Submitted:
23 December 2025
Posted:
24 December 2025
You are already at the latest version
Abstract
Three alloys, two based on cobalt and one on nickel, containing 5 or 10 wt.%Al for their resistance to hot oxidation, and Ta and C for forming TaC carbides for they creep–resistance at high temperature, were synthesized by casting. They were subjected to the control of their as–cast microstructures and to oxidation tests at 1200°C for 50 hours in a thermobalance. The initial microstructures of the two low Al alloys, both containing 5 wt.%Al, are not significantly modified by the Al introduction by comparison to the more usual {25 to 30 wt.%Cr}–containing original alloys. In contrast, their oxidation behaviors are either catastrophic (Co alloy) or acceptable but not really alumina–forming. To improve the oxidation resistance of the Co alloy a version with 10 wt.%Al was additionally elaborated. Increasing the Al content improved significantly the oxidation behavior but also induced obvious modifications in the microstructure, with the appearance of the Co3Al intermetallic replacing almost a half of the volume fraction of the Co solid solution matrix. Except the 5wt.%Al cobalt alloy over which a thick double–structured scale made of CoO and of a mix of CoO and spinel formed, the 5wt.%Al nickel alloy and the 10wt.%Al cobalt alloy were covered a duplex external oxide scale with an outermost spinel oxide and an innermost alumina oxide, rather protective considering the parabolic constants but threatened by spallation even for the rather slow cooling. The responsibility of tantalum, the oxide of which seems deleterious for adherence, was pointed out.
Keywords:
cobalt–based alloys
; nickel–based alloys
; aluminum
; Ta carbides
; high temperature oxidation
; thermogravimetry
; metallographic characterization
1. Introduction
Metallic components based on cobalt, nickel or iron, working at around 1000°C or more are not only threatened by risks of local fusion but also by, first deformation and rupture [1], and second chemical degradation due to their exposure to aggressive gas mixtures or molten more or less complex substances [1,2]. Indeed, mechanical stresses, induced by fluid pressure or centrifugal forces for instances, may significantly alter geometry and thus the function expected from the component (e.g. trajectory of combustion gas flows and thus the output on the mechanical power retrieved by the turbine, breakdown of blades) [1,3]. Hot corrosion by gaseous or liquid fluids (combustion gases, molten sulftates and CMAS, molten glasses in some industries) also take part to the degradation of operation of the component, notably by helping the mechanical loading for the cracks initiation and propagation.
Choosing chemical compositions refractory enough is followed in parallel by first, the introduction of particular elements to enhance the resistance against these mechanical and chemical solicitations and second, by external thermal insulation coatings associated to internal cooling solutions to prevent too high temperature known by the alloy for keeping strength high enough. An increase of the resistance against creep can be achieved by modern solutions as the very efficient single–crystalline solidification associated by the precipitation of reinforcing intermetallic particles (namely gamma prime – Ni(Co,Fe)3Al(Ti,Ta,Nb) – precipitated with high volume fractions) [1,4] or coarse – grained Ni or Fe alloys strengthened by fine and homogeneous dispersion of Y2O3 nano–oxides (O.D.S. superalloys) [1]. Unfortunately the use of single–crystals is limited to 1100°C because of a start of instability of the gamma prime precipitates leading to possible total disappearance beyond 1100°C. These alloys are also limited to particular geometries (elongated components such as turbine blades), a problem which also affects O.D.S. alloys which are anisotropic structured (in one or two dimensions).
More freedom in geometric design is possible with polycrystalline equiaxed alloys (casting, powder metallurgy, additive manufacturing) but equiaxed granular structures coarse enough to favor a mechanical strength base for elevated temperatures are accessible by casting. Coarse grains are not enough and other solutions need to be additionally applied such as solid solution strengthening and precipitation, during solidification and/or solid state high temperature isothermal stages, of hard particles with favorable geometry, size and repartition. By adding the condition of high stability at elevated temperature MC carbides appear as good choice, tantalum mono-carbides for instance.
TaC is a key particle to strengthen superalloys which is known from long time [5], notably when present in important proportion in some famous superalloys such as Mar-M509 [6,7]. Generally these alloys (principally cobalt–based) have their oxidation and corrosion resistance which are based on the presence of chromium [8]. Aluminum, the other element playing a very important role for the resistance to oxidation, is the most often absent in superalloys strengthened mainly by TaC (among the carbides present) whereas Al is generally present in most of nickel–based alloys [1,4] and can belong to ones containing Ta [1]. Al can also be encountered in a series of cobalt–based alloys containing Ta [9,10,11,12], high entropy alloys [13] or Co–containing Ta–based refractory alloys [14], but essentially in the C–free ones, even if some rare exceptions can be noted as in some directionally solidified cobalt-alloys (e.g. [15]) or in HEAs (e.g. [16]).
Thus, it seems that no published articles deal with examples of association of, on one hand the presence of Al as single element for oxidation resistance, and of the other hand a reinforcement by high fraction of TaC (notably as single carbide phase present). The aim of the present work is to start investigating the possible microstructures and oxidation properties of two systems – one based on cobalt and one based on nickel – combining TaC and aluminium.
2. Materials and Methods
2.1. Choice of the Alloys and Elaboration
At the beginning two alloys were defined to start exploring the characteristics which may result from the simultaneous presence of Al and TaC in an alloy possibly representing a base for developing real superalloys. They were Ni(bal.)–5Al–0.4C–6Ta (“NACT5”) and Co(bal.)–5Al–0.4C–6Ta (“CACT5”), all contents being in wt.%. Later, after having observed the disappointing oxidation behavior of the “CACT5” alloy, a third alloy was introduced in the study: “CACT10” with the Co(bal.)–10Al–0.4C–6Ta composition.
All alloys were obtained by the melting pure Ni or Co, Al, C and Ta. These elements were introduced in the charges as metallic flakes and of graphite rod (Alfa Aesar, purity > 99.9%). Melting and the following solidification were done in a 50 kW induction furnace (CELES, France). As gaseous atmosphere, the fusion chamber, closed with a silica tube, contained 800 mbar of pure argon. The input voltage was increased to the maximal value of 5kV, while the alternative current (4 A) stayed at the 100 kHz frequency. Solidification led to solid compact ingots weighing about 40 grams in each case.
2.2. Obtained Chemical Compositions and As–Cast Microstructures
The obtained ingots were cut in several parts using a metallographic saw. For each alloy, a first part was embedded in resin, ground with SiC papers (grade from #240 to #1200), washed, and finally polished (textile disk supporting 3 µm hard particles).
The metallographic samples, with a mirror–like surface, were examined using a Scanning Electron Microscope (SEM). This one (model: JSM 6010LA, manufacturer: JEOL, Tokyo, Japan) was used with a 20kV acceleration voltage, and the imaging mode was Back Scattered Electrons (BSE) allowed controlling the microstructures.
The chemical compositions were analyzed by Energy Dispersion Spectrometry (EDS) using the spectrometer attached to the SEM. This was performed on five ×250 areas randomly chosen in the bulk. With this EDS device the accuracy of the values obtained for each content was about +/- 0.2 wt.%. The average value and the standard deviation values were calculated from these five obtained results.
2.3. Oxidation Tests
The oxidation tests were carried out for 50 hours at 1200°C in a thermo-balance TGA92 (manufacturer: SETARAM, Caluire, France) in a 1.5L/h flow of synthetic air. Heating up to 1200°C was performed at +20°C min-1 and the final cooling was done at -5°C min-1. The oxidation samples were parallelepipeds with the following approximate dimensions: 3 mm × 3 mm × 10 mm. Their six faces were ground using #1200 SiC papers. Edges and corners were themselves smoothed (using the same grade of SiC paper). The mass gain were plotted versus time for the measurements recorded during the isothermal stage, to specify the kinetic of oxidation at 1200°C. Mass variation was also plotted versus temperature for the whole cycle to obtain supplementary data on the heating part and on the cooling part.
2.4. Characterization of the Oxidized States
The oxidized surfaces of the samples were first observed with the SEM in Secondary Electrons (SE) imaging mode, and second subjected to elemental EDS mapping. They were thereafter embedded in the same resin system as for the metallographic as-cast parts, then divided in two halves using the metallographic saw. The obtained metallographic samples were ground and polished to obtain a mirror – like state for cross – sectional observation. The external and internal oxides, as well as the sub surfaces affected by oxidation, were observed with the SEM in BSE mode. EDS elemental mapping and EDS spot analyses helped to identify the oxides natures and to specify the chemical composition in the subsurfaces.
3. Results and Discussion
3.1. Chemical Compositions and Microstructures of the Alloys
The chemical compositions of the three alloys in their as–cast states are displayed in Table 1. The Al contents are slightly lower than the targeted ones (about 0.5-1 wt.% less for the expected 5 wt.%Al, about 1-1.5 wt.% less for the expected 10 wt.%Al). This can be explained by the high reactivity of this element which led to oxidation of a part of aluminum by the oxygen and nitrogen traces necessarily present in the “pure” argon occupying the melting chamber (the volume of which is more than 1 liter). A partial sublimation of this element which melts at 660°C only and vaporizes at 2470°C (not much higher than the maximal temperature reached during elaboration ≅1600-1700°C) may also lead to a small loss). In contrast, the Ta content seems a little higher than targeted. This can be explained by the probable presence of many TaC in relief on surface due to the high hardness of this compound; overestimation of Ta is frequently met when EDS is used. Globally one can consider that the wished chemical compositions were rather respected.
The microstructures in as–cast condition are illustrated in Figure 1 by SEM/BSE micrographs. The three alloys are composed of a dendritic matrix and of an interdendritic network of script–like shaped tantalum carbides. These ones are essentially of a eutectic nature, as suggested by their multi-elongated shape mixed with matrix, but some rare coarse TaC can be also seen here and there.
The matrixes of the NACT5 and CACT5 alloys contain all aluminum, and a part of tantalum which is higher in matrix for NACT5 (≅5 wt.%Ta) than for CACT5 (≅2 wt.%Ta). This seems logical since the TaC phase is obviously more present in the cobalt alloy than in the nickel alloy. The matrix of the CACT10 alloy is obviously double–phased: about a clear half is with the approximative 7wt.%Al–2 wt.%Ta composition and the second half – muck darker – contains 13wt.%Al–2wt.%Ta. These two cobalt–based parts of matrix seems being Al–saturated for the clear one, and close to the Co3Al intermetallic for the dark one (a Ta–containing version of the Co3Al intermetallic compound).
3.2. Isothermal Oxidation Kinetics
The isothermal mass gain curves obtained for the three alloys are plotted together in Figure 2. One can remark first that the mass gain by oxidation of CACT5 is parabolic but particularly rapid. It oxidized much faster than the NACT5 and CACT10 alloys, the curves of which are repeated in Figure 3 at a more favorable vertical scale for a better readability.
The mass gain curve of NACT5 started by an important linear oxidation before becoming parabolic (transient oxidation) while the mass gain kinetic of CACT10 was parabolic as soon as temperature reached 1200°C. One can guess, before confirmation by metallographic characterization, that 10 wt.% Al allowed CACT10 to be covered by an efficient protective oxide scale, maybe alumina, while the NACT5 alloy was itself protected by such a protective scale but after a short delay. Concerning the CACT5 alloy, the parabolic but extremely fast oxidation kinetic suggests that other elements than aluminum were oxidizing. To take the mass gain during heating (CACT5 and CACT10), with addition of the transient oxidation in the case of the NACT5 alloy, the isothermal mass gains were treated according to a method allowing a better representativity of the parabolic constant Kp [17]. Table 2 gives the obtained values, which show that the Kp of CACT5 is one thousand times higher than for the two other alloys the Kp values of which are equivalent to one another.
3.3. Mass Variations During Heating and Cooling
The mass gain during heating, after correction from the air buoyancy variation (Archimede’s pressure decrease) according to a method earlier described [18], is plotted for the three alloys together in Figure 4. This suggests that oxidation started to be detectable by the used thermobalance for temperatures which are lower for the two cobalt alloys (≅ 400°C) than for the nickel one (≅ 550-600°C). Obviously, CACT5 and CACT10 are more reactive than NACT5. The characterization of the oxides will maybe allow interpret these differences.
Similarly, the mass variation was studied versus temperature during cooling [19]. The obtained curves, plot together in Figure 5, show a start of mass loss due to oxide scale spallation which seems later for the CACT10 cobalt alloy ((≅ 350°C)) than for the NACT10 nickel alloy (≅ 500°C) which lost more oxide (negative mass variation along the whole thermal cycle). Concerning the CACT5 cobalt alloy, it did not meet problems of oxide detachment during cooling. Here too, we will wait for the metallographic post-mortem analysis to try explaining these differences of behavior.
3.4. Aspects of the Oxidized Surfaces
With the naked eye and with the SEM at low magnification in SE mode (Figure 6, a), one can see that the CACT5 alloy is covered all around by a thick oxide shell, the outermost part of which is the cobalt oxide CoO as identified by EDS. One can observe its polycrystalline structure (Figure 6, b) and its porous texture (Figure 6, c). Cross–sectional preparation and SEM/BSE observation (Figure 6, d) evidence the catastrophic oxidation that this alloy underwent (the alloy is close to be entirely oxidized and its bulk has lost all its initial carbides, including in the core). The thick oxide shell is composed of a continuous outermost compact CoO and a poly-constituted oxide mixing CoO, CoAl2O4 spinel and complex oxide involving Ta, Co and Al (EDS spot analyses). The loss of all the numerous carbides initially present suggests that carbon was totally oxidized and has quitted the sample as gaseous species.
In contrast, with 5 wt.% Al more, the CACT10 alloy behaved better. The oxide spallation during cooling (Figure 5) allows revealing the structure of the external oxide (Figure 6). The denuded alloy zones appears as bright in these SEM/BSE micrographs. Spot analyses allowed identifying the gray part of oxide (seemingly outermost part of the scale) as being the CoAl2O4 spinel oxide, and the innermost dark part of the scale as being alumina (Figure 7). The repartition, of these oxides is better shown by the EDS elemental cartography in Figure 8. The external oxide scales for the NACT5 alloy is similar (Figure 9).
3.5. Cross-Sectional Observations of the Catastrophically Oxidized CACT5)
After embedding, cutting and grinding/polishing, the obtained mirror–like metallographic samples of the oxidized alloys allowed observing the oxides scales and the subsurface deterioration in the depth. Figure 10, Figure 11 and Figure 12 describe the oxidized CACT5.
One can distinguish the stratified structure of the innermost part of the thick oxide scale, the growth of which looks jerky; it seems having progressed wave by wave. Indeed, the progress of oxidation was apparently a repeated sequence constituted by {oxidation of Co, then oxidation of Co and Al together}, superposed with oxidation of tantalum. This was as oxidation hesitated alternatively between oxidation of Co only (with consequently re-enrichment in Al) and oxidation of both Co and Al (with consequently impoverishment in Al).
The concentration profiles (Figure 12, top) also illustrate quantitively these variations in all elements across the innermost part of the scale, which contrasts with the relative composition consistency (CoO) of the outermost part of scale. The second graph with concentration files (Figure 12, bottom) shows the diffusion of Al towards both borders with the thick scale. Seemingly Al kept its role of selectively oxidized element and it moved towards the regressing oxidation front consuming the alloy. By seeing the Al content in extreme surface (only a little more than 1 wt.%) one understands the inwards propagation of oxidation and the particular constitution of the innermost part of the oxide scale.
3.6. Cross-Sectional Observations of the Moderately Oxidized NACT5 and CACT10
Although that its Al content was the same as the CACT5 one the nickel alloy NACT5 behaved much better in oxidation. Obviously, the external oxide scale was made of an outermost (Ni, Al)xOy oxide and an innermost aluminum oxide (Figure 13). EDS spot analysis allowed specifying the (Ni, Al)xOy composition, which is not really the NiAl2O3 spinel as thought earlier in this text, but which is a nickel aluminum oxide with variable composition (Figure 14). Indeed, towards the interface with alloy the content in Ni decreases and the content in Al increases. In contrast the aluminum oxide was well identified as being alumina (Al2O3). One can also notice the presence of isolated nickel oxides and of a thin complex oxide involving tantalum, top of the spinel scale. This dual external oxide scale (Ni & Al oxide + continuous sublayer of alumina) is certainly at the origin of the slow mass gain. It also prevented internal oxidation.
With 5 wt.%Al more, the CACT10 alloy behaved too much better than the CACT5 alloy. The oxidation products formed externally are similar to the ones described previously in the case of the NACT5 alloy, with an outermost scale made of oxide of both Co and Al and an innermost aluminum oxide layer (Figure 15). EDS spot analysis and EDS concentration profiles (Figure 16) demonstrate that the composition of the cobalt and aluminum oxide varies when moving towards the interface with alloy (from Co-rich Al-poor to Co-poor Al-rich).
Another interesting observation concerns the modification of the subsurface: not only its chemical composition is logically modified (e.g. gradient in Al concentration) but its microstructure has itself transformed. Indeed, the SEM/BSE micrographs of Figure 15 and Figure 16, as well as the elemental Al cartography of Figure 15 and the EDS concentration profile of Figure 16, show a disappearance of the Co3Al part of matrix over a depth having reached about 100 µm. In addition to the Al concentration profiles, this evidences an Al diffusion towards the oxidation front. This Al movement allowed forming and maintaining the Al-involving complex oxide and the alumina sublayer which allowed the alloy oxidizing slowly, in a similar way as NACT5.
4. Conclusions
Thus, removing all chromium and replacing it by aluminum did not affect the population of tantalum carbides which are still script–like shaped and mixed with the periphery of matrix dendrites. However one must mention the presence of rare coarse TaC, seemingly of a pre-eutectic nature (CACT5 alloy) and that the script eutectic TaC are a little modified in the CACT10 alloy the matrix of which has become double–phased. Concerning the strengthening effect of TaC no significant difference is expected. In contrast the matrix of the cobalt alloys is possibly influenced by the introduction of too aluminum and beyond a threshold between 5 and 10 wt.%Al, the matrix evolution may have itself consequences on the mechanical properties at high temperature (creep resistance) but also at ambient temperature (machinability) and further investigation concerning this point will be carried out. Concerning the oxidation resistance, it is clear that the alloys are not really alumina-forming while they were chromia–forming with 30 wt.%Cr. Nevertheless the behaviors in hot oxidation nickel alloy with 5 wt.%Al and the cobalt alloy with 10 wt.%Al were promising at this 1200°C elevated temperature, with parabolic mass gain (no flattening at high durations characteristic of chromia volatilization) and despite the absence of oxide loss the parabolic constants (about 40 × 10-12 g2 cm-4 s-1) were lower than for a chromia-forming Ni-30wt.%Cr in the same conditions (≅ 70 × 10-12 g2 cm-4 s-1). One can guess that this can be much better if a new enrichment (e.g. 15 wt.%Al) allows the oxide scale being mainly of alumina. But one must be careful since it was seen here that the introduction of Al in high amount may destabilize the matrix if its Al solubility is exceeded (e.g. CACT10). Anyway, the microstructures and oxidation behaviors observed in this work allow considering that this research way is interesting to deepen and can lead to new alloys with new properties, potentially interesting.
Author Contributions
Conceptualization, P.B.; methodology, P.B.; validation, P.B.; formal analysis, P.B.; investigation, P.B.; data curation, P.B.; writing—original draft preparation, P.B.; writing—review and editing, P.B.; visualization, P.B.; project administration, P.B..; funding acquisition, N/A.
Institutional Review Board Statement
“Not applicable”
Informed Consent Statement
“Not applicable”
Data Availability Statement
Please refer to suggested Data Availability Statements in section “MDPI Research Data Policies” at https://www.mdpi.com/ethics.
Acknowledgments
The author wishes thanking Mr. Lionel Aranda for his assistance for the thermogravimetry tests.
Conflicts of Interest
The authors declare no conflict of interest.
References
- Donachie, M.S.; Donachie, S.J. Superalloys: A Technical Guide, 2nd ed.; ASM International: Materials Park, U.S.A., 2002. [Google Scholar]
- Young, D.J. High Temperature Oxidation and Corrosion of Metals; Elsevier: Amsterdam, The Netherlands, 2008. [Google Scholar]
- Sims, C.T.; Hagel, W.C. The Superalloys; Wiley-Interscience: New York, U.S.A., 1972. [Google Scholar]
- Durand–Charre, M. The Microstructure of Superalloys; CRC Press: Boca–Raton, U.S.A., 1997. [Google Scholar]
- Bradley, E.F. Superalloys: A Technical Guide; ASM International: Metals Park, U.S.A., 1988. [Google Scholar]
- Beltran, A.M.; Sims, C.T.; Wagenheim, N.T. The high-temperature properties of Mar-M alloy 509 J. Metals 1969, 21, 39–47. [Google Scholar] [CrossRef]
- Potter, A.; Sumner, J.; Simms, N.J. The role of superalloy precipitates on the early stages of oxidation and type II hot corrosion Mater. High Temp. 2018, 35, 236–242. [Google Scholar] [CrossRef]
- Kofstad, P. High Temperature Corrosion; Elsevier applied science: London, U.K., 1988. [Google Scholar]
- Grudzien-Rakoczy, M.; Rakoczy, L.; Cygan, R.; Kromka, F.; Pirowski, Z.; Milkovoic, O. Fabrication and characterization of the newly developed superalloys based on Inconel 740. Materials 2020, 13, 2362. [Google Scholar] [CrossRef] [PubMed]
- Makineni, S.K.; Samanta, A.; Rojhirunsakool, T.; Alam, T.; Nithin, B.; Singh, A.K.; Banerjee, R.; Chattopadhyay, K. A new class of high strength high temperature cobalt based -’ Co-Mo-Al alloys stabilized with Ta addition. Acta Mater. 2015, 97, 29–40. [Google Scholar] [CrossRef]
- Chen, Y.; Wang, C.; Ruan, J.; Yang, S.; Omori, T.; Kainuma, R.; Ishida, K.; Han, J.; Lu, Y.; Lu, X. Development of low-density /’(Co–Al–Ta-based superalloys with high solvus temperature. Acta Mater. 2020, 188, 652–664. [Google Scholar] [CrossRef]
- Nithin, B; Samanta, A.; Makineni, S.K.; Alam, T.; Pandey, P.; Singh, A.K.; Banerjee, R.; Chattopadhyay, K. Effect of Cr addition on -’ cobalt-based Co-Mo-Al-Ta class of superalloys: a combined experimental and computational study J. Mater. Sci. 2017, 52, 11036–11047. [Google Scholar] [CrossRef]
- Senkov, O.N.; Isheim, D.; Seidman, D.N.; Pilchak, A.L. Development of a refractory high entropy superalloy. Entropy 2016, 18, 102. [Google Scholar] [CrossRef]
- Pickering, E.J.; Christofidou, K.A.; Stone, H.J.; Jone, N.G. On the design and feasibility of tantalum-base superalloys J. Alloys Compds 2019, 804, 314–321. [Google Scholar] [CrossRef]
- Lu, Z.; Xu, Y.; Hu, Z. Low cycle fatigue behavior of a directionally solidified cobalt base superalloy Mater. Sci. Eng. A 1999, 270, 162–169. [Google Scholar] [CrossRef]
- Bala, P.; Morgiel, J.; Cios, G.; Wieczerzak, K.; Tokarski, T. Ni-Cr-Ta-Al-C complex phase alloy – Design, microstructure and properties Mater. Sci. Eng. A 2018, 711, 99–108. [Google Scholar] [CrossRef]
- Berthod, P.; Vébert, C.; Aranda, L. Effect of dendritic orientation on the high temperature oxidation kinetic of tantalum-containing nickel-base alloys J. Mater. Sci. 2007, 42, 352–362. [Google Scholar] [CrossRef]
- Berthod, P. Oxidation start detection on heating parts of thermogravimetry curves for high temperature alloys based on nickel, cobalt or iron Open Corr. J. 2011, 4, 1–8. [Google Scholar]
- Berthod, P. Thermogravimetric study of oxide spallation for chromium-rich cast cobalt-based and iron-based alloys oxidized at high temperature Open Corr. J. 2009, 2, 61–70. [Google Scholar]
Figure 1.
Microstructures of the three alloys: (a) NACT5 (Ni-5Al-0.4C-6Ta), (b) CACT5 (Co-5Al-0.4C-6Ta) and (c) CACT10 (Co-10Al-0.4C-6Ta).
Figure 1.
Microstructures of the three alloys: (a) NACT5 (Ni-5Al-0.4C-6Ta), (b) CACT5 (Co-5Al-0.4C-6Ta) and (c) CACT10 (Co-10Al-0.4C-6Ta).
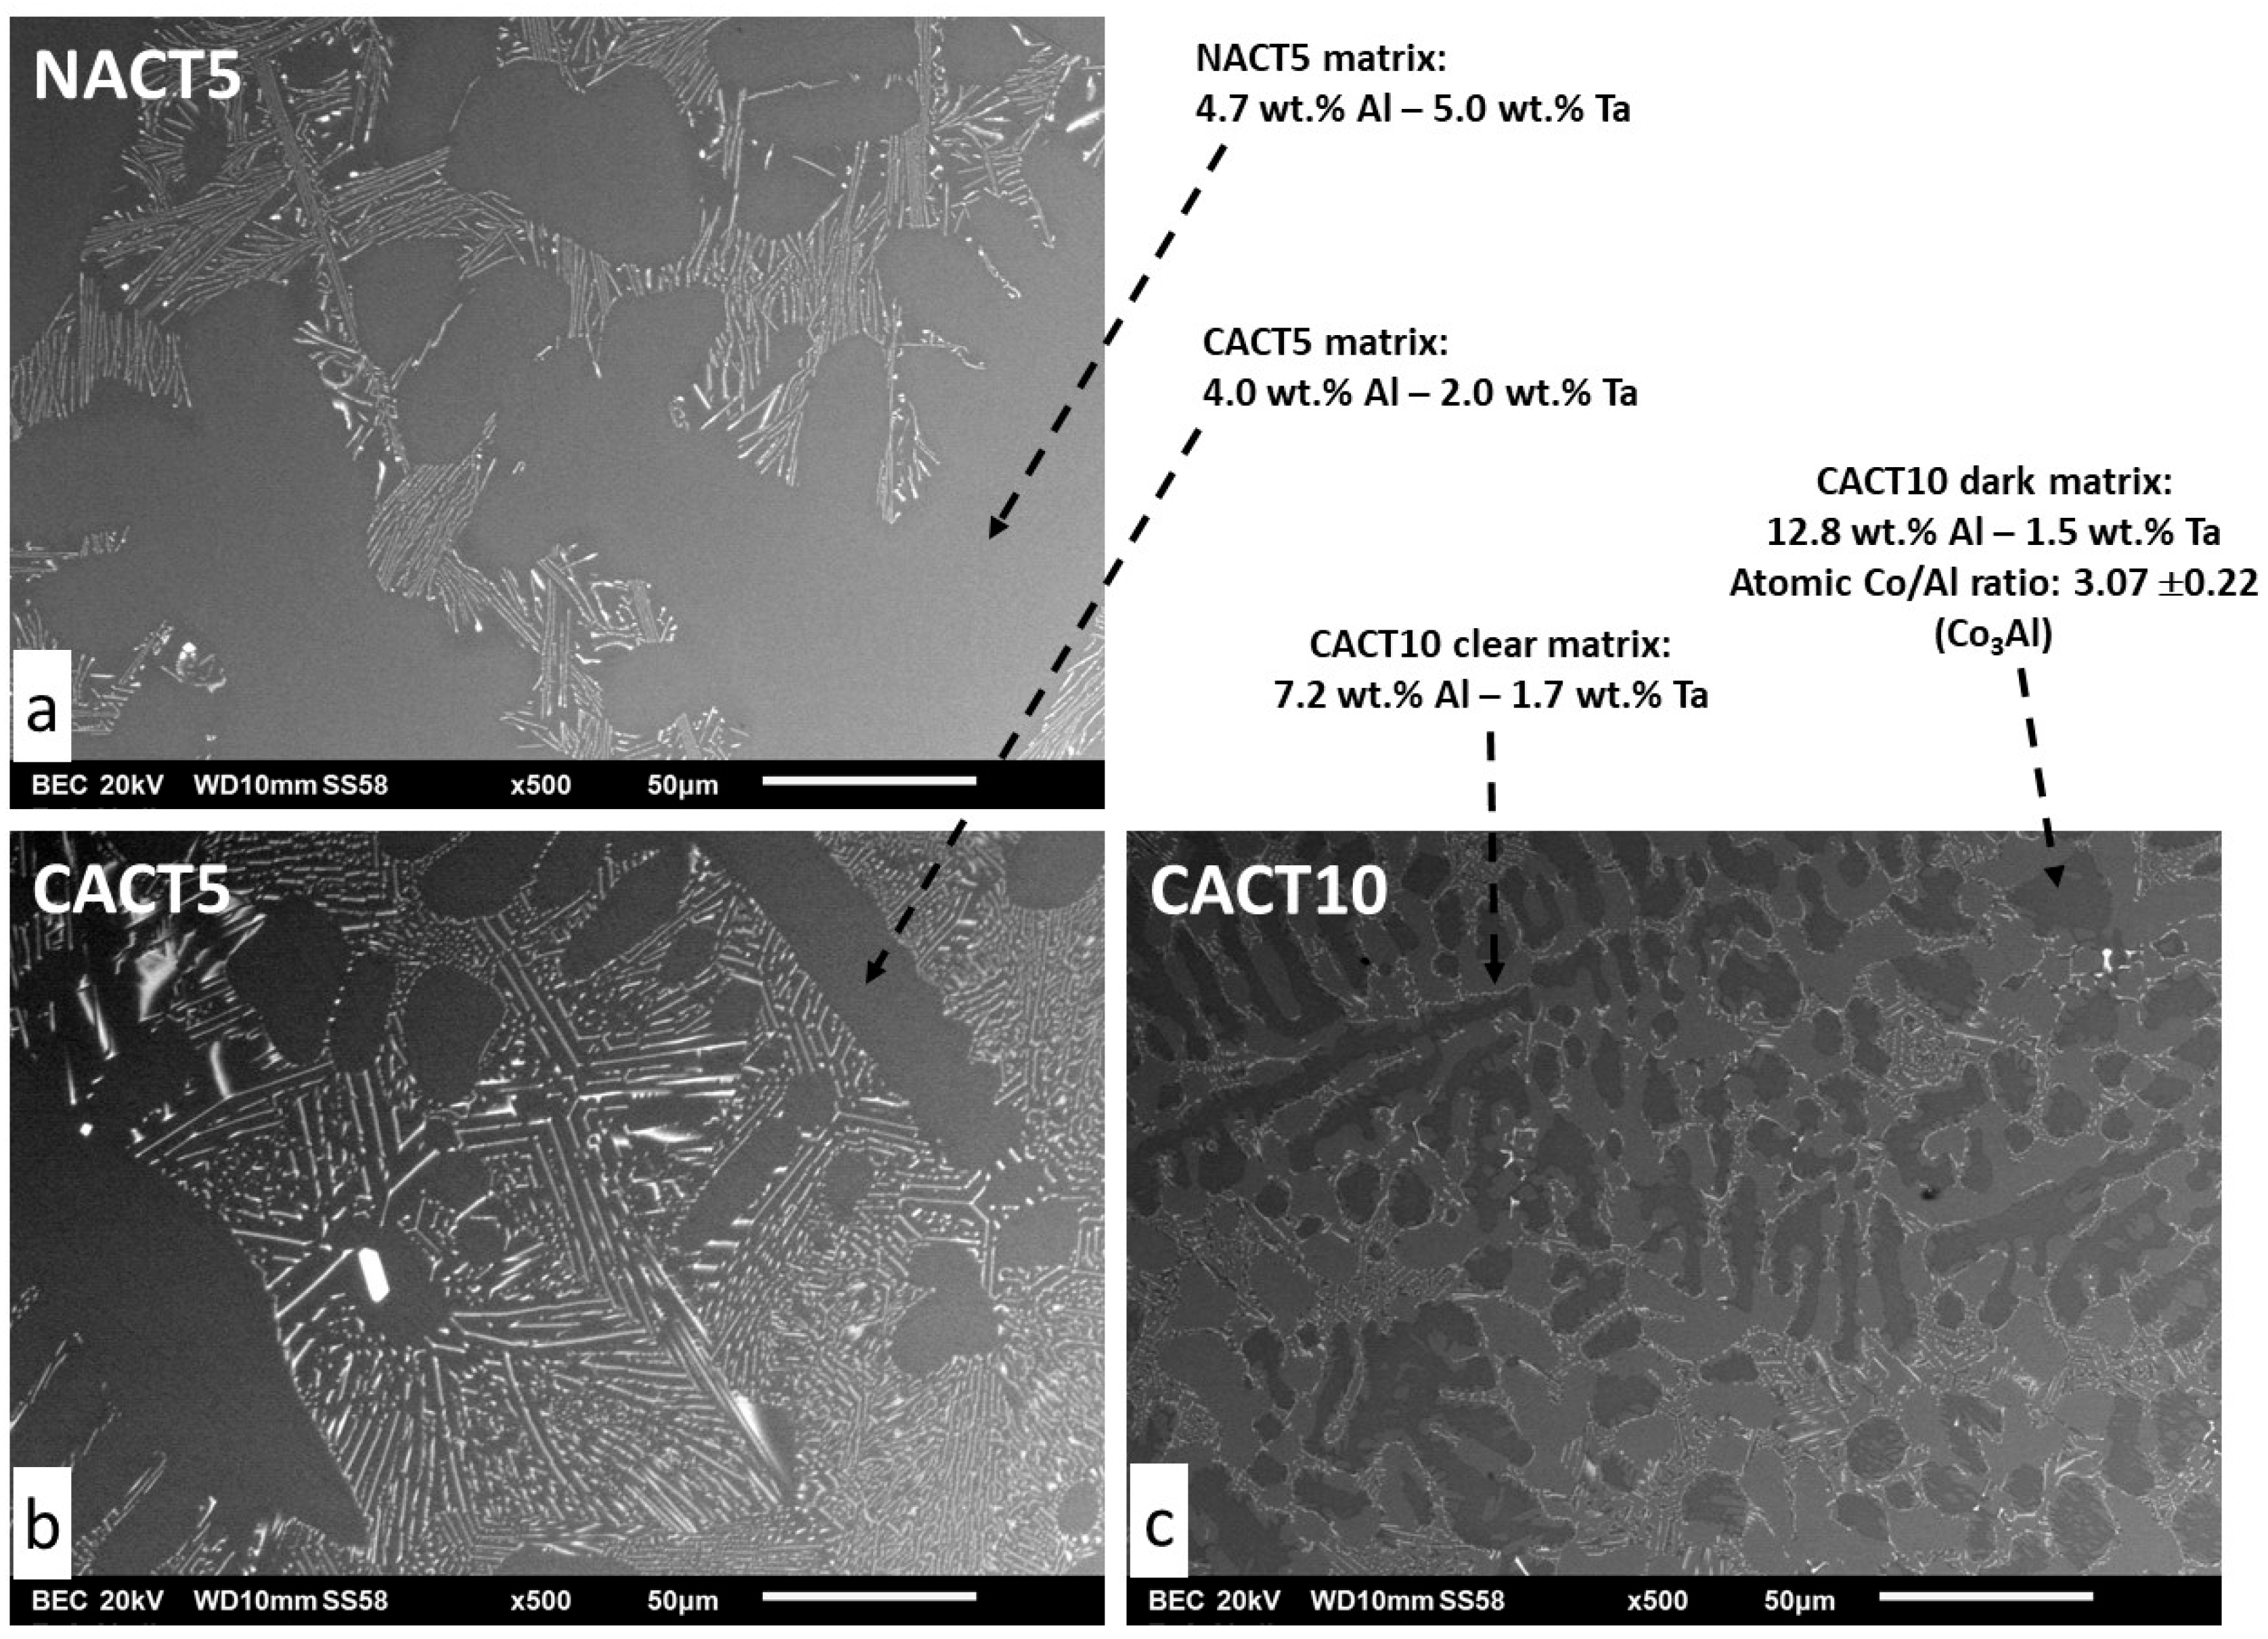
Figure 2.
Mass gain curves during oxidation of the three alloys at 1200°C.
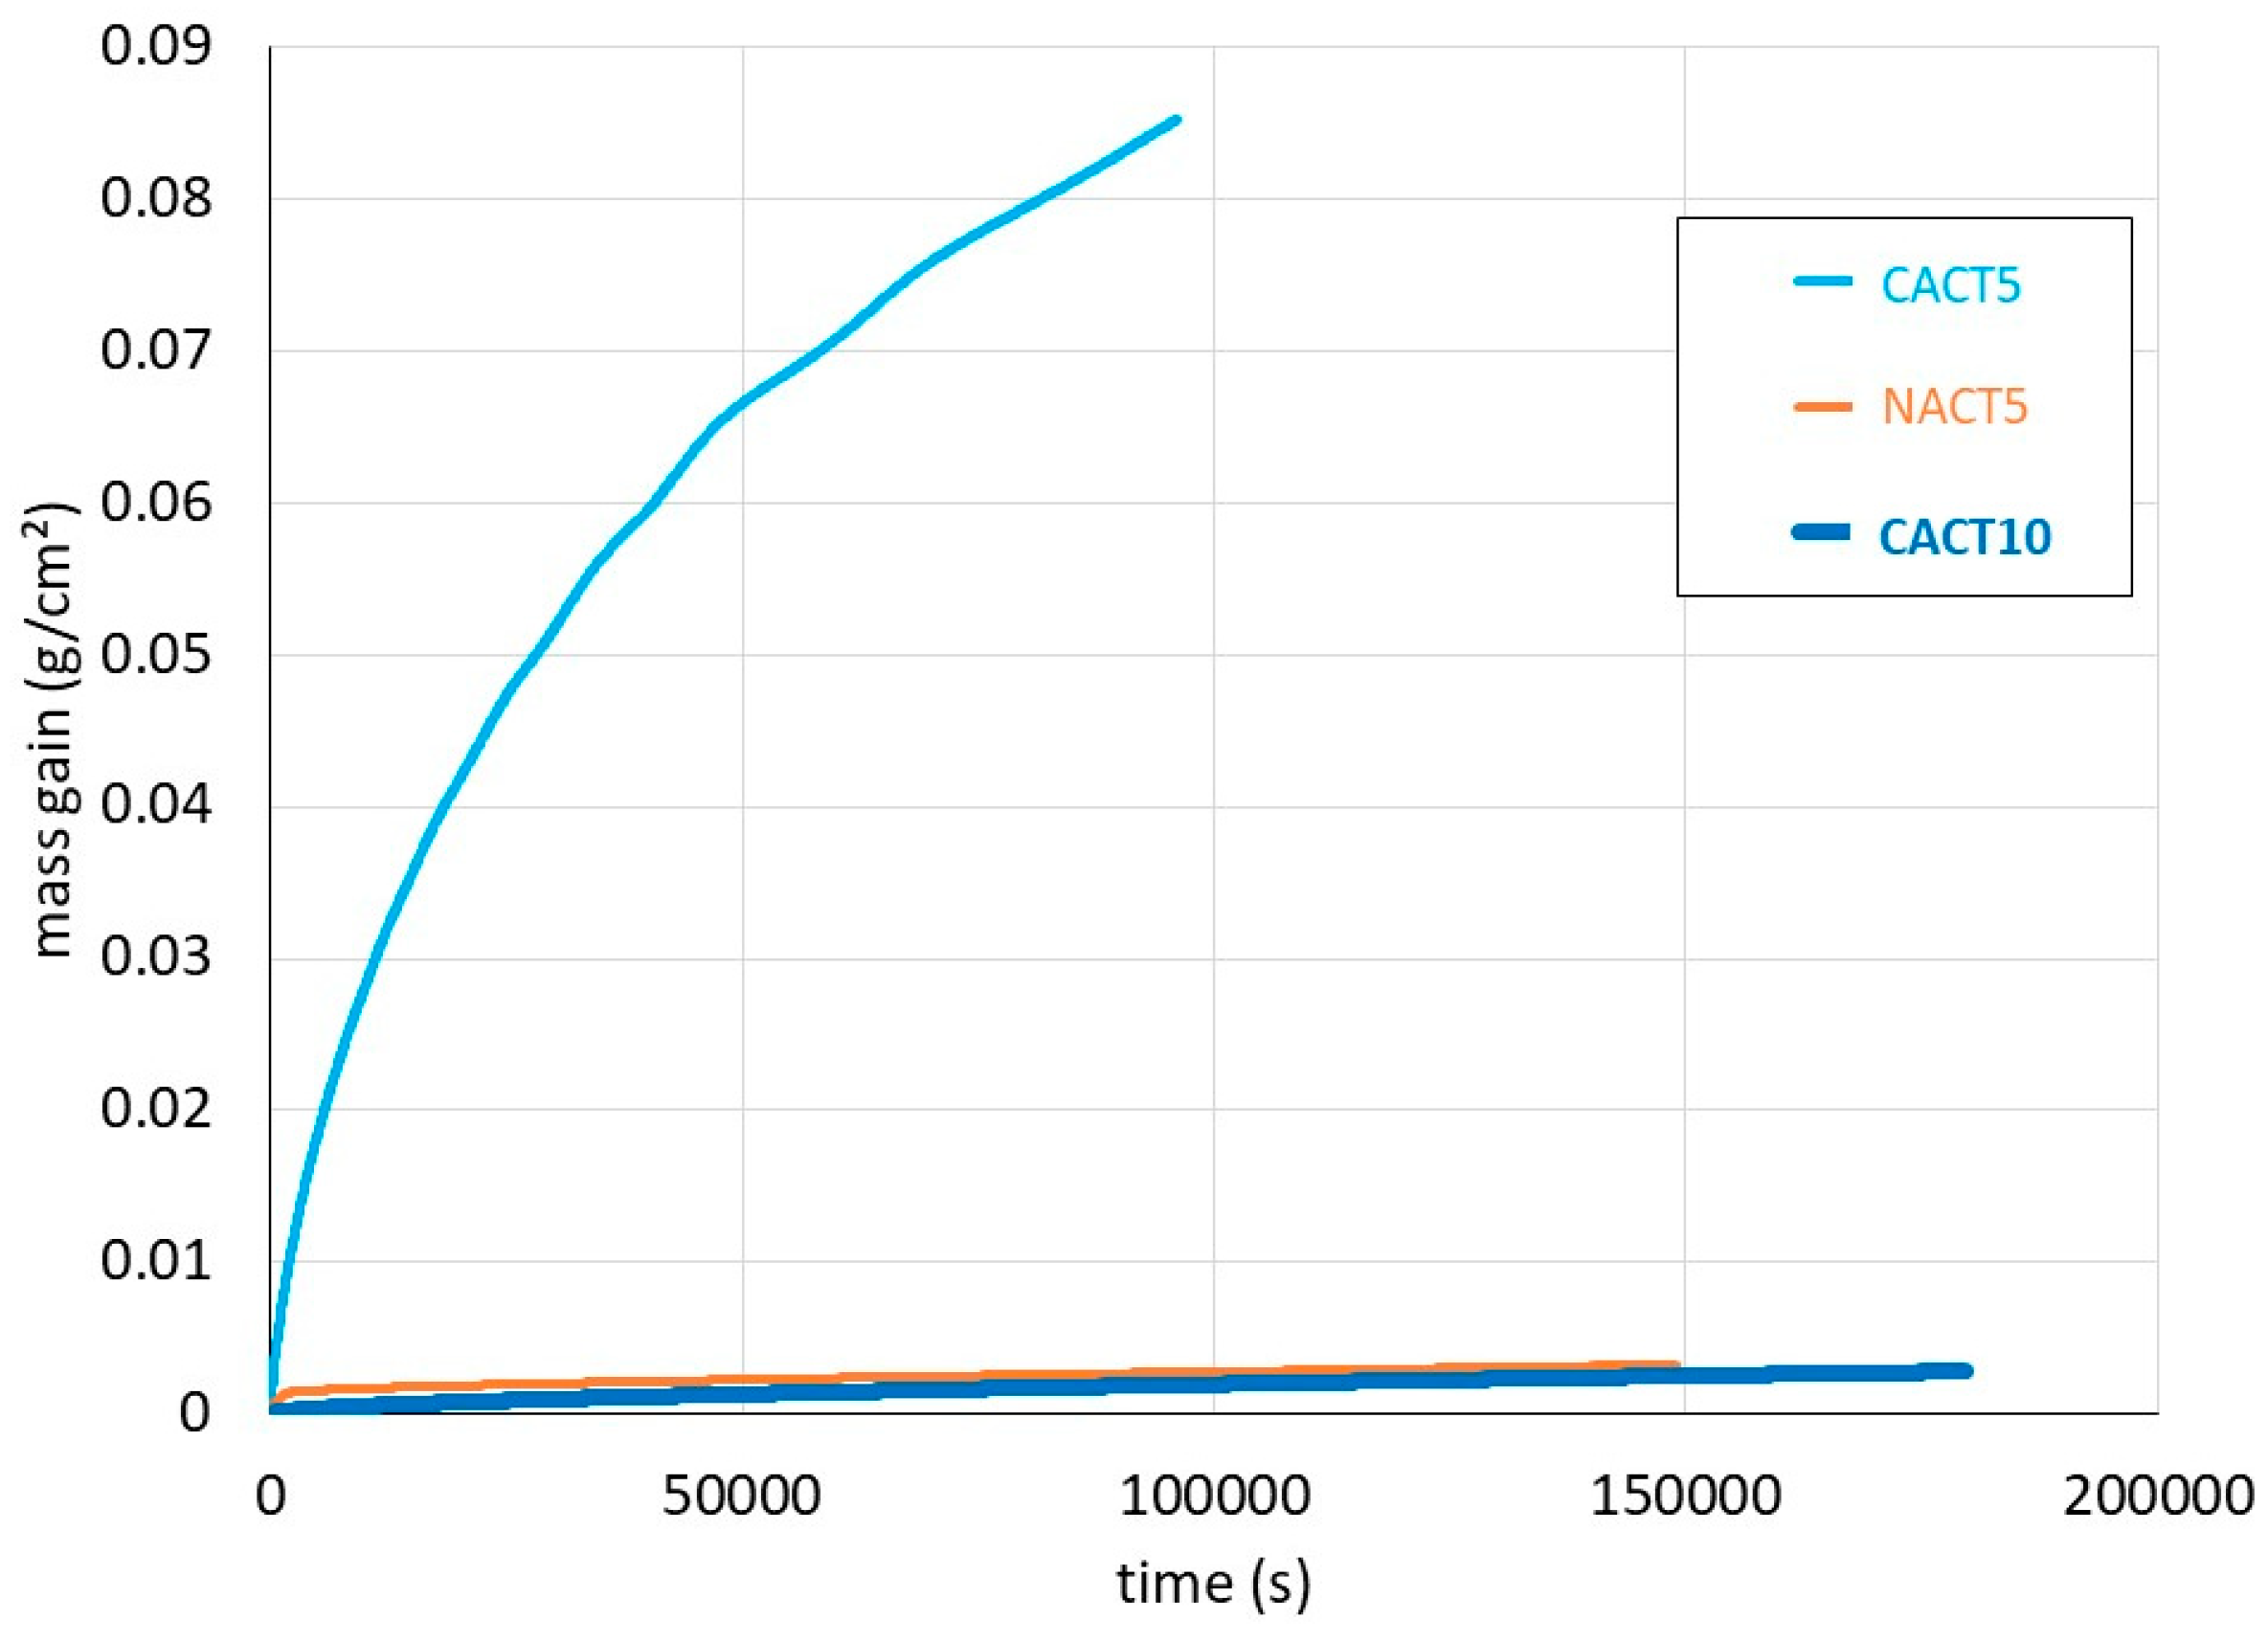
Figure 3.
Vertical enlargement of the mass gain curves of CACT10 and NACT5.
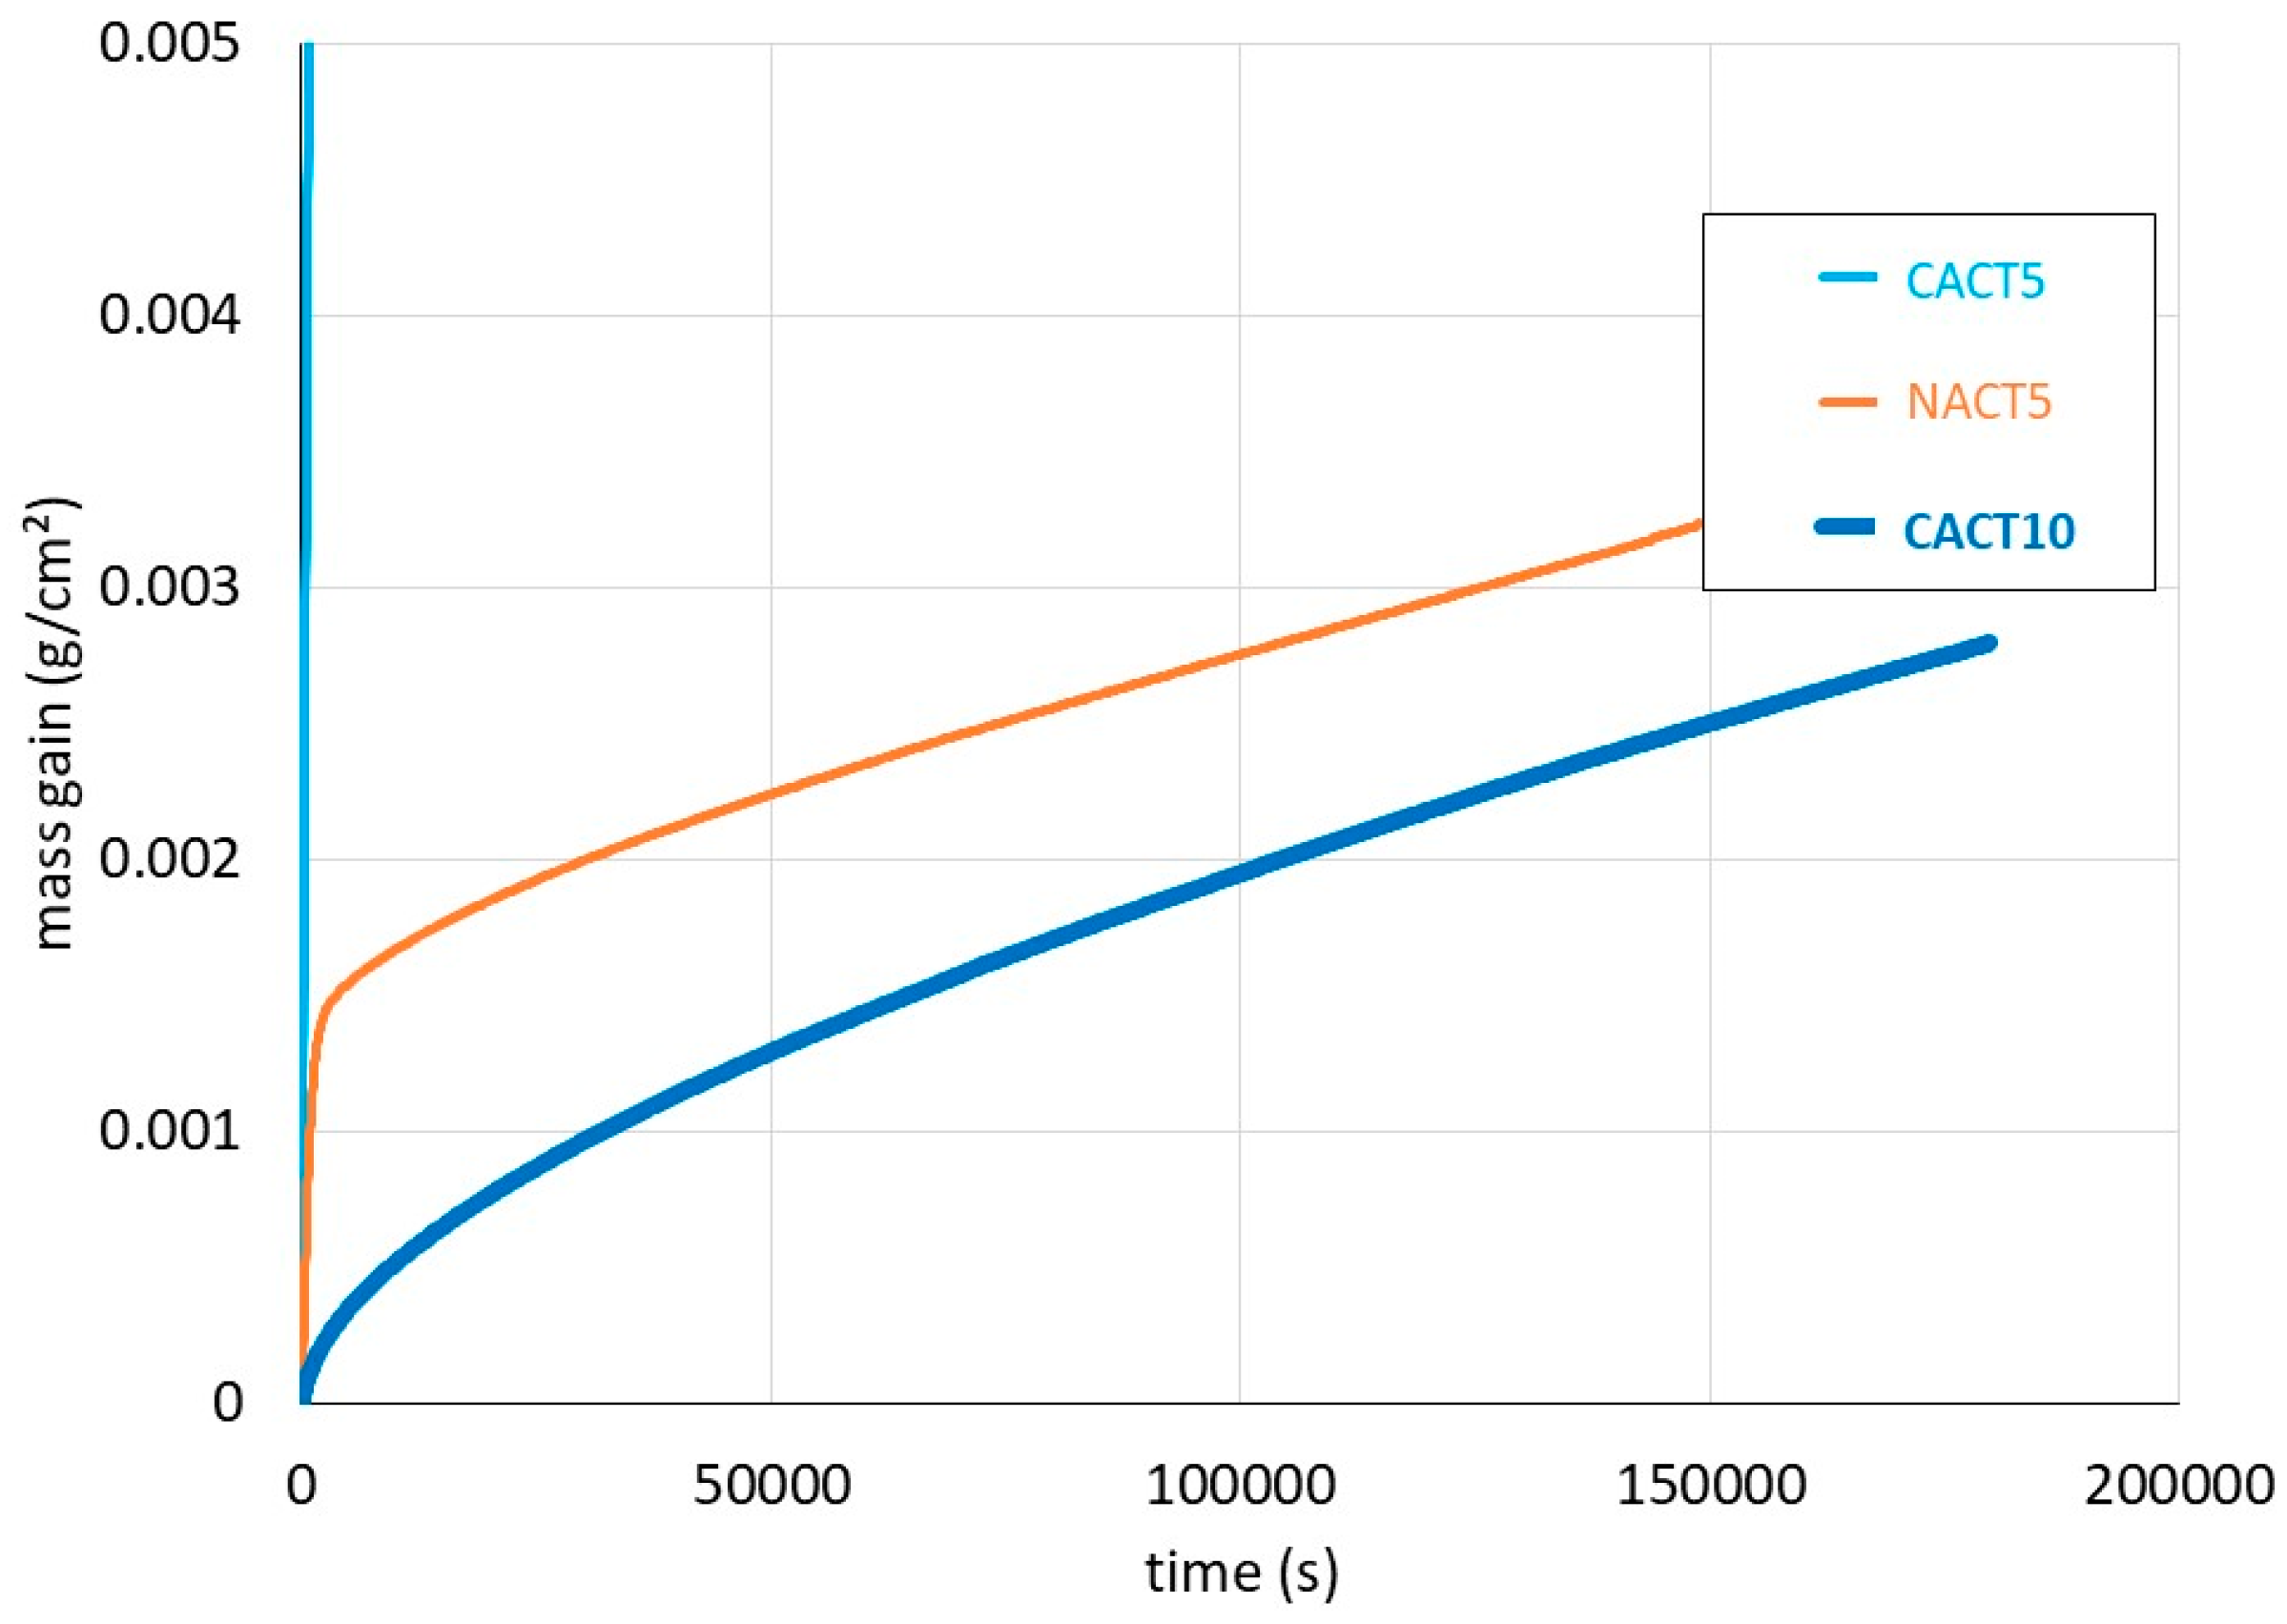
Figure 4.
Start of mass gain by oxidation during heating.
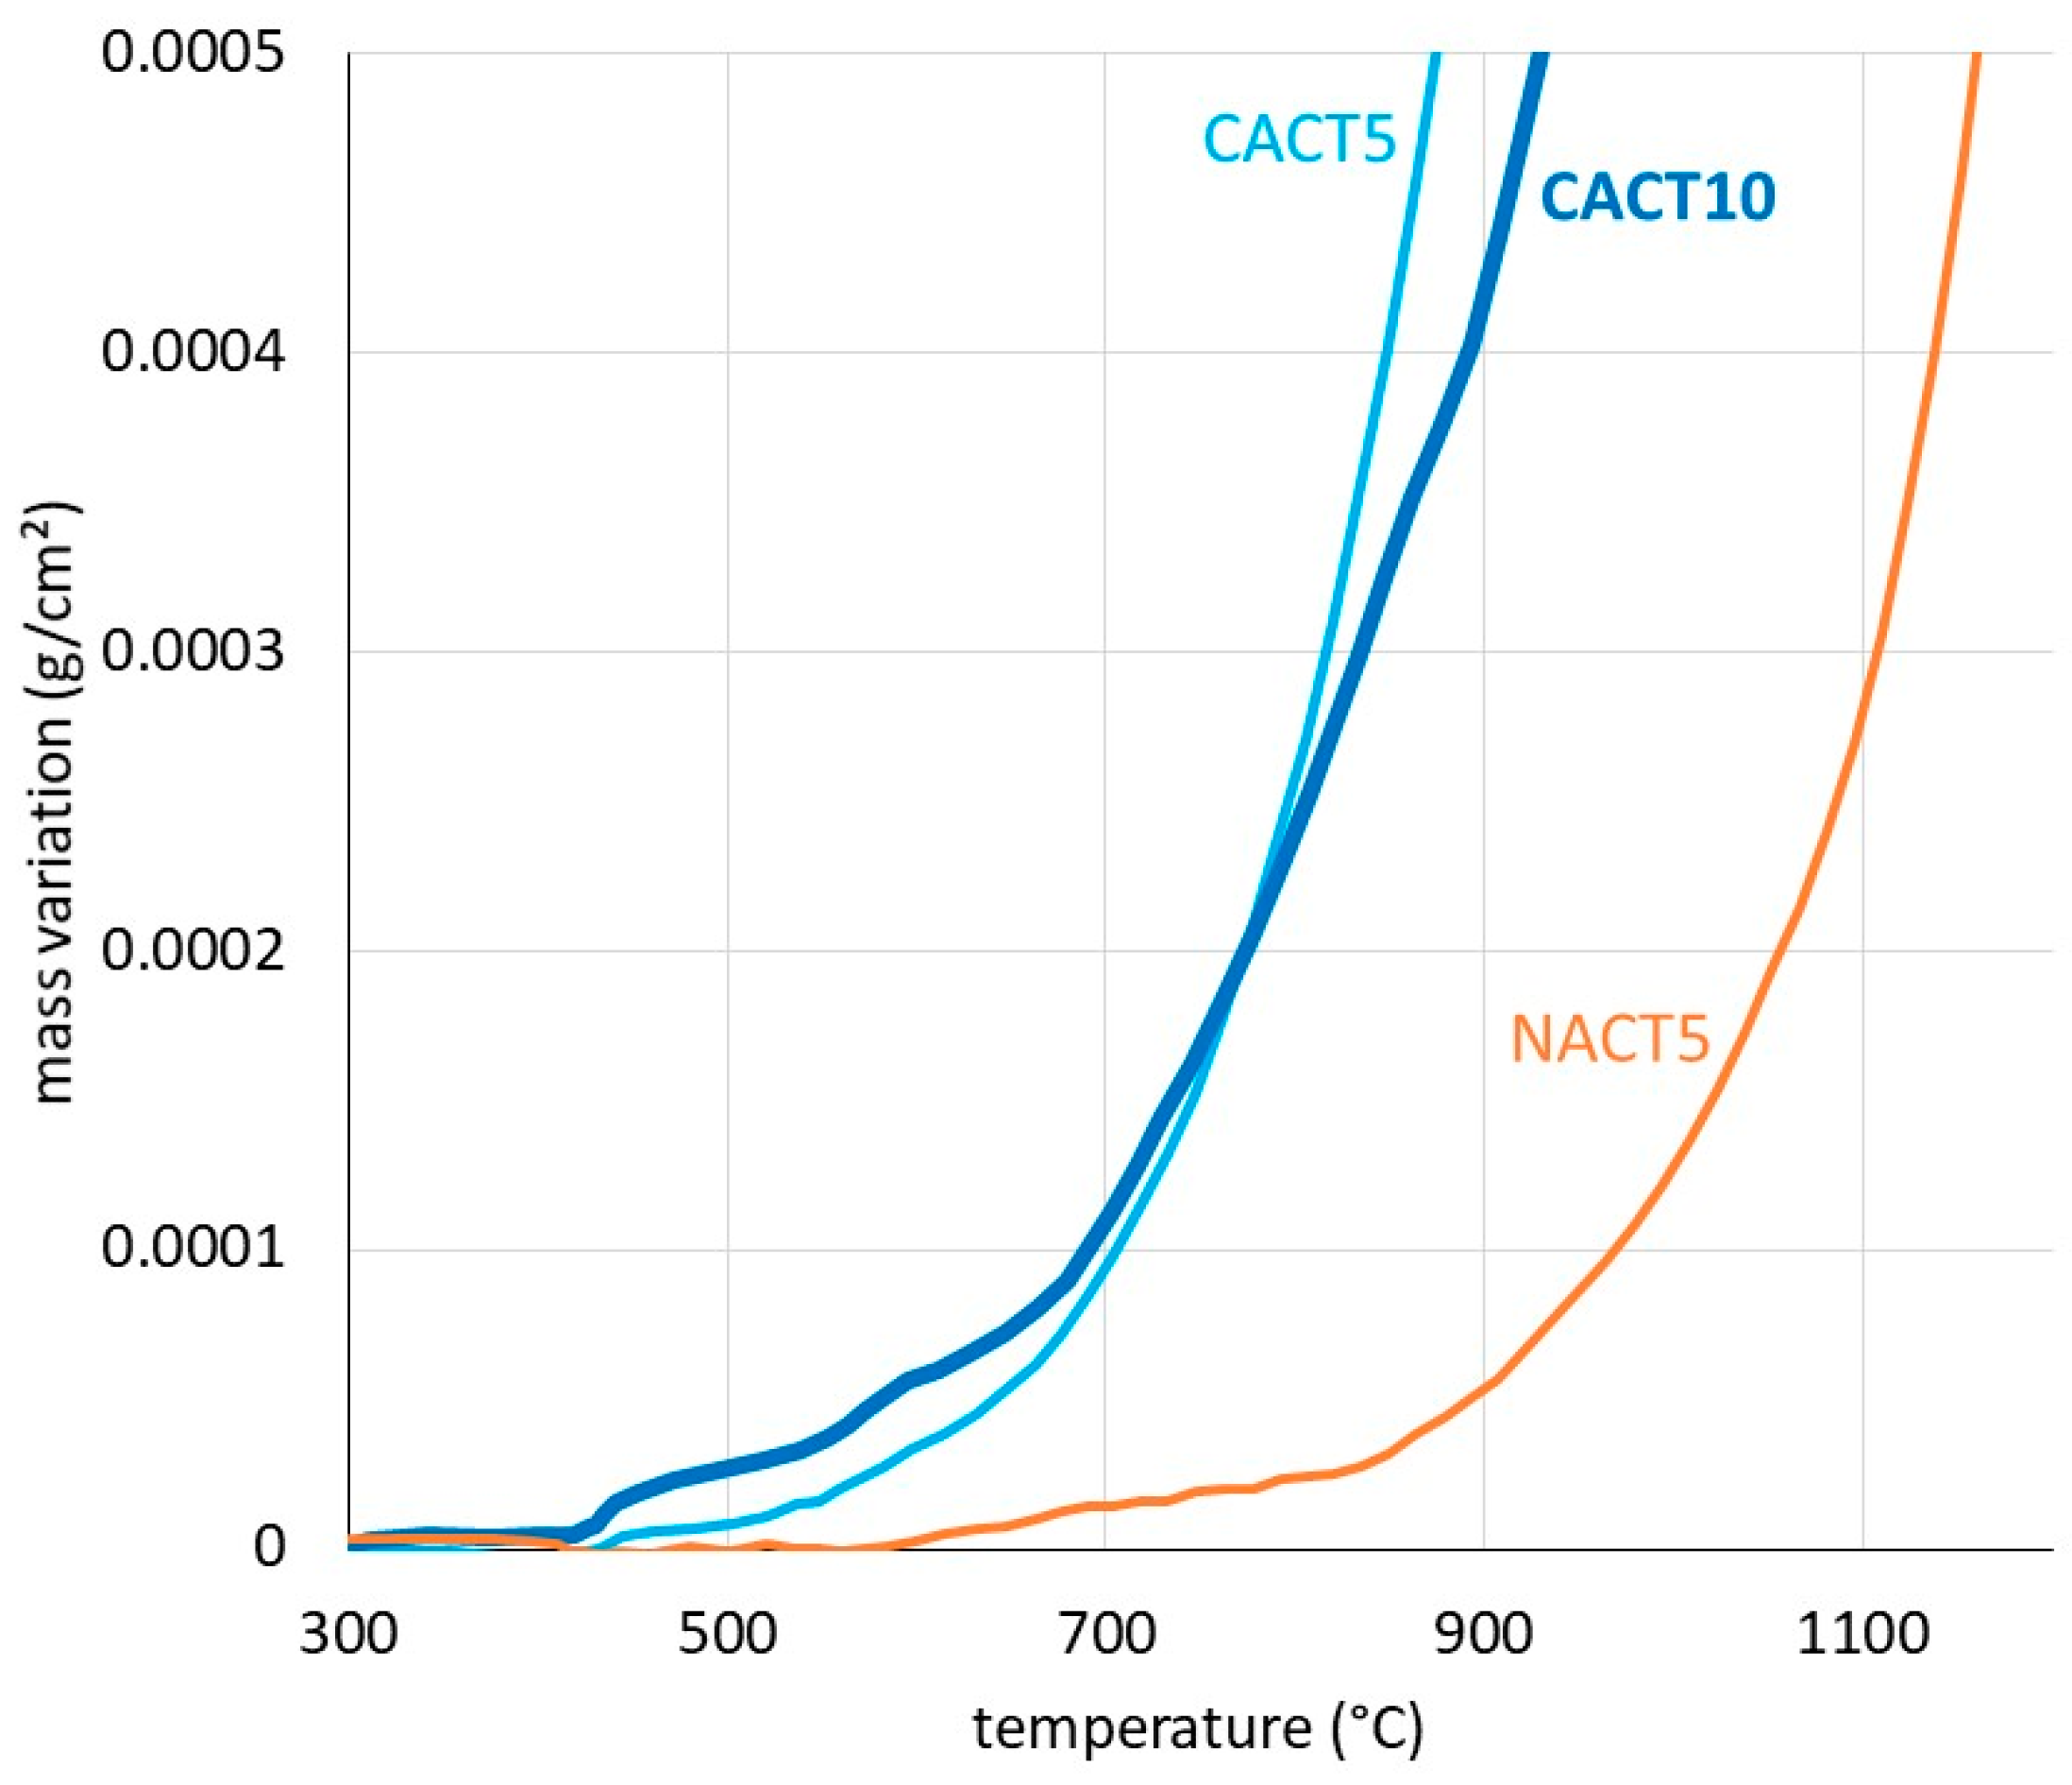
Figure 5.
Start of oxide scale spallation during cooling.
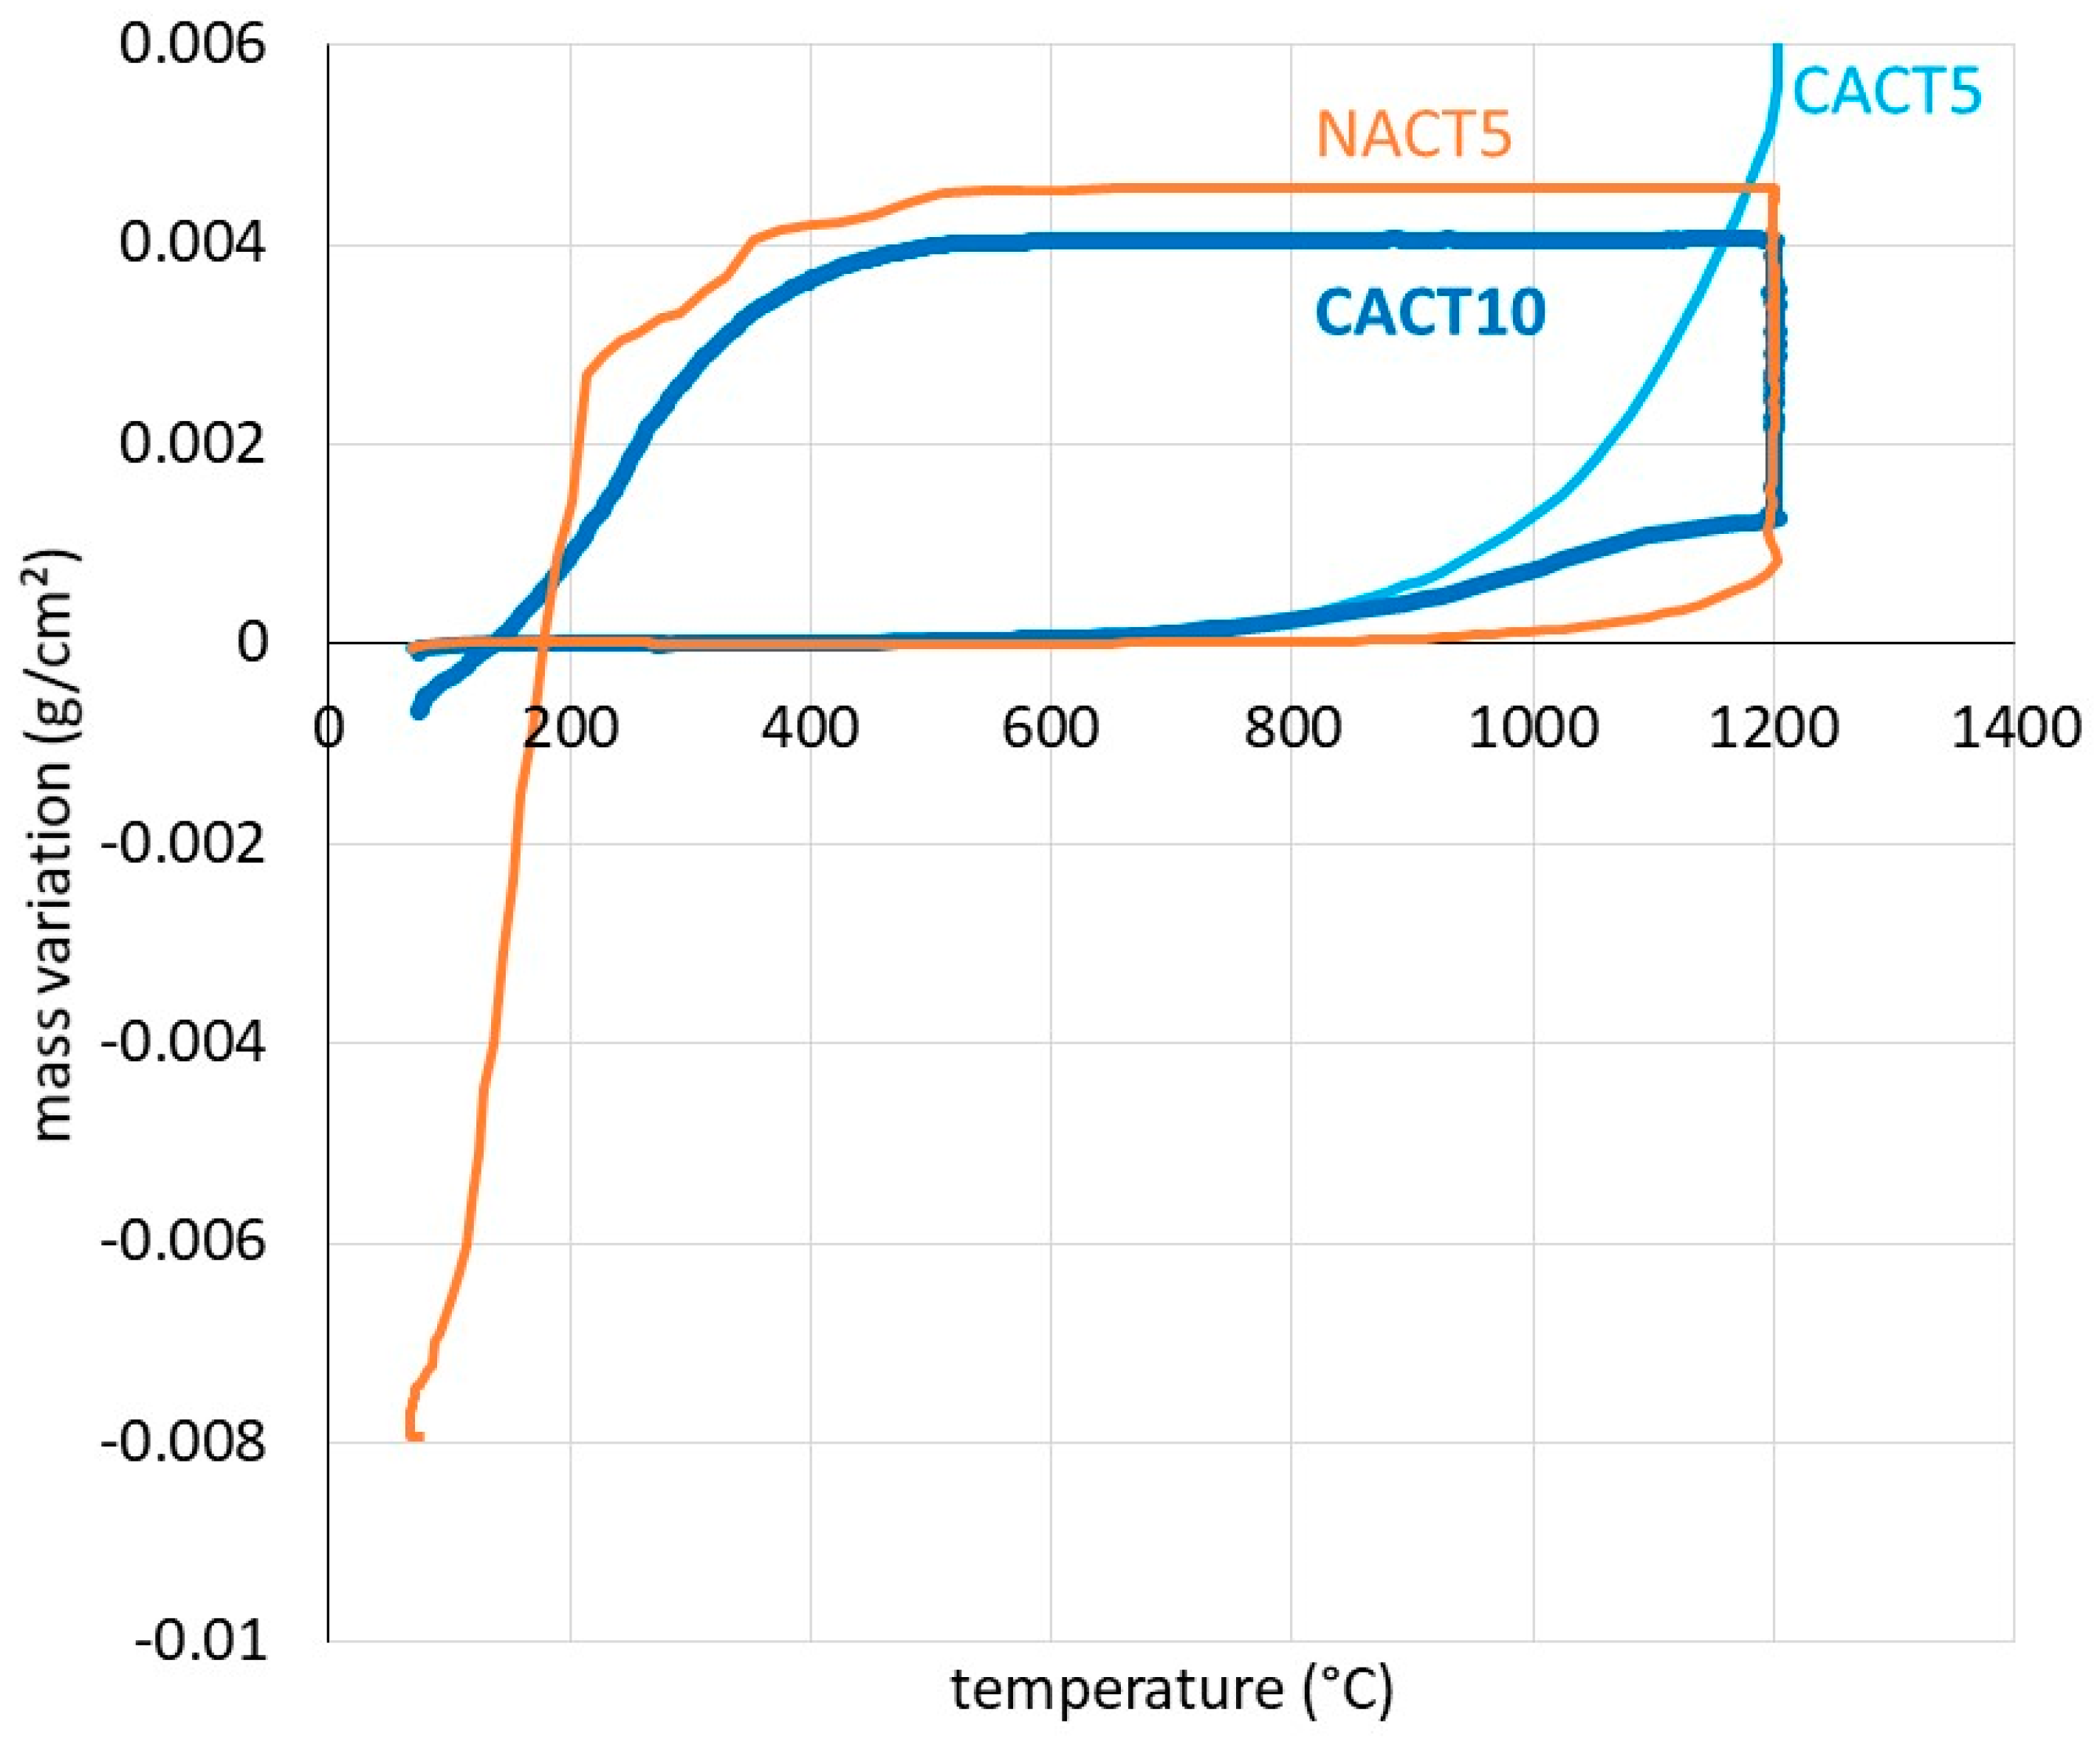
Figure 6.
SEM/SE observation of the oxidized CACT5 alloy (a, b, c) and SEM/BSE cross-sectional observation of the external oxides and alloy state (d).
Figure 6.
SEM/SE observation of the oxidized CACT5 alloy (a, b, c) and SEM/BSE cross-sectional observation of the external oxides and alloy state (d).
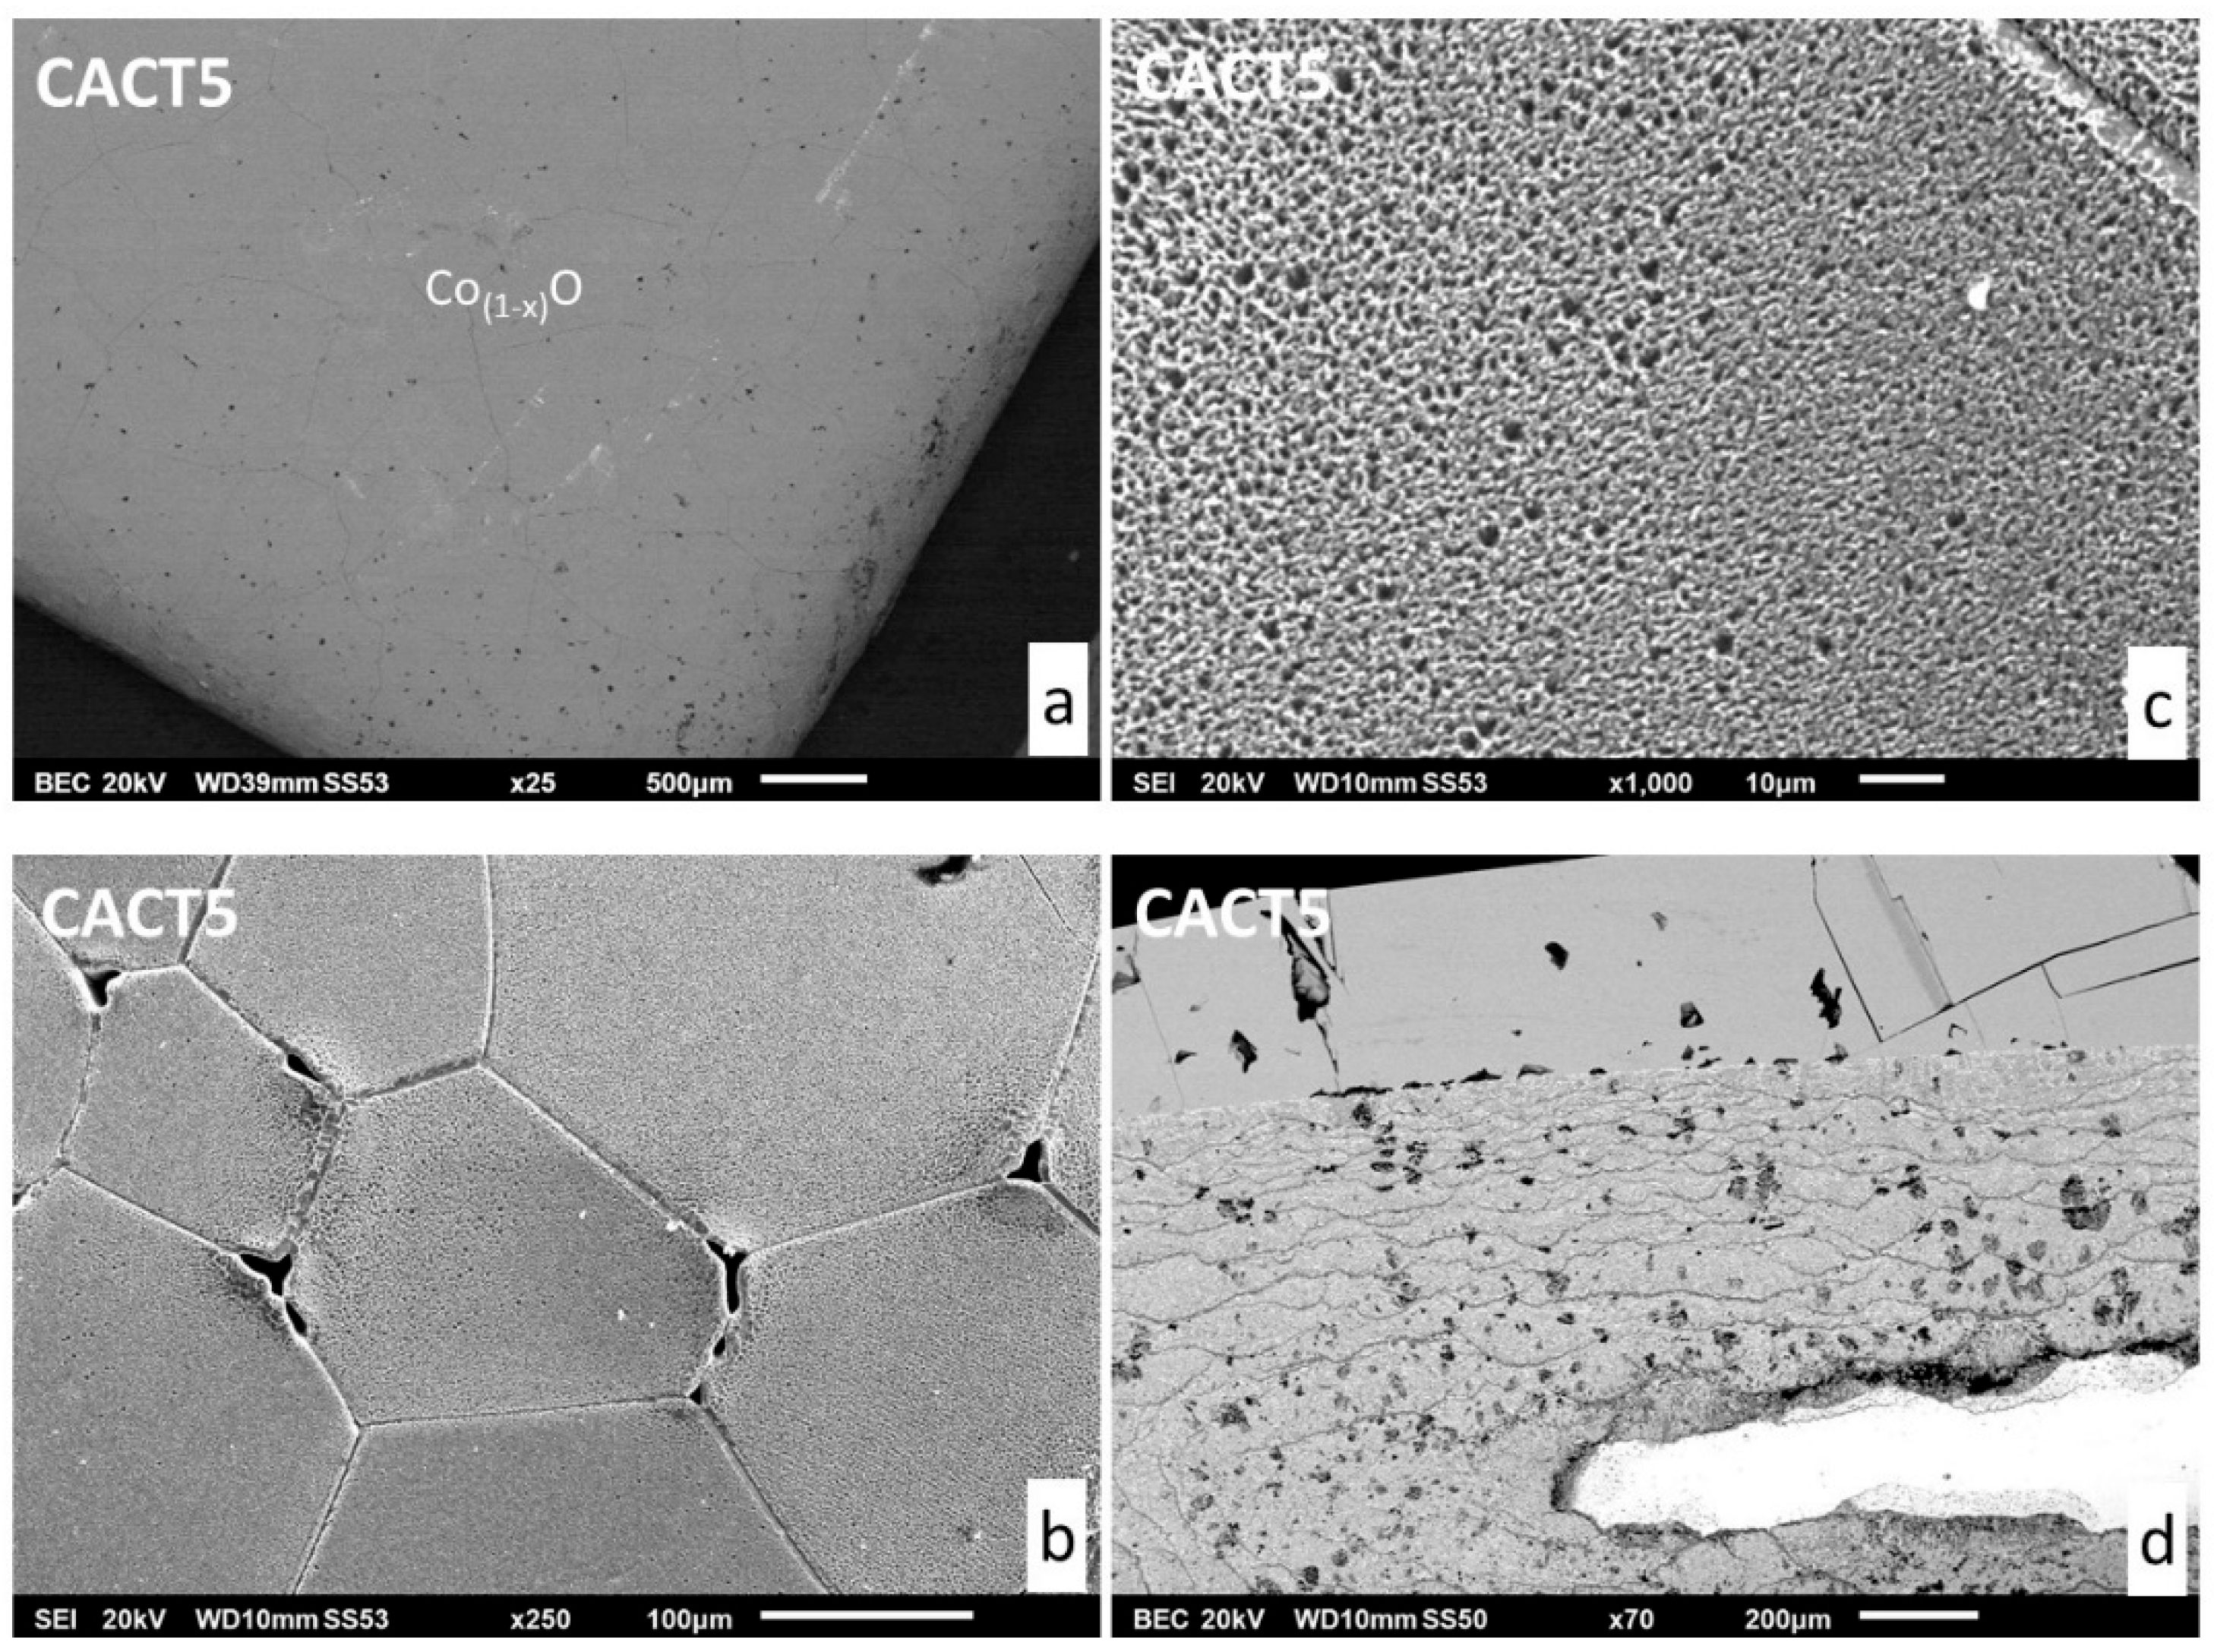
Figure 7.
Low (a) and high (b) magnification views of the parts of oxide scale remaining after spallation during cooling (SEM/BSE).
Figure 7.
Low (a) and high (b) magnification views of the parts of oxide scale remaining after spallation during cooling (SEM/BSE).
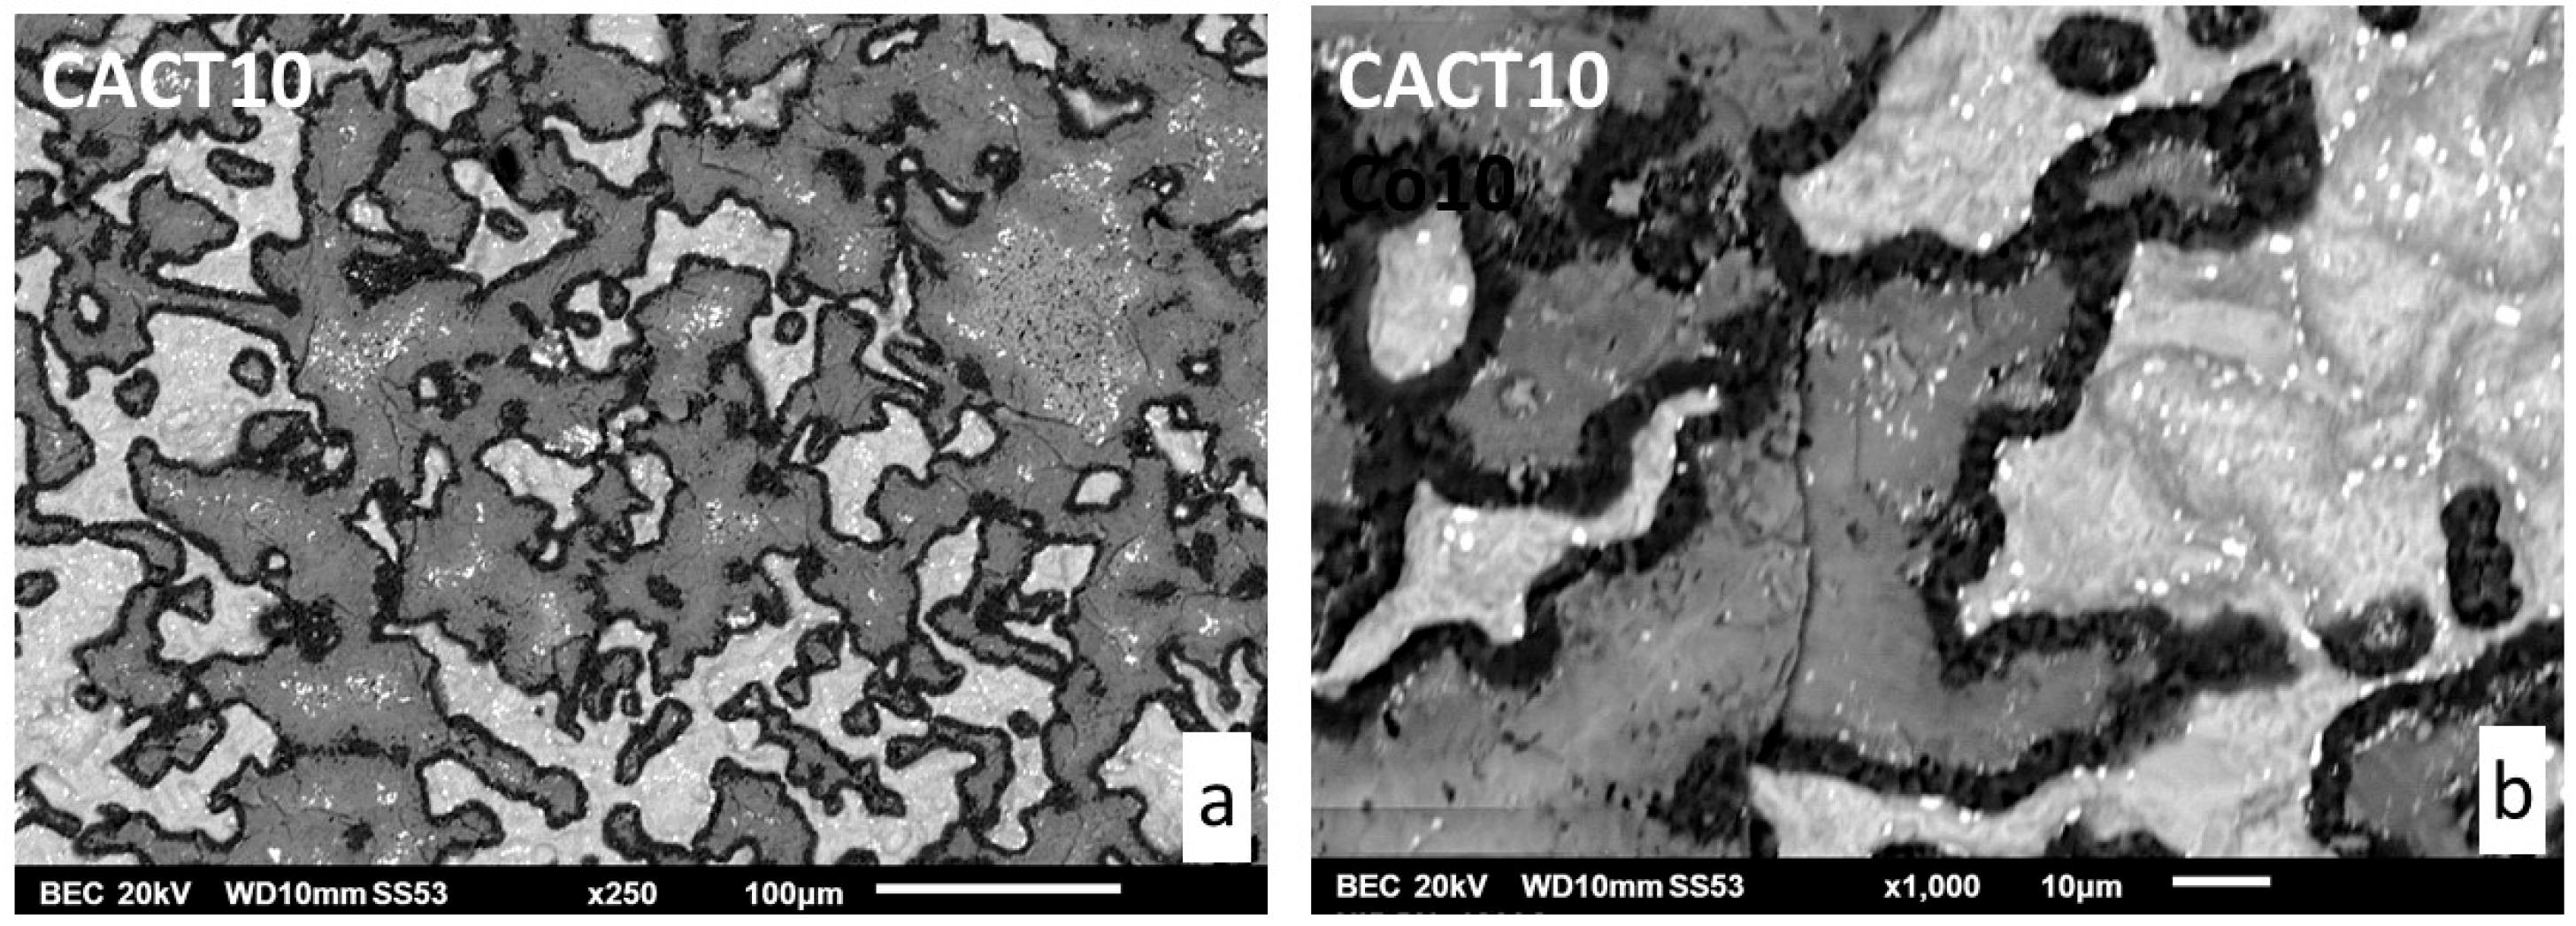
Figure 8.
Elemental EDS cartography helping to identify the different parts of the external scale (here: CACT10).
Figure 8.
Elemental EDS cartography helping to identify the different parts of the external scale (here: CACT10).
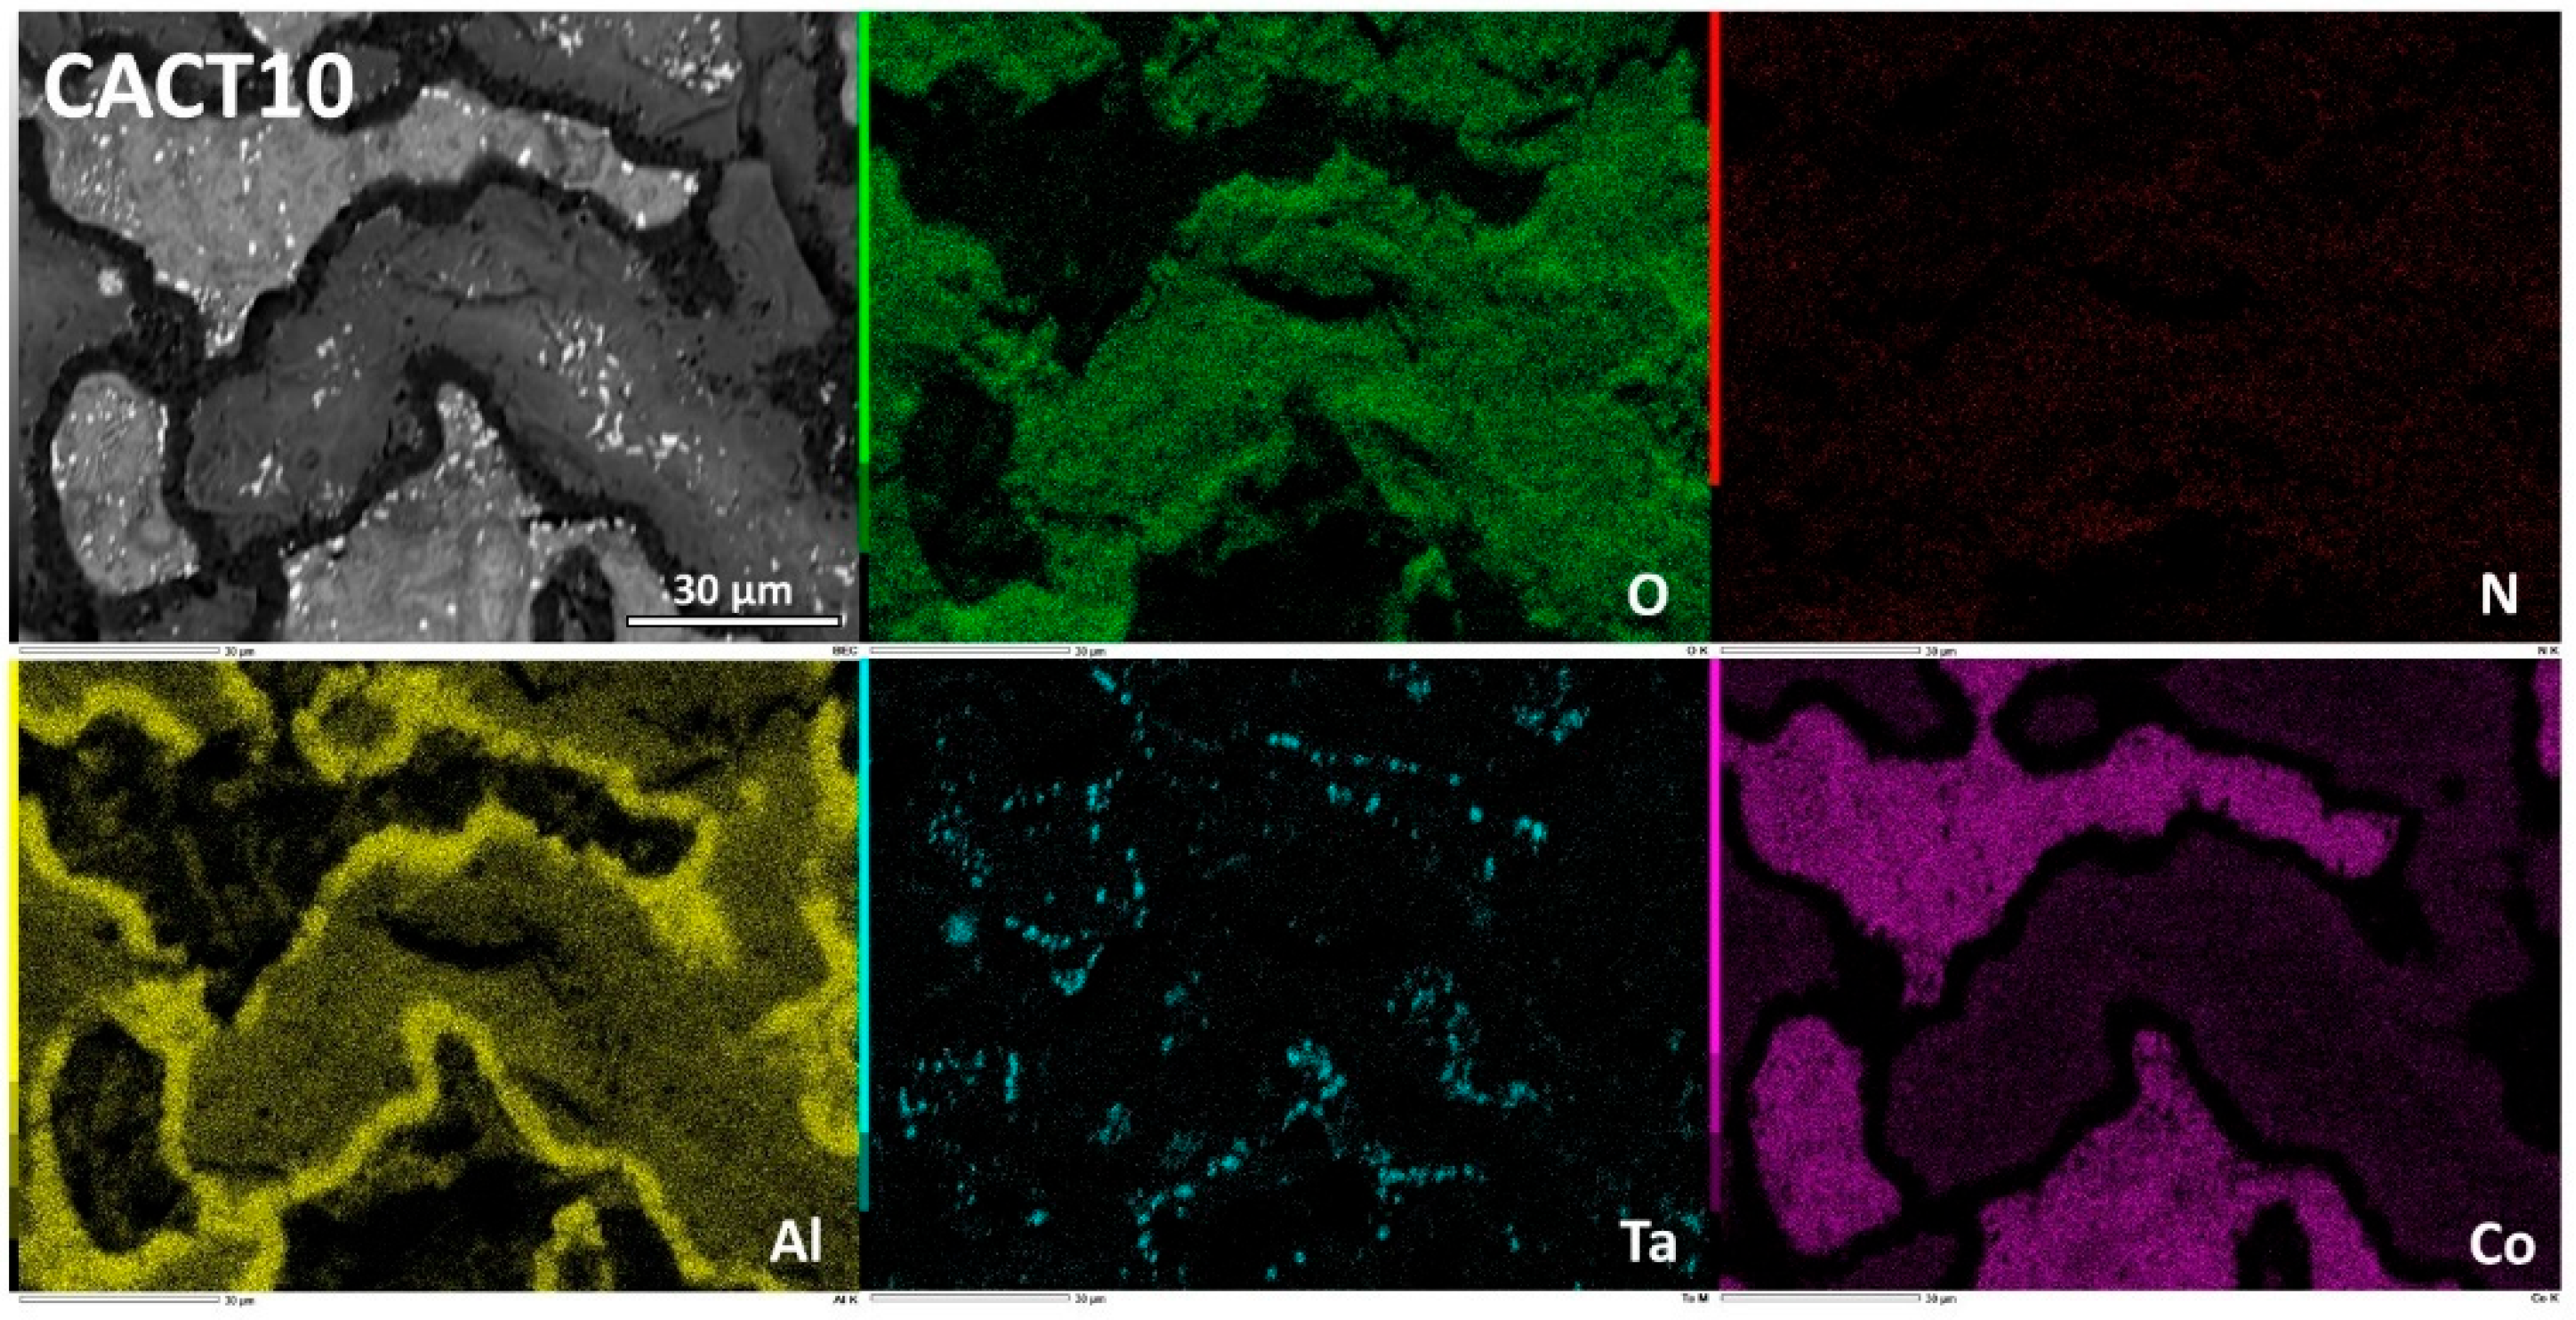
Figure 9.
Elemental EDS cartography helping to identify the different parts of the external scale (here: NACT5).
Figure 9.
Elemental EDS cartography helping to identify the different parts of the external scale (here: NACT5).
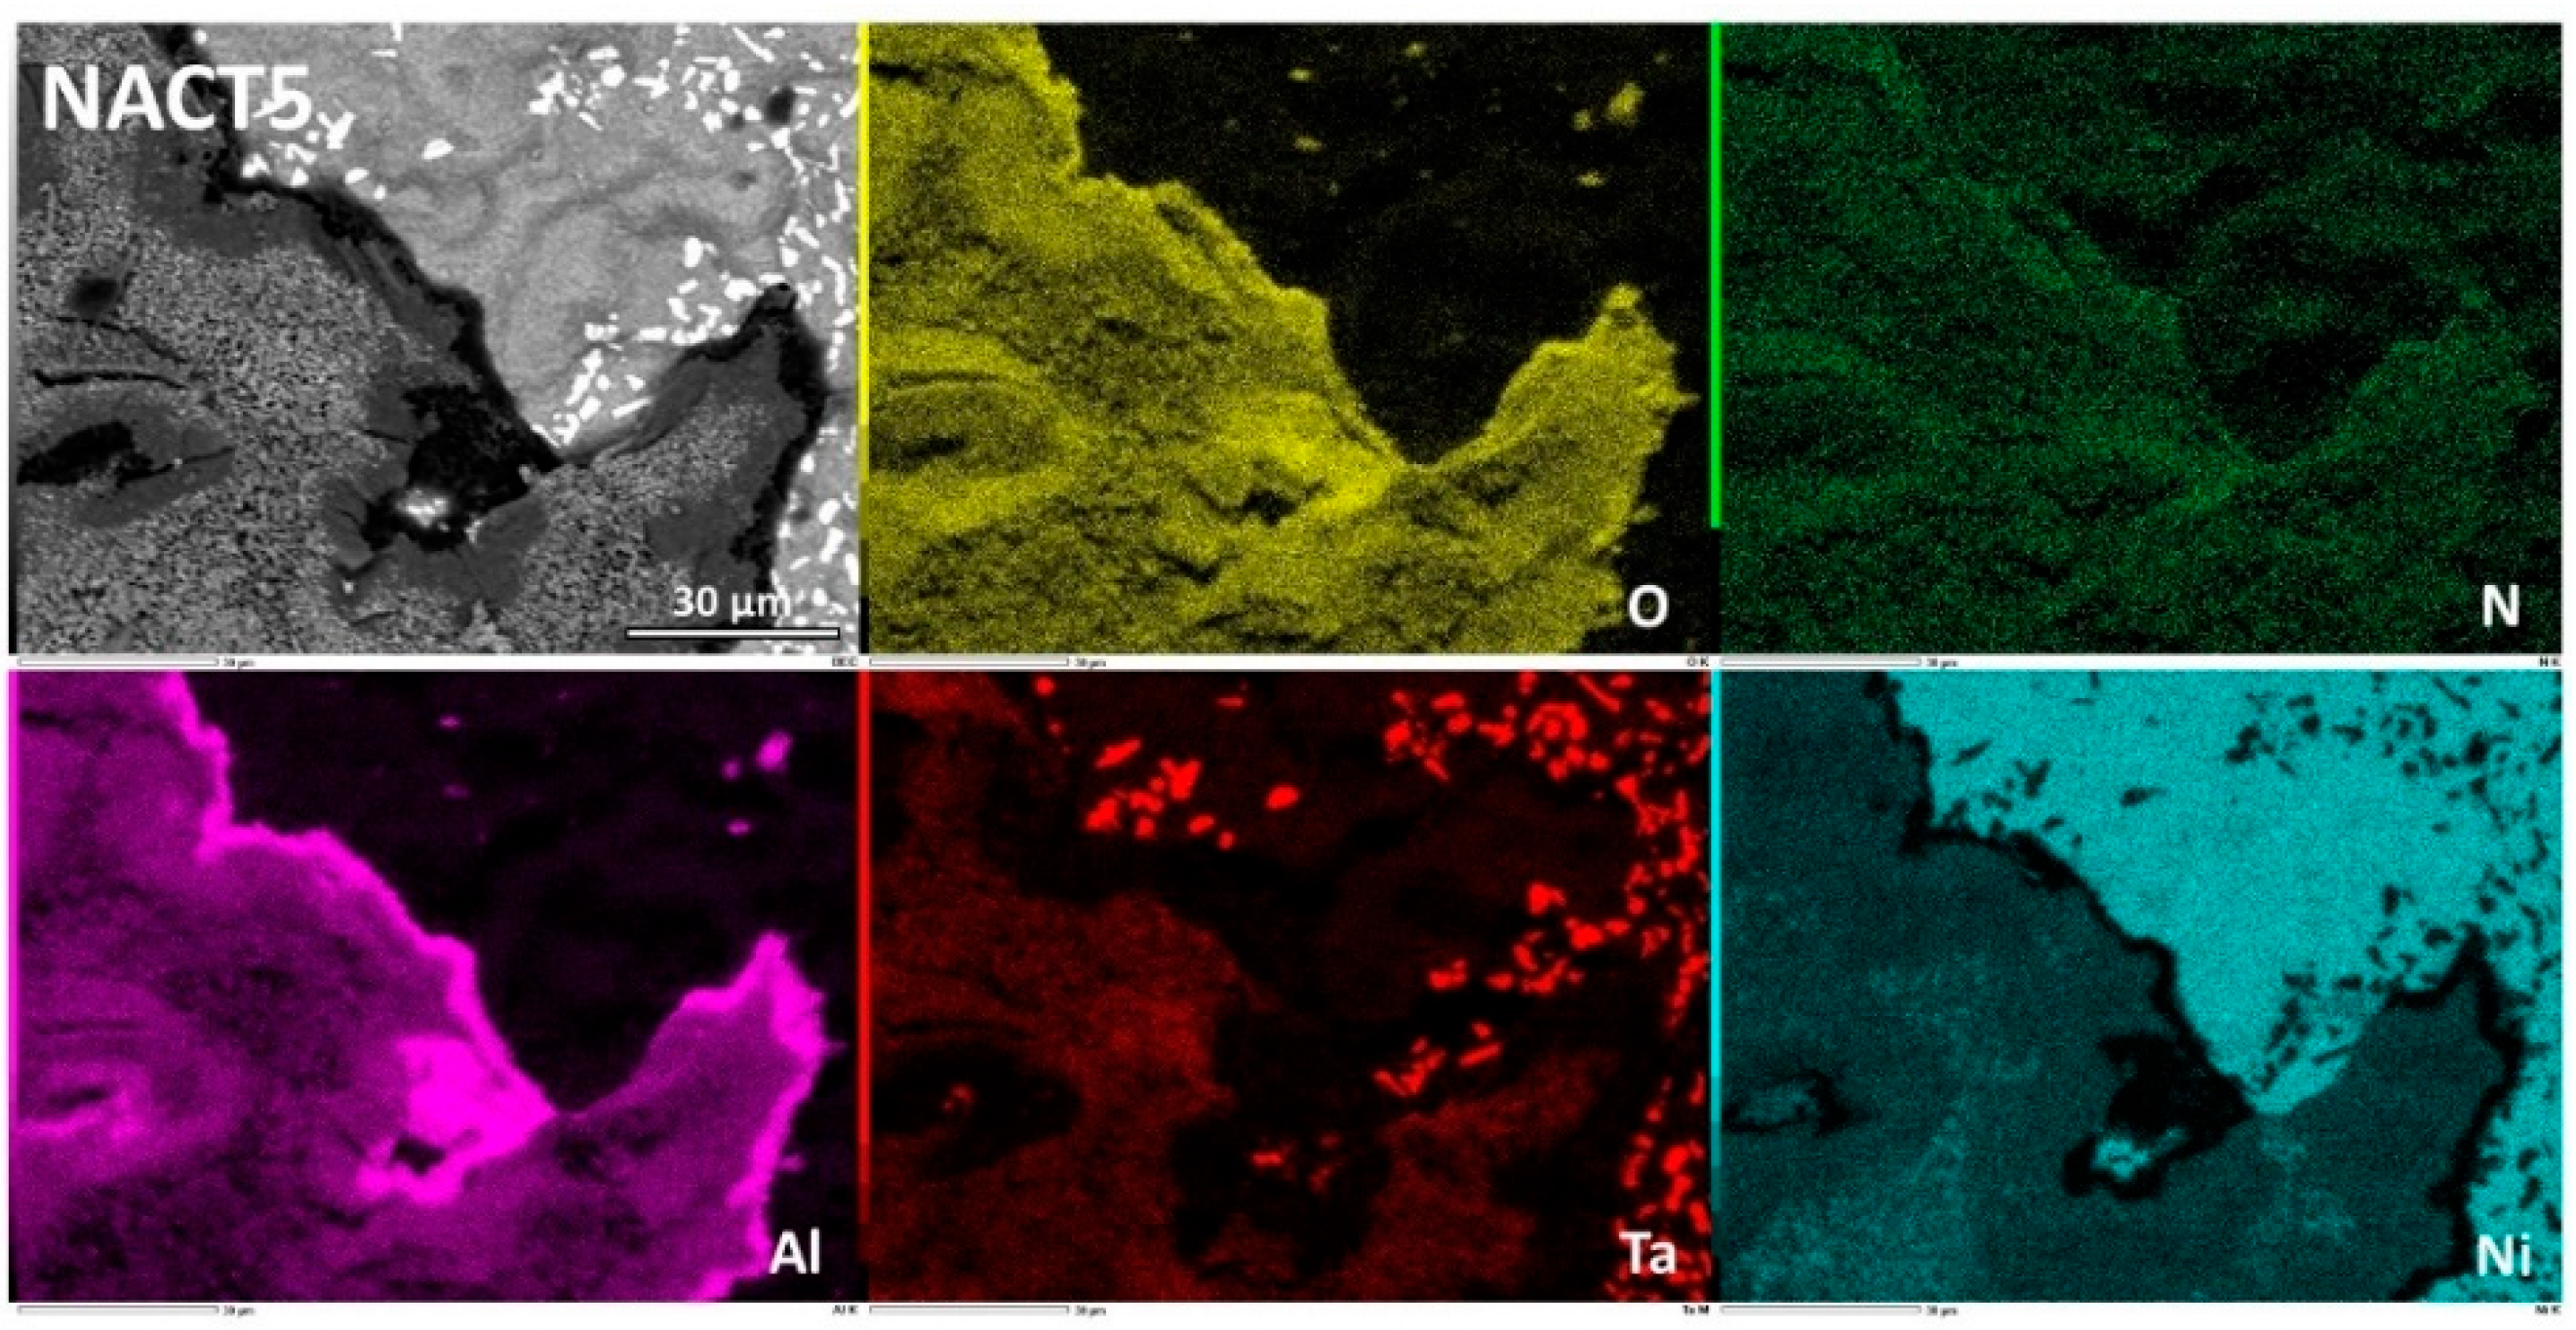
Figure 10.
Elemental EDS cartography on the oxide scale and deteriorated subsurface of the CACT5 alloy, at low magnification.
Figure 10.
Elemental EDS cartography on the oxide scale and deteriorated subsurface of the CACT5 alloy, at low magnification.
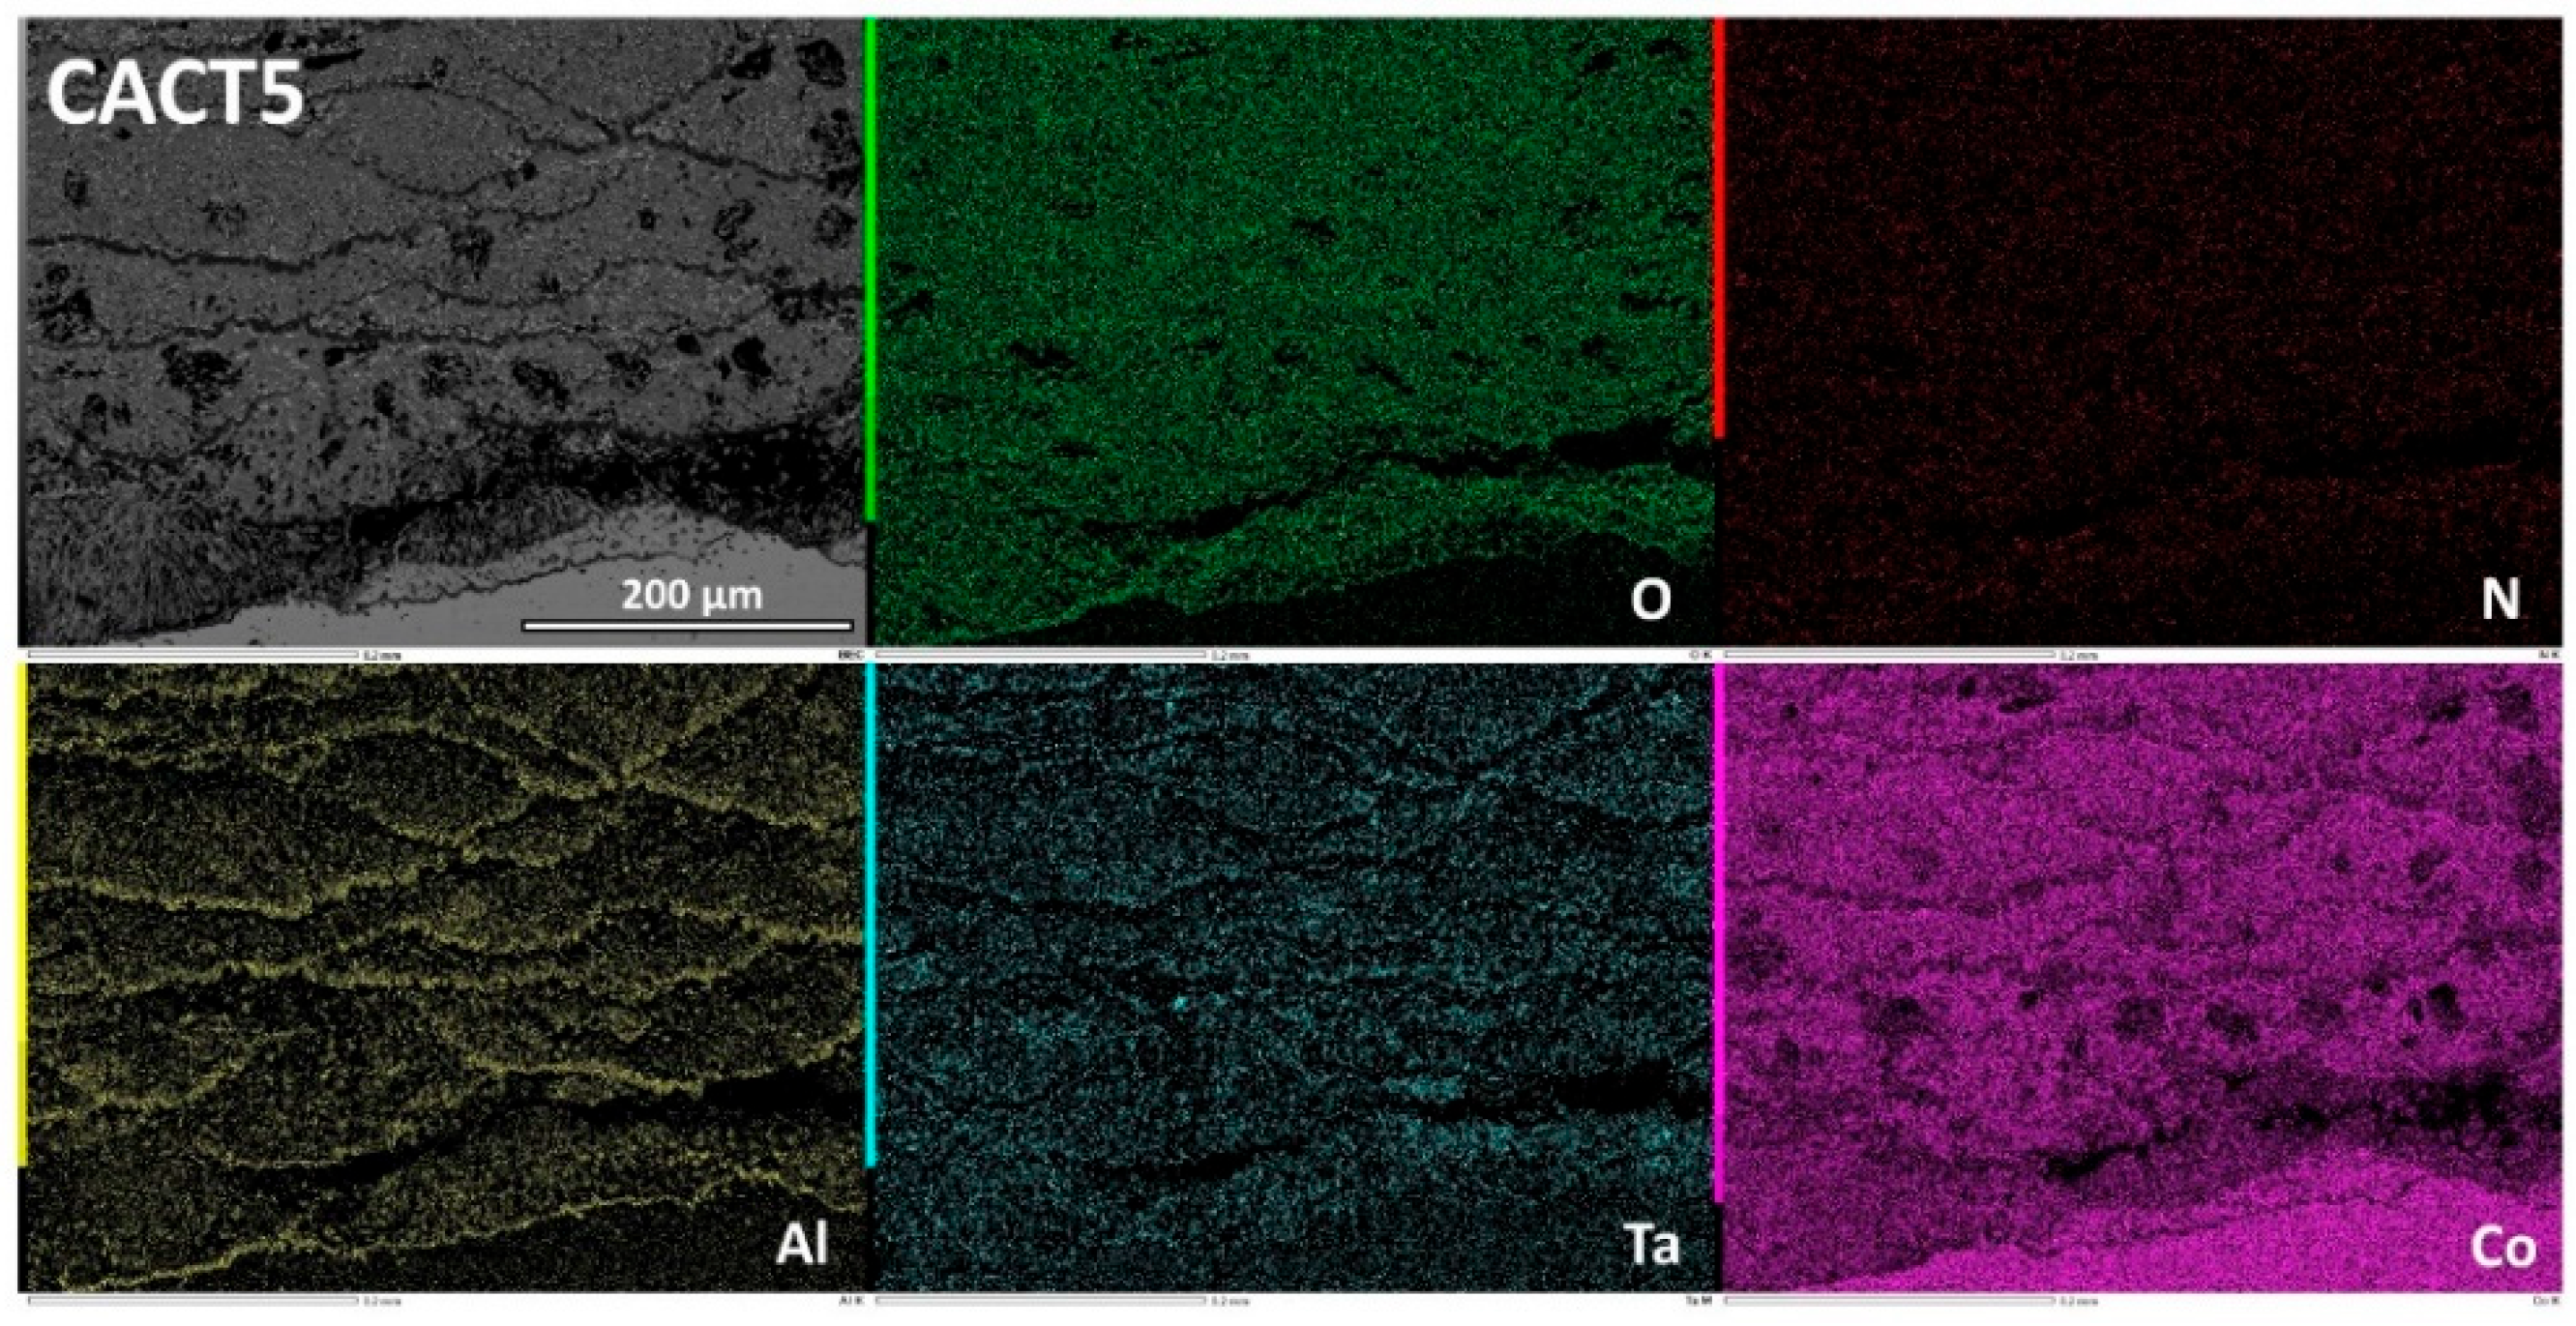
Figure 11.
Elemental EDS cartography on the innermost part of the oxide scale covering the CACT5 alloy, at high magnification.
Figure 11.
Elemental EDS cartography on the innermost part of the oxide scale covering the CACT5 alloy, at high magnification.
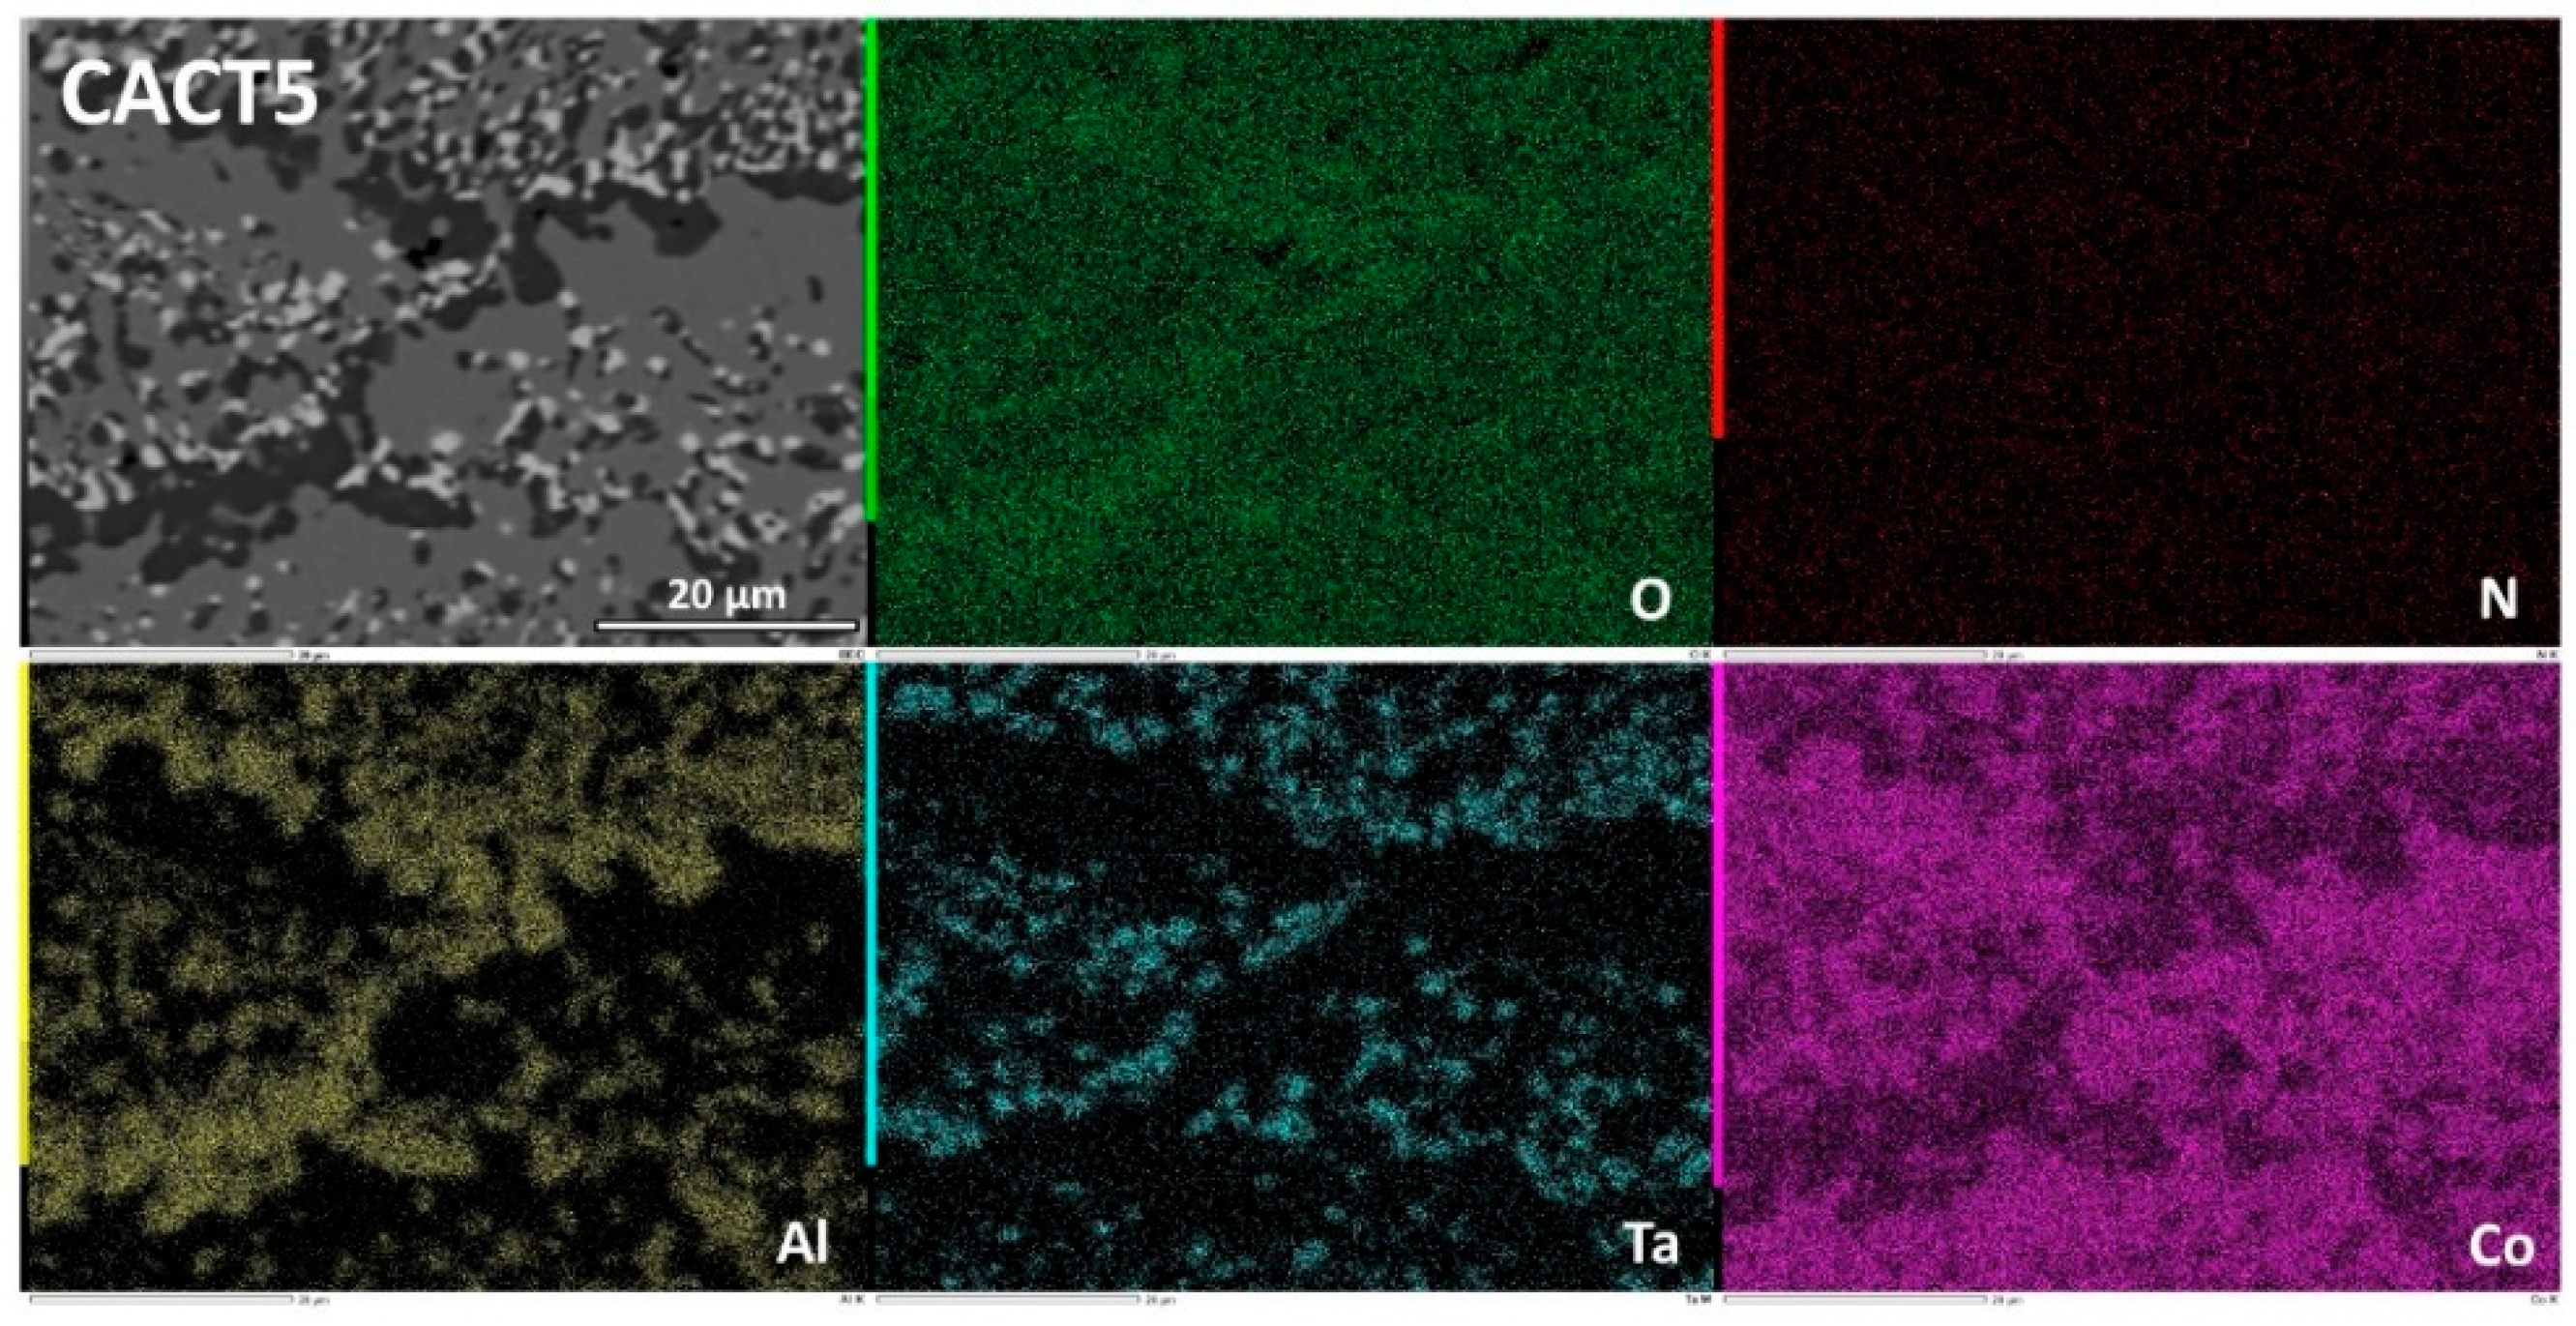
Figure 12.
Oxidized CACT5 alloy: SEM/BSE micrographs and EDS concentration profiles across the whole oxide scale (two zones) and across the whole remaining alloy.
Figure 12.
Oxidized CACT5 alloy: SEM/BSE micrographs and EDS concentration profiles across the whole oxide scale (two zones) and across the whole remaining alloy.
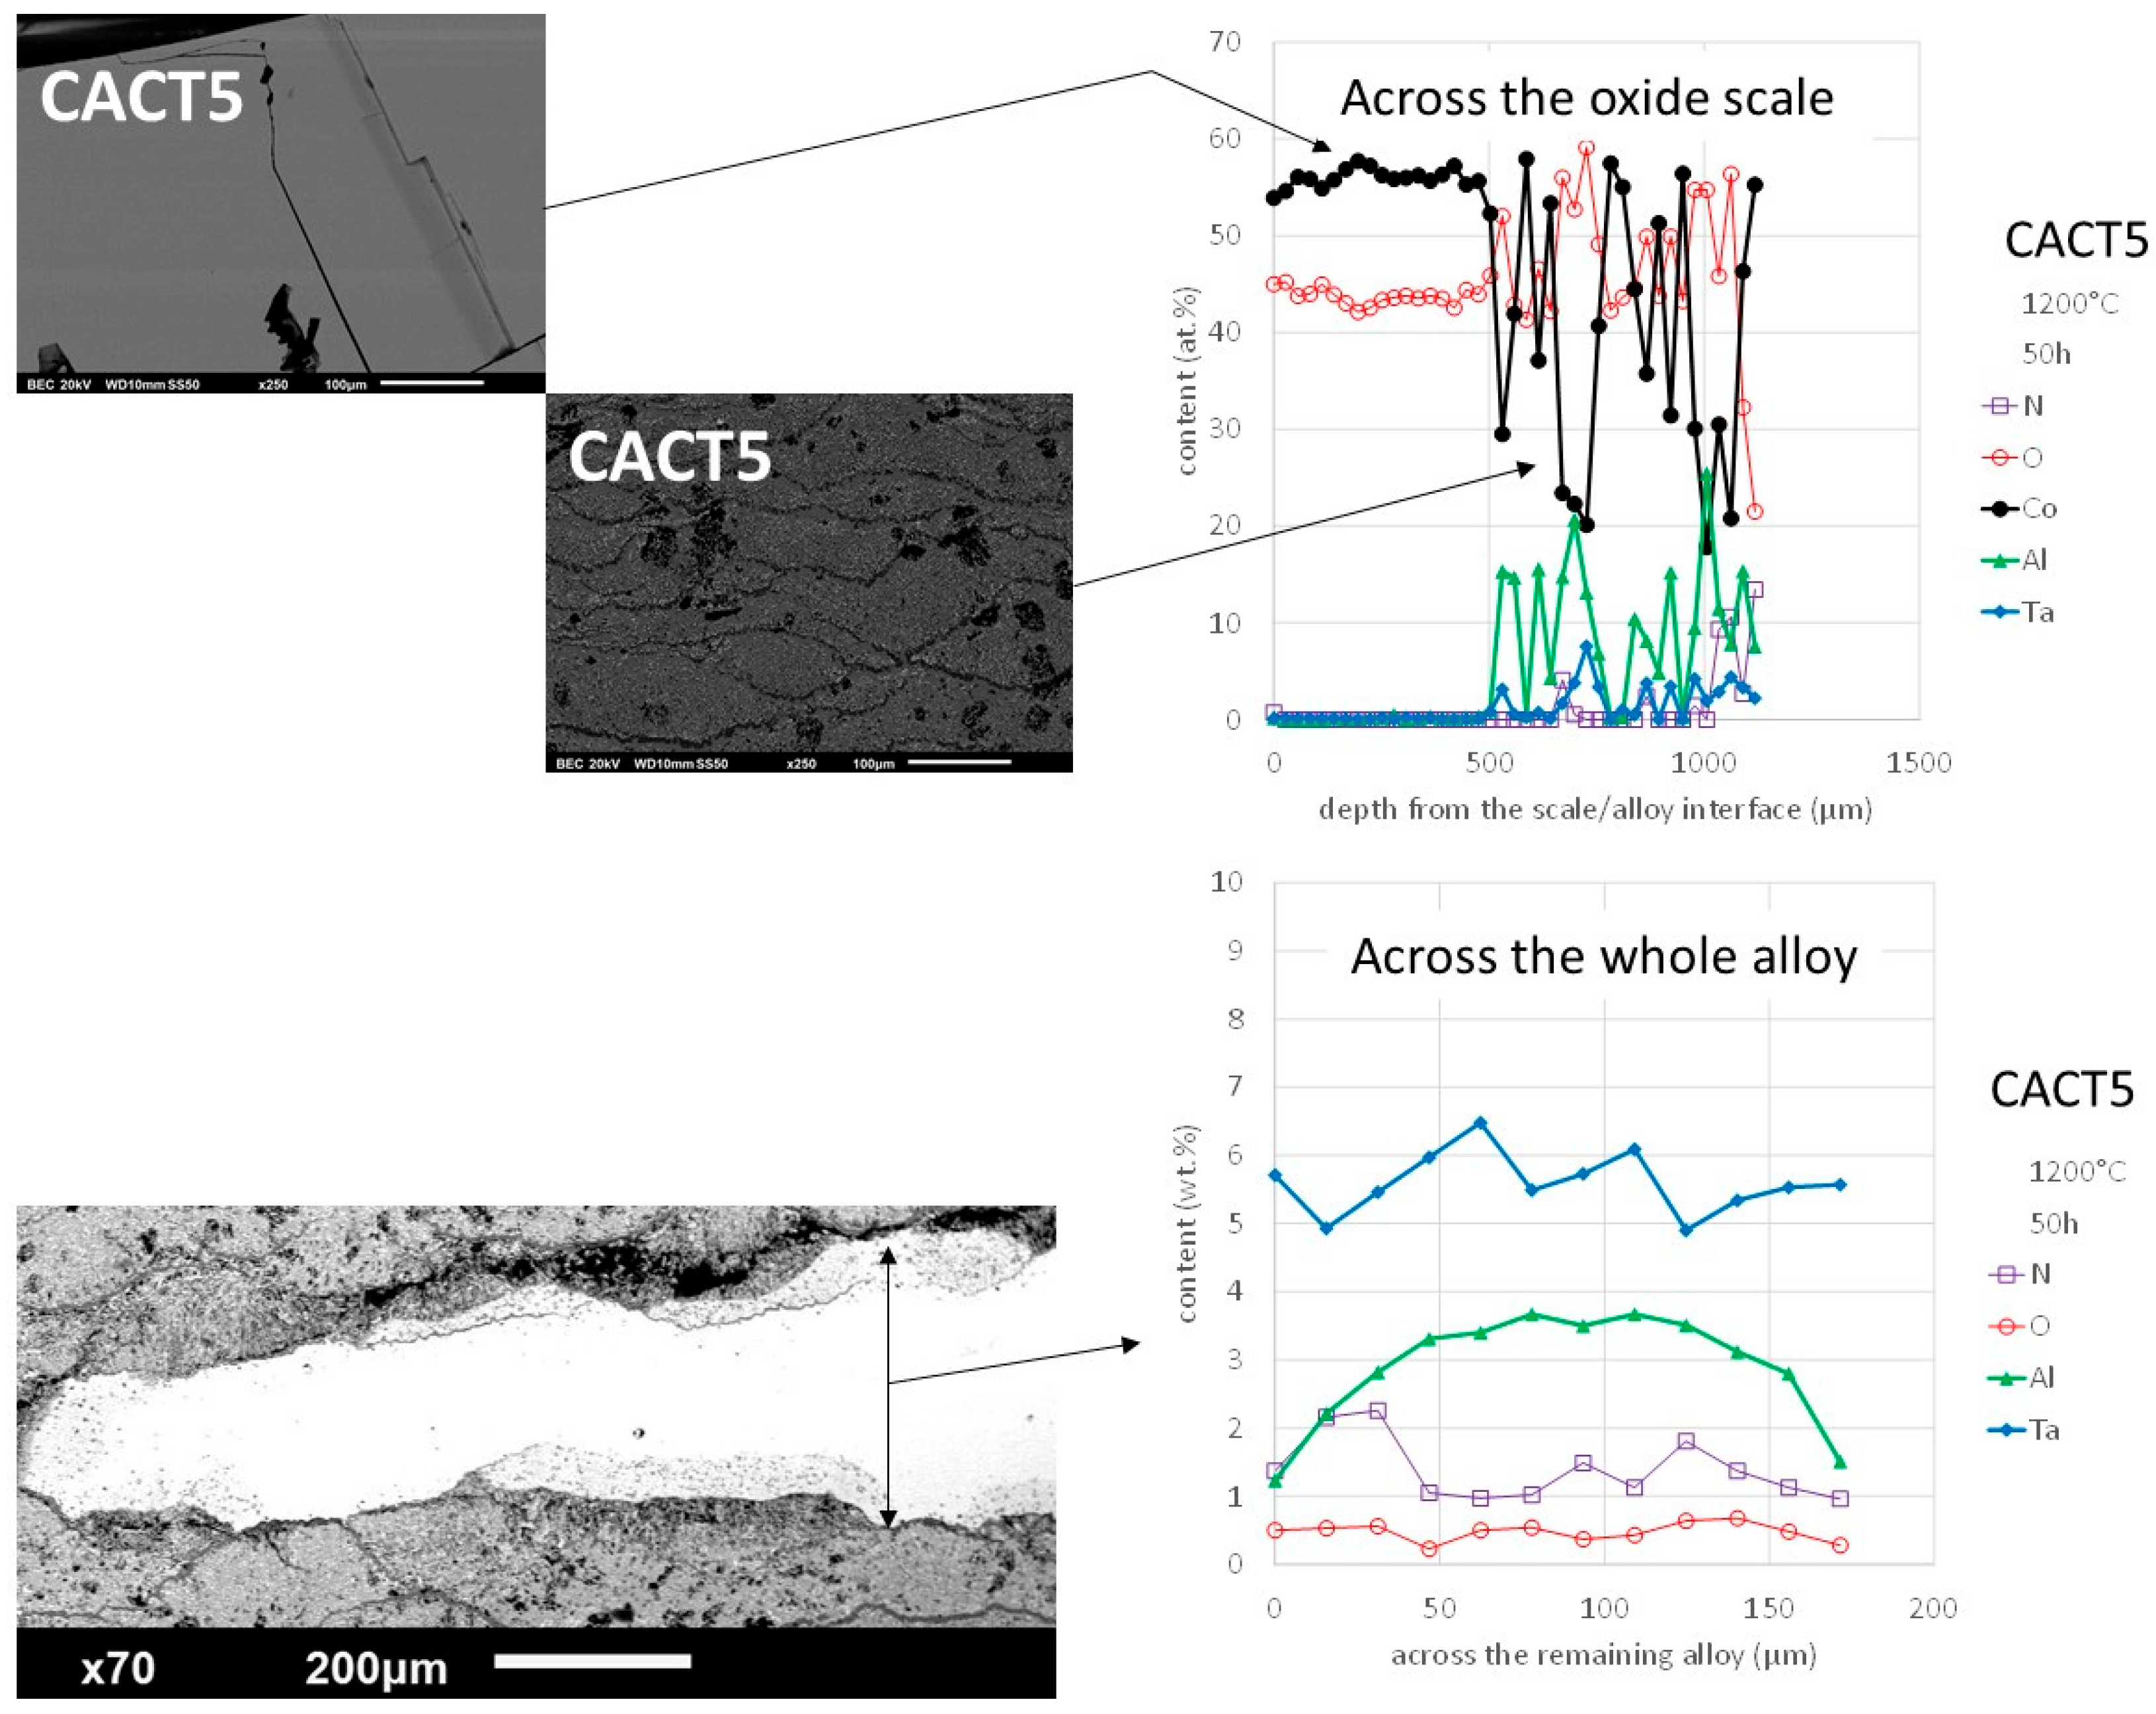
Figure 13.
Elemental EDS cartography on the external oxide scale and the subsurface of the NACT5 alloy.
Figure 13.
Elemental EDS cartography on the external oxide scale and the subsurface of the NACT5 alloy.
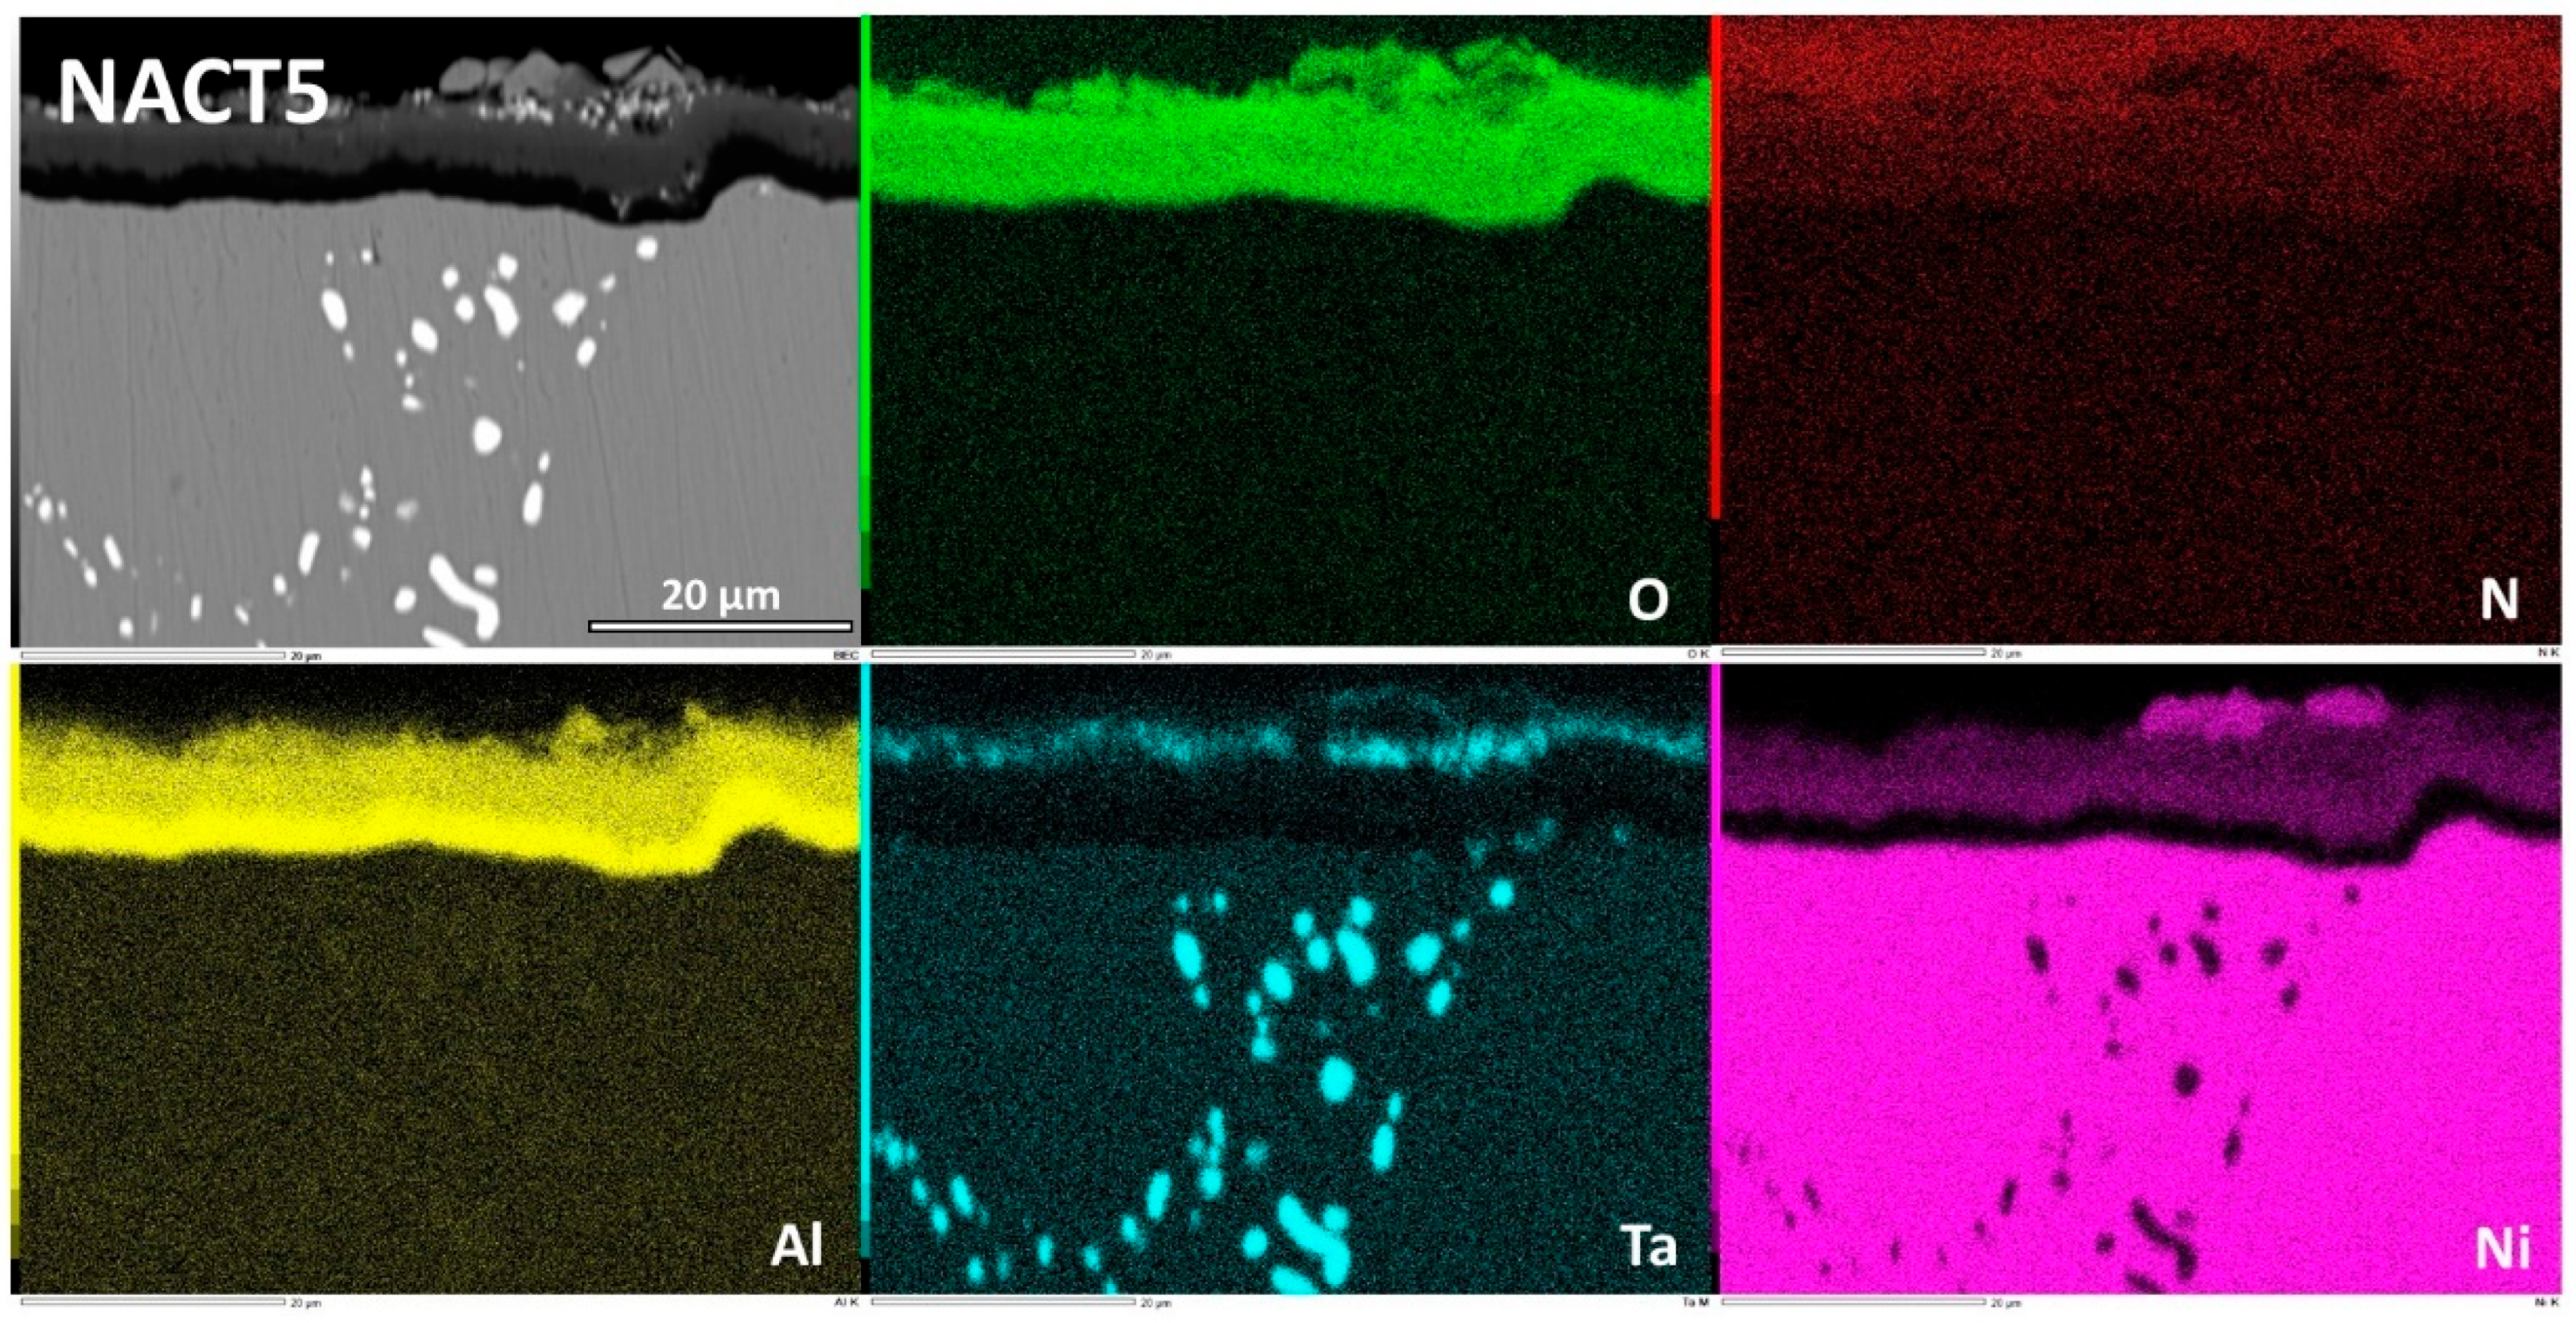
Figure 14.
Oxidized NACT5 alloy: SEM/BSE micrographs and EDS concentration profiles across the oxide scale and the subsurface (top right) and across the oxide scale only.
Figure 14.
Oxidized NACT5 alloy: SEM/BSE micrographs and EDS concentration profiles across the oxide scale and the subsurface (top right) and across the oxide scale only.
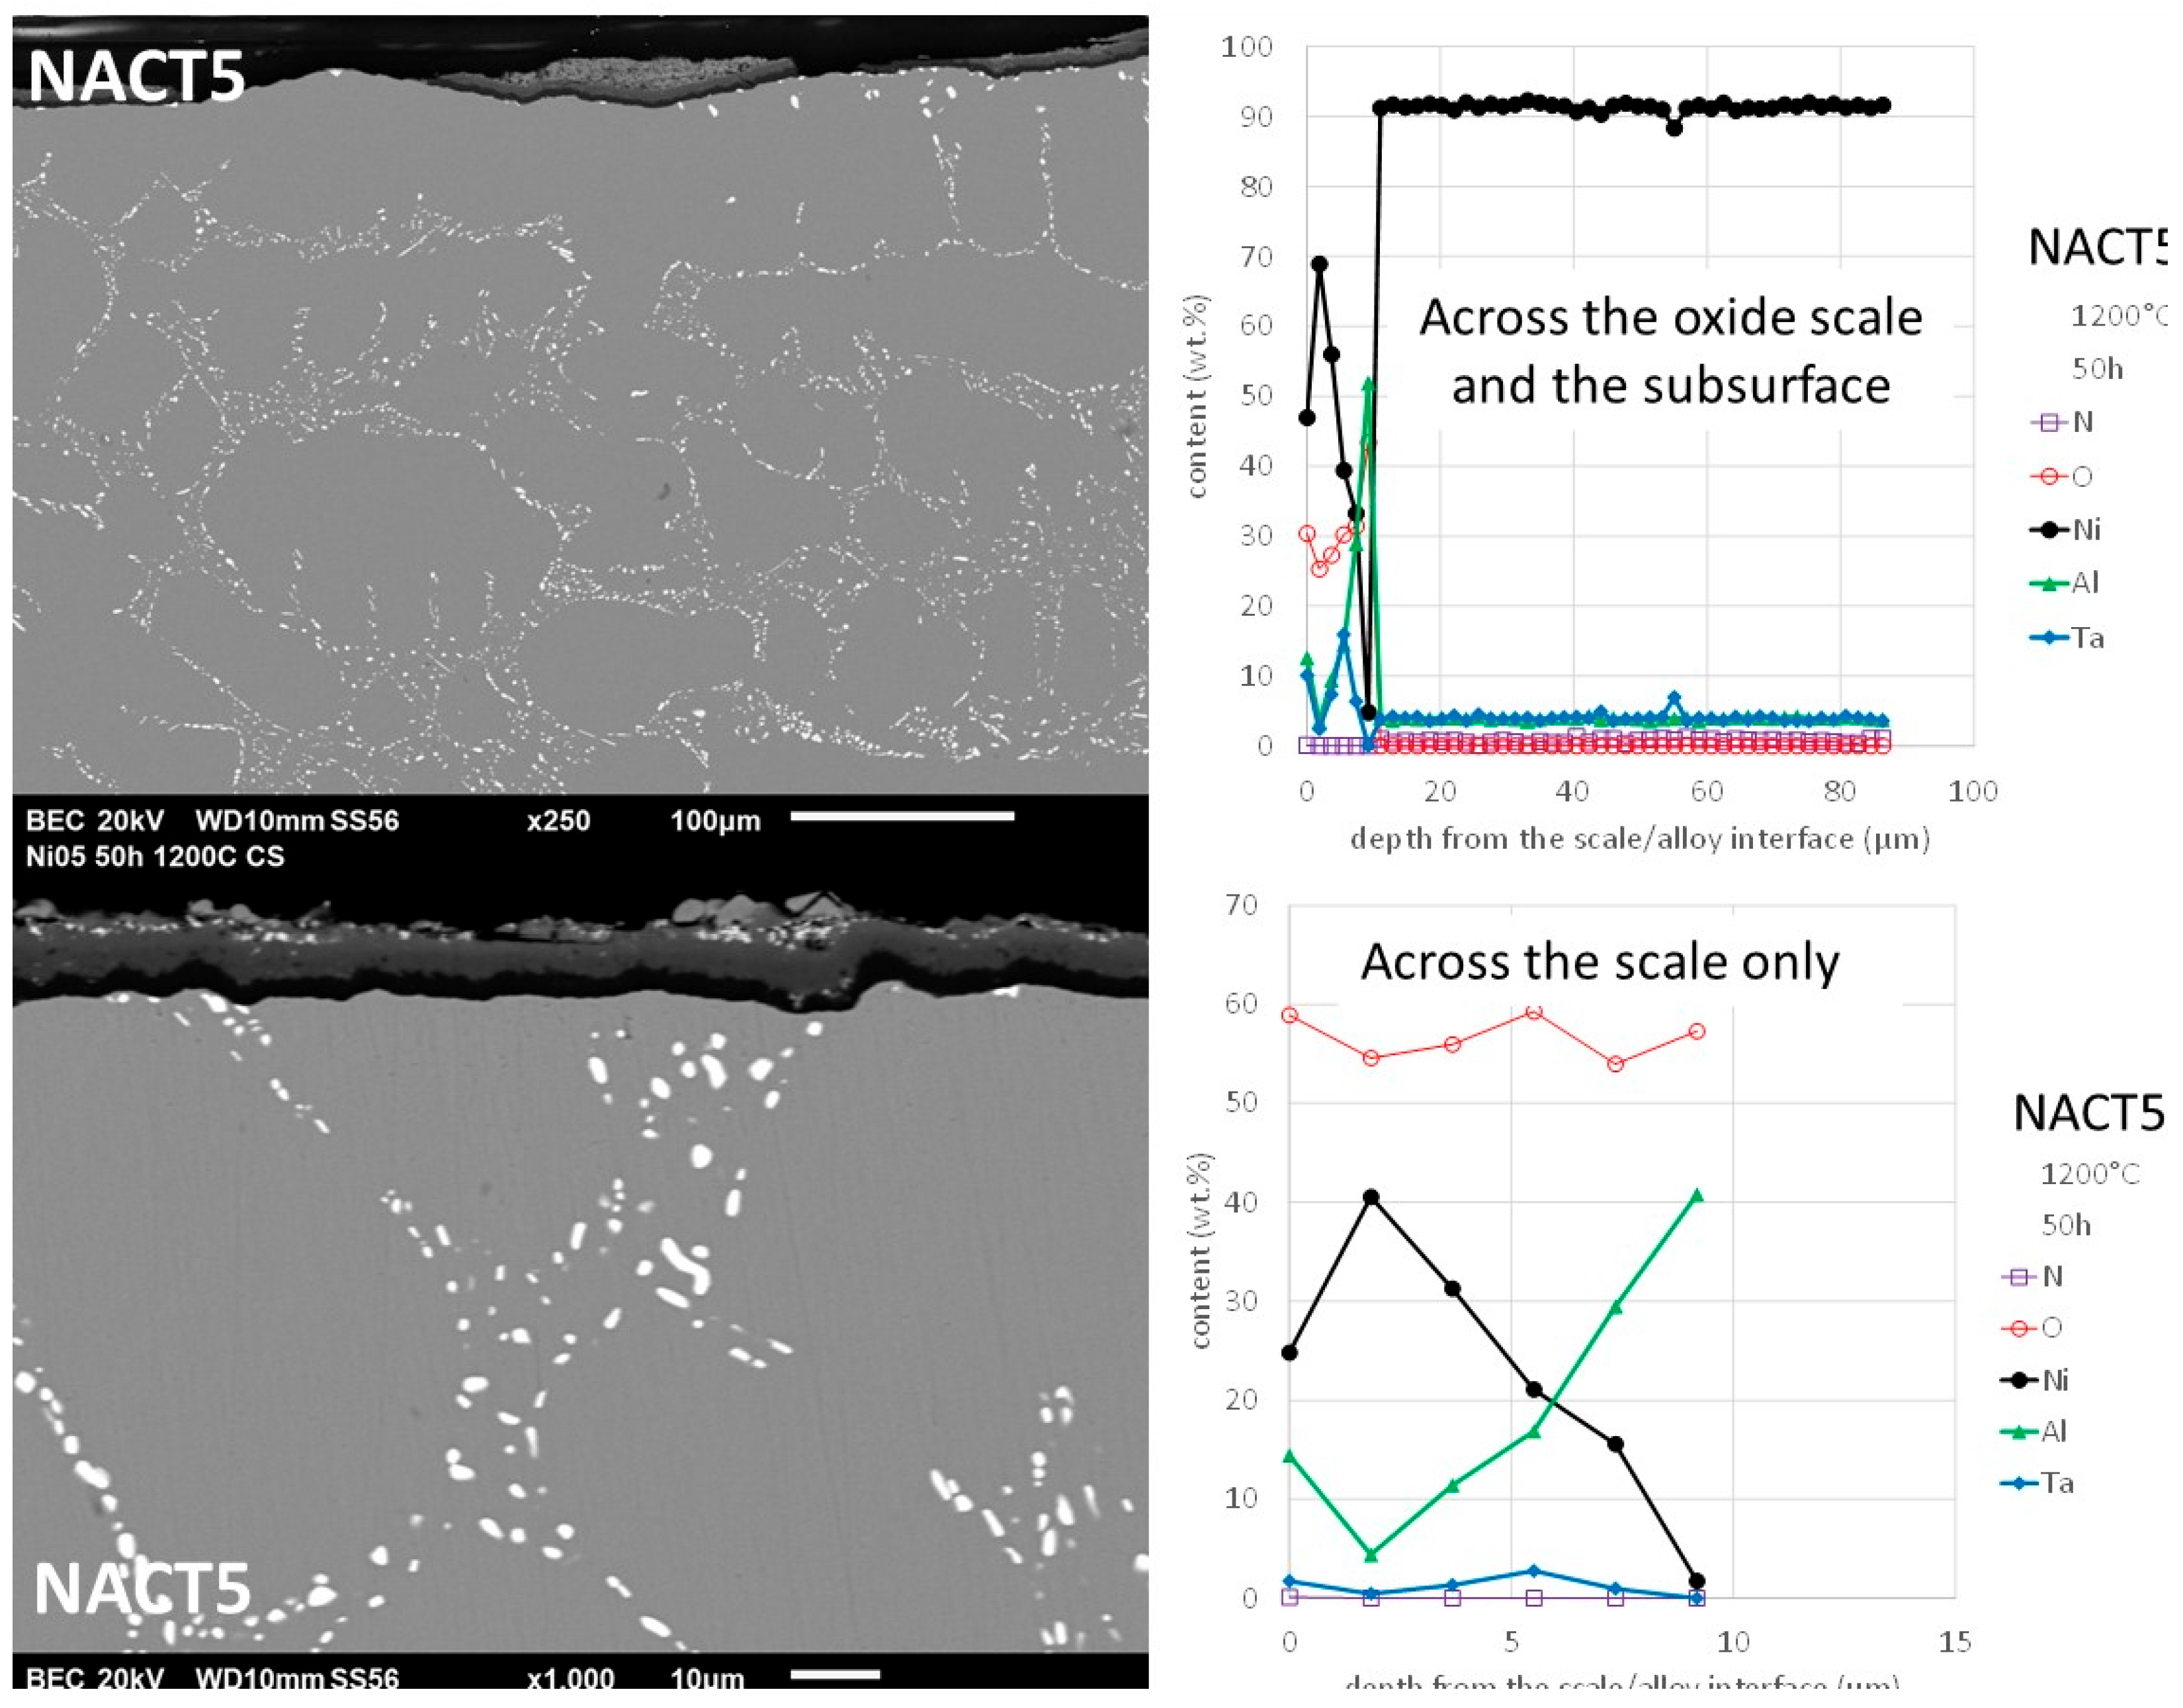
Figure 15.
Elemental EDS cartography on the external oxide scale and the subsurface of the CACT10 alloy.
Figure 15.
Elemental EDS cartography on the external oxide scale and the subsurface of the CACT10 alloy.

Figure 16.
Oxidized CACT10 alloy: SEM/BSE micrographs and EDS concentration profiles across the oxide scale and the subsurface (top right) and across the oxide scale only.
Figure 16.
Oxidized CACT10 alloy: SEM/BSE micrographs and EDS concentration profiles across the oxide scale and the subsurface (top right) and across the oxide scale only.


Table 1.
Chemical compositions of the three alloys in their as–cast states (wt.%, SEM/EDS; five ×250 full frame analyses).
Table 1.
Chemical compositions of the three alloys in their as–cast states (wt.%, SEM/EDS; five ×250 full frame analyses).
| Wt.% | Ni or Co | Al | Ta | C |
| NCAT5 | Ni(bal.) | 4.6 ±0.2 | 7.5 ±0.6 | Not measurable |
| CACT5 | Co(bal.) | 4.1 ±0.1 | 7.9 ±0.2 | Not measurable |
| CACT10 | Co(bal.) | 8.8 ±0.2 | 5.3 ±0.5 | Not measurable |
Table 2.
Values of the parabolic constants.
| Alloy | Kp (×10-12 g2 cm-4 s-1) |
| NACT5 | ≅ 42 |
| CACT5 | ≅ 46,000 |
| CACT10 | ≅ 39 |
Disclaimer/Publisher’s Note: The statements, opinions and data contained in all publications are solely those of the individual author(s) and contributor(s) and not of MDPI and/or the editor(s). MDPI and/or the editor(s) disclaim responsibility for any injury to people or property resulting from any ideas, methods, instructions or products referred to in the content. |
© 2025 by the authors. Licensee MDPI, Basel, Switzerland. This article is an open access article distributed under the terms and conditions of the Creative Commons Attribution (CC BY) license (http://creativecommons.org/licenses/by/4.0/).
Copyright: This open access article is published under a Creative Commons CC BY 4.0 license, which permit the free download, distribution, and reuse, provided that the author and preprint are cited in any reuse.


