
Submitted:
23 December 2025
Posted:
24 December 2025
You are already at the latest version
Abstract
Background/Objectives: Interpretation of chest X-rays (CXRs) requires accurate identification of lesion presence, diagnosis, location, size, and number to be considered complete. However, the effectiveness of large language models with vision capabilities (vLLMs) in performing these tasks remains uncertain. This study aimed to evaluate the image interpretation performance of vLLMs in the absence of clinical information. Methods: A total of 247 CXRs covering 13 diagnoses, such as pulmonary edema, cardiomegaly, lobar pneumonia, and other medical conditions, were evaluated using Gemini 1.0, Gemini 1.5 Pro, GPT-4 Turbo, and GPT-4o. The text outputs generated by the vLLMs were assessed for diagnostic accuracy and identification of key imaging features. Each interpretation was classified as fully correct, partially correct, or incorrect according to the criteria for complete interpretation. Results: When both fully and partially correct responses were considered as successful detections, vLLMs effectively identified large, bilateral, multiple lesions and big devices, such as acute pulmonary edema (53.8%), lobar pneumonia (55%), multiple malignancies (55%), massive pleural effusions (47.5%) and pacemakers (98.3%), showing significant differences in the chi-square test. Feature descriptions varied among models, especially in posteroanterior and anteroposterior views and side markers, though central lines were partially recognized. Gemini 1.5 Pro (49.0%) performed best, followed by Gemini 1.0 (43.8%), GPT-4o (32.0%), and GPT-4Turbo (20.0%). Conclusions: Although vLLMs were able to identify certain diagnoses and key imaging features, their limitations in detecting small lesions, recognizing laterality, reasoning through differential diagnoses, and using domain-specific expressions indicate that CXR interpretation without textual cues still requires further improvement.
Keywords:
chest X‐rays
; GPT
; Gemini
; vision‐capable
; performance
; language model
1. Introduction
Artificial Intelligence (AI), particularly in areas such as deep learning and neural networks, has seen gradual adoption in the healthcare field over the past few years. Notable applications include diagnostic imaging in medicine, the development of models predicting mortality rates for specific diseases and providing health-related information [1,2,3,4]. The success of large language models, such as the generative pretrained transformer (GPT) that emerged in 2022 [5] and Google Gemini, which was deployed in December 2023 [6], has begun to open new fields of application in healthcare.
Various studies have tested the utility of these LLMs in medical writing exams, demonstrating significant improvements in natural language processing. These models have performed at or near the passing threshold for various medical exams without specialized training [7,8]. With the introduction of vision capabilities, there has yet to be an evaluation of these vision-capable LLMs (vLLMs) in interpreting medical images.
Unlike written examinations that yield binary outcomes, a complete medical image interpretation is considered achieved only when the presence of a lesion, its diagnosis, location, size, and number are all accurately identified. Vision-capable AI may detect lesions but still generate errors due to unfamiliarity with clinical reasoning and medical terminology. In the field of CXRs, the ability to interpret images without prior knowledge of a patient’s medical history represents a critical skill for evaluating a radiologist’s true diagnostic competence. This study aimed to compare CXR interpretations across different diagnostic categories using vLLMs, analyze their performance to identify potential limitations, and provide insights for future model development and improvement.
2. Materials and Methods
The entire research workflow is outlined in Figure 1, with the following sections providing detailed explanations of each step in the process. This study complies with the requirements of the Checklist for Artificial Intelligence in Medical Imaging (CLAIM): 2024 Update [9], and the relevant information is provided in the Supplemental Material for reference.
2.1. Image Dataset And LLMs Selection
We selected the National Institutes of Health Chest X-ray Dataset (NIHCXRs) for our study. This dataset comprises 112,120 X-ray images from 30,805 unique patients and is publicly available under the Creative Commons License “CC0: Public Domain.” [10].
2.1.1. Chest X-Rays Selection and Randomization
The CXRs with obvious and typical pathological findings were selected from the NIH CXR dataset by two pulmonologists. Only images for which both pulmonologists reached consensus and demonstrated clear, characteristic features were included. Any images with uncertainty or disagreement were excluded and replaced with the next available case. These were 20 images of acute pulmonary edema, 20 of cardiomegaly, 10 of hiatal hernia, 15 of lobar pneumonia, 15 of pacemaker, 5 of port-a-cath, 10 of peripherally inserted central catheter (PICC), pleural effusion with 15 of minimal, 10 of small, 15 of moderate, and 10 of massive amount, malignancy with 15 of central distributed lesion, 22 of single lesion, and 30 of multiple lesion, 5 of diaphragm elevation, and 30 with no findings, totaling 247 images across 13 categories. To prevent potential identification of filenames and their associated diagnoses through online searches, the selected CXRs were renamed randomly, ranging from 00000000.png to 00000246.png in the final test set. See “Test dataset” in supplemental material.
2.1.2. Selection of Vision-Capable LLMs
We employed four vision-capable LLMs to interpret the CXRs, using the following models and their respective application programming interface (API) versions: Gemini Vision Pro (version 1.0, with model name “gemini-pro-vision”), Gemini 1.5 Pro (model name “gemini-1.5-pro-latest”), GPT-4 Turbo (model name “gpt-4-turbo”), and GPT-4o (model name “gpt-4o”). Their version dates were as follows: Gemini 1.5 Pro and GPT-4o dated 2024-06-10, Gemini Vision Pro dated 2024-06-12, and GPT-4 Turbo dated 2024-06-11.
2.2. How to Describe the Lesions in CXR
2.2.1. Criteria for a Complete Lesion Description
In clinical practice, when interpreting a lesion on a CXR, several aspects must be evaluated to achieve a complete lesion description. The first step is to determine whether a lesion is visible. The interpreter must then accurately describe its location on the right or left side, the number of lesions, and their size. Finally, the diagnosis of the lesion, or an appropriate differential diagnosis, should be provided. Only when all these aspects are correctly identified can the interpretation be considered a complete assessment of the CXR lesion.
If any of these elements are incorrect, the interpretation should not be regarded as fully correct. For example, if the ground truth indicates right lobar pneumonia but the model outputs pneumonia in left lobe, it cannot be considered correct. However, in vision-capable AI, such an error may suggest that the model detected the lesion but misclassified its laterality due to training limitations. Therefore, classifying each response as fully correct, partially correct, or incorrect provides a more appropriate framework for evaluating the performance of vLLMs.
2.2.2. Definitions of Fully Correct, Partially Correct, and Incorrect Answers
The definition of a fully correct answer included three scenarios: a definite diagnosis with the correct site, inclusion of the correct diagnosis in the differential diagnosis with the correct site, and descriptions indicating normal findings without mentioning any abnormalities. Partial correctness included mentioning the lesion with the correct diagnosis but the wrong site, or the correct site but the wrong diagnosis. Other cases included detection of the lesion without providing definite or differential diagnosis, mentioning the lesion with the wrong site or wrong diagnosis, or the correct diagnosis and site but incorrect magnitude. Incorrect answers indicated that the vLLMs failed to detect the lesions, as they did not mention the corresponding findings in their responses, with the primary diagnosis used as the reference standard.
For the evaluation criteria, any response that mentioned the presence of a lesion was considered partially correct, even if multiple descriptive errors were present. For example, a case described as “a port-a-cath at left upper lung” but output by the model as “a pacemaker at right lung” was classified as partially correct because the model identified the presence of a device, despite containing two descriptive errors. See Figure 3 and Figure 7.
2.2.3. Primary Diagnosis and Key Imaging Features Scoring
The evaluation focused on two main aspects: the accuracy of the primary diagnosis and the extraction of pertinent imaging features from the generated description text.
For the primary diagnosis, since a reference standard was available, the scoring assessed whether each vLLM provided the correct main diagnosis for a given CXR. For cases with a confirmed primary diagnosis, the evaluation followed the criteria for a complete lesion description, which included the presence of a lesion, its laterality, size, and the accuracy of the definite or differential diagnosis. Each case was therefore classified as fully correct, partially correct, or incorrect.
In contrast, the evaluation of imaging feature scores did not rely on a fixed reference standard. Instead, the assessment was based on the descriptive text generated by each model, which included mentions of other lesions, devices, letters, or imaging findings visible on the CXR. Because the imaging features identified by different models were not entirely consistent, the most frequently reported elements were defined as the key imaging features for statistical analysis in this study. These included the posterior-anterior or anterior-posterior (PA/AP) view, left/right side markers, other letters or numbers appearing in the image, foreign bodies, identification of the patient as adult or child and as male or female, surgical clips or implants, monitoring wires or leads, and intravenous lines, ports, or devices. Each description was rated as correct or partially correct, and the total number of correctly identified features was summed for subsequent analysis.
2.3. Scoring the vLLMs
The prompt used uniformly across all models was “Please describe the image.”. The text outputs generated by the vLLMs were saved as text files and subsequently analyzed by two pulmonologists. The first pulmonologist reviewed the vLLM-generated texts and based on professional expertise in CXR interpretation, compared each output with the corresponding image. The second pulmonologist served as a verifier. Because the selected CXRs, the criteria for complete lesion description, and the key imaging features were all clearly defined and unambiguous, both pulmonologists ultimately reached full consensus. Therefore, inter-rater agreement analysis was not applied.
2.4. Statistical Analysis and Software
2.4.1. Statistical Analysis
The analysis was divided into two performance levels: fully correct and fully correct plus partially correct. The latter was defined as cases in which the model successfully detected the lesion but failed to meet all diagnostic criteria. This outcome may occur because vLLMs can identify visual abnormalities but still generate inaccurate descriptions due to limited familiarity with clinical reasoning and medical terminology. The chi-square test was applied to infer the statistical significance of performance differences. Analyses were conducted into the overall performance combining all four vLLMs. To facilitate interpretation, the 13 primary diagnostic categories were grouped according to their radiographic characteristics as follows:
Large-sized lesions included acute pulmonary edema, lobar pneumonia, and cardiomegaly. Acute pulmonary edema affects both lung fields, whereas lobar pneumonia involves a localized lesion within a single lung field. Cardiomegaly is located within the mediastinum and partially obscures the medial portions of both lower lung fields. These categories were used to evaluate the model’s ability to detect lesions of varying sizes. Lesion number consisted of malignancies with a single lesion versus multiple lesions, allowing assessment of the model’s sensitivity to the number of lesions present in an image. Mediastinal lesions included malignancy with a central distribution and hiatal hernia. These conditions were used to evaluate the model’s ability to detect findings within or adjacent to the mediastinum. Devices included pacemaker, port-a-cath, and PICC. These devices have distinct radiographic appearances and strong image contrast. The pacemaker is generally larger than the port-a-cath, and both exhibit line-like structures on chest radiographs, whereas the PICC primarily represents a linear structure alone. Pleural effusion and diaphragm elevation were analyzed to assess the model’s detection capability for pleural effusion. Diaphragm elevation exhibits radiographic features like those between small and moderate pleural effusion, although they are pathophysiologically distinct conditions.
Finally, a model performance comparison was conducted using the primary diagnosis scores of the four vLLMs. A chi-square test was applied to evaluate and compare the diagnostic performance among these models.
2.4.2. Software
The analyses were performed using Python 3.8 with the statistical functions provided in the SciPy 1.10.1 package. All graphical outputs were generated using Matplotlib version 3.7.5.
3. Results
3.1. Results for Primary Diagnosis
3.1.1. Scores of Four LLMs in Primary Diagnosis
In primary diagnosis, the four LLMs fully correctly identified 54, 55, 39, and 56 cases in the order of Gemini 1.0, Gemini 1.5 Pro, GPT-4 Turbo, and GPT-4o respectively. Partial correctness was observed in 63, 71, 25, and 44 cases. See Figure 2
3.1.2. Analysis of Partial Correctness in Primary Diagnosis
In the primary diagnosis analysis, some partially correct responses contained left-right location errors: Gemini 1.0 Pro had 27 such cases, Gemini 1.5 Pro had 30, GPT-4 Turbo had 4, and GPT-4o had 21. There were 2, 2, 4, and 8 cases, respectively, in which a lesion was mentioned but its specific location was not indicated. The numbers of incorrect diagnoses were 4, 13, 0, and 1. There were 25, 21, 12, and 12 cases in which a lesion was mentioned without providing a definitive or differential diagnosis. Additionally, there were 13, 15, 5, and 8 cases in which both a lesion and a differential diagnosis were mentioned, but the differential diagnosis did not correctly identify the primary diagnosis (Figure 3).
For the evaluation criteria, any response that mentioned the presence of a lesion was considered partially correct, even if multiple descriptive errors were present. Therefore, the cumulative count of such cases may exceed the total partial correctness scores as shown in Figure 2.
3.1.3. Scores Across Thirteen Categories
Scores of full correctness were as follows: acute pulmonary edema (7, 6, 0, 6, in the order of Gemini 1.0, Gemini 1.5 Pro, GPT-4 Turbo, and GPT-4o respectively), cardiomegaly (1, 3, 1, 0), lobar pneumonia (1, 3, 0, 1), pacemakers (10, 8, 13, 6), Port-A-cath (0, 0, 0, 2), pleural effusion (3, 6, 0, 4), malignancy with single lesion(0,0,0,1) , malignancy with multiple lesions (4, 0, 1, 5), diaphragm elevation(0,0,0,1), and normal chest images (28, 29, 24, 30). No correct identifications were made for hiatal hernia, PICC, or malignancy with central distribution.
Partial accuracy was as follows: acute pulmonary edema (7, 11, 3, 3), cardiomegaly (4, 4, 1, 0), lobar pneumonia (9, 10, 2, 7), pacemakers (4, 7, 2, 9), Port-A-cath (4, 5, 5, 3), pleural effusion (12, 9, 3, 11), malignancy with central distribution (0,2,0,0), malignancy with single lesion(4,2,1,1) , malignancy with multiple lesions (18, 20, 8, 10), and diaphragm elevation(1,1,0,0). No partial accuracy was observed for hiatal hernia, PICC, or normal chest images. The ratios of scores for each category are depicted in Figure 4.
3.1.4. Analysis for Pleural Effusion
In the pleural effusion category, Gemini 1.0 correctly described 1 case of minimal effusion, 0 cases of small effusion, 1 case of moderate effusion, and 1 case of massive effusion. For Gemini 1.5 Pro, the corresponding numbers of correctly described cases were 1, 2, 0, and 3, respectively. GPT-4 Turbo was incorrect in all cases, whereas GPT-4o correctly described 0, 0, 1, and 3 cases in the same order. Partial correctness was observed in 1, 3, 5, and 3 cases for minimal, small, moderate, and massive effusions, respectively, in Gemini 1.0. For Gemini 1.5 Pro, the corresponding numbers were 0, 2, 6, and 1. GPT-4 Turbo had 0, 0, 1, and 2 partially correct cases, while GPT-4o had 0, 1, 4, and 6, respectively. Please refer to Figure 5.
3.2. Results for Key Imaging Features
3.2.1. Scores for Key Imaging Features
In the key imaging feature description, Gemini 1.0 fully correctly described 140 features, Gemini 1.5 Pro described 159, GPT-4 Turbo described 117, and GPT-4o described 152. Partial correctness was observed in 36, 48, 49, and 67 cases, respectively. Specific feature identification varied across several attributes, including the posterior-anterior/anterior-posterior (PA/AP) view (94, 101, 28, and 43), side markers (9, 7, 56, and 68), additional letters (0, 1, 11, and 13), external monitoring wires and leads (10, 10, 7, and 16), surgical implants (4, 5, 2, and 6), surgical clips (3, 4, 3, and 2), central lines, ports, or devices (4, 1, 1, and 1), and identification of female and adult subjects (12, 28, 6, and 1). See Figure 6.
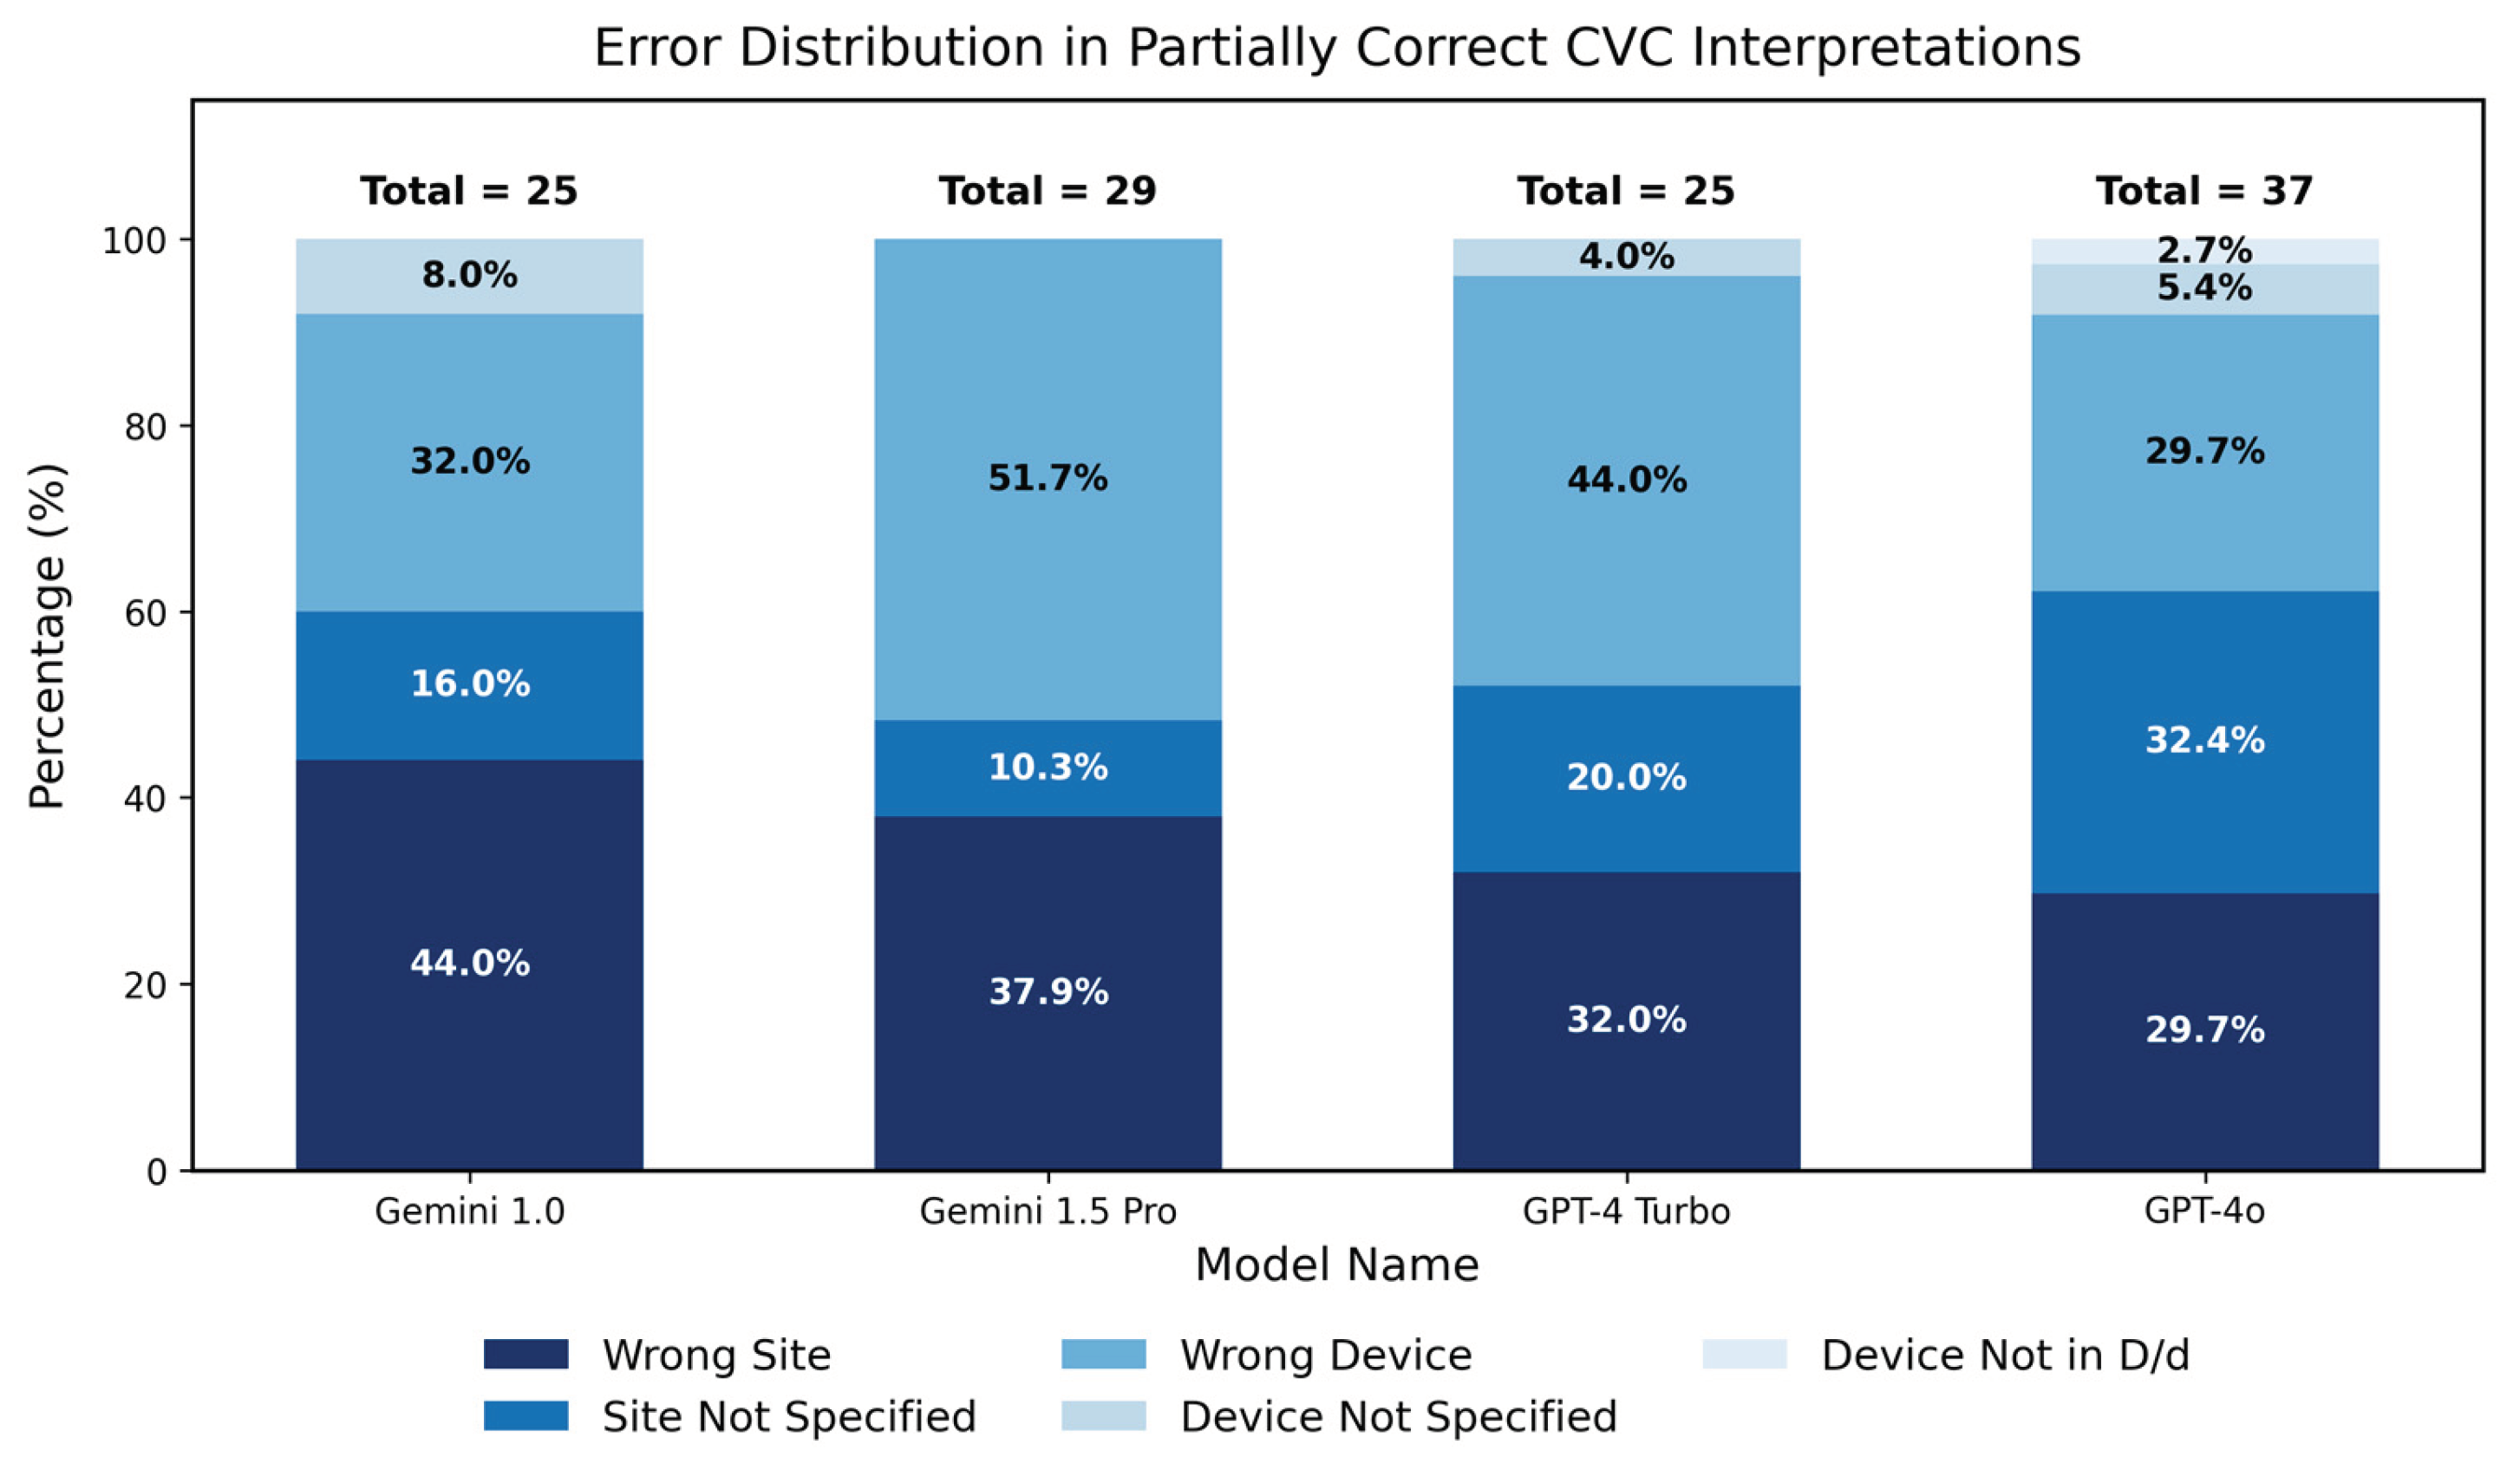
3.2.2. Analysis of Partial Correctness in Central Venous Catheter Diagnosis
In the analysis of key imaging features, we found that all models achieved high detection scores for central venous catheters (CVCs), although these were often only partially correct. Therefore, we conducted a focused analysis of these findings. Left–right location errors were observed in 11 cases each for Gemini 1.0 and Gemini 1.5 Pro, 8 for GPT-4 Turbo, and 11 for GPT-4o. Specific device locations were not indicated in 4, 3, 5, and 12 cases, respectively. Incorrect device names were given in 8, 15, 11, and 11 cases, while 2, 0, 1, and 2 instances involved descriptions mentioning only the device without its name. Additionally, a differential diagnosis failed to identify the correct device name in 0, 0, 0, and 1 case, respectively. See Figure 7. Consistent with the approach used in Figure 2, the cumulative count may be greater than the total number of partially correct cases because a single partially correct lesion can involve more than one descriptive error.
3.3. Statistical Analysis
3.3.1. Statistical Analysis for Five Major Groups
A total of five major groups were analyzed to evaluate the diagnostic performance of all vLLMs. Each group represented clinically distinct imaging characteristics designed to assess lesion size, lesion number, mediastinal involvement, device recognition, and pleural findings.
In the large-sized lesion group, which included acute pulmonary edema, lobar pneumonia, and cardiomegaly, a statistically significant difference was observed among the three conditions for fully correct responses (χ2 = 12.40, p = 0.0020). The fully correct rates were acute pulmonary edema (23.8%), lobar pneumonia (8.3%), and cardiomegaly (6.2%). When both fully and partially correct responses were treated as successful detections, the difference remained significant (χ2 = 28.52, p < 0.0001). The detection rates followed a similar pattern, with lobar pneumonia (55.0%), acute pulmonary edema (53.8%), and cardiomegaly (17.5%).
In the lesion number group, which compared malignancy with a single lesion and malignancy with multiple lesions, a significant difference was found in fully correct responses (χ2 = 3.91, p = 0.0480), with the multiple-lesion group (8.3%) outperforming the single-lesion group (1.1%). When both fully and partially correct responses were considered, the difference became highly significant (χ2 = 42.22, p < 0.0001). The detection rates were multiple (55.0%) and single (10.2%), indicating greater sensitivity of vLLMs for multiple lesions compared with solitary findings.
In the mediastinal lesion group, including malignancy with central distribution and hiatal hernia, all four vLLMs demonstrated complete failure of recognition. None of the models produced any fully correct responses, and all yielded zero detections for hiatal hernia. Only two partially correct responses were generated by Gemini 1.5 Pro in the malignancy-with-central-distribution category. Because all observed counts were zero or near zero, no valid chi-square test could be performed.
In the device group, comprising pacemaker, port-a-cath, and PICC, statistically significant differences were observed among the three device types when only fully correct responses were analyzed (χ2 = 47.14, p < 0.0001). The fully correct rates were pacemaker (61.7%), port-a-cath (10.0%), and PICC (0.0%). When fully and partially correct responses were combined, the difference remained highly significant (χ2 = 111.50, p < 0.0001). The detection rates were pacemaker (98.3%), port-a-cath (95.0%), and PICC (0.0%), indicating that vLLMs exhibited superior recognition performance for large, high-contrast implanted devices.
In the pleural effusion group, which included minimal, small, moderate, and massive pleural effusion as well as diaphragm elevation, significant differences were found across the five subcategories. For fully correct responses, the chi-square test showed significance (χ2 = 10.36, p = 0.0348). The fully correct rates were massive (17.5%), small (5.0%), diaphragm elevation (5.0%), minimal (3.3%), and moderate (3.3%). When fully and partially correct detections were combined, the difference became more pronounced (χ2 = 26.97, p < 0.0001). The detection rates were massive (47.5%), moderate (30.0%), small (20.0%), diaphragm elevation (15.0%), and minimal (5.0%), demonstrating that larger effusion volumes were more reliably identified by the models, whereas smaller effusions and diaphragm elevation were often underrecognized
3.3.2. Model Performance Comparison
A chi-square test of independence revealed a statistically significant difference in the distribution of responses among the four vLLMs (χ2 = 27.84, p = 0.0001). The highest rate of fully correct responses was achieved by Gemini 1.5 Pro (21.3%), followed by Gemini 1.0 (20.2%), GPT-4o (18.0%), and GPT-4Turbo (12.3%). When both fully and partially correct responses were considered as successful detections, the ranking remained consistent, with Gemini 1.5 Pro (49.0%) performing the best, followed by Gemini 1.0 (43.8%), GPT-4o (32.0%), and GPT-4Turbo (20.0%). These results demonstrate that the Gemini models exhibited superior diagnostic accuracy and consistency compared with the GPT-based models.
4. Discussion
Currently, there are several customized AI systems available to assist with medical image interpretation, such as CE-marked AI-based software [11], and for certain clinical conditions, like heart failure, endotracheal tube positioning, and COVID-19 [12,13,14], which achieve specific results. In our study, we used publicly available LLMs with visual capabilities, Gemini 1.0, Gemini 1.5 pro, GPT-4 turbo and GPT-4o. The four vision-capable models can tell chest X-rays without any prompt to be reminded that this is a CXR.
In comparison of primary scores among LLMs, we observed that the models exhibited relatively better detection capabilities for bilateral lesions such as acute pulmonary edema, malignancy with bilateral distribution, and lobar pneumonia. Pacemaker and port-a-cath detection rates were the highest, likely due to the distinctiveness of these devices. Conversely, the detection rate for PICC lines was not as high, possibly due to their relative thin and small scale. The models also struggled significantly with detecting lesions in mediastinum. They exhibited almost no detection capability for hiatal hernia and malignancy with central distribution.
We classified pleural effusion into four categories: minimal pleural effusion, which indicates costophrenic angle blunting [15]; small amount, which indicates the disappearance of the unilateral diaphragm; moderate pleural effusion, which indicates a lesion covering more than half of the lung field; and massive pleural effusion, which indicates that the entire lung field appears white [16]. Both minimal and small amounts show poor detection rates. A similar analogy applies to diaphragm elevation [17], indicating that future advancements in medical vision capability will require further algorithmic improvements to detect these conditions.
For the “no finding” category, most scores were achieved by describing anatomical structures as normal. However, cases where the models directly interpreted the image as normal were relatively few. In this aspect, the Gemini models demonstrated significant confidence in diagnosing normal CXRs. It is important to note that while publicly available LLMs provide similar interpretations, they also have the potential to spread misinformation and exacerbate the misuse of AI in medical imaging due to a lack of accountability [18]. This highlights the need for medical professionals to be involved in making accurate diagnoses [19].
In imaging feature interpretation, the Gemini models showed a notable advantage in imaging feature description tasks, particularly in distinguishing between PA/AP views, detecting CVCs, and identifying female breast shadows. On the other hand, GPT models emphasized the detection of side markers and other letters to annotate the image and demonstrated competency in detecting CVCs. These differences may be attributed to the distinct algorithms employed by the respective companies. Both models demonstrated higher detection rates for pacemakers.
We introduced the concept of partial correctness because we found that some lesions could be detected by LLMs. However, they might be given the wrong diagnoses, described as being on the wrong side, or included in a list of differential diagnoses that does not contain the correct answer. Despite some views suggesting this represents artificial hallucinations [20,21], we believe that with further training or the addition of more differential diagnoses, there is potential for improvement [22].
A recurring issue for these models is side confusion. In clinical practice, the terminology is based on the patient’s left and right sides, meaning the right side of the image corresponds to the patient’s left side, and vice versa. Despite this being a well-established clinical consensus, vision-capable models frequently confuse the left and right sides. Addressing this issue could significantly improve the models’ accuracy and overall pass rates [23].
In interpreting a CXR, providing a list of potential differential diagnoses can significantly enhance clinical assessment [24], particularly in the absence of corroborating clinical data. For this study, we adopted a scoring approach where the LLM was awarded points if its proposed differential diagnosis included the correct diagnosis. Our analysis reveals that offering a more comprehensive list of differential diagnoses could substantially improve the clinical utility of these models, effectively supporting clinicians’ diagnostic reasoning. This approach allows for a broader consideration of potential conditions, which is especially valuable in complex or ambiguous cases, and increases the usability of AI-assisted LLM by radiologists [25].
Limitations
The field of CXR diagnosis is remarkably broad. This study focused exclusively on prominent findings, deliberately excluding abnormalities of the skeletal system such as rib fractures and spinal disorders, as well as subdiaphragmatic conditions and severe thoracic emergencies like pneumothorax and pneumomediastinum. Interstitial lung diseases were also omitted from the investigation. Furthermore, no clinical history was provided for each CXR. While this approach minimized the potential bias of interpretations influenced by clinical information, it also limited the evaluation of diagnostic accuracy when such data are available [26]. Although previous studies have suggested that extracting specific regions from whole CXRs can improve diagnostic accuracy [27], the present study used entire CXRs as inputs without any image preprocessing. Lastly, as this study was based on a single dataset (NIHCXR), the findings may not be generalized to other clinical environments or customized imaging systems. These excluded aspects represent important areas for future research.
5. Conclusions
For these publicly accessible LLMs, despite their increasing use in medical applications, the ability to independently and accurately interpret a single CXR still faces some limitations and may require further development. As a tool to assist in clinical image interpretation, addressing issues like side confusion and providing sufficient differential diagnoses during training are crucial. These models can be fine-tuned to enhance diagnostic capabilities and reduce errors, thereby improving their utility in clinical settings.
Supplementary Materials
The following supporting information can be downloaded at the website of this paper posted on Preprints.org.
Author Contributions
All authors contributed to the study’s conception and design. Material preparation, data collection, and analysis were performed by Chih-Hsiung Chen. Medical image analysis was conducted by Chih-Hsiung Chen, Chang-Wei Chen, and Kuo-En Huang. The idea and resource support were provided by Kuang-Yu Hsieh and Hsien-Yung Lai. The first draft of the manuscript was written by Chih-Hsiung Chen and later revised by Hsien-Yung Lai. All authors provided feedback on previous versions of the manuscript, all authors read and approved the final manuscript. All authors have read and agreed to the published version of the manuscript.
Funding
This research received no external funding.
Institutional Review Board Statement
The study was conducted in accordance with the Declaration of Helsinki, and approved by the Institutional Review Board of Mennonite Christian Hospital. (protocol code 25-04-013 and date of approval on 2025-05-12).
Informed Consent Statement
Not applicable.
Data Availability Statement
This study utilized the National Institutes of Health Chest X-ray Dataset (NIH CXR dataset), available for public use under the Creative Commons License ‘CC0: Public Domain.’ This open-access dataset allows scientists unrestricted use for research purposes. In accordance with the requirements, The NIH Clinical Center provided the dataset, accessible at: https://nihcc.app.box.com/v/ChestXray-NIHCC, with the following citation: Wang, X. et al. ChestX-ray8: Hospital-scale Chest X-ray Database and Benchmarks on Weakly-Supervised Classification and Localization of Common Thorax Diseases. IEEE CVPR, 3462-3471. http://openaccess.thecvf.com/content_cvpr_2017/papers/Wang_ChestX-ray8_Hospital-Scale_Chest_CVPR_2017_paper.pdf (2017).
Acknowledgments
During the preparation of this manuscript/study, the author(s) used Python 3.8 with the statistical functions provided in the SciPy 1.10.1 package. All graphical outputs were generated using Matplotlib version 3.7.5. The authors have reviewed and edited the output and take full responsibility for the content of this publication.
Abbreviations
The following abbreviations are used in this manuscript:
| CXRs | Chest X-rays |
| vLLMs | Large language models with vision capabilities |
| GPT | Generative pretrained transformer |
| NIHCXRs | National Institutes of Health Chest X-ray Dataset |
| PICC | Peripherally inserted central catheter |
| API | Application programming interface |
| PA/AP | Posterior-anterior or anterior-posterior view |
| CVC | Central venous catheters |
References
- Panahi, A.; Askari, M.R.; Tarvirdizadeh, B.; Madani, K. Simplified U-Net as a deep learning intelligent medical assistive tool in glaucoma detection. Evol. Intel. 2024, 17, 1023–1034. [Google Scholar] [CrossRef]
- Mohan, G.; Subashini, M.M.; Balan, S.; Singh, S. A multiclass deep learning algorithm for healthy lung, Covid-19 and pneumonia disease detection from chest X-ray images. Discov. Artif. Intell. 2024, 4. [Google Scholar] [CrossRef]
- Oliveira, M.; Seringa, J.; Pinto, F.J.; Henriques, R.; Magalhaes, T. Machine learning prediction of mortality in Acute Myocardial Infarction. BMC Med. Inform. Decis. Mak. 2023, 23. [Google Scholar] [CrossRef]
- Kaarre, J.; Feldt, R.; Keeling, L.E.; Dadoo, S.; Zsidai, B.; Hughes, J.D.; et al. Exploring the potential of ChatGPT as a supplementary tool for providing orthopaedic information. Knee Surg. Sports Traumatol. Arthrosc. 2023, 31, 5190–5198. [Google Scholar] [CrossRef]
- Open, AI; Achiam, J.; Adler, S.; Agarwal, S.; Ahmad, L.; Akkaya, I.; Aleman, F.L.; et al. GPT-4 Technical Report. 15 March 2023. Available online: http://arxiv.org/abs/2303.08774.
- Anil, R.; Borgeaud, S.; Alayrac, J.B.; Yu, J.; Soricut, R.; Schalkwyk, J.; et al.; Gemini Team Google Gemini: A Family of Highly Capable Multimodal Models. [CrossRef]
- Abbas, A.; Rehman, M.S.; Rehman, S.S. Comparing the Performance of Popular Large Language Models on the National Board of Medical Examiners Sample Questions. Cureus 2024, 16, e55991. [Google Scholar] [CrossRef] [PubMed]
- Chen, C.; Hsieh, K.; Huang, K.; Lai, H.Y. Comparing Vision-Capable Models, GPT-4 and Gemini, With GPT-3.5 on Taiwan’s Pulmonologist Exam. Cureus 2024, 16, e67641. [Google Scholar] [CrossRef] [PubMed]
- National Institutes of Health Clinical Center. Ronald, M. S. 10 Center Drive, Bethesda, MD 20892, September 2017. Available online: https://nihcc.app.box.com/v/ChestXray-NIHCC.
- Fanni, S.C.; Marcucci, A.; Volpi, F.; Valentino, S.; Neri, E.; Romei, C. Artificial Intelligence-Based Software with CE Mark for Chest X-ray Interpretation: Opportunities and Challenges Review. Diagnostics (Basel) 2023, 13, 2020. [Google Scholar] [CrossRef]
- Celik, A.; Surmeli, A.O.; Demir, M.; Esen, K.; Camsari, A. The diagnostic value of chest X-ray scanning by the help of Artificial Intelligence in Heart Failure (ART-IN-HF). Clin. Cardiol. 2023, 46, 1562–1568. [Google Scholar] [CrossRef]
- Wong, K.P.; Homer, S.Y.; Wei, S.H.; Yaghmai, N.; Estrada Paz, O.A.; Young, T.J.; et al. Integration and evaluation of chest X-ray artificial intelligence in clinical practice. J. Med. Imaging (Bellingham) 2023, 10, 051805. [Google Scholar] [CrossRef]
- Kufel, J.; Bargieł, K.; Koźlik, M.; Czogalik, L.; Dudek, P.; Jaworski, A.; et al. Application of artificial intelligence in diagnosing COVID-19 disease symptoms on chest X-rays: A systematic review. Int. J. Med. Sci. 2022, 19, 1743–1752. [Google Scholar] [CrossRef]
- Woodring, J.H. Recognition of pleural effusion on supine radiographs: how much fluid is required? AJR Am. J. Roentgenol. 1984, 142, 59–64. [Google Scholar] [CrossRef]
- McGrath, E.E.; Anderson, P.B. Diagnosis of pleural effusion: a systematic approach. Am. J. Crit. Care 2011, 20, 119–27. quiz 128. [Google Scholar] [CrossRef]
- Rothstein, E.; Landis, F.B. Intrapulmonary pleural effusion simulating elevation of the diaphragm. Am. J. Med. 1950, 8, 46–52, illust. [Google Scholar] [CrossRef] [PubMed]
- Clusmann, J.; Kolbinger, F.R.; Muti, H.S.; Carrero, Z.I.; Eckardt, J.N.; Laleh, N.G.; et al. The future landscape of large language models in medicine. Commun. Med. 2023, 3, 141. [Google Scholar] [CrossRef] [PubMed]
- Iniesta, R. The human role to guarantee an ethical AI in healthcare: a five-facts approach. In AI Ethics; 2023. [Google Scholar] [CrossRef]
- Kumar, M.; Mani, U.A.; Tripathi, P.; Saalim, M.; Roy, S. Artificial Hallucinations by Google Bard: Think Before You Leap. Cureus 2023, 15, e43313. [Google Scholar] [CrossRef]
- Nakaura, T.; Ito, R.; Ueda, D.; Nozaki, T.; Fushimi, Y.; Matsui, Y.; et al. The impact of large language models on radiology: a guide for radiologists on the latest innovations in AI. Jpn. J. Radiol. 2024, 42, 685–696. [Google Scholar] [CrossRef]
- Rau, S.; Rau, A.; Nattenmüller, J.; Fink, A.; Bamberg, F.; Reisert, M.; et al. A retrieval-augmented chatbot based on GPT-4 provides appropriate differential diagnosis in gastrointestinal radiology: a proof of concept study. Eur. Radiol. Exp. 2024, 8, 60. [Google Scholar] [CrossRef] [PubMed]
- Gilbert, S.; Kather, J.N.; Hogan, A. Augmented non-hallucinating large language models as medical information curators. NPJ Digit. Med. 2024, 7, 100. [Google Scholar] [CrossRef]
- Hasani, A.M.; Singh, S.; Zahergivar, A.; Ryan, B.; Nethala, D.; Bravomontenegro, G.; et al. Evaluating the performance of Generative Pre-trained Transformer-4 (GPT-4) in standardizing radiology reports. Eur. Radiol. 2024, 34, 3566–3574. [Google Scholar] [CrossRef] [PubMed]
- Cheung, J.L.S.; Ali, A.; Abdalla, M.; Fine, B. U”AI” Testing: User Interface and Usability Testing of a Chest X-ray AI Tool in a Simulated Real-World Workflow. Can. Assoc. Radiol. J. 2023, 74, 314–325. [Google Scholar] [CrossRef] [PubMed]
- Horiuchi, D.; Tatekawa, H.; Oura, T.; Shimono, T.; Walston, S.L.; Takita, H.; et al. ChatGPT’s diagnostic performance based on textual vs. visual information compared to radiologists’ diagnostic performance in musculoskeletal radiology. Eur. Radiol. 2025, 35, 506–516. [Google Scholar] [CrossRef] [PubMed]
- Chen, C.H.; Hsu, S.H.; Hsieh, K.Y.; Lai, H.Y. The two-stage detection-after-segmentation model improves the accuracy of identifying subdiaphragmatic lesions. Sci. Rep. 2024, 14, 25414. [Google Scholar] [CrossRef] [PubMed]
Figure 1.
Flowchart of the Study. Abbreviations: CXR: chest x-rays, LLM: large language model.
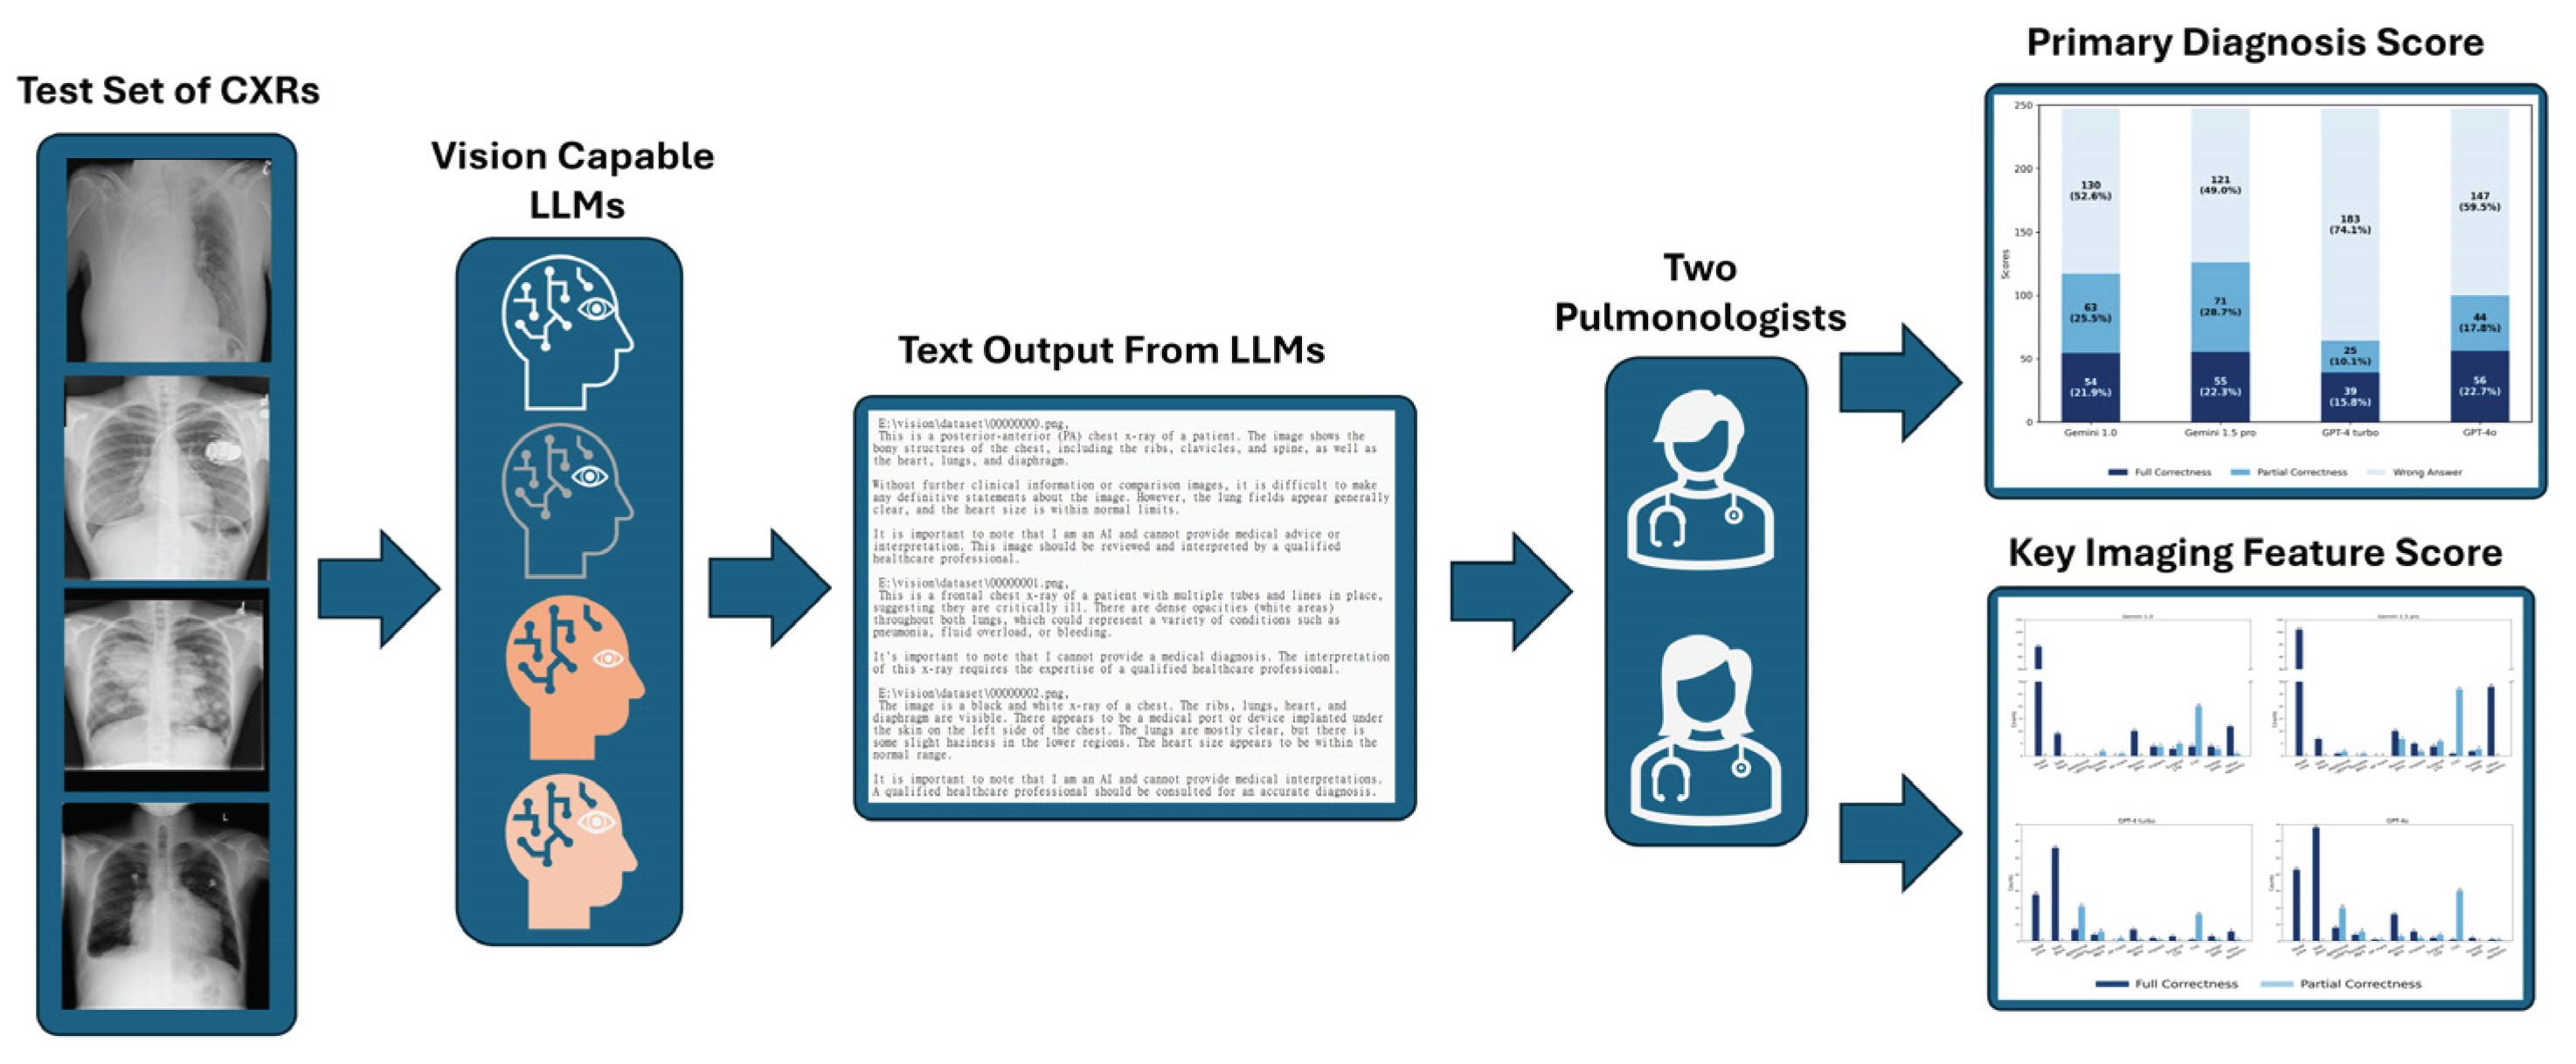
Figure 2.
Total Scores in Primary Diagnosis. In this figure, the dark blue bars represent full correctness, the medium blue bars represent partial correctness, and the light blue bars represent wrong answers. The x-axis shows the four models: Gemini 1.0, Gemini 1.5 Pro, GPT-4 Turbo, and GPT-4o. The y-axis represents the total score, with a cumulative total of 247 for each model. The numbers displayed at the center of each colored bar indicate the corresponding score, while the values in parentheses represent the percentage.
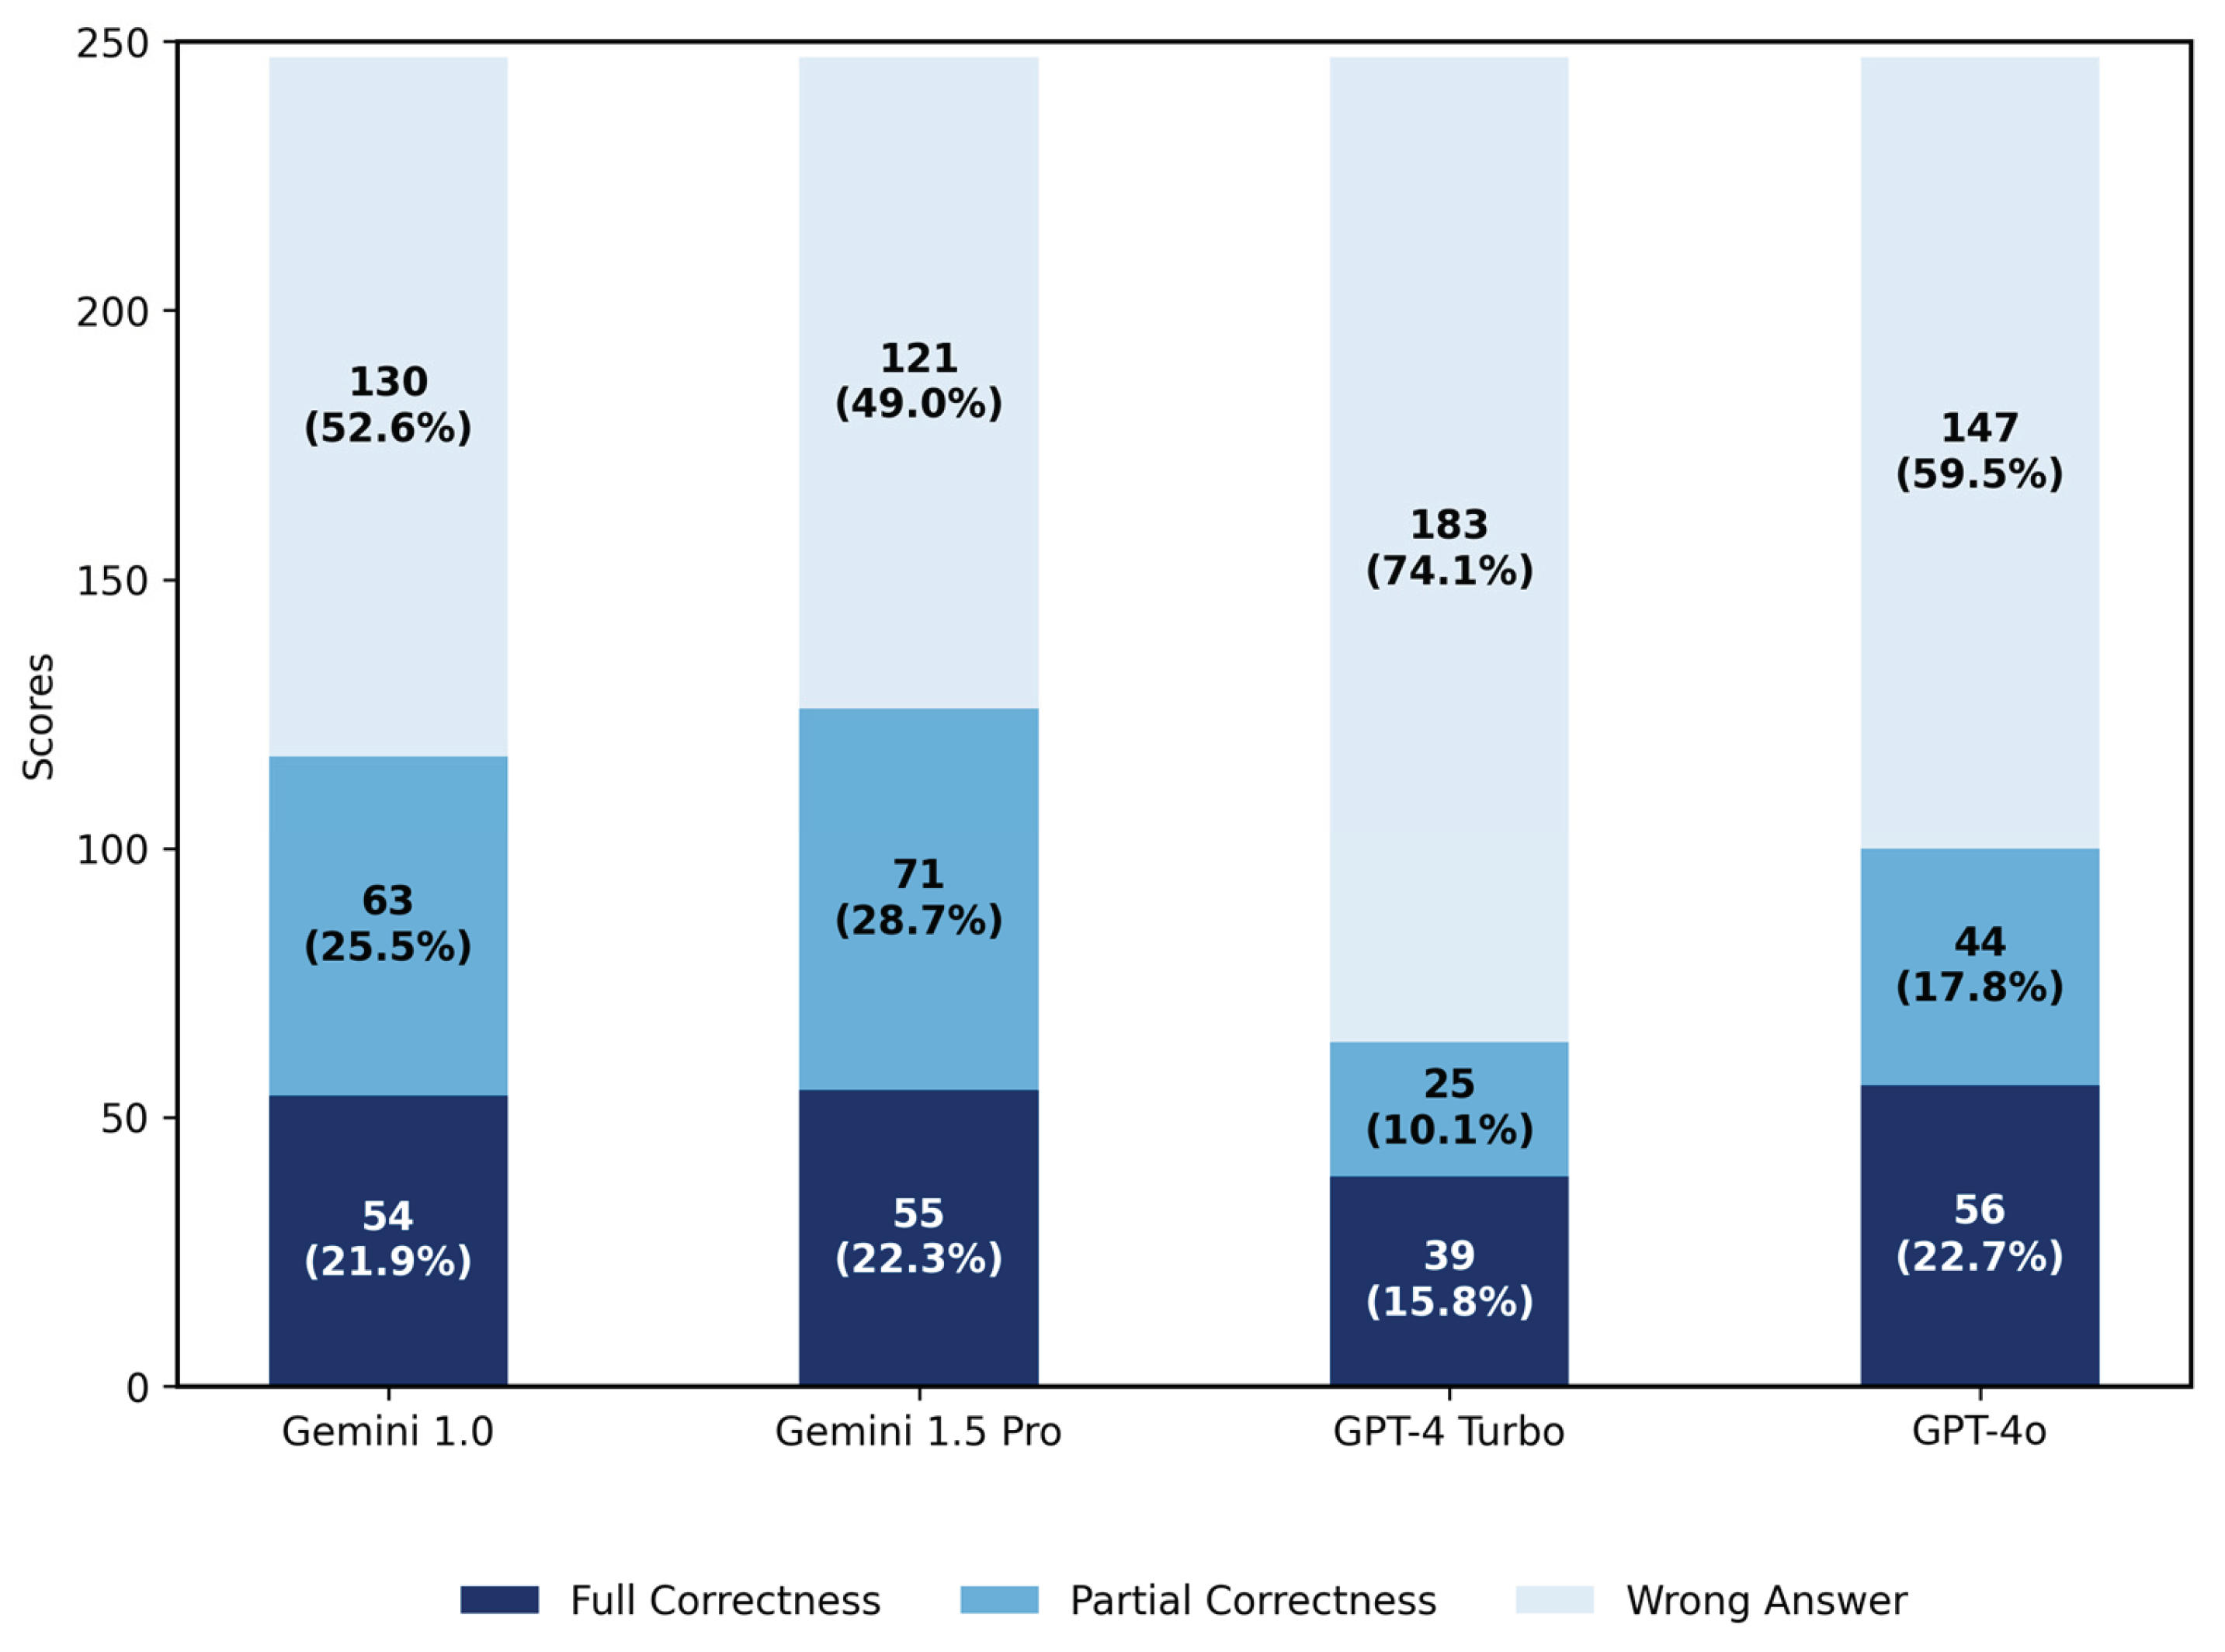
Figure 3.
Distribution of Errors in Partially Correct Primary Diagnoses. The number above each bar in the chart represents its value. Wrong Site: confusion between the right and left sides; Site Not Specified: the lesion is mentioned without specifying the exact location; Wrong Diagnosis: the lesion is mentioned but the diagnosis is incorrect; D/d (Differential Diagnosis) Not Given: the lesion is mentioned without providing a definitive or differential diagnosis; Not In D/d: the differential diagnoses provided does not match the primary diagnosis.
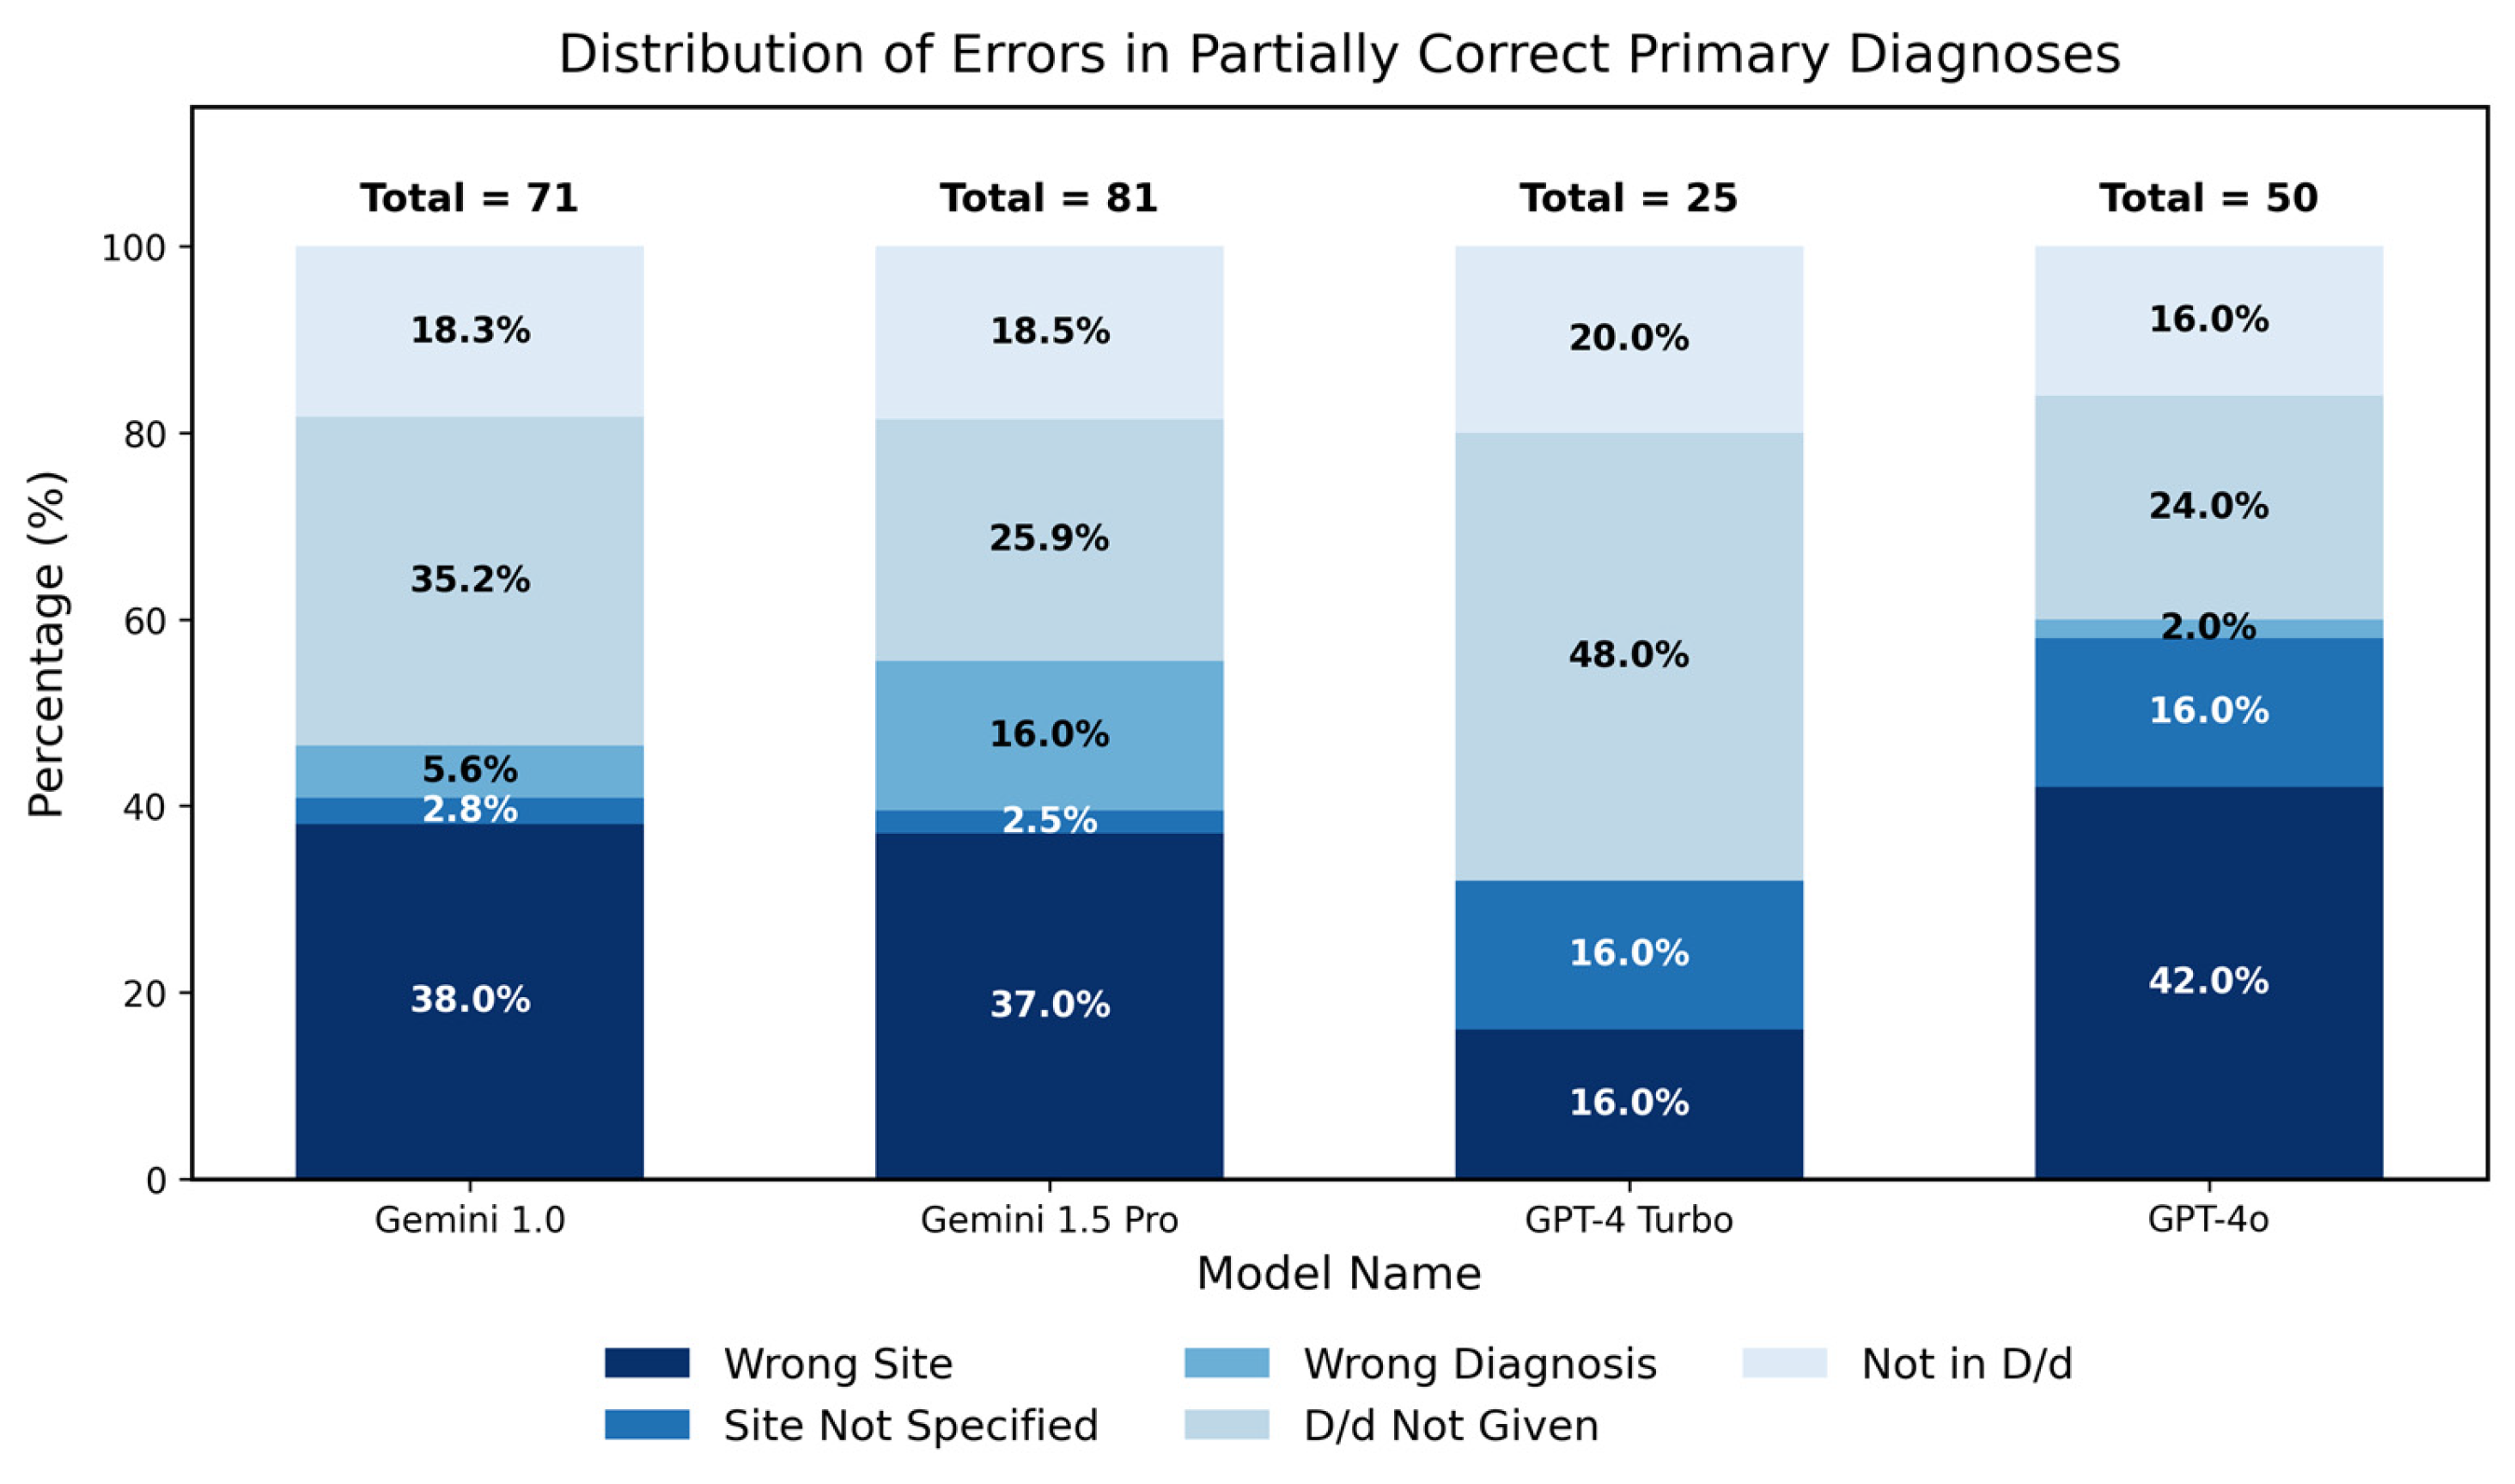
Figure 4.
Ratios of Scores Details Across Thirteen Categories. In this figure, the dark blue bars represent full correctness, the medium blue bars represent partial correctness, and the light blue bars represent wrong answers. The y-axis of each subplot is displayed as a percentage, while the x-axis represents each model: Gemini 1.0, Gemini 1.5 Pro, GPT-4 Turbo, and GPT-4o. The primary diagnosis category is indicated in the title of each subplot, with the number in parentheses representing the total number of images in that category. The numbers displayed at the center of each colored bar indicate the corresponding percentage.
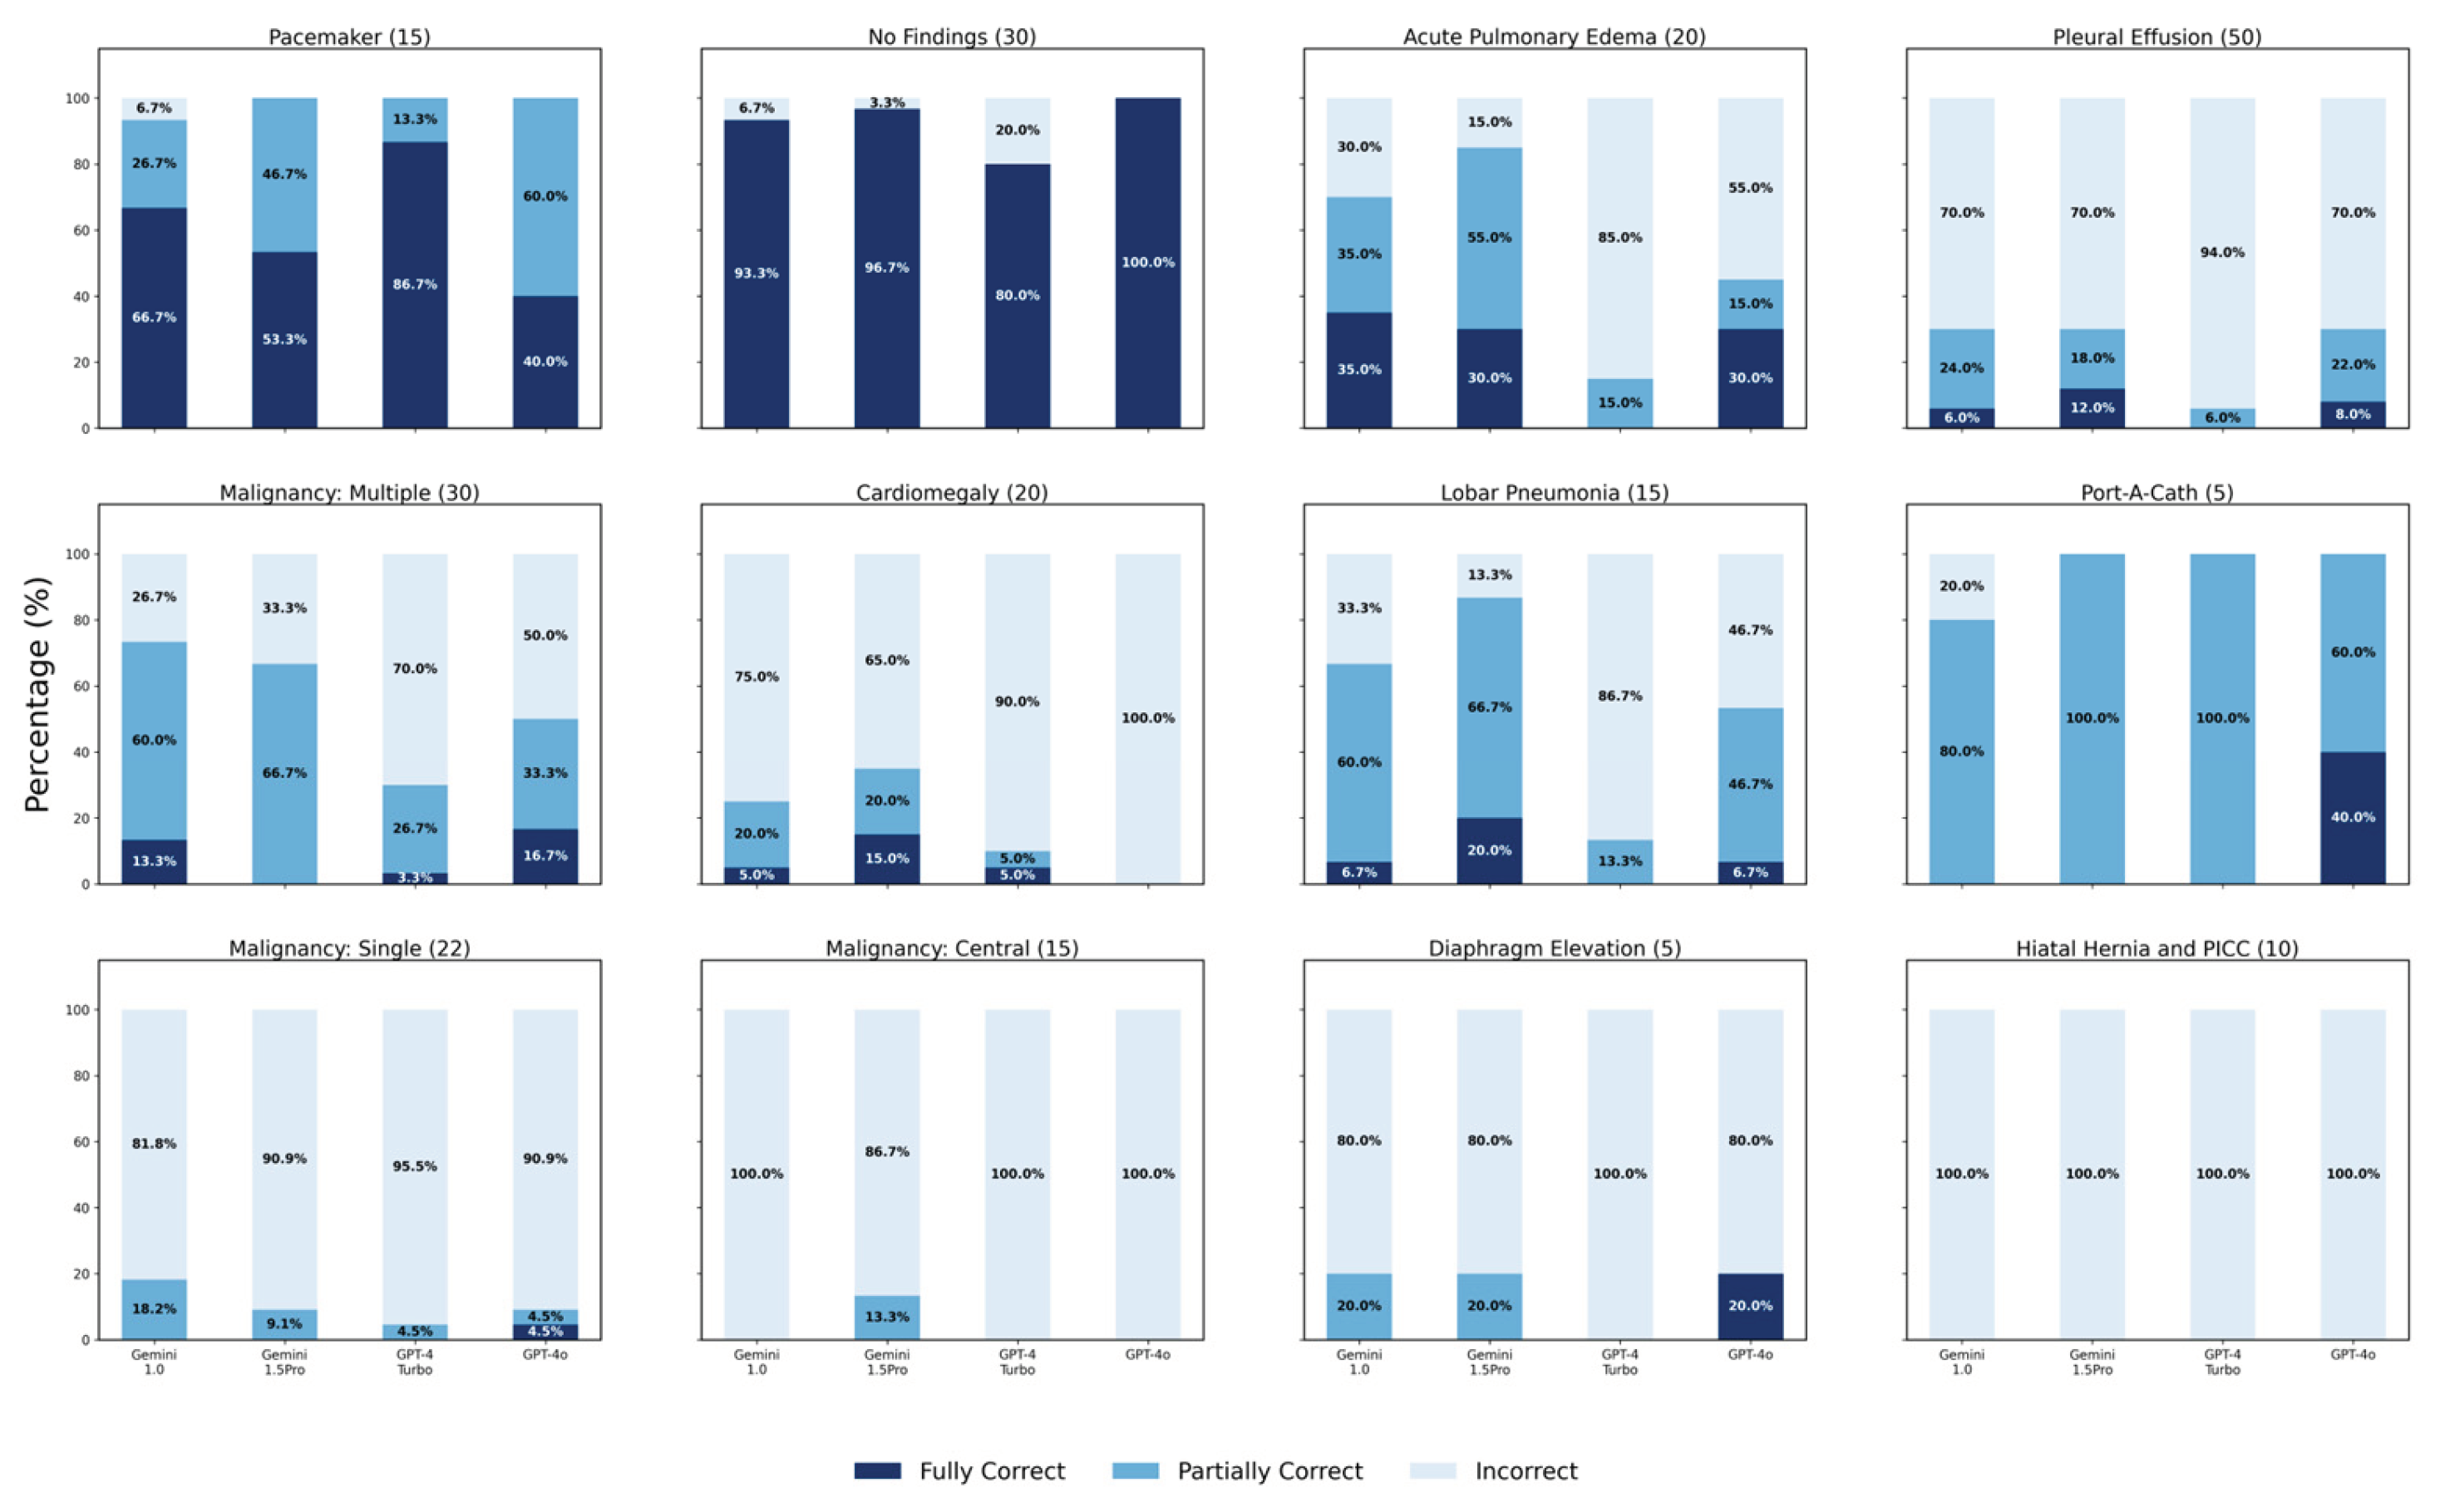
Figure 5.
Scores in Different Amount of Pleural effusion. In this figure, the dark blue bars represent full correctness, the medium blue bars represent partial correctness, and the light blue bars represent wrong answers. The y-axis represents the percentage of correct responses, while the x-axis represents the volume of pleural effusion: minimal, small, moderate, and massive. The numbers displayed at the center of each colored bar indicate the corresponding percentage.
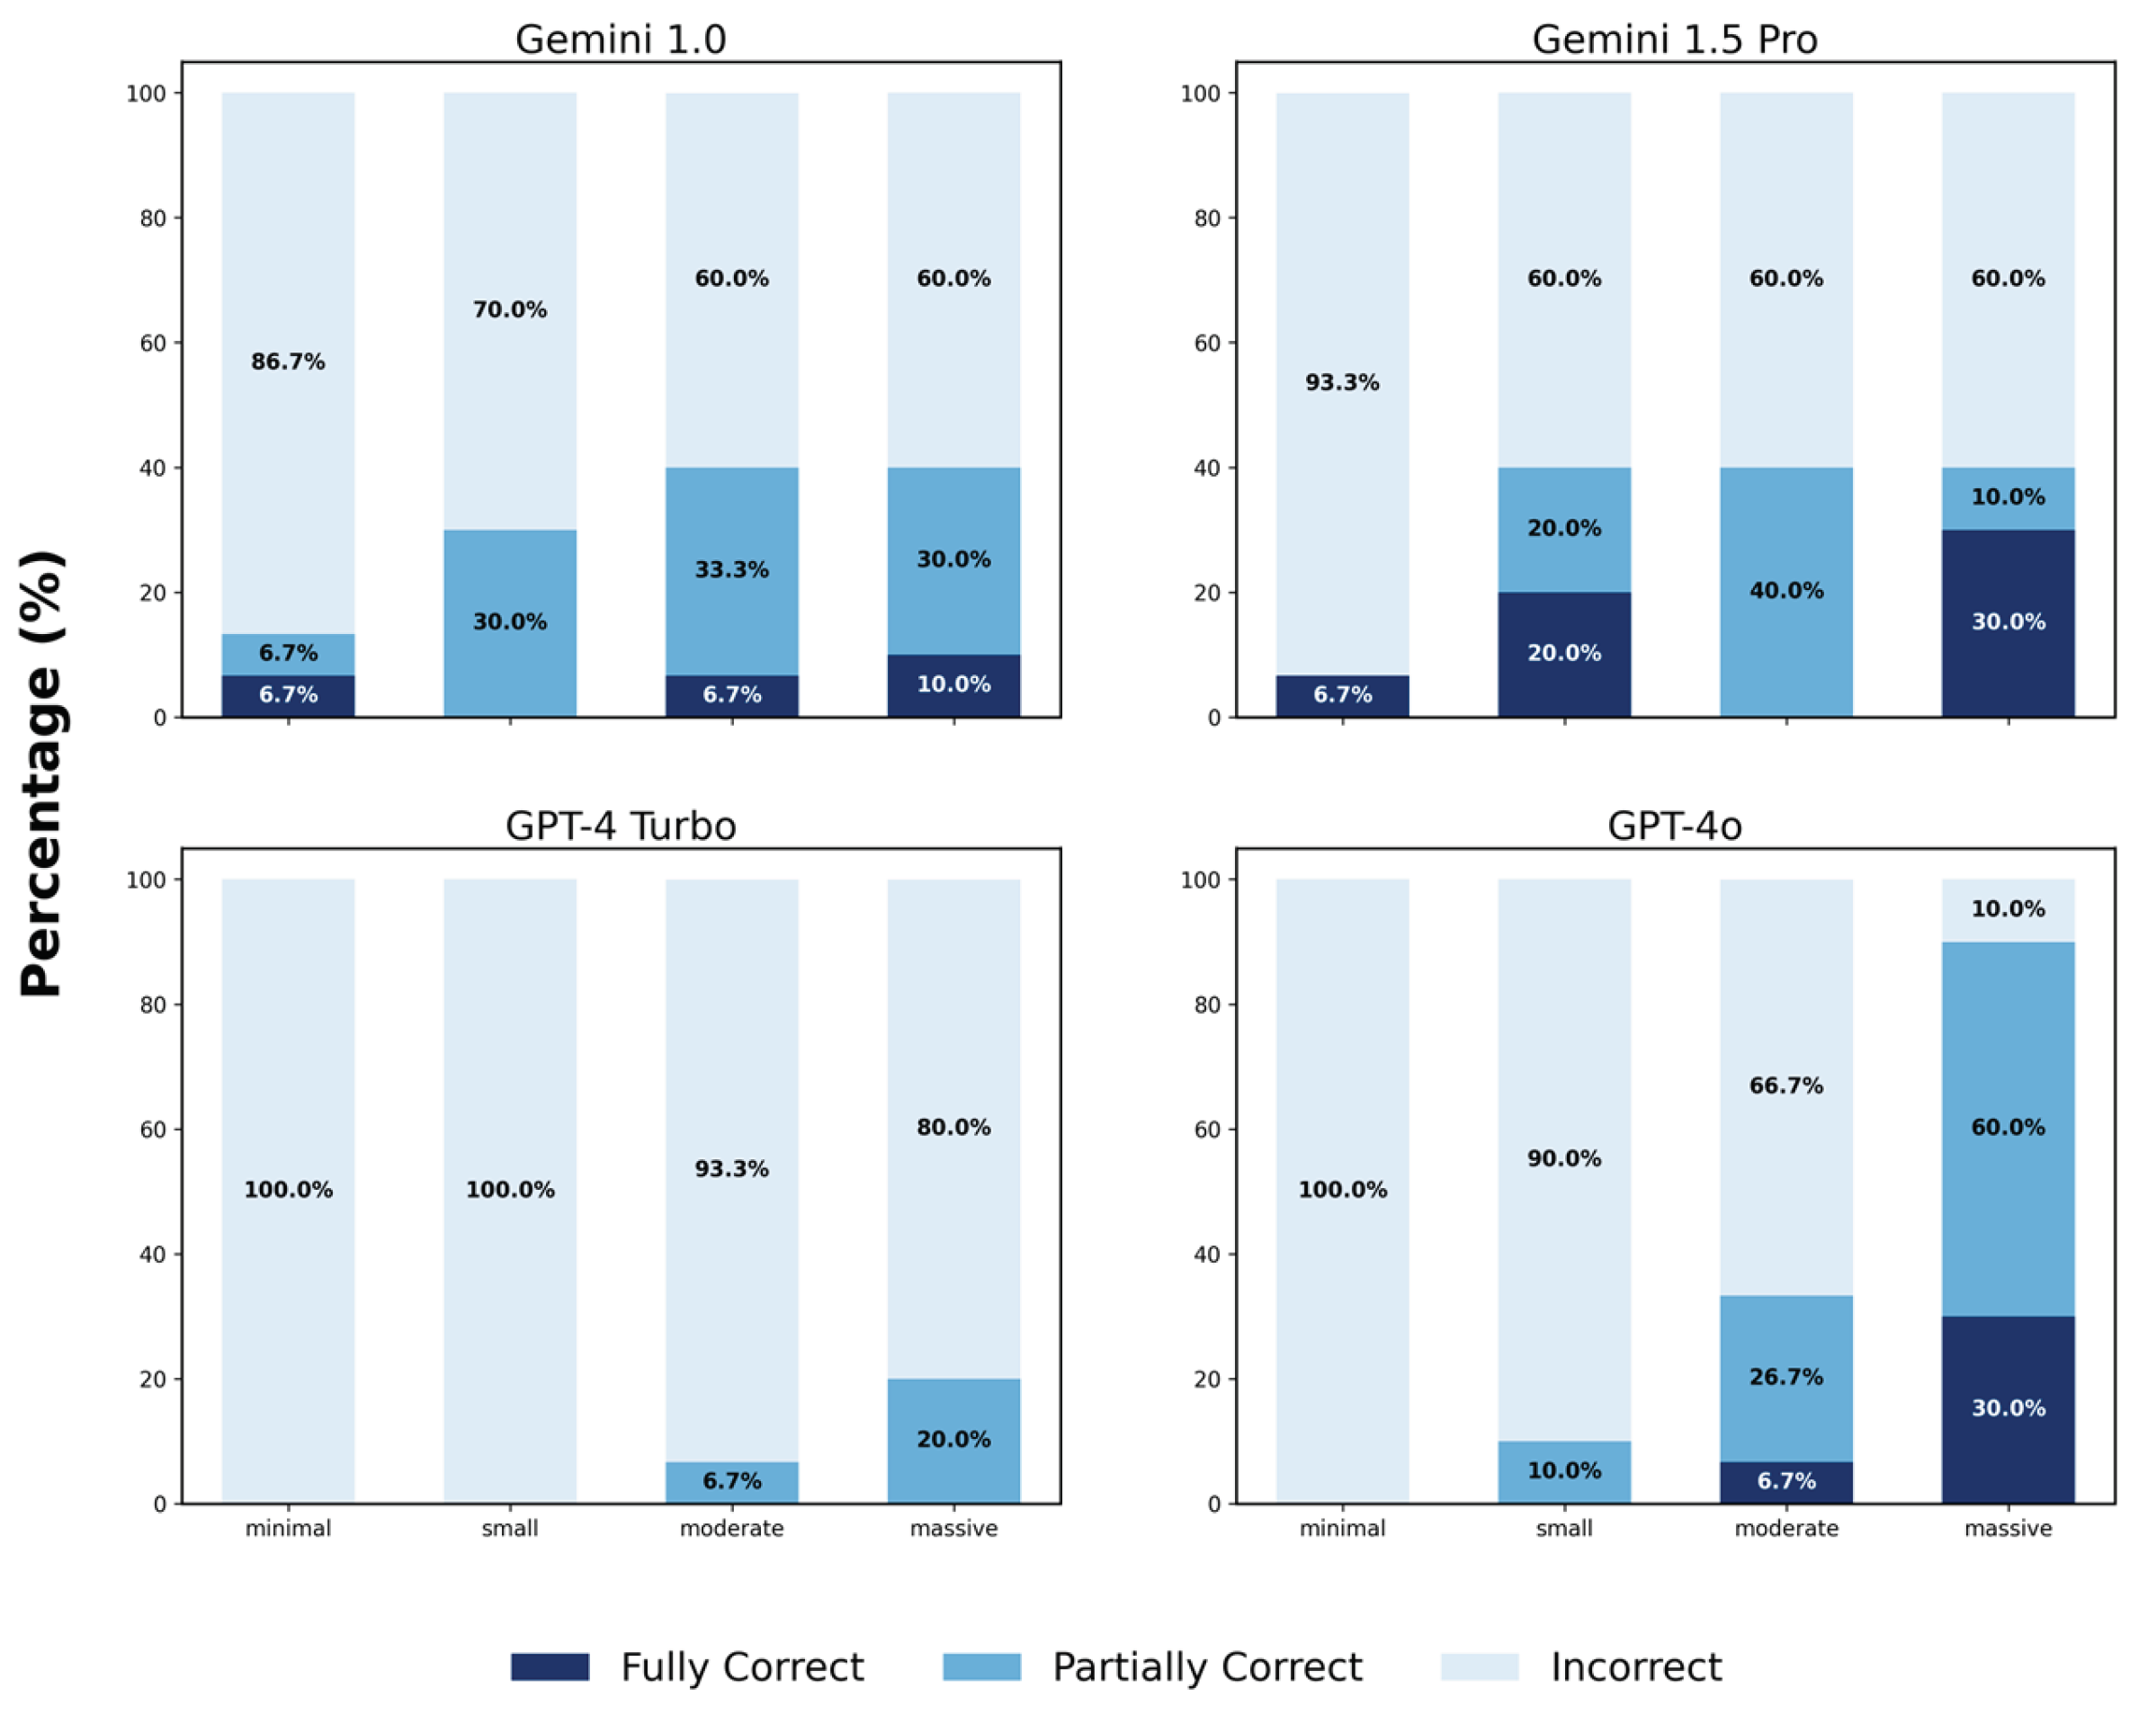
Figure 6.
Details in Key Imaging Feature Score Among Models. The y-axis of the subplot of Gemini 1.0 and Gemini 1.5 Pro has a break between the 30 and 85 marks. The number above each bar in the chart represents its value. Abbreviation: PA/AP: posterior-anterior/anterior-posterior; Side marker: “R” or “L,” or any other letters indicating the patient’s side on a CXR.; Additional letters: any letters appearing on the image, which may be in normal orientation, reversed left-right, flipped upside down, or both flipped and reversed; Portable mark: the word “PORTABLE” in the image; AP mark: the letters “AP” in the image; CVC: central venous catheter; Foreign body: anything outside the body, such as a necklace, clothes zipper, or earrings; Other remarks: indicating breast shadows or distinguishing between an adult or child.
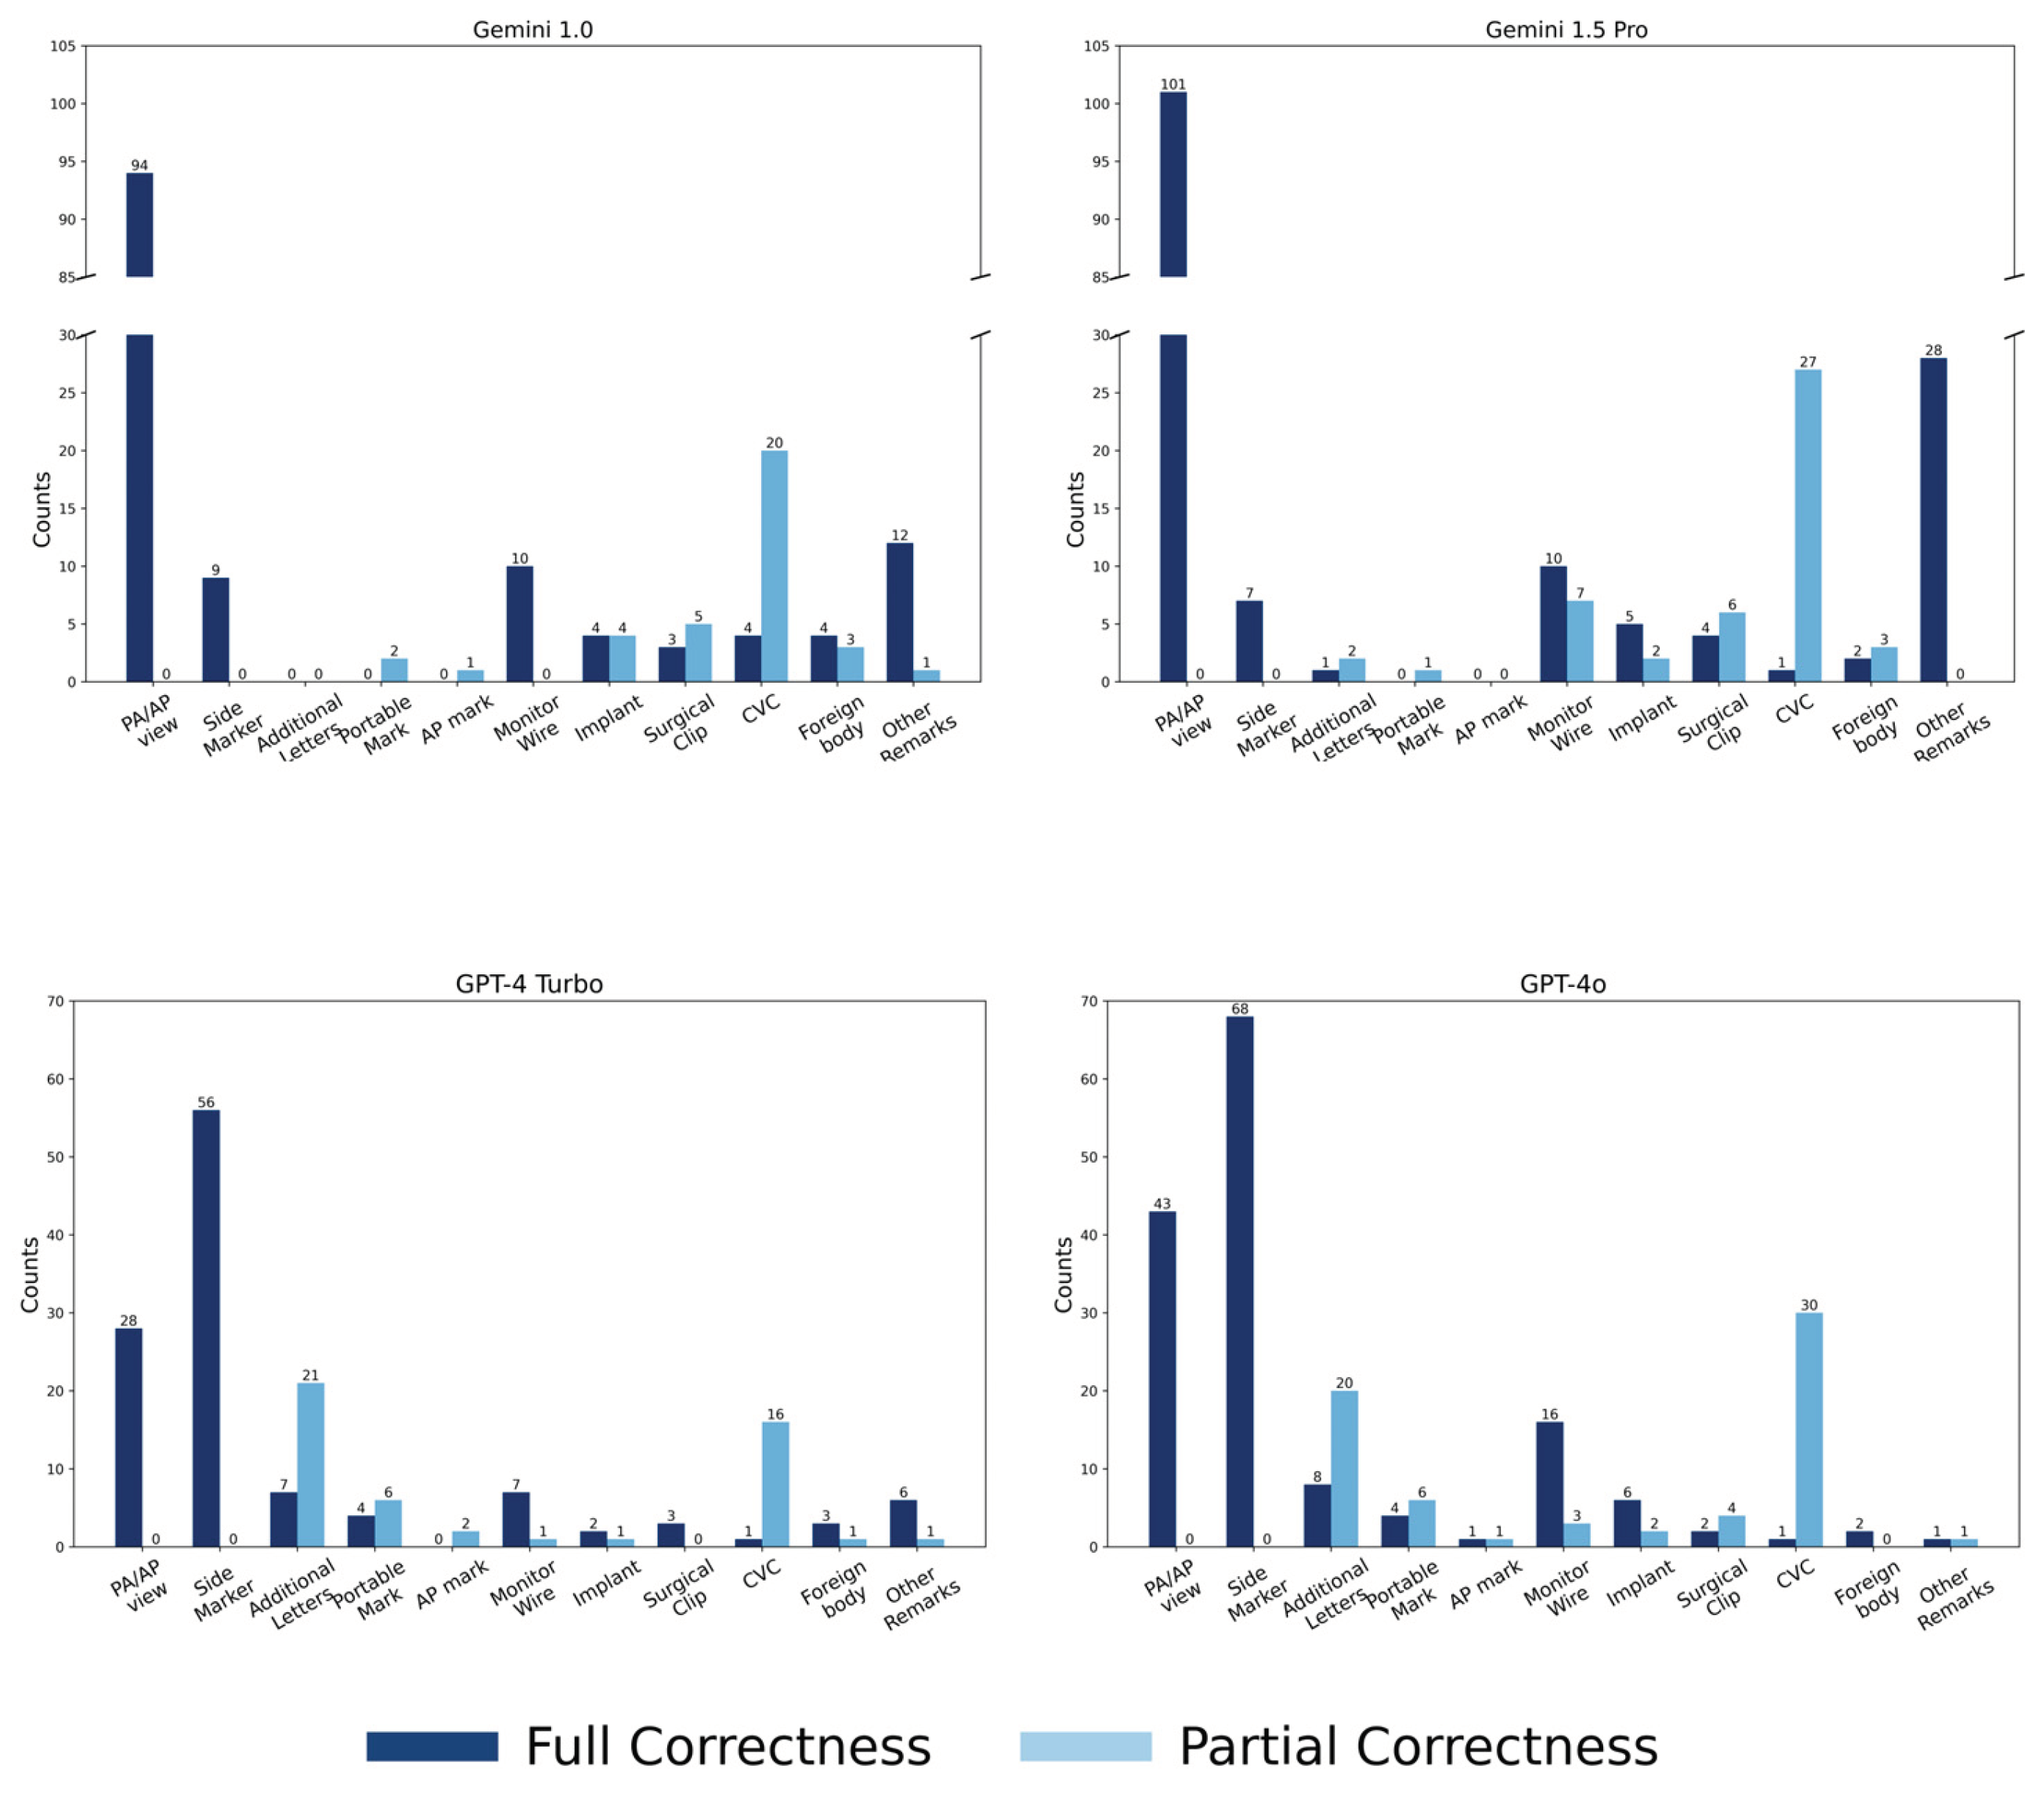
Figure 7.
Error Distribution in Partially Correct CVC Interpretations. he number above each bar in the chart represents its value. Wrong Site refers to confusion between the right and left sides; Site Not Specified indicates that the lesion is mentioned without specifying the exact location; Wrong Device means the device is mentioned, but the diagnosis is incorrect; Device Not Specified refers to the device being mentioned without providing a name; and Device Not In D/d (Differential Diagnosis) means the differential diagnosis provided does not match the device name.
Disclaimer/Publisher’s Note: The statements, opinions and data contained in all publications are solely those of the individual author(s) and contributor(s) and not of MDPI and/or the editor(s). MDPI and/or the editor(s) disclaim responsibility for any injury to people or property resulting from any ideas, methods, instructions or products referred to in the content. |
© 2025 by the authors. Licensee MDPI, Basel, Switzerland. This article is an open access article distributed under the terms and conditions of the Creative Commons Attribution (CC BY) license (http://creativecommons.org/licenses/by/4.0/).
Copyright: This open access article is published under a Creative Commons CC BY 4.0 license, which permit the free download, distribution, and reuse, provided that the author and preprint are cited in any reuse.


