
Submitted:
23 December 2025
Posted:
24 December 2025
You are already at the latest version
Abstract
Accurate estimation of hematoma age remains a major challenge in forensic practice, where assessments rely largely on subjective visual interpretation. Hyperspectral imaging (HSI) captures rich spectral signatures that may reflect the biochemical evolution of hematomas. We evaluate whether integrating spectral and spatial information with a convolutional neural network (CNN) improves hematoma age estimation and whether a reduced, physiologically motivated subset of wavelengths can maintain performance. A forearm hematoma dataset from 25 participants was processed using radiometric normalization, SAM-based segmentation, and extraction of 64 × 64 × 204 hyperspectral patches. Using leave-one-subject-out cross-validation, the CNN achieved substantially lower mean absolute error (MAE 2.29 days) compared to a spectral-only Lasso baseline (MAE 3.24 days). Bandimportance analysis combining SmoothGrad and occlusion sensitivity identified 20 highly informative wavelengths, and using only these bands matched or exceeded the accuracy of the full 204-band model across early, middle, and late hematoma stages. These results show that spectral-spatial modeling and physiologically grounded band selection can significantly enhance hematoma age estimation while reducing data dimensionality, supporting the development of compact multispectral systems for objective clinical and forensic evaluation.
Keywords:
hyperspectral imaging
; hematoma evolution
; deep learning
; spectral-spatial modeling
; optical sensors
; biomedical imaging
1. Introduction
Hematomas are localized collections of blood within the tissue outside blood vessels, typically resulting from blunt trauma that causes leakage into surrounding tissues. The assessment of hematoma plays a crucial role in various clinical and forensic contexts. In forensic medicine, estimating hematoma age can provide valuable information for narrowing down the time of injury and reconstructing the sequence of events leading to trauma.
In current forensic practice, hematoma age estimation is predominantly based on visual inspection of external characteristics such as color and consistency. However, it has been shown that the subjective visual assessment of hematoma age based on photographs is unreliable, and the accuracy of the results does not increase with a higher degree of forensic expertise [1,2]. This subjectivity highlights the need for objective, reproducible, and non-invasive methods for hematoma age assessment.
Previous work investigated the use of optical techniques for objective hematoma. For example, the color changes in the visible spectrum with respect to hematoma development can be quantified using reflectance spectroscopy [3,4,5]. Attempts have been made to use this change in the visible spectrum to date hematoma, e.g., by computing the agreement between the recorded spectrum and simulated spectra [6]. More recently, deep learning approaches have been proposed for hematoma age estimation from standard RGB images, by formulating it as a classification problem [7].
Recently, hyperspectral imaging (HSI) has shown promising potential for medical and forensic applications [8,9]. Unlike conventional RGB imaging, HSI captures reflectance information across a broad range of wavelengths, allowing for the analysis of spectral signatures at different tissue depths. Since longer wavelengths penetrate deeper into the skin, HSI has the potential for enhanced sensitivity to physiological and biochemical changes associated with hematoma evolution over time. A recent study by Al-Arami et al. [10] demonstrated that hematoma age prediction is feasible using HSI data by averaging the spectral reflectance across manually segmented hematoma regions. Although their results were encouraging, the method relied on manual segmentation, constraining its scalability and robustness for fully automated applications.
In this paper, we propose a semi automatic pipeline for hematoma age estimation from hyperspectral images. Our approach leverages a convolutional neural network (CNN) to learn spectral-spatial features directly from the data. The main contributions of this work are threefold:
- Development of a CNN-based model capable of automatically estimating hematoma age from raw hyperspectral data, supported by SAM-based automatic segmentation.
- Systematic evaluation of the model’s performance across different hematoma ages, achieving more accurate performance than previous methods (mean absolute error of 2.29 days).
- Spectral band analysis to identify wavelength regions most relevant for hematoma age estimation, offering insights into the underlying optical and physiological processes.
2. Materials and Methods
2.1. Dataset
This study utilized the HSI dataset described by Al-Arami et al. [10]. The dataset includes images from 25 healthy participants (15 male, 10 female) aged between 20 and 40 years. For each participant, a standardized hematoma was induced by injecting 3 ml of autologous blood into the volar side of the forearm. The hyperspectral images were acquired using the Specim IQ® camera (Specim, Spectral Imaging Ltd., Oulu, Finland). Imaging was performed immediately before and after hematoma induction, then daily for the first seven days, and every 48 hours during the subsequent two weeks, resulting in a 21-day observation period. In total, 604 hyperspectral image samples were collected. Each hyperspectral image is of size and consists of 204 spectral channels covering the 400–1000 nm wavelength range, enabling detailed spectral characterization of hematoma evolution over time. Figure 1 provides a simple example of hematoma evolution for a single participant, illustrating early (0–3 days), middle (4–9 days), and late (10–20 days) stages of hematoma development over the 21-day period.
2.2. Preprocessing
Processing the raw data at the original size of would require substantial computational resources. Furthermore, as can be seen in Figure 1, the hematoma occupies only a small area of the image, which complicates the task of predicting its age because there are more pixels showing healthy tissue and background. Therefore, a targeted preprocessing pipeline illustrated in Figure 2 was designed to both reduce computational cost and emphasize hematoma-relevant information. The pipeline consisted of three main steps: radiometric normalization, hematoma segmentation, and patch extraction.
In the first step, radiometric normalization was performed to correct illumination variability and sensor noise using corresponding white and dark reference images. The normalization was computed by
Next, the hematoma region was segmented using the Segment Anything Model (SAM) [11]. Although only a bounding box is ultimately required for patch extraction, segmentation was used as an intermediate step to accurately locate the hematoma center, ensuring that the extracted patches consistently covered the most affected region across time. This approach reduced manual annotation effort and improved reproducibility. The basic SAM model was chosen for its efficiency and sufficient accuracy for the task. To direct SAM’s attention toward the hematoma, a rough, manually defined bounding box was drawn around its approximate location. Samples without visible hematomas were excluded, particularly those captured shortly after blood injection (before hematoma formation) or at later stages when the hematoma had completely faded. This semi-automatic segmentation ensured that SAM-generated masks focused precisely on the hematoma while minimizing inclusion of surrounding skin or background regions. Figure 3 shows examples of SAM masks and corresponding bounding boxes centered on the segmented areas. Finally, from each segmented region, a patch of size pixel was extracted, preserving all 204 spectral channels. This patch size was selected as a compromise between computational efficiency and spatial coverage: it was sufficiently large to capture the central and most informative region of the hematoma in most cases while keeping the input dimensionality manageable for model training. In some middle-stage samples, where the hematoma expanded, the entire hematoma did not fully fit within the patch. Conversely, in late-stage samples, as the hematoma began to fade and shrink, the extracted region also included a small portion of surrounding healthy skin. By consistently centering the extraction on the SAM-generated mask, the selected patches always captured the most diagnostically relevant region, whether this corresponded to the dense hematoma core in earlier stages or the residual discoloration in later stages. This ensured that each sample represented the most informative area for temporal hematoma evolution, while maintaining consistent input dimensions and reducing computational complexity.
2.3. Model Architectures
To evaluate the effectiveness of different modeling strategies for hematoma age estimation, we compared a simple linear baseline with a deep learning approach that jointly leverages spectral and spatial information. The two models differ in their ability to capture the underlying physiological patterns reflected in hyperspectral data.
2.3.1. Baseline Model
Following the spectral-only analysis in Al-Arami et al. [10], the baseline model applies Lasso regression to the spatially averaged spectral signature. For each patch, all pixel spectra were averaged, yielding a single 204-dimensional feature vector per sample. Lasso regularization was used to constrain model complexity and automatically select informative wavelengths, providing a simple and interpretable reference model that does not utilize spatial information.
2.3.2. Proposed CNN Model
To exploit both spectral and spatial cues, we designed a two-stage CNN that is illustrated in Figure 4. In the first stage, 1D convolutions were applied along the spectral dimension to extract compact spectral embeddings that capture wavelength-dependent biochemical changes associated with hematoma maturation. In the second stage, 2D convolutions were applied to these embeddings to learn spatial patterns within the hematoma region, including distribution, shape, and localized absorption characteristics. This hybrid spectral-spatial design models hematoma evolution in the spatial and spectral dimensions, accounting for changes in chromophore absorption patterns and spatial morphology over time.
The dataset was split by participant into 70% training, 15% validation, and 15% testing. Models were trained with a batch size of 32 using the Adam optimizer (, weight decay ) for up to 100 epochs. Training employed early stopping based on validation loss (patience of 25 epochs, minimum improvement of 0.01). Data augmentation consisted of random horizontal and vertical flips to enhance spatial robustness. All experiments were performed on a single NVIDIA RTX A6000 GPU with mixed-precision training.
2.4. Evaluation Protocol
A Leave-One-Subject-Out (LOSO) cross-validation strategy was employed to assess model generalization. In each fold, one participant’s data were held out for testing, while the remaining participants were used for training and validation. This process was repeated for all 25 participants, and performance was reported as mean across the folds. The performance was quantified using Mean Absolute Error (MAE), Root Mean Square Error (RMSE), and the coefficient of determination (). To evaluate clinical relevance, threshold accuracy was computed at ±1, ±2, and ±3 days, indicating the proportion of predictions within the acceptable error range.
2.5. Spectral Configurations and Band-Importance Analysis
To evaluate the impact of spectral information on hematoma age estimation, four input configurations were designed using the same CNN architecture:
- (i)
- An RGB subset containing bands at 460 nm, 540 nm, and 650 nm, approximating conventional color imaging
- (ii)
- An extended configuration including three additional hemoglobin-sensitive wavelengths of 504 nm, 569 nm and 578 nm
- (iii)
- The full hyperspectral range of 204 channels covering wavelengths of 400–1000 nm
- (iv)
- A 20-channel configuration (Top-20) consisting of the twenty most informative spectral bands
The additional bands in configuration (ii) were selected based on known absorption peaks of oxyhemoglobin, deoxyhemoglobin, and bilirubin reported in optical spectroscopy literature [12,13]. These subsets allow direct comparison between standard imaging and hyperspectral approaches while isolating physiologically motivated spectral features. To identify the most informative spectral channels in configuration (iv), we employed two complementary feature-attribution techniques applied to the trained CNN. First, a gradient-based saliency approach with noise averaging (SmoothGrad) [14] was used to estimate per-band relevance by computing the gradient of the output with respect to the input channels. Second, an occlusion-sensitivity method [15] was applied by sequentially masking each spectral band and measuring the resulting performance degradation. A consensus importance score was obtained by averaging the ranks from both methods, providing a robust estimate of each wavelength’s contribution to hematoma age prediction. The twenty highest-scoring bands were selected to form the Top-20 subset used for comparison with the full spectral range in the Results section.
3. Results
The proposed CNN demonstrated clear improvements over the baseline Lasso regression across all evaluation metrics. The results of the LOSO experiments are summarized in Table 1.
Specifically, the CNN reduced MAE from 3.24 to 2.29 days () and RMSE from 4.01 to 3.36 days (), while increasing from 0.46 to 0.62. Furthermore, accuracy within ±1, ±2, and ±3 days increased by 19.4, 27.0, and 22.0 percentage points, indicating a markedly higher proportion of clinically acceptable predictions.
3.1. Comparison Baseline vs. Proposed CNN
To assess the added value of spatial information, the spectral-only Lasso regression baseline was compared with the proposed spectral-spatial CNN using the same LOSO evaluation scheme. Across all metrics, the CNN outperformed the baseline, showing lower error, better fit to the data, and a substantially higher proportion of predictions falling within clinically relevant error margins. In Figure 5 compares predicted and ground truth ages for both models. A locally weighted regression (LOWESS) trend line, an interpretable, non-parametric smoothing technique, was applied to visualize systematic bias across the age range. While both models track the identity line reasonably well in the mid-range, the Lasso baseline consistently underestimates hematomas older than approximately 10 days. In contrast, the CNN remains closer to the identity line throughout, demonstrating more stable behavior across early, middle, and late stages of healing.
3.2. Spectral Band Exploration and Importance Analysis
Model performance for the spectral configurations defined in Section 2.5 was analyzed across three temporal stages of hematoma healing, which were defined based on the dominant visual and biochemical phases: early (0–3 days), characterized by fresh hemoglobin and a reddish appearance; middle (4–9 days), representing the period of highest spectral contrast and stable chromophore coexistence; and late (10–20 days), characterized by bilirubin accumulation and fading, yellow-brown coloration.
As shown in Figure 6, predicting hematoma age during the late healing stage was the most challenging across all input configurations.
The RGB-only configuration yielded the largest prediction errors (MAE = 4.82 days), followed by the six-channel hemoglobin-sensitive subset (MAE = 3.91 days) and the full 204-band configuration (MAE = 3.59 days), while the Top-20 subset achieved the lowest error (MAE = 3.42 days). In the middle stage, where hematomas are visually most pronounced, all methods performed well, but the Top-20 configuration achieved the best result (MAE = 1.22 days), slightly outperforming the full-band model (MAE = 1.26 days). In the early stage, all configurations produced similar MAEs between 1.7 and 1.9 days, whereas the Top-20 approach again performed best with MAE = 1.76 days.
Overall, the Top-20 subset matched or exceeded the performance of the full-band model in all stages, indicating that concentrating on a limited set of physiologically meaningful wavelengths can maintain or even improve predictive accuracy while substantially reducing data dimensionality.
Figure 7 shows the consensus band-importance spectrum derived from SmoothGrad and occlusion sensitivity. The Top-20 most informative wavelengths (marked in red) are predominantly located in the blue-green region (405–445 nm), corresponding to hemoglobin absorption peaks that dominate during the early and middle hematoma stages. Additional clusters appear around 570–580 nm, associated with bilirubin and oxyhemoglobin absorption, and near 790–800 nm in the near-infrared range, reflecting sensitivity to deeper tissue scattering. These spectral patterns align well with known physiological absorption features and confirm that the CNN focuses on wavelength regions relevant to hematoma composition and evolution.
4. Discussion
The results of this study demonstrate that combining spectral and spatial information in a CNN substantially improves hematoma age estimation compared to a spectral-only Lasso regression baseline. Across all metrics, the CNN produced lower estimation errors, indicating that spatial heterogeneity within hematomas carries diagnostic information that is lost when spectra are averaged. In parallel, the finding that a compact Top-20 band configuration matched or exceeded the performance of the full 204-band input suggests that physiologically informed band selection can retain most of the relevant information while reducing sensor and computational complexity.
The observed performance gains are grounded in identifiable spectral properties. Band-importance analysis showed that the CNN consistently emphasized wavelengths in the blue-green region (405–445 nm) and around 570–580 nm, which coincide with dominant absorption features of hemoglobin species and bilirubin reported in optical spectroscopy and diffuse reflectance studies [12,13]. These chromophores undergo predictable biochemical transitions as hematomas evolve, and the model’s sensitivity to these bands is consistent with established tissue optical properties and chromophore behavior [16]. Additional informative contributions around 790–800 nm likely reflect deeper scattering and hemodynamic changes, in line with near-infrared assessments of tissue blood volume and oxygenation [17]. Together, these results support the interpretation that the model exploits a physiologically meaningful subset of the spectrum rather than relying on spurious correlations.
Model performance was not uniform across healing phases; the best results were obtained in the middle healing phase (4–9 days). During this interval, oxyhemoglobin and deoxyhemoglobin coexist in relatively stable proportions, generating strong spectral contrast against surrounding skin [2,18]. This richer biochemical signature likely facilitates more precise age estimation. In contrast, the weaker and more diffuse spectral characteristics of early and especially late stages make age estimation inherently more challenging, even when hyperspectral information is available.
As hematomas progress toward resolution, their appearance becomes increasingly yellow-brown due to the accumulation of bilirubin and other hemoglobin degradation products [2,18]. Concurrently, the overall optical contrast diminishes, reducing spectral separability from normal skin. This effect is further complicated by melanin absorption, which contributes residual background signals and represents a particularly relevant confound for individuals with darker skin tones [19]. Moreover, late-stage hematomas tend to become spatially diffuse with poorly defined boundaries. In the present pipeline, this undermined RGB-based SAM segmentation and the subsequent patch extraction, leading to patches that may not fully capture faint or spatially extended spectral changes.
Several methodological limitations must be acknowledged. First, processing full-resolution hyperspectral images () is computationally intensive. To make LOSO cross-validation feasible, training was restricted to patches centered on the hematoma; even with this strategy, all 25 folds required approximately 18 hours on a single NVIDIA A6000 GPU. While this approach substantially reduced memory and runtime demands, it also limited the available spatial context, which likely contributed to reduced accuracy for late-stage and more diffuse lesions. Second, the dataset comprised 25 participants with predominantly light skin tones and experimentally induced forearm hematomas, which constrains generalizability to other anatomical locations, naturally occurring injuries, and more diverse populations. Third, each acquisition was treated as an independent sample, and the model did not explicitly exploit temporal dependencies, even though hematoma evolution is inherently sequential and likely to contain informative progression patterns. Finally, the relatively small sample size combined with a high-capacity deep network raises the possibility of overfitting, underscoring the need for external validation on larger, more heterogeneous datasets before clinical or forensic deployment.
5. Conclusions
This study demonstrates the feasibility and added value of hyperspectral imaging combined with deep learning for objective hematoma age estimation. Current hematoma dating practices rely heavily on subjective visual inspection and narrative plausibility [1]. The proposed hyperspectral approach offers an initial quantitative alternative that can support expert judgment by providing reproducible estimates tied to physiological and optical evidence rather than perception alone. Such a system has the potential to improve consistency, transparency, and fairness in forensic evaluations.
A key engineering outcome is that a consensus Top-20 subset of wavelengths matched or exceeded the performance of the full 204-band configuration across all stages. This result is consistent with previous hyperspectral studies showing that carefully selected, physiologically or task-informed subsets of wavelengths can achieve performance comparable to full-band acquisition while reducing sensor complexity [20,21,22]. The identified Top-20 wavelengths therefore provide a concrete starting point for the design of compact multispectral sensors that could support portable, forensic-ready hematoma assessment systems.
Future work should address both methodological and translational aspects. On the methodological side, integrating band-selection or Top-k wavelength algorithms directly into the training process could further reduce spectral dimensionality and make it computationally feasible to include larger spatial regions (e.g., the entire forearm mask) instead of small patches. Improving lesion localization through hyperspectral-aware segmentation methods, rather than relying on RGB-derived masks, is another promising direction, particularly for subtle or diffuse hematomas. Incorporating temporal modeling through recurrent neural networks or transformer-based sequence architectures could allow the model to explicitly learn hematoma evolution trajectories rather than treating each acquisition independently.
On the translational side, expanding the dataset to include a broader range of skin tones, anatomical locations, and naturally occurring hematomas will be essential to enhance model generalizability and forensic utility. Prospective studies and external validation on independent cohorts will be required before the system can be considered for routine casework. Beyond human forensic applications, the reduced-band configuration and potential for low-cost sensor implementations also make this technology attractive for animal welfare monitoring, where simpler and more affordable systems could be used to detect and assess bruising in veterinary or agricultural settings.
Overall, this work illustrates how hyperspectral imaging and deep learning can bridge physiological interpretation with practical sensor optimization for objective hematoma age estimation. The insights gained here contribute to the growing body of research aimed at translating hyperspectral technology from the laboratory to clinical and forensic practice, as well as emerging applications in animal welfare.
Author Contributions
Arash Keshavarz: methodology, software, investigation, writing - original draft, visualization. Gerald Bieber: supervision, conceptualization, writing - conclusion , review and editing. Daniel Wulff: writing - review and editing, revision support. Carsten Babian: interpretation, writing - review and editing. Stefan Lüdtke: supervision, writing - introduction, review and editing.
Institutional Review Board Statement
This study was conducted in accordance with the Declaration of Helsinki and in accordance with the EU Directive 2010/63/EU. No animals were harmed for the purpose of this study. A positive vote has been received from the Ethics Committee of the Faculty of Medicine at Leipzig University (397/21-ek).
Informed Consent Statement
Informed consent was obtained from all subjects involved in the study.
Data Availability Statement
The data analyzed in this study is available from Carsten Babian (Carsten.Babian@medizin.uni-leipzig.de) upon request.
Conflicts of Interest
The authors declare no potential conflict of interests.
Abbreviations
The following abbreviations are used in this manuscript:
| SAM | Segment Anything Model |
| CNN | Convolutional Neural Network |
| HSI | Hyperspectral Imaging |
| LOSO | Leave One Subject Out |
| MAE | Mean Absolute Error |
| RMSE | Root Mean Squared Error |
References
- Grossman, S.E.; Johnston, A.; Vanezis, P.; Perrett, D. Can we assess the age of bruises? An attempt to develop an objective technique. Medicine, Science and the Law 2011, 51, 170–176. [Google Scholar] [CrossRef] [PubMed]
- Langlois, N.E. The science behind the quest to determine the age of bruises—a review of the English language literature. Forensic science, medicine, and pathology 2007, 3, 241–251. [Google Scholar] [CrossRef] [PubMed]
- Bohnert, M.; Baumgartner, R.; Pollak, S. Spectrophotometric evaluation of the colour of intra-and subcutaneous bruises. International journal of legal medicine 2000, 113, 343–348. [Google Scholar] [CrossRef] [PubMed]
- Hughes, V.; Ellis, P.; Burt, T.; Langlois, N. The practical application of reflectance spectrophotometry for the demonstration of haemoglobin and its degradation in bruises. Journal of clinical pathology 2004, 57, 355–359. [Google Scholar] [CrossRef] [PubMed]
- Hughes, V.K.; Langlois, N.E. Use of reflectance spectrophotometry and colorimetry in a general linear model for the determination of the age of bruises. Forensic Science, Medicine, and Pathology 2010, 6, 275–281. [Google Scholar] [CrossRef] [PubMed]
- Randeberg, L.L.; Haugen, O.A.; Haaverstad, R.; Svaasand, L.O. A novel approach to age determination of traumatic injuries by reflectance spectroscopy. Lasers in Surgery and Medicine: The Official Journal of the American Society for Laser Medicine and Surgery 2006, 38, 277–289. [Google Scholar] [CrossRef] [PubMed]
- Tirado, J.; Mauricio, D. Bruise dating using deep learning. Journal of forensic sciences 2021, 66, 336–346. [Google Scholar] [CrossRef] [PubMed]
- Radicke, P.; Lüdtke, S.; Dreßler, J.; Babian, C. Detection of tooth-colored composite restorations via optical analysis hyperspectral imaging (400 nm-1000 nm) and near-infrared spectroscopy (1550 nm–1950nm). Forensic Science International 2025, 112583. [Google Scholar] [CrossRef] [PubMed]
- Czarkowski, P.; Babian, C.; Lüdtke, S.; Baumann, S.; Dreßler, J. Contactless in vitro detection of carboxyhemoglobin using hyperspectral imaging (HSI). Forensic Science, Medicine and Pathology 2025, 1–8. [Google Scholar] [CrossRef] [PubMed]
- Al-Arami, S.; Lüdtke, S.; Dreßler, J.; Babian, C. Age prediction of hematoma using hyperspectral imaging (HSI). Forensic Science, Medicine and Pathology 2025. [CrossRef]
- Kirillov, A.; Mintun, E.; Ravi, N.; Mao, H.; Rolland, C.; Gustafson, L.; Xiao, T.; Whitehead, S.; Berg, A.C.; Lo, W.Y.; et al. Segment Anything. arXiv 2023, arXiv:2304.02643. [Google Scholar] [PubMed]
- Meng, F.; Alayash, A.I. Determination of extinction coefficients of human hemoglobin in various redox states. Analytical Biochemistry 2017, 521, 11–19. [Google Scholar] [CrossRef] [PubMed]
- Minakawa, M.; Wares, M.A.; Nakano, K.; Haneishi, H.; Aizu, Y.; Hayasaki, Y.; Ikeda, T.; Nagahara, H.; Nishidate, I. Measuring and imaging of transcutaneous bilirubin, hemoglobin, and melanin based on diffuse reflectance spectroscopy. Journal of Biomedical Optics 2023, 28. [Google Scholar] [CrossRef] [PubMed]
- Smilkov, D.; Thorat, N.; Kim, B.; Viégas, F.; Wattenberg, M. SmoothGrad: removing noise by adding noise, 2017. [CrossRef]
- Zeiler, M.D.; Fergus, R., Visualizing and Understanding Convolutional Networks. In Computer Vision – ECCV 2014; Springer International Publishing, 2014; p. 818–833. [CrossRef]
- Jacques, S.L. Optical properties of biological tissues: a review. Physics in Medicine and Biology 2013, 58, R37–R61. [Google Scholar] [CrossRef] [PubMed]
- Hou, L.; Liu, Y.; Qian, L.; Zheng, Y.; Gao, J.; Cao, W.; Shang, Y. Portable Near-Infrared Technologies and Devices for Noninvasive Assessment of Tissue Hemodynamics. Journal of Healthcare Engineering 2019, 2019, 1–11. [Google Scholar] [CrossRef] [PubMed]
- Langlois, N.; Gresham, G. The ageing of bruises: A review and study of the colour changes with time. Forensic Science International 1991, 50, 227–238. [Google Scholar] [CrossRef] [PubMed]
- Zonios, G.; Dimou, A.; Bassukas, I.; Galaris, D.; Tsolakidis, A.; Kaxiras, E. Melanin absorption spectroscopy: new method for noninvasive skin investigation and melanoma detection. Journal of Biomedical Optics 2008, 13, 014017. [Google Scholar] [CrossRef] [PubMed]
- Lu, G.; Fei, B. Medical hyperspectral imaging: a review. Journal of Biomedical Optics 2014, 19, 010901. [Google Scholar] [CrossRef] [PubMed]
- Sawant, S.; Manoharan, P. Hyperspectral band selection based on metaheuristic optimization approach. Infrared Physics &; Technology 2020, 107, 103295. [Google Scholar] [CrossRef]
- Vaddi, R.; Manoharan, P. CNN based hyperspectral image classification using unsupervised band selection and structure-preserving spatial features. Infrared Physics &; Technology 2020, 110, 103457. [Google Scholar] [CrossRef]
Figure 1.
Representative hyperspectral RGB composites from early (Day 1), middle (Day 6), and late (Day 17) hematoma stages for one participant. These images illustrate the temporal evolution of hematoma appearance over the 21-day observation period.
Figure 1.
Representative hyperspectral RGB composites from early (Day 1), middle (Day 6), and late (Day 17) hematoma stages for one participant. These images illustrate the temporal evolution of hematoma appearance over the 21-day observation period.
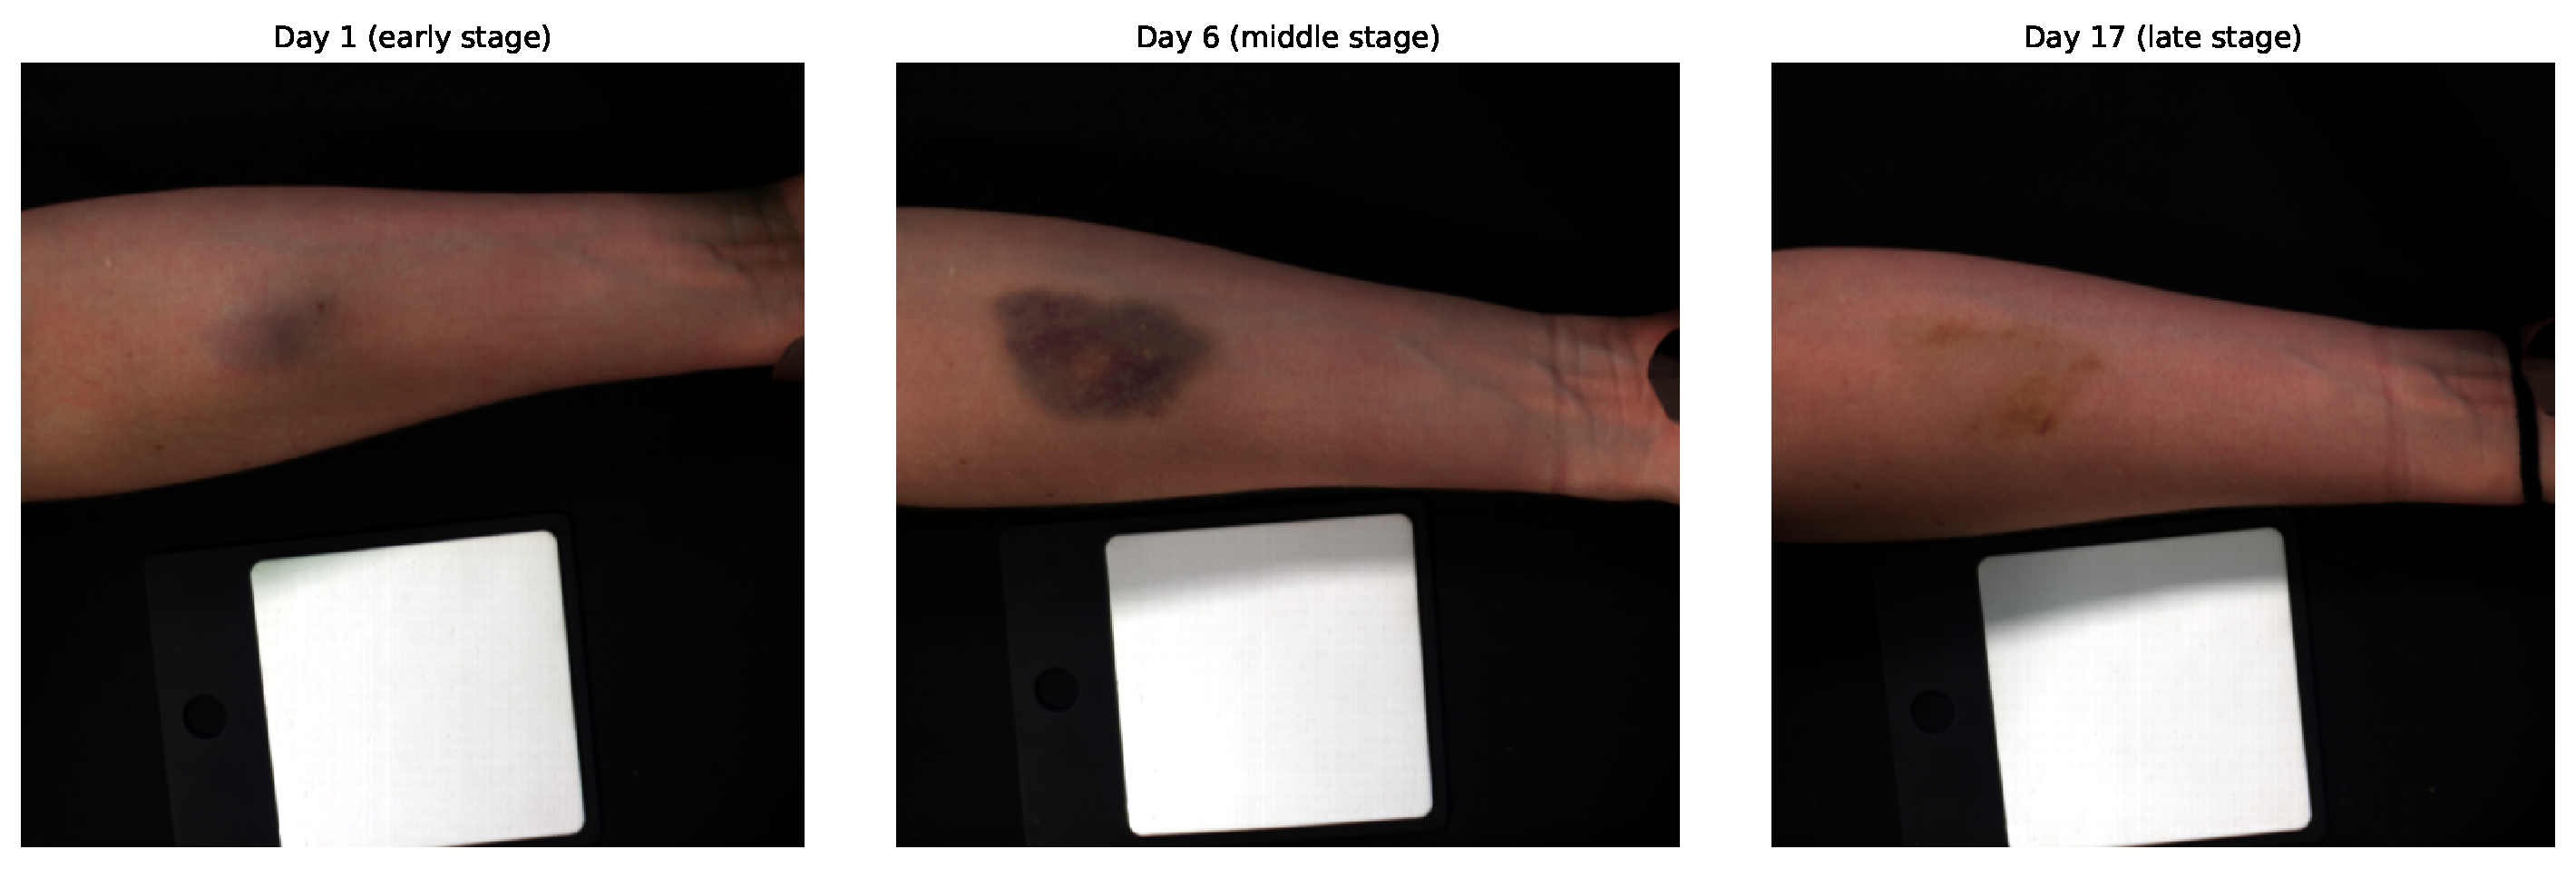
Figure 2.
Preprocessing pipeline applied to the hyperspectral dataset, including radiometric normalization, hematoma segmentation, and patch extraction.
Figure 2.
Preprocessing pipeline applied to the hyperspectral dataset, including radiometric normalization, hematoma segmentation, and patch extraction.
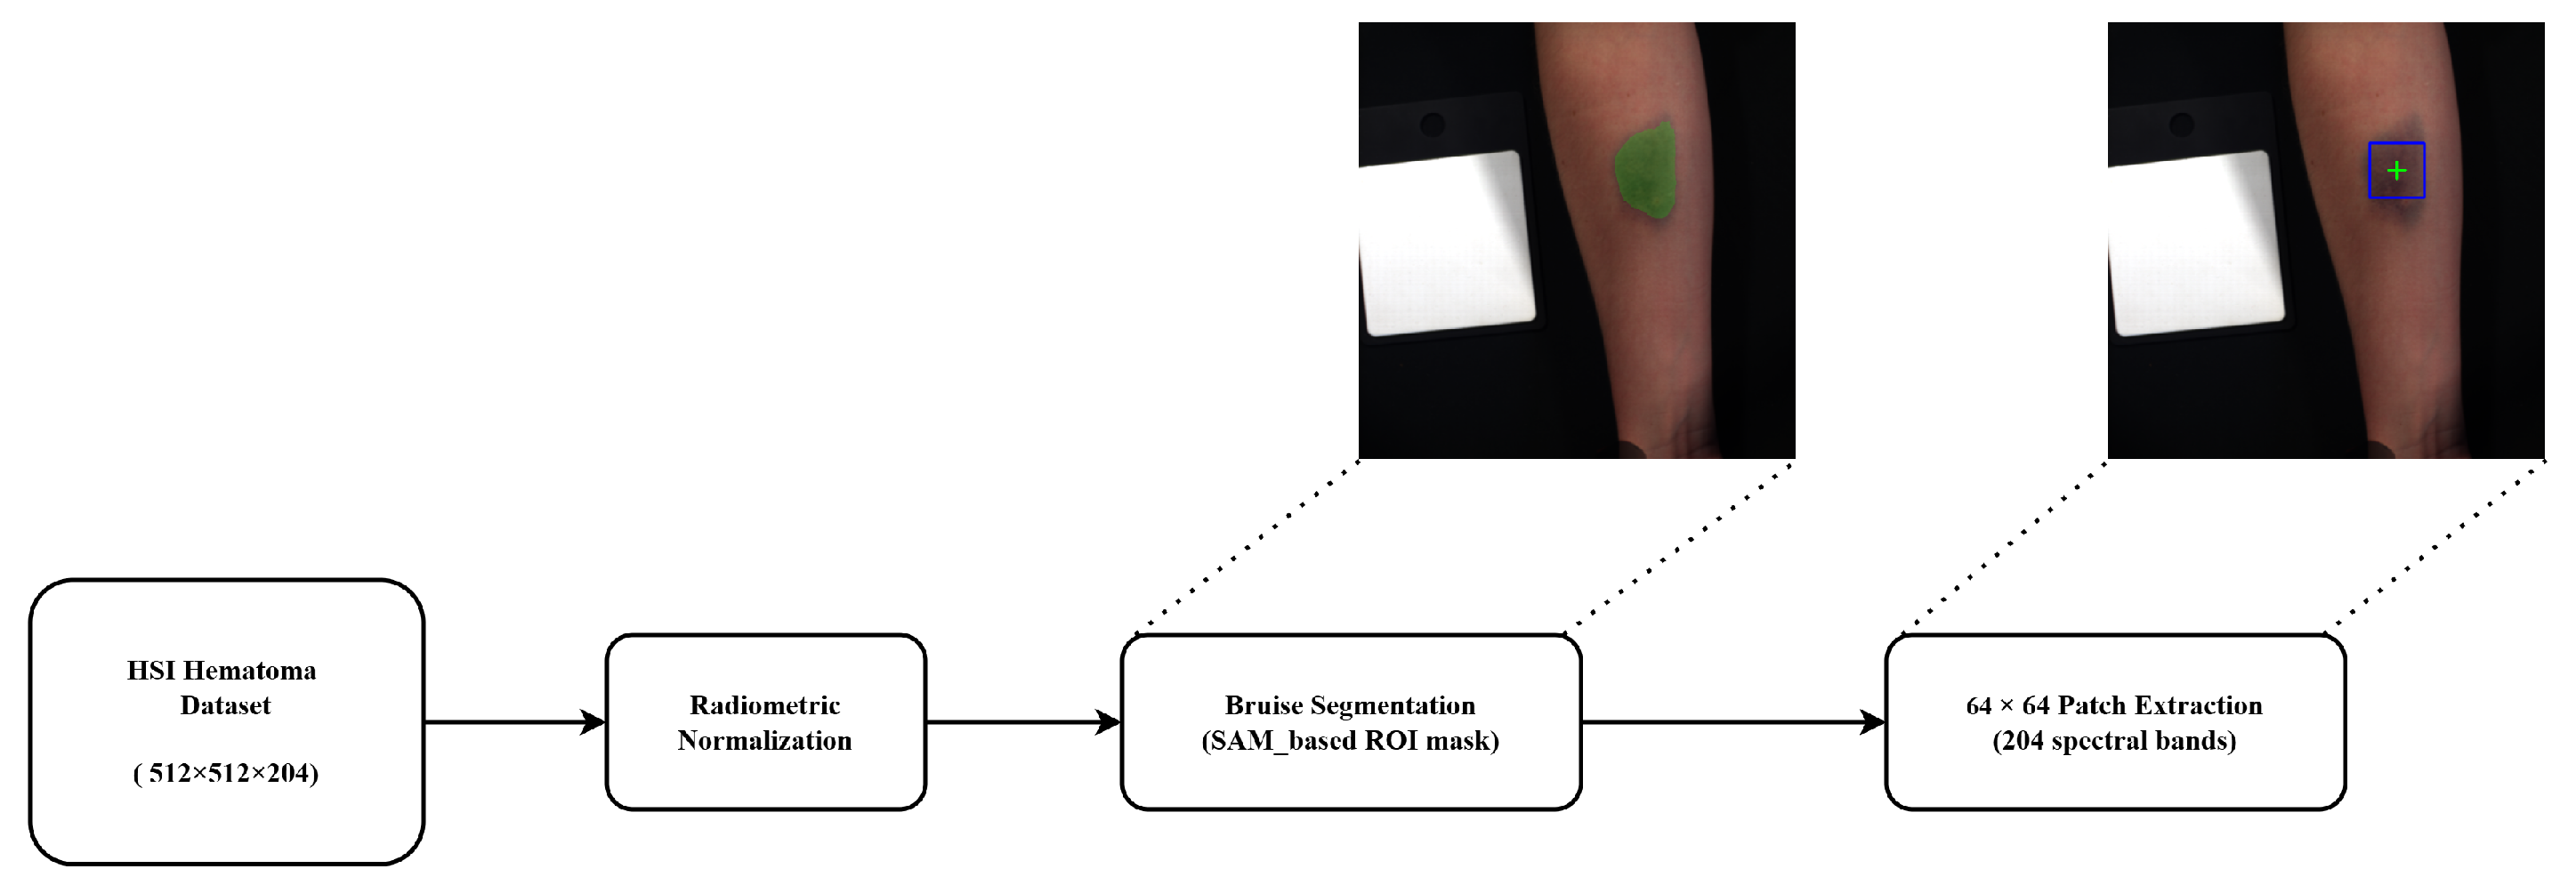
Figure 3.
Segmentation examples for Participant 25, showing SAM-generated masks across early, middle, and late hematoma stages, together with the corresponding bounding boxes of size used for patch extraction.
Figure 3.
Segmentation examples for Participant 25, showing SAM-generated masks across early, middle, and late hematoma stages, together with the corresponding bounding boxes of size used for patch extraction.
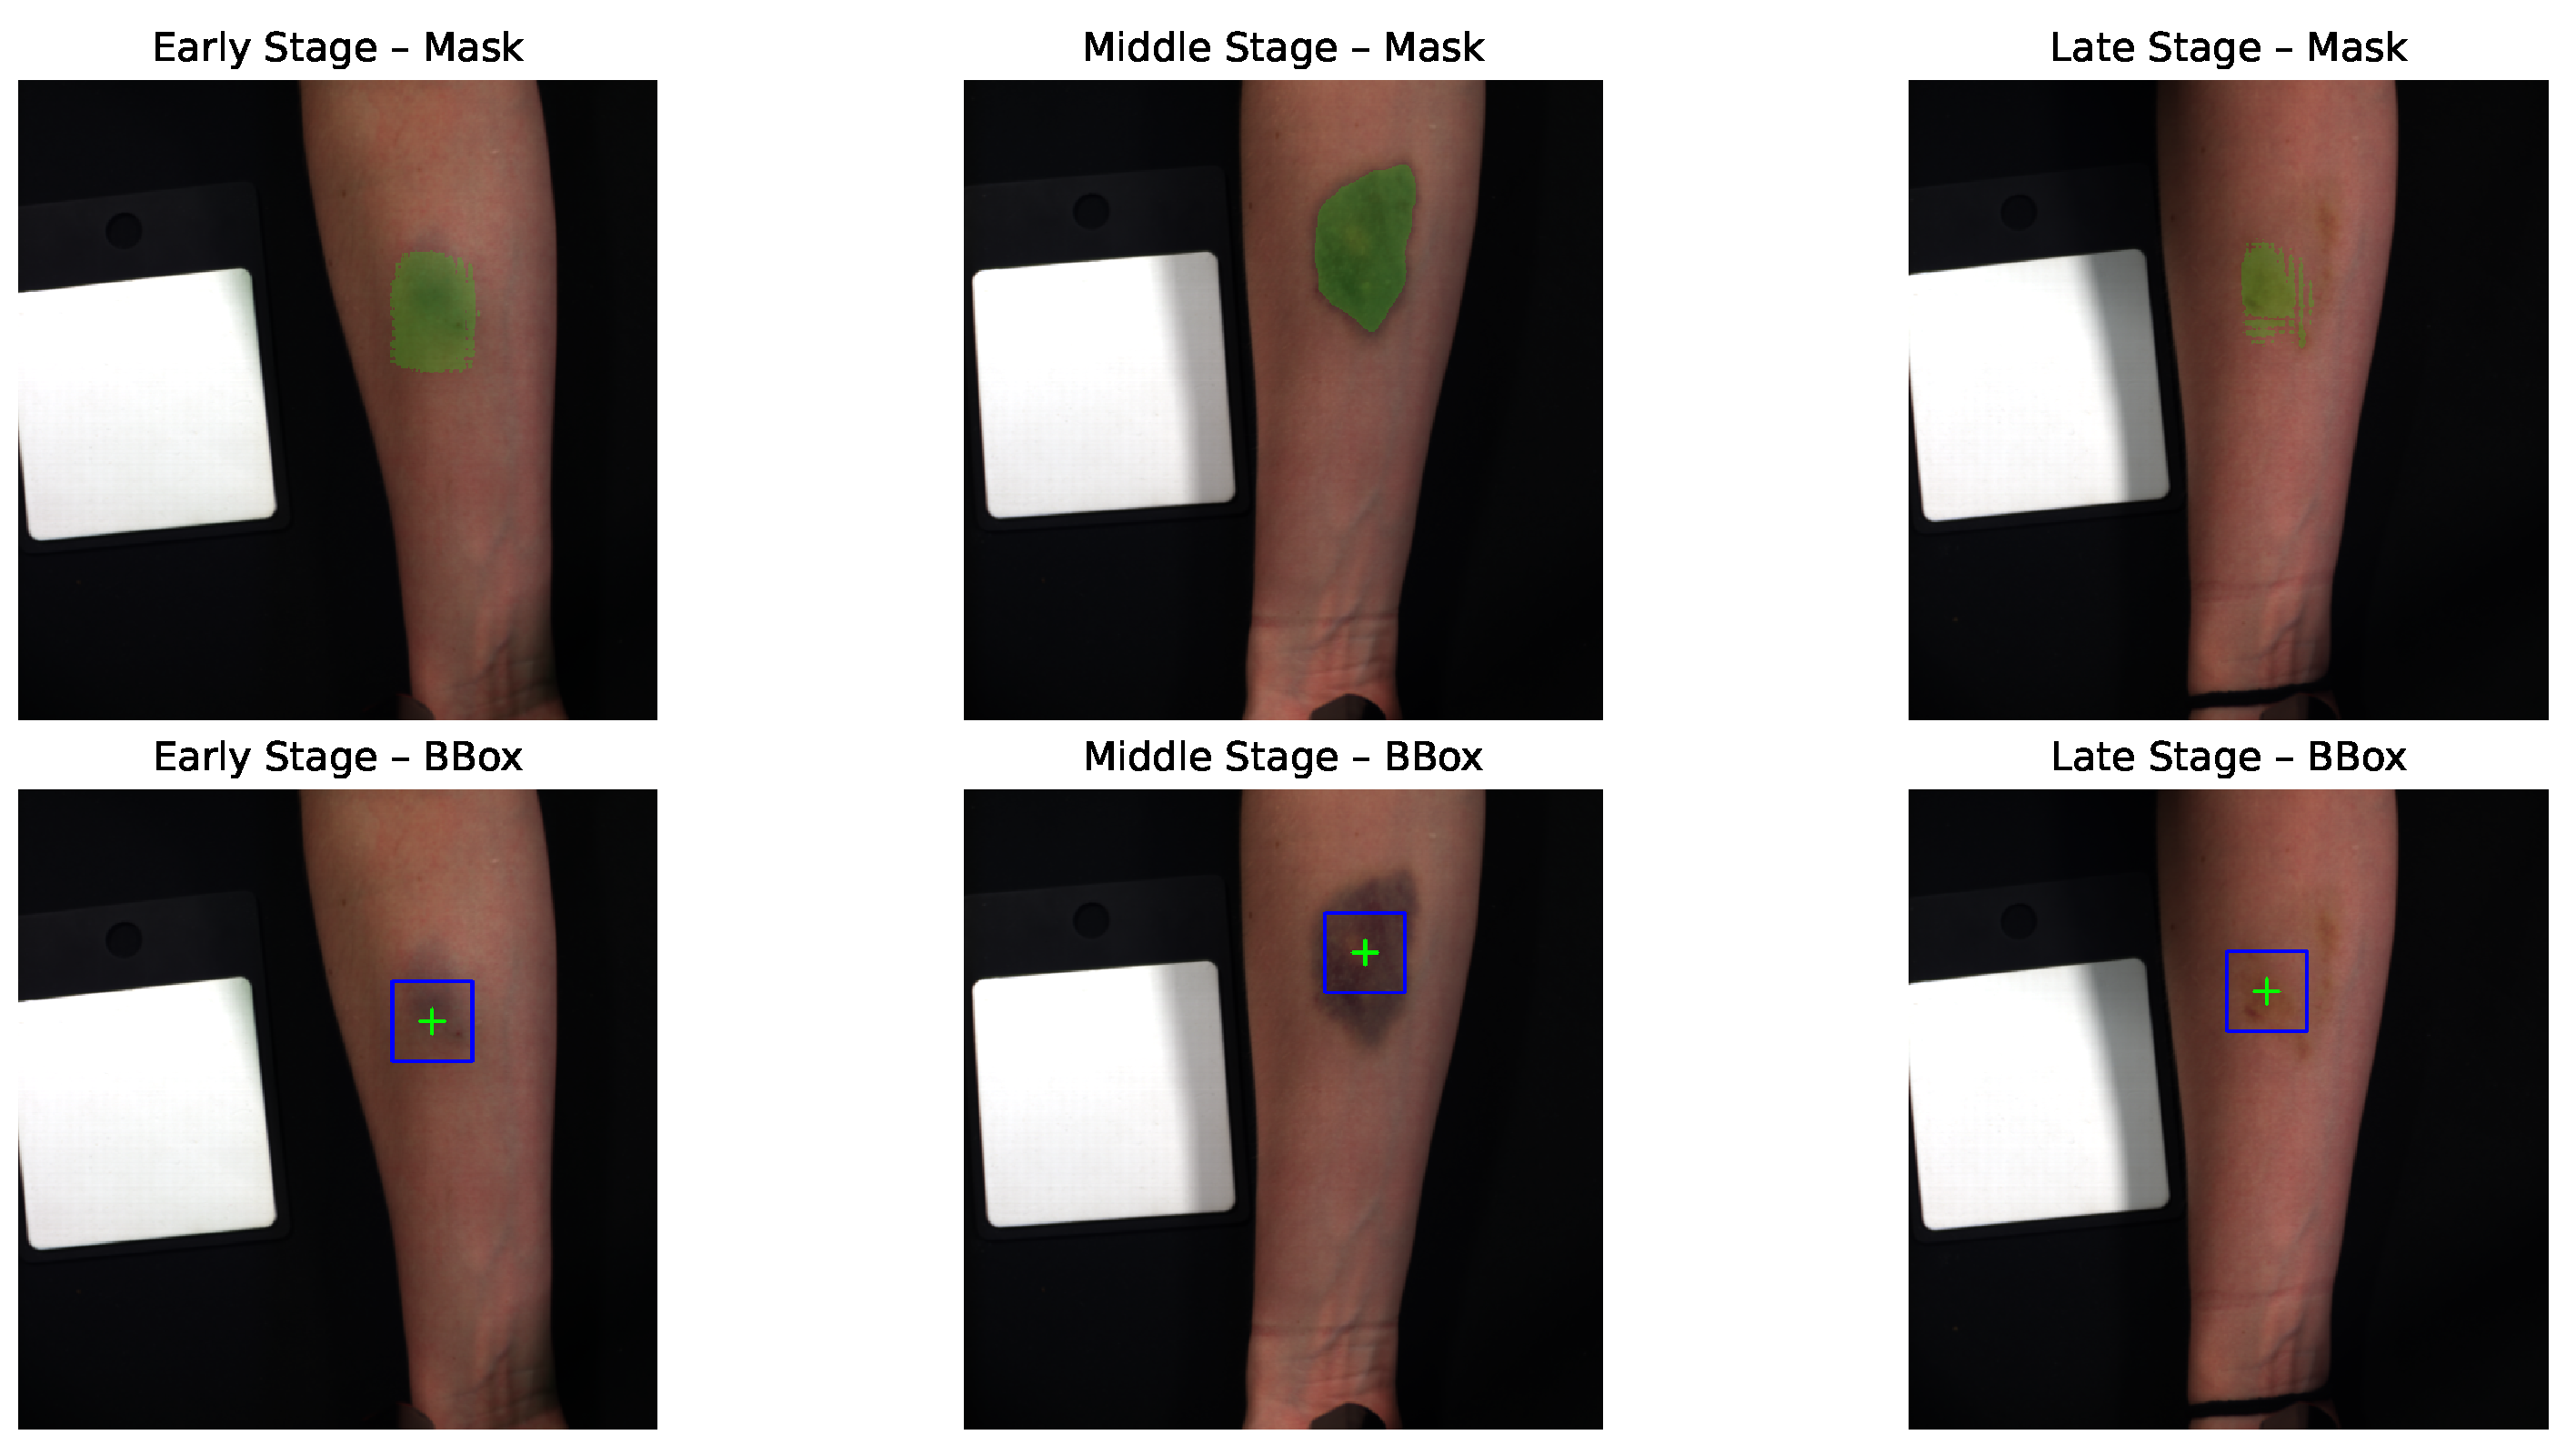
Figure 4.
Overview of the proposed deep learning architecture for hyperspectral hematoma age estimation.
Figure 4.
Overview of the proposed deep learning architecture for hyperspectral hematoma age estimation.
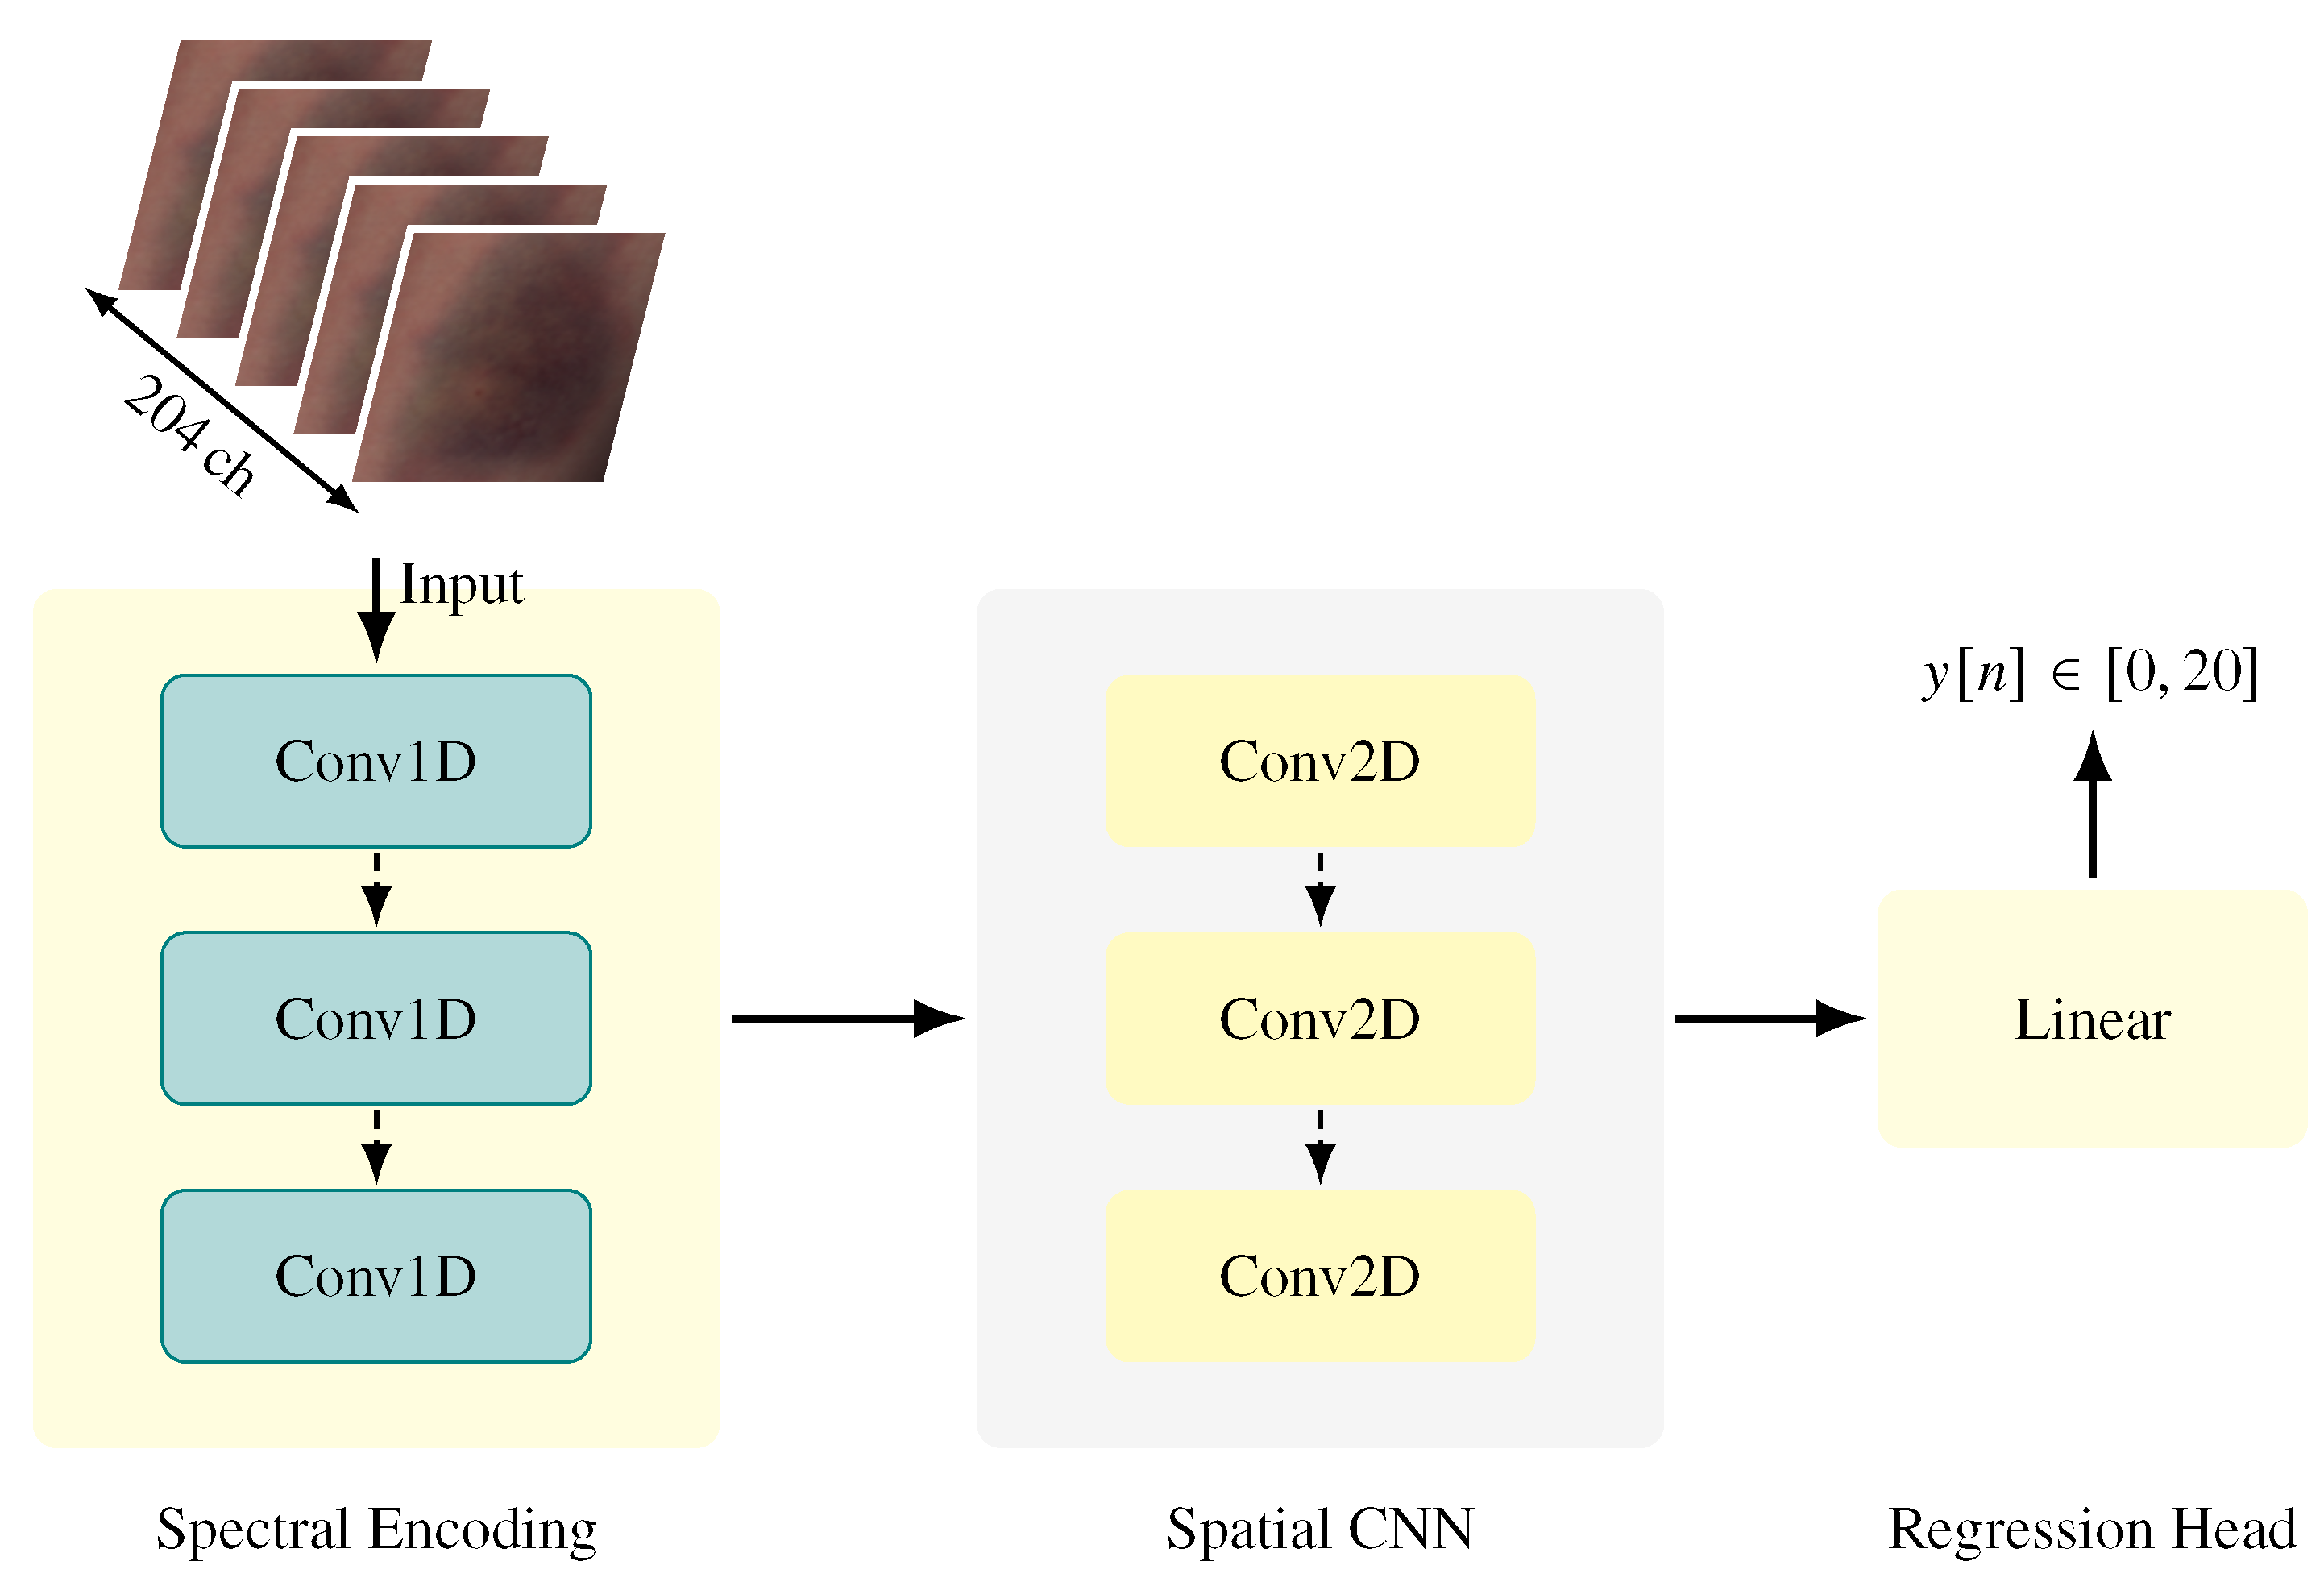
Figure 5.
Scatter plot of predicted vs. ground truth hematoma ages for Lasso regression and the proposed CNN. The CNN follows the identity line more closely and avoids the systematic underestimation observed in the baseline model.
Figure 5.
Scatter plot of predicted vs. ground truth hematoma ages for Lasso regression and the proposed CNN. The CNN follows the identity line more closely and avoids the systematic underestimation observed in the baseline model.
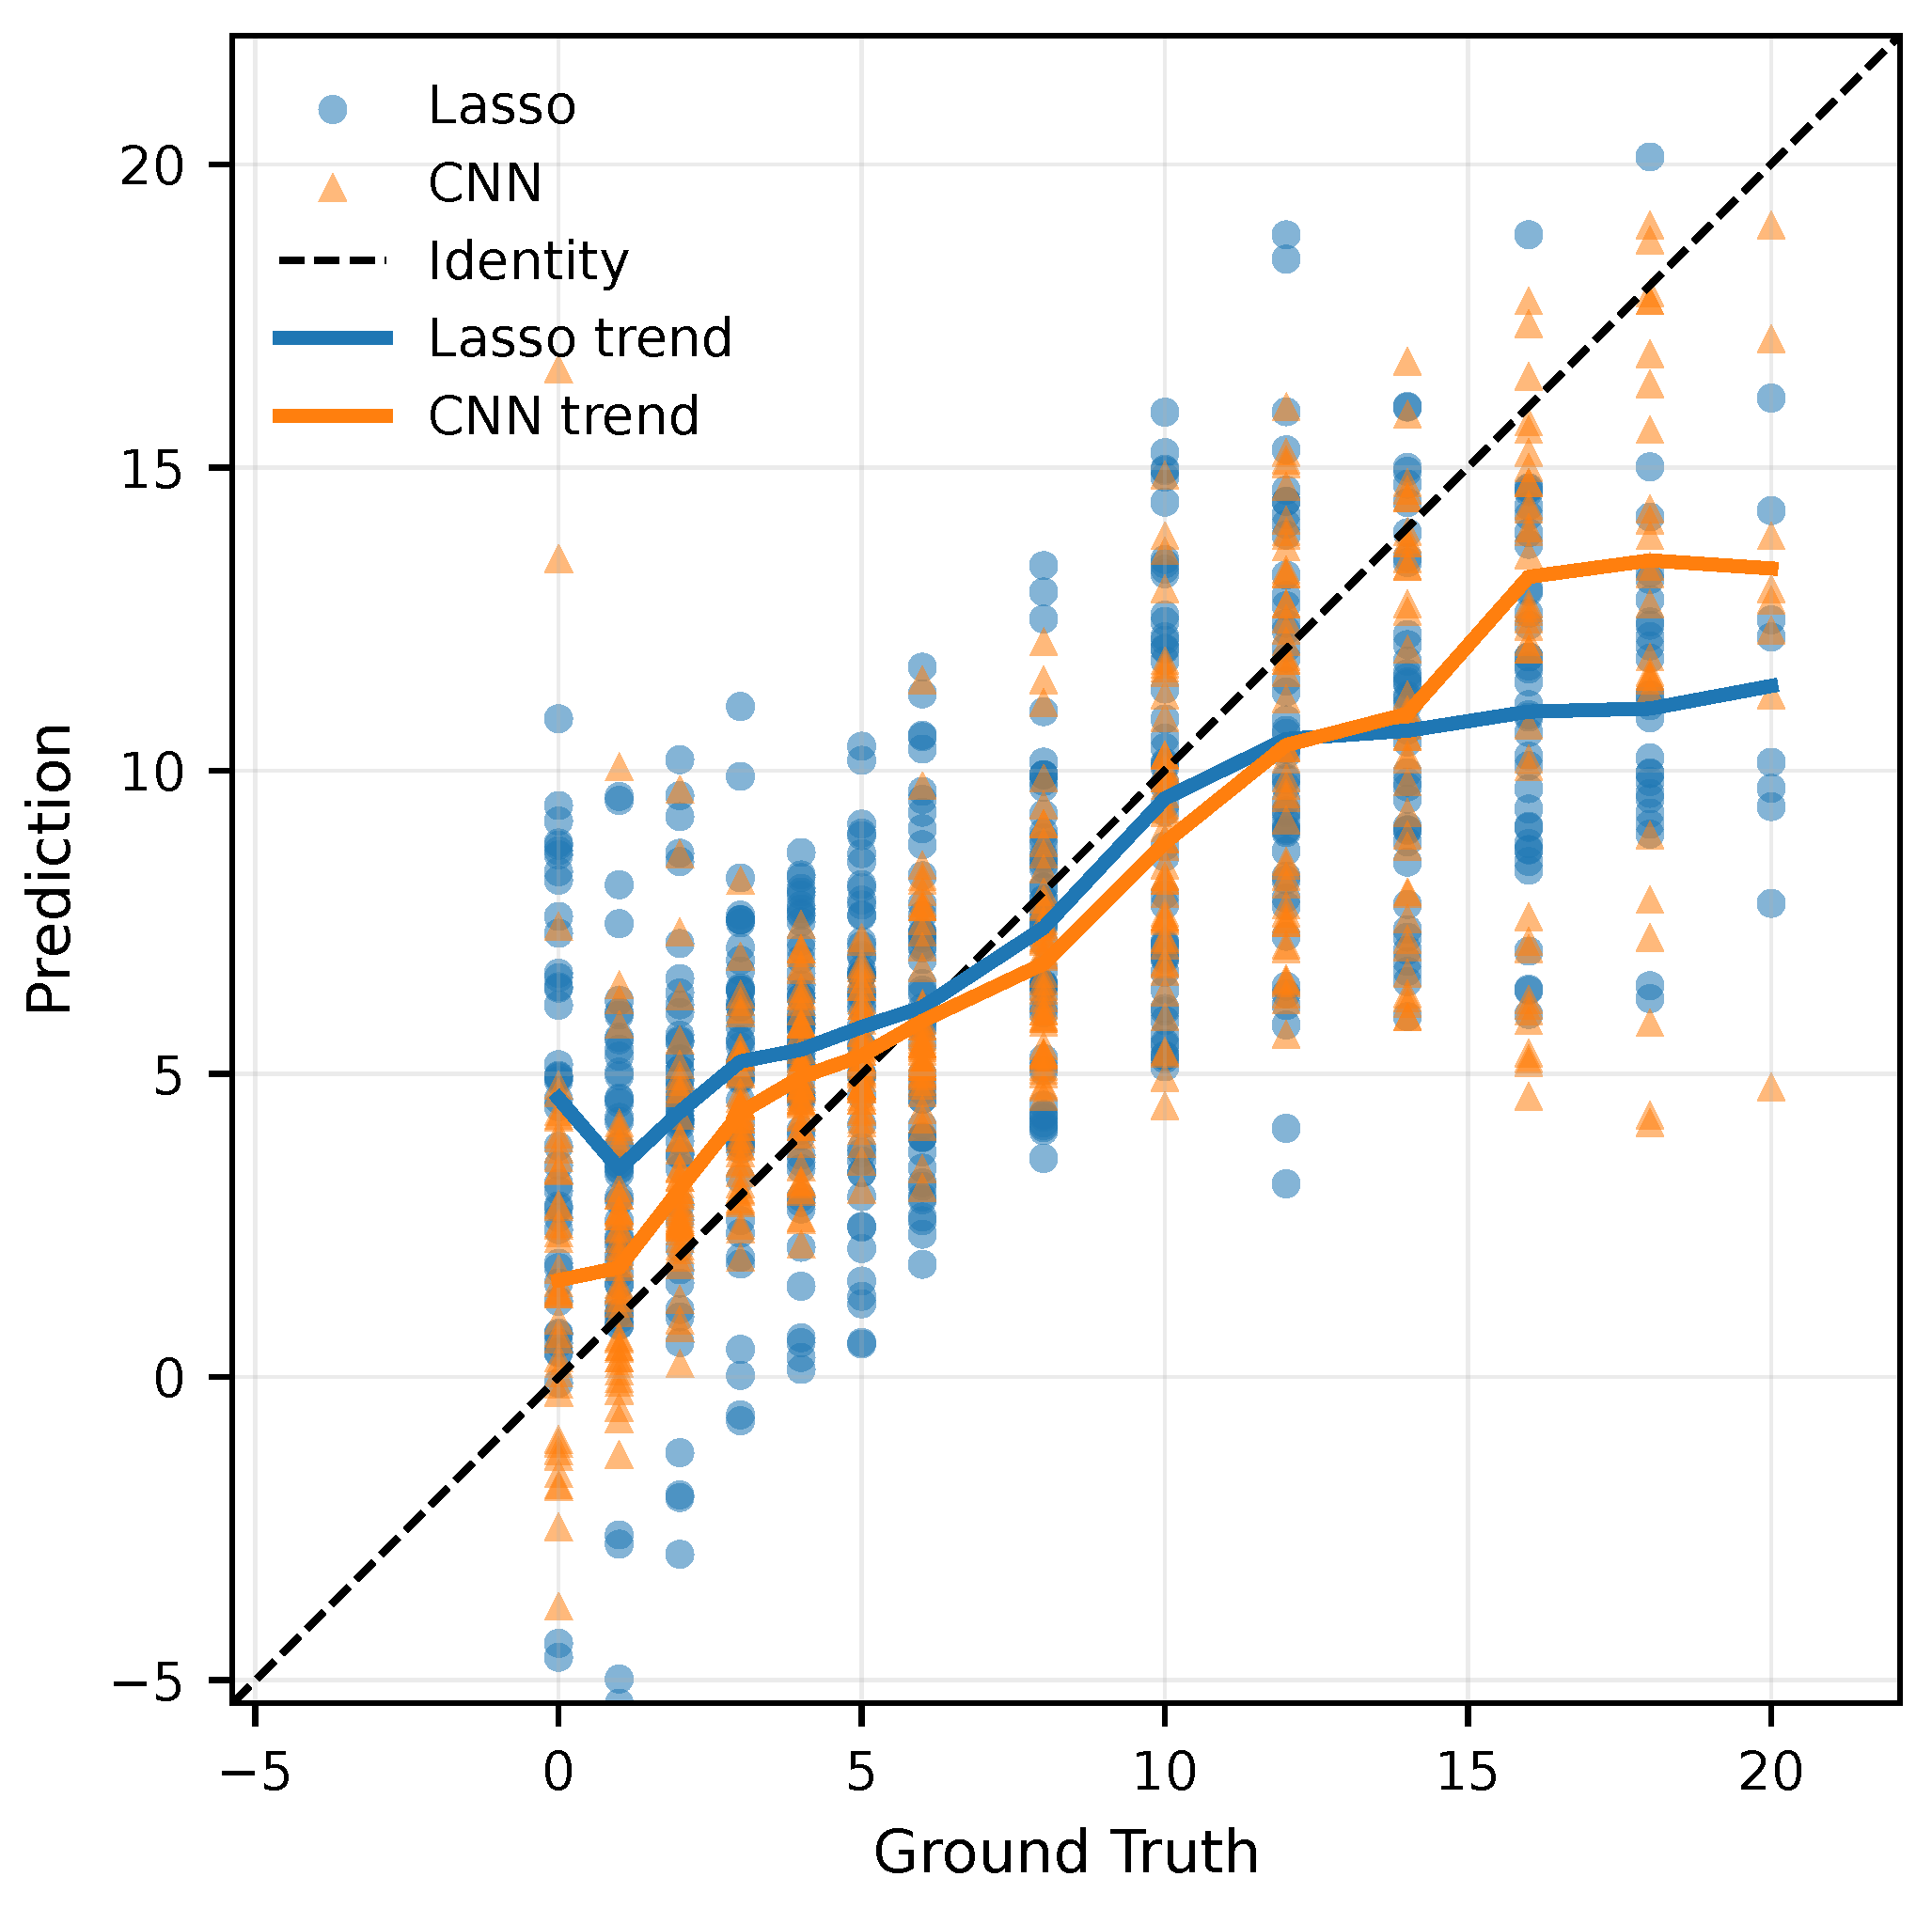
Figure 6.
Absolute prediction errors for RGB, RGB+hemoglobin (6ch), full-band, and Top-20 configurations across the three hematoma-healing stages (Section 2.5).
Figure 6.
Absolute prediction errors for RGB, RGB+hemoglobin (6ch), full-band, and Top-20 configurations across the three hematoma-healing stages (Section 2.5).
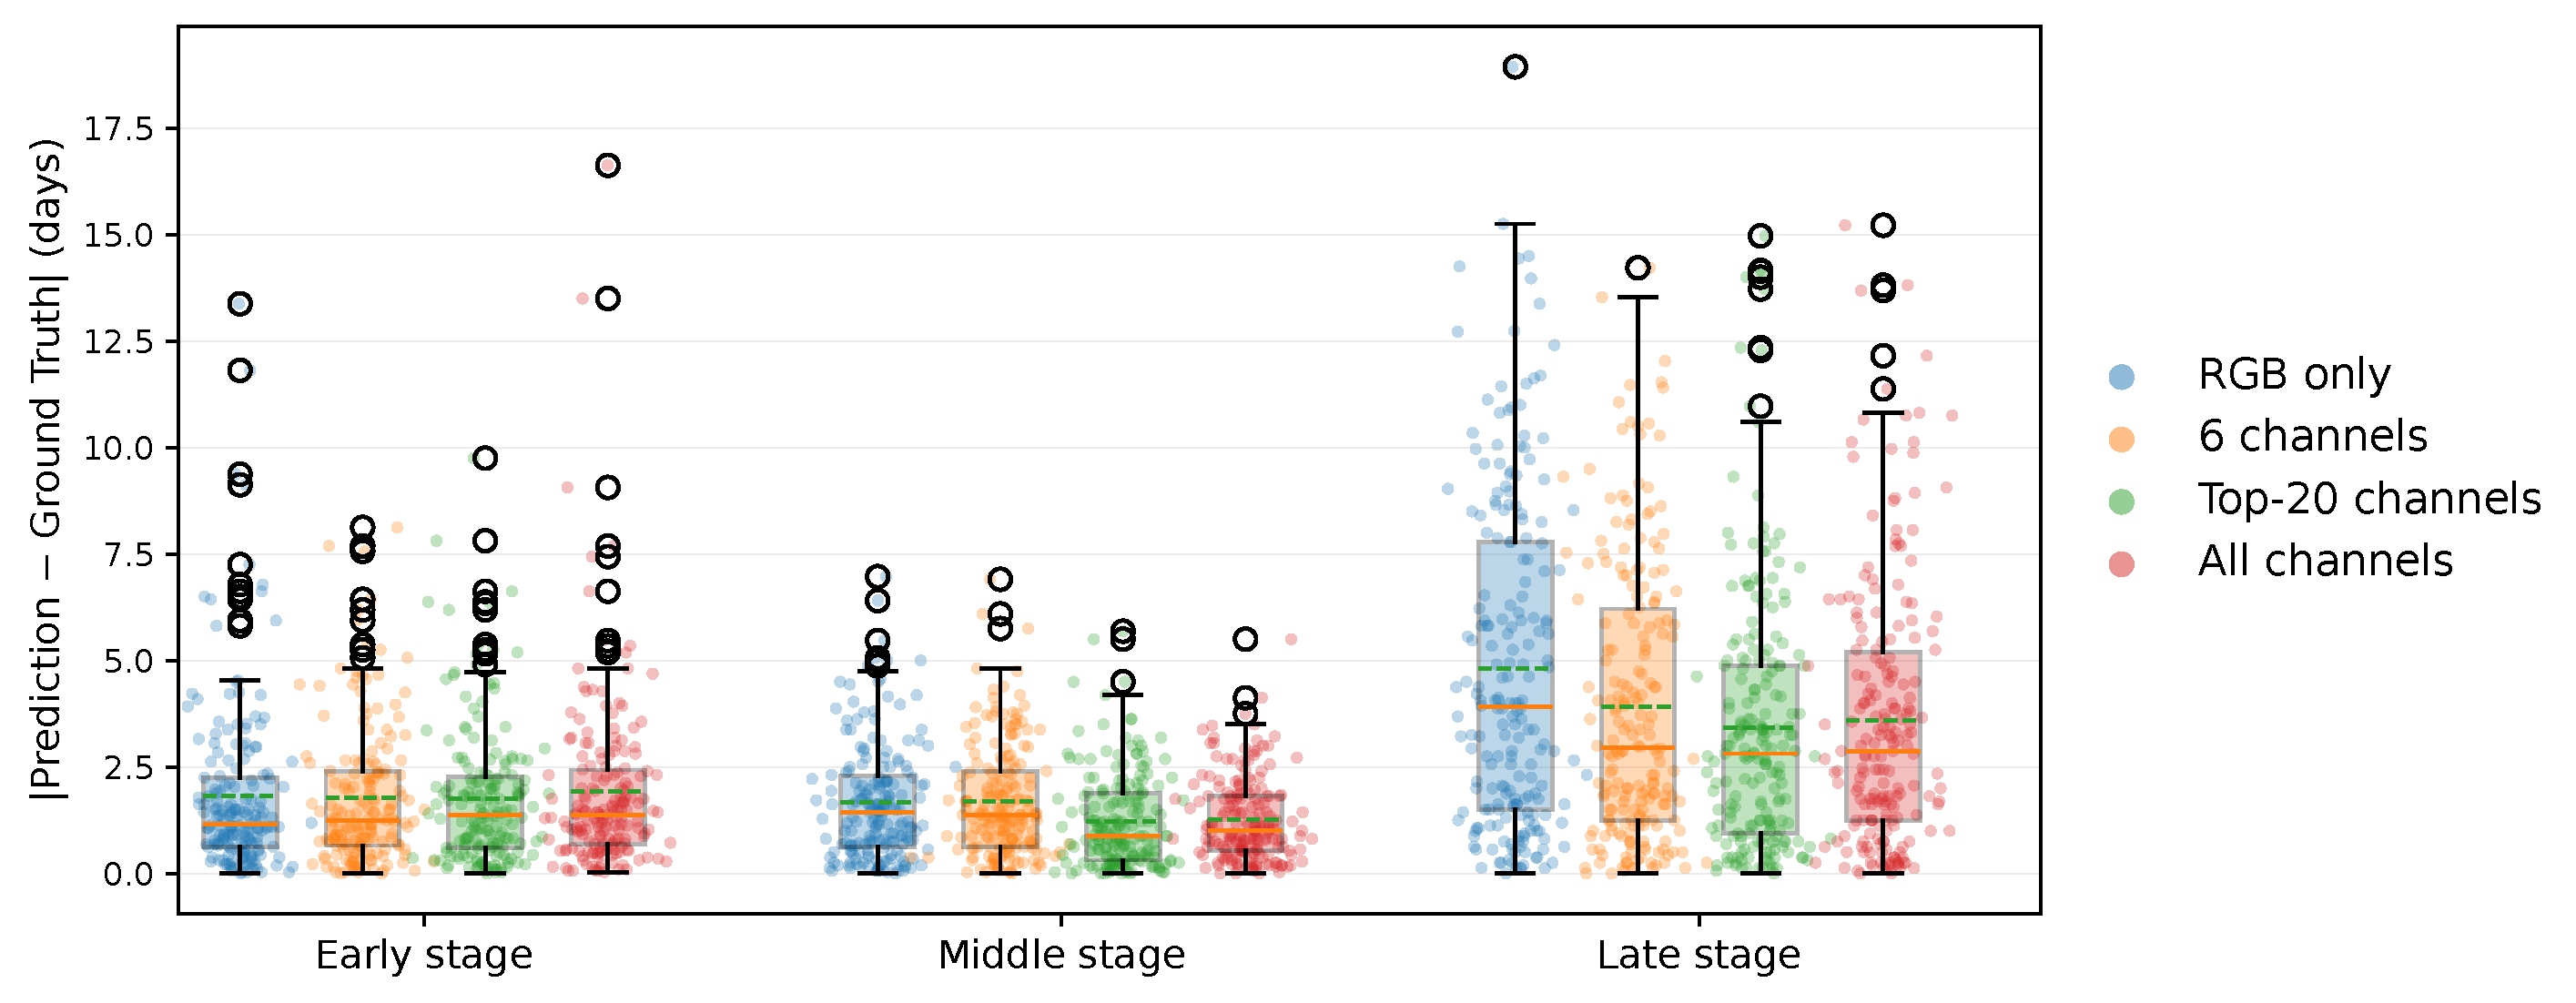
Figure 7.
Consensus band-importance spectrum derived from SmoothGrad and occlusion sensitivity, highlighting the Top-20 selected bands (red).
Figure 7.
Consensus band-importance spectrum derived from SmoothGrad and occlusion sensitivity, highlighting the Top-20 selected bands (red).
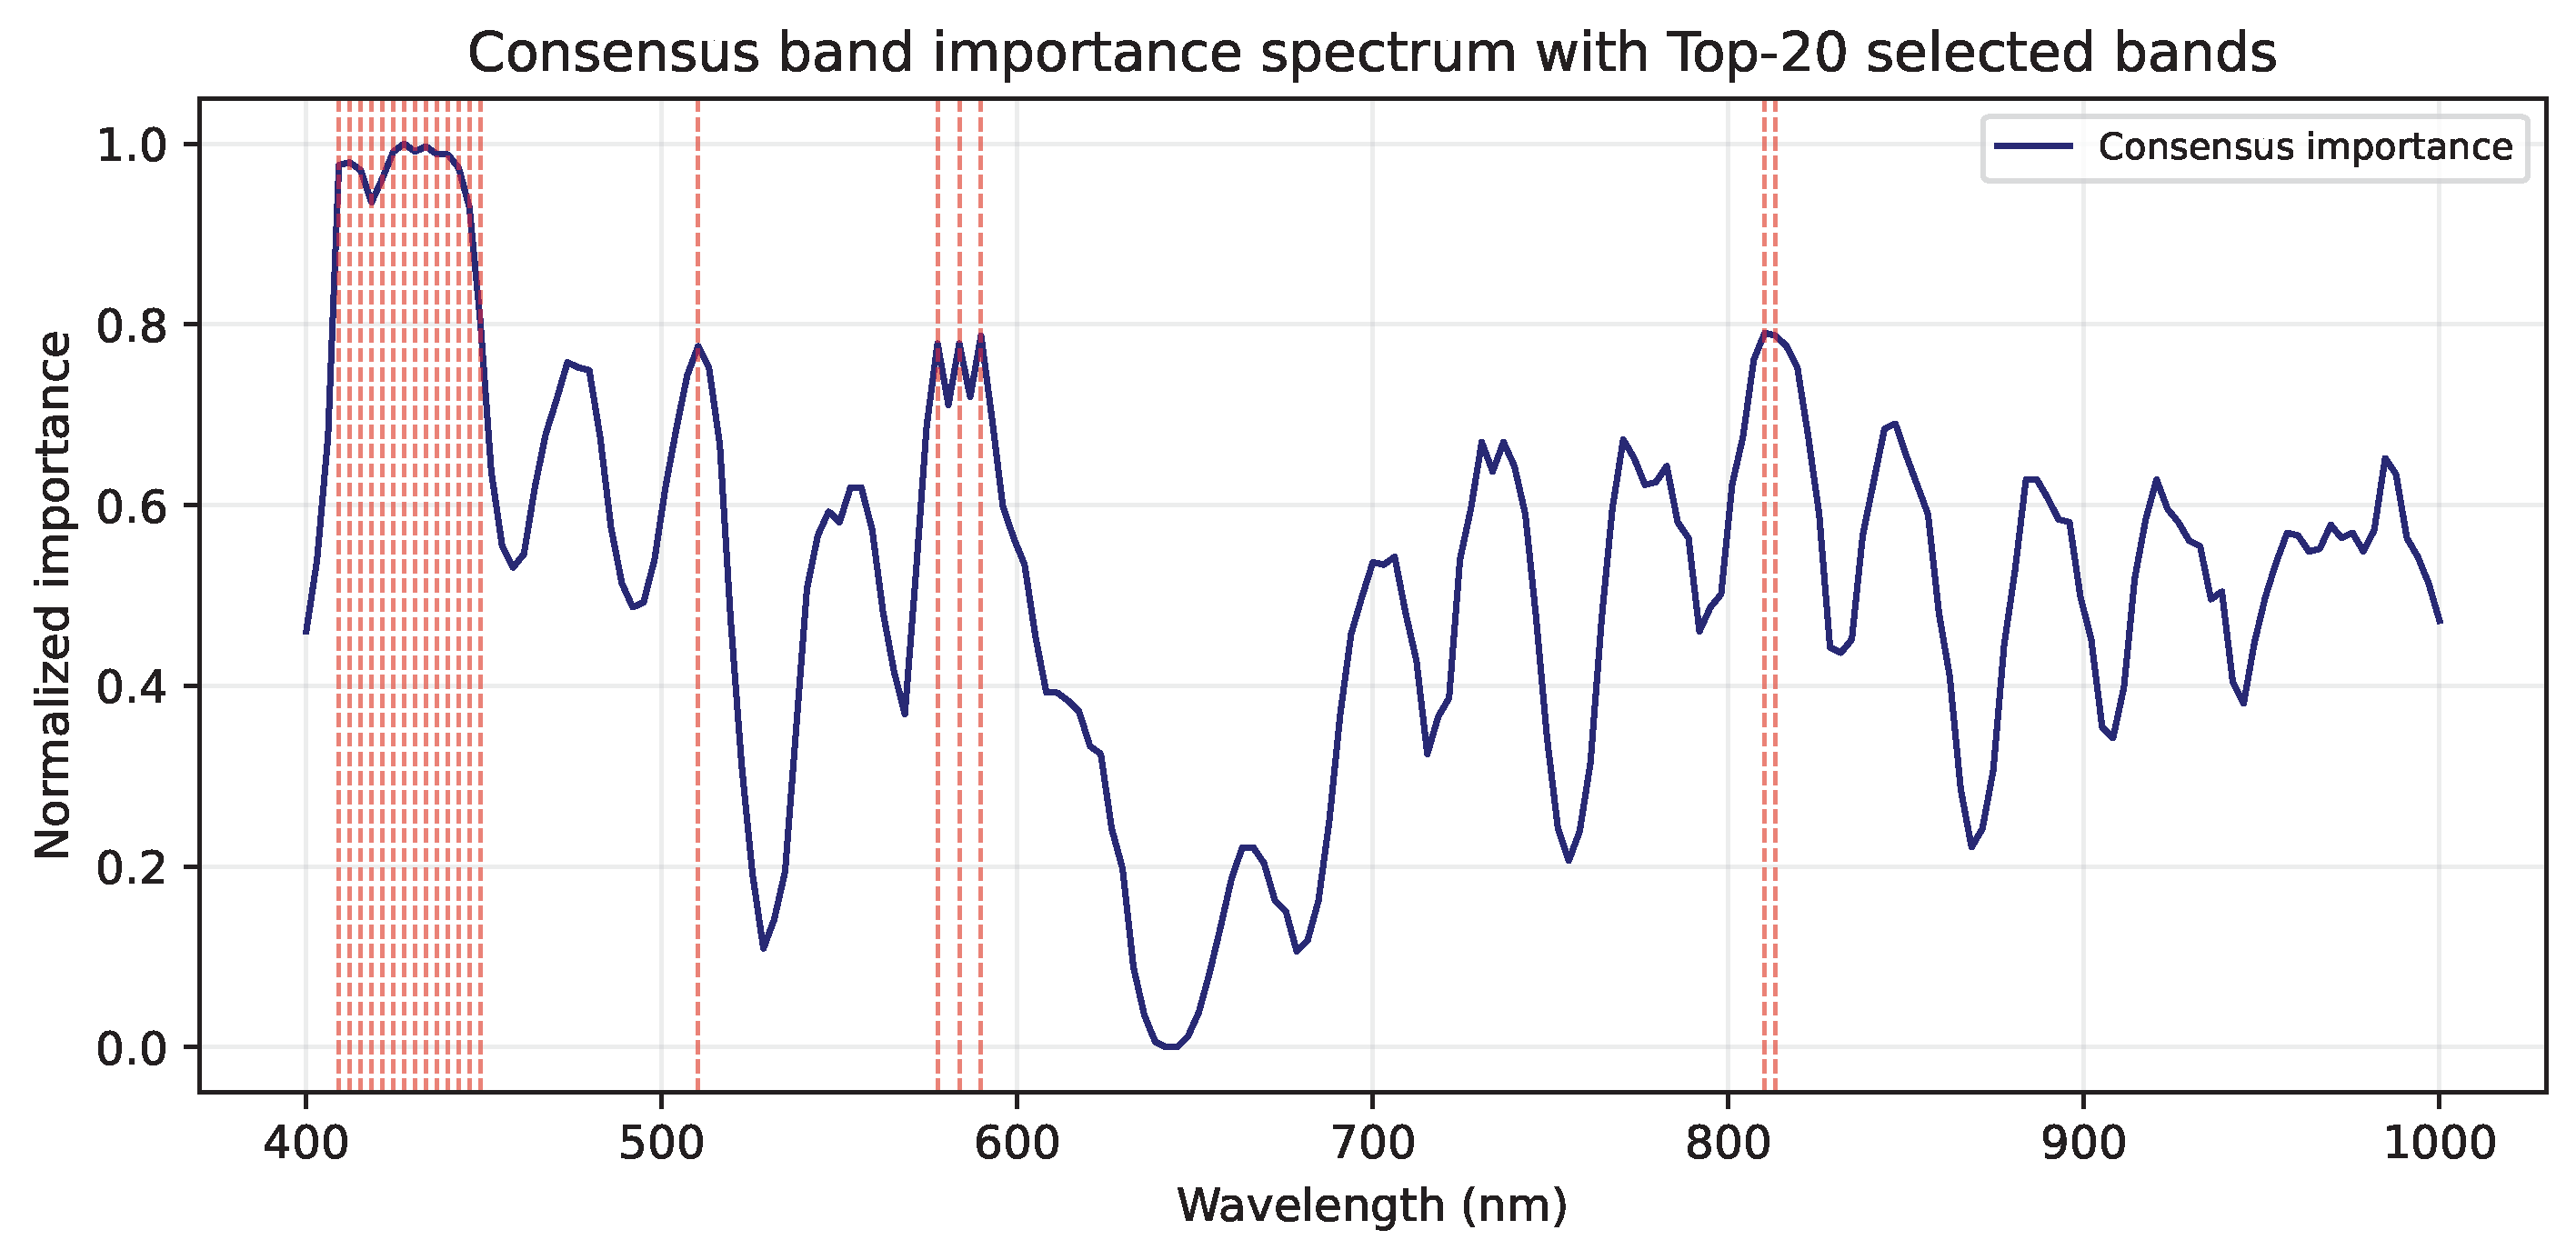

Table 1.
Quantitative performance comparison between the baseline and proposed models using LOSO cross-validation.
Table 1.
Quantitative performance comparison between the baseline and proposed models using LOSO cross-validation.
| Model | MAE [days] | RMSE [days] | Acc@1d [%] | Acc@2d [%] | Acc@3d [%] | |
|---|---|---|---|---|---|---|
| Baseline (Lasso) | ||||||
| Proposed CNN |
Values are reported as mean over 25 LOSO folds. Acc@Xd indicates the percentage of predictions within ±X days of the ground truth.
Disclaimer/Publisher’s Note: The statements, opinions and data contained in all publications are solely those of the individual author(s) and contributor(s) and not of MDPI and/or the editor(s). MDPI and/or the editor(s) disclaim responsibility for any injury to people or property resulting from any ideas, methods, instructions or products referred to in the content. |
© 2025 by the authors. Licensee MDPI, Basel, Switzerland. This article is an open access article distributed under the terms and conditions of the Creative Commons Attribution (CC BY) license (http://creativecommons.org/licenses/by/4.0/).
Copyright: This open access article is published under a Creative Commons CC BY 4.0 license, which permit the free download, distribution, and reuse, provided that the author and preprint are cited in any reuse.


