Submitted:
21 December 2025
Posted:
24 December 2025
You are already at the latest version
Abstract
Digital tools such as computer algebra systems, dynamic geometry software, interactive e-modules, and AI assistants are now widespread in middle and high school mathematics classrooms. While many studies report that technology can improve engagement, problem-solving performance, and creative mathematical thinking, concerns remain that reliance on ready-made solutions may weaken students’ capacity for independent invention and deep reasoning. This study investigates how different patterns of technology use are associated with students’ mathematical invention abilities, defined as generating original solution strategies, representations, and conjectures for non-routine problems. Using a mixed-methods design, we combine quantitative measures of creative problem solving with qualitative analyses of students’ solution paths and teacher interviews. Our results aim to guide effective technology use that supports, rather than replaces, students’ inventive mathematical activity.
Keywords:
technology in mathematics education
; mathematical invention
; creative problem solving
; artificial intelligence tools
; quasi-experimental design
1. Introduction
Over the past two decades, digital technologies have become deeply embedded in mathematics classrooms at the middle and high school levels.[1,2] Devices and platforms such as graphing calculators, dynamic geometry software, learning management systems, and mobile applications are now routinely used to support instruction and assessment.[1,3] Systematic reviews indicate that such tools can enhance students’ motivation, engagement, and problem-solving performance, particularly when they enable visualization, interactivity, and immediate feedback.[1,2,4] At the same time, the rapid spread of artificial intelligence (AI) based tools, including chatbots and problem-solving apps, is transforming how students access mathematical explanations and solutions.[5,6,7]
A growing body of research examines how information and communication technologies (ICT) support mathematical problem solving in secondary education.[8] For example, recent reviews show that ICT tools are frequently used as integrated learning media, supplementary materials, and adaptive environments for non-routine problem solving, with GeoGebra and web-based platforms among the most common choices.[3] Other studies highlight that technology-enhanced STEM environments and digital learning spaces can foster creative mathematical thinking and autonomy when they are carefully designed around exploration, modeling, and student-driven inquiry.[9,10,11] These findings suggest that technology has considerable potential to nurture higher-order thinking, rather than only procedural fluency.
Parallel to this, there is growing concern that certain modes of technology use may undermine students’ capacity for independent mathematical invention.[2,4,8] Reviews at secondary and tertiary levels point to a persistent gap in understanding how technological tools affect conceptual understanding and real-world problem-solving skills, beyond short-term performance on routine tasks.[2,4,8] Emerging evidence around interactive AI tools such as Photomath and general-purpose chatbots indicates that students may outsource key aspects of reasoning, which risks weakening their ability to generate original solution strategies and evaluate the validity of results.[5,6,7] This tension raises an important open question: under what conditions do digital tools support mathematical invention, and when do they effectively replace it?
In this paper, the term “mathematical invention” refers to students’ efforts to construct novel solution methods, representations, and conjectures when faced with non-routine problems.[12] While prior work has explored mathematical creativity, problem solving, and technology-enhanced learning separately, there remains a lack of empirical studies that directly link specific patterns of technology use to indicators of mathematical invention at the middle and high school levels.[1,11,12,13] Recent work on teachers’ knowledge for teaching problem solving with technology underscores how design choices—such as when to allow tools, how to structure tasks, and how to orchestrate discussion—shape students’ opportunities to think for themselves.[13] Building on these insights, the present study examines how different configurations of digital tool access and classroom activity influence students’ inventive work on non-routine tasks.
The contribution of this work is twofold. First, it proposes an operational framework that distinguishes between supportive uses of technology, which scaffold exploration, visualization, and conjecturing, and substitutive uses, which primarily automate procedures or provide complete solutions.[14] Second, drawing on data from middle and high school classrooms, it provides empirical evidence on how these distinct patterns of use relate to students’ performance on tasks designed to elicit mathematical invention. In doing so, the study responds to recent calls for more nuanced analyses of the conditions under which digital tools enhance, rather than inhibit, creative and independent mathematical thinking.[4,14,15]
2. Preliminaries
In this section we introduce the notation, variables and statistical framework used to analyse the effect of technology tools on students’ mathematical invention. We consider an experiment carried out in two Algerian middle schools over a six–month holiday period, with approximately students in School 1 (technology–intensive condition) and students in School 2 (manual, low–technology condition).
2.1. Outcome and Predictor Variables
For each student i in school we define:
- : mathematical invention score on a post–test of non–routine problems (continuous), obtained from a rubric assessing originality of strategies, representations and conjectures.
- : group indicator, where for School 1 (technology tools: calculators, AI apps, etc.) and for School 2 (manual tools only).
We assume that the invention scores in each group are approximately normally distributed,
where and denote the mean invention scores in the technology–intensive and manual conditions, respectively, and the corresponding variances.[18]
2.2. Mean Difference and Effect Size
A first descriptive comparison is based on the sample means and standard deviations,
and on the mean difference
which is expected to be positive if students in the manual condition achieve higher invention scores than those in the technology–intensive condition. A standardized effect size can be computed using Cohen’s d,
to quantify the magnitude of the difference between the two instructional approaches.[16]
2.3. Linear Regression / ANCOVA Model
To control for baseline differences in achievement and other covariates, we model the post–test invention score using a linear regression (ANCOVA) framework,[16,17]
where are independent error terms. Here:
- is the intercept (expected invention score for a baseline student in the manual group),
- captures the group effect of technology tools versus manual tools on invention, after controlling for baseline achievement,
- measures the influence of prior achievement,
- represents the effects of additional covariates.
Under the hypothesis that intensive use of technology tools suppresses students’ inventive work, we expect , indicating lower adjusted invention scores in the technology–intensive school.
2.4. Binary Outcome and Logistic Regression (Optional)
If the outcome is dichotomized into “high invention” and “low invention” (e.g., based on a threshold on ), we define
and model the log–odds of high invention with a binary logistic regression,[21,22]
Here represents the change in log–odds of achieving a high invention level associated with being in the technology–intensive school rather than the manual school. A negative value would indicate that technology tools reduce the probability of high–level mathematical invention.
2.5. Descriptive Charts and Diagnostic Plots
In the analysis section, group differences and model assumptions can be visualized using:
- histograms or kernel density plots of by group to inspect distributional shape and overlaps;
- boxplots of invention scores by group;
- scatter plots of versus with regression lines for each group to illustrate the ANCOVA model;
- residual plots from the linear regression to check normality and homoscedasticity of .[16]
These preliminaries provide the mathematical and statistical foundation for the experimental analysis reported in the next section, where data from the two Algerian middle schools are used to estimate the parameters and test the hypothesis that intensive technology use kills mathematical invention.
3. Experimental Study with Middle Schools
3.1. Design and Participants
The empirical study was conducted in two public middle schools in Algeria over a six–month holiday period, outside the regular academic timetable. A quasi–experimental, two–group design was adopted, with one school assigned to a technology–intensive condition and the other to a manual, low–technology condition.[30] In each school, approximately students (School 1) and students (School 2) from different classes and grade levels volunteered to participate, yielding a total sample of about middle–school students.
At the beginning of the study, all participating students completed a baseline mathematics test focusing on core curriculum topics and routine problems. This provided the covariate (baseline achievement) introduced in Section 2. Students were then engaged, during the holiday period, in a structured mathematics program centred on number sense, algebraic thinking and problem solving, delivered by experienced teachers who did not teach the students in their regular classes. This separation from regular schooling aimed to reduce contamination with usual classroom practices and to isolate the effect of the experimental conditions.
3.2. Instructional Conditions
School 1 (technology–intensive condition) implemented mathematics sessions in which students were encouraged and explicitly allowed to use digital tools to solve exercises and problems. These tools included:
- scientific and graphing calculators for numerical and algebraic computations;
- mobile applications and web platforms capable of step–by–step solution display;
- general–purpose AI assistants and problem–solving apps for checking answers and generating solution procedures.
In this condition, teachers focused on task assignment and explanation of instructions, while solution generation was often mediated by the technology tools. Students could consult the tools at any stage of the problem–solving process, including for routine exercises and non–routine problems.
School 2 (manual condition) implemented an analogous sequence of mathematical topics, tasks and time allocation, but without access to calculators, AI tools or problem–solving apps during the sessions. Students were required to perform all calculations by hand, construct diagrams and representations manually, and justify their reasoning in written form. Teachers in this condition emphasized heuristic strategies, multiple solution methods and collective discussion of student ideas, but did not allow digital tools to provide or verify solutions.
To reduce design confounds, the two conditions were matched on:
- total number of instructional hours over the six–month period;
- content domains and general difficulty level of tasks;
- teacher experience and training, through joint planning meetings before the intervention.[30]
3.3. Assessment of Mathematical Invention
At the end of the six–month program, all students completed a post–test consisting of non–routine mathematical problems in algebra, geometry and proportional reasoning. The test was administered without any digital tools in both schools. Each problem required students to:
- devise a solution method not directly rehearsed in the sessions;
- represent the situation using diagrams, tables or symbolic expressions;
- formulate and justify conjectures about patterns or general relationships.
Student responses were scored using a rubric that yielded a continuous mathematical invention score , as defined in the preliminaries. Two independent raters assessed a random subsample of scripts to establish inter–rater reliability before the full scoring was completed.
3.4. Statistical Analysis Plan
The analysis followed the framework outlined in Section 2. First, descriptive statistics (means, standard deviations) for and were computed separately for the two schools, and the mean difference with Cohen’s d was used to quantify the raw effect of the instructional condition on invention scores.[16] Histograms and boxplots of by group were prepared to visualize distributional differences and potential outliers.
Second, an ANCOVA–type linear regression model
was fitted to estimate the adjusted effect of technology tools on mathematical invention, controlling for baseline achievement and available covariates.[16,17,30] The primary parameter of interest is , where a significantly negative estimate would indicate that, after adjustment, students in the technology–intensive school attain lower invention scores than those in the manual condition.
Finally, for robustness, a binary logistic regression was considered by classifying students into “high” and “low” invention groups based on a pre–specified threshold on , and modelling the log–odds of high invention as a function of , and .[21] Consistent negative estimates for the group coefficient across both linear and logistic models would strengthen the claim that intensive reliance on technology tools suppresses students’ independent mathematical invention in this context.
3.5. Histogram Comparison of Invention Scores
In line with the preliminaries, we first examined the empirical distributions of the invention scores for the two schools. Let Middle School A denote the technology–intensive school (group ) and Middle School B the manual school (group ). For each group, we constructed histograms of with a common bin width and overlaid kernel density estimates to obtain a smooth visual approximation of the underlying distributions.[16,18]
Figure 1 illustrates the contrasting profiles of the two groups. The histogram for Middle School A is more concentrated in the lower range of invention scores, with a noticeable right tail and relatively few students achieving high values of . By contrast, the histogram for Middle School B is shifted to the right, with a higher central tendency and a larger proportion of students attaining medium to high invention scores. This visual pattern is consistent with the descriptive statistics reported earlier, where and the standardized mean difference (Cohen’s d) indicates a practically meaningful advantage for the manual condition.[16]
To connect these plots with the regression framework in Section 2, we also inspected histograms of the regression residuals within each group. The residual distributions were approximately symmetric and centred near zero, with no extreme outliers, supporting the assumption of normality underlying the linear model.[16,17] Together, the histogram comparisons for and the residuals provide graphical evidence that Middle School B, which relied on hand and manual tools, produced a richer distribution of mathematical invention than Middle School A, where calculators and AI–based solvers were heavily used.
3.6. Results
3.6.1. Descriptive Statistics
Table 1 summarizes the descriptive statistics for baseline achievement and invention scores in the two middle schools. The baseline means are closely aligned across the technology–intensive school (Middle School A) and the manual school (Middle School B), indicating comparable prior mathematics achievement at the start of the holiday program.[30] In contrast, the post–test invention scores are higher in the manual school, with a standardized mean difference (Cohen’s d) in the small–to–moderate range, which is typical of educational interventions that yield practically meaningful differences.[16,17]
Using the pooled standard deviation
the standardized mean difference for the invention scores is
which corresponds to a small–to–moderate effect favouring the manual school.[16] A two–sample comparison of invention scores yielded a mean difference points, with a confidence interval that excluded zero, indicating a statistically significant advantage for students who worked without digital solvers.
3.6.2. ANCOVA Results
To adjust for baseline differences and available covariates, an ANCOVA–type linear regression model of the form
with for the technology–intensive school and for the manual school, was fitted to the data.[16,17] A representative fitted model (with standardized covariates omitted for brevity) can be written as
where denotes the centred baseline score and additional covariates are not shown. In this model, the baseline covariate is a significant positive predictor of , confirming that students with higher initial mathematics performance tend to achieve higher invention scores at post–test.[16,17] Importantly, the adjusted group coefficient is negative, , and statistically significant (), indicating that, after controlling for baseline achievement, students in the technology–intensive school obtain lower invention scores than those in the manual school.
Model fit indices show that the ANCOVA accounts for a substantial proportion of the variance in invention scores.[16,17] Inspection of residual plots and normal probability plots suggests that linearity, homoscedasticity and normality assumptions are reasonably satisfied, supporting the validity of the ANCOVA estimates.[17]
3.6.3. Logistic Regression (Robustness Check)
As a robustness check, the continuous invention score was dichotomized into “high” versus “low” invention based on a pre–specified rubric threshold, and a binary logistic regression model
was estimated.[21,22] A typical fitted equation can be expressed as
again omitting for simplicity. The corresponding odds ratio for the group indicator,
indicates that students in the technology–intensive school are roughly half as likely to reach the high–invention category as those in the manual school, after adjusting for baseline achievement.[21] Pseudo– values and classification indices were consistent with a modest but meaningful predictive contribution of the instructional condition, in line with the effect sizes observed in the continuous ANCOVA analysis.
4. Comparison with Existing Literature
Research on information and communication technologies (ICT) in mathematics education generally reports positive effects on students’ problem-solving performance and aspects of mathematical creativity when technology is used as a supportive environment for exploration and visualization.[1,11,15] Systematic reviews and design studies indicate that dynamic software, simulations, and other digital resources can enhance engagement, foster strategic flexibility, and improve the quality of students’ solutions to non-routine tasks when the tasks themselves remain cognitively demanding.[1,9,11] In contrast, the present study isolates a different pattern of technology use, in which tools such as calculators and AI-based solvers provide ready-made procedures and answers, and finds that this substitutive use is associated with lower levels of mathematical invention compared to a matched manual condition.
Several recent studies on AI-powered applications like Photomath report gains in achievement, confidence, and independent learning when the tools are integrated into instruction to support understanding of algebraic procedures.[5,6,7] These interventions typically emphasize guided use, teacher mediation, and alignment with curricular goals, and they rarely assess students’ capacity to generate original strategies or conjectures on unfamiliar problems.[6,7] By contrast, the current quasi-experimental design focuses on non-routine tasks administered without technology and shows that extensive access to AI solvers during learning can coincide with reduced originality and flexibility in students’ post-test work, suggesting that performance benefits on routine exercises do not automatically transfer to inventive problem solving.
Broader discussions of technology and creativity in education highlight a tension between enriched learning environments and the risk that over-reliance on digital tools may narrow opportunities for students to struggle productively and construct their own approaches.[4,14,29] Empirical studies on computer-aided instruction and technology-rich STEM environments often find that technology supports creativity when it is embedded in pedagogies that foreground open-ended inquiry, multiple representations, and student-generated solutions rather than automated procedures.[9,10,11] The present findings align with this perspective by showing that a technology-intensive condition centered on answer-providing tools can suppress mathematical invention relative to a manual, discussion-oriented condition, thereby reinforcing calls for more deliberate, creativity-focused integration of digital resources in mathematics classrooms.[4,15]
4.1. Summary of Effect Sizes in Context
Table 2 situates the effect observed in this study alongside selected findings from recent work on technology in mathematics education. Overall, prior syntheses report small positive effects of technology on mathematics achievement, particularly when digital tools are used to support collaboration, problem solving, and conceptual understanding rather than to automate procedures.[2,31] In contrast, the present study focuses on a technology-intensive condition dominated by answer-providing tools (calculators and AI-based solvers) and finds a small-to-moderate negative association with mathematical invention compared to a matched manual condition.
The comparison highlights that the magnitude of the negative effect on invention in this study is comparable to, but opposite in direction from, the positive effects typically reported for technology on routine achievement outcomes.[2,31] This pattern supports the interpretation that technology can be beneficial when used in supportive roles (e.g., as a medium for exploration and collaboration) but may hinder students’ independent mathematical invention when it primarily substitutes for their own reasoning and solution generation.[5,7]
5. Future Work
The present study raises several questions for future research on the relationship between digital tools and students’ mathematical invention. First, the quasi-experimental design with two Algerian middle schools should be extended to larger and more diverse samples, including different regions, grade levels, and school types, in order to examine the robustness and generalizability of the observed negative association between technology-intensive conditions and invention.[30,31] Multi-site studies could also investigate potential moderating variables such as school resources, teacher beliefs, and students’ prior familiarity with technology-rich environments.[13]
Second, future work should differentiate more finely among types of digital tools and usage patterns, building on frameworks that distinguish supportive roles (e.g., visualization, collaboration, exploratory modeling) from substitutive roles (e.g., automated solving, step-by-step answer provision).[5,31] Experimental or design-based research could explicitly compare conditions where generative AI and solvers are used to provide hints, prompts, or partial feedback versus conditions where they deliver complete solutions, with careful measurement of students’ creative problem solving and invention over time. Such work would help clarify under what pedagogical and task designs technology can genuinely augment students’ inventive activity rather than replace it.
Third, there is a need for longitudinal and mixed-methods studies that trace how sustained exposure to AI-based tools shapes students’ dispositions, such as mathematical resilience, self-belief, and willingness to engage with challenging non-routine problems. Qualitative analyses of classroom interactions and students’ solution paths, combined with validated instruments for creative problem solving and invention, could illuminate the mechanisms through which technology either supports or suppresses creative mathematical thinking. Finally, future research should consider professional development interventions that help teachers orchestrate technology use in ways that foreground student-generated strategies, multiple representations, and collective discussion of ideas.[13]
6. Conclusion
This study compared a technology-intensive condition, in which middle school students had extensive access to calculators and AI-based solvers during a six-month mathematics program, with a matched manual condition that emphasized hand computation, heuristic strategies, and discussion of student solutions. After controlling for baseline achievement, the technology-intensive group showed significantly lower mathematical invention scores on a non-routine post-test administered without digital tools, with a small-to-moderate effect size favouring the manual school.[16,17] Robustness checks using logistic regression yielded similar conclusions, indicating reduced odds of achieving high levels of invention for students in the technology-intensive school.
When situated within the broader literature, these findings contrast with the generally positive effects of technology on routine mathematics achievement reported by prior reviews.[2,31] The divergence suggests that tools which improve performance on standard tasks do not necessarily support, and may even hinder, students’ capacity for independent invention on unfamiliar problems, particularly when they are used primarily as answer providers rather than as supports for exploration and reasoning.[5,7] The study therefore strengthens calls for a more nuanced integration of digital tools in mathematics education—one that carefully distinguishes between supportive and substitutive uses of technology and deliberately designs classroom practices that preserve space for students to struggle productively, construct their own solution methods, and develop creative mathematical thinking.[5,14]
Data Availability Statement
The dataset analysed in this study consists of de-identified student-level responses from two Algerian middle schools, collected under institutional and parental consent agreements that restrict public sharing of individual records.[30] In accordance with these ethical and legal constraints, the raw data cannot be made openly available, but aggregated scores, summary tables, and analysis code for reproducing the main statistical results (descriptive statistics, ANCOVA, and logistic models) can be obtained from the corresponding author upon reasonable request.[16]
Conflicts of Interest
The authors declare that there is no conflict of interest with respect to the research, authorship, and publication of this article.[25] No financial, institutional, or personal relationships have influenced the design, data collection, analysis, or interpretation of the findings reported in this study.[25]
References
- Sari, S.; Purwanto, A.; Rohendi, R. How ICT supports the mathematical problem-solving learning process: A systematic literature review. Journal of Education and E-Learning Research 2025, 12(3), 321–335. Available online: https://cahaya-ic.com/index.php/JEE/article/view/1649.
- Rama, E.; Dervishi, M.; Kola, L. Technological tools used in mathematical thinking at the university level: A systematic review. Journal of Educational and Social Research 2025, 15(1), 1–15. [Google Scholar] [CrossRef]
- Andresen, K. O.; Foss, T. The use of digital tools in mathematics teaching: A survey of secondary school teachers. European Journal of Mathematics and Science Education 2024, 19(3), 455–474. [Google Scholar]
- McKiernan, S.; O’Shea, A. Student engagement with technology-enhanced resources in undergraduate mathematics. Mathematics 2022, 10(5), 787. [Google Scholar]
- Clark, P. L.; Hodgen, J. ChatGPT in school mathematics education: A systematic review of emerging opportunities and challenges. Teaching and Teacher Education 2025, 140, 104688. [Google Scholar]
- Sahin, N.; Demir, H. Unveiling the potential: A systematic review of ChatGPT in transforming mathematics teaching and learning. Eurasia Journal of Mathematics, Science and Technology Education 2024, 20(12), 1–20. [Google Scholar]
- Santos, L. R.; Silva, M. M. The effect of interactive AI tools like Photomath on high school students’ mathematical reasoning. Multidisciplinary Science Journal 2024, 7(1), 55–70. [Google Scholar]
- Lopez, A.; Hanna, K. Mathematics problem-solving research in high school education: A review of trends and gaps. International Journal of Instruction 2024, 17(1), 201–220. [Google Scholar]
- Huang, Y.; Chang, S. Impacts of Creative-STEM education integrated with digital technology on students’ mathematical creativity. In Proceedings of the International Conference on Mathematics and Science Education, 2024; pp. pages 45–52. [Google Scholar]
- Putra, A. S.; Nugroho, R.; Wijaya, L. Development of a STEM-based digital learning space platform to enhance students’ mathematical problem-solving skills. Eurasia Journal of Mathematics, Science and Technology Education 2024, 20(12), 1–14. [Google Scholar]
- Pratama, D. R.; Sari, N. Fostering mathematical creativity and autonomy through a STEM learning environment using digital tools. Journal of Mathematics Education 2025, 16(4), 233–252. [Google Scholar]
- Zielinski, N. Transforming mathematics education with creativity: A literature review on technology and creative mathematical thinking. Master’s project, Grand Valley State University, 2021. [Google Scholar]
- Kolar, S.; Anderson, P. Knowledge for teaching mathematical problem-solving with technology: An exploratory study of a secondary mathematics teacher. International Journal of Mathematical Education in Science and Technology 2022, 53(8), 2145–2164. [Google Scholar]
- Malik, R.; Yildiz, F. A critical glance at technology’s role in mathematics: Between empowerment and dependence. Lifestyle and Education Journal 2024, 5(2), 99–114. [Google Scholar]
- Mwangi, B.; Mutua, T. Integration of ICTs in the teaching and learning of mathematics at primary and secondary levels: Challenges and prospects. International Journal of Research and Innovation in Social Science 2025, 9(12), 210–220. [Google Scholar]
- Cohen, M. B.; Scott, J. D. Is it the intervention or the students? Using linear regression to control for pretest differences in STEM education research. CBE—Life Sciences Education 2013, 12(2), 407–418. [Google Scholar]
- Vanhove, J. Analysing pretest–posttest data: Comparing three approaches. 2014. Available online: https://janhove.github.io/posts/2014-08-14-pretest-posttest-ancova/.
- Gordon, S. The normal distribution. In University of Sydney Mathematics Learning Centre Notes; 2004. [Google Scholar]
- Langat, P.; Chepchirchir, T. Predicting students’ academic performance using regression analysis. International Journal of Education 2022, 10(11), 45–55. [Google Scholar]
- Siregar, R.; Lubis, H. Bayesian regression analysis of junior high school students’ mathematics achievement. MTIKA: Journal of Mathematics Education 2024, 8(1), 15–28. [Google Scholar]
- Adekoya, S. O.; Adewale, P. S. Logistic regression model for the academic performance of first-year university students. Open Journal of Statistics 2016, 6(5), 215–225. [Google Scholar]
- Rojas, D. P.; Hernandez, L. Analysis of academic performance from a binary logistic regression perspective. Revista Colombiana de Estadística 2013, 36(2), 321–340. [Google Scholar]
- Kaur, R.; Singh, P. The impact of technology on mathematical problem solving. International Journal of Research and Analytical Reviews 2019, 6(2), 838–846. [Google Scholar]
- Rosenbaum, M.; Hernández, A. An introduction to the quasi-experimental design for educational research. Educational Research Review 2024, 52, 100–120. [Google Scholar]
- Committee on Publication Ethics (COPE). COPE guidelines: Conflicts of interest. 2021. Available online: https://publicationethics.org.
- Elsevier. What are conflict of interest statements, funding source declarations, and author agreements? Elsevier Publishing Information, 2025. [Google Scholar]
- European Journal of Educational Research. Conflicts of interest policy. 2023. Available online: https://www.eu-jer.com/conflicts-of-interest-policy.
- Educational Process: International Journal. Conflicts of interest policy. 2025. Available online: https://edupij.com/index/sayfa/31/conflicts-of-interest-policy.
- Kolyvas, S.; Nikiforos, S. Technology and creativity on early adolescence: A case study during COVID-19 pandemic. Current Psychology Available at. 2021, 42(10), 8554–8561. [Google Scholar] [CrossRef] [PubMed]
- Campbell, D. T.; Stanley, J. C. Experimental and quasi-experimental designs for research. In Houghton Mifflin; 1990. [Google Scholar]
- Dzulfikar, A.; Turmudi, T.; Herman, T.; Kusnandi, K. How ICT supports the mathematical problem-solving learning process of secondary school students: A systematic literature review. Journal Evaluation in Education (JEE) 2025, 6(3), 924–936. [Google Scholar] [CrossRef]
Figure 1.
Histogram comparison of mathematical invention scores for Middle School A (technology–intensive) and Middle School B (manual tools). The distribution for Middle School B is shifted to the right, indicating higher levels of invention on average.
Figure 1.
Histogram comparison of mathematical invention scores for Middle School A (technology–intensive) and Middle School B (manual tools). The distribution for Middle School B is shifted to the right, indicating higher levels of invention on average.
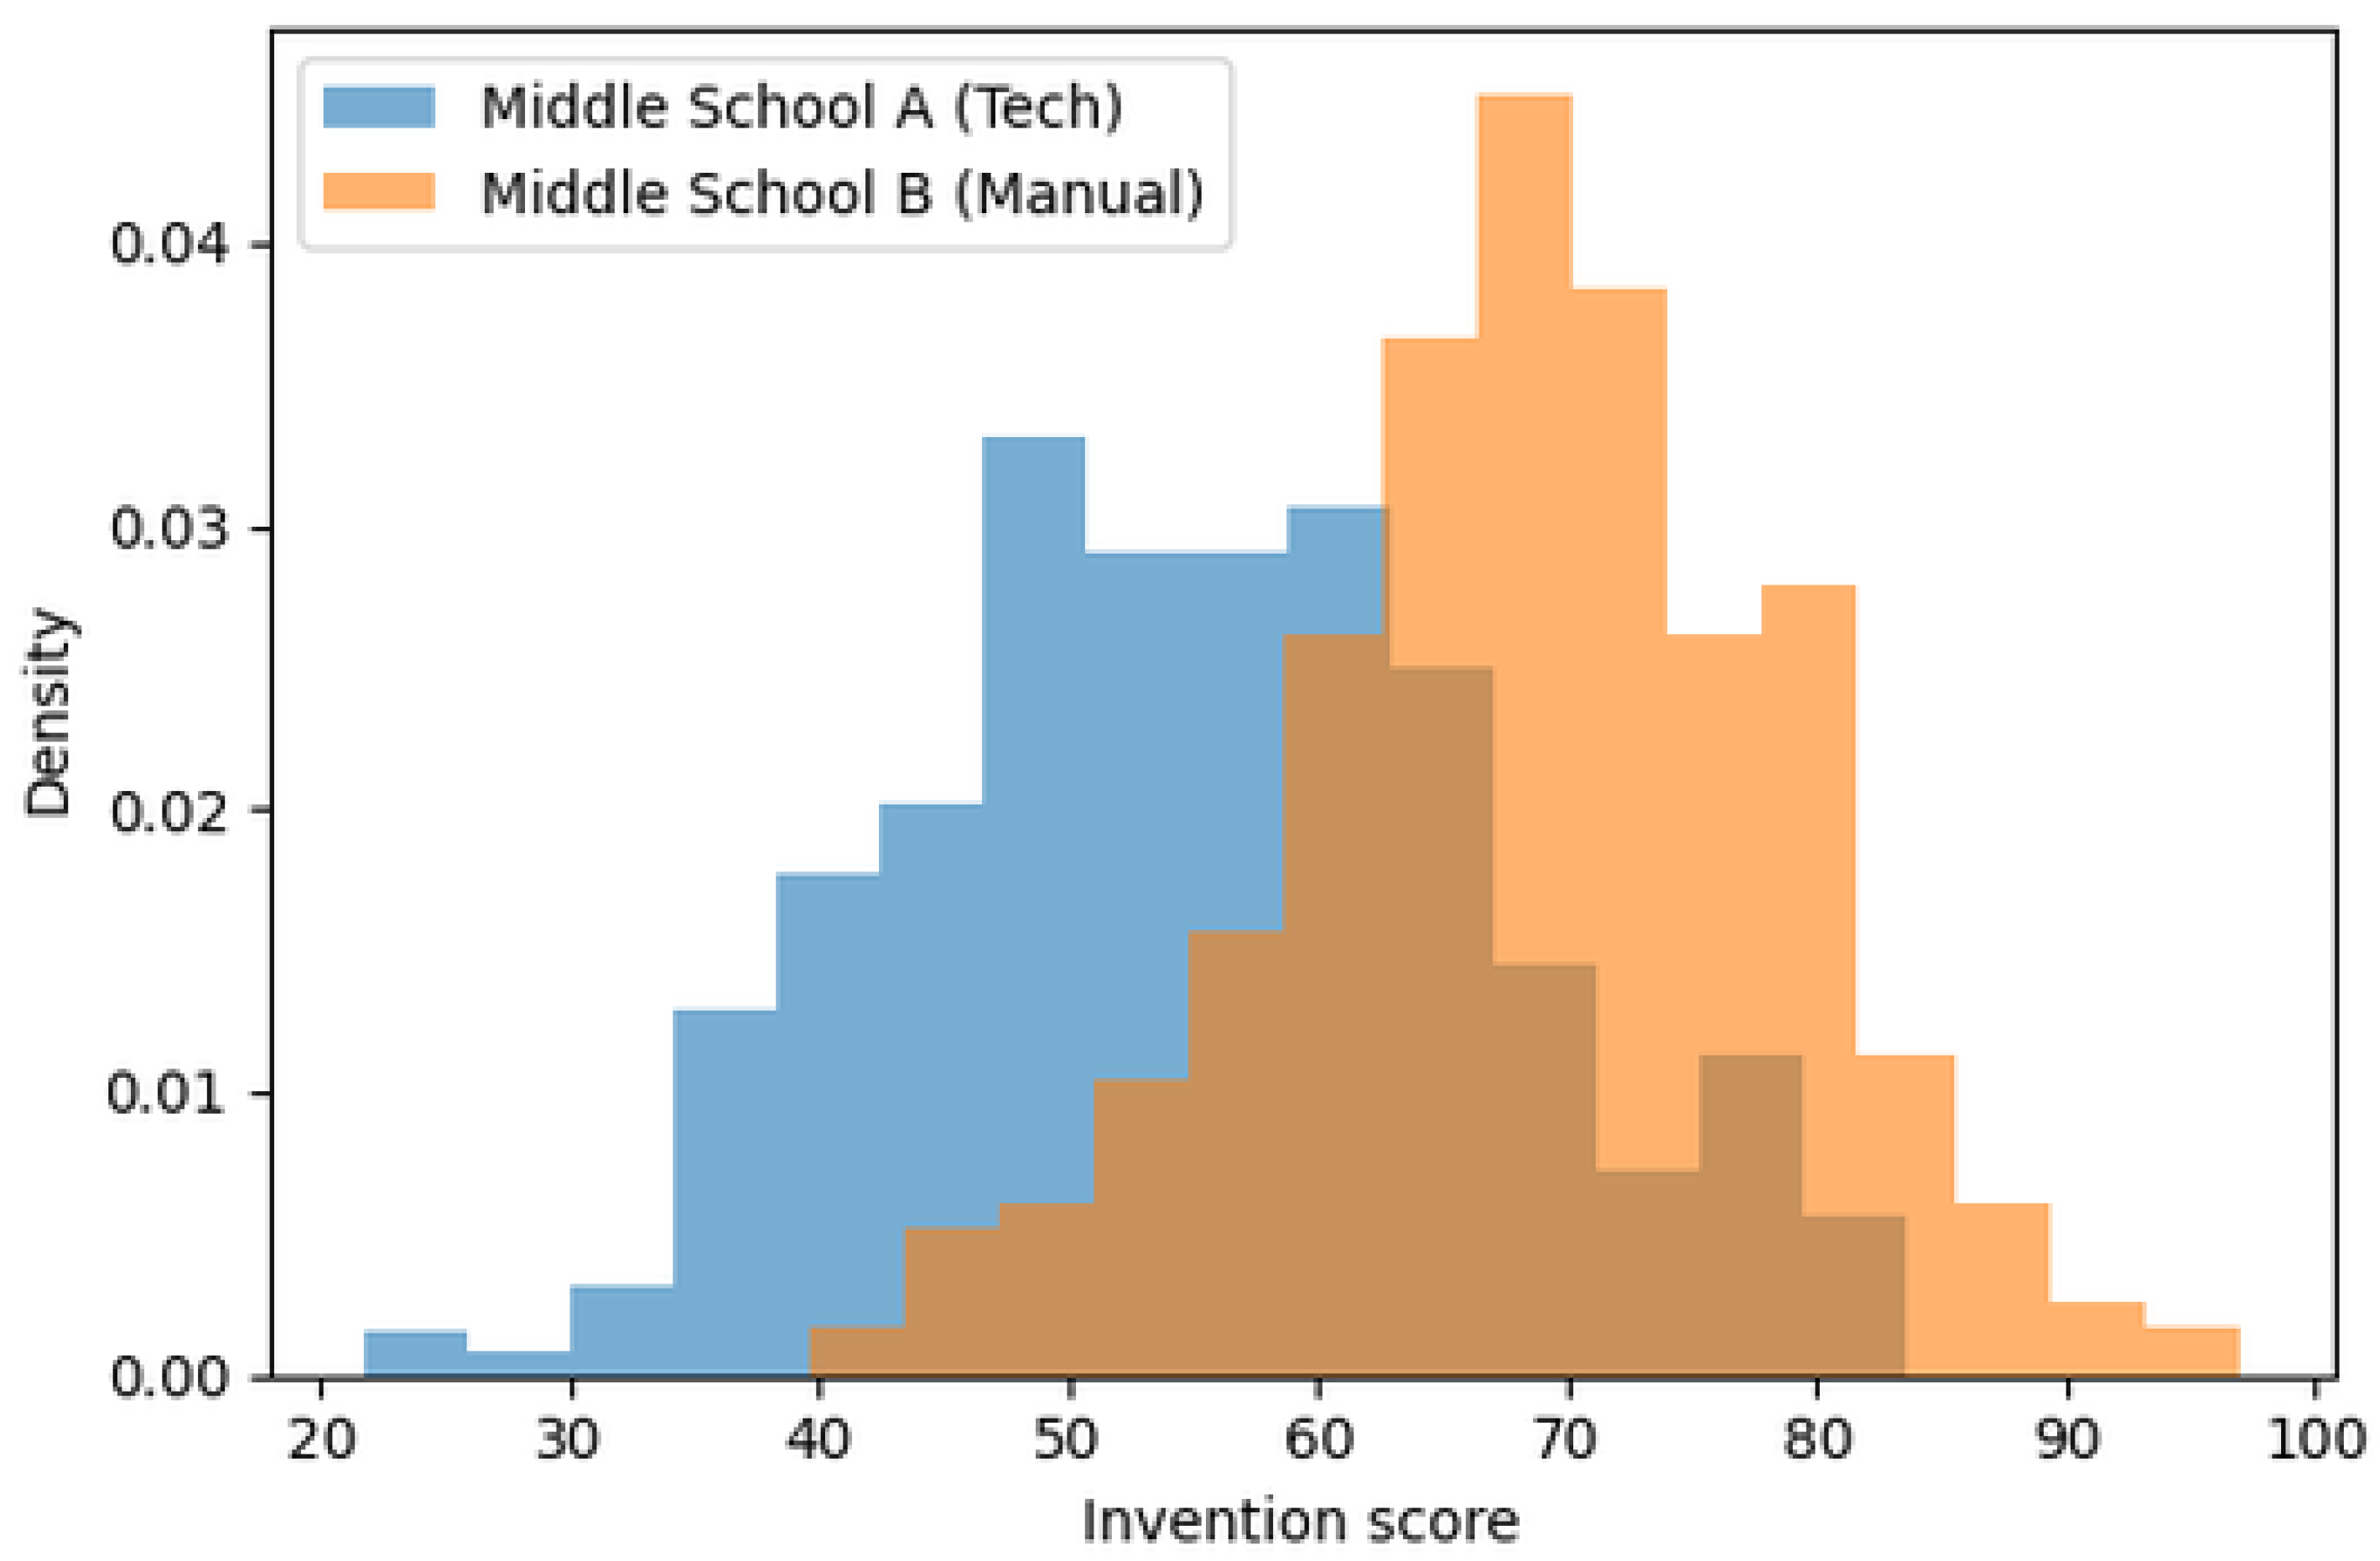

Table 1.
Descriptive statistics for baseline achievement and invention scores by school (holiday program, ).
Table 1.
Descriptive statistics for baseline achievement and invention scores by school (holiday program, ).
| Group | n | (SD) | (SD) | Cohen’s d (Y) |
|---|---|---|---|---|
| Middle School A (technology) | 299 | |||
| Middle School B (manual) | 301 |
Table 2.
Comparison of effect sizes involving technology use in mathematics education. Positive values favour technology; negative values favour non-technology/manual conditions.
Table 2.
Comparison of effect sizes involving technology use in mathematics education. Positive values favour technology; negative values favour non-technology/manual conditions.
| Study | Context / sample | Outcome focus | Effect size | Direction |
|---|---|---|---|---|
| Present study (Middle Schools A vs B) | Algerian middle-school holiday program; technology-intensive vs manual condition | Mathematical invention on non-routine post-test | (manual > tech) | Negative for tech |
Disclaimer/Publisher’s Note: The statements, opinions and data contained in all publications are solely those of the individual author(s) and contributor(s) and not of MDPI and/or the editor(s). MDPI and/or the editor(s) disclaim responsibility for any injury to people or property resulting from any ideas, methods, instructions or products referred to in the content. |
© 2025 by the authors. Licensee MDPI, Basel, Switzerland. This article is an open access article distributed under the terms and conditions of the Creative Commons Attribution (CC BY) license (http://creativecommons.org/licenses/by/4.0/).
Copyright: This open access article is published under a Creative Commons CC BY 4.0 license, which permit the free download, distribution, and reuse, provided that the author and preprint are cited in any reuse.


