
Submitted:
22 December 2025
Posted:
23 December 2025
You are already at the latest version
Abstract
A comprehensive analysis of the notch toughness of Electron Beam Powder Bed Fused (EB-PBF) Ti-6Al-4V was conducted, which focused on the influence of build orientation and correlations with key mechanical properties. Horizontal and vertical specimens were fabricated with optimized process parameters and reused powder. The microhardness and microstructure of the metal were examined and both profilometry and scanning electron microscopy were used in evaluating the fracture surfaces. Results showed that the metal with vertical build orientation absorbed ~47% higher impact energy than the horizontal orientation due to crack propagation perpendicular to the prior-β grains, lower microhardness, and greater ductility. The importance of ductility to the vertical specimens was evidenced by greater shear lip height (~35%), shear area (~50%), and roughness of the fracture surface (~15%). Overall, results show that the notch toughness of EB-PBF Ti6Al4V is dependent on the build orientation due to difference in microstructure and the bulk mechanical properties. The notch toughness is well correlated with tensile properties and fracture toughness. The relationship between the notch toughness in dynamic loading and quasi-static fracture toughness for EB-PBF Ti-6Al-4V is discussed.
Keywords:
electron beam powder bed fused (EB-PBF) Ti-6Al-4V
; notch toughness
; build orientation
; mechanical properties
1. Introduction
Electron beam powder bed fusion (EB-PBF) is an additive manufacturing (AM) process that is used for the fabrication of components from a variety of metals. The EB-PBF process is used in the aerospace, automotive, and biomedical industries, among others, for rapid prototyping as well as for production of complex metal parts, including those of titanium [1,2]. There are some advantages of EB-PBF. Due to the high temperature of the build chamber, which generally exceeds 650 °C, and vacuum conditions, EB-PBF parts exhibit negligible residual stresses and no interference from gas flow unlike in laser powder bed fusion (L-PBF) [3,4]. However, the roughness of EB-PBF parts is often greater due to larger powder diameter and beam diameter compared to those in L-PBF [5]. Machining is recommended for both the processes while additional post processing (i.e., heat treatment) is needed in L-PBF to remove residual stresses [6].
One of the major differences between PBF processes and traditional manufacturing processes (e.g., casting) is the greater number of process variables and uncertainties involved in PBF. Since PBF processes are performed layer-by-layer, the mechanical properties of fabricated metallic parts exhibit anisotropy due to variation in localized microstructure, process induced defects such as porosity and lack of fusion (LOF), and surface roughness. Indeed, the mechanical properties of the EB-PBF Ti6Al4V varies with orientation and build location within the build space [7]. Specifically, the tensile strength, fatigue properties, and fracture toughness vary by as much as 15% [1,2,8]. While these properties are of substantial importance, they do not address the dynamic fracture resistance, where localized strains and strain rates are extremely high. The notch toughness under impact loading is an important mechanical property, which refers to the amount of energy that a material can absorb before rupture under dynamic loading. Charpy impact testing provides a convenient manner to explore the dynamic toughness and notch sensitivity [9]. These properties can be sensitive to microstructure and defects, which are concerns in PBF processes in general [10,11].
Ti6Al4V is widely used for stress-critical applications due to its high specific strength, superior fatigue and fracture properties. It exhibits a strong balance between tensile strength and ductility due to HCP and BCC crystallographic structure [12]. While several studies have been reported on the notch toughness behavior of L-PBF Ti6Al4V, few have been reported on EB-PBF of Ti6Al4V. Hrabe et. al. studied the effects of internal porosity and crystallographic texture on the notch toughness of EB-PBF specimens in the as-built condition and after Hot Isostatic Pressing (HIP) considering horizontal and vertical orientations [13]. Results showed that the HIP treatment reduces internal porosity and increases the α lath thickness, which improved the absorbed energy. Their results emphasized that crystallographic texture and grain morphology influence energy absorption and that crack pathways crossing prior-β grain boundaries absorb higher energy. In another study performed on Ti6Al4V produced by EB-PBF, HIP improved the impact toughness and diminished effects of configuration on the notch sensitivity [14]. Bruno et. al. investigated the effect of build orientation (0°, 30°, 60°, 90°) on the microstructure and mechanical performance of Ti6Al4V parts fabricated by EB-PBF, and reported that horizontal builds exhibited lower ductility and toughness compared to vertical builds in Izod impact testing [15].
Aziziderouei et. al. studied the effects of build orientation (0°, 45°, 90°) and lack of fusion (LOF) on the impact energy of Ti6Al4V produced by EB-PBF. They reported that the impact energy increased with effective angle between the notch direction and build orientation. Interestingly, LOF facilitated crack propagation when the notch direction was aligned with the build direction [16]. They also discussed the influence of microstructure on the crack paths and reported higher impact energy for vertical specimens. Jeffs et. al. examined the effects of process parameters and build orientation on the notch toughness of EB-PBF Ti6Al4V [17]. Their results also showed that vertical builds exhibited higher impact energy due to epitaxial grain growth. Furthermore, the beam velocity and normalized energy density contributed to the impact energy due to their contribution to the printed microstructure. Grell et. al. studied the effects of oxidation with powder reuse on the notch toughness of horizontal (XZ and XY orientations) and vertical (ZX) specimens, and reported that the toughness was correlated with ductility. Their results showed that the differences in energy absorbed with build orientation were most prominent in the lower oxidized condition; vertical specimens absorbed the highest amount of energy [18]. Soundarapandiyan reported that the impact energy decreased with oxidation in EB-PBF of Ti6Al4V [19] and increased with heat treatment [20]. Summarizing the existing body of work, the microstructure of EB-PBF Ti6Al4V, often characterized by α+β phases and porosity, can cause structural anisotropy due to layer-wise processing, which can significantly influence the impact toughness of Ti6Al4V. Furthermore, HIP can improve the notch toughness of the alloy but is highly dependent on the treatment temperature and pressure.
Most of the previous research on the notch toughness of EB-PBF Ti6Al4V has interpreted trends in the impact energy to failure without mechanical property data or supporting fractographic evaluation. Optical profilometry is an effective method for analyzing the fracture surface morphology both qualitatively and quantitatively to achieve a mechanistic understanding. Hence, a detailed evaluation of the fracture surface morphology of EB-PBF Ti6Al4V specimens after Charpy impact testing was conducted and the key features were identified. The notch toughness is reportedly a function of ductility and the dependence is often reflected through characteristic features of the fracture surfaces [21]. To strengthen that interpretation, the effects of build orientation were evaluated in relation to surface topography, indentation hardness, mechanical properties, and microstructure including the predominate process induced defects. Based on these findings, their contribution to the notch toughness of EB-PBF Ti6Al4V fabricated with optimized parameters is discussed.
2. Materials and Methods
2.1. Specimen Fabrication
Charpy impact specimens were built with Ti6AL4V powder in the used condition after 20 previous builds. Details regarding the total number of hours accrued in the build chamber or replenishment practiced in these builds were not available. The nominal average particle diameter was approximately 50 µm with most of the powder (> 90% of particles) in the range of 45-120 µm. The weight percentage composition of this feedstock is presented in Table 1 [22].
The Charpy impact specimens were built in accordance with ASTM E23 with three different orientations, including Horizontal Side (HS), Horizontal Top (HT) and Vertical (V) as shown in Figure 1(c) [23]. Ten specimens were built with each orientation in a single build, all with standard geometry (10 x 10 x 55 mm), notch depth of 2 mm, interior angle of 45°, and a notch-tip curvature of 0.25 mm (Figure 1). The position and orientation of the specimens inside the chamber were virtually modeled with 6 mm support structures in Materialize Magics software. The build was completed on an ARCAM A2X EBM machine (Molndal, Sweden) operated with Version 5.0.64 control software, and using the default parameters for Ti6Al4V. The default build parameters included beam current of15 mA, max current of 20 mA, beam scan offset of 25 mA, beam speed of 4530 mm/sec, speed function of 45, and preheat temperature of 650 °C after [24,25].
After completion, the powder cake was removed from the build chamber, and the specimens were extracted using the powder recovery system (PRS). The specimens were ready for impact testing without further post-processing. Tensile properties of the metal fabricated with this powder using the same ARCAM A2X machine and build parameters are listed in Table 2 [21].
2.2. Charpy Impact Experiment
The Charpy impact test quantifies the notch toughness of metals under impact loading [9]. The experiments in this investigation were performed using a Satec SI-1K3 (Warren, MI) adhering to the ASTM E23 standard [23]. Figure 2 outlines the experimental set up for the Charpy impact test. The instrument was calibrated prior to each experiment as required for accurate measurements. The Charpy impact test evaluates the energy absorbed during fracture, which is calculated according to
where, Ei and Ef are the initial potential energy of the pendulum and the final energy after impact loading., which are given by
In Eqn. 2, m is the hammer mass, g is gravitational acceleration and R is the pendulum radius of swing [26].
2.3. Optical Profilometry
An optical profilometer (Keyence, Model VR – 3100, Osaka, Japan) was used to characterize the surface topography of the EB-PBF Ti6Al4V specimens after impact testing. Optical images and the 3D topography of the fracture surfaces were captured at magnifications between 12X and 180X. The standard surface roughness parameters were calculated for each specimen including the average area roughness (Sa), maximum height variation (Sz) and root mean square height Sq. In addition, the average peak height (Sp) and average valley depth (Sv) parameters were estimated [27]. Topography maps of the fractured specimens were created to support identification of the dominant characteristics in the fracture surfaces. The entire fracture surface area was considered as the reference plane in profiling the surface topography.
2.4. Shear Area Analysis
The shear area for each fracture surface was measured from the high-resolution color maps obtained using the Keyence optical profilometer (Model VR – 3100, Osaka, Japan) and post-processing using ImageJ software (Version 1.46r, Bethesda, MD). For each fracture surface evaluated, the total shear area was estimated from the sum of the left-side and right-side shear regions. To account for potential variations in measurements and minimize errors, the average shear area was calculated considering both sides of each broken specimen. The shear areas were then averaged across the 10 specimens of each build orientation to reflect the effects of build orientation on the fracture behavior.
The measured shear area is the projected area as seen from the top view of the fractured surface rather than the actual 3-D shear area. Using the projected shear area, the shear angle and the trigonometric principals, the actual shear areas and consequently the shear widths of the specimens were calculated, which is a more comprehensive reflection of the shear mechanisms. In addition, the shear lip dimensions, including length and height, were calculated from the 3D topography as shown in Figure 3. Jeffs et. al. also used shear lip width to discuss the fracture behavior of EB-PBF Ti6Al4V [17]. Two more indices have been introduced and measured in this study, namely the Maximum Continuous Shear Lip Length (MCSL) and Maximum Continuous Shear Dip Length (MCSD). The MCSL and MCSD are defined as the maximum length of the continuous shear lip and shear dip in a fractured surface. The shear dips are the recessed region on the opposite side of the fracture surface relative to the shear lips. In addition, the shear angle of the shear lips was calculated considering the vertical plane as a reference [28].
2.5. Microstructure and Microhardness Analysis
Selected specimens were sectioned, mounted, and polished to evaluate the microstructure and measure the microhardness. Out of the 30 total specimens, 11 representative specimens were evaluated. One half of each fractured specimen was mounted in a graphitic mounting compound using a conventional mount press. Polishing was performed using an EcoMet 30 semi-automatic polisher (Buehler, IL). The process began with sequential grinding using silicon carbide (SiC) papers of 240, 400, 600, 800, and 1200 grit. Each grit was applied for 3 minutes at 300 RPM under a polishing load of 20 N per mount, with continuous water coolant. Fine polishing was performed using a 1 mL DiaLube diamond suspension (~3 μm particle size) for 5–6 minutes without additional water. To achieve a mirror-like surface, a final chemical polishing step was performed using a mixture of 0.5 mL NH4OH and 2 drops of H2O2 in 10 mL colloidal silica (~0.05 μm silica particle size) for 5 minutes. The microstructure was revealed by etching the final polished specimens with Kroll’s reagent (2% HF, 6% HNO3, and 92% H2O) for 8-12 seconds. Optical images were then captured using an optical microscope (Nikon BXZ5150, Japan) at magnifications of 50X, 100X, 200X, 500X, and 1000X.
To estimate microhardness, a micro-indenter (LM247AT, LECO Corp., MI) equipped with AMH43 software (LECO Corp., MI) was used, following ASTM E92 standards. Each specimen underwent at least 15 indentations, with an applied force of 100 g for 13 seconds per indentation. To comply with ASTM E92 guidelines, the indentation sites were examined before and after testing, ensuring a minimum spacing of 2.5 times the indentation diagonal (2.5d) between adjacent impressions to prevent interference.
2.6. Scanning Electron Microscopy
The detailed features on the fractured surfaces were evaluated by scanning electron microscopy (SEM) using a commercial instrument(JEOL JSM 6010PLUS/LA). Prior to performing SEM, the specimens were cleared of any debris with a nitrogen gas gun. Images were obtained at between 30X-400X magnification. Two images of each of the three build orientations were analyzed using the ImageJ software (e.g., Figure 4) to estimate the percentage area of porosity with respect to the total fractured surface area.
3. Results
3.1. Impact Energy
The impact energy to fracture of the EB-PBF specimens is presented in Figure 5(a) for all three build orientations. The average impact energy for the horizontal side (HS), horizontal top (HT) and vertical (V) orientations are 15.5, 15.9 and 22.9 J, respectively. As evident from the distribution, the vertical orientation exhibited nearly 50% higher average absorbed energy than the two horizontal orientations. The HS specimens exhibited slightly higher (~3%) average impact energy than the HT group, but this difference was not significant. The importance of build location on the impact energy of the horizontal specimens is presented in Figure 5(b). Overall, there was limited change in energy to fracture with radial distance for the HT specimens and no trend is observed in the HS specimens. When comparing the notch toughness, the V specimens exhibited higher average toughness of 0.285 J/mm2 ± 0.188 followed by the HS and HT top specimens, which had average toughness of 0.199 J/mm2 ± 0.009 and 0.193 J/mm2 ± 0.013, respectively. The notch toughness follows the similar trend as the impact energy absorption since the geometry for each group were similar.
3.2. Topography and Quantification of Shear Region
Figure 6 shows the surface topography of six representative fractured specimens including the three build orientations. Shear lips and shear dips are clearly visible on the edges of the specimens. The measured shear lip area, average shear lip height, and absorbed impact energy are provided in the legend below each specimen. The shear areas were distributed on the fractured specimens either in the form of shear lips or shear dips. The shear lips were either continuous or discontinuous. All the fractured surfaces appear rugged, with valleys and peaks on the fractured surfaces. However, the height variation on the vertical specimens is comparatively much higher than that of the horizontal specimens.
Quantitative results for the fracture surface shear area measurements are presented in Figure 7(a). Overall, the shear area was most predominant for the vertical specimens as evident in Figure 7(a). The cross-sectional area available to resist fracture beyond the notch was ~80 mm2. Of this area, approximately ~14%, ~18% and ~24% of the total fractured area was attributed to the shear region for the HS, HT, and V specimens, respectively.
Figure 7(b) presents the average shear lip height measurements with respect to build orientation. The areas affected by the dominant shear regions at the edges and the notch were excluded in these measures. As evident from comparing the results with respect to orientation, the shear lip height for the vertical specimens is significantly higher than those for the two horizontal orientations. Overall, the average shear lip height of the vertical specimens is approximately 35% higher than that of the horizontal specimens.
The average shear lip width measurements for the three orientations are presented in Figure 7(c). The average shear widths for the HS, HT and V specimens are 0.76 mm ± 0.082, 1.02 mm ± 0.131 and 1.34 mm ± 0.125, respectively. The shear angles were also calculated and found to be roughly 44°, 42°, and 45° for the HS, HT, and Vertical specimens; the overall average was 43 °± 1.4° considering all three orientations.
The average Maximum Continuous Shear Lip Lengths (MCSL) for the HS, HT and V specimens are shown in Figure 7(d) and were estimated to be 5.4 mm, 6.3 mm, and 7.1 mm, respectively. The shear lip lengths account for approximately 54% (HS), 63% (HT) and 70% (V) of the specimen widths, respectively, for these three orientations. As expected, the average Maximum Continuous Shear Dip Length (MCSD) for the HS, HT and V specimens were very consistent with the MCSL measurements, with values of 5.5 mm, 6.5 mm, and 7.0 mm, respectively (Figure 7(d)).
Table 3. The surface average roughness parameters of the fracture surface excluding the shear areapresents the average surface roughness parameters obtained for the fracture surfaces. These values represent the roughness posed by the surface asperities excluding the shear area. The mean Sa values for the HS, HT and V specimens are 18.1 μm, 19.1 μm and 21.4 μm, respectively. Similarly, the mean Sv values for the HS, HT and V specimens are 124.1 μm, 175.5 μm and 164.2 μm, respectively. Overall, the roughness of the fracture surface of the vertical specimens is higher than that of the horizontal specimens. This agrees with the morphology evident in Figure 6 as the surface topography of the vertical built EB-PBF Ti6Al4V specimens appears more rugged than that of the horizontal specimens, suggesting higher ductility. Overall, the fracture surfaces of the horizontal specimens appear less rugged and comparatively flatter than that of the vertical specimens.
3.3. Microhardness and Microstructure
Microhardness is a measure of the resistance to permanent deformation and for metals is often proportional to the ultimate ensile strength [29]. The average microhardness of the HS and HT specimen was determined to be 355.5 ± 2.9, and 362.3 ± 8.3, respectively, with no significant difference between these two orientations. The average microhardness of the vertical specimens is 351.3 ± 3.8.
Although α-lath thickness measurements were not obtained, the vertical specimens appeared to have coarser α-lath thickness. That agrees with Jeffs et. al. that reported finer α-lath thickness in horizontal specimens compared to the vertical specimens [17]. In a previous related study on EB-PBF Ti6Al4V [30], α-lath thickness exhibited a disproportionate relationship with microhardness, which is consistent with Tan et al. [31], and then Sharma et al. [32].
Figure 8 shows optical micrographs for sectioned surfaces of the horizontal and vertical specimens with annotation of the crack paths and columnar β grains. Clearly evident for the horizontal specimens, the crack travels predominantly along the prior β boundaries, and not across. These findings align with previous research on Ti6Al4V fracture behavior [16]. In contrast, for the vertical specimens, the crack propagates through α plus β colonies, crossing prior β grains in the process, indicating trans-granular propagation.
3.4. Scanning Electron Microscopy
Results of SEM analysis of the fractured EB-PBF Ti6Al4V specimens with horizontal (HT) and vertical (V) orientations are shown in Figure 9 at multiple magnifications. The fractured surfaces exhibit process defects, including porosity and LOF voids. Porosity is evident for both the horizontal and vertical specimens as circular voids. The average porosity measurements from fracture surfaces of the horizontal and vertical orientation are 4.5%, and 1.8%, respectively, indicating that the porosity in the horizontal specimens was about 2.5 times of the vertical specimens. It is important to note that this does not represent the actual porosity within the entire volume, which would have been better analyzed using micro computed tomography.
The surfaces also exhibit micro-void coalescence such as fracture flutes [21], as highlighted with yellow arrows in Figure 9(b). These flutes are elongated dimples and are common to HCP structures. They signify ductile fracture and develop from a reduction in slip in the HCP-α phase due to increasing oxygen content in the material [21]. These flutes tend to form on along α–α and α–β grain boundaries and are also often formed in Widmanstatten microstructures due to the close packing of the α and β plates [33].
4. Discussion
The mechanical behavior of Ti6Al4V produced by EB-PBF varies with build orientation and was reflected in the bulk tensile propertiets, microhardness, and notch toughness. This section comprehensively discusses the influence of build orientation on impact energy absorption and notch toughness in relation to mechanical properties, microstructure and porosity and establishes a correlation of the impact toughness with the fracture toughness.
4.1. Influence of Microstructure and Fracture Surface Topography
The notch toughness of the EB-PBF Ti6Al4V specimens was evaluated in the as-built condition and exhibited anisotropy with respect to the build orientation. While there was minimal difference in the impact energy between the two horizontal orientations (HS and HT), the vertical specimens had approximately 50% higher average impact energy than the horizontal specimens (Figure 5). Hence, the crack path driven by dynamic fracture in the horizontal plane involved interaction with the microstructure that absorbed more energy.
According to the experimental results presented in Section 0, the impact toughness obtained in this study is comparable to that reported for the as-built condition in previous studies [15,17,18]. A comparison of the notch toughness values from this study with others reported for EB-PBF Ti6Al4V is shown in Figure 10. The overall average impact energy absorbed (18.1 J) resulting from EB-PBF is comparable to that for the Ti6Al4V alloy in wrought form (19.94 J) [34]. As evident in Figure 10, the impact toughness of EB-PBF Ti6Al4V is also comparable to LB-PBF and cast Ti6Al4V [26,35,36]. However, it is lower than values reported for EB-PBF Ti6Al4V in the machined and HIP condition, which warrants further discussion.
The as-built condition of the metal had more surface asperities, and larger apparent surface stress concentrations compared to the machined condition, thereby reducing its capacity for energy absorption. Clearly, due to the external surface texture the as-built surface condition leads to higher local stress concentration, which can result in lower energy absorption. Additionally, reused powder can cause a reduction in energy absorption as greater oxygen content tends to decrease the ductility in EB-PBF Ti6Al4V [21,37].
Figure 10.
Broad comparison of notch toughness of as built and machined EB-PBF Ti6Al4V with literature [13,16,17,26,34,35,38,39].
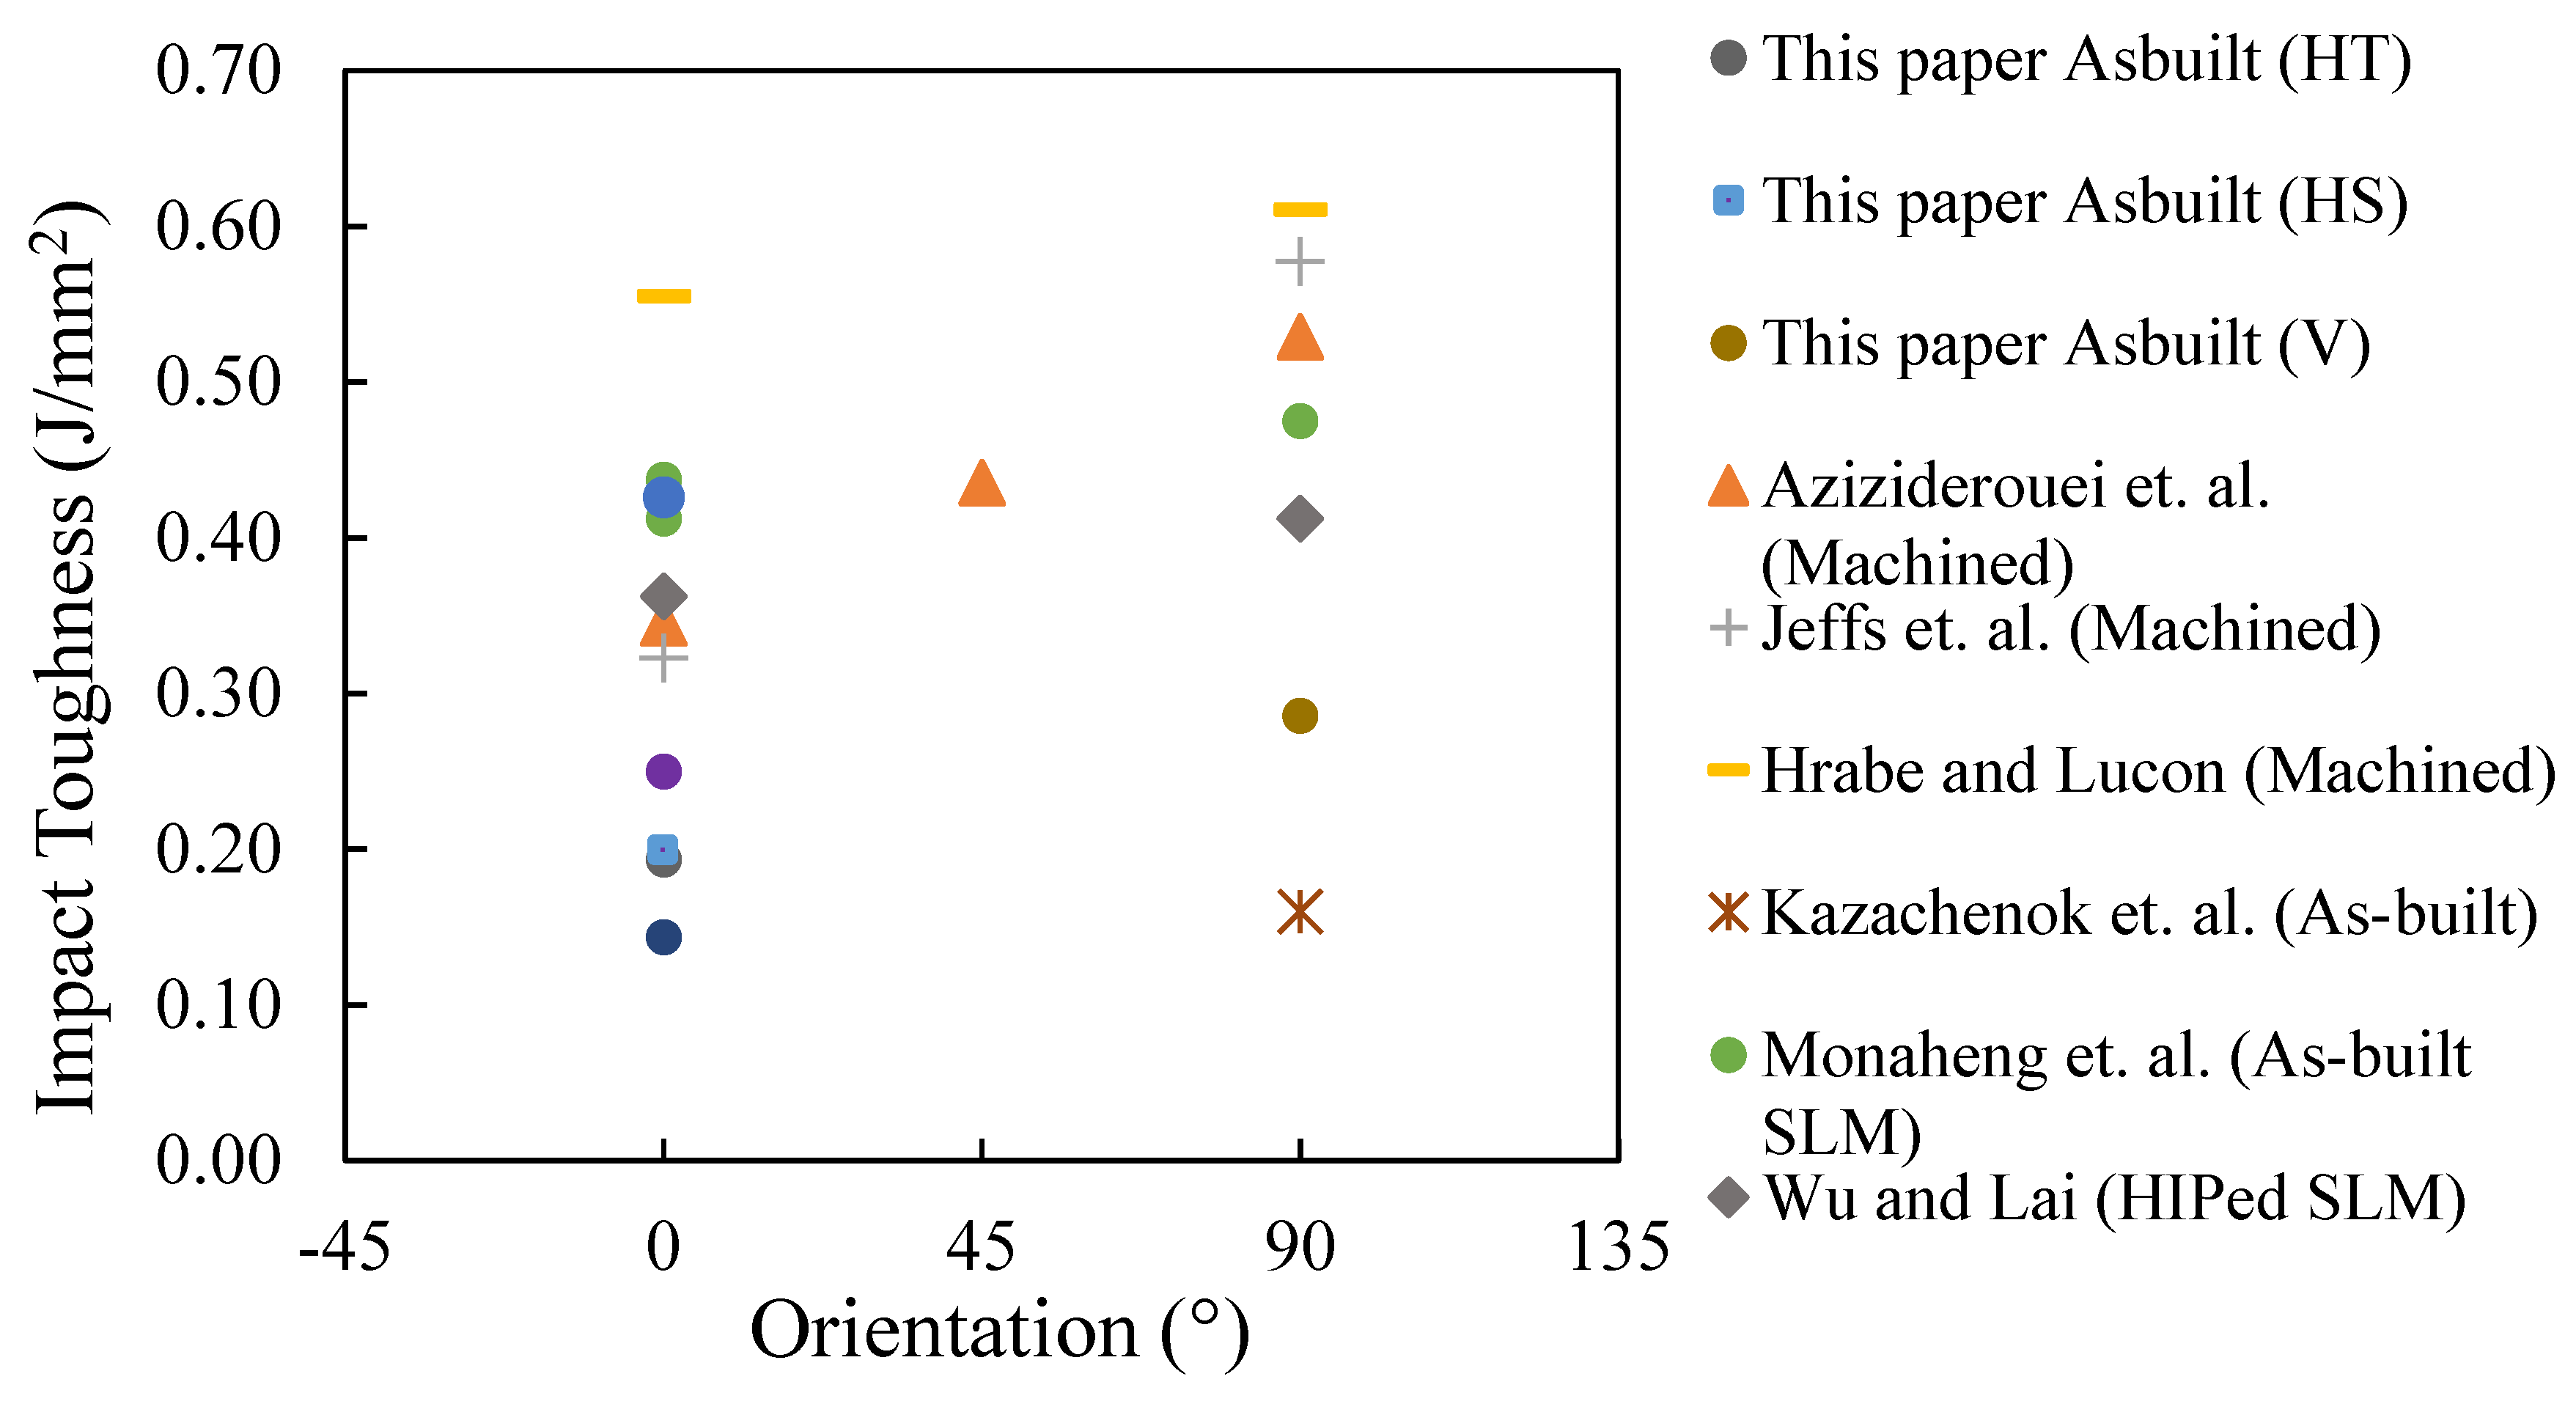
Results confirmed that build orientation is important to the impact energy absorption of the metal. The larger notch toughness of vertical specimens is due to the influence of microstructure, as reflected by the greater ductility, and lower microhardness. The orientation of crack propagation in the vertical specimens is perpendicular to the columnar prior β grains. Crack deflection is promoted by their orientation, and the propagation ultimately occurs through more α-β grain boundaries. Moreover, the prior β-grains are bent and fractured transversely in the vertical specimens as driven by the orientation of impact loading (Figure 8). The crack deflection due to α-β grain boundaries enhances energy dissipation by increasing the fracture surface area per unit crack extension. Whereas in the horizontal specimens the crack propagates parallel to the prior-β grain, it reduces the extent of crack deflection. Therefore, the impact toughness is greater for the vertical specimens. The difference in energy absorbed between the horizontal top face and horizontal side faced specimens is minimal due to similarities in crack propagation direction and prior-β grain directions. Regarding hardness, the average hardness of the vertical specimens was lower than that of the horizontal specimens, which is expected from the prior β grain orientation relative to the loading direction. The rank of microhardness measurements between the horizontal and vertical orientations is consistent with the published literature [15,25].
Results from optical profilometry showed that the vertical specimens had greater signs of inelastic deformation that accompanied fracture when compared to the horizontal specimens. The ruptured surface of the vertical specimens showed ~35% greater shear lips height, and ~51% actual shear area (~40% greater shear lip width and longer continuous shear lips). In addition, the fracture surface of the vertical specimens exhibited ~15% higher roughness and more rugged topography. The vertical specimens exhibited higher average shear angles (44.6° ± 4.7) than the horizontal specimens (42.8° ± 7.2); the difference was not significant. The slightly lower shear angle of the horizontal specimens could result from more rapid crack propagation facilitated by extension along the prior-β grains boundaries. In a previous study on the fracture toughness of EB-PBF Ti6Al4V, Mojib et. al. reported higher shear area for vertical specimens than horizontal specimens, when the build is attached to the base plate, which is consistent with the build condition in this study [8]. Overall, the energy absorption in impact is dissipated as plastic energy through ductile shear, with the remainder expended as the surface energy associated with crack propagation [40].
4.2. Influence of Tensile Properties
According to previous related research [21], the percent elongation achieved by the vertical and horizontal EB-PBF Ti6Al4V specimens produced with the same powder are 9.18% and 4.30%, respective (see Table 2), which agrees with the literature [15]. The vertical orientation has significantly higher tensile toughness (83 ± 17 MPa) than the horizontal orientation (51 ± 19 MPa) [37]. The vertical specimens have greater ductility and energy absorption due to the orientation-specific improvement in slip transmission between α+β colonies; the horizontal specimens exhibit less plasticity because of limited slip across prior β-grain boundaries [21]. Thus, both the tensile properties and hardness help interpret the orientation dependence in response to impact loading. Figure 11(a) and (b) show the average shear lip height and width with respect to the notch toughness obtained from the experiments. These results agree with those of Jeffs et. al., who reported greater shear lip width in the vertically built EB-PBF specimens with respect to the horizontal orientation [17].
4.3. Influence of Porosity
The presence of porosity can influence the energy absorption and crack propagation [13,41]. However, the microstructure (grain orientation) plays a more dominant role than porosity in this investigation. Approximately 80% of the vertical specimens exhibited higher impact energy absorption (notch toughness) than the horizontal ones, which is expected to be driven by crack deflection and crack propagation perpendicular to the columnar prior-β grains. The remaining 20% of lower energy absorption are expected to result from interactions with porosity and variations in grain orientation. This is speculative and requires further research. Nevertheless, the approximated trend on porosity of the vertical and horizonal fractured surfaces is consistent with our previous study [8]. Schur et. al. also reported the higher presence of porosity and lack of fusion in vertical metal relative to the horizontal orientation over 30 build cycles [37]. Since the powder in this study was being used for the 20th time, the presence of higher porosity could also lower the notch toughness than the existing literature.
4.4. Relationship Between Notch Toughness and Fracture Toughness
In metals, the largest contribution to energy absorption is through plastic deformation. Both impact and fracture obey the minimum energy density criterion during crack initiation and propagation. Consequently, a quantitative relationship must exist between these two forms of toughness. Establishing such a correlation is useful since both the parameters reflect the competition between shear and flat fracture modes, as reported for high-strength steels by Li et al. [42]. Because both the Charpy and fracture toughness (KIC) specimens exhibit a transition from flat to shear fracture at the edges, Li et al. introduced the shear-lip width as a physical bridge between impact and fracture toughness. In that effort the Charpy specimen’s shear width (tc) and the KIC specimen’s shear width (tk) were related by the specimen-size correction:
where δ is the specimen-size factor and δ₀ is the shear lip width related to crack initiation. This assumes that once shear lips are fully developed, their width remains constant along the fracture path.
According to the principles of fracture mechanics, the plastic-zone size γₚ at the crack tip is proportional to where is the yield strength, which can be expressed as:
Since the shear-lip width represents the plastic-zone boundary, where and β is material constant, thus it be written as:
For impact loading, Duan et al. and Zhou et al. established a relationship between the Charpy shear-lip width tc and intrinsic impact toughness αc (≈ αₖ for a 10 mm wide specimen) as
where γ is a constant and is the intrinsic impact toughness of the material [43,44]. Substituting Eqn (5) and (6) into Eqn (3) eliminates the intermediate variable t, linking fracture and impact toughness directly. The quasi-static plane strain fracture toughness, and dynamic notch toughness are then correlated as follows
where is a specimen size coefficient and is the shear lip width parameter related to crack initiation, which are material constants.
In the presence of a crack, and represents the relative importance of crack propagation to plastic deformation in quasi-static loading, and energy absorption to plastic deformation in dynamic fracture, respectively. The relationship between and for the EB-PBF specimens is shown in Figure 12 for results from all three build orientations. The fracture toughness of the material for the three crack directions were reported in in Vidit [28] and Mojib et al. [8]. Similar to the reported behavior of high-strength steels, the fracture toughness scales approximately linearly with impact energy after accounting for yield strength and geometric effects [42]. Results for the EB-PBF specimens are consistent with those reported for wrought and electron beam welded Ti6Al4V from the studies of Rao and Acharya [34,45].
The notch toughness results have been carefully compared with fracture toughness results from Ref [28] for specimen with similar (constant) build orientations (14 total), crack direction and specimen geometry in Figure 12. The quantitative proportionality betweenand observed in the EB-PBF Ti6Al4V suggests that similar scaling laws can be extended from quenched-tempered steels to AM titanium alloys, albeit with adjustments to the constants θ and ω to reflect microstructural anisotropy and porosity effects inherent to the EB-PBF process. Hence, if the Charpy impact energy absorption is known or determined, this approach can be utilized to estimate the fracture toughness, which provides a comparatively faster experimental method than fracture toughness testing. Nevertheless, more work should be performed to validate the approach across build conditions and post-processing routines.
Although the findings of this investigation provide new understanding concerning the notch toughness of Ti6Al4V resulting from EB-PBF, there are some limitations that should be considered. Of key importance, this research explored the metal behavior in the as-built condition only without further treatment. In addition to the value of including more build orientations and larger number of specimens to increase the statistical power, the investigation should be extended to consider the machined condition and other post processing treatments. Perhaps most important is inclusion of Hot Isostatic Pressing to remove the contribution of internal porosity. Furthermore, although the trend in porosity is consistent with extensive porosity measurement reported in Ref [8] and Ref [37], the porosity measurements were limited in this study. Further work involving a detailed evaluation of the microstructure is warranted. Overall, results show that design for EB-PBF focused on dynamic toughness should orient components such that the plane of maximum principal stress will be perpendicular to the build orientation and the elongated prior β grains.
5. Conclusions
An experimental investigation of the notch toughness of Electron Beam Powder Bed Fusion (EB-PBF) Ti-6Al-4V was performed with respect to build orientation. The importance of the bulk mechanical properties and microstructure were evaluated. According to the findings, the following conclusions are drawn:
The notch toughness of the vertical specimens was ~50% higher than that of the horizontal specimens. The superior toughness of the vertical orientation was attributed to the synergic effects of larger ductility, prior β grain boundary contributions to the crack growth resistance and lower microhardness.
The fracture surface topography of the EB-PBF Ti6Al4V can be categorized into a shear region and fracture region. The shear region was characterized by shear area, shear lips (height, width, and angle), and shear dips. The surface roughness of the fracture region can be used a metric to quantify and compare the fractured topography. The vertical specimens exhibited ~15% greater roughness than the horizontal specimens.
The fractured surface topography of the vertical specimens reflects the importance of greater ductility on the notch toughness, i.e., ~35% greater shear lips height, ~50% shear area, and ~8% greater shear angle in the fracture region. The vertical specimens exhibited trans-granular fracture, crossing prior β grain boundaries, and promoting higher energy absorption. The horizontal specimens experienced intergranular fracture along prior β boundaries, making them more brittle.
The vertical specimens possessed higher ductility that facilitated inelastic deformation and promoted energy absorption, as confirmed by a correlation between shear lip dimensions, and impact energy. The shear lip width and continuous shear length reflected the greater ductility of the vertical orientation and serve as metrics correlating with the impact toughness of the EB-PBF Ti-6Al-4V.
The notch toughness correlated well with fracture toughness, tensile properties and hardness. The vertical specimens had lower microhardness and higher percentage of elongation, further establishing the anisotropy in mechanical performance in EB-PBF Ti6Al4V.
The relationship of notch toughness in dynamic loading and quasi-static fracture toughness for EB-PBF Ti-6Al-4V was elucidated.
Acknowledgments
This work was partially accomplished using facilities funded by the Joint Center for Deployment and Research in Earth Abundant Materials (JCDREAM) in Washington State. The authors sincerely acknowledge the support of the Boeing Company in this work through the Boeing Pennell Professorship Funding awarded to M. Ramulu. The authors would like to sincerely thank Hanson Fong, Carter Beamish, and Bill Kuykendall for their help during specimen fabrication and experiments in this study.
References
- Chern, A.H.; Nandwana, P.; Yuan, T.; Kirka, M.M.; Dehoff, R.R.; Liaw, P.K.; Duty, C.E. A Review on the Fatigue Behavior of Ti-6Al-4V Fabricated by Electron Beam Melting Additive Manufacturing. Int. J. Fatigue 2019, 119, 173–184. [Google Scholar] [CrossRef]
- Lewandowski, J.J.; Seifi, M. Metal Additive Manufacturing: A Review of Mechanical Properties. Annu. Rev. Mater. Res. 2016, 46, 151–186. [Google Scholar] [CrossRef]
- Schleusener, R.; Montelione, A.; Cunningham, C.; Schur, R.; Ramulu, M.; Arola, D. On the Contribution of Planned and Unplanned Build Interrupts to the Fatigue Properties of Ti6Al4V from Laser Powder Bed Fusion. J. Mater. Res. Technol. 2025, 35, 4368–4377. [Google Scholar] [CrossRef]
- Abeyta, A.; Nouwens, C.; Jones, A.M.; Haworth, T.A.; Montelione, A.; Ramulu, M.; Arola, D. Characterizing Gas Flow in the Build Chamber of Laser Powder Bed Fusion Systems Utilizing Particle Image Velocimetry: A Path to Improvements. 2025. [Google Scholar] [CrossRef]
- Soltani-Tehrani, A.; Salman Yasin, M.; Shao, S.; Haghshenas, M.; Shamsaei, N. Effects of Powder Particle Size on Fatigue Performance of Laser Powder-Bed Fused Ti-6Al-4V. Procedia Struct. Integr. 2022, 38, 84–93. [Google Scholar] [CrossRef]
- Abdullah, M.B.; Mojib, M.; Atmadja, N.; Ramulu, M. Machinability of Electron Beam Powder Bed Fused Ti-6Al-4V in Face Milling with Coated Carbide End Mill. J. Mater. Eng. Perform. 2025. [Google Scholar] [CrossRef]
- Ghods, S.; Schur, R.; Schleusener, R.; Montelione, A.; Pahuja, R.; Wisdom, C.; Arola, D.; Ramulu, M. Contributions of Intra-Build Design Parameters to Mechanical Properties in Electron Beam Additive Manufacturing of Ti6Al4V. Mater. Today Commun. 2022, 30. [Google Scholar] [CrossRef]
- Mojib, M.M.; Fero, K.; Atmadja, N.; Arola, D.; Chen, X.; Ramulu, M. Effect of Intra-Build Design Parameters on the Fracture Toughness Properties of Electron Beam Melted Ti6Al4V. Fatigue Fract. Eng. Mater. Struct. 2024, 47, 3894–3909. [Google Scholar] [CrossRef]
- Jawaid, M.; Sultan, M.T.H.; Saba, N. Mechanical and Physical Testing of Biocomposites, Fibre-Reinforced Composites and Hybrid Composites; Woodhead Publishing, 2018; ISBN 978-0-08-102292-4. [Google Scholar]
- Solberg, K.; Berto, F. Notch-Defect Interaction in Additively Manufactured Inconel 718. Int. J. Fatigue 2019, 122, 35–45. [Google Scholar] [CrossRef]
- Eylon, D.; Pierce, C. M. Effect of Microstructure on Notch Fatigue Properties of Ti-6Al-4V. Metall. Trans. A 1976, 7, 111–121. [Google Scholar] [CrossRef]
- Safdar, A.; Wei, L.Y.; Snis, A.; Lai, Z. Evaluation of Microstructural Development in Electron Beam Melted Ti-6Al-4V. Mater. Charact. 2012, 65, 8–15. [Google Scholar] [CrossRef]
- Hrabe, N.; White, R.; Lucon, E. Effects of Internal Porosity and Crystallographic Texture on Charpy Absorbed Energy of Electron Beam Melting Titanium Alloy (Ti-6Al-4V). Mater. Sci. Eng. 2019, 742, 269–277. [Google Scholar] [CrossRef]
- Lucon, E.; Hrabe, Nikolas. Instrumented Impact Testing of Miniaturized Charpy Specimens of AM Ti-6Al-4V. Mater. Perform. Charact. 2018, 7, 126–138. [Google Scholar] [CrossRef]
- Bruno, J.; Rochman, A.; Cassar, G. Effect of Build Orientation of Electron Beam Melting on Microstructure and Mechanical Properties of Ti-6Al-4V. J. Mater. Eng. Perform. 2017, 26, 692–703. [Google Scholar] [CrossRef]
- Aziziderouei, M.; Chen, Z.; Pasang, T.; Newby, M.; Tao, Y. Effect of Lack of Fusion Formed during Electron Beam Powder Bed Fusion of Ti-6Al-4V Alloy on Impact Toughness. J. Mater. Eng. Perform. 2020, 29, 4978–4990. [Google Scholar] [CrossRef]
- Jeffs, S.; Lancaster, R.; Davies, G.; Hole, W.; Roberts, B.; Stapleton, D.; Thomas, M.; Todd, I. Baxter Gavin Effect of Process Parameters and Build Orientation on Microstructure and Impact Energy of Electron Beam Powder Bed Fused Ti-6Al-4V. Materials 2021, 14, 5376. [Google Scholar] [CrossRef]
- Grell, W.A.; Solis-Ramos, E.; Clark, E.; Lucon, E.; Garboczi, E.J.; Predecki, P.K.; Loftus, Z.; Kumosa, M. Effect of Powder Oxidation on the Impact Toughness of Electron Beam Melting Ti-6Al-4V. Addit. Manuf. 2017, 17, 123–134. [Google Scholar] [CrossRef] [PubMed]
- Soundarapandiyan, G.; Johnston, C.; Khan, R.H.U.; Leung, C.L.A.; Lee, P.D.; Hernandez-Nava, E.; Chen, B.; Fitzpatrick, M.E. The Effects of Powder Reuse on the Mechanical Response of Electron Beam Additively Manufactured Ti6Al4V Parts. Addit. Manuf. 2021, 46. [Google Scholar] [CrossRef]
- Soundarapandiyan, G.; Johnston, C.; Chen, B.; Fitzpatrick, M.E. Effect of Postprocessing Thermal Treatments on Electron-Beam Powder Bed–Fused Ti6Al4V. Mater. Des. Process. Commun. 2021, 3. [Google Scholar] [CrossRef]
- Schur, R.; Ghods, S.; Schultz, E.; Wisdom, C.; Pahuja, R.; Montelione, A.; Arola, D.; Ramulu, M. A Fractographic Analysis of Additively Manufactured Ti6Al4V by Electron Beam Melting: Effects of Powder Reuse. J. Fail. Anal. Prev. 2020, 20, 794–803. [Google Scholar] [CrossRef]
- Ghods, S.; Schultz, E.; Wisdom, C.; Schur, R.; Pahuja, R.; Montelione, A.; Arola, D.; Ramulu, M. Electron Beam Additive Manufacturing of Ti6Al4V: Evolution of Powder Morphology and Part Microstructure with Powder Reuse. Materialia 2020, 9. [Google Scholar] [CrossRef]
- ASTM International. Standard Test Methods for Notched Bar Impact Testing of Metallic Materials; E 23. [CrossRef]
- Abdullah, M.B.; Ramulu, M. Sliding Wear Behavior of Electron Beam Melted (EBM) Ti6Al4V. In Proceedings of the ASME 2022 International Mechanical Engineering Congress and Exposition, Ohio, USA, 2023; Advanced Manufacturing; Vol. 2B. [Google Scholar]
- Abdullah, M.B.; Alajmi, A.F.; Ramulu, M. Solid Particle Erosion Behavior of Electron Beam Melted (EBM) Ti6Al4V at Different Built Orientation. In Proceedings of the ASME 2022 International Mechanical Engineering Congress and Exposition, 2022; Advanced Manufacturing; Vol. 2A. [Google Scholar]
- Monaheng, L.F.; Preez, W.B.; Polese, C. Towards Qualification in the Aviation Industry: Impact Toughness of Ti6Al4V(ELI) Specimens Produced through Laser Powder Bed Fusion Followed by Two-Stage Heat Treatment. Metals 2021, 11, 1736. [Google Scholar] [CrossRef]
- Keyence Corp, Introduction to Areal Roughness. 12 17 2025. Available online: https://www.keyence.com/ss/products/microscope/roughness/surface/.
- Tambi, V. Study of Fracture Toughness and Notch Toughness under Impact Loading of Electron Beam Melted Ti6Al4V Alloy. MS Thesis, University of Washington, 2025. [Google Scholar]
- Hickey, C.F.J. Tensile Strength - Hardness Correlation for Titanium Alloys; Watertown Arsenal Labs: MA, 1961. [Google Scholar]
- Abdullah, M.B.; Bol, E.; Kelley, G.; Doyle, C.; Schleusener, R.; Mojib, M.; Chen, X.; Arola, D.; Ramulu, M. Microstructure and Microhardness of Electron Beam Melted Ti–6Al–4V Components with Differential Thickness in Initial Deposition Layers. J. Mater. Res. Technol. 2023, 26, 6493–6507. [Google Scholar] [CrossRef]
- Tan, X.; Kok, Y.; Tan, Y.J.; Descoins, M.; Mangelinck, D.; Tor, S.B.; Leong, K.F.; Chua, C. kai Graded Microstructure and Mechanical Properties of Additive Manufactured Ti–6Al–4V via Electron Beam Melting. Acta Mater. 2015, 97, 1–16. [Google Scholar] [CrossRef]
- Sharma, H.; Parfitt, D.; Syed, A.K.; Wimpenny, D.; Baxter, G.; Chen, B. A Critical Evaluation of the Microstructural Gradient along the Build Direction in Electron Beam Melted Ti-6Al-4V Alloy. Mater. Sci. Eng. 2019, 744, 182–194. [Google Scholar] [CrossRef]
- Meyn, D.; Brooks, E. Microstructural Origin of Flutes and Their Use in Distinguishing Striationless Fatigue Cleavage from Stress-Corrosion Cracking in Titanium Alloys; ASTM International, January 1981; pp. 5–31. [Google Scholar]
- Rao, B.N.; Acharya, A.R. A Comparative Study on Evaluation of Fracture Toughness from Charpy V-Notch Impact Energy and Reduction-in-Area. Eng. Fract. Mech. 1992, 41, 85–90. [Google Scholar] [CrossRef]
- Wu, M.-W.; Lai, P.-H.; Chen, J.-K. Anisotropy in the Impact Toughness of Selective Laser Melted Ti–6Al–4V Alloy. Mater. Sci. Eng. 2016, 650, 295–299. [Google Scholar] [CrossRef]
- Wu, M.-W.; Lai, P.-H. The Positive Effect of Hot Isostatic Pressing on Improving the Anisotropies of Bending and Impact Properties in Selective Laser Melted Ti-6Al-4V Alloy. Mater. Sci. Eng. 2016, 658, 429–438. [Google Scholar] [CrossRef]
- Schur, R.; Ghods, S.; Wisdom, C.; Pahuja, R.; Montelione, A.; Arola, D.; Ramulu, M. Mechanical Anisotropy and Its Evolution with Powder Reuse in Electron Beam Melting AM of Ti6Al4V. Mater. Des. 2021, 200. [Google Scholar] [CrossRef]
- Kazachenok, M.; Panin, A.; Panin, S.; Vlasov, I. Impact Toughness of Ti–6Al–4V Parts Fabricated by Additive Manufacturing. AIP Conf. Proc. 2019, 2167, 020153. [Google Scholar] [CrossRef]
- Yasa, E.; Deckers, J.; Kruth, J.; Rombouts, M.; Luyten, J. Charpy Impact Testing of Metallic Selective Laser Melting Parts. Virtual Phys. Prototyp. 2010, 5, 89–98. [Google Scholar] [CrossRef]
- Anderson, T.L. Elastic–Plastic Fracture Mechanics, 4th ed.; 2017; ISBN 978-1-315-37029-3. [Google Scholar]
- Maurya, A.; Dabas, A.; Narasimhulu, A. A Review on the Effect of Powder Oxidation, Internal Porosity and Crystallographic Texture on the Charpy Impact Energy of Ti-6Al-4V Specimen Fabricated Using Electron Beam Melting and Hot-Isostatic Pressing Post Processing. Int. J. Eng. Res. Technol. 2019, 8. [Google Scholar] [CrossRef]
- Li, H.F.; Duan, Q.Q.; Zhang, P.; Zhou, X.H.; Wang, B.; Zhang, Z.F. The Quantitative Relationship between Fracture Toughness and Impact Toughness in High-Strength Steels. Eng. Fract. Mech. 2019, 211, 362–370. [Google Scholar] [CrossRef]
- Duan, Q.Q.; Qu, R.T.; Zhang, P.; Zhang, Z.J.; Zhang, Z.F. Intrinsic Impact Toughness of Relatively High Strength Alloys. Acta Mater. 2018, 142, 226–235. [Google Scholar] [CrossRef]
- Zhou, X.H. The Impact Toughness and Mechanical Properties and Fatigue Crack Propagation Rate Research of High-Strength Steels; Aerospace University: Shenyang, 2017. [Google Scholar]
- Rao, B.N.; Acharya, A.R. Charpy V-Notch Impact Test: A Partial Alternate to ASTM E 399 Fracture Testing for Routine Quality Control Applications. Eng. Fract. Mech. 1989, 32, 39–42. [Google Scholar] [CrossRef]
Figure 1.
Details of the specimens. (a) dimensions of the specimen (not to scale), (b) notch dimensions, (c) notch orientations with respect to the build plate orientation system (red arrow indicates impact direction), (d) example fabricated specimens.
Figure 1.
Details of the specimens. (a) dimensions of the specimen (not to scale), (b) notch dimensions, (c) notch orientations with respect to the build plate orientation system (red arrow indicates impact direction), (d) example fabricated specimens.
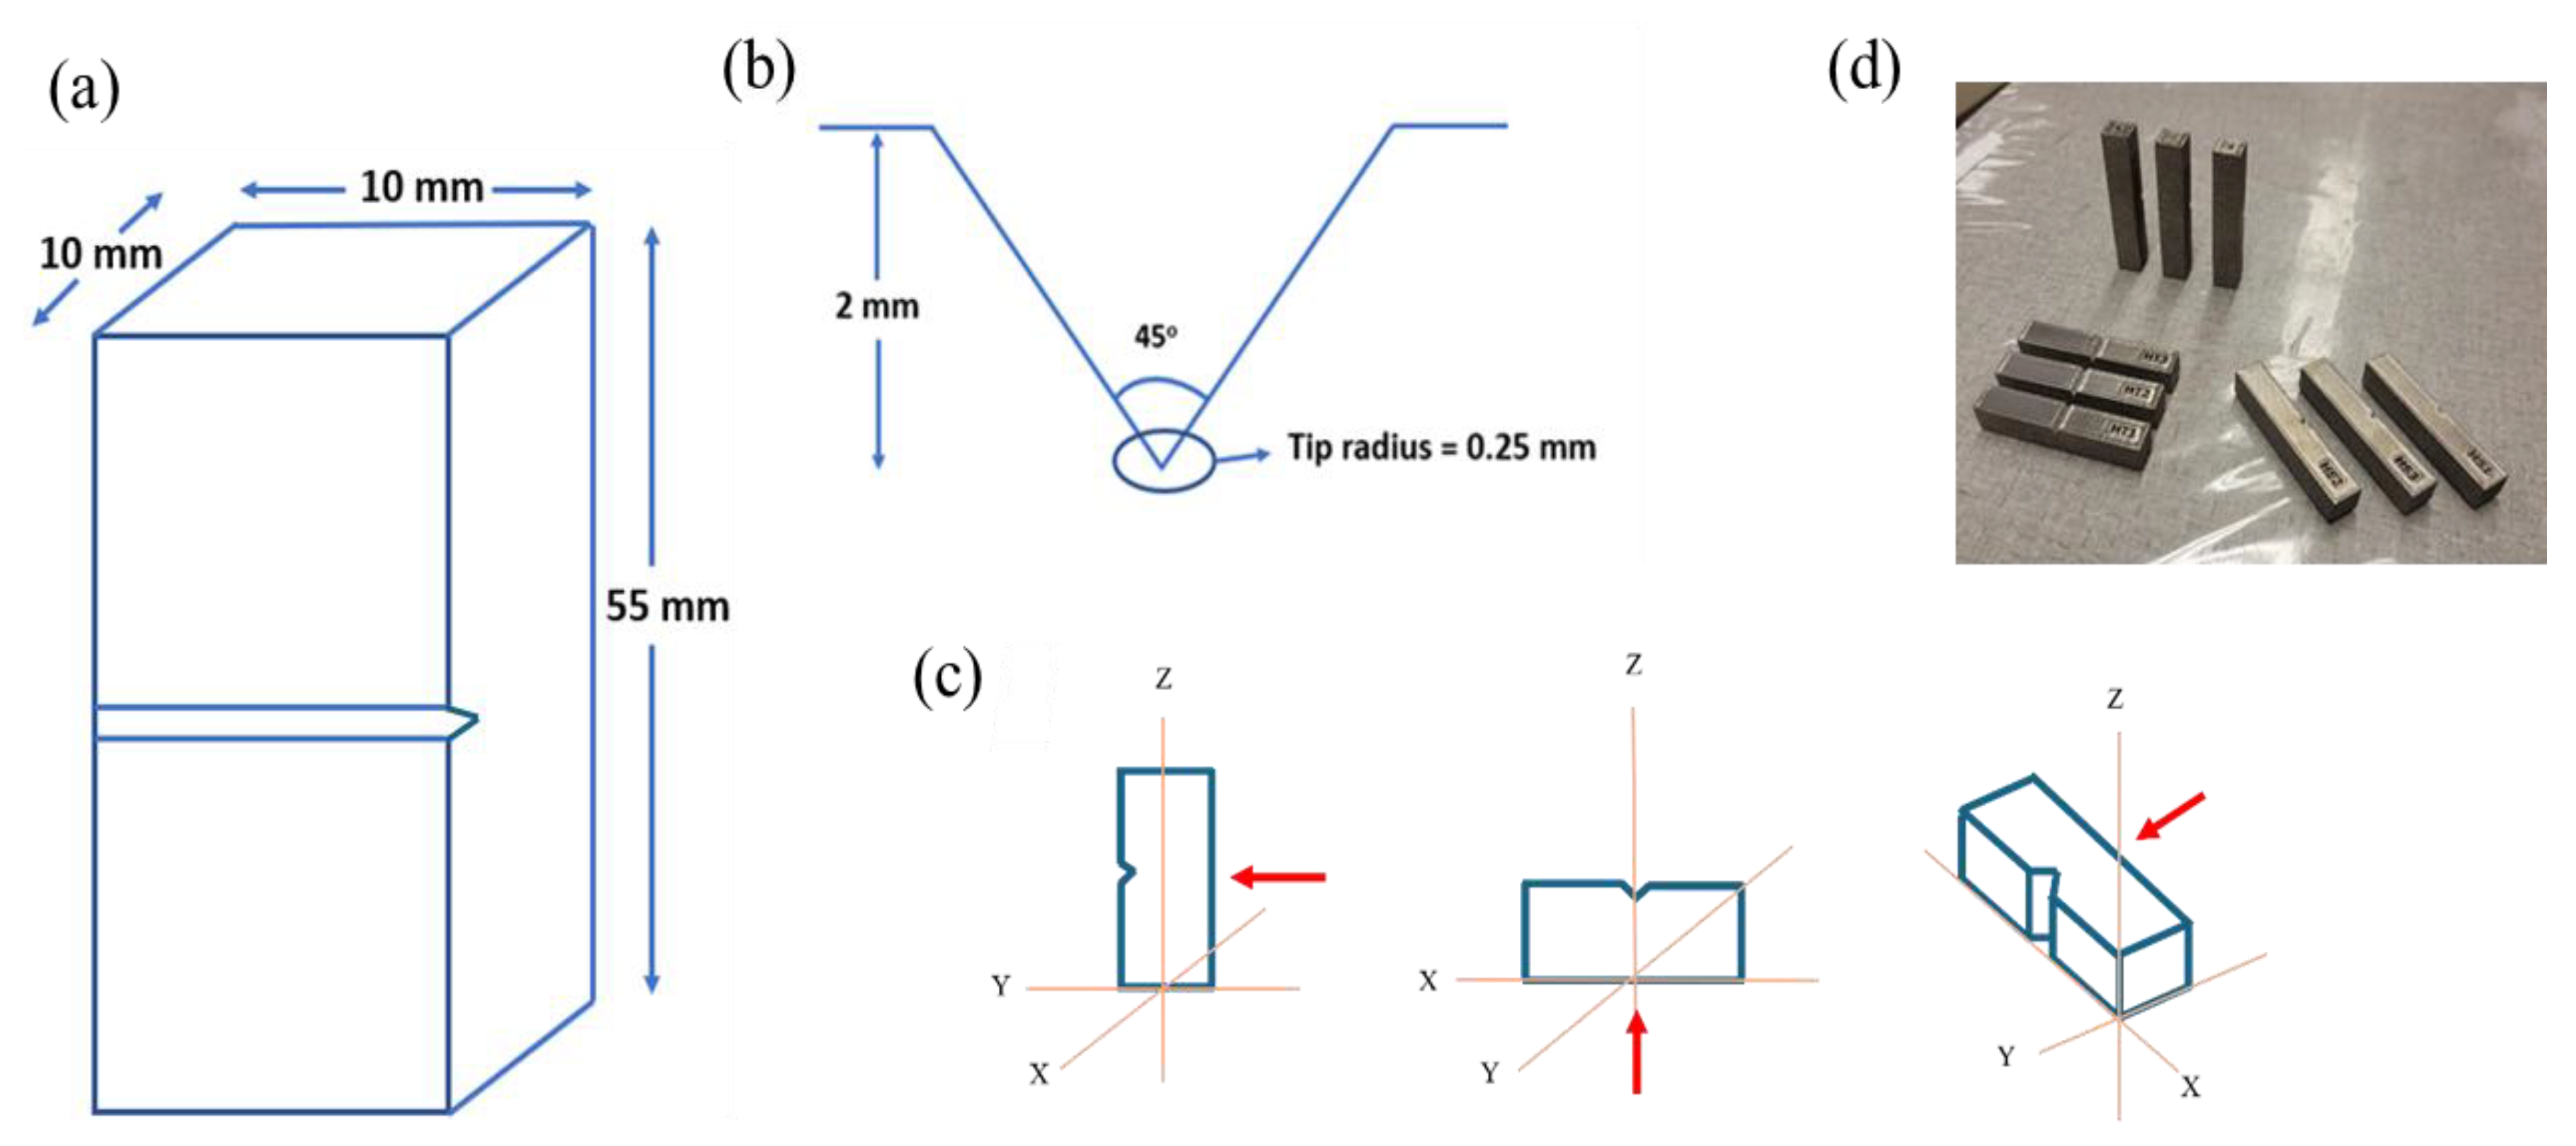
Figure 2.
Pictorial representation of Charpy impact testing and tester with a specimen loaded.
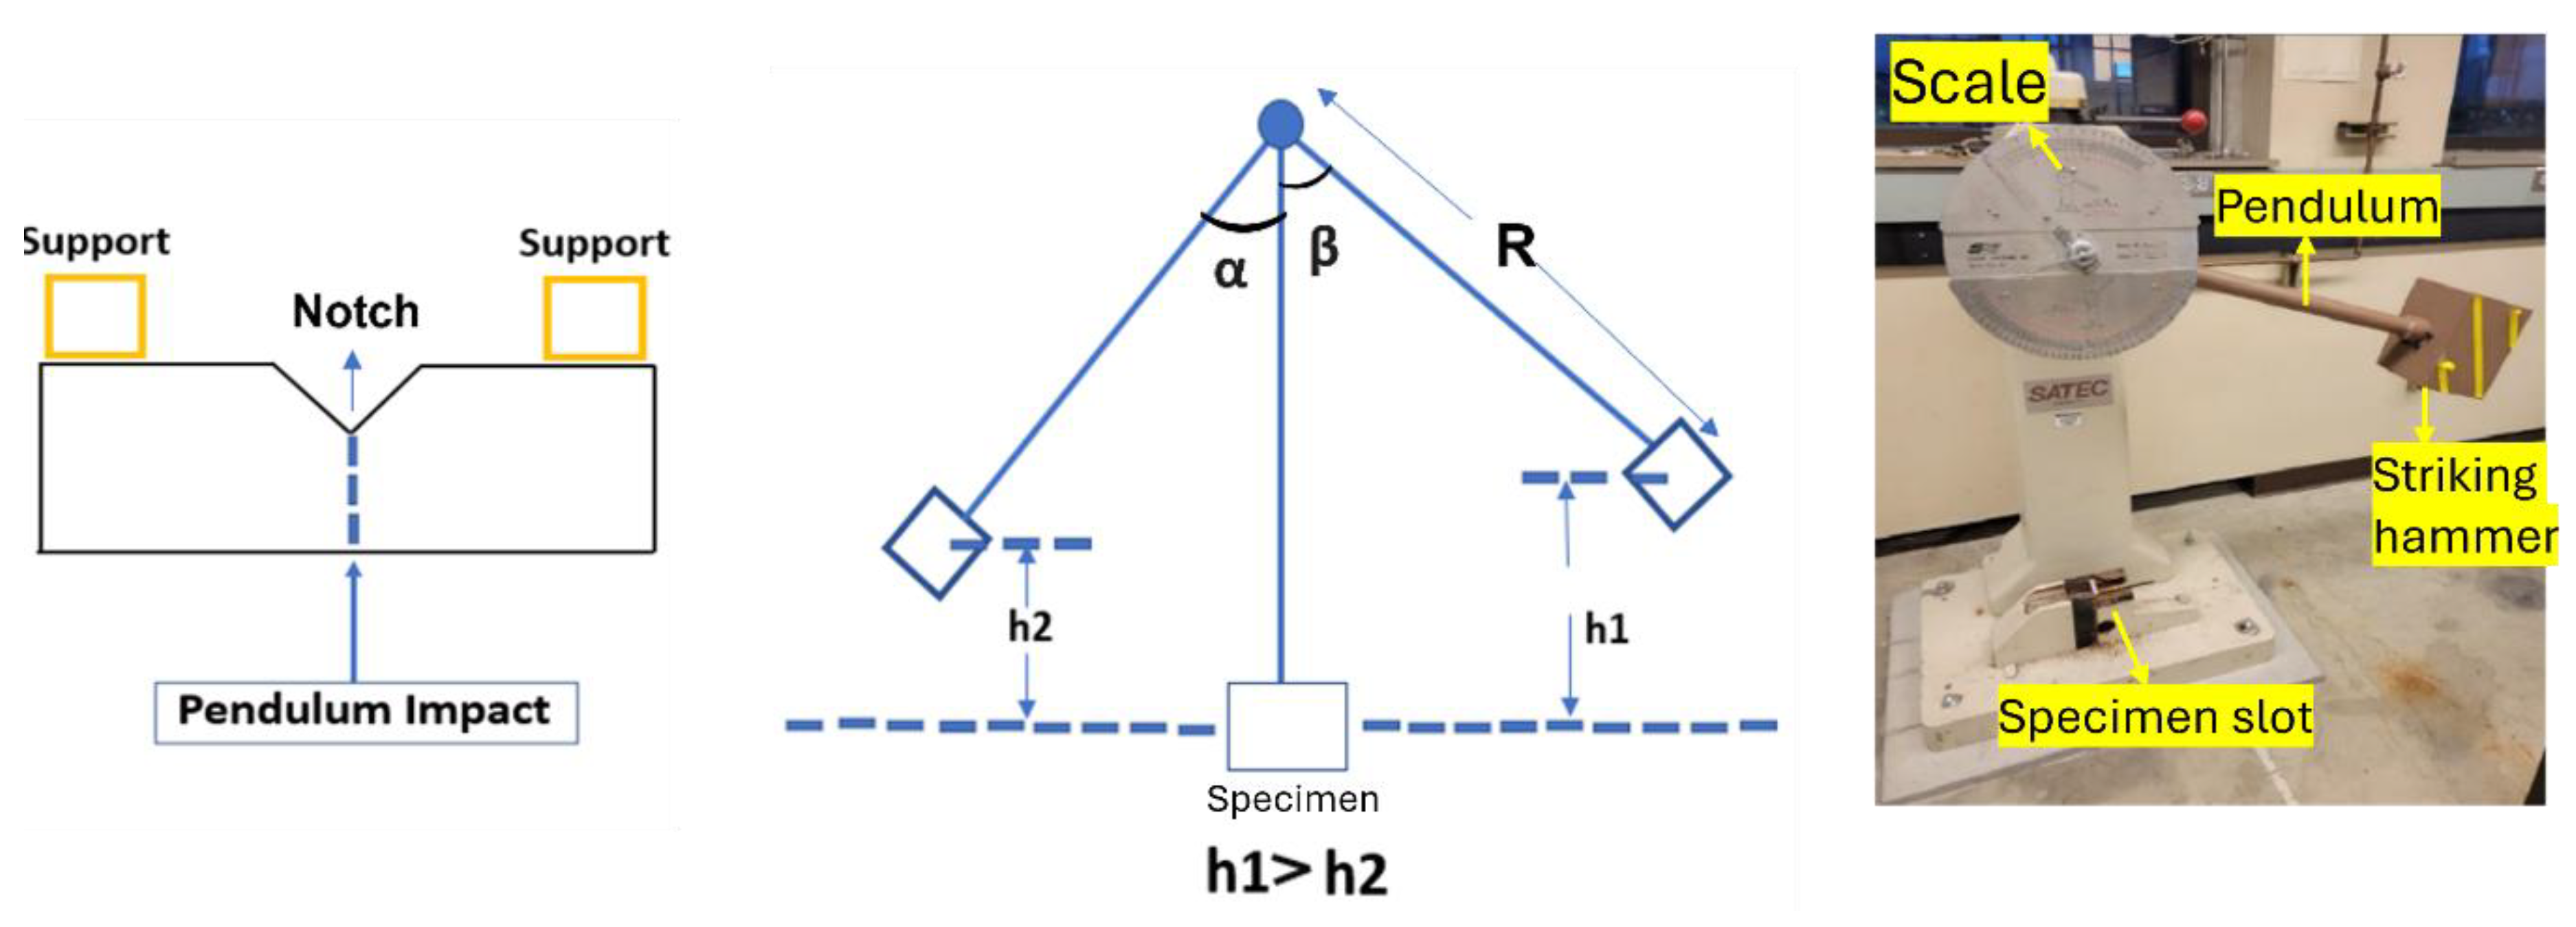
Figure 3.
Details concerning quantitative analysis of the fracture surface morphology. (a) Cracking and shearing region of a fracture surface, (b) Surface topography of fracture region (c) Shear lip height measurement.
Figure 3.
Details concerning quantitative analysis of the fracture surface morphology. (a) Cracking and shearing region of a fracture surface, (b) Surface topography of fracture region (c) Shear lip height measurement.
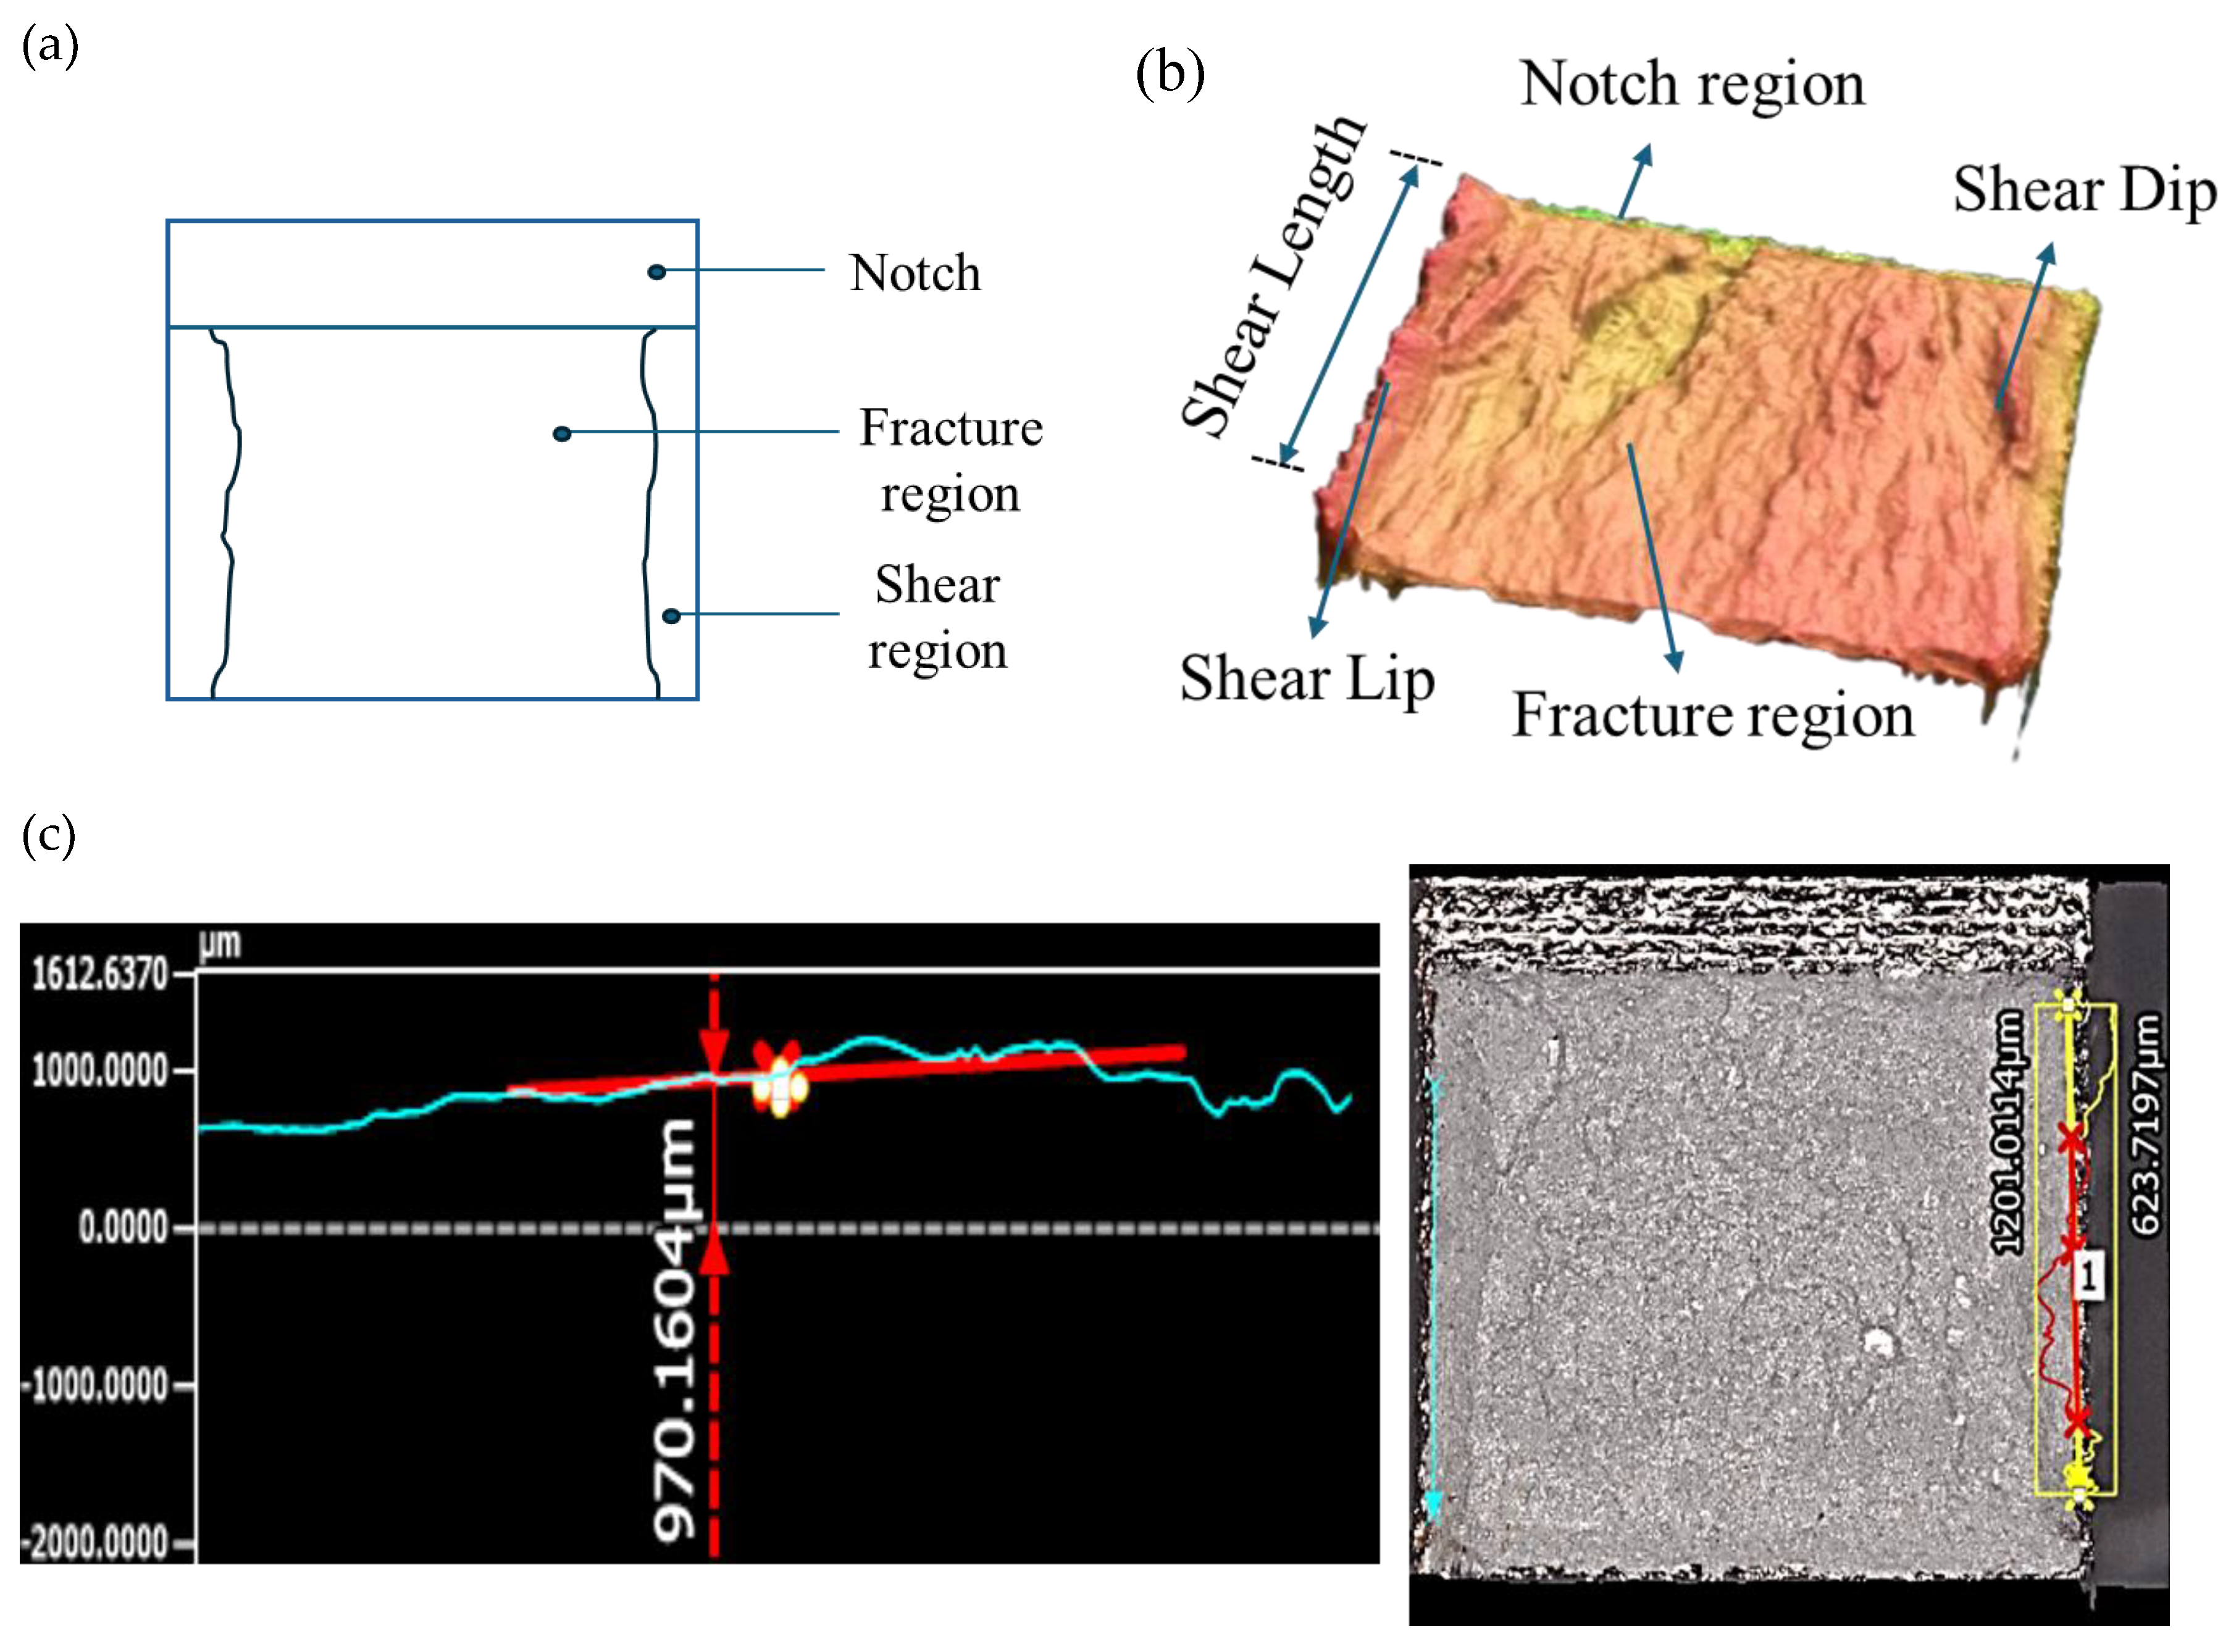
Figure 4.
Calculation of pore area and porosity percentage using ImageJ software. The numbers in yellow represent the Lack of Fusion (LOF) voids and pores visible by the naked eye.
Figure 4.
Calculation of pore area and porosity percentage using ImageJ software. The numbers in yellow represent the Lack of Fusion (LOF) voids and pores visible by the naked eye.
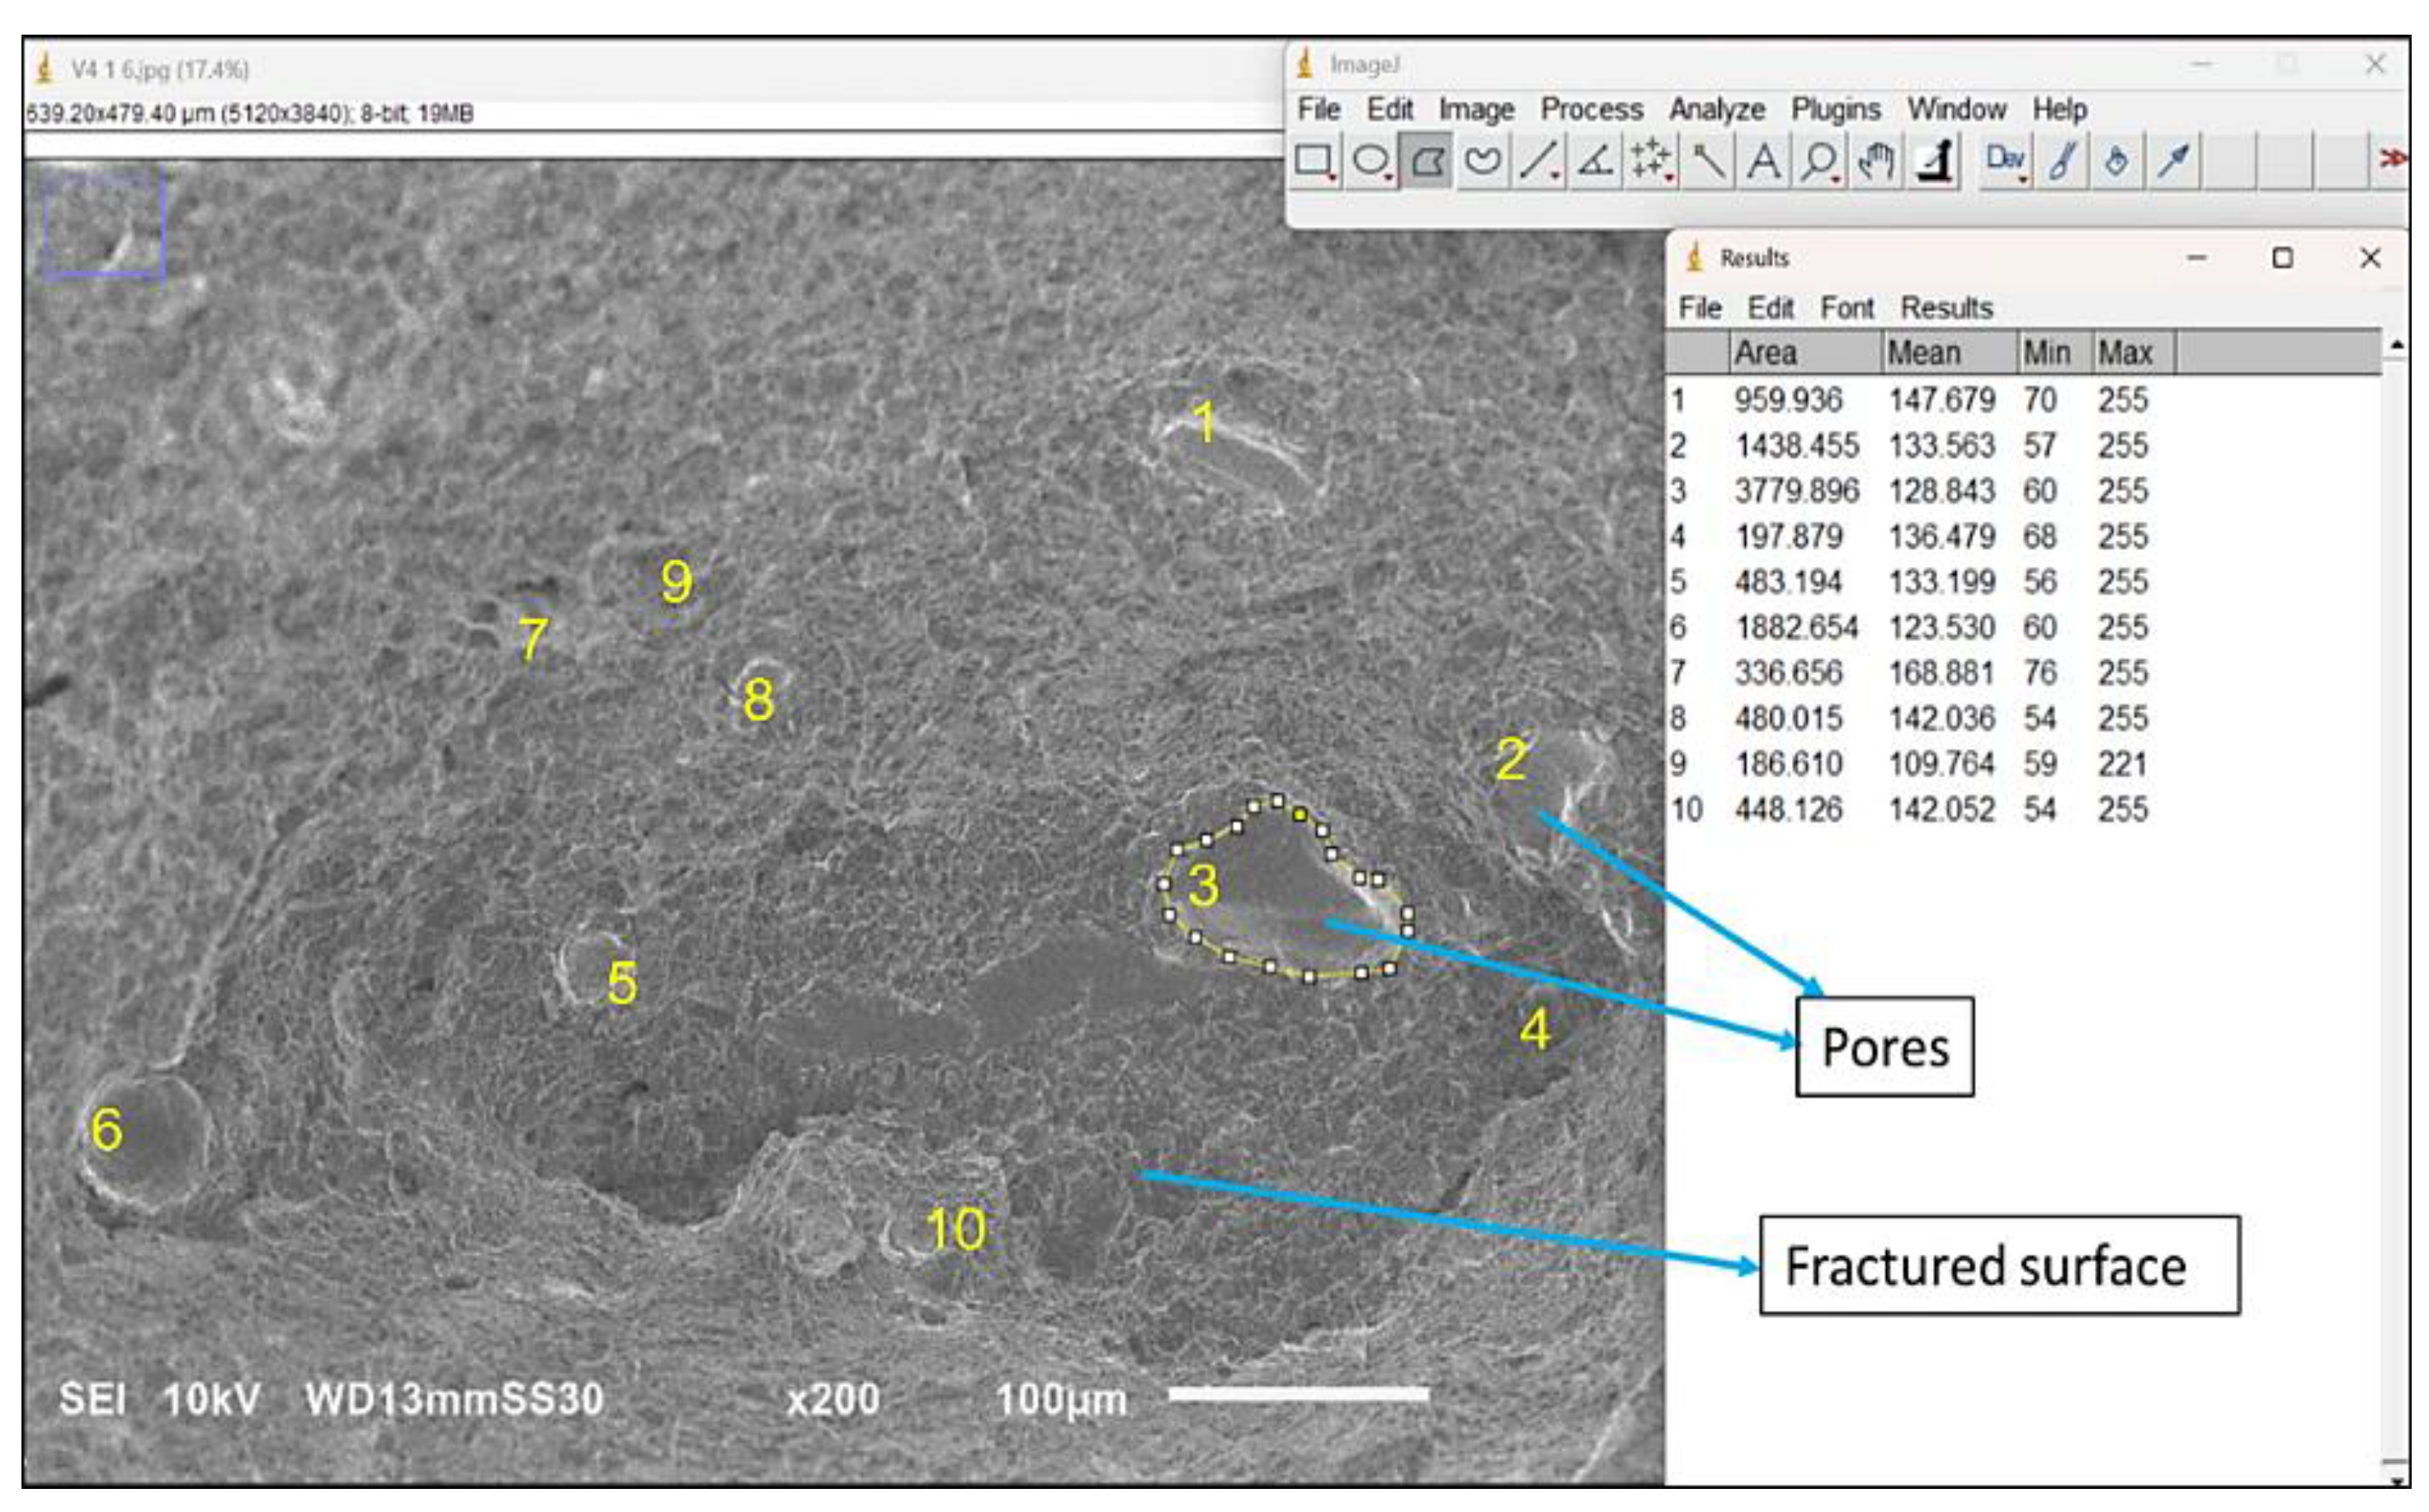
Figure 5.
Impact energy variation for (a) the three different build orientations, and (b) as a function of radial distance from the center of the build plate.
Figure 5.
Impact energy variation for (a) the three different build orientations, and (b) as a function of radial distance from the center of the build plate.
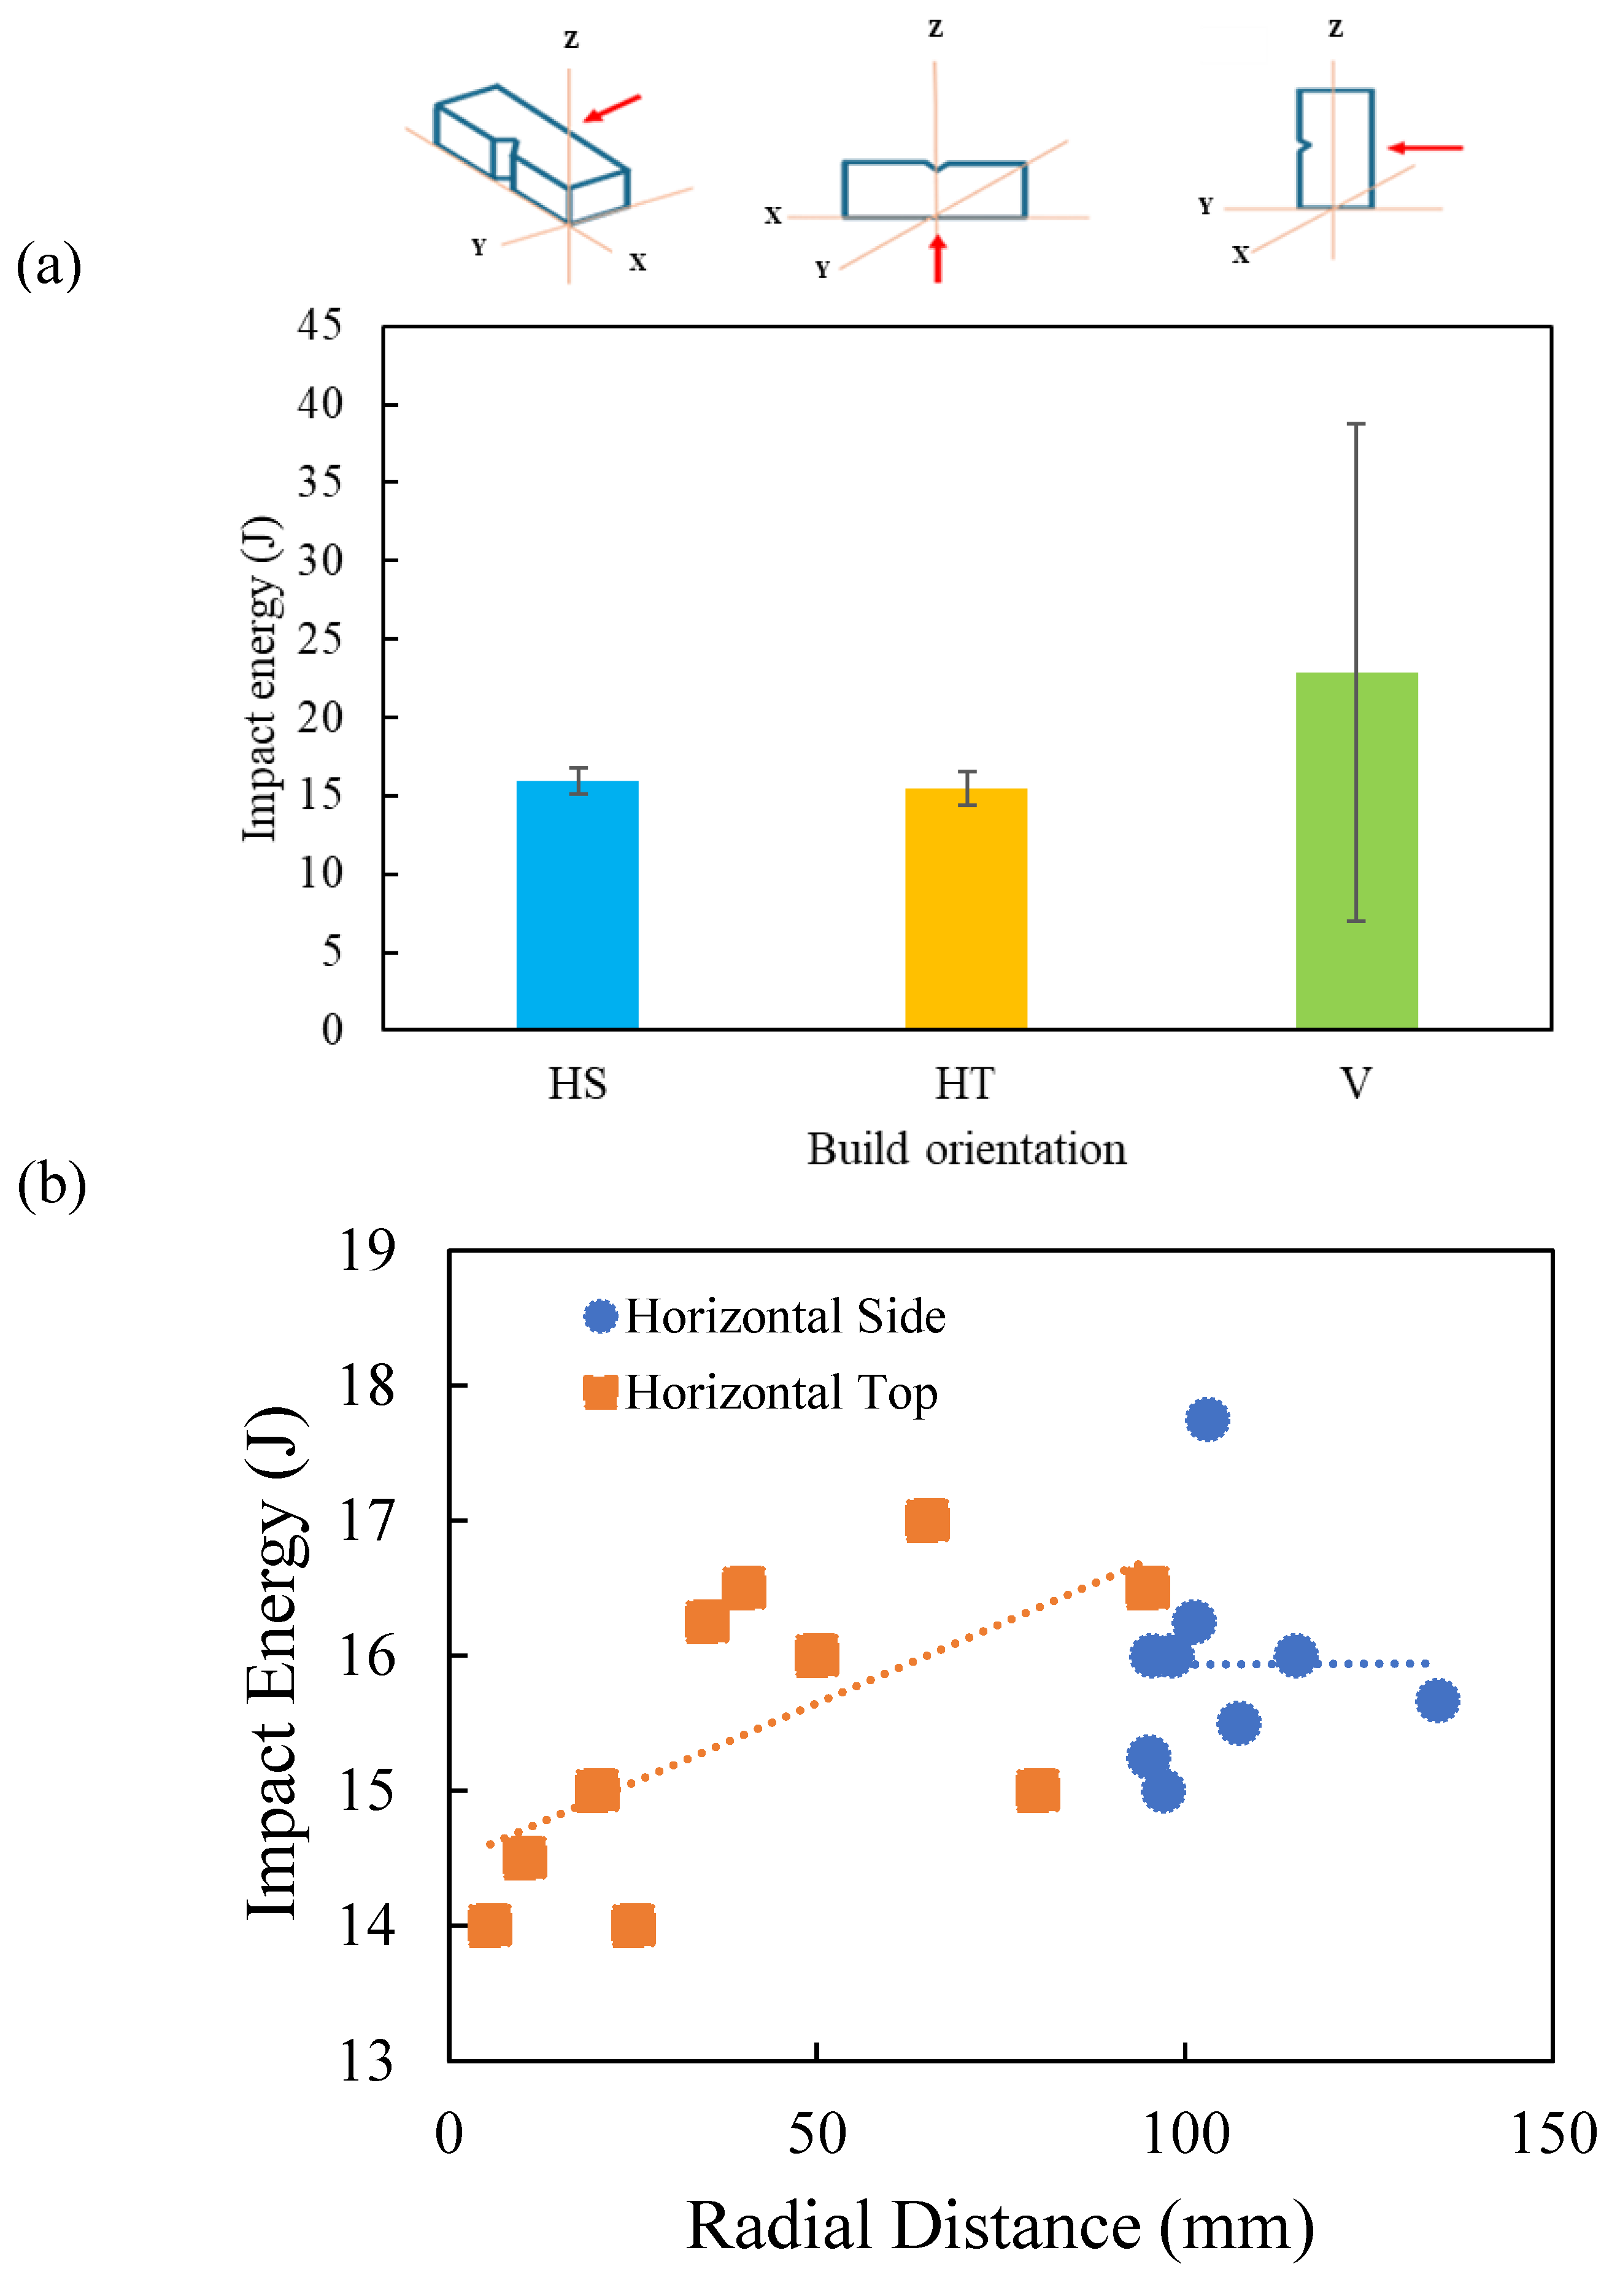
Figure 6.
The surface topography of the fractured EB-PBF Ti6AL4V. The height scale is overlayed on the left edge on each color plot with maximum and minimum height values indicated. The measured shear lip area, average shear lip height, and absorbed impact energy are listed inside parentheses.
Figure 6.
The surface topography of the fractured EB-PBF Ti6AL4V. The height scale is overlayed on the left edge on each color plot with maximum and minimum height values indicated. The measured shear lip area, average shear lip height, and absorbed impact energy are listed inside parentheses.
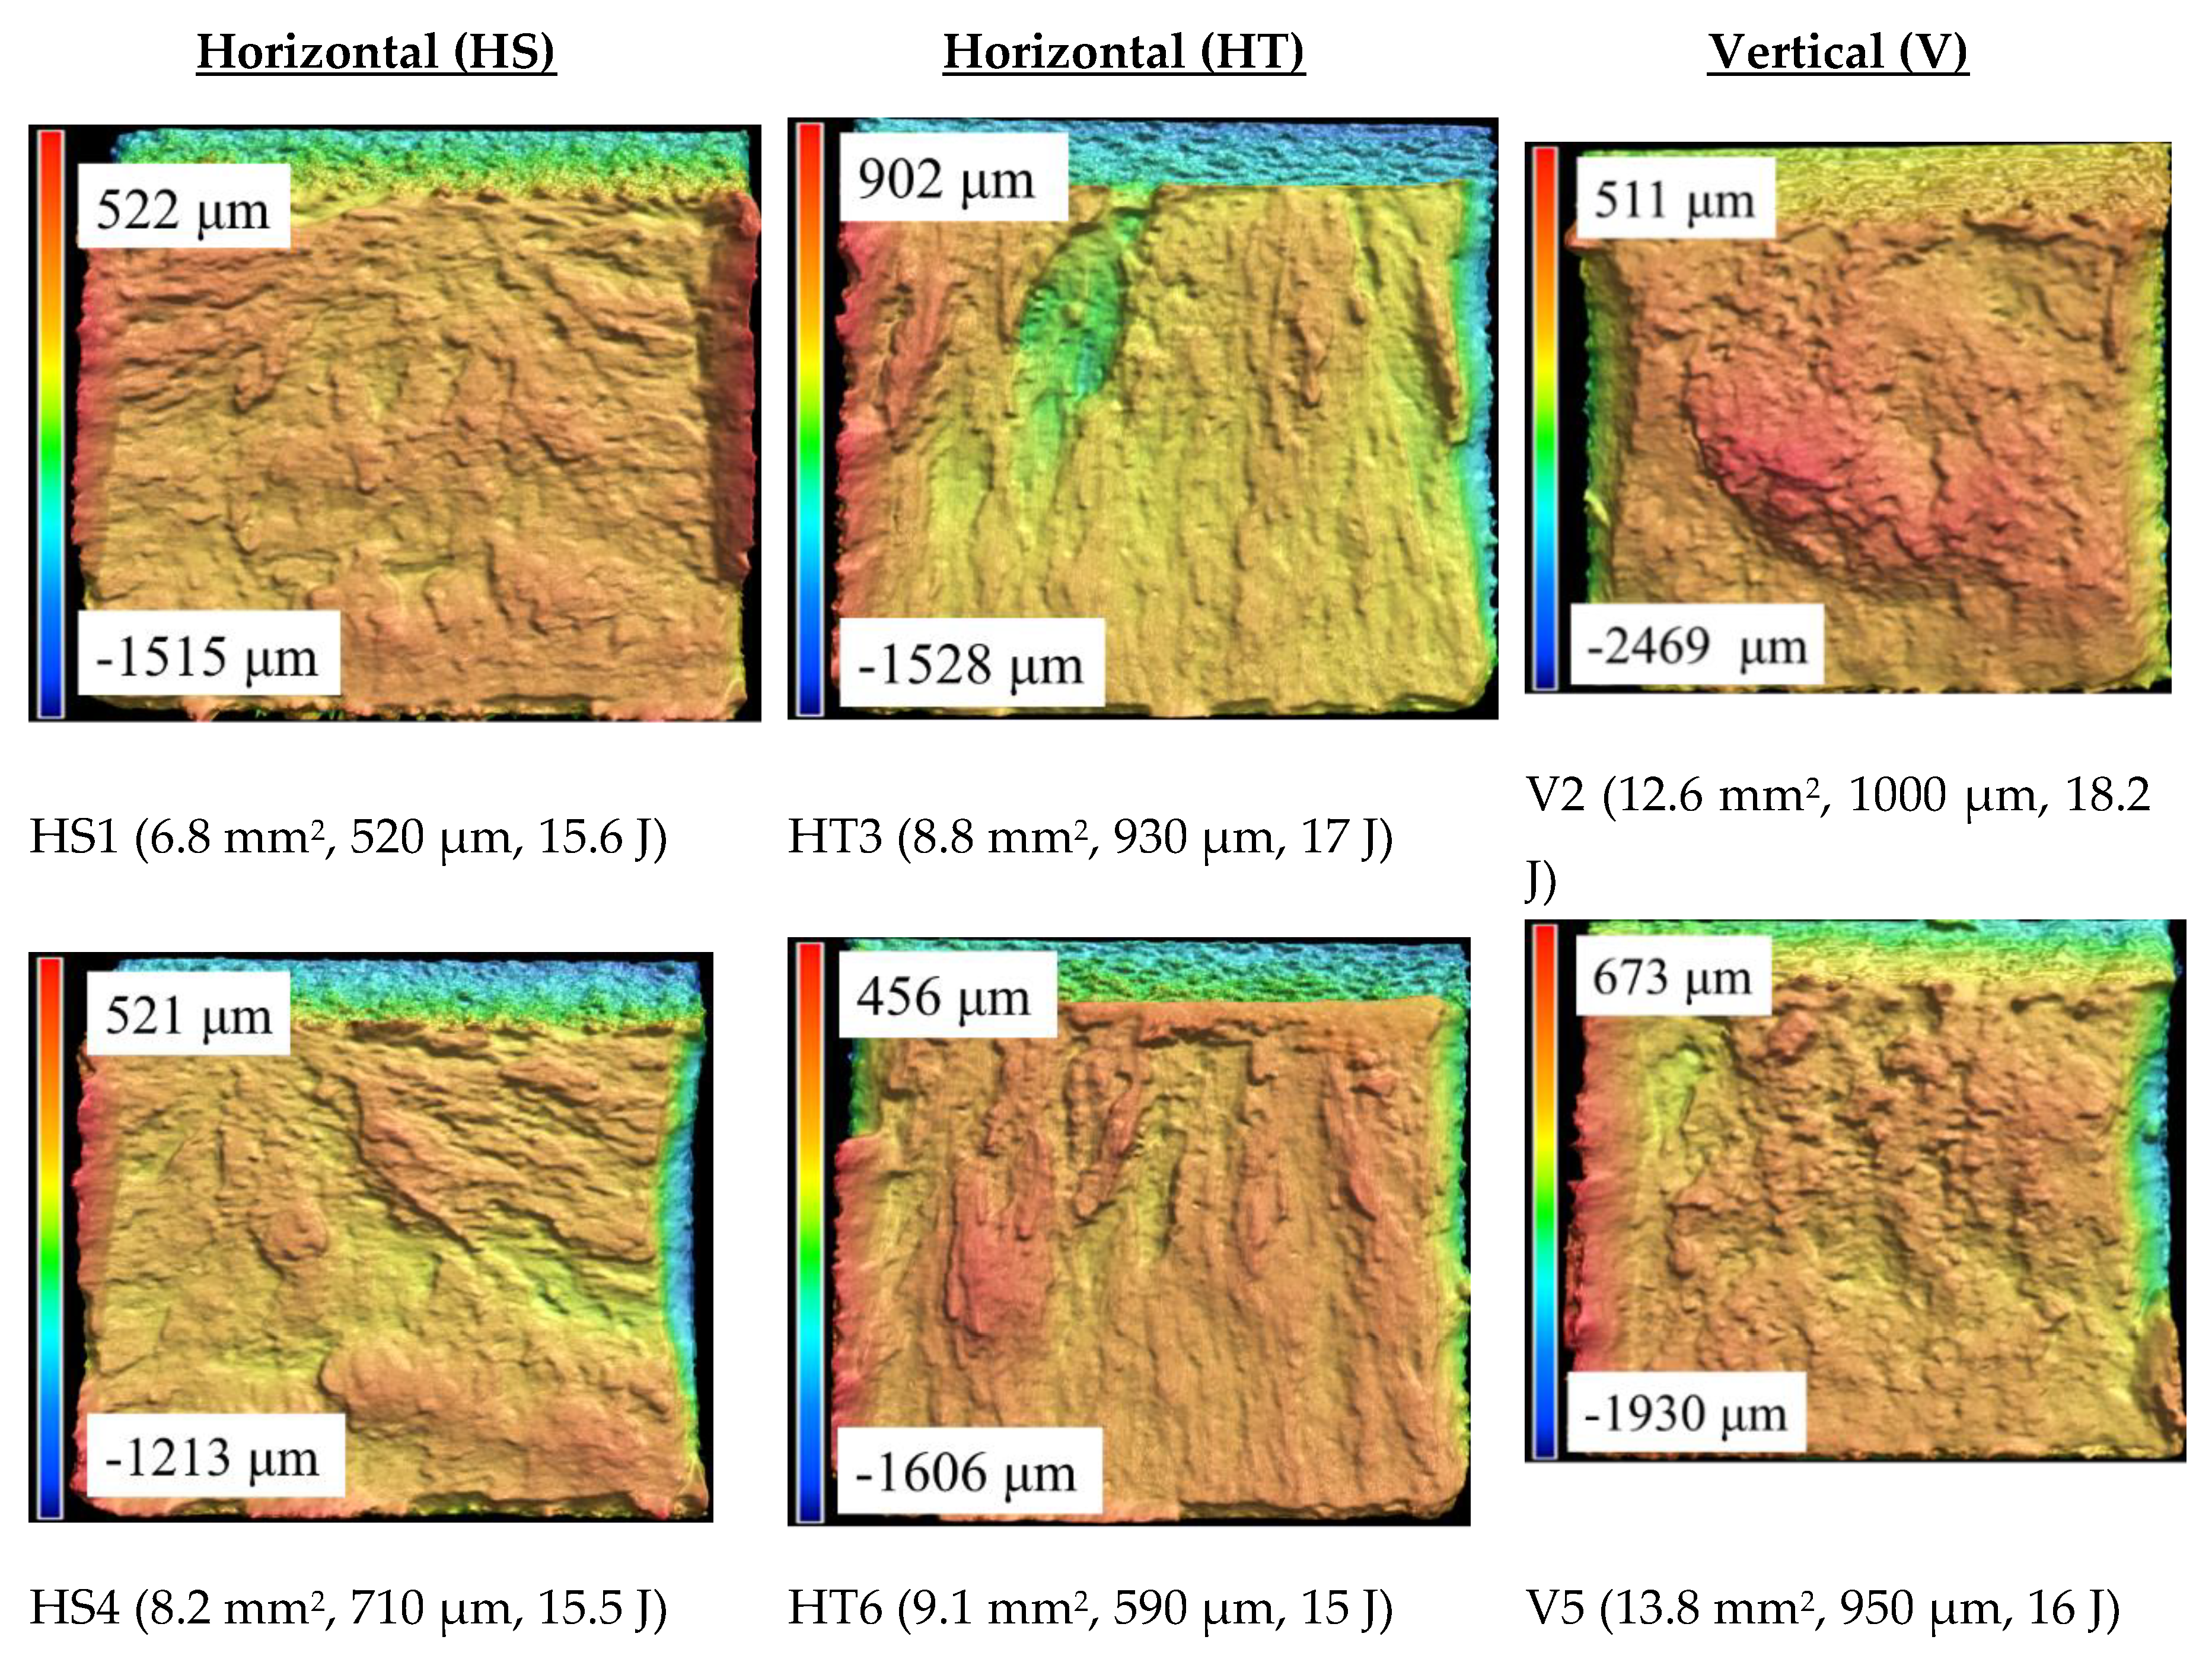
Figure 7.
Distribution of average measured (a) average shear area, (b) average shear lip height, (c) average shear width, (d) MCSL and MCSD lengths, for the three build orientations.
Figure 7.
Distribution of average measured (a) average shear area, (b) average shear lip height, (c) average shear width, (d) MCSL and MCSD lengths, for the three build orientations.
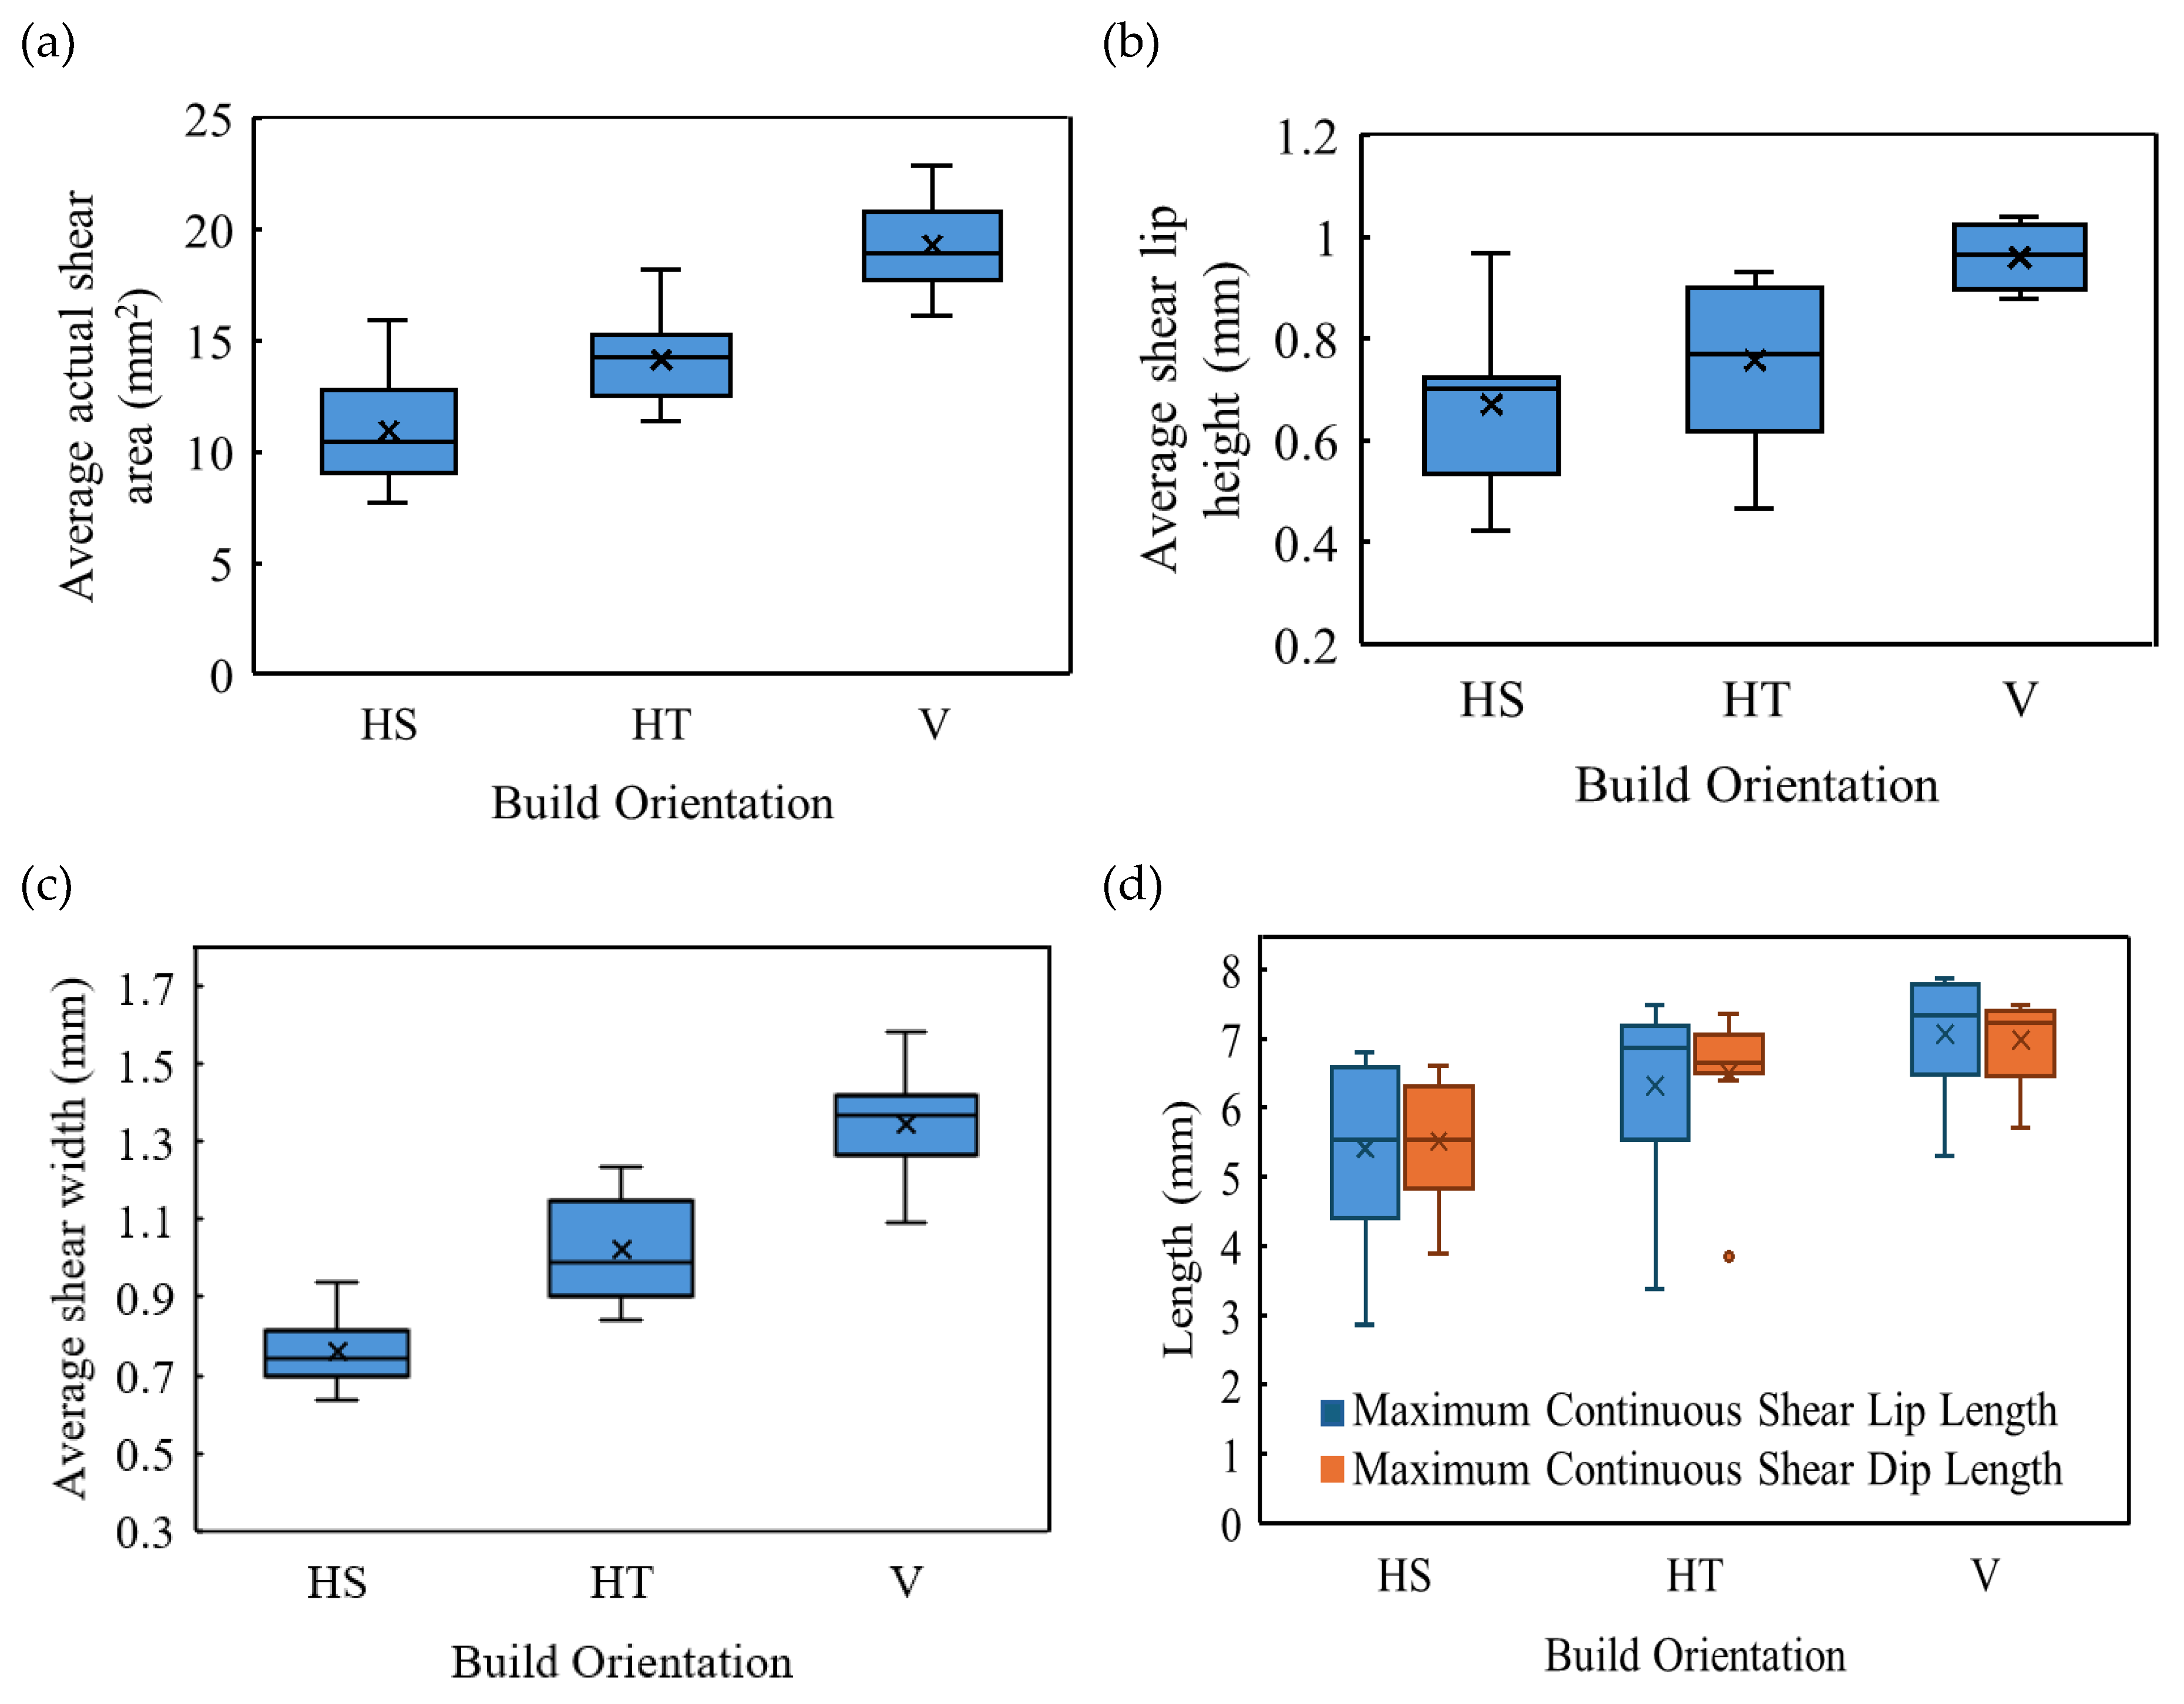
Figure 8.
Sectioned views of the fracture surface, crack path and prior-β columnar grains within the microstructure of EB-PBF Ti6Al4V (a-d) horizontal specimens, (e-h) vertical specimen. The prior-β grains are highlighted with red dashed line. Schematics of prior - β columnar grains, crack direction, and fractured surfaces are provided for both orientations on the right to the microstructure images.
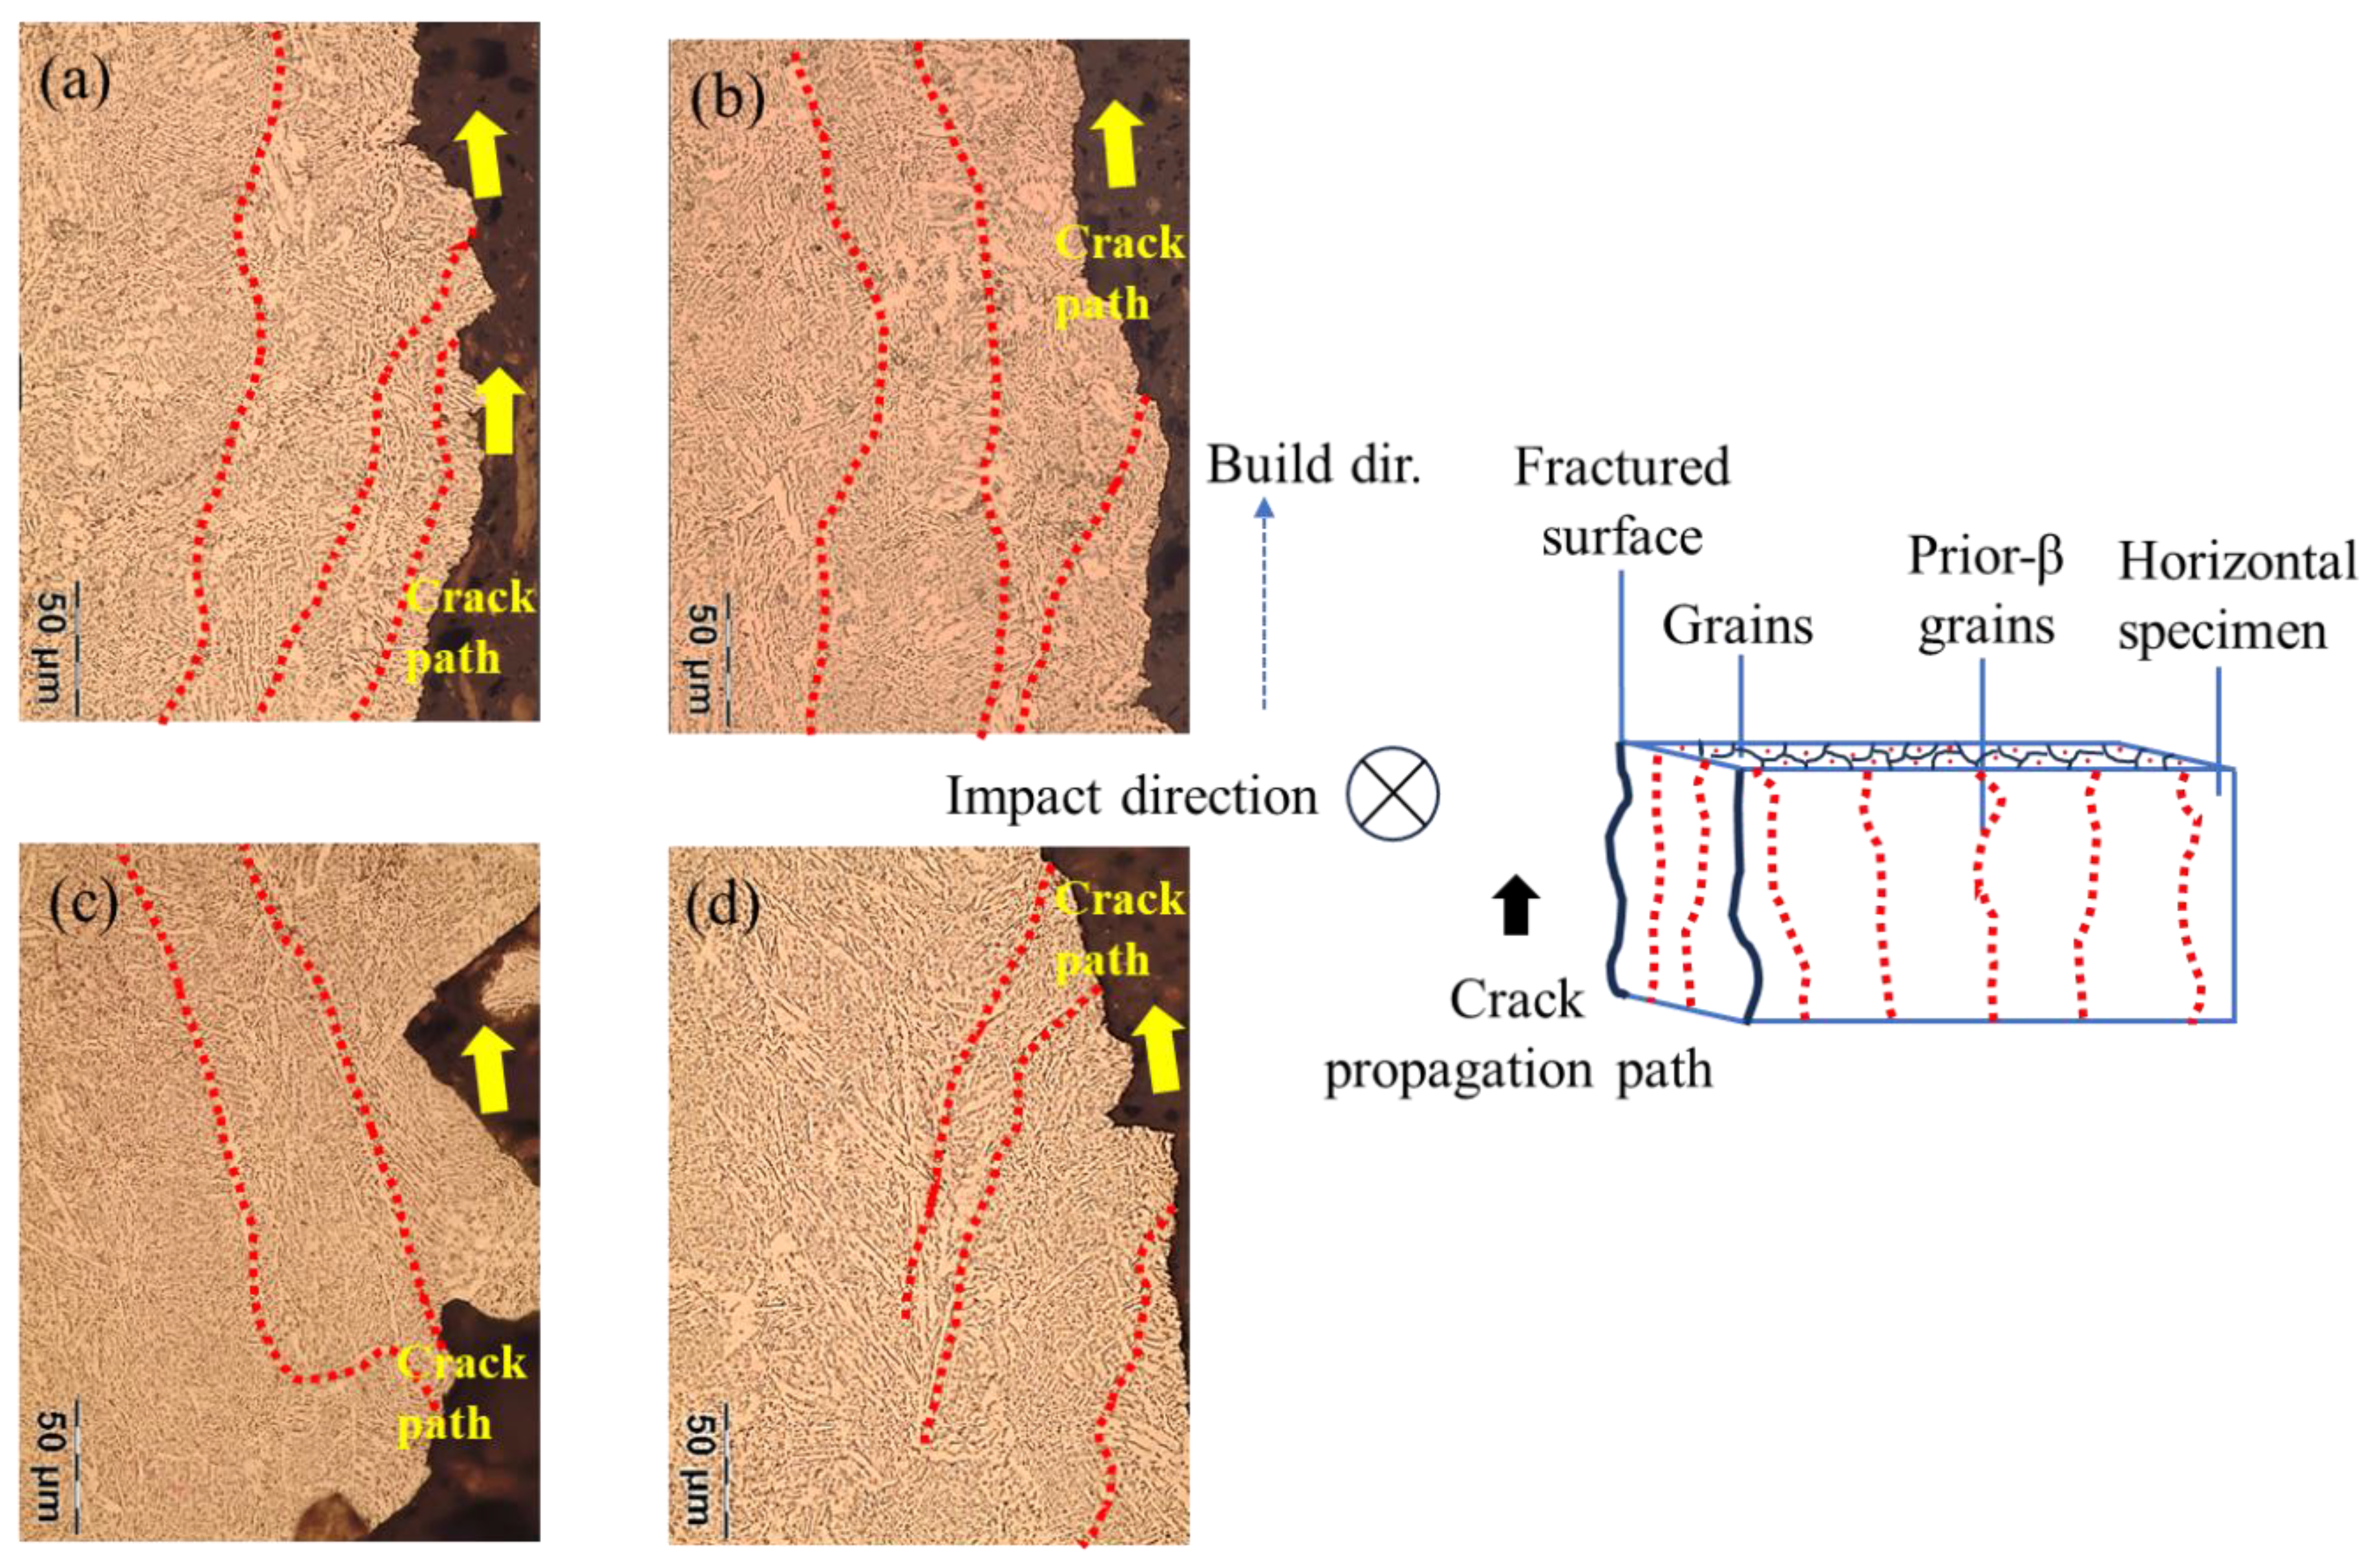
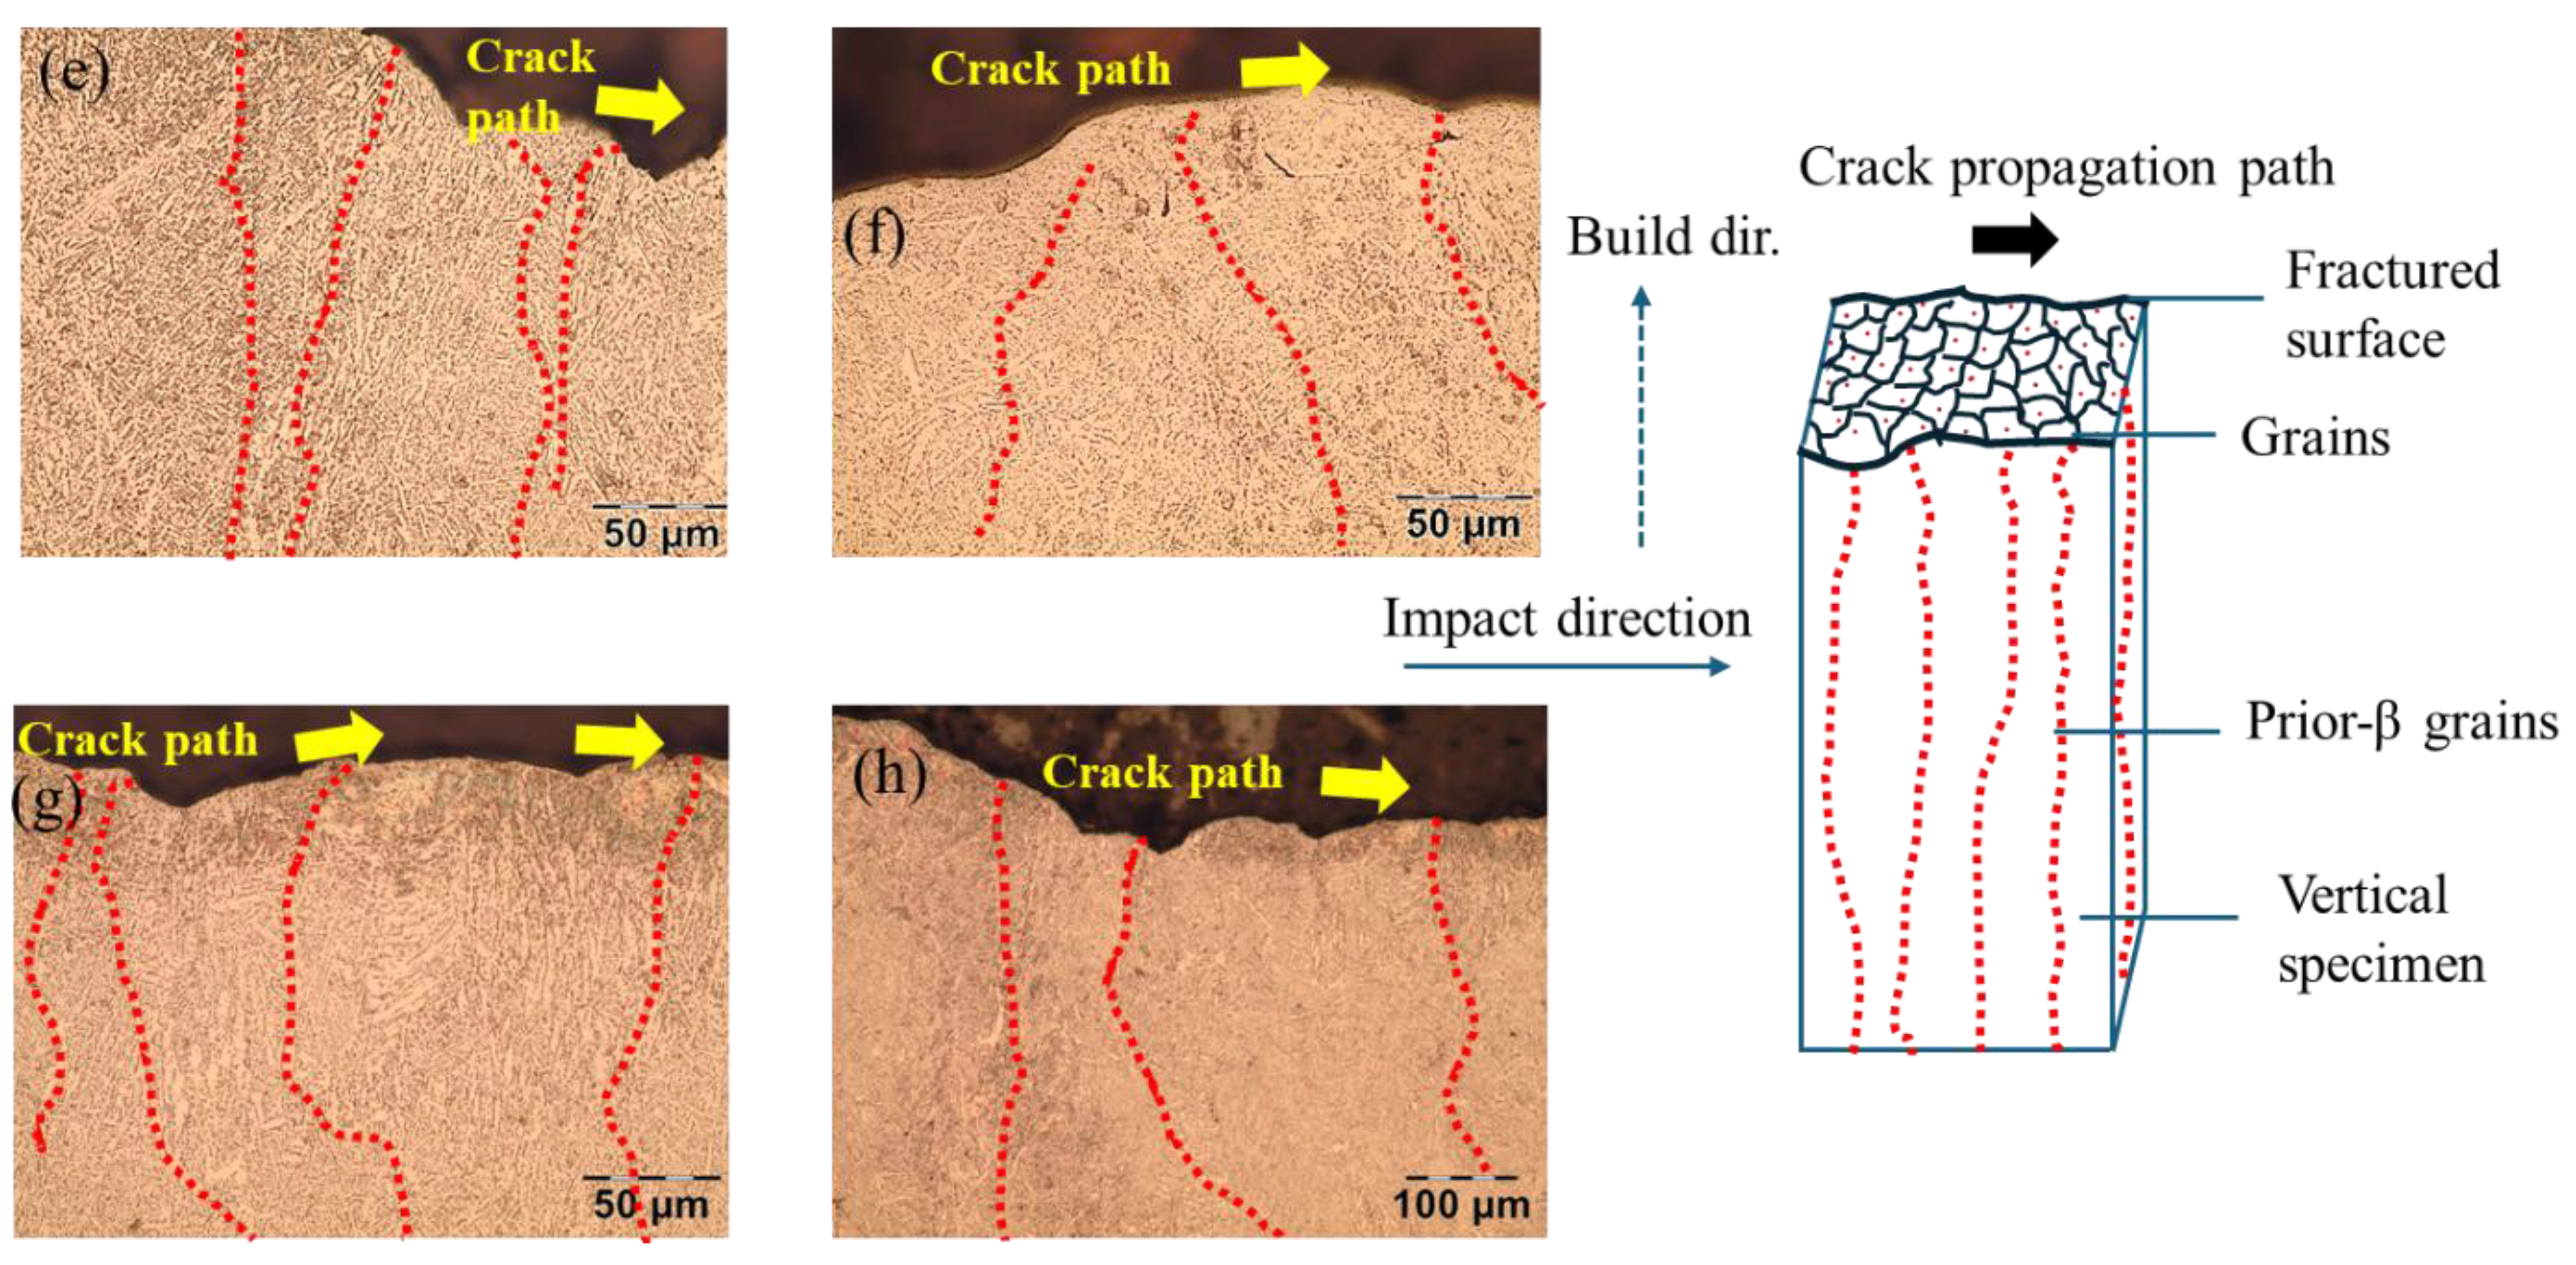
Figure 9.
SEM images of fractured EB-PBF specimens with (a) Horizontal (HT) – 60x, (b) Horizontal (HT) – 160x, (c) Vertical (V) – 200x, and (d) Vertical (V) – 200x orientations. The yellow arrows in these images highlight the fracture flutes.
Figure 9.
SEM images of fractured EB-PBF specimens with (a) Horizontal (HT) – 60x, (b) Horizontal (HT) – 160x, (c) Vertical (V) – 200x, and (d) Vertical (V) – 200x orientations. The yellow arrows in these images highlight the fracture flutes.
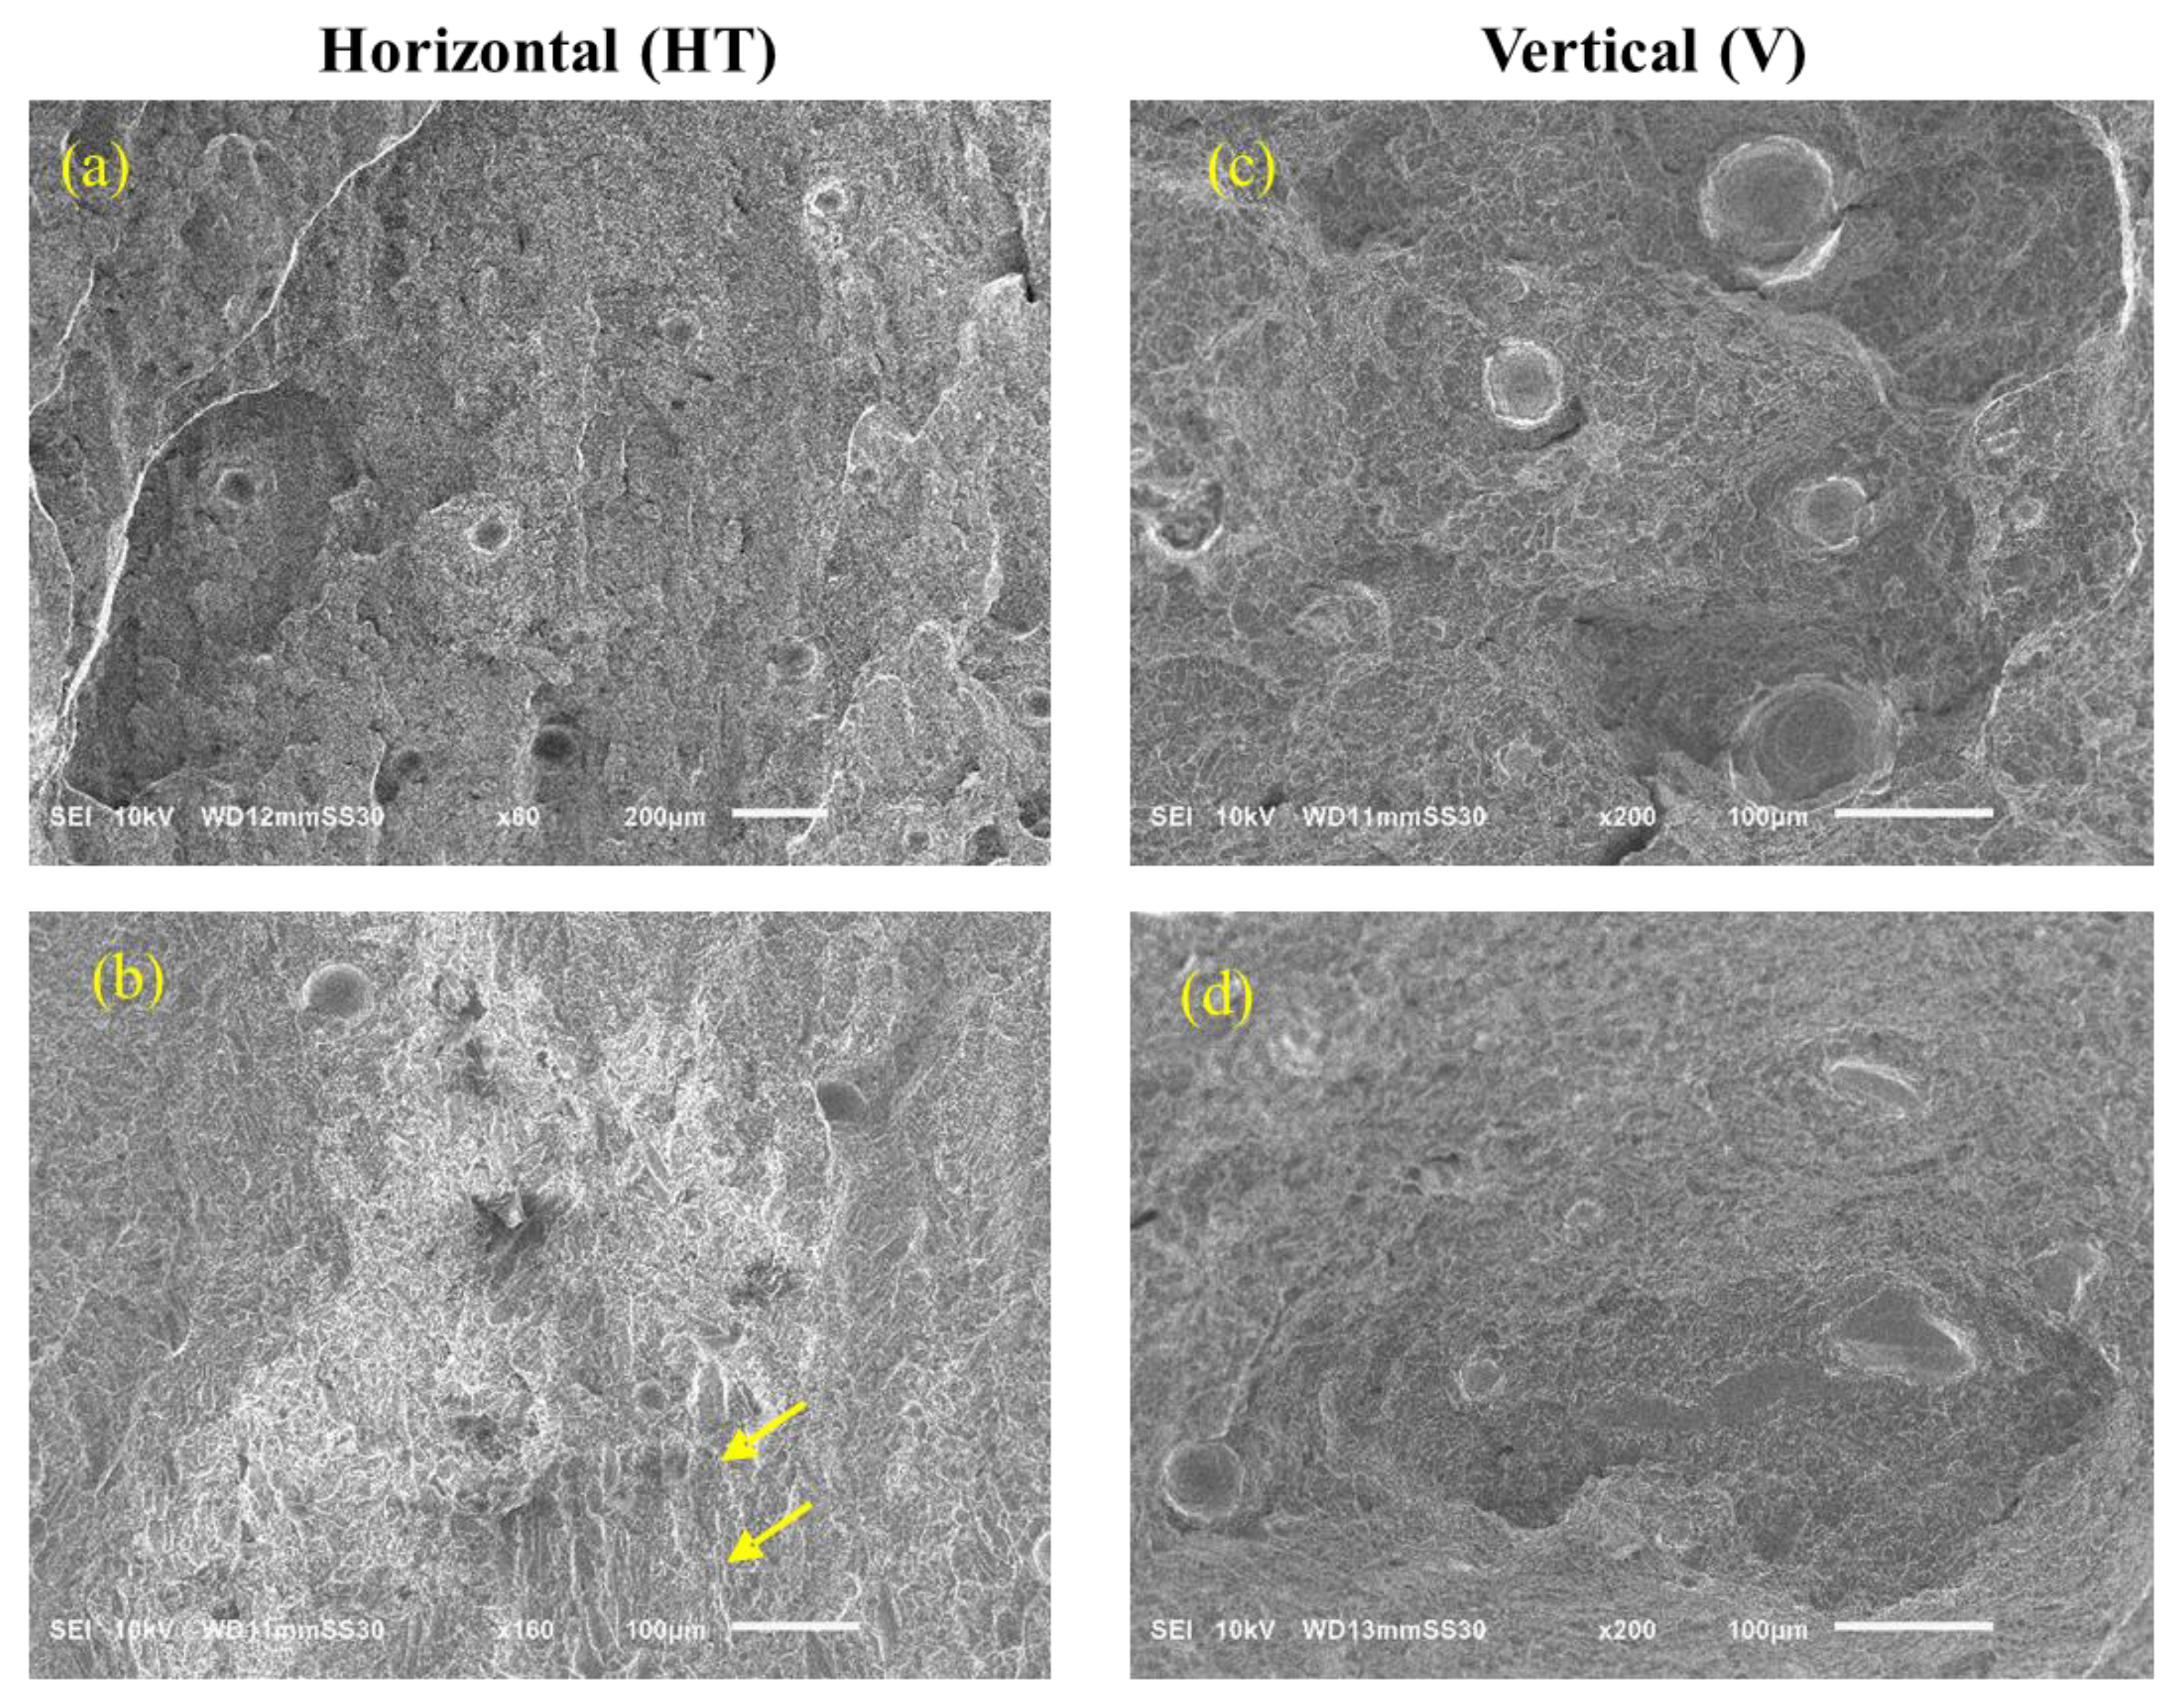
Figure 11.
Distribution in notch toughness with respect to (a) average shear lip height, (b) average shear lip width.
Figure 11.
Distribution in notch toughness with respect to (a) average shear lip height, (b) average shear lip width.
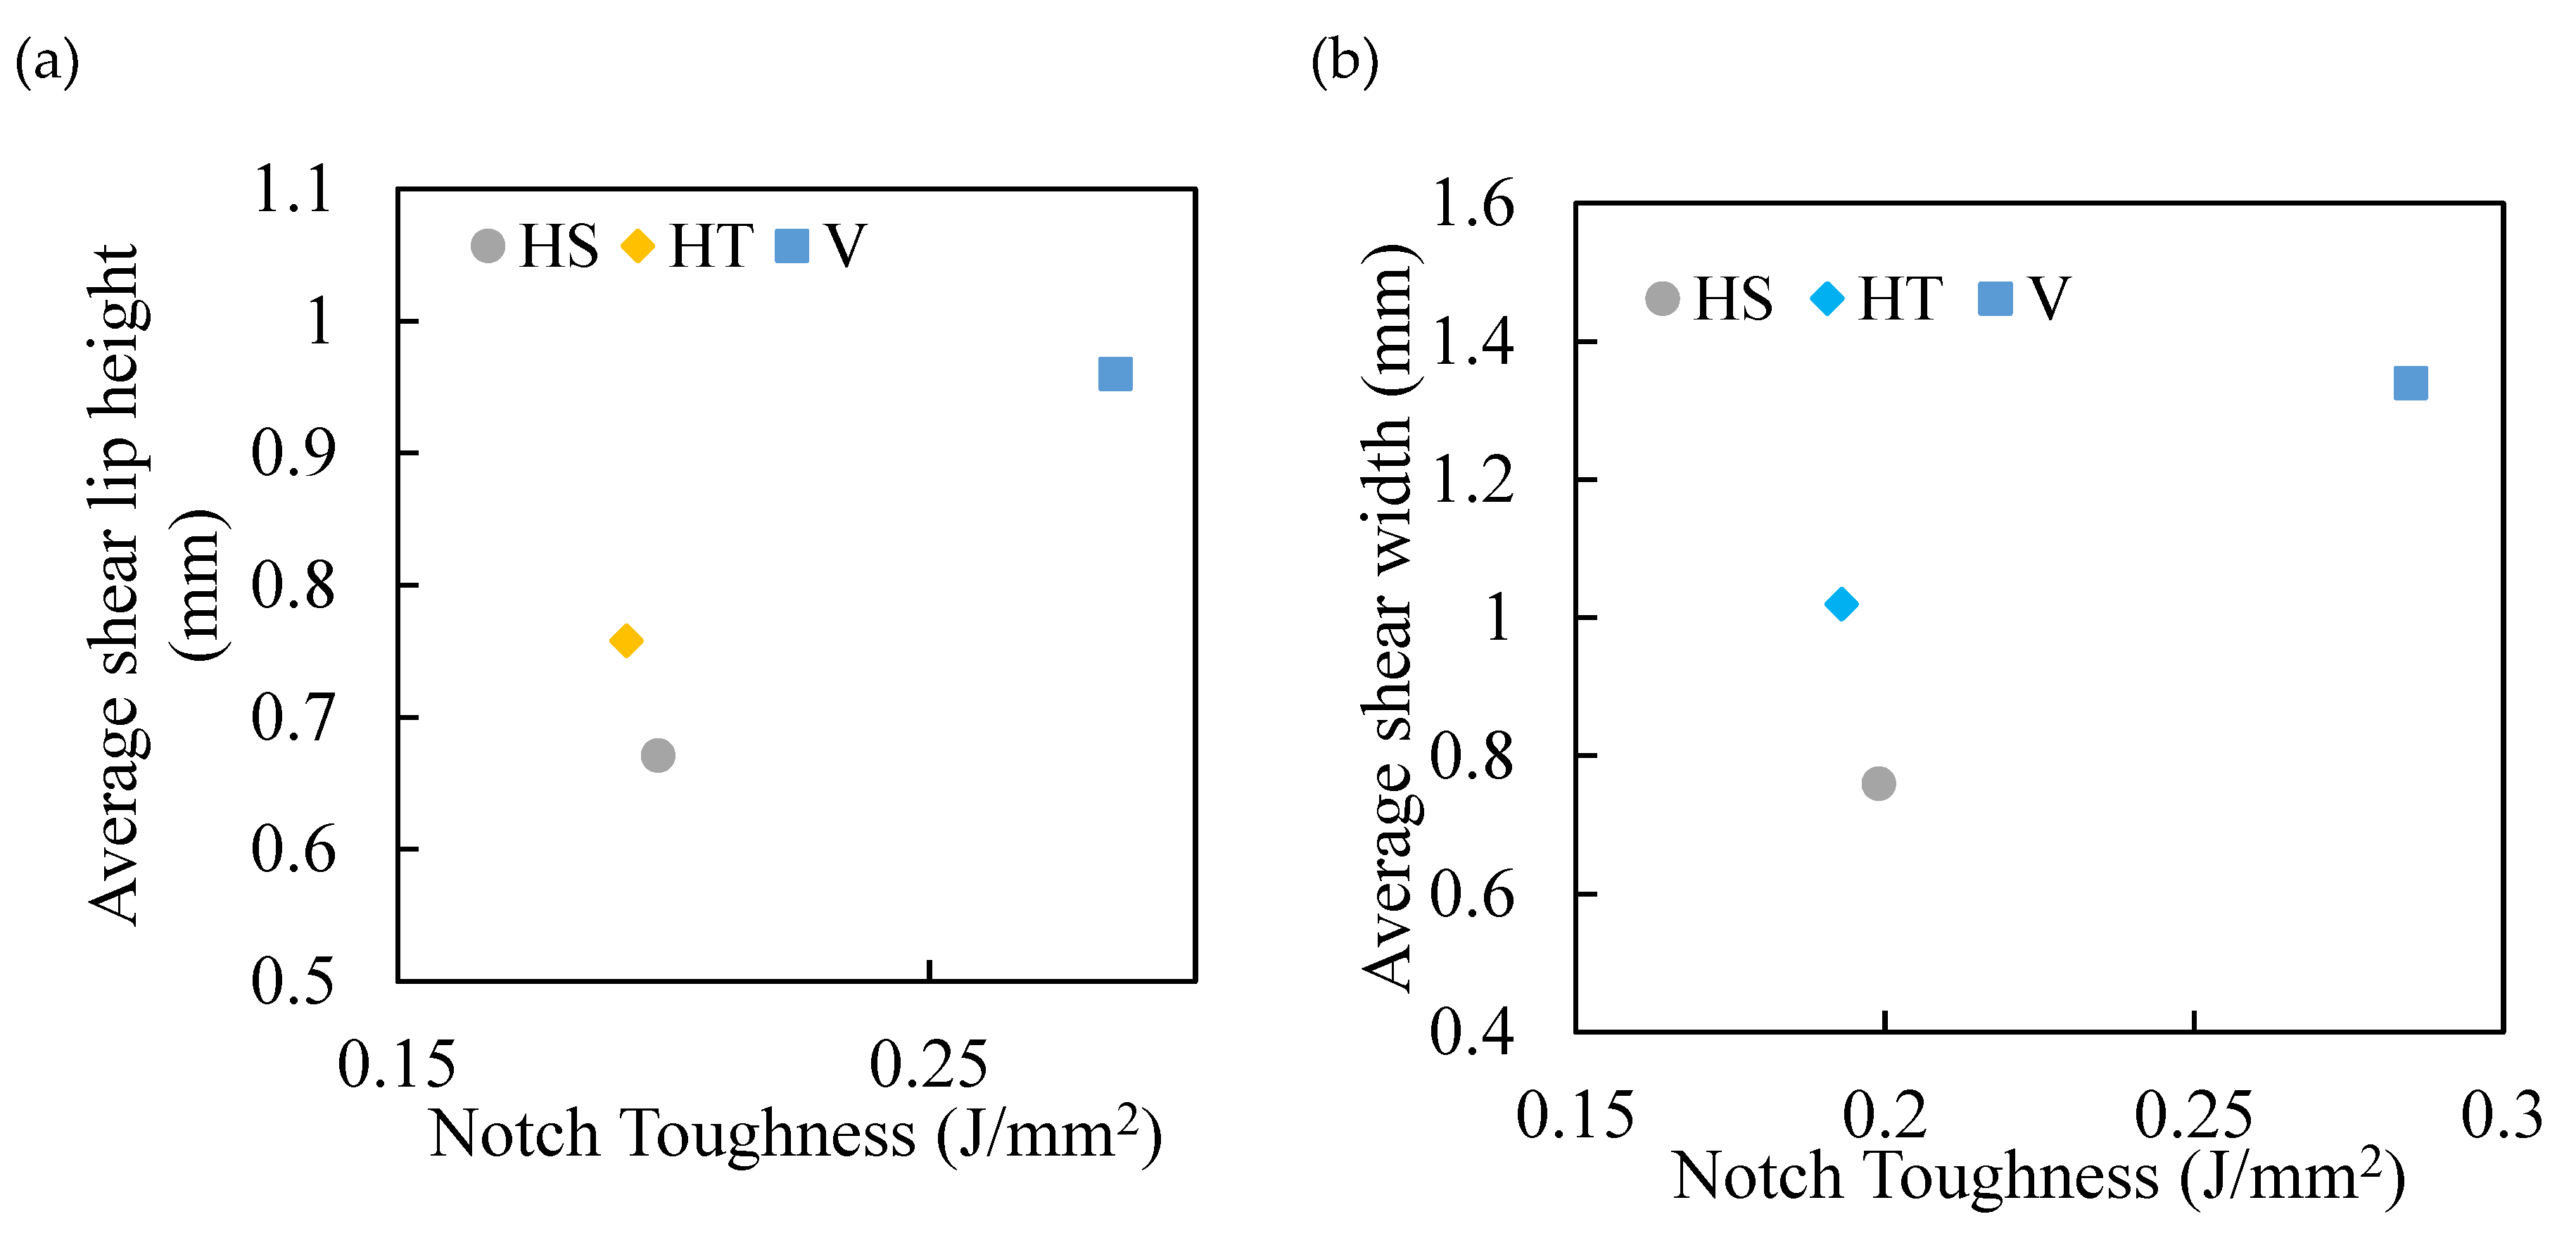
Figure 12.
The intrinsic relationship between KIC and values in EB-PBF Ti6Al4V alloy.
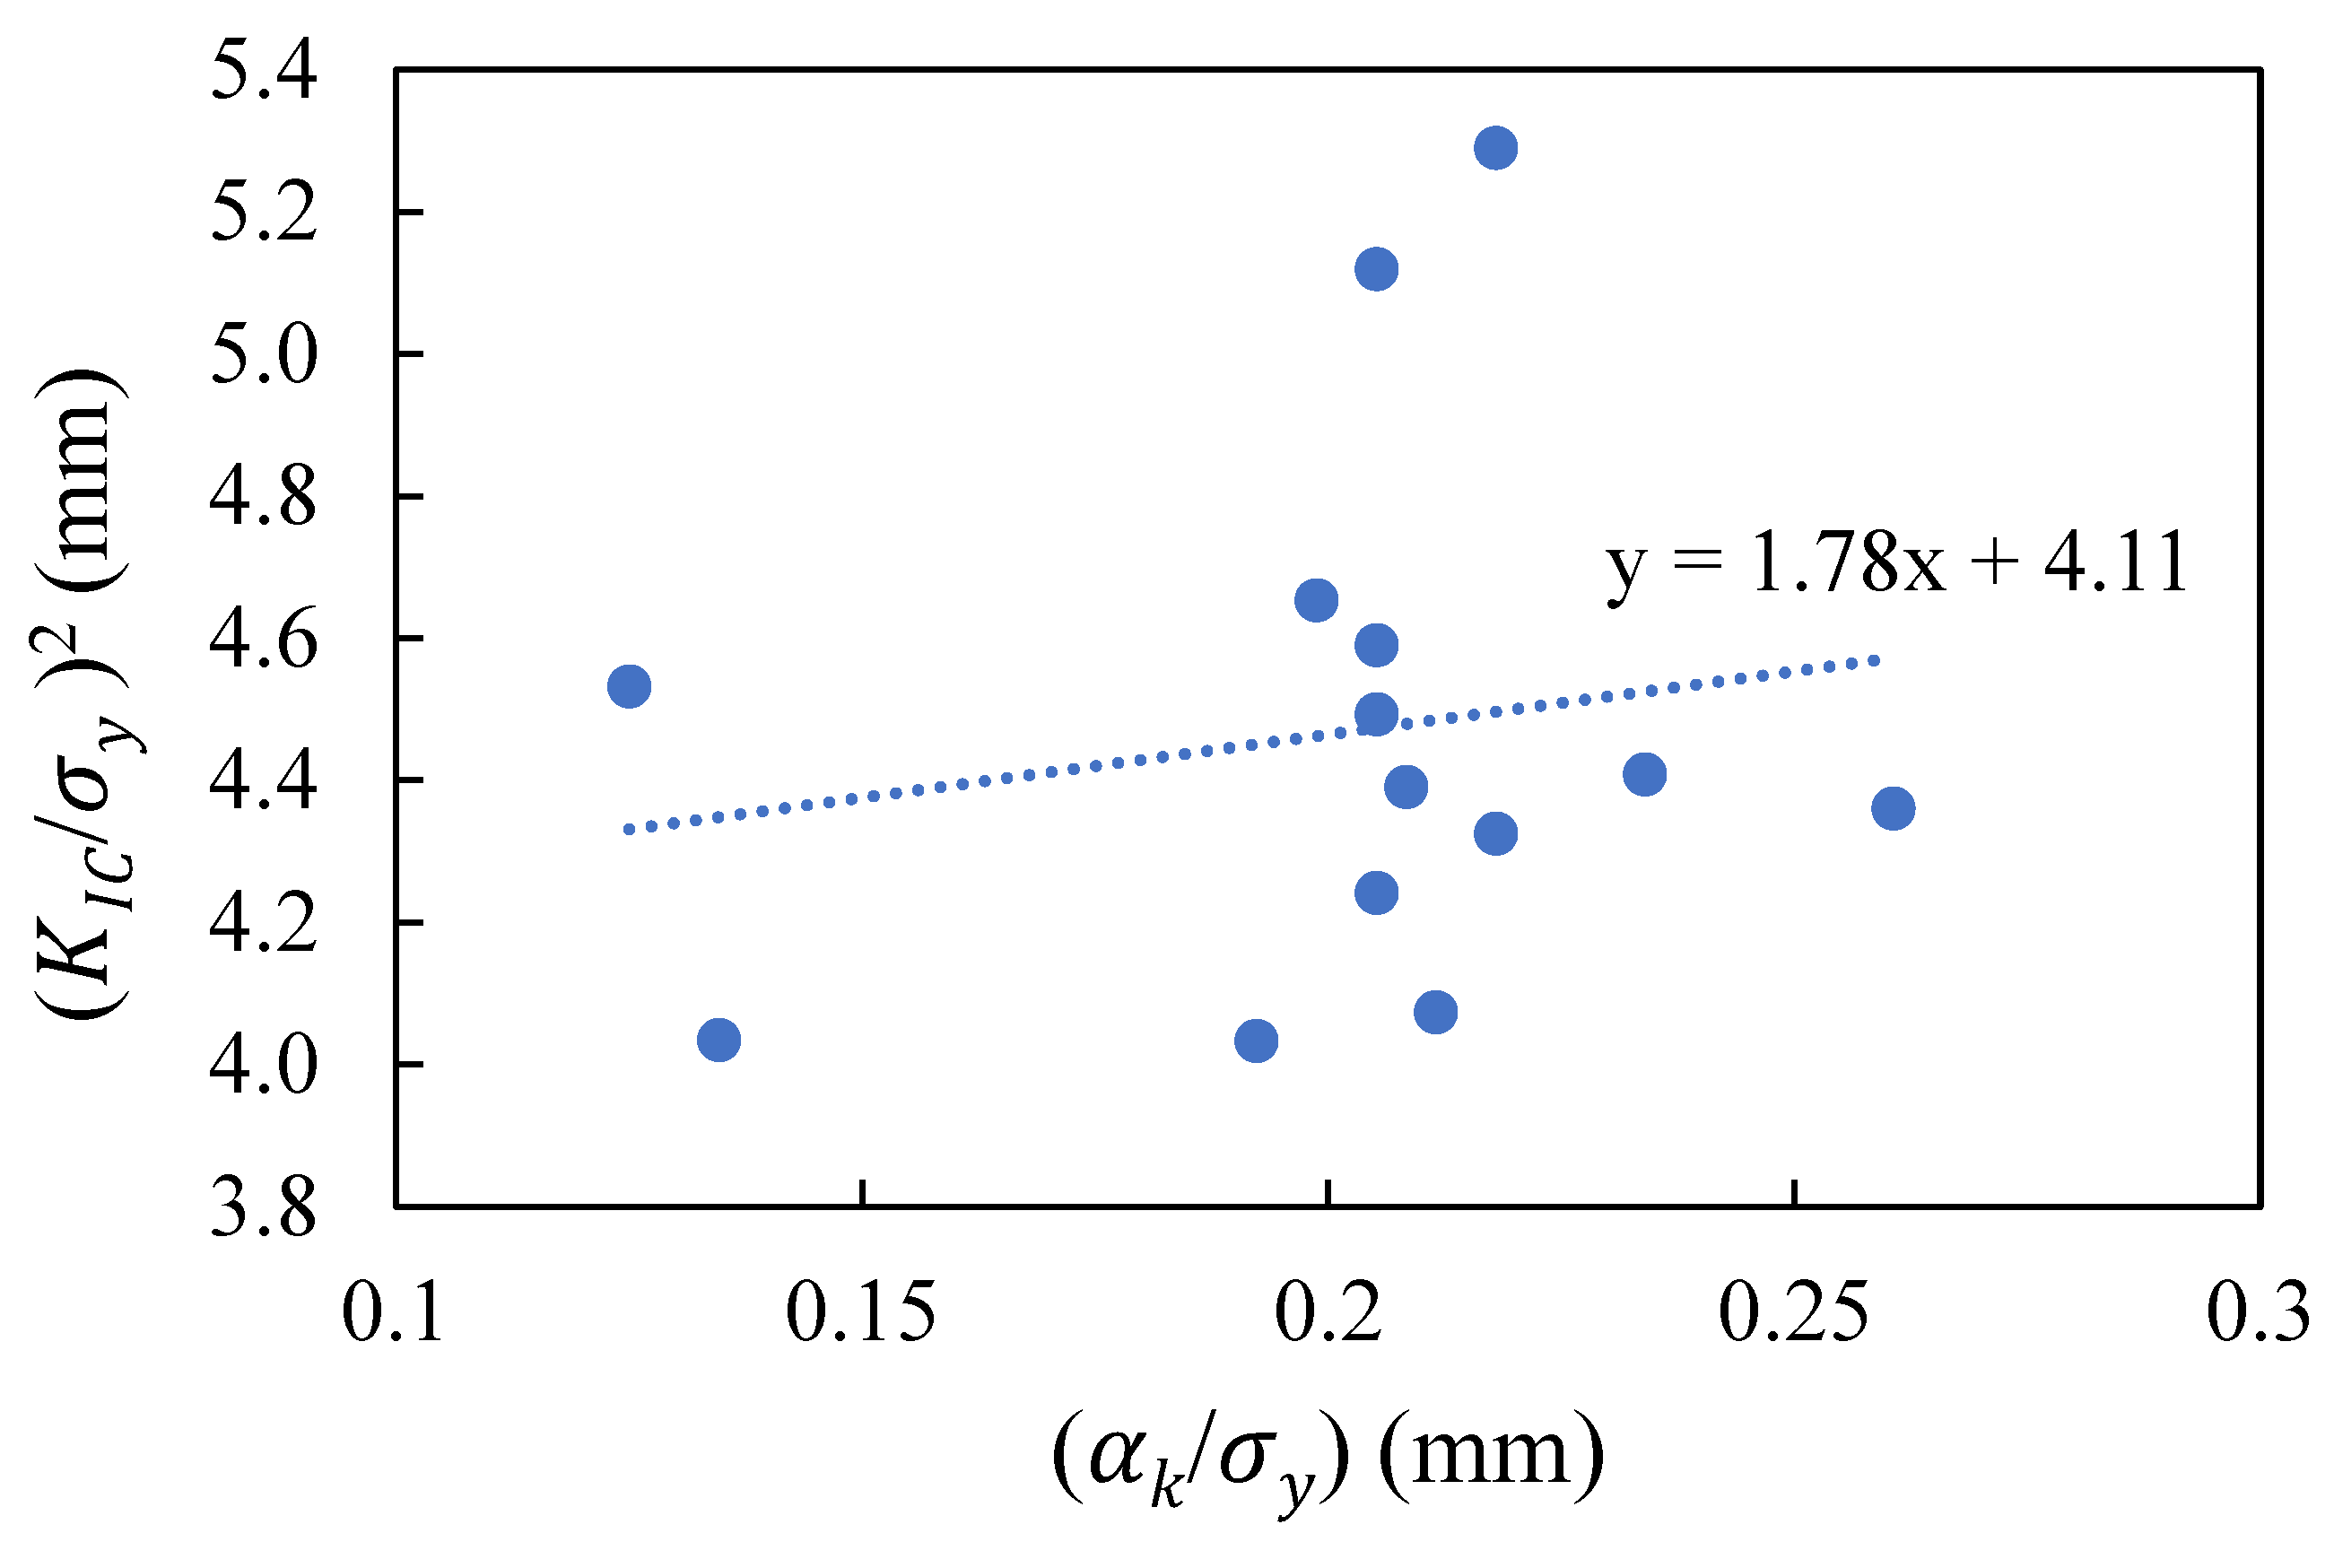

Table 1.
Weight percentage composition of 20th build cycle Ti6AL4V [22].
Table 1.
Weight percentage composition of 20th build cycle Ti6AL4V [22].
| Build | Al (wt%) | V (wt%) | O (wt%) | N (wt%) | Fe (wt%) | H (wt%) |
| 20 | 5.54 | 3.40 | 0.269 | 0.027 | 0.26 | 0.0012 |
Table 2.
Tensile Properties of EB-PBF Ti6Al4V specimens at 20 cycles [21].
Table 2.
Tensile Properties of EB-PBF Ti6Al4V specimens at 20 cycles [21].
| Orientation | Elastic modulus (GPa) |
Yield Strength (MPa) |
Ultimate Tensile Strength (MPa) | % Elongation |
| Horizontal | 102 ± 0.8 | 927 ± 18.9 | 1010 ± 21.8 | 4.3 ± 0.25 |
| Vertical | 113 ± 5.9 | 939 ± 7.5 | 1070 ± 11.3 | 9.18 ± 0.99 |
Table 3.
The surface average roughness parameters of the fracture surface excluding the shear area.
| Orientation | Sa (μm) | Sq (μm) | Sz (μm) | Sp (μm) | Sv (μm) |
| HS | 18.1 | 24.2 | 263.8 | 139.6 | 124.1 |
| HT | 19.1 | 26.1 | 375.8 | 200.3 | 175.5 |
| Vertical | 21.4 | 28.8 | 346.8 | 182.6 | 164.2 |
Disclaimer/Publisher’s Note: The statements, opinions and data contained in all publications are solely those of the individual author(s) and contributor(s) and not of MDPI and/or the editor(s). MDPI and/or the editor(s) disclaim responsibility for any injury to people or property resulting from any ideas, methods, instructions or products referred to in the content. |
© 2025 by the authors. Licensee MDPI, Basel, Switzerland. This article is an open access article distributed under the terms and conditions of the Creative Commons Attribution (CC BY) license (http://creativecommons.org/licenses/by/4.0/).
Copyright: This open access article is published under a Creative Commons CC BY 4.0 license, which permit the free download, distribution, and reuse, provided that the author and preprint are cited in any reuse.


