
Submitted:
23 December 2025
Posted:
23 December 2025
You are already at the latest version
Abstract
How people perceive their neighborhoods can impact their aging trajec-tories, with less known regarding neighborhood perceptions among older adults from minoritized groups. This study examined the impacts of be-havioral and psychosocial factors on neighborhood perceptions among Non-Latino (NL) Black and Latino older adults. Participants (N=506) were NL Black (n=372) and Latino (n=134) older adults (?̅ age=79 years) without dementia. Participants completed a modified Perceptions of Neighbor-hood Environments Scale (mPNES; higher scores indicate more favorable perceptions) and measures of behavioral and psychosocial factors. We performed fully saturated linear regression analyses to assess how each factor related to the mPNES, followed by stepwise linear regression analyses to determine final predictive models for the full sample and each ethnoracial group. For the full sample, higher purpose in life, more physical activity, less discrimination, and higher income were associated with higher mPNES scores. For NL Black older adults, more physical ac-tivity, less discrimination, and higher income were associated with higher mPNES scores. For older Latinos, more purpose in life and a larger social network size were associated with higher mPNES scores. Distinct associ-ations exist by ethnoracial group and suggest unique considerations to facilitate positive neighborhood perceptions among NL Black and Latino older adults.
Keywords:
psychosocial factors
; perceptions of neighborhood environments
; individual determinants
; Black adults
; Latinos
1. Introduction
Neighborhood environments play a critical role in the health and wellbeing of older adults, especially structural characteristics or designed features [1,2,3,4]. Positive structural characteristics provide a neighborhood and its residents with maintained walkways, the availability of safe parks and trails, access to reliable modes of transportation, and proximity to healthcare facilities, locations for physical and social activities, and fresh fruits and vegetables. Older adults who reside in these structurally well-characterized neighborhoods experience better mobility, lower likelihood of early mortality, reduced levels of cognitive impairment, and a decreased risk of dementia [4,5,6,7]. Unfortunately, older adults who belong to minoritized racial and ethnic groups, including Non-Latino (NL) Black and Latino older adults, oftentimes do not live in neighborhood environments that support their health, placing these communities at an elevated risk for deleterious outcomes including cognitive impairment, mobility limitations, and poorer mental health [1,3,8].
Structural neighborhood characteristics are not the sole contributor to health in aging [4]. Positive social elements of neighborhood environments, such as friendly and respectful relationships between neighbors and a sense of belonging, also support healthy aging. Older adults who reside in neighborhoods marked by more optimal social attributes report better mental health, higher levels of wellbeing, and feelings of being supported [5]. Structural and social characteristics of neighborhood environments, individually and collectively, remain highly important for older adults and their health. Yet, they do not fully capture how a person perceives their neighborhood environment, which can also impact their health in aging trajectories - independent of objective measures, particularly for members of minoritized groups [9,10,11,12].
Perceptions of neighborhood environments refer to how people make sense of or interpret the characteristics of where they live – independent of objective measures or the viewpoints of others [9,13]. More favorable neighborhood perceptions regarding walkability, local parks, grocery stores, and physical appearance have been linked to more physical activity [6,12], higher levels of wellbeing [14], and better self-rated physical and mental health [15,16]. Conversely, unfavorable neighborhood perceptions have been associated with lower cognitive function [17]. Previous research has also suggested that NL Black and Latino adults possess more negative perceptions of their neighborhood environments compared to their NL White counterparts [18,19]. However, studies pertaining to neighborhood perceptions have been conducted with samples largely comprised of either NL White adults or persons younger than 65 years of age, without much emphasis on how NL Black and Latino older adults perceive their neighborhood environments and why.
The current study: 1) characterized how NL Black and Latino older adults perceived their neighborhood environments and 2) examined the impacts of behavioral and psychosocial factors on neighborhood perceptions among these older adults. We included both NL Black and Latino older adults in the current examination as they face an increased risk of deleterious health outcomes in aging. Suboptimal aging among NL Black and Latino older adults in the United States is, in part, influenced by discrimination and related practices such as redlining and the facilitation of economic disparities. Equally, NL Black and Latino older adults exhibit resilience and coping factors such as familial support, cultural practices and celebrations, and faith-based belief systems. While NL Black and Latino older adults undoubtably share lived experiences, they also have their own historical and current distinctions related to migration, immigration, and other circumstances. Cumulatively, these issues potentially inform behavioral and psychosocial factors – both common and unique - at the intersection of the individual and their surroundings that may impact neighborhood perceptions. The Ecological Theory of Aging [20,21] and the World Health Organization (WHO) Aging-Friendly Cities and Communities Framework [22] guided the selection of our behavioral and psychosocial factors among existing data at the Rush Alzheimer’s Disease Center (RADC). Behavioral factors included late life cognitive activity, late life social activity, and physical activity – individual-level variables associated with older adults’ participation in their communities, a central goal of the WHO Aging-Friendly Cities and Communities Framework [22]. Psychosocial variables consisted of purpose in life, social isolation, social network size, life space, experiences of discrimination, and current annual income; and represented individual-and interpersonal-level factors that may illuminate the relationship between an older adult and their neighborhood environment, a core tenet of the Ecological Theory of Aging [9,20,21]. This study ultimately aimed to understand neighborhood perceptions among NL Black and Latino older adults that may point to targets for policy development, public health intervention, and community support that can facilitate equitable environmental outcomes in aging for all [22]. See Figure A1.
2. Materials and Methods
Participants
Eligible participants for the current analyses self-identified as either NL Black or Latino and were participating in one of four ongoing cohort studies on aging and cognitive health at the RADC including the Rush Memory and Aging Project (MAP) [23], the Minority Aging Research Study (MARS) [24], the Rush Clinical Core, and the Rush Latino Core [25]. Each cohort study recruits from communities in the Chicago metropolitan area. All cohort participants are approximately 60 years of age or older, without known dementia, and tested within their homes. All cohort participants report their race (e.g., Black/African American) and ethnicity (i.e., Hispanic: yes or no) based on categories from the 1990 United States Census Bureau as well as their sex (i.e., male or female), date of birth, and years of education. As part of their cohort study participation, each person consents to an annual clinical evaluation that includes assessments of behavioral, biological, environmental, psychosocial, and sociocultural factors [23,24,25].
A substudy on characteristics and perceptions of neighborhood environments was introduced into the four cohort studies in 2020. Of the 1,653 participants who self-identified as either NL Black or Latino with a complete baseline on or before the time of the current analyses (August 2022), 539 had completed the neighborhood environments substudy. Of this group, 31 were diagnosed with dementia at our analytic baseline [first modified Perceptions of Neighborhood Environments Scale (mPNES) data point] and 2 had missing dementia diagnoses. As such, 506 participants were included in the current analyses. All cohort studies and the substudy on neighborhood environments were approved by an Institutional Review Board at Rush University Medical Center. Each participant signed an informed consent document for each study. Data can be requested at https://www.radc.rush.edu.
Outcome Variable: Modified Perceptions of Neighborhood Environments Scale (mPNES)
We used a modified version of the PNES to measure participants’ thoughts and experiences related to where they live [10,11,26,27]. We reduced the original 36-item measure to 12 items to lessen participant burden; however, we ensured that all original neighborhood dimensions were assessed including aesthetic quality, social features, physical activity spaces, and food availability. Participants were asked to rate items along a Likert-type scale from 1 (Strongly Agree) to 5 (Strongly Disagree). All mPNES items, some of which were reverse coded so that a higher score reflected more positive or favorable neighborhood perceptions, were averaged to create a mPNES total score. We also ran a principal component analysis (PCA) with varimax rotation to determine appropriate subscales for all RADC participants using their mPNES data (N=964). Three components with eigenvalues greater than 1.0 were retained based on the scree plot, collectively explaining 63% of the total variance. The resulting PCA-derived factor loadings reflected the following constructs: 1) community cohesiveness (6 items); 2) health opportunities (4 items); and 3) ambient surroundings (2 items). The community cohesiveness subscale referred to a person’s relationship with their neighbors and aesthetic conditions of their neighborhood. The health opportunities subscale denoted how the neighborhood supports participants’ options for selecting healthier food and taking part in physical activities. The ambient surroundings subscale assessed noise and traffic associated with the neighborhood environment. See Table A1.
Behavioral Factors
For late life cognitive activity, participants self-reported their engagement in seven activities (e.g., reading magazines or books) during the past year using a 5-point Likert scale (1=every day/almost every day to 5=once a year or less) [28,29]. Scores were reverse-coded and averaged with higher scores indicating more late-life cognitive activity. Late life social activity was measured with six items assessing the frequency of participation in events such as going on day or overnight trips on a 5-point Likert scale (1 = once a year or less to 5 = every day or almost every day) [30]. Items were averaged with higher scores signaling higher levels of late life social activity. For physical activity, participants indicated whether they engaged in three activities (e.g., gardening or yardwork) within the past two weeks. If so, participants reported the number of occasions for each activity [29].
Analyses
To characterize how NL Black and Latino older adults perceive their neighborhood environments, we ran basic descriptive analyses, including mean, standard deviation, and range of scores, for the mPNES total scale and subscales across the full sample and by ethnoracial group (NL Black and Latino). To examine initial relationships between behavioral and psychosocial factors (predictor variables) and mPNES scores (separate outcomes for the total scale and each subscale), we performed fully saturated models (all predictor variables included) using linear regression analyses with the total sample and stratified by ethnoracial group. We performed subscale analyses to understand potential nuances in neighborhood perceptions. We stratified the sample by ethnoracial group to assess unique within-group relationships between predictor and outcome variables.
We established a final set of predictor variables associated with total mPNES scores and each subscale using separate stepwise linear regression models using the forward selection and backward elimination method for the full sample and stratified by ethnoracial group. For each predictor variable, we considered the statistical significance of entering and retention in the model as 0.10 and 0.05, respectively. All final models consisted of predictors with a statistical significance of p < 0.05. All models adjusted for age, gender, and years of education. All analyses were conducted using SAS software, version 9.4 of the SAS system for Linux.
3. Results
Participant Characteristics
Participants (N=506) were self-identified NL Black (n=372) and Latino (n=134) older adults with a mean age of 79 years and 14 mean years of education. Participants were 84% women and had a median MMSE score of 28. See Table A2.
Perceptions of Neighborhood Environments
Across the full sample, the total mPNES score was 47.69, with NL Black older adults ( = 49.65) reporting higher mPNES total scores than Latino older adults (= 42.26). For both NL Black and Latino older adults, the Community Cohesiveness subscale of the mPNES received the highest scores. See Table A2.
4. Discussion
The current study examined behavioral and psychosocial factors associated with neighborhood perceptions among community-dwelling NL Black and Latino older adults without dementia. Neighborhood perceptions consisted of three components: community cohesiveness, health opportunities, and ambient surroundings. Multiple behavioral and psychosocial factors were considered based on The Ecological Theory of Aging [20,21] and the WHO Aging-Friendly Cities and Communities Framework [22]. Overall, participants held neutral opinions of their neighborhoods, with community cohesiveness rated the highest subscale among both NL Black and Latino older adults. Associations existed between behavioral and psychosocial factors and neighborhood perceptions, for all participants as well as specific to NL Black and Latino older adults, respectively. We observed persistent associations with more favorable neighborhood perceptions by ethnoracial group, including higher income for NL Black older adults and higher purpose in life for older Latinos. These results can lay the foundation for strategies to improve neighborhood perceptions among NL Black and Latino older adults that may, in turn, foster positive health outcomes in aging.
The current study adds to the growing body of literature that pertains to neighborhood perceptions among older adults [39,40]. Findings for the full sample include associations of higher levels of physical activity and income, and lower levels of discrimination with better overall neighborhood perceptions. Additionally, higher income was related to more positive perceptions of community cohesiveness and health- and ambient-related aspects of neighborhood environments for the full sample. A well-established relationship exists between higher income levels and structurally well-characterized neighborhoods, which may lend itself to better neighborhood perceptions [41,42]. Similarly, discrimination represents a key consideration in neighborhood perceptions, with less discrimination signaling more positive social aspects of a neighborhood, including residents feeling welcomed and comfortable among neighbors and local businesses [43,44]. A recent synthesis also suggests that more physical activity is indicative of more optimal objective structural and social aspects of a neighborhood environment, one typified by access to quality and safe spaces to partake in exercise and other movement [45,46]. Perhaps a more nuanced iterative relationship exists between better neighborhood perceptions and necessary, pleasing, and age-friendly physical spaces and resources that foster social connectedness [9]. Current findings suggest that neighborhood perceptions are associated with behavioral and psychosocial factors among NL Black and Latino older adults.
NL Black and Latino older adults share a history of marginalization in the United States, including the Chicago metropolitan area where all participants resided, and it is feasible that comparable factors may impact their neighborhood perceptions. NL Black and Latino older adults also possess unique trajectories regarding neighborhood environments, including locations of residential areas, nearby resources, and paths of im/migration. These experiences may also contribute to neighborhood perceptions. Indeed, study findings suggest distinct patterns of neighborhood perceptions for NL Black and Latino older adults. For NL Black older adults, neighborhood perceptions were associated with behavioral and psychosocial factors at the interface of structural and social facets. Notably, higher income levels related not only to better overall neighborhood perceptions but also more positive views on community cohesiveness and health- and ambient-related aspects of neighborhood environments. Complex and nuanced relationships persist between race, socioeconomic status, and neighborhood characteristics, particularly for Black adults, and it is unclear the precise mechanisms linking higher income to more favorable neighborhood perceptions in this population [47]. It remains crucial to not conflate race and socioeconomic status where racial identification or categorization as Black equates to lower levels of income. Higher income levels may possibly form a foundation for better neighborhood perceptions for NL Black older adults, particularly as an established connection exists between individual financial resources and available residential resources such as grocery stores and green spaces that support positive outcomes in aging. Yet objectively better or presumably more ideal structural aspects of neighborhood environments have not always translated into more optimal outcomes for Black adults [48,49]. A broader group of factors emerged for NL Black older adults regarding community cohesiveness; specifically, with less social isolation, more physical activity, less discrimination, and higher income being associated with more positive perceptions of resident relationships and neighborhood appearance. It is possible that less social isolation, a factor that harkens to positive residential characteristics such as harmony among neighbors [50], is linked to better neighborhood perceptions. Future research is needed to elucidate mechanisms linking these behavioral and psychosocial factors with neighborhood perceptions; however, the current study suggests the existence of a foundational association.
For older Latinos, neighborhood perceptions were associated with behavioral and psychosocial factors centered on communal facets of the self and the environment. Higher purpose in life was the sole factor associated with better overall neighborhood perceptions as well as perceived community cohesiveness and ambient surroundings. More late life social activity was also the only factor linked to better perceptions of health opportunities for healthier food selections and physical activities. Hence, the interplay between individual- and group-level factors—rather than either alone—may be key to understanding how people perceive their neighborhood environments. [51]. These associations between individual-level factors and neighborhood environments may be facilitated by a cultural value of familismo, where Latinos highly prioritize connectedness with family and extended social networks, which can serve as a protective factor against deleterious outcomes such as depressive symptoms [52,53,54,55]. Familismo spans across generations and age groups, including older Latinos [54,56]. It is possible that an emphasis on family and social networks among older Latinos shapes how their social capital is cultivated and perceived in neighborhood contexts, including how they conceptualize themselves and their neighborhood-related roles and experiences. Together, these associations further suggest the intertwined nature of self- and community-related factors as considerations for older Latino adults.
While future research is needed to elucidate the directionality of relationships and underlying mechanisms, these findings open a dialogue for targets, such as purpose in life and physical activity, to consider for potential intervention strategies focused on maintaining and improving neighborhood perceptions among NL Black and Latino older adults. Admittedly, intervention strategies must exist at the individual, social, and structural levels; however, our work suggests that strategies may focus on income, discrimination, physical activity, late life social activity, and purpose in life, particularly for involving NL Black and Latino older adults. In varying degrees, these psychosocial factors are modifiable. For example, strategies focused on individual income can include culturally relevant informational materials and tools regarding financial decision making and choices to protect and maximize current income (individual-level) and must be coupled with National- and State-level efforts regarding pay parity across the lifespan and increased contributions to basic income in older age (structural-level). When combined, these multi-level strategic efforts may benefit structural and social characteristics of neighborhood environments as well as neighborhood perceptions which, in turn, can facilitate overall health and quality of life for NL Black and Latino older adults. Intervention strategies focused on structural characteristics of neighborhood environments can also include the development and implementation of available and affordable opportunities for physical activities that are appropriate for a person’s abilities and interests as well as material safety, and spaces for engagement in social activities in their own neighborhoods. Intervention strategies can simultaneously target social aspects of neighborhood environments that may foster communal and physical activities through neighborhood-located programming such as group exercise classes or walking groups; thus, creating more opportunities for positive engagement among neighbors and chances for exercise and movement. These efforts may also foster purpose in life. These levels are interrelated, with strategies that focus on any level – individual, social, or structural – having an impact on other levels and, thus, may bolster neighborhood perceptions. Overall, perceptions of neighborhood environments represent a critical aspect for NL Black and Latino older adults, but future work remains.
5. Conclusions
The current study has limitations and strengths. One limitation is the large percentage of women and the relatively smaller number of Latinos. A second limitation is the cross-sectional design of this study and, as such, it is not possible to determine directionality. Furthermore, other factors not studied here may impact neighborhood perceptions, such as the demographic composition of a neighorhood, segregation, and gentrification. This study has several strengths including a well-characterized group of community-dwelling NL Black and Latino older adults without dementia, the use of established measures of behavioral and psychosocial factors, and a rigorously tested measure of neighborhood perceptions. Results of this study contribute to the field’s understanding of neighborhood environments as well as a step forward to developing needed intervention strategies to benefit health and wellbeing in these populations.
Supplementary Materials
The following supporting information can be downloaded at the website of this paper posted on Preprints.org.
Author Contributions
CMG and ML contributed to the conception and design of the research study; CMG and ML drafted the work; CMG, AC, TW, BLM, DAB, DXM, LLB, JAS, and ML revised the work critically for important intellectual content; CMG, AC, TW, BLM, DAB, DXM, LLB, JAS, and ML provided approval for publication of the content; CMG and ML agreed to be accountable for all aspects of the work.
Funding
This work was supported by grants from the National Institutes of Health (NIH) [grant numbers: RF1NS143766-01 and R01AG095017 to CMG; R01AG062711 to ML; P30AG072975 and P30AG010161 to JAS; R01AG022018 to LLB; R01AG17917 to DAB]. The conten of this manuscript is solely the responsibility of the authors and does not necessarily represent the official views of the National Institutes of Health.
Institutional Review Board Statement
An Institutional Review Board at Rush University Medical Center approved The Rush Alzheimer’s Disease Research Center’s Clinical (L91020181) and Latino Cores (15032102); MAP (L86121802); and MARS (L03030302). All participants signed an informed consent document for each study.
Informed Consent Statement
Informed consent was obtained from all subjects involved in the study.
Data Availability Statement
Acknowledgments
We would like to thank all study participants in the Rush Alzheimer’s Disease Research Center’s African American and Latino Cores, the Rush Memory and Aging Project (MAP), and the Minority Aging Research Study (MARS). We also would like to thank all staff at the Rush Alzheimer’s Disease Center.
Conflict of Interest
The authors report no conflicts with any product mentioned or concept discussed in this article.
Abbreviations
The following abbreviations are used in this manuscript:
| NL | Non-Latino |
| WHO | World Health Organization |
| RADC | Rush Alzheimer’s Disease Center |
| MAP | Rush Memory and Aging Project |
| MARS | Minority Aging Research Study |
| mPNES | Modified Perceptions of Neighborhood Environments |
Appendix
Figure A1.
Hypothesized Relationships Between Individual- and Interpersonal-Level Factors and More Favorable Perceptions of Neighborhood Environments. .
Figure A1.
Hypothesized Relationships Between Individual- and Interpersonal-Level Factors and More Favorable Perceptions of Neighborhood Environments. .
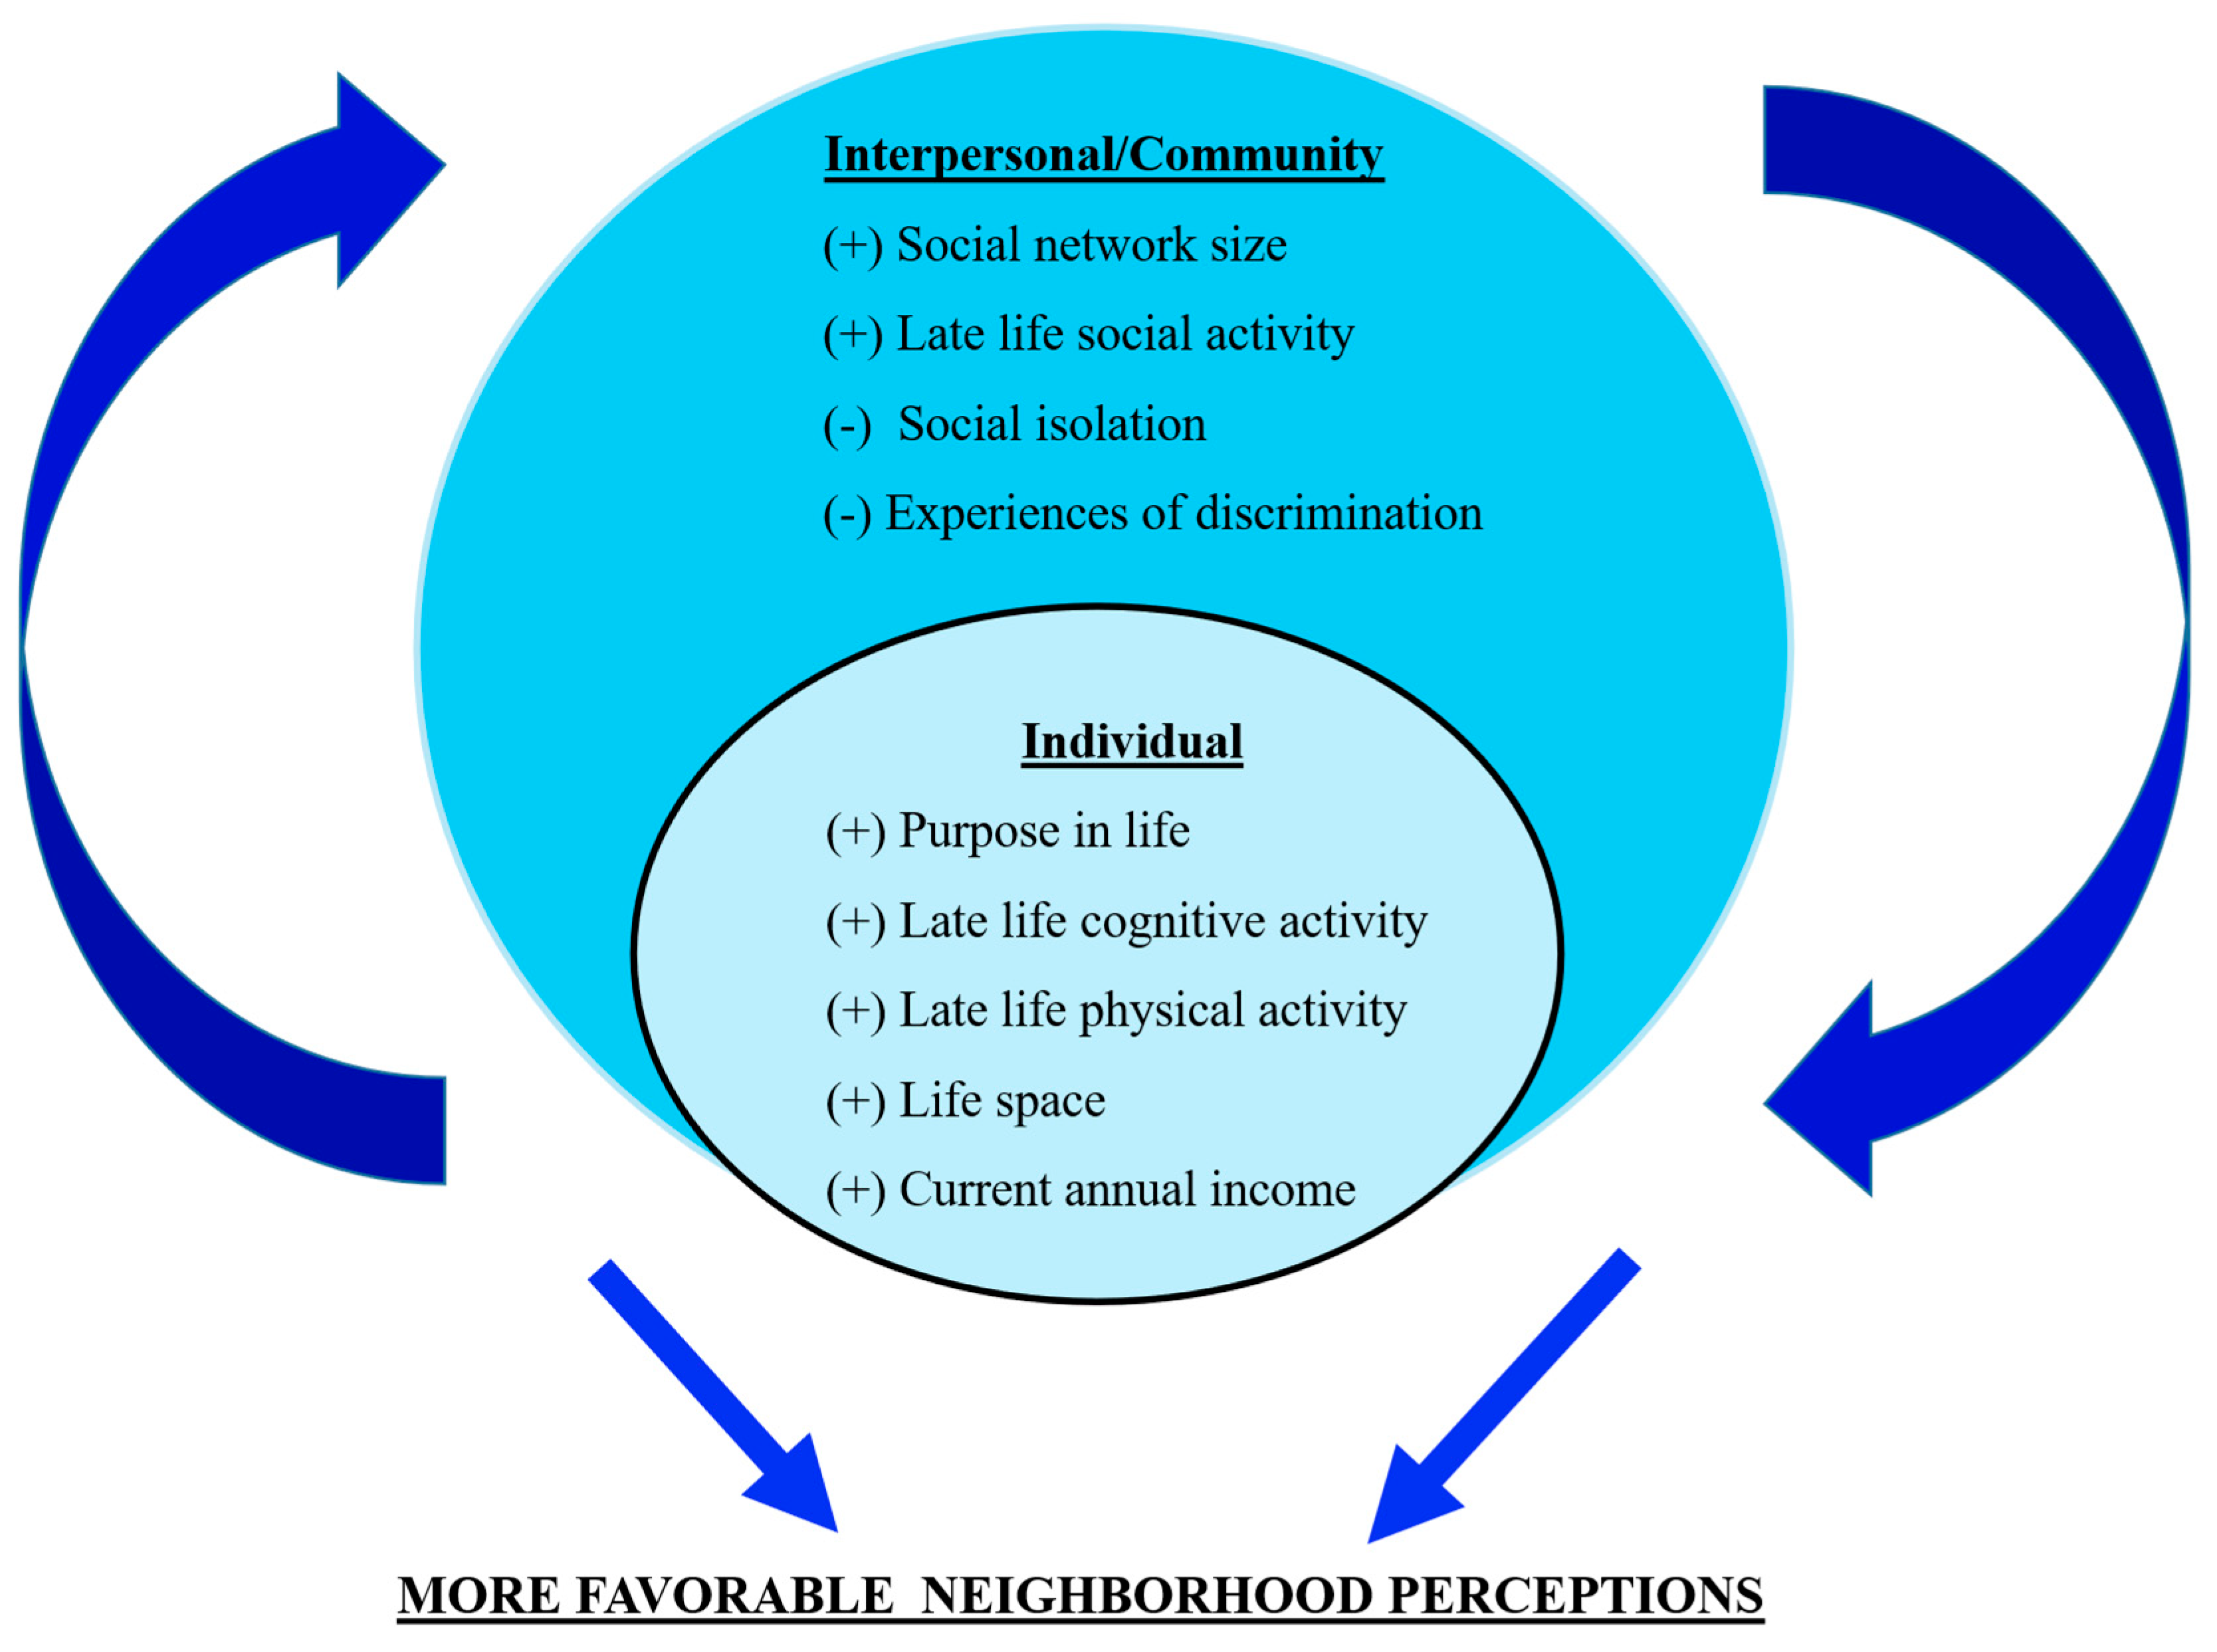

Table A1.
Modified Perception of Neighborhood Environment Scale (mPNES). Instructions: I’m going to read you a list of statements about neighborhoods. Please tell me how much you agree or disagree with each statement as it relates to the neighborhood you live in now. In answering these questions, please think of your neighborhood as the area within about a 20-minute walk (or about a mile) from your house.
| Item |
|---|
| Subscale 1: Community Cohesiveness |
| 1. In my neighborhood the buildings and homes are well-maintained. |
| 2. My neighborhood is attractive. |
| 3. It is pleasant to walk in my neighborhood. |
| 4. People around here are willing to help their neighbors. |
| 5. People in my neighborhood generally get along with each other. |
| 6. People in my neighborhood can be trusted. |
| Subscale 2: Health Opportunities |
| 7. A large selection of fresh fruits and vegetables is available in my neighborhood. |
| 8. There are many opportunities to purchase fast foods in my neighborhood. |
| 9. My neighborhood offers many opportunities to be physically active. |
| 10. Local sports clubs and other facilities in my neighborhood offer many opportunities to get exercise. |
| Subscale 3: Ambient Surroundings |
| 11. There is a lot of noise in my neighborhood. |
| 12. My neighborhood has heavy traffic. |
Response Options: 1- Strongly Agree. 2- Agree. 3- Neutral (neither agree or disagree). 4- Disagree. 5- Strongly Disagree.
Table A2.
Participant Characteristics* for the Full Sample, Non-Latino Black Older Adults, and Older Latinos.
Table A2.
Participant Characteristics* for the Full Sample, Non-Latino Black Older Adults, and Older Latinos.
| Variables | Full Sample (N=506) |
Non-Latino Black Older Adults (n=372) |
Older Latinos (n=134) |
|---|---|---|---|
| Demographic Characteristics | |||
| Age | 79.09 (6.53; 62.56 – 98.59) | 80.66 (6.05; 66.72 – 98.59) | 74.73 (5.83; 62.56 – 93.11) |
| Gender, Women | 423 (84%) | 320 (86%) | 103 (77%) |
| Years of Education | 14.26 (4.05; 0.00 – 30.00) | 15.36 (3.13; 5.00 – 30.00) | 11.22 (4.71; 0.00 – 22.00) |
| MMSE Score | 28.00 (26.00 – 30.00) | 28.00 (26.00 – 30.00) | 28.00 (26.00 – 29.00) |
| Outcome: Modified Perceptions of Neighborhood Environments | |||
| Total Scale | 47.69 (6.85; 26.00 – 66.00) | 49.65 (6.26; 32.00 – 66.00) | 42.26 (5.32; 26.00 – 55.00) |
| Community Cohesiveness Subscale | 3.74 (0.55; 1.83 – 5.00) | 3.76 (0.55; 1.83 – 5.00) | 3.70 (0.54; 26.00 – 55.00) |
| Health Opportunities Subscale** | 2.06 (0.71; -0.25 – 3.50) | 2.04 (0.73; 0.00 – 3.50) | 2.12 (0.65; -0.25 – 3.50) |
| Ambient Surroundings Subscale | 3.25 (0.78; 1.00 – 5.00) | 3.25 (0.80; 1.00 – 5.00) | 3.25 (0.74; 1.50 – 5.00) |
| Psychosocial Factors | |||
| Purpose In Life | 3.75 (0.44; 2.00 – 5.00) | 3.83 (0.43; 2.00 – 5.00) | 3.53 (0.38; 2.60 – 4.60) |
| Social Isolation | 2.33 (0.58; 1.00 – 4.20) | 2.26 (0.55; 1.00 – 4.20) | 2.56 (0.60; 1.00 – 4.00) |
| Social Network Size | 4.62 (4.48; 0.00 – 33.00) | 4.17 (4.14; 0.00 – 33.00) | 5.84 (5.13; 0.00 – 28.00) |
| Late Life Cognitive Activity | 2.63 (0.78; 1.00 – 4.67) | 2.74 (0.77; 1.00 – 4.67) | 2.34 (0.73; 1.00 – 4.33) |
| Late Life Social Activity | 1.74 (0.54; 1.00 – 3.50) | 1.76 (0.54; 1.00 – 3.50) | 1.67 (0.52; 1.00 – 3.17) |
| Physical Activity | 1.14 (0.92; 0.00 – 3.00) | 1.04 (0.92; 0.00 – 3.00) | 1.44 (0.86; 0.00 – 3.00) |
| Life Space | 5.00 (5.00 – 6.00) | 5.00 (5.00 – 6.00) | 5.00 (5.00 – 6.00) |
| Discrimination | 1.67 (2.22; 0.00 – 9.00) | 1.66 (2.35; 0.00 – 9.00) | 1.69 (1.83; 0.00 – 7.00) |
| Income | 6.43 (2.65; 1 – 10) | 6.82 (2.55; 1 – 10) | 5.33 (2.63; 1 – 10) |
*Mean (Standard Deviation; Range of Scores); Median (Interquartile Range) are reported for the following variables: Income, MMSE (Mini-Mental State Examination), and Life Space; and N (%) for Gender. ** Composite scores included one negatively worded item and the range of composite scores can include a negative integer.
Figure A2.
Forest Plots of the Fully Saturated Model Estimates and 95% Confidence Intervals (CI) for the Linear Regression Analyses Investigating the Relationship Between Psychosocial Factors and the Modified Perception of Neighborhood Environment Scale Total Score for A) The Total Sample and Stratified By B) Non-Latino Black Older Adults and C) Latino Older Adults, All Adjusting for Age, Gender, and Years of Education.
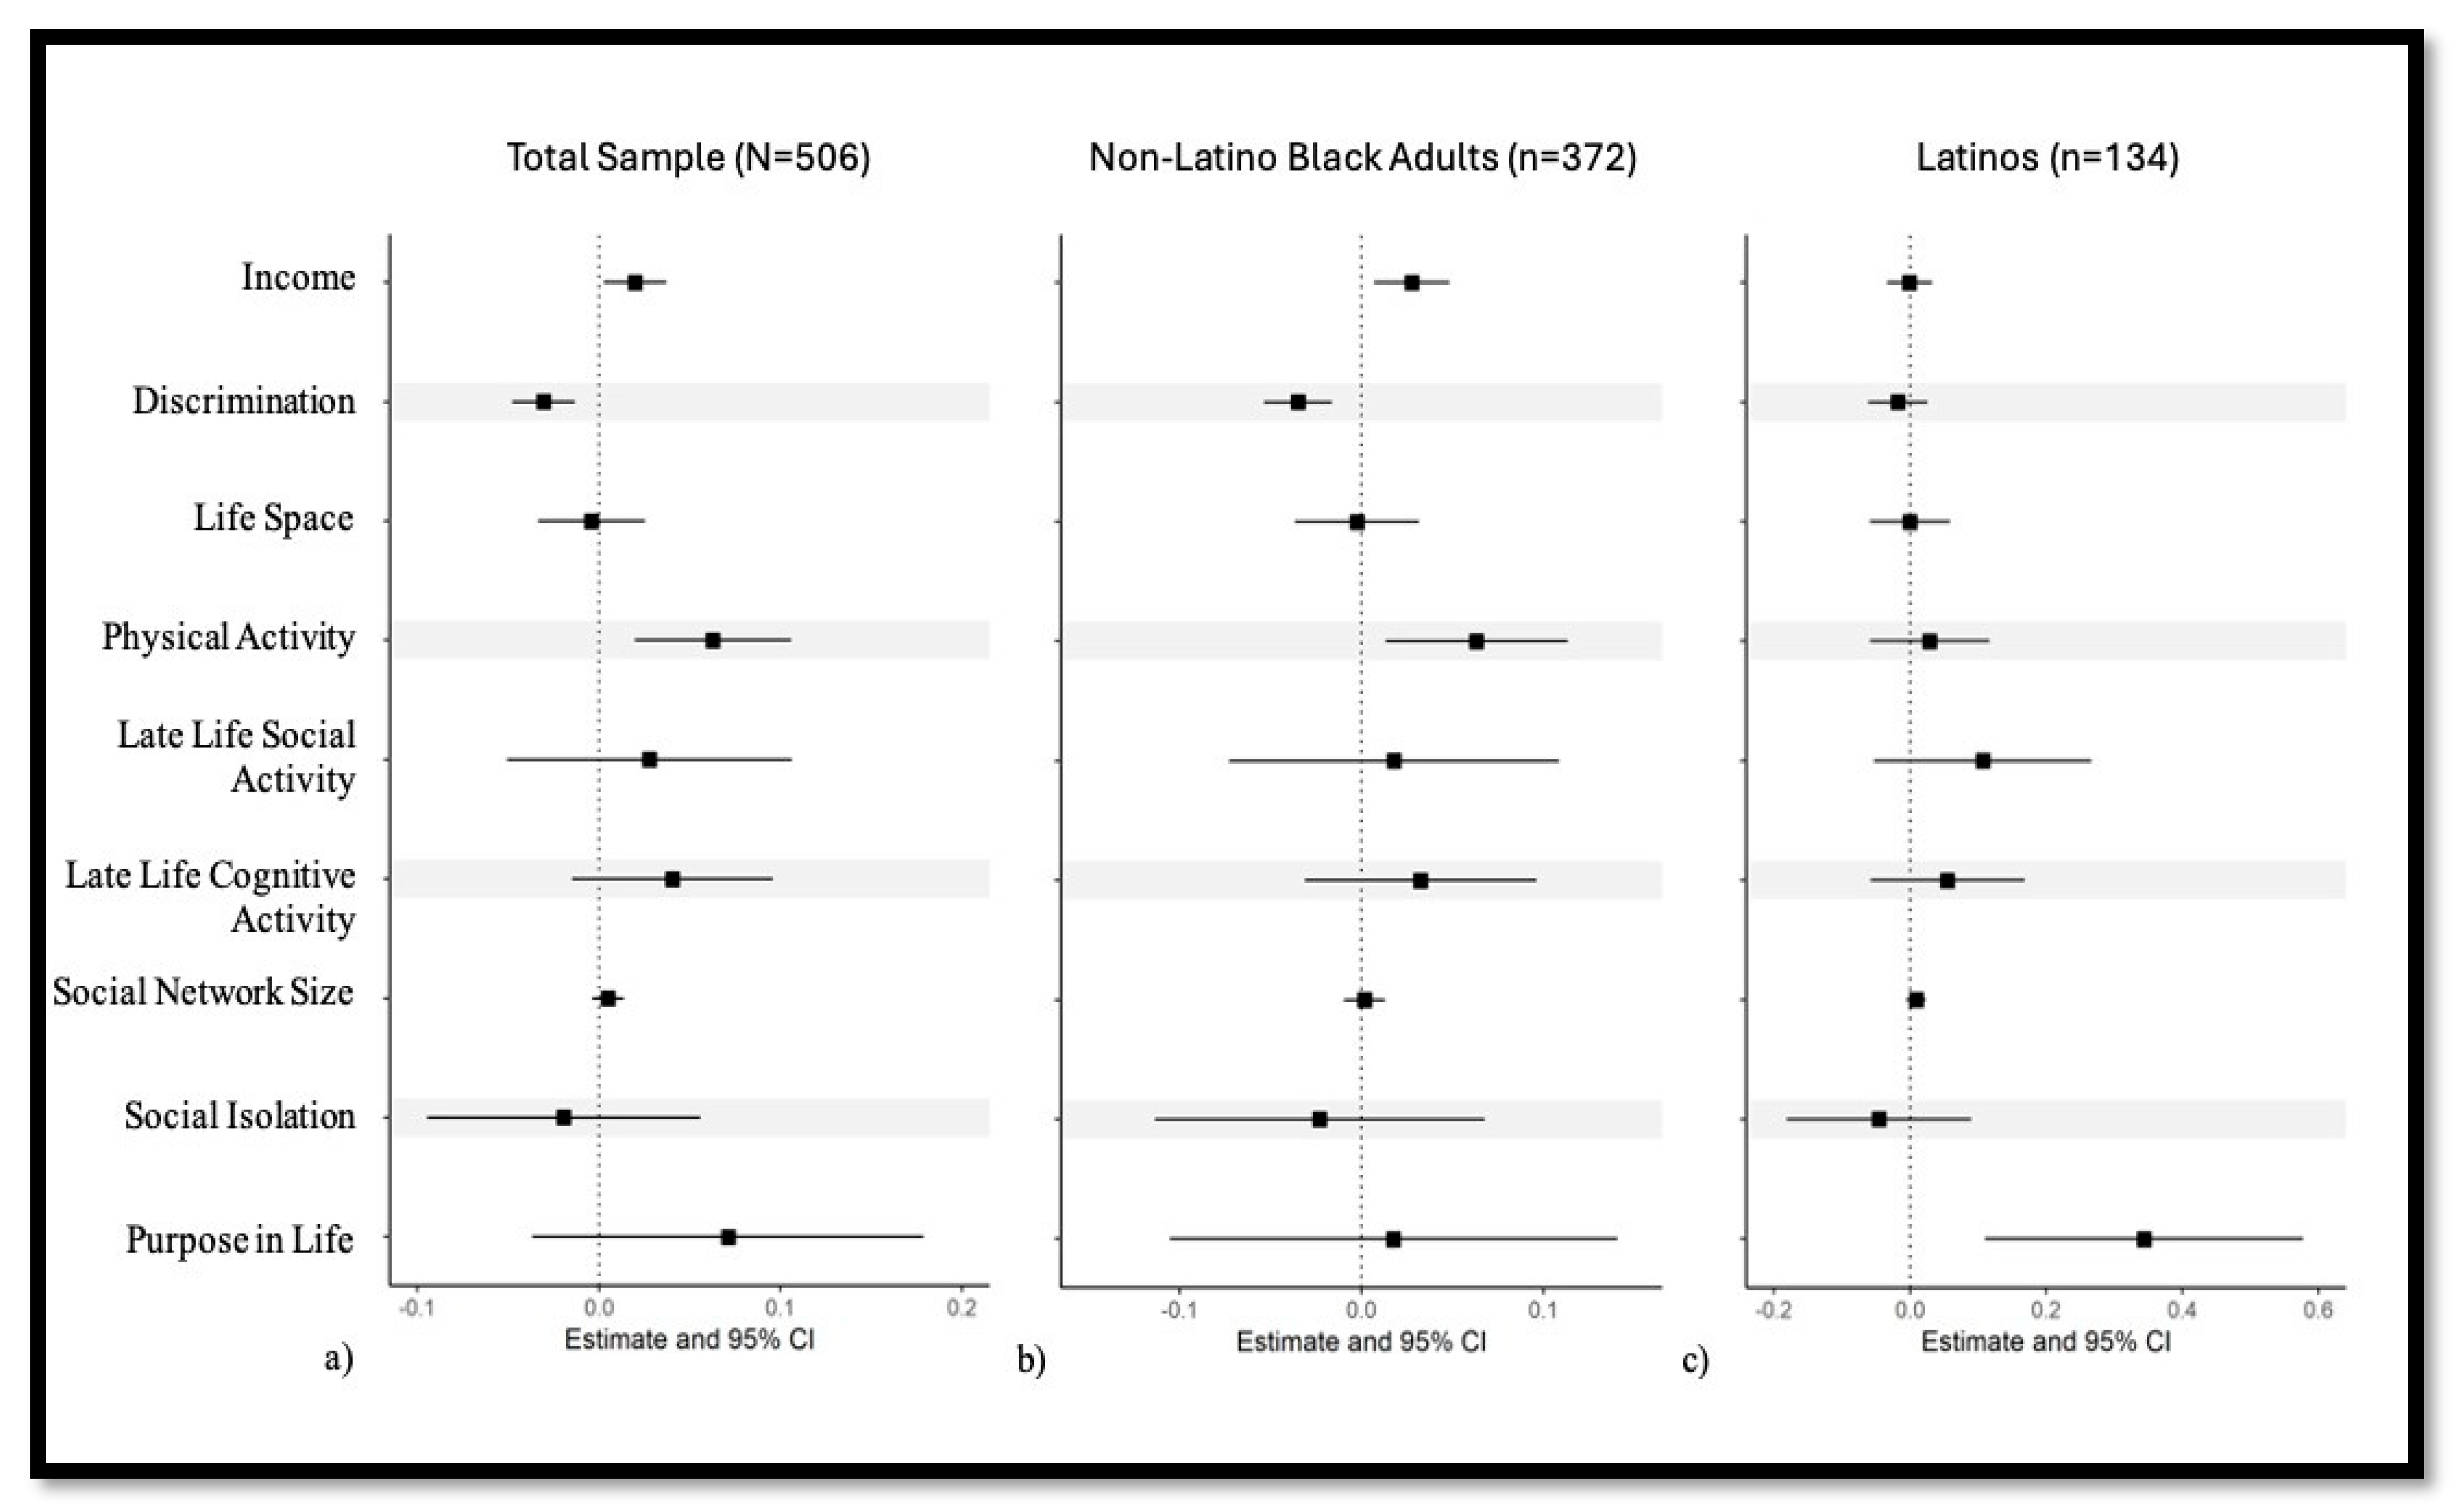
Table A3.
Relationships between Psychosocial Factors* and Community Cohesiveness Subscale Scores for the Modified Perceptions of Neighborhood Environments Scale with the Full Sample and Stratified by Racial and Ethnic Groups.
Table A3.
Relationships between Psychosocial Factors* and Community Cohesiveness Subscale Scores for the Modified Perceptions of Neighborhood Environments Scale with the Full Sample and Stratified by Racial and Ethnic Groups.
| Factors | Full Sample (N=506) |
Non-Latino Black Older Adults (n=372) |
Latino Older Adults (n=134) |
||||||||
|---|---|---|---|---|---|---|---|---|---|---|---|
| Model 1: Initial Saturated Linear Regression Models | |||||||||||
| Est | SE | p | Est | SE | P | Est | SE | p | |||
| Purpose In Life | 0.14 | 0.07 | 0.04 | 0.08 | 0.07 | 0.30 | 0.39 | 0.15 | 0.01 | ||
| Social Isolation | -0.04 | 0.05 | 0.34 | -0.07 | 0.06 | 0.21 | -0.01 | 0.09 | 0.94 | ||
| Social Network Size | 0.01 | 0.01 | 0.14 | 0.01 | 0.01 | 0.38 | 0.01 | 0.01 | 0.29 | ||
| Late Life Cognitive Activity | 0.04 | 0.03 | 0.23 | 0.02 | 0.04 | 0.59 | 0.12 | 0.07 | 0.11 | ||
| Late Life Social Activity | 0.05 | 0.05 | 0.29 | 0.04 | 0.06 | 0.46 | 0.13 | 0.10 | 0.21 | ||
| Physical Activity | 0.05 | 0.03 | 0.05 | 0.06 | 0.03 | 0.04 | -0.01 | 0.06 | 0.59 | ||
| Life Space | 0.00 | 0.02 | 0.84 | 0.01 | 0.02 | 0.49 | -0.02 | 0.04 | 0.89 | ||
| Discrimination | -0.03 | 0.01 | 0.004 | -0.04 | 0.01 | 0.001 | -0.01 | 0.03 | 0.60 | ||
| Income | 0.02 | 0.01 | 0.07 | 0.03 | 0.01 | 0.04 | -0.00 | 0.02 | 0.95 | ||
| Model 2: Final Stepwise Linear Regression Models | |||||||||||
| Est | SE | p | Est | SE | P | Est | SE | p | |||
| Purpose In Life | 0.19 | 0.06 | <0.001 | 0.48 | 0.13 | <0.001 | |||||
| Social Isolation | -0.11 | 0.05 | 0.02 | ||||||||
| Social Network Size | |||||||||||
| Late Life Cognitive Activity | |||||||||||
| Late Life Social Activity | |||||||||||
| Physical Activity | 0.06 | 0.03 | 0.01 | 0.07 | 0.03 | 0.02 | |||||
| Life Space | |||||||||||
| Discrimination | -0.03 | 0.01 | 0.001 | -0.04 | 0.01 | <0.001 | |||||
| Income | 0.02 | 0.01 | 0.05 | 0.03 | 0.01 | 0.003 | |||||
*Based on multivariable linear regression models controlling for age, gender, and years of education. Statistics provided include parameter estimates, standard errors, and p-values.
Table A4.
Relationships between Psychosocial Factors* and Health Opportunities Subscale Scores for the Modified Perceptions of Neighborhood Environments Scale with the Full Sample and Stratified by Racial and Ethnic Groups.
Table A4.
Relationships between Psychosocial Factors* and Health Opportunities Subscale Scores for the Modified Perceptions of Neighborhood Environments Scale with the Full Sample and Stratified by Racial and Ethnic Groups.
| Factors | Full Sample (N=506) |
Non-Latino Black Older Adults (n=372) |
Latino Older Adults (n=134) |
|||||||||
|---|---|---|---|---|---|---|---|---|---|---|---|---|
| Model 1: Initial Saturated Linear Regression Models | ||||||||||||
| Est | SE | p | Est | SE | P | Est | SE | p | ||||
| Purpose In Life | 0.02 | 0.09 | 0.84 | -0.03 | 0.10 | 0.80 | 0.23 | 0.18 | 0.22 | |||
| Social Isolation | -0.05 | 0.06 | 0.46 | -0.07 | 0.08 | 0.36 | -0.08 | 0.11 | 0.47 | |||
| Social Network Size | 0.01 | 0.01 | 0.23 | 0.00 | 0.01 | 0.60 | 0.01 | 0.01 | 0.25 | |||
| Late Life Cognitive Activity | 0.03 | 0.05 | 0.55 | 0.01 | 0.05 | 0.88 | 0.03 | 0.09 | 0.71 | |||
| Late Life Social Activity | 0.03 | 0.06 | 0.66 | 0.02 | 0.08 | 0.84 | 0.17 | 0.13 | 0.18 | |||
| Physical Activity | 0.07 | 0.04 | 0.06 | 0.06 | 0.04 | 0.14 | 0.06 | 0.07 | 0.42 | |||
| Life Space | 0.01 | 0.02 | 0.70 | -0.01 | 0.03 | 0.60 | 0.07 | 0.05 | 0.15 | |||
| Discrimination | -0.02 | 0.01 | 0.13 | -0.03 | 0.02 | 0.03 | 0.02 | 0.03 | 0.59 | |||
| Income | 0.02 | 0.01 | 0.08 | 0.05 | 0.02 | 0.005 | -0.02 | 0.03 | 0.36 | |||
| Model 2: Final Stepwise Linear Regression Models | ||||||||||||
| Est | SE | p | Est | SE | P | Est | SE | p | ||||
| Purpose In Life | ||||||||||||
| Social Isolation | ||||||||||||
| Social Network Size | ||||||||||||
| Late Life Cognitive Activity | ||||||||||||
| Late Life Social Activity | 0.28 | 0.11 | 0.02 | |||||||||
| Physical Activity | 0.07 | 0.03 | 0.03 | |||||||||
| Life Space | ||||||||||||
| Discrimination | -0.03 | 0.02 | 0.02 | |||||||||
| Income | 0.03 | 0.01 | 0.01 | 0.05 | 0.02 | 0.001 | ||||||
*Based on multivariable linear regression models controlling for age, gender, and years of education. Statistics provided include parameter estimates, standard errors, and p-values.
Table A5.
Relationships between Psychosocial Factors* and Ambient Surroundings Subscale Scores for the Modified Perceptions of Neighborhood Environments Scale with the Full Sample and Stratified by Racial and Ethnic Groups.
Table A5.
Relationships between Psychosocial Factors* and Ambient Surroundings Subscale Scores for the Modified Perceptions of Neighborhood Environments Scale with the Full Sample and Stratified by Racial and Ethnic Groups.
| Factors | Full Sample (N=506) |
Non-Latino Black Older Adults (n=372) |
Latino Older Adults (n=134) |
|||||||
|---|---|---|---|---|---|---|---|---|---|---|
| Model 1: Initial Saturated Linear Regression Models | ||||||||||
| Est | SE | p | Est | SE | p | Est | SE | p | ||
| Purpose In Life | 0.19 | 0.10 | 0.05 | 0.11 | 0.12 | 0.33 | 0.62 | 0.20 | 0.002 | |
| Social Isolation | 0.01 | 0.07 | 0.84 | 0.04 | 0.09 | 0.62 | -0.09 | 0.12 | 0.42 | |
| Social Network Size | -0.00 | 0.01 | 1.00 | -0.00 | 0.01 | 0.88 | 0.00 | 0.01 | 0.94 | |
| Late Life Cognitive Activity | 0.04 | 0.05 | 0.43 | 0.09 | 0.06 | 0.14 | -0.14 | 0.10 | 0.17 | |
| Late Life Social Activity | -0.00 | 0.07 | 0.97 | -0.02 | 0.09 | 0.86 | 0.01 | 0.14 | 0.94 | |
| Physical Activity | 0.06 | 0.04 | 0.12 | 0.03 | 0.05 | 0.54 | 0.11 | 0.08 | 0.15 | |
| Life Space | -0.07 | 0.03 | 0.01 | -0.07 | 0.03 | 0.04 | -0.05 | 0.05 | 0.30 | |
| Discrimination | -0.04 | 0.02 | 0.01 | -0.04 | 0.02 | 0.04 | -0.04 | 0.04 | 0.30 | |
| Income | 0.04 | 0.02 | 0.01 | 0.04 | 0.02 | 0.04 | 0.04 | 0.03 | 0.14 | |
| Model 2: Final Stepwise Linear Regression Models | ||||||||||
| Est | SE | p | Est | SE | p | Est | SE | p | ||
| Purpose In Life | 0.19 | 0.09 | 0.03 | 0.72 | 0.18 | <0.001 | ||||
| Social Isolation | ||||||||||
| Social Network Size | ||||||||||
| Late Life Cognitive Activity | ||||||||||
| Late Life Social Activity | ||||||||||
| Physical Activity | ||||||||||
| Life Space | -0.07 | 0.03 | 0.01 | |||||||
| Discrimination | -0.04 | 0.02 | 0.02 | |||||||
| Income | 0.05 | 0.02 | 0.001 | 0.05 | 0.02 | 0.01 | 0.06 | 0.03 | 0.03 | |
*Based on multivariable linear regression models controlling for age, gender, and years of education. Statistics provided include parameter estimates, standard errors, and p-values.
References
- Besser, L. M.; Rodriguez, D. A.; McDonald, N.; Kukull, W. A.; Fitzpatrick, A. L.; Rapp, S. R.; Seeman, T. Neighborhood built environment and cognition in non-demented older adults: The Multi-Ethnic Study of Atherosclerosis. Social science & medicine 2018, 200, 27–35. [Google Scholar] [CrossRef]
- Braveman, P. A.; Egerter, S. A.; Woolf, S. H.; Marks, J. S. When do we know enough to recommend action on the social determinants of health? American journal of preventive medicine 2011, 40, S58–S66. [Google Scholar] [CrossRef]
- Franco, M.; Roux, A. V. D.; Glass, T. A.; Caballero, B.; Brancati, F. L. Neighborhood characteristics and availability of healthy foods in Baltimore. American journal of preventive medicine 2008, 35, 561–567. [Google Scholar] [CrossRef]
- Towfighi, A.; Berger, R. P.; Corley, A. M.; Glymour, M. M.; Manly, J. J.; Skolarus, L. E. Recommendations on social determinants of health in neurologic disease. Neurology 2023, 101 Supplement_1, S17–S26. [Google Scholar] [CrossRef]
- Griffith, D. M.; Towfighi, A.; Manson, S. M.; Littlejohn, E. L.; Skolarus, L. E. Determinants of inequities in neurologic disease, health, and well-being: The NINDS social determinants of health framework. Neurology 2023, 101 Supplement_1, S75–S81. [Google Scholar] [CrossRef] [PubMed]
- Peters, M.; Muellmann, S.; Christianson, L.; Stalling, I.; Bammann, K.; Drell, C.; Forberger, S. Measuring the association of objective and perceived neighborhood environment with physical activity in older adults: challenges and implications from a systematic review. International journal of health geographics 2020, 19, 1–20. [Google Scholar] [CrossRef] [PubMed]
- Powell, W. R.; Buckingham, W. R.; Larson, J. L.; Vilen, L.; Yu, M.; Salamat, M. S.; Kind, A. J. Association of neighborhood-level disadvantage with Alzheimer disease neuropathology. JAMA network open 2020, 3, e207559–e207559. [Google Scholar] [CrossRef] [PubMed]
- Wong, C. G.; Miller, J. B.; Zhang, F.; Rissman, R. A.; Raman, R.; Hall, J. R.; HABS-HD Study Team. Evaluation of neighborhood-level disadvantage and cognition in Mexican American and non-Hispanic White adults 50 years and older in the US. JAMA network open 2023, 6, e2325325–e2325325. [Google Scholar] [CrossRef]
- Buckley, T.D. A Scoping Review of Psychological Sense of Community among Community-Dwelling Older Adults. Int J Environ Res Public Health 2022, 19, 8395. [Google Scholar] [CrossRef]
- Echeverria, S. E.; Diez-Roux, A. V.; Link, B. G. Reliability of self-reported neighborhood characteristics. Journal of Urban Health 2004, 81, 682–701. [Google Scholar] [CrossRef]
- Echeverría, S.; Diez-Roux, A. V.; Shea, S.; Borrell, L. N.; Jackson, S. Associations of neighborhood problems and neighborhood social cohesion with mental health and health behaviors: the Multi-Ethnic Study of Atherosclerosis. Health & place 2008, 14, 853–865. [Google Scholar] [CrossRef]
- Maisel, J. L. Impact of older adults’ neighborhood perceptions on walking behavior. Journal of aging and physical activity 2016, 24, 247–255. [Google Scholar] [CrossRef]
- Schulz, A. J.; Zenk, S. N.; Israel, B. A.; Mentz, G.; Stokes, C.; Galea, S. Do neighborhood economic characteristics, racial composition, and residential stability predict perceptions of stress associated with the physical and social environment? Findings from a multilevel analysis in Detroit. Journal of Urban Health 2008, 85, 642–661. [Google Scholar] [CrossRef]
- Curl, A.; Mason, P. Neighbourhood perceptions and older adults’ wellbeing: Does walking explain the relationship in deprived urban communities? Transportation research part A: policy and practice 2019, 123, 119–129. [Google Scholar] [CrossRef]
- Barile, J. P.; Kuperminc, G. P.; Thompson, W. W. Resident characteristics and neighborhood environments on health-related quality of life and stress. Journal of Community Psychology 2017, 45, 1011–1025. [Google Scholar] [CrossRef]
- Wen, M.; Hawkley, L. C.; Cacioppo, J. T. Objective and perceived neighborhood environment, individual SES and psychosocial factors, and self-rated health: An analysis of older adults in Cook County, Illinois. Social science & medicine 2006, 63, 2575–2590. [Google Scholar] [CrossRef]
- Thierry, A. D.; Sherman-Wilkins, K.; Armendariz, M.; Sullivan, A.; Farmer, H. R. Perceived neighborhood characteristics and cognitive functioning among diverse older adults: An intersectional approach. International Journal of Environmental Research and Public Health 2021, 18, 2661. [Google Scholar] [CrossRef]
- Boslaugh, S. E.; Luke, D. A.; Brownson, R. C.; Naleid, K. S.; Kreuter, M. W. Perceptions of neighborhood environment for physical activity: Is it “who you are” or “where you live?”. Journal of Urban Health 2004, 81, 671–681. [Google Scholar] [CrossRef] [PubMed]
- Whitfield, G. P.; Carlson, S. A.; Ussery, E. N.; Watson, K. B.; Brown, D. R.; Berrigan, D.; Fulton, J. E. Racial and ethnic differences in perceived safety barriers to walking, United States National Health Interview Survey–2015. Preventive medicine 2018, 114, 57–63. [Google Scholar] [CrossRef]
- Lawton, M.P. Environment and Aging; Center for the Study of Aging: Albany, NY, 1986. [Google Scholar]
- Lawton, M. P.; Nahemow, L. Ecology and the aging process. In The psychology of adult development and aging; Eisdorfer, C., Lawton, M. P., Eds.; American Psychological Association, 1973; pp. 619–674. [Google Scholar] [CrossRef]
- World Health Organization. Global age-friendly cities: a guide. World Health Organization. 2007. Available online: https://iris.who.int/handle/10665/43755.
- Bennett, D. A.; Buchman, A. S.; Boyle, P. A.; Barnes, L. L.; Wilson, R. S.; Schneider, J. A. Religious orders study and rush memory and aging project. Journal of Alzheimer’s disease 2018, 64, S161–S189. [Google Scholar] [CrossRef]
- Barnes, L.L.; Shah, R.C.; Aggarwal, N.T.; Bennett, D.A; Schneider, J.A. The Minority Aging Research Study: ongoing efforts to obtain brain donation in African Americans without dementia. Current Alzheimer Research 2012b, 9, 734–745. [Google Scholar] [CrossRef]
- Marquez, D. X.; Glover, C. M.; Lamar, M.; Leurgans, S. E.; Shah, R. C.; Barnes, L. L.; Bennett, D. A. Representation of older Latinxs in cohort studies at the Rush Alzheimer’s Disease Center. Neuroepidemiology 2020, 54, 404–418. [Google Scholar] [CrossRef]
- Burke-Miller, J. K.; Weber, K. M.; Cohn, S. E.; Hershow, R. C.; Sha, B.; French, A. L.; Cohen, M. H. Measurement of neighborhood context in an urban cohort of HIV-infected or at risk low-income women. Journal of poverty 2017, 21, 80–96. [Google Scholar] [CrossRef]
- Mujahid, M. S.; Diez Roux, A. V.; Morenoff, J. D.; Raghunathan, T. Assessing the measurement properties of neighborhood scales: from psychometrics to ecometrics. American journal of epidemiology 2007, 165, 858–867. [Google Scholar] [CrossRef]
- Barnes, L. L.; Wilson, R. S.; Mendes de Leon, C. F.; Bennett, D. A. The relation of lifetime cognitive activity and lifetime access to resources to late-life cognitive function in older African Americans. Aging, Neuropsychology, and Cognition 2006, 13, 516–528. [Google Scholar] [CrossRef] [PubMed]
- Glover, C. M.; Yu, L.; Stewart, C. C.; Wilson, R. S.; Bennett, D. A.; Boyle, P. A. The association of late life cognitive activity with healthcare and financial decision-making in community-dwelling, nondemented older adults. The American Journal of Geriatric Psychiatry 2021, 29, 117–125. [Google Scholar] [CrossRef]
- James, B. D.; Wilson, R. S.; Barnes, L. L.; Bennett, D. A. Late-life social activity and cognitive decline in old age. Journal of the International Neuropsychological Society 2011, 17, 998–1005. [Google Scholar] [CrossRef] [PubMed]
- Ryff, C. D.; Keyes, C. L. M. The structure of psychological well-being revisited. Journal of personality and social psychology 1995, 69, 719–727. [Google Scholar] [CrossRef] [PubMed]
- Glover, C. M.; Stewart, C. C.; Yu, L.; Wilson, R. S.; Lamar, M.; Bennett, D. A.; Boyle, P. A. Psychological Well-being Relates to Healthcare and Financial Decision Making in a Study of Predominantly White Older Adults. Journal of Applied Gerontology 2023. [Google Scholar] [CrossRef]
- Wilson, R.S.; Krueger, K.R.; Arnold, S.E.; Schneider, J.A.; Kelly, J.F.; Barnes, L.L.; Tang, Y.; Bennett, D.A. Loneliness and risk of Alzheimer disease. Archives of general psychiatry 2007, 64, 234–240. [Google Scholar] [CrossRef]
- Bennett, D. A.; Schneider, J. A.; Tang, Y.; Arnold, S. E.; Wilson, R. S. The effect of social networks on the relation between Alzheimer's disease pathology and level of cognitive function in old people: a longitudinal cohort study. The Lancet Neurology 2006, 5, 406–412. [Google Scholar] [CrossRef] [PubMed]
- Barnes, L. L.; Wilson, R. S.; Bienias, J. L.; Mendes de Leon, C. F.; Kim, H. J. N.; Buchman, A. S.; Bennett, D. A. Correlates of life space in a volunteer cohort of older adults. Experimental aging research 2007, 33, 77–93. [Google Scholar] [CrossRef] [PubMed]
- Barnes, L. L.; De Leon, C. F. M.; Lewis, T. T.; Bienias, J. L.; Wilson, R. S.; Evans, D. A. Perceived discrimination and mortality in a population-based study of older adults. American journal of public health 2008, 98, 1241–1247. [Google Scholar] [CrossRef]
- Barnes, L. L.; Lewis, T. T.; Begeny, C. T.; Yu, L.; Bennett, D. A.; Wilson, R. S. Perceived discrimination and cognition in older African Americans. Journal of the International Neuropsychological Society 2012a, 18, 856–865. [Google Scholar] [CrossRef]
- Huntley, J.; Ostfeld, A.M.; Taylor, J.O.; et al. Established populations for epidemiologic studies of the elderly: Study design and methodology. Aging Clinical and Experimental Research 1993, 5, 27–37. [Google Scholar] [CrossRef]
- Besser, L. M.; McDonald, N. C.; Song, Y.; Kukull, W. A.; Rodriguez, D. A. Neighborhood environment and cognition in older adults: a systematic review. American journal of preventive medicine 2017, 53, 241–251. [Google Scholar] [CrossRef]
- Heuer, S.; Besser, L.; Dominguez, B.; Huynh, S.; Le, B. N.; Nguyen, B. S.; Meyer, O. See Something, Say Something: A Qualitative Study of Neighborhood Perceptions And Brain Health. Innovation In Aging 2024, 8 Suppl 1, 1333. [Google Scholar] [CrossRef]
- Arcaya, M. C.; Ellen, I. G.; Steil, J. Neighborhoods and Health: Interventions at the Neighborhood Level Could Help Advance Health Equity: Article Examines Interventions at the Neighborhood Level That Could Help Advance Health Equity. Health Affairs 2024, 43(2), 156–163. [Google Scholar] [CrossRef]
- Sallis, J. F.; Saelens, B. E.; Frank, L. D.; Conway, T. L.; Slymen, D. J.; Cain, K. L.; Kerr, J. Neighborhood built environment and income: examining multiple health outcomes. Social science & medicine 2009, 68(7), 1285–1293. [Google Scholar] [CrossRef]
- Hunt, M. O.; Wise, L. A.; Jipguep, M. C.; Cozier, Y. C.; Rosenberg, L. Neighborhood racial composition and perceptions of racial discrimination: Evidence from the Black Women's Health Study. Social Psychology Quarterly 2007, 70(3), 272–289. [Google Scholar] [CrossRef]
- Stokes, J. E. Trajectories of perceived neighborhood quality across the life course: Sociodemographic determinants and implications for well-being. Social Science Research 2019, 79, 181–193. [Google Scholar] [CrossRef] [PubMed]
- Song, Y.; Liu, Y.; Bai, X.; Yu, H. Effects of neighborhood built environment on cognitive function in older adults: a systematic review. BMC geriatrics 2024, 24(1), 194. [Google Scholar] [CrossRef]
- Yang, H. W.; Wu, Y. H.; Lin, M. C.; Liao, S. F.; Fan, C. C.; Wu, C. S.; Wang, S. H. Association between neighborhood availability of physical activity facilities and cognitive performance in older adults. Preventive Medicine 2023, 175, 107669. [Google Scholar] [CrossRef] [PubMed]
- Sullivan, A.; Armendariz, M.; Thierry, A. D. A scoping review of neighborhoods and cognitive health disparities among US midlife and older adults. Journal of Aging and Health 2024, 36(3-4), 257–270. [Google Scholar] [CrossRef]
- Anderson, E. The white space. Sociology of race and ethnicity 2015, 1(1), 10–21. [Google Scholar] [CrossRef]
- DeAngelis, R.; Fisher, V.; Dou, J.; Bakulski, K.; Rigby, D.; Hicken, M. Residential Segregation and Epigenetic Age Acceleration Among Older-Age Black and White Americans. International Journal of Environmental Research and Public Health 2025, 22(6), 837. [Google Scholar] [CrossRef]
- Mao, S.; Lou, V. W.; Lu, N. Perceptions of neighborhood environment and loneliness among older Chinese adults: the mediator role of cognitive and structural social capital. Aging & Mental Health 2023, 27(3), 595–603. [Google Scholar] [CrossRef]
- Bhatt, R.; Lori, A.; Liu, J.; Mei, Z.; Wingo, T. S.; Wingo, A. P. Important Correlates of Purpose in Life in a Diverse Population-Based Cohort: A Machine Learning Approach. The American Journal of Geriatric Psychiatry 2023, 31(9), 691–703. [Google Scholar] [CrossRef] [PubMed]
- Ayón, C.; Marsiglia, F.F.; Bermudez-Parsai, M. Latino family mental health: Exploring the role of discrimination and familismo. Journal of community psychology 2010, 38, 742–756. [Google Scholar] [CrossRef]
- Calzada, E.J.; Tamis-LeMonda, C.S.; Yoshikawa, H. Familismo in Mexican and Dominican families from low-income, urban communities. Journal of Family Issues 2013, 34, 1696–1724. [Google Scholar] [CrossRef]
- Chavez-Korell, S.; Benson-Flórez, G.; Rendón, A.D.; Farías, R. Examining the relationships between physical functioning, ethnic identity, acculturation, familismo, and depressive symptoms for Latino older adults. The Counseling Psychologist 2014, 42, 255–277. [Google Scholar] [CrossRef]
- Nicasio, A.V.; Cassisi, J.E.; Negy, C.; Jentsch, F. Attitude–behavior discrepancy in familism and its relation to symptoms of depression among Latinos. Journal of Latinx Psychology 2019, 7, 154. [Google Scholar] [CrossRef]
- Ruiz, M.E.; Ransford, H.E. Latino elders reframing familismo: Implications for health and caregiving support. Journal of Cultural Diversity 2012, 19, 50. [Google Scholar] [PubMed]
Disclaimer/Publisher’s Note: The statements, opinions and data contained in all publications are solely those of the individual author(s) and contributor(s) and not of MDPI and/or the editor(s). MDPI and/or the editor(s) disclaim responsibility for any injury to people or property resulting from any ideas, methods, instructions or products referred to in the content. |
© 2025 by the authors. Licensee MDPI, Basel, Switzerland. This article is an open access article distributed under the terms and conditions of the Creative Commons Attribution (CC BY) license (http://creativecommons.org/licenses/by/4.0/).
Copyright: This open access article is published under a Creative Commons CC BY 4.0 license, which permit the free download, distribution, and reuse, provided that the author and preprint are cited in any reuse.


