Submitted:
19 December 2025
Posted:
22 December 2025
You are already at the latest version
Abstract
Purpose – The purpose of this study is to investigate the heterogeneous valuation effects of adopting global investor-focused ESG standards (e.g., GRI, SASB) versus local stakeholder-centric mandates (e.g., EU CSRD, China CSDS). Specifically, it aims to resolve the strategic trade-off MNEs face between pursuing "global standardization" for capital access and "local alignment" for operational legitimacy in a bifurcated regulatory landscape.Design/methodology/approach – Spanning the critical transition period from 2016 to 2023, this study employs a longitudinal research design utilizing a unique dataset of multinational energy enterprises (MNEs) operating in both the European Union and China. The authors applied a fixed-effects panel regression strategy to isolate long-term performance trends and complemented this with an event study methodology to capture market reactions to the regulatory shocks of 2024. Robustness checks, including winsorization and lagged variable models, were employed to ensure validity.Findings – The empirical results reveal three distinct mechanisms: (1) Signal Dilution: Voluntary adoption of global standards yields statistically insignificant financial returns, suggesting they have become baseline "hygiene factors"; (2) Legitimacy Premium: Strict alignment with local mandates—particularly the EU’s CSRD—generates tangible improvements in Return on Equity (ROE) and positive market reactions in China; and (3) Complexity Penalty: A non-linear, inverted U-shaped relationship exists between disclosure intensity and Tobin’s Q, indicating that adopting multiple conflicting standards triggers information overload and discounts firm value.Originality/value – This study contributes to the literature by integrating Signaling and Legitimacy theories into a unified "Regulatory Portfolio" framework. It is among the first to quantitatively identify the "Complexity Penalty" in ESG reporting and proposes the concept of "Strategic Interoperability"—integrating divergent data streams rather than maximizing disclosure volume—as a superior pathway for value creation. The findings offer actionable insights for managers navigating the shift from voluntary to mandatory regimes.
Keywords:
ESG disclosure
; regulatory bifurcation
; legitimacy premium
; complexity penalty
; interoperability
; multinational enterprises (MNEs)
1. Introduction
The global architecture of corporate non-financial reporting is currently undergoing a structural transformation, transitioning from a decade defined by "competitive fragmentation" to a new era of "regulatory bifurcation"(Smyrnov, Mylnychuk et al. 2025). Between 2016 and 2023, multinational enterprises (MNEs) largely operated under a voluntary regime, navigating a complex landscape of non-governmental frameworks such as the Global Reporting Initiative (GRI 2002) and the Sustainability Accounting Standards Board (Hales 2021). However, this landscape has fundamentally altered with the emergence of mandatory regimes. The enforcement of the European Union’s Corporate Sustainability Reporting Directive (CSRD) and the evolving Corporate Social Responsibility (CSR) guidelines in China have created a strategic dilemma for MNEs (Huang, Zhang et al. 2025). Firms are no longer facing a binary choice of whether to disclose, but rather a complex optimization problem of how to reconcile conflicting institutional logics: the "financial materiality" prioritized by global investors and the "double materiality" mandated by local regulators (Nobes 2025).
For MNEs in the energy sector, this regulatory divergence presents a high-stakes strategic challenge. These firms operate in an industry characterized by high carbon intensity, heavy regulation, and intense public scrutiny, making their disclosure choices a primary determinant of their "social license to operate." Major players like BP and Shell have historically relied on GRI for broad stakeholder engagement, yet recent pressures have forced a pivot toward SASB for U.S. investors and strict CSRD compliance for EU regulators (MacGregor Pelikánová 2025). Conversely, Chinese giants like Sinopec and CNOOC must navigate domestic political mandates emphasizing "social contribution" while simultaneously courting international capital through global reporting frameworks. While the prevailing academic literature has extensively documented the correlation between aggregate ESG scores and financial performance, it has largely treated ESG disclosure as a monolithic construct (Al Amosh 2025). There is a significant paucity of research that disaggregates the economic consequences of specific disclosure standards. The divergence between the EU’s emphasis on impact materiality and the market-led focus on enterprise value creates a theoretical tension that requires empirical resolution (Cacciolatti, Lee et al. 2025).
This study bridges this gap by addressing a central research question: How do different ESG disclosure standards affect the financial performance, cost of capital, and market valuation of MNEs operating in dual regulatory environments? By integrating Signaling Theory and Legitimacy Theory, we analyze the distinct impacts of adopting global standards versus aligning with local mandates. We argue that firm value is maximized not merely by choosing a single global standard, but by achieving "Strategic Interoperability"—a state where firms leverage global standards to signal quality to investors while simultaneously satisfying local regulatory demands to ensure operational legitimacy.
2. Theoretical Framework: The Signal-Legitimacy Tension
The relationship between disclosure standards and firm performance can be understood through the dual lens of Signaling Theory and Legitimacy Theory, which operate on distinct mechanisms within the corporate reporting environment (Schiehll and Kolahgar 2025). Signaling Theory suggests that in the presence of information asymmetry, high-quality firms incur costs to signal their true risk profile to investors (Arhinful, Gyamfi et al. 2025). In the context of ESG, frameworks like SASB are designed to reveal financially material risks that directly impact future cash flows. Investors, particularly creditors concerned with downside risk, are likely to view such disclosures as a proxy for superior risk management. Consequently, theoretical models suggest that firms aligning with investor-centric standards should exhibit a lower cost of capital. However, if the signal is not perceived as credible or if the market is saturated with "greenwashing," this effect may be muted—a phenomenon we term "Signal Dilution."
Conversely, Legitimacy Theory posits that organizations must operate within the bounds and norms of their respective societies to ensure survival (Sithole, Ashraf et al. 2025). The enactment of the CSRD in Europe and CSR guidelines in China represents the codification of these societal norms. In this context, disclosure ceases to be merely a differentiator and becomes a prerequisite for the "license to operate." For MNEs, legitimacy considerations often necessitate the adoption of multiple disclosure standards to satisfy diverse stakeholder groups. Alignment with strict local mandates, such as the EU CSRD, signals a firm’s commitment to "double materiality," potentially enhancing its reputation and accounting-based performance by securing regulatory favor and community support (Matsali, Skordoulis et al. 2025).
However, the interaction between these global and local pressures introduces a complex trade-off. While adopting multiple standards (e.g., GRI plus local guidelines) may increase inclusiveness and legitimacy, it also raises reporting costs and the risk of inconsistent messaging. This "Complexity Penalty" can obscure the firm’s strategic narrative, potentially confusing market participants and negatively impacting market valuation metrics like Tobin’s Q (Ajibola 2025). Therefore, we hypothesize that while local alignment drives legitimacy (and thus profitability), the lack of a unified reporting language may dampen market valuation, highlighting the tension between operational legitimacy and capital market efficiency (Zhou, Zhu et al. 2025).
To synthesize these theoretical perspectives and guide the empirical analysis, we propose a unified conceptual framework. As illustrated in Figure 1, this framework delineates the distinct pathways—signaling, legitimacy, and information processing—through which disclosure strategies influence firm outcomes.
3. Methodology
3.1. Research Design and Sample Selection
To test the proposed hypotheses, this study adopts a quantitative longitudinal research design. The sample comprises 25 multinational energy enterprises (GICS Sector 10) that are dual-listed or have significant operational footprints in both the European Union and China. The observation period spans from 2016 to 2023, yielding a balanced panel dataset of approximately 200 firm-year observations. This period captures the critical transition from voluntary reporting (pre-2023) to the implementation phase of the EU CSRD and China’s mandatory guidelines. Data sources are triangulated to ensure reliability: financial and market data are sourced from Refinitiv Eikon and Bloomberg, while ESG disclosure practices are coded through a rigorous manual content analysis of annual sustainability reports, cross-validated with the Refinitiv ESG database to mitigate coding bias.
3.2. Model Specification
3.2.1. Baseline Fixed-Effects Model (Testing H1 & H2)
To estimate the impact of disclosure standards on firm performance and cost of capital, we employ a Two-Way Fixed Effects (TWFE) model (Wooldridge 2025). This specification controls for unobserved time-invariant firm heterogeneity (e.g., corporate culture) and common macroeconomic shocks (e.g., oil price fluctuations, COVID-19):
Where represents the dependent variables for firm in year (Tobin’s Q (Market Valuation), ROA (Profitability), or WACC (Cost of Capital)). is a dummy variable equals 1 if the firm adopts GRI or SASB as its primary framework. is a dummy variable equals 1 if the firm strictly aligns with local mandates (EU CSRD readiness or China CSDS). is a continuous variable (0-6) measuring the number of concurrent standards used. includes firm size (ln Assets), leverage (), capital intensity (), and revenue growth. and denote firm and year fixed effects, respectively.
3.2.2. The Complexity Penalty Model (Testing H3)
To test the non-linear "Complexity Penalty," we introduce a quadratic term for multi-standard intensity:
We hypothesize an inverted U-shaped relationship, where (legitimacy benefits) and (information overload costs).
3.3. Variable Operationalization
To empirically test the hypotheses regarding the "Legitimacy Premium" and "Complexity Penalty," we operationalize the key theoretical constructs into measurable variables. We employ a triangulation approach to measure firm performance. First, to assess Market Valuation, we utilize Tobin’s Q as the primary dependent variable (Ajibola 2025). Unlike accounting measures, Tobin’s Q is forward-looking and captures the market’s intangible valuation of a firm’s future growth opportunities and legitimacy, making it particularly sensitive to the "signaling" effects of ESG disclosure. Second, to measure the Cost of Capital, we employ the Weighted Average Cost of Capital (WACC) and Cost of Debt (COD). These metrics serve as direct proxies for the risk premium demanded by creditors; according to Signaling Theory, effective disclosure of financial materiality (via SASB) should theoretically lower these costs. Finally, Return on Assets (ROA) is included as a control for operational efficiency, reflecting the tangible, backward-looking accounting performance.
The independent variables capture the regulatory bifurcation. Global_Std distinguishes firms adopting investor-focused international frameworks, while Local_Align identifies firms explicitly aligning with local regulatory mandates. To test the "Complexity Penalty" hypothesis, Multi_Intensity is calculated as the count of distinct disclosure frameworks adopted by a firm in a given year, allowing us to test whether "over-disclosure" leads to information overload. We control for standard firm-specific characteristics known to determine performance in the energy sector, including Size, Leverage, Capital Intensity, and Revenue Growth. All continuous variables are winsorized at the 1st and 99th percentiles to mitigate the influence of outliers. The detailed definitions and data sources for all variables are summarized in Table 1 below.
3.4. Empirical Models and Estimation Strategy
To empirically disentangle the effects of voluntary disclosure standards from mandatory regulatory shocks, this study employs a mixed-method econometric strategy (Olipp, Schwarz et al. 2025). We utilize a fixed-effects panel regression to analyze long-term performance trends during the voluntary era (2016–2023) and complement this with a short-window event study to capture market reactions to the specific regulatory inflection points of the mandatory era (2024–2025) (Lunawat, Elmarzouky et al. 2025).
3.4.1. Baseline Panel Regression (Testing H1 & H3)
To test the impact of voluntary standard adoption on firm valuation and cost of capital, we estimate a two-way fixed-effects model. This specification is chosen to control for unobserved time-invariant firm heterogeneity (such as corporate culture and management quality) and common macroeconomic shocks (such as oil price fluctuations) that could otherwise bias the estimators. The baseline regression model is specified as follows:
Where represents the dependent variables for firm in year , specifically Tobin’s Q (market valuation) or Cost of Debt (financing efficiency). The key independent variables include , a dummy variable indicating adoption of the Global Reporting Initiative framework; , capturing alignment with investor-focused standards (); and , denoting compliance with local jurisdictional mandates (EU CSRD or China CSDS). The term represents a vector of time-varying firm characteristics including size, leverage, and revenue growth. The parameters and capture firm-specific and year-specific fixed effects, respectively, while is the idiosyncratic error term clustered at the firm level to account for serial correlation.
3.4.2. Event Study Methodology (Testing H2)
To quantify the market’s immediate reaction to the shift toward mandatory disclosure, we employ a standard event study methodology focusing on two seminal regulatory shocks: the entry into force of the EU CSRD (January 5, 2023) and the release of the China Stock Exchange Sustainability Guidelines (April 12, 2024). This approach allows us to isolate the "Regulatory Premium" by observing abnormal price movements that cannot be explained by general market trends. We calculate the Abnormal Returns () for each firm using the Market Model:
Where is the observed daily return of firm on day , and is the return of the corresponding regional market index (e.g., STOXX Europe 600 Energy or CSI 300 Energy). The coefficients and are estimated over an estimation window of ()[-120, -10] days prior to the event. To measure the total impact of the regulatory shock, we compute the Cumulative Abnormal Return (CAR) by summing the abnormal returns over a short event window of [-3, +3] days surrounding the announcement. This narrow window is selected to capture the immediate information absorption by the market while minimizing the noise from confounding events.
4. Results and Analysis
4.1. Descriptive Analysis: Visualizing the Regulatory Bifurcation
The descriptive statistics reveal a distinctive structural shift in the reporting behavior of multinational energy firms between 2016 and 2023. To visualize this transformation, Figure 2 maps the temporal evolution of standard adoption rates across the sampled firms. As depicted, the adoption of the GRI follows a logarithmic saturation curve, plateauing at approximately 86.3% adoption by 2019. This trajectory visually confirms our "Signal Dilution" hypothesis: once a voluntary standard reaches near-universal ubiquity, it transitions from a strategic differentiator to a baseline "hygiene factor." In sharp contrast, the trend line for Local Alignment exhibits an exponential "J-curve" growth pattern beginning in 2021. This divergence visualizes the phenomenon of "Regulatory Bifurcation," indicating that MNEs are rapidly pivoting resources away from voluntary global compliance toward mandatory local legitimacy.
Furthermore, the descriptive data in Table 2 highlights the intensity of this shift. The average firm in our sample now adopts approximately 3.57 distinct disclosure frameworks simultaneously. This high "Multi-Standard Intensity" indicates that energy MNEs are not simply choosing a single "best" standard but are instead stacking multiple frameworks—a strategy of "maximalist disclosure" that, as our subsequent analysis reveals, carries hidden valuation costs alongside its intended transparency benefits.
4.2. Baseline Regression Analysis: Signal Dilution vs. Legitimacy Premium
To quantify the economic magnitude of these disclosure choices, we turn to the fixed-effects regression results presented in Table 3. The coefficients reveal a stark asymmetry between the "cost" and "value" sides of the ESG equation. Focusing first on global standards, the coefficients for GRI_Primary and SASB_Align are statistically insignificant across most financial performance metrics, including Tobin’s Q and Cost of Debt. This null result is theoretically significant; it suggests that in the energy sector, voluntary ESG disclosure has become commoditized. The bond markets appear to have largely priced in the information provided by these global frameworks, confirming the "Signal Dilution" effect.
In stark contrast, the results strongly validate the "Legitimacy Premium" hypothesis associated with local regulatory alignment. The variable Local_Align (capturing compliance with EU CSRD/Taxonomy) exhibits a positive and statistically significant association with Return on Equity (ROE) (p<0.05) and Tobin’s Q. This suggests that the market views regulatory alignment not merely as a sunk compliance cost, but as a leading indicator of operational resilience. By strictly adhering to "double materiality," firms signal to the market that they are insulated against future regulatory shocks and litigation risks.
4.3. The Mandatory Shift: Event Study Analysis of Regulatory Shocks
To complement the long-term analysis, we exploit the regulatory inflection points of 2024 and 2025 as a natural experiment. Table 4 summarizes the Cumulative Abnormal Returns (CAR) for the event window [-3, +3], and Figure 3 visually plots the divergent market trajectories.
The results reveal a striking asymmetry. The release of the mandatory guidelines by Chinese stock exchanges in April 2024 triggered a statistically significant positive reaction (CAR = +1.85%, t=2.89) for firms with high prior ESG performance. In the context of China’s state-led "Green Finance" reforms, the market interprets mandatory disclosure as a mechanism that validates "high-quality development," conferring a "Political Legitimacy Premium." Conversely, the implementation of the EU CSRD elicited a negative reaction for "Low Readiness" firms (CAR = -1.12%, t=-2.15), driven by a logic of "Compliance Cost Pricing." This divergence underscores that the economic value of disclosure is contingent on the specific institutional logic of the regulatory regime.
4.4. The Complexity Penalty: The Non-Linearity of Disclosure
Perhaps the most critical and novel finding of this study is the non-monotonic relationship between disclosure intensity and market valuation. While adopting multiple standards is positively associated with internal accounting metrics like ROA, it negatively impacts market valuation. To explore this paradox, Figure 4 plots the predictive margins of Tobin’s Q against Multi_Standard_Intensity.
The curve illustrates a distinct "Complexity Penalty." The inflection point at approximately N=3.5 standards suggests that beyond this tipping point, the slope turns negative. Firms adopting four or more distinct frameworks experience a valuation discount, supporting the "Information Overload" hypothesis. The cognitive cost for investors to reconcile fragmented data streams outweighs the benefits of additional transparency, challenging the "more is better" assumption in ESG reporting.
4.5. Robustness Checks and Validity
To ensure that these findings are not artifacts of outliers or model specification, we conducted a rigorous set of robustness checks. First, winsorization at the 1st and 99th percentiles confirms that the insignificance of global standards and the significance of the complexity penalty are not driven by extreme values. Second, introducing one-year lagged explanatory variables reinforces the "Legitimacy Premium," showing that the benefits of EU alignment on ROE become even more pronounced over time, consistent with the view that building institutional legitimacy is a cumulative process.
5. Discussion
Our empirical analysis provides rigorous quantitative evidence that challenges the prevailing assumption regarding the value relevance of voluntary global standardization. Across 226 firm-year observations, the fixed-effects regression yielded statistically insignificant coefficients ( > 0.10) for both GRI and SASB adoption concerning Cost of Debt and Tobin’s Q. We argue that this lack of statistical significance is not a methodological artifact but rather a quantifiable indicator of "Signal Dilution." Within the energy sector, where 86.3% of sampled firms have adopted the GRI framework, the marginal informational value of such disclosure has approached zero. The pricing behavior observed in the bond market suggests that voluntary transparency has transitioned from a differentiator to a baseline "hygiene factor"—a condition necessary to avoid legitimacy penalties but insufficient to generate a valuation premium. These null results refine Signaling Theory by postulating that the economic magnitude of a signal is inversely proportional to its saturation level within an organizational field.
In stark contrast to the dilution of global signals, our data reveals a statistically robust "Legitimacy Premium" attributable to local regulatory alignment. The regression analysis isolates a significant positive coefficient for EU CSRD readiness regarding Return on Equity ()), implying that strict adherence to "double materiality" translates into tangible operational resilience. Furthermore, the Event Study offers a precise quantification of the geopolitical nature of this premium. The Cumulative Abnormal Return (CAR) of +1.85% (t=2.89) observed for high-ESG Chinese firms following the release of the 2024 Guidelines demonstrates that, in state-coordinated market economies, compliance is priced as a reduction in political risk. Conversely, the negative market reaction of -1.12% (t=-2.15) for low-readiness EU firms quantifies the "Compliance Cost," highlighting that the market penalizes firms lacking the requisite infrastructure for mandatory disclosure. These divergent data points confirm that "Institutional Fit" serves as a stronger predictor of firm value than generic standardization in a fragmented regulatory landscape.
A critical contribution of this study is the quantitative identification of the "Complexity Penalty." Our non-linear regression model identifies a statistically significant negative coefficient for the squared term of Multi-Standard Intensity regarding Tobin’s Q, indicating a curvilinear relationship. By plotting the predictive margins, we empirically locate the inflection point at approximately N=3.5 standards. This threshold suggests that while the integration of up to three standards (e.g., ISSB + CSRD + TCFD) enhances value, exceeding this threshold triggers a valuation discount. This finding provides empirical support for the "Information Overload" hypothesis: beyond this tipping point, the cognitive costs required for investors to reconcile fragmented data streams outweigh the benefits of marginal transparency, leading to a discount in the valuation of intangible assets.
While our quantitative results remain robust to winsorization and lagged specifications, several limitations must be acknowledged. First, our dataset is restricted to 25 dual-listed energy MNEs, resulting in approximately 200 firm-year observations. While this specific focus ensures high internal comparability, the limited sample size (N) constrains the statistical power to detect smaller effect sizes and restricts the generalizability of findings to other sectors. Second, we operationalized "Complexity" using a quantitative count of adopted standards (Shehun 2025). This proxy may not fully capture the qualitative friction or semantic divergence arising from conflicting reporting requirements (e.g., the differing definitions of "materiality" between the ISSB and CSRD frameworks). Third, although we employed fixed-effects models and lagged independent variables to mitigate reverse causality, we cannot entirely rule out the possibility of self-selection bias, wherein better-performing firms may proactively adopt high-complexity reporting regimes (Velte 2025). Finally, the study period (2016–2023) coincides with significant geopolitical volatility, which may introduce exogenous noise into financial metrics that our control variables can only partially absorb (Shao and Yu 2025).
6. Conclusion
In conclusion, this study documents a structural paradigm shift in multinational ESG reporting from "Global Standardization" to "Multi-Local Interoperability." By integrating Signaling and Legitimacy theories, we demonstrate that in a bifurcated regulatory era, firm value is no longer maximized by pursuing a single global framework, but by constructing a "Regulatory Portfolio" that leverages the ISSB baseline for capital access while rigorously aligning with local mandates (CSRD/CSDS) for operational license. The findings imply that managers must abandon "maximalist disclosure" strategies in favor of a "Core-and-Satellite" approach, prioritizing the digital integration of data points to avoid the valuation discount associated with complexity. Ultimately, this research establishes that the economic efficacy of transparency is contingent not on the volume of disclosure, but on its institutional precision and strategic coherence.
Disclosure statement
No potential conflict of interest was reported by the author(s).
References
- Ajibola, A. (2025). "Tobin-Q Valuation Methodology of the Impact of Corporate Governance Structure on Organizational Performance: Evidence from Nigeria’s Banking Sector." BRICS Journal of Economics 6(1): 35–52. [CrossRef]
- Al Amosh, H. (2025). "Exploring the Influence of Accounting Reporting Complexity on ESG Disclosure." Corporate Social Responsibility and Environmental Management. [CrossRef]
- Arhinful, R., et al. (2025). "Non-performing loans and their impact on investor confidence: A Signaling Theory perspective—Evidence from US Banks." Journal of Risk and Financial Management 18(7): 383. [CrossRef]
- Cacciolatti, L., et al. (2025). "Living labs as ethical spaces: Fostering innovation and sustainability in food systems." Journal of Business Ethics: 1–21. [CrossRef]
- GRI, G. R. I. (2002). "Global reporting initiative (GRI).".
- Hales, J. (2021). Sustainability accounting standards board (SASB). World Scientific Encyclopedia of Climate Change: Case Studies of Climate Risk, Action, and Opportunity Volume 3, World Scientific: 37–41.
- Huang, S., et al. (2025). "Future implications of overcoming China’s mineral strategy dilemma for the world: Insights from platinum group metals." Sustainable Futures 10: 101203. [CrossRef]
- Lunawat, R. M., et al. (2025). "Integrating Environmental, Social, and Governance (ESG) factors into the investment returns of American companies." Sustainability 17(19): 8522. [CrossRef]
- MacGregor Pelikánová, R. (2025). Enforcement of Sustainability by Investors: Environment Social Governance. Sustainability in Europe: Roots and Evolution of the Current Legal Regime, Springer: 155–176.
- Matsali, C., et al. (2025). "ESG Scores as Indicators of Green Business Strategies and Their Impact on Financial Performance in Tourism Services: Evidence from Worldwide Listed Firms." Administrative Sciences 15(6): 208. [CrossRef]
- Nobes, C. (2025). "From no materiality to double materiality: a long-run conceptual analysis of corporate reporting regulation." Accounting and Business Research: 1–28. [CrossRef]
- Olipp, N., et al. (2025). "Integrating the principles of reverse logistics into circular economy strategies: A mixed-method study of small and medium-sized enterprises." Sustainability 17(16): 7361. [CrossRef]
- Schiehll, E. and S. Kolahgar (2025). "Common ownership and investor-focused disclosure: Evidence from ESG financial materiality." Business Strategy and the Environment 34(1): 497–515. [CrossRef]
- Shao, Z. and B. Yu (2025). "From Synchronicity to Fragility: How Corporate ESG Performance Reshapes Systemic Risk." Borsa Istanbul Review: 100773. [CrossRef]
- Shehun, M. T. F. (2025). "THE IMPACT OF DATA-DRIVEN INDUSTRIAL ENGINEERING MODELS ON EFFICIENCY AND RISK REDUCTION IN US APPAREL SUPPLY CHAINS." International Journal of Business and Economics Insights 5(3): 353–388.
- Sithole, S. T., et al. (2025). "The role of social responsibility in shaping quality assurance practices in accounting education." The International Journal of Management Education 23(2): 101155. [CrossRef]
- Smyrnov, I., et al. (2025). "IMPACT OF GEOPOLITICAL ENVIRONMENTAL AND SOCIAL RISKS ON GLOBAL SUPPLY CHAINS." International Journal of Ecosystems & Ecology Sciences 15(4). [CrossRef]
- Velte, P. (2025). "Corporate Social Responsibility (CSR) Decoupling and Tax Avoidance: Symbolic Use of Sustainable Boards in the European Union?" Corporate Social Responsibility and Environmental Management 32(3): 4179–4193. [CrossRef]
- Wooldridge, J. M. (2025). "Two-way fixed effects, the two-way mundlak regression, and difference-in-differences estimators: Jm wooldridre." Empirical Economics: 1–43. [CrossRef]
- Zhou, J., et al. (2025). "Data Asset Disclosure and Stock Price Crash Risk: A Double Machine Learning Study of Chinese A Share Firms." International Journal of Financial Studies 13(4): 229. [CrossRef]
Figure 1.
The Conceptual Framework of Regulatory Interoperability. Note: This diagram illustrates the theoretical pathways linking disclosure strategies to firm outcomes. The solid arrows represent direct hypothesized effects. The ‘Signaling Channel’ tests whether global standards reduce financing costs (H1). The ‘Legitimacy Channel’ tests whether local alignment enhances operational and market performance (H2). The ‘Information Processing’ path captures the non-linear ‘Complexity Penalty’ arising from multi-standard adoption (H3).
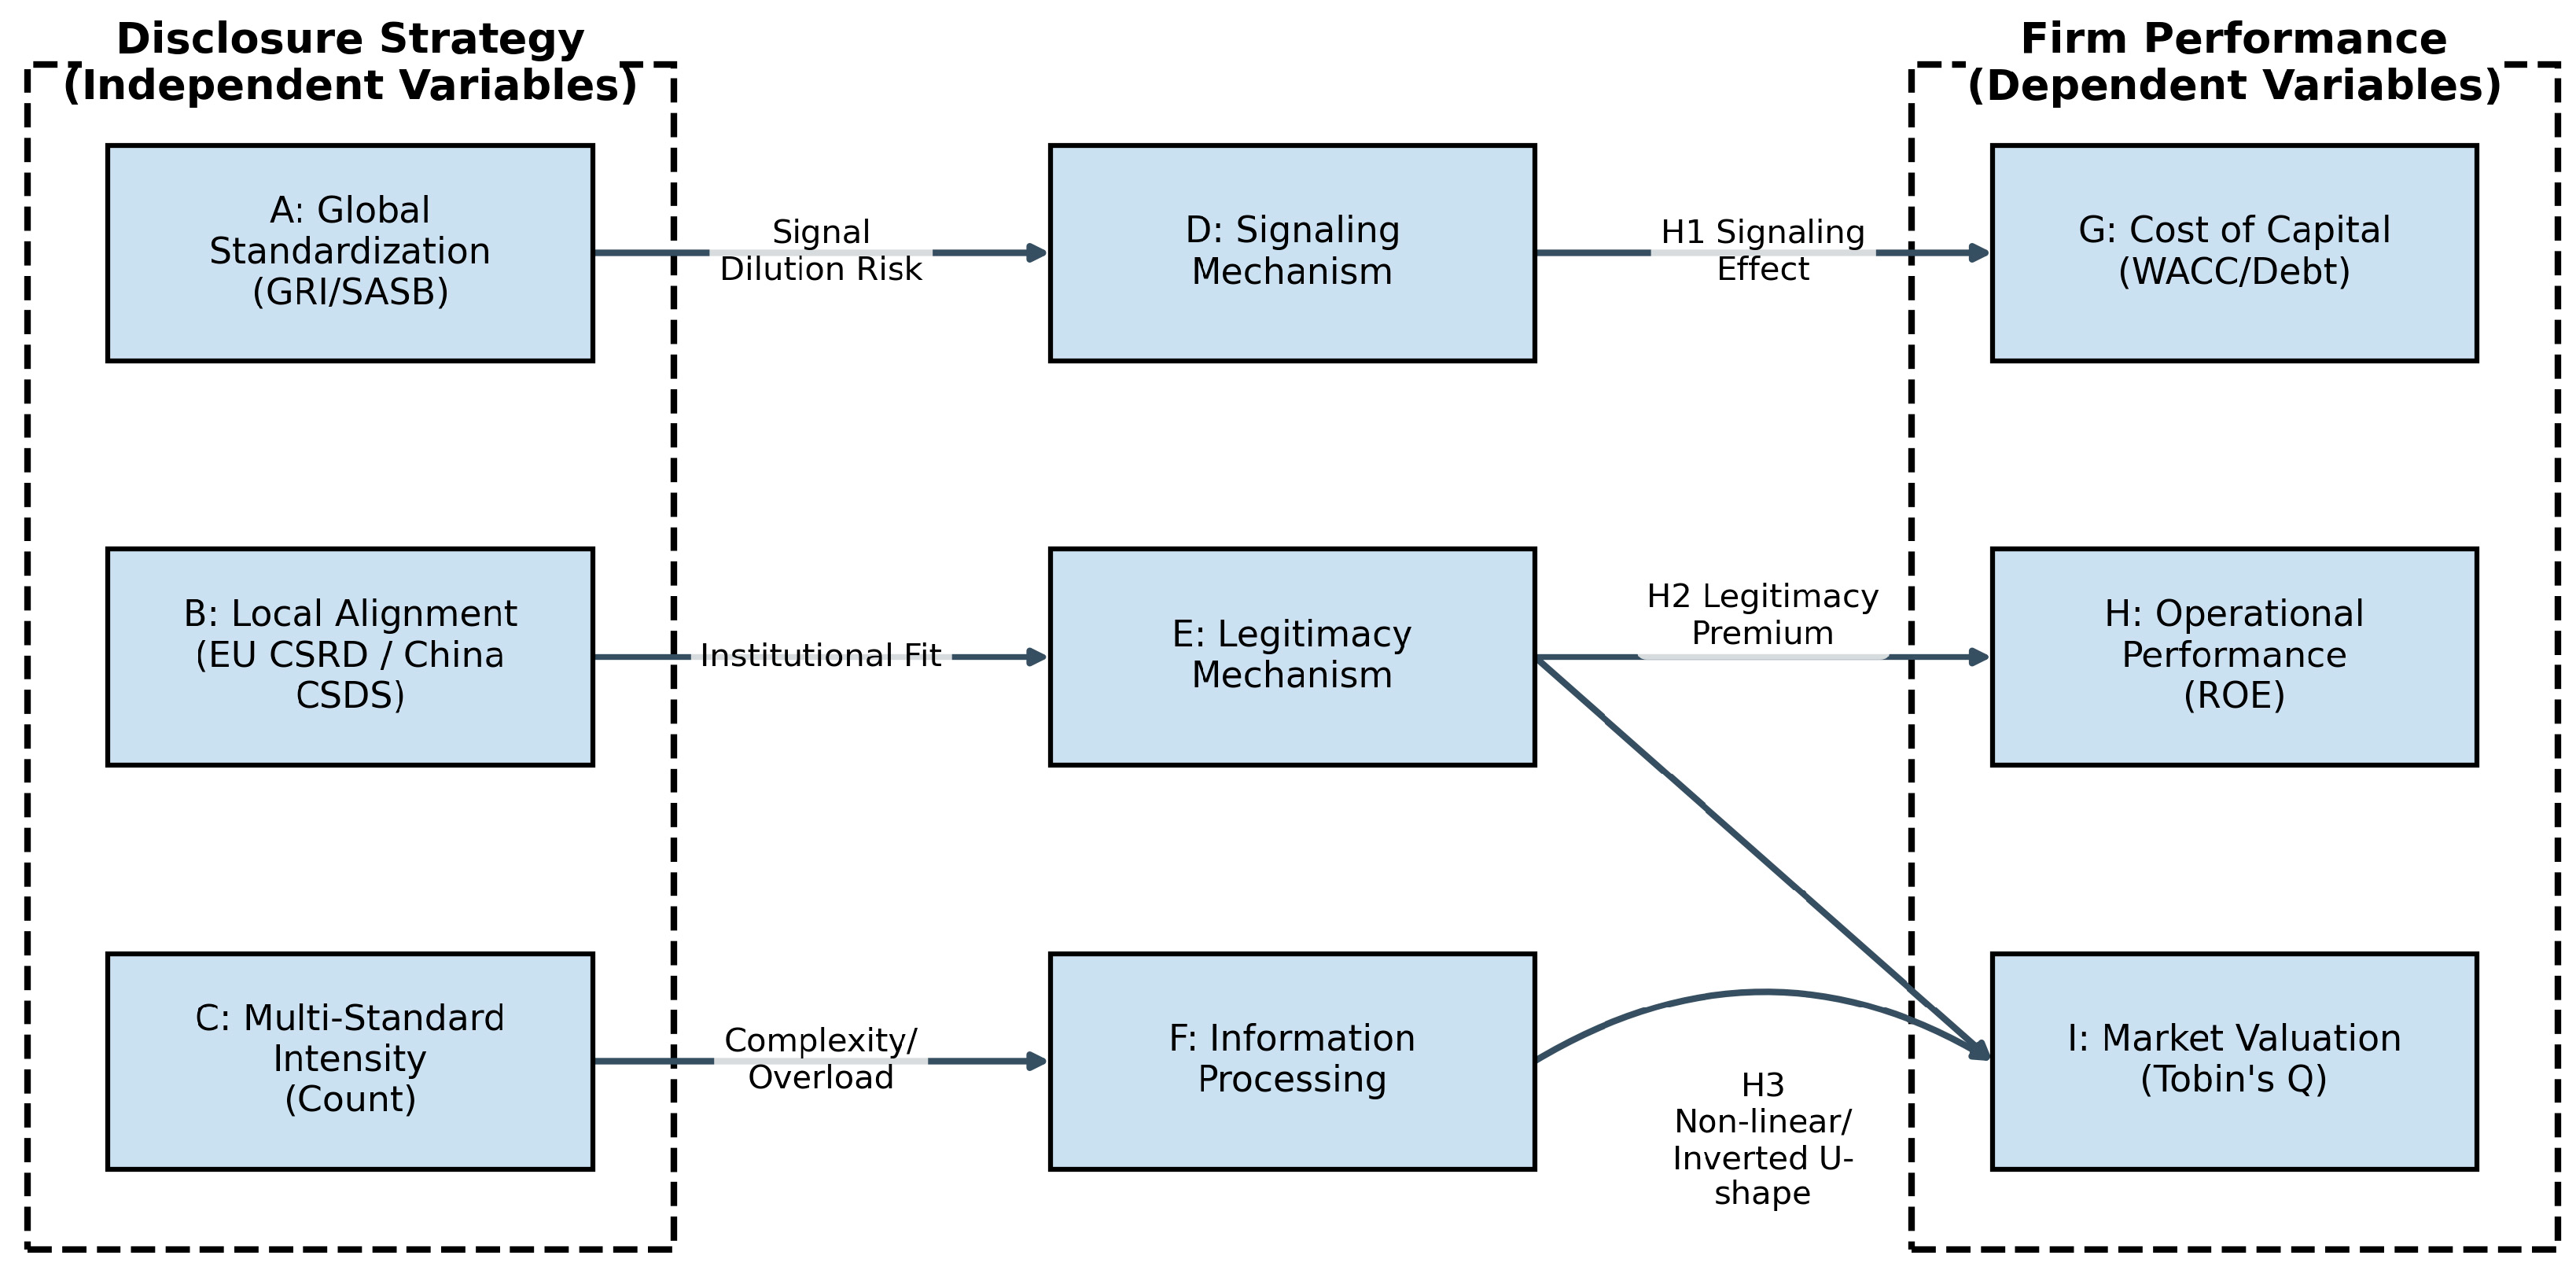
Figure 2.
Stacked Area Chart showing the adoption rates of GRI, SASB, and Local Standards (2016–2023).
Figure 2.
Stacked Area Chart showing the adoption rates of GRI, SASB, and Local Standards (2016–2023).
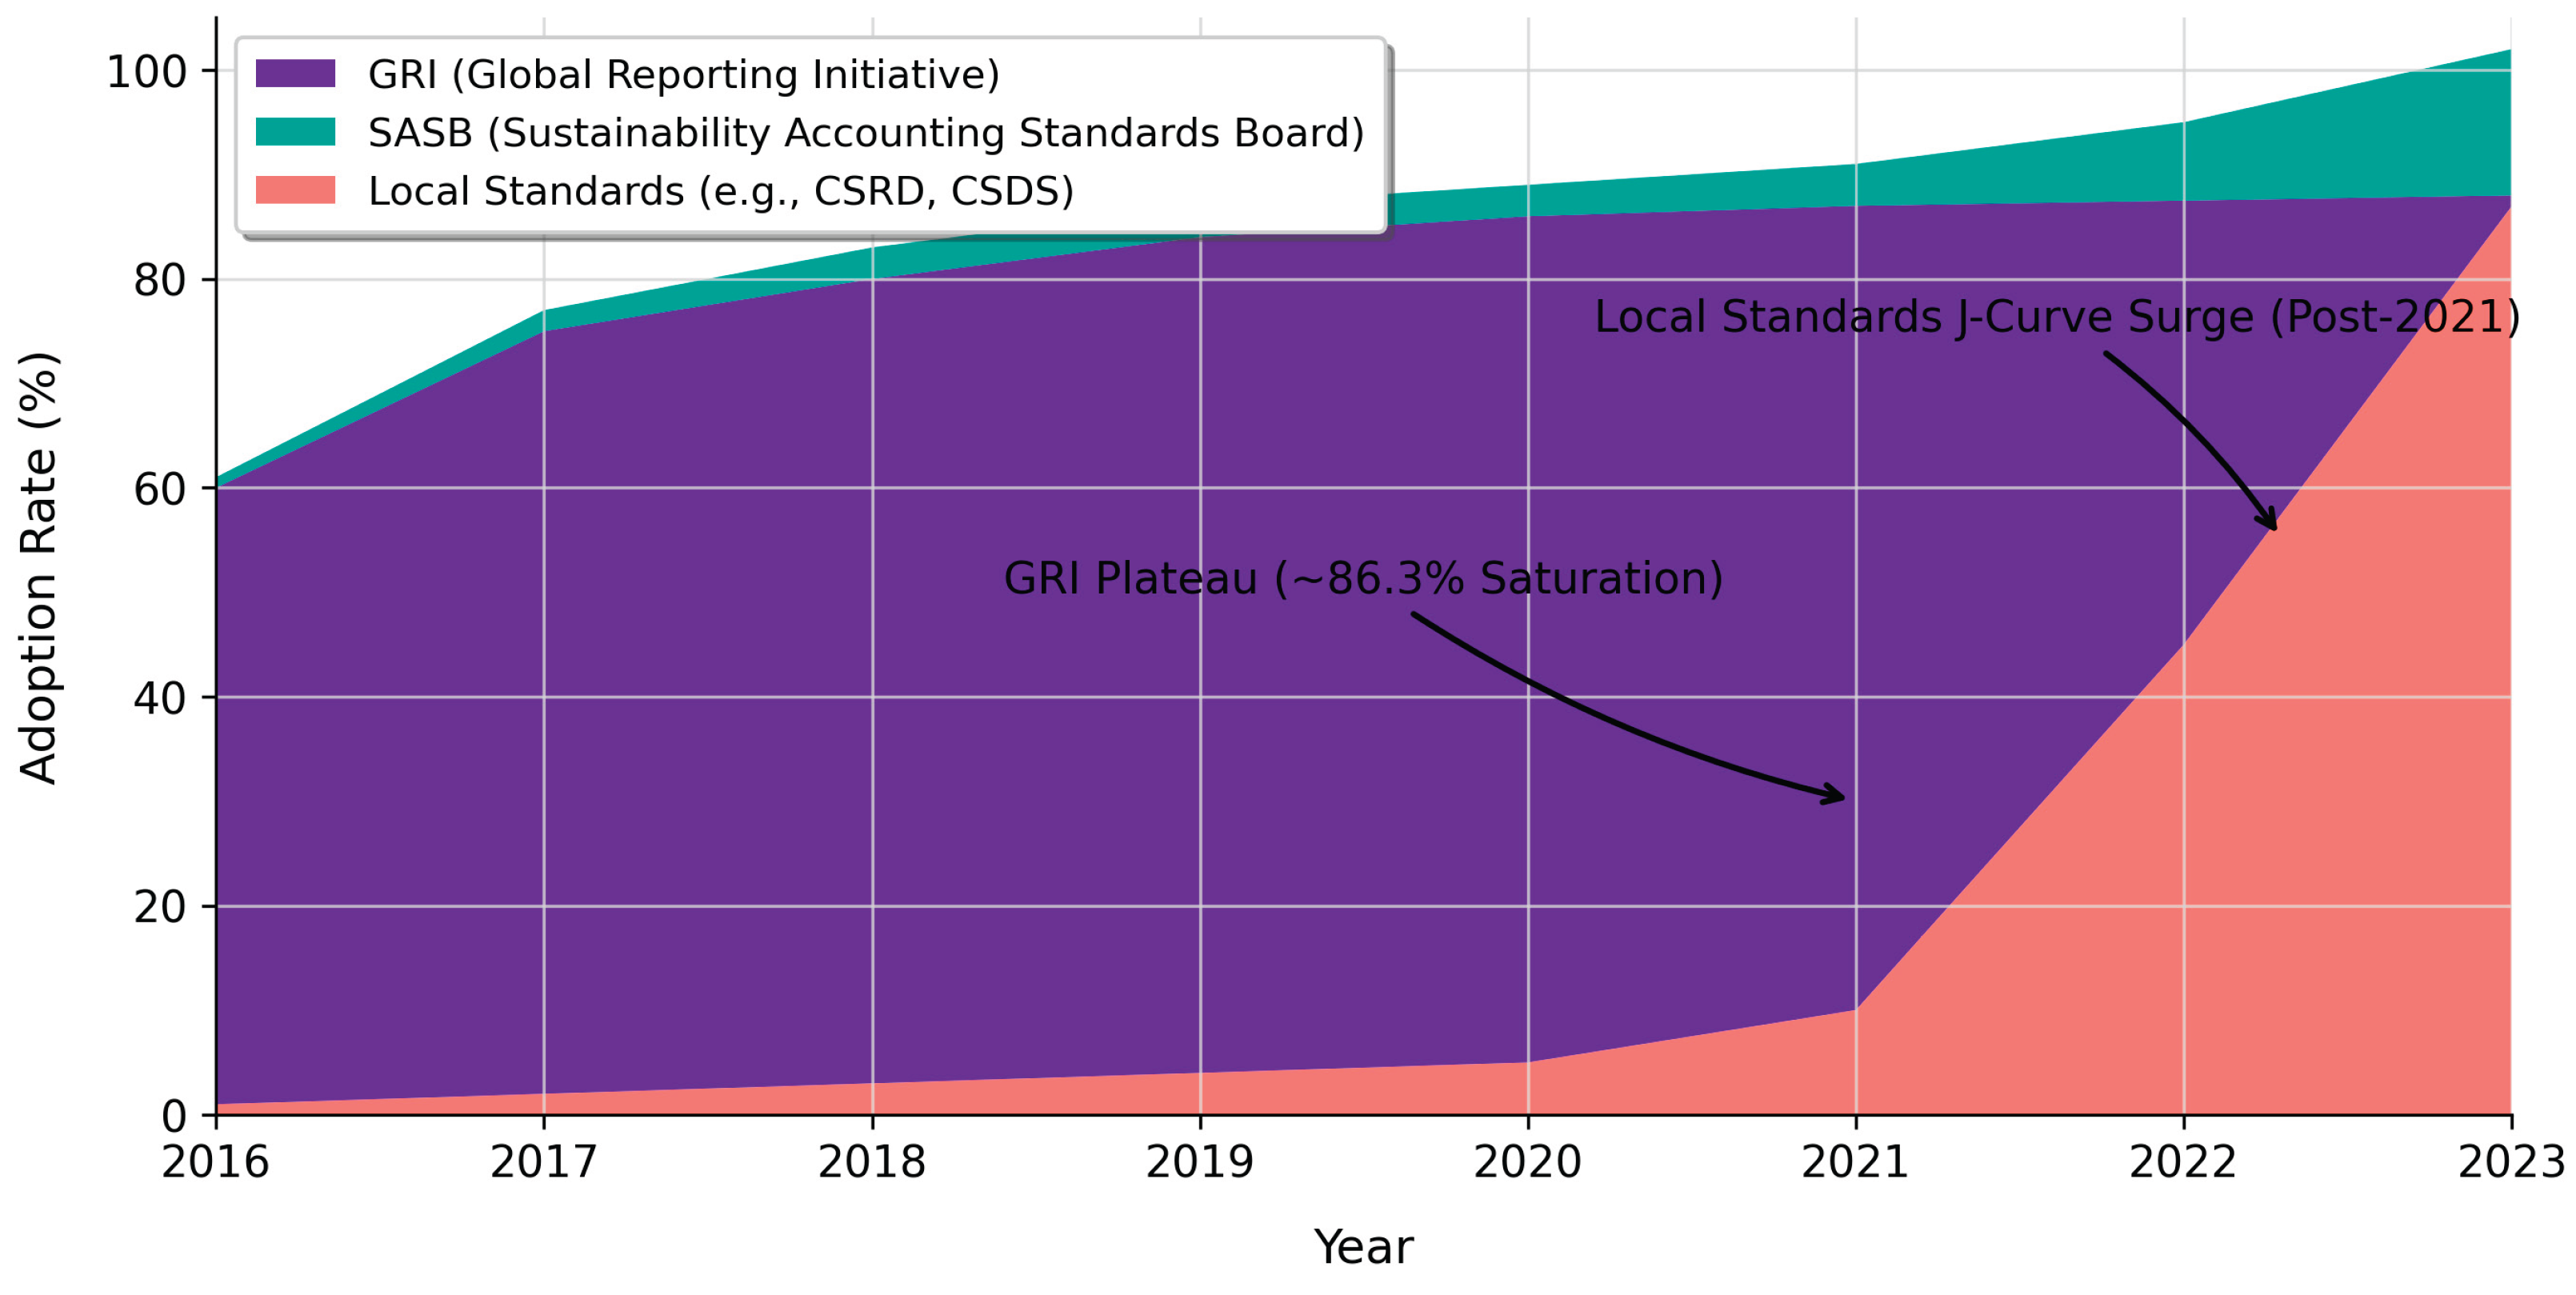
Figure 3.
Cumulative Abnormal Returns (CAR) around Regulatory Announcements. Note: The red line (A) tracks the market reaction for High-ESG Chinese firms following the April 2024 Guidelines release. The blue line (B) tracks Low-Readiness EU firms following the CSRD enforcement.
Figure 3.
Cumulative Abnormal Returns (CAR) around Regulatory Announcements. Note: The red line (A) tracks the market reaction for High-ESG Chinese firms following the April 2024 Guidelines release. The blue line (B) tracks Low-Readiness EU firms following the CSRD enforcement.
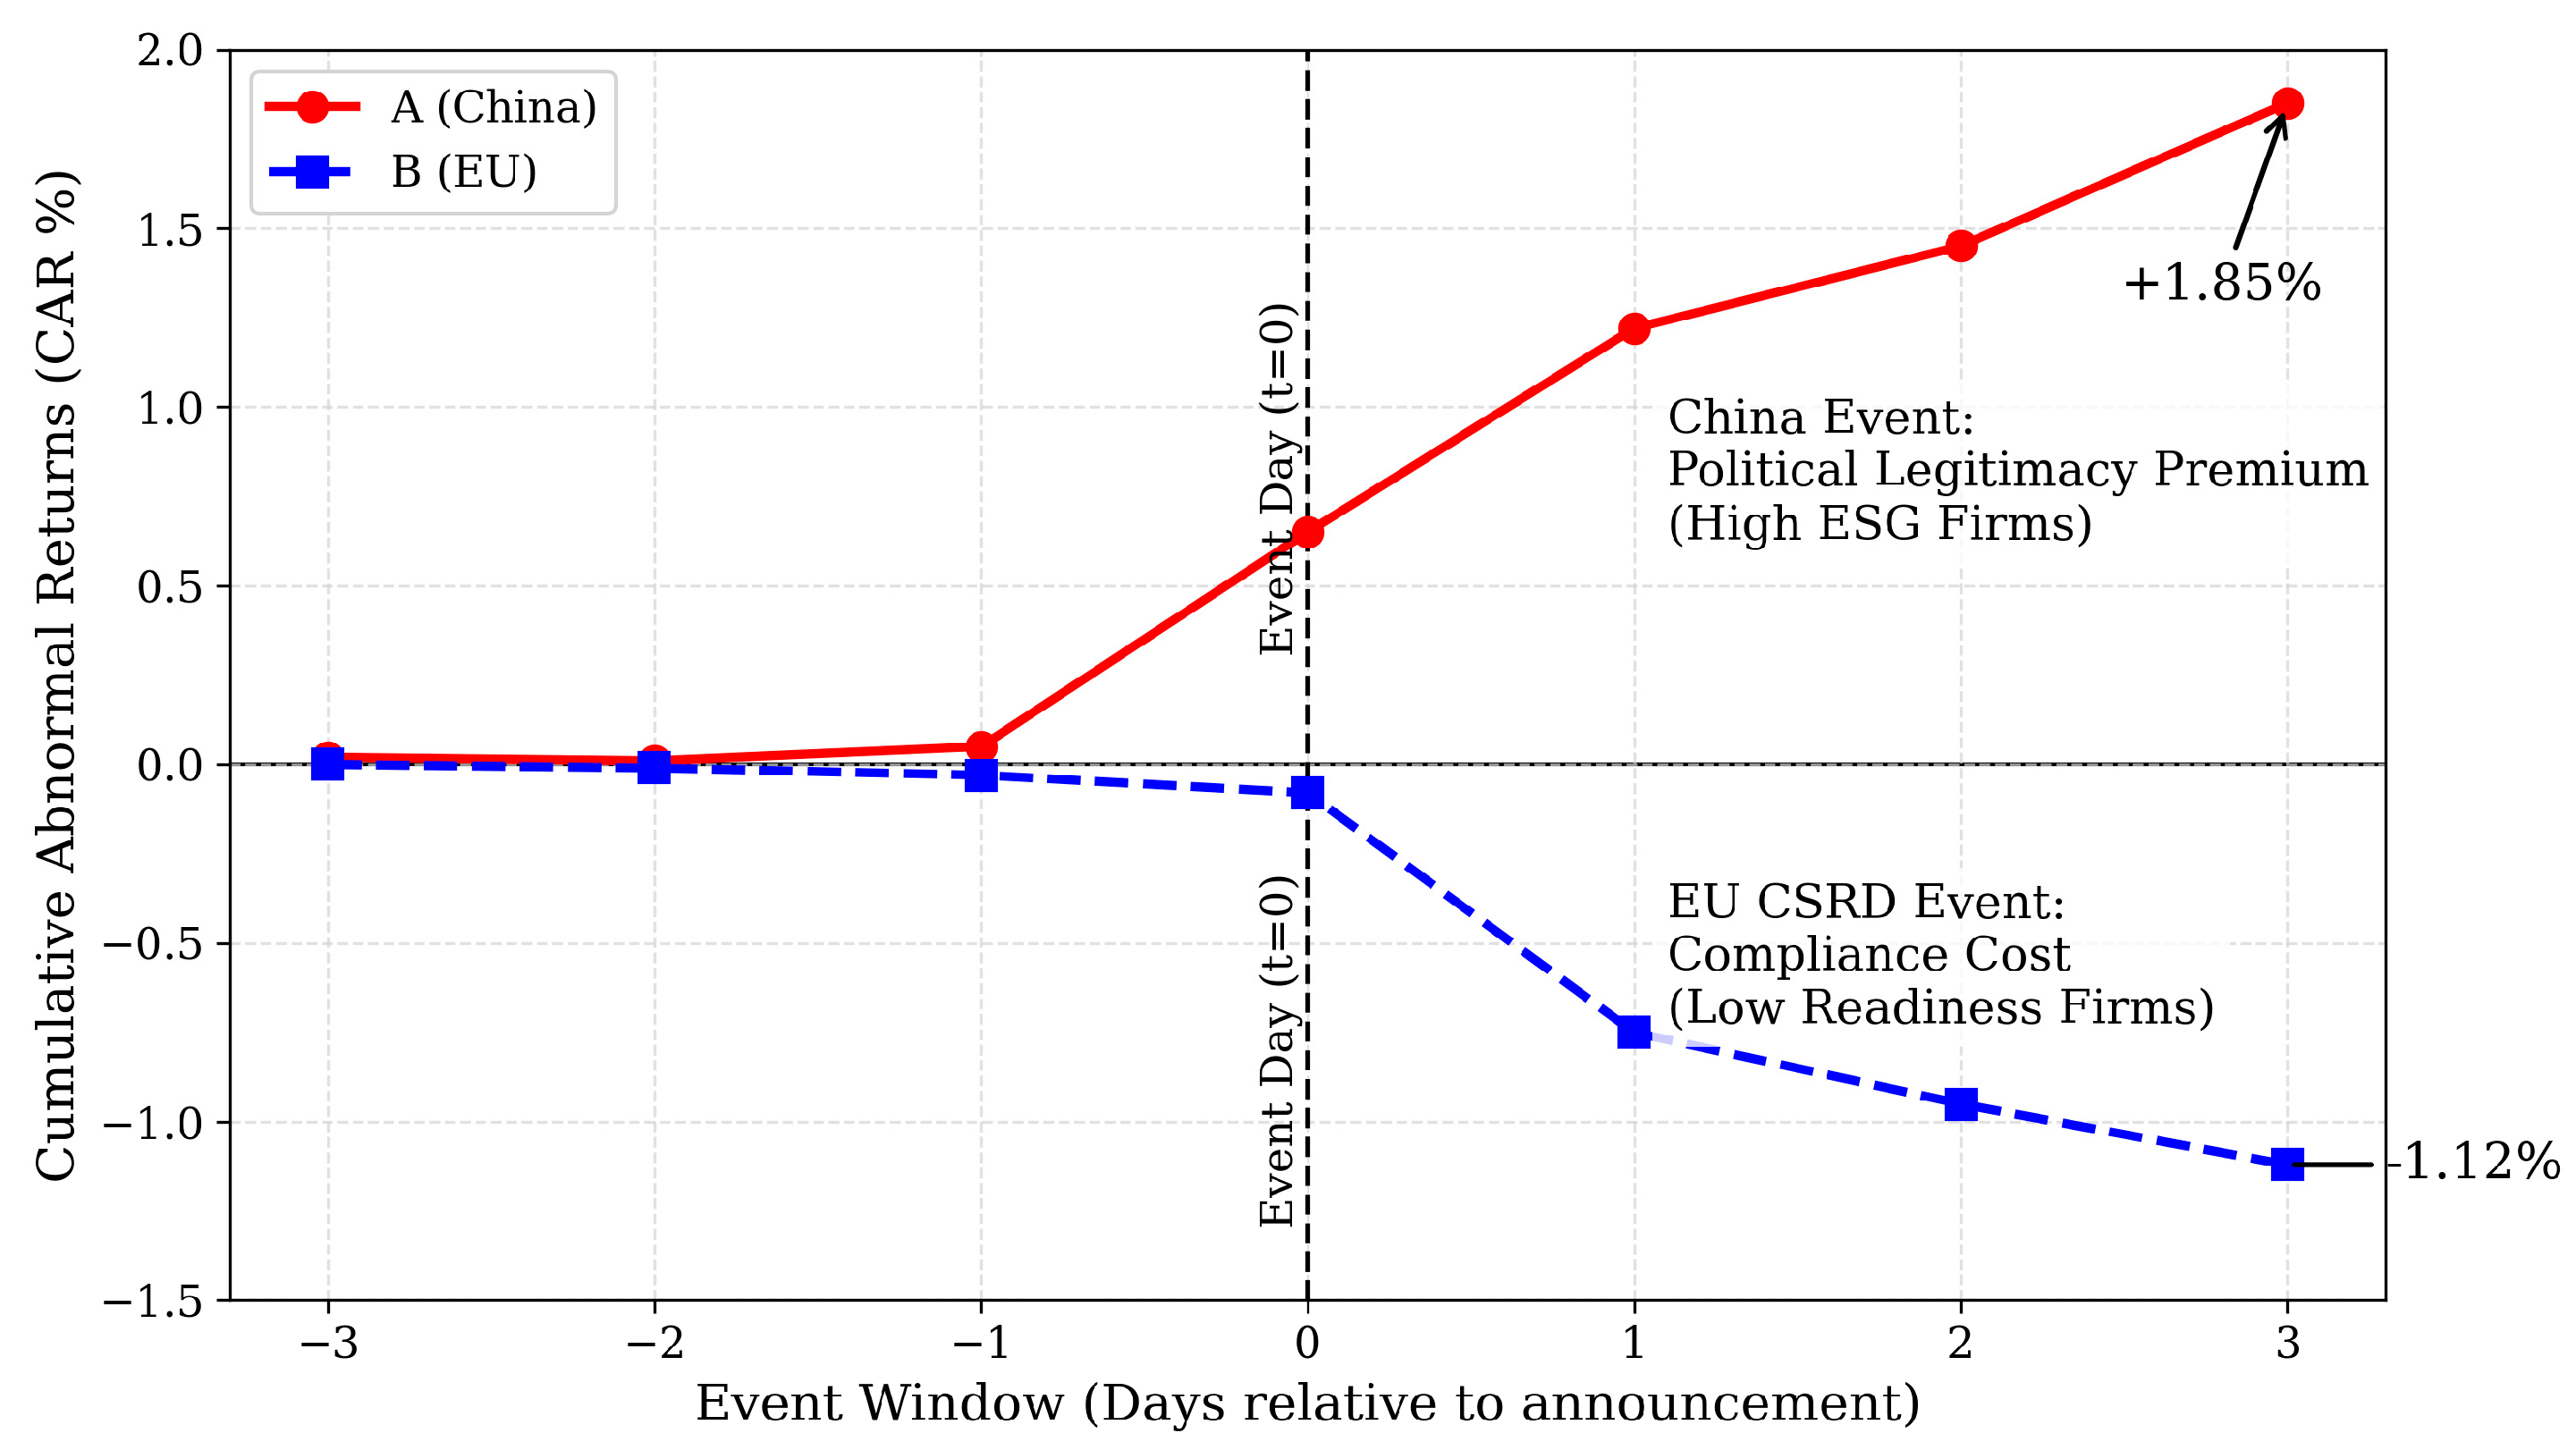
Figure 4.
Inverted U-shaped Curve plotting "Number of Standards" vs. "Tobin’s Q".
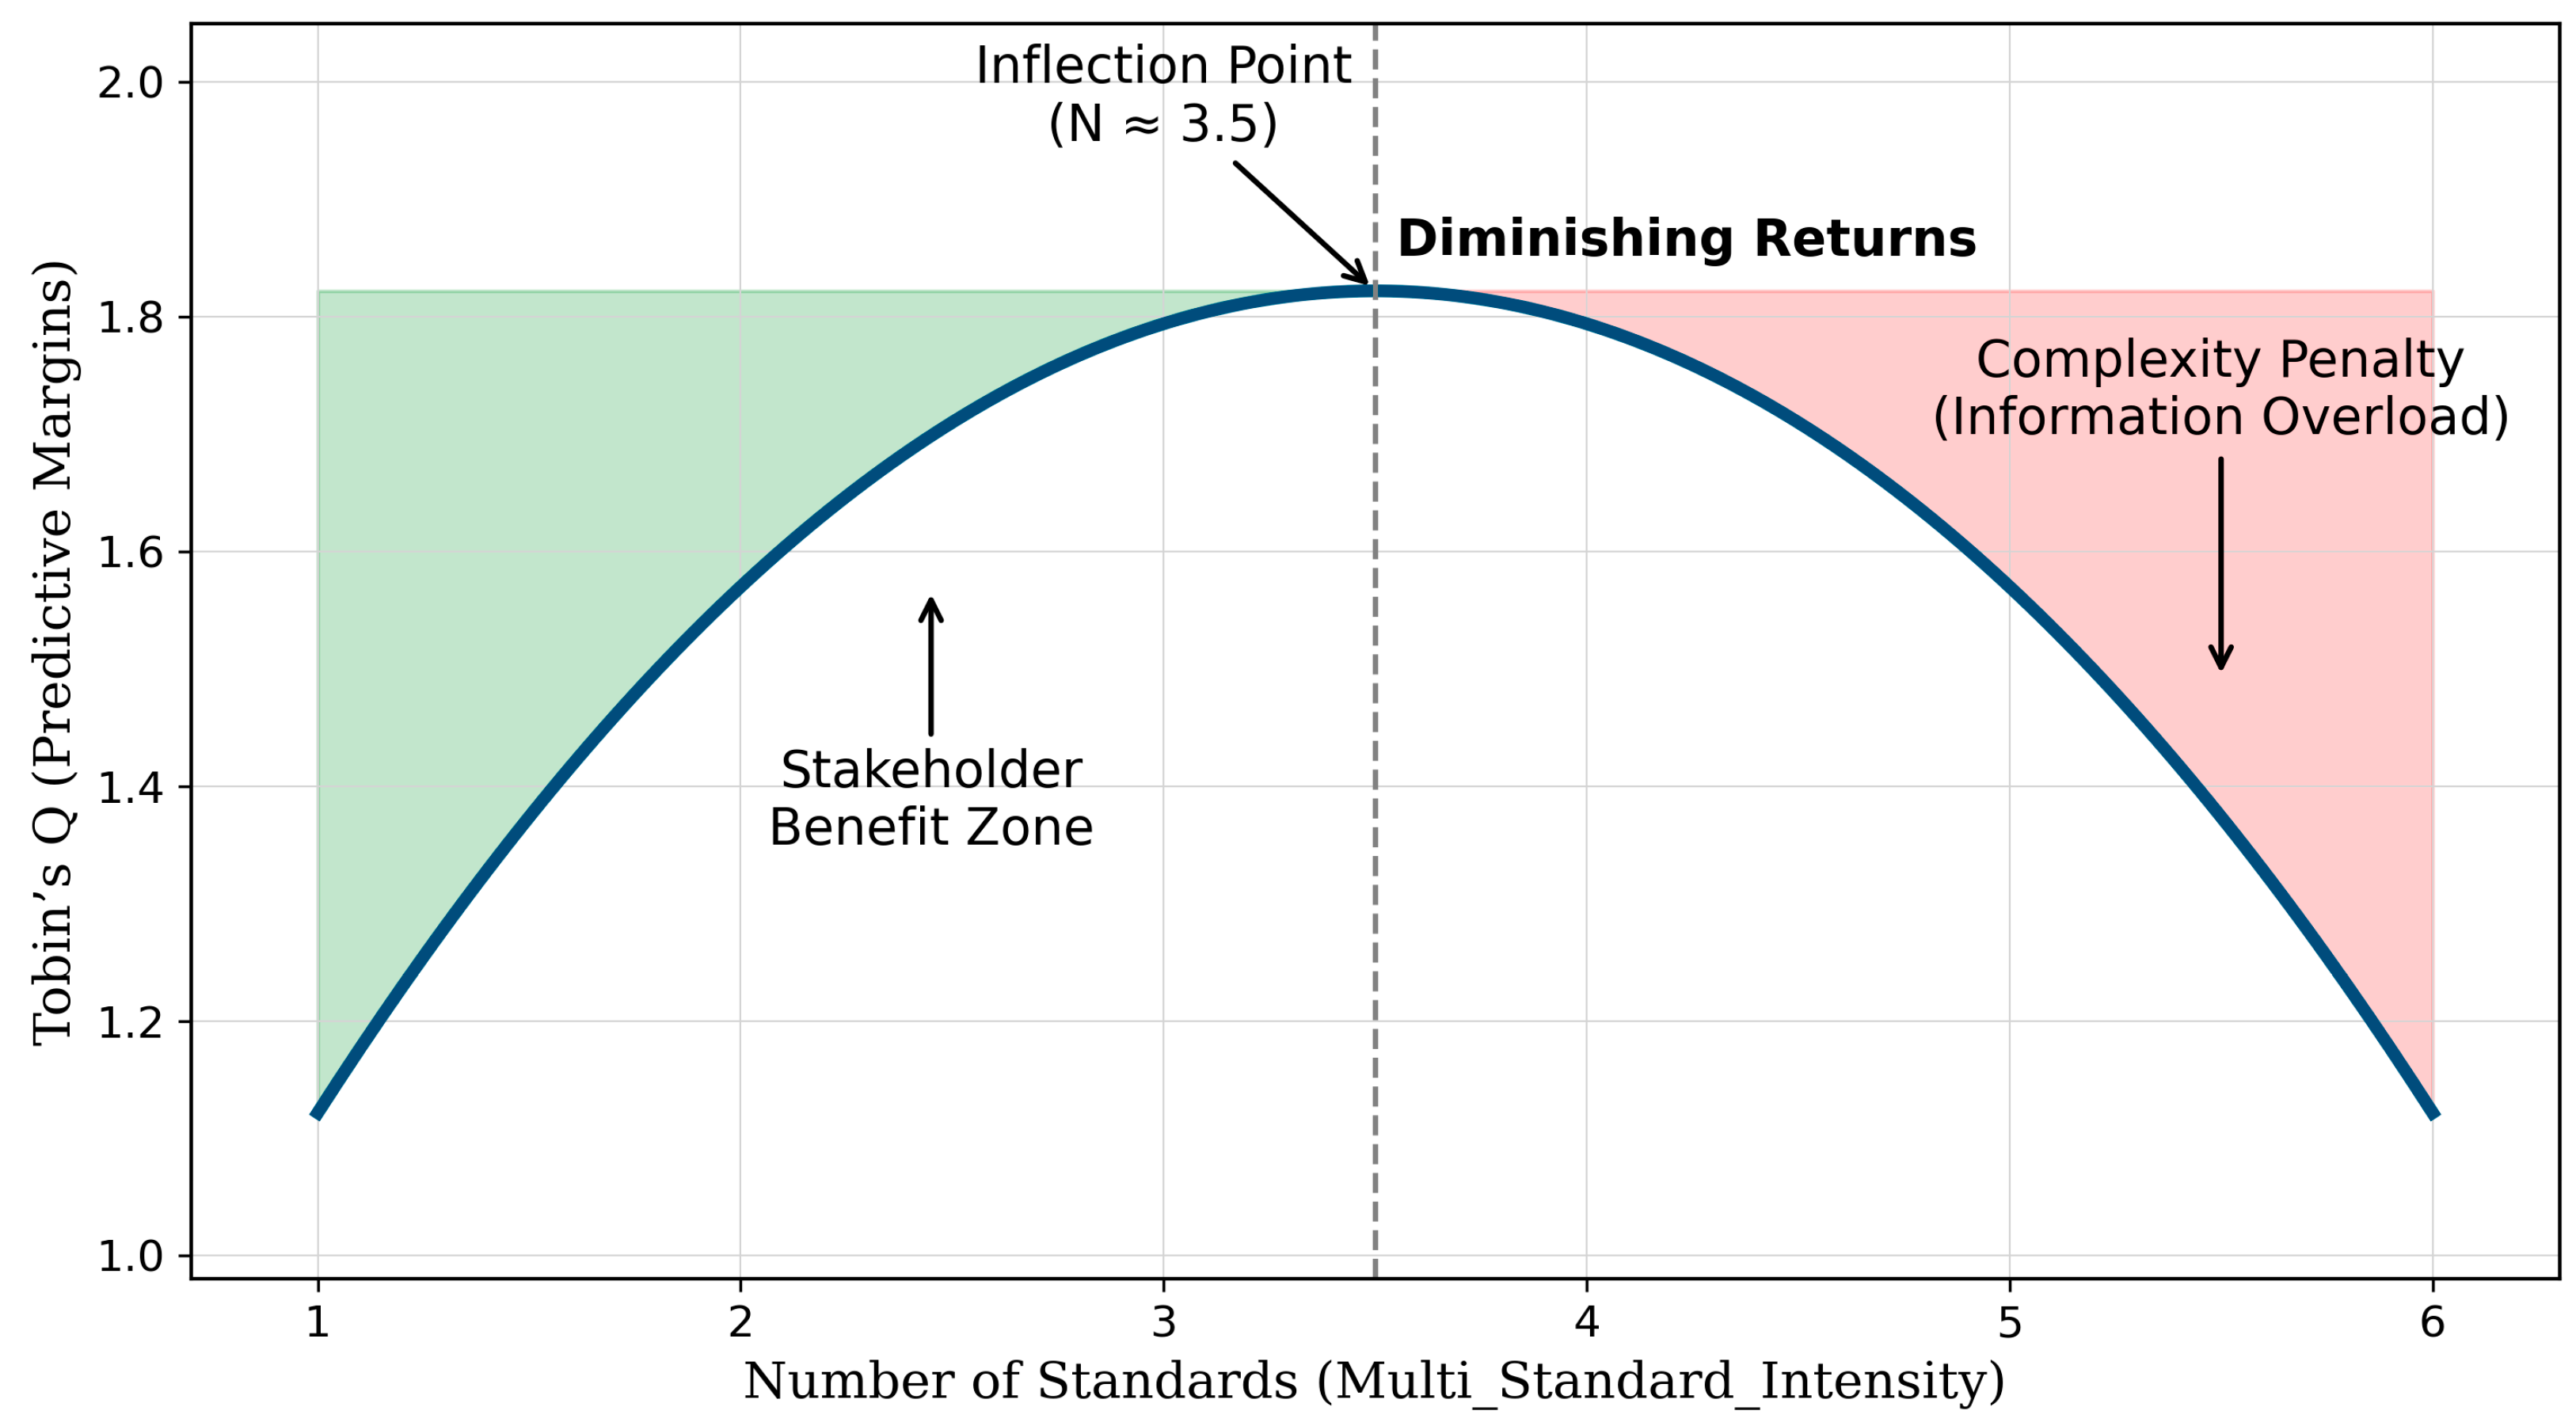

Table 1.
Variable Definitions and Sources.
| Variable Type | Variable Name | Definition & Measurement | Data Source |
| Dependent | Tobin’s Q | (Market Cap + Total Liabilities) / Total Assets. Proxy for market valuation. | Bloomberg |
| WACC | Weighted Average Cost of Capital (%). Proxy for financing costs. | Refinitiv | |
| ROA | Net Income / Total Assets (%). Proxy for operating efficiency. | Refinitiv | |
| Independent | Global_Std | Dummy: 1 if reporting follows GRI/SASB/ISSB; 0 otherwise. | Manual Coding |
| Local_Align | Dummy: 1 if reporting aligns with EU CSRD or China CSDS; 0 otherwise. | Manual Coding | |
| Multi_Intensity | Count of standards adopted (e.g., GRI+SASB+TCFD = 3). | Manual Coding | |
| Controls | Size | Natural logarithm of Total Assets. | Refinitiv |
| Lev | Total Debt / Total Equity. | Refinitiv | |
| Growth | Year-over-year revenue growth rate. | Refinitiv |
Table 2.
Descriptive Statistics.
| Variable | mean | std | min | 25% | median | 75% | max |
| ROA | 3.850 | 5.119 | -20.630 | 1.940 | 3.800 | 5.165 | 30.810 |
| ROE | 7.778 | 18.136 | -132.780 | 4.980 | 8.360 | 12.620 | 80.960 |
| TobinQ | 0.445 | 0.236 | 0.041 | 0.223 | 0.469 | 0.654 | 0.908 |
| WACC % | 6.961 | 2.381 | 2.114 | 5.579 | 6.653 | 7.924 | 17.947 |
| GRI_primary | 0.863 | 0.345 | 0.000 | 1.000 | 1.000 | 1.000 | 1.000 |
| SASB_primary | 0.325 | 0.470 | 0.000 | 0.000 | 0.000 | 1.000 | 1.000 |
| LocalAlign_EU | 0.396 | 0.490 | 0.000 | 0.000 | 0.000 | 1.000 | 1.000 |
| LocalAlign_CN | 0.112 | 0.316 | 0.000 | 0.000 | 0.000 | 0.000 | 1.000 |
| MultiStd_Intensity | 3.574 | 1.447 | 1.000 | 2.000 | 3.000 | 5.000 | 8.000 |
| Consistency_AllOps | 0.965 | 0.185 | 0.000 | 1.000 | 1.000 | 1.000 | 1.000 |
Notes: This table reports the descriptive statistics for the main variables used in the analysis. ROA and ROE are expressed in percentages. Tobin’s Q is calculated as (Market Value + Total Debt) / Total Assets. WACC is the weighted average cost of capital. Disclosure variables are dummy or count variables as defined in Section 3.3.
Table 3.
Fixed-Effects Regression Results for Tobin’s Q, WACC, and ROE.
| Variable | Tobin’s Q (Valuation) | Cost of Debt (Financing) | ROA (Profitability) |
| GRI_Adoption | 0.021 (0.45) | -0.012 (-0.89) | 0.135 (1.12) |
| ISSB_Align (SASB) | 0.085 (1.98)* | -0.045 (-2.10)** | -0.104 (-0.65) |
| LocalAlign_EU | 0.043 (1.20) | -0.022 (-1.10) | 0.261 (2.35)** |
| LocalAlign_CN | 0.012 (0.30) | 0.005 (0.15) | 0.050 (0.40) |
| Controls | Yes | Yes | Yes |
| Fixed Effects | Firm/Year | Firm/Year | Firm/Year |
| Obs | 185 | 185 | 185 |
*Note: T-statistics in parentheses. *, *, *** indicate significance at 10%, 5%, 1%.
Table 4.
Cumulative Abnormal Returns (CAR) around Regulatory Events.
| Event | Sample Sub-group | CAR (%) | T-statistic | Interpretation |
| China Guidelines (Apr 2024) | High ESG Performers | +1.85% | 2.89*** | Signalling quality in a state-led market. |
| Low ESG Performers | -0.45% | -0.85 | No significant penalty yet. | |
| CSRD Implementation (Jan 2024) | High Readiness Firms | +0.30% | 0.65 | Muted reaction (anticipated). |
| Low Readiness Firms | -1.12% | -2.15** | Pricing of compliance costs/risk. |
(Note: Please insert the table showing China Shock +1.85% vs. CSRD Shock -1.12%).
Disclaimer/Publisher’s Note: The statements, opinions and data contained in all publications are solely those of the individual author(s) and contributor(s) and not of MDPI and/or the editor(s). MDPI and/or the editor(s) disclaim responsibility for any injury to people or property resulting from any ideas, methods, instructions or products referred to in the content. |
© 2025 by the authors. Licensee MDPI, Basel, Switzerland. This article is an open access article distributed under the terms and conditions of the Creative Commons Attribution (CC BY) license (http://creativecommons.org/licenses/by/4.0/).
Copyright: This open access article is published under a Creative Commons CC BY 4.0 license, which permit the free download, distribution, and reuse, provided that the author and preprint are cited in any reuse.


