1. Introduction
Alzheimer's disease (AD) has long been one of the primary therapeutic targets for neurodegenerative diseases. It accounts for approximately 50-70% of neurodegenerative dementia cases, and statistics indicate that approximately 44 million people worldwide live with dementia. This number could triple by 2050 due to population aging [
1]. Effective treatment for AD has not yet been developed. The most significant limitation is the inability to reverse the progressive disease; however, its progression can be slowed. Symptoms often begin to manifest only several years after disease onset [
2]. Neurological pathology in Alzheimer's disease involves the aggregation of beta-amyloid plaques and tau tangles, which begin in the brainstem and entorhinal cortex in the early stages and progress to the medial temporal lobe, ultimately affecting the neocortex [
3,
4].
AD diagnosis is based on imaging tests such as positron emission tomography (PET) or magnetic resonance imaging (MRI) [
5]. Molecular biomarkers, such as amyloid beta (1-42) or phosphorylated forms of tau protein, are also tested; however, this requires the collection of cerebrospinal fluid (CSF), which is an invasive and burdensome procedure for the patient [
6]. Therefore, blood biomarkers are currently a highly sought-after diagnostic tool, as they greatly facilitate the prognosis of Alzheimer's disease in clinical practice [
7]. As previously mentioned, the tau protein and its forms are worthy of attention.
Tau is a microtubule-associated protein involved in growth and axonal transport, neuronal polarization, and overall neuronal function in brain tissue. It is located primarily in neurons but also occurs in astrocytes [
8]. In pathological conditions, tau protein phosphorylation occurs, rendering it incapable of binding to microtubules. Phosphorylated forms (e.g., ptau-181) aggregate, forming paired helical filaments (PHF) and neurofibrillary tangles (NFT) [
8]. In clinical studies and reviews, plasma ptau-181 levels are typically higher in individuals with AD than in healthy individuals or patients with other neurodegenerative diseases. Ptau-181 levels correlate with the presence of amyloid-beta deposits, as well as with tau from PET scans and ptau-181 levels in cerebrospinal fluid. This makes ptau-181 one of the most important biomarkers of AD [
9]. Total tau protein in CSF has traditionally been considered a marker of neuronal damage, i.e., neurodegeneration. Elevated levels are associated with Alzheimer's disease, although they are not specific to AD [
10]. However, a growing body of evidence suggests that tau protein levels in CSF are linearly related to the severity of disease symptoms [
11,
12]. Considering the measurement of tau protein I, ptau-181, is a well-established standard for diagnosing Alzheimer's disease in cerebrospinal fluid (CSF), along with amyloid beta-42 [
5]. In recent years, CSF biomarkers for Alzheimer's disease have been validated. A protocol for the collection, storage, and preparation of CSF samples has been introduced. Certified reference methods and standardized measurements already exist for amyloid beta-42. Standardization efforts are ongoing for ptau-181 and total tau; however, the introduction of fully automated immunochemical assays improves the repeatability and precision of measurements, which are crucial for routine diagnostics [
5]. The best source of Alzheimer's disease biomarkers is cerebrospinal fluid (CSF), as it has direct contact with the extracellular space of the brain. Therefore, all biochemical changes have a direct impact on CSF [
13]. However, the procedure for measuring this biological material is invasive and requires a lumbar puncture, which is associated with side effects such as nausea, headaches, backache, and general fatigue. Therefore, searching for biomarkers in peripheral blood is most advantageous due to the minimally invasive nature of the collection procedure, as well as its ease and low cost [
14]. Therefore, blood plasma is one of the most frequently selected biological materials for assays when testing the suitability of biosensors. Their use is crucial in the fields of diagnostics, drug identification, biomedicine, food safety, and ecological research.
Biosensors are devices that convert biochemical interactions into a measurable analytical signal. The basic components of a biosensor are a receptor layer, a transducer, and a detector. A wide range of electrochemical, optical, thermal, and piezoelectric methods can be used as detection methods [
15]. A biosensor for the simultaneous determination of total tau and ptau-181 has been described in the literature. This is a portable electrochemical system based on nano-Au modified with vertical graphene (VG@Au) [
16]. This modified surface features a high density of active sites for antibody immobilization and exhibits excellent electrical conductivity. The entire electrode surface is designed as a "superwettable microwell", a structure that allows a sample droplet (e.g., serum) to remain stable and prevent it from spilling. This allows for work with volumes of several microliters, making it ideal for analyses with limited sample volumes. Antibodies specific for total tau and ptau-181 were used as the recognition element, and the surfaces were blocked with BSA to minimize nonspecific adsorption. The sensor utilizes differential pulse voltammetry (DPV) detection, and the authors indicate that the detection time is shorter than in conventional immunoassays. The sensor operates in the range of 0.1–1000 pg/mL for both proteins. Therefore, it is a rapid, sensitive, and low-cost alternative to conventional immunoassays (ELISA, SIMOA) used in the diagnosis of Alzheimer's disease. However, the method has certain limitations – the VG@Au surface is difficult to mass-produce without nanotechnological infrastructure. Despite its high sensitivity, matrix calibration is necessary in real-world assays [
16].
In another study, in addition to total tau and ptau-181, amyloid beta (1-40) and amyloid beta (1-42) were also examined. The goal was to develop a single sensor platform that would enable rapid, simultaneous, and sensitive detection of these four key AD biomarkers [
17]. The biosensor is constructed from a silicon substrate (Si/SiO
2) with nanofabricated sensing channels. The active layer consists of parallel-arranged single carbon nanotubes (CNTs), which form a conductive network. Each channel contains a specific antibody to one of the four compounds being assayed. After introducing a plasma sample, the target proteins bind to the corresponding antibodies. This binding changes the local charge density in the presence of the nanotubes, resulting in a measurable change in resistance. The shift in ΔI/I
0 current is proportional to the analyte concentration. The sensor exhibits a wide dynamic range, spanning from 10 fM to 1 nM, and achieves low detection limits of the order of fM. This is undoubtedly an innovative, multiplex sensor that does not require sample dilution or labeling, and the authors mention a detection time of less than 30 minutes. It also allows for assays in biological material such as plasma. However, the limitation of this method is the complexity of surface functionalization – the preparation and stabilization of nanotubes require specialized nanolithography devices, which also translate into expensive production. As a result, it is not yet a technology that can be easily implemented in routine clinical tests [
17].
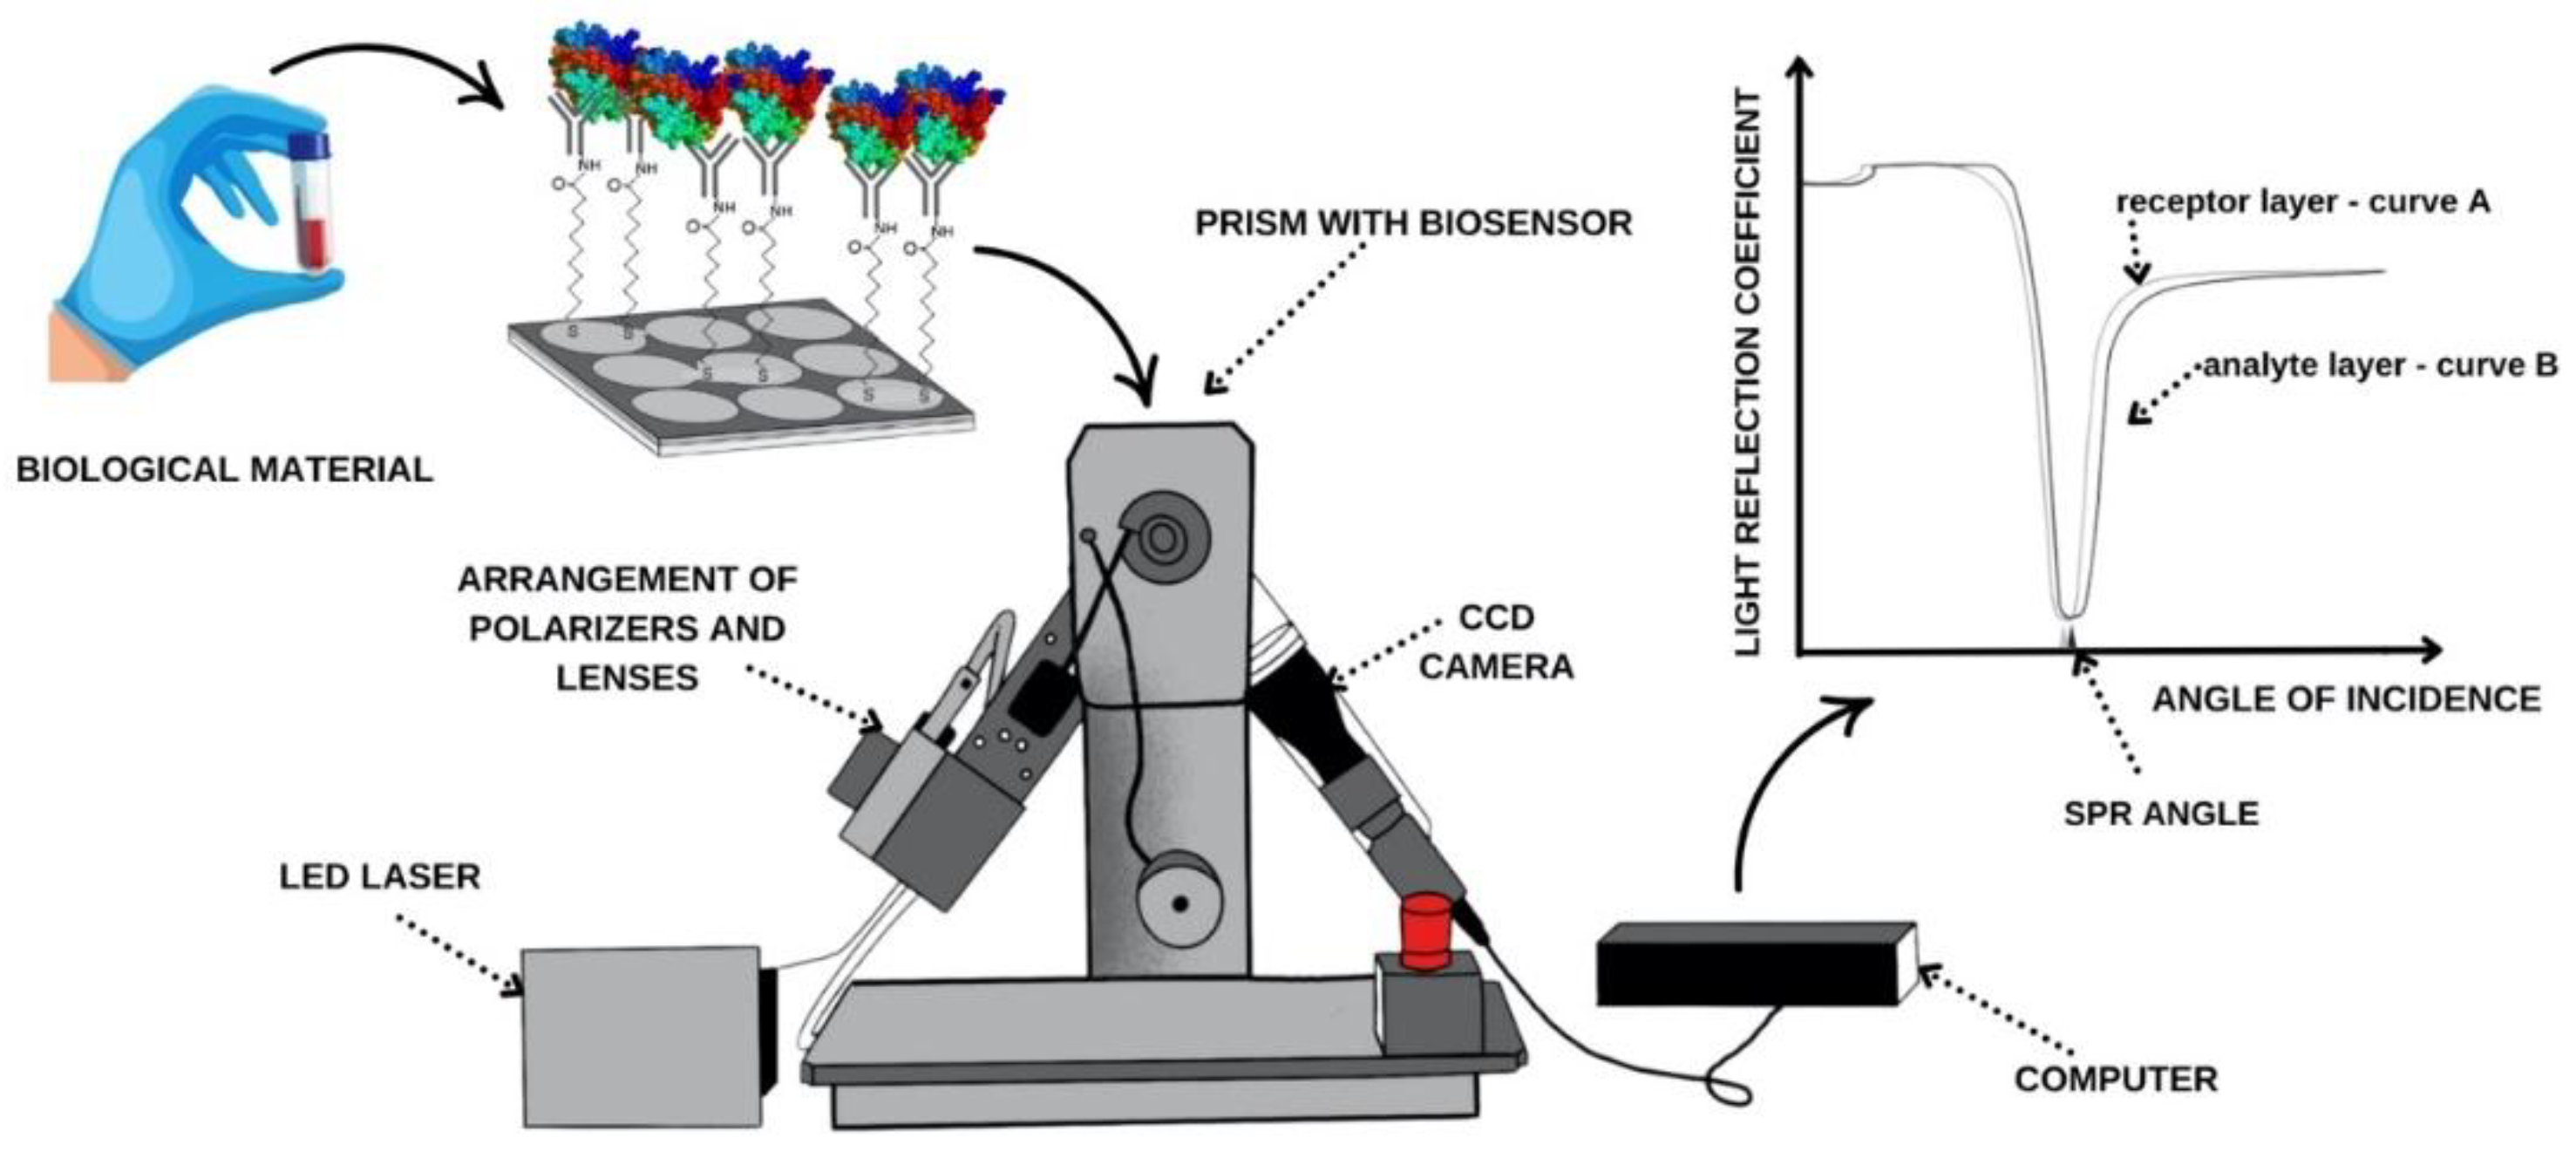
In this paper, we propose the use of optical biosensors – SPRi biosensors – to simultaneously determine total tau and ptau-181 in the blood plasma of AD patients and controls. Surface Plasmon Resonance Imaging (SPRi) is a method that utilizes plasmons, i.e., surface oscillating charges at a metal-dielectric interface, excited by light. At a specific angle of incidence, known as the SPR angle, and a suitable wavelength, plasmon excitation and reduced reflection are observed. The metal-dielectric interface is susceptible to changes in the refractive index of the dielectric. SPR measures mass changes at this interface, allowing the method to be used as a label-free method for studying molecular bonds [
18]. The most commonly used experimental setup for SPR is the Kretschmann setup, where a thin layer of metal, typically gold (approximately 50 nm), is placed on a glass prism and illuminated by a light beam at a variable angle. When the phase condition is met, energy is transferred to the plasmon, resulting in minimal reflection. Changing conditions, such as immobilizing another layer on the surface, shift the minimum angle, which is the detection signal used [
19]. SPRi (imaging version) is an extension of SPR in which a spatial image of the reflected light is measured using a CCD camera. This enables us to observe multiple locations simultaneously in real-time [
20].
2. Materials and Methods
2.1. Subsection
The following reagents were also used for the tests: thiol 11-mercaptoundecanoic acid (SIGMA, Steinheim, Germany), EDC (N-ethyl-N′-(3-dimethylaminopropyl)carbodiimide hydrochloride) (SIGMA, Steinheim, Germany), NHS N-hydroxysuccinimide (Aldrich, Munich, Germany), buffered saline solution (PBS buffer) (Biomed, Lublin, Poland), absolute ethyl alcohol (POCh, Gliwice, Poland), and ethanolamine solution (SIGMA, Steinheim, Germany), recombinant human (phospho)-181 Tau protein (Abcam, Cambridge, UK), monoclonal rabbit antibody specific to ptau-181 protein (Abcam, Cambridge, UK), recombinant human Tau protein (R&D Systems, Minneapolis, MN, USA), polyclonal goat antibody specific to total Tau protein (R&D Systems, Minneapolis, MN, USA). The biosensor was constructed on a base consisting of plates with a gold layer (Ssens, Enschede, The Netherlands).
2.2. Biological Material
The biological material consisted of 17 plasma samples from patients diagnosed with Alzheimer’s disease, without comorbidities. Alzheimer's disease was confirmed in these patients. The relevant Bioethics Committee of the Medical University of Bialystok approved the study using this material (approval no. APK.002.596.2024, 20 March 2025). Additionally, 18 plasma control samples were used from patients who were not affected by Alzheimer’s disease but were smokers. Healthy smokers are a good control group because they can control the effect of smoking as a strong confounding factor on oxidative stress and cerebral hypoxia. The samples came from the Biobank of the Medical University of Bialystok, and consent to conduct the study was obtained from the relevant bioethics committee (approval R-I-002/600/2019, 19 December 2019).
2.3. SPRi Device and Measurement Methodology
The SPRi apparatus located in the Bioanalysis Laboratory, Faculty of Chemistry, University of Bialystok, was used for this study. Its components are shown in
Figure 1.
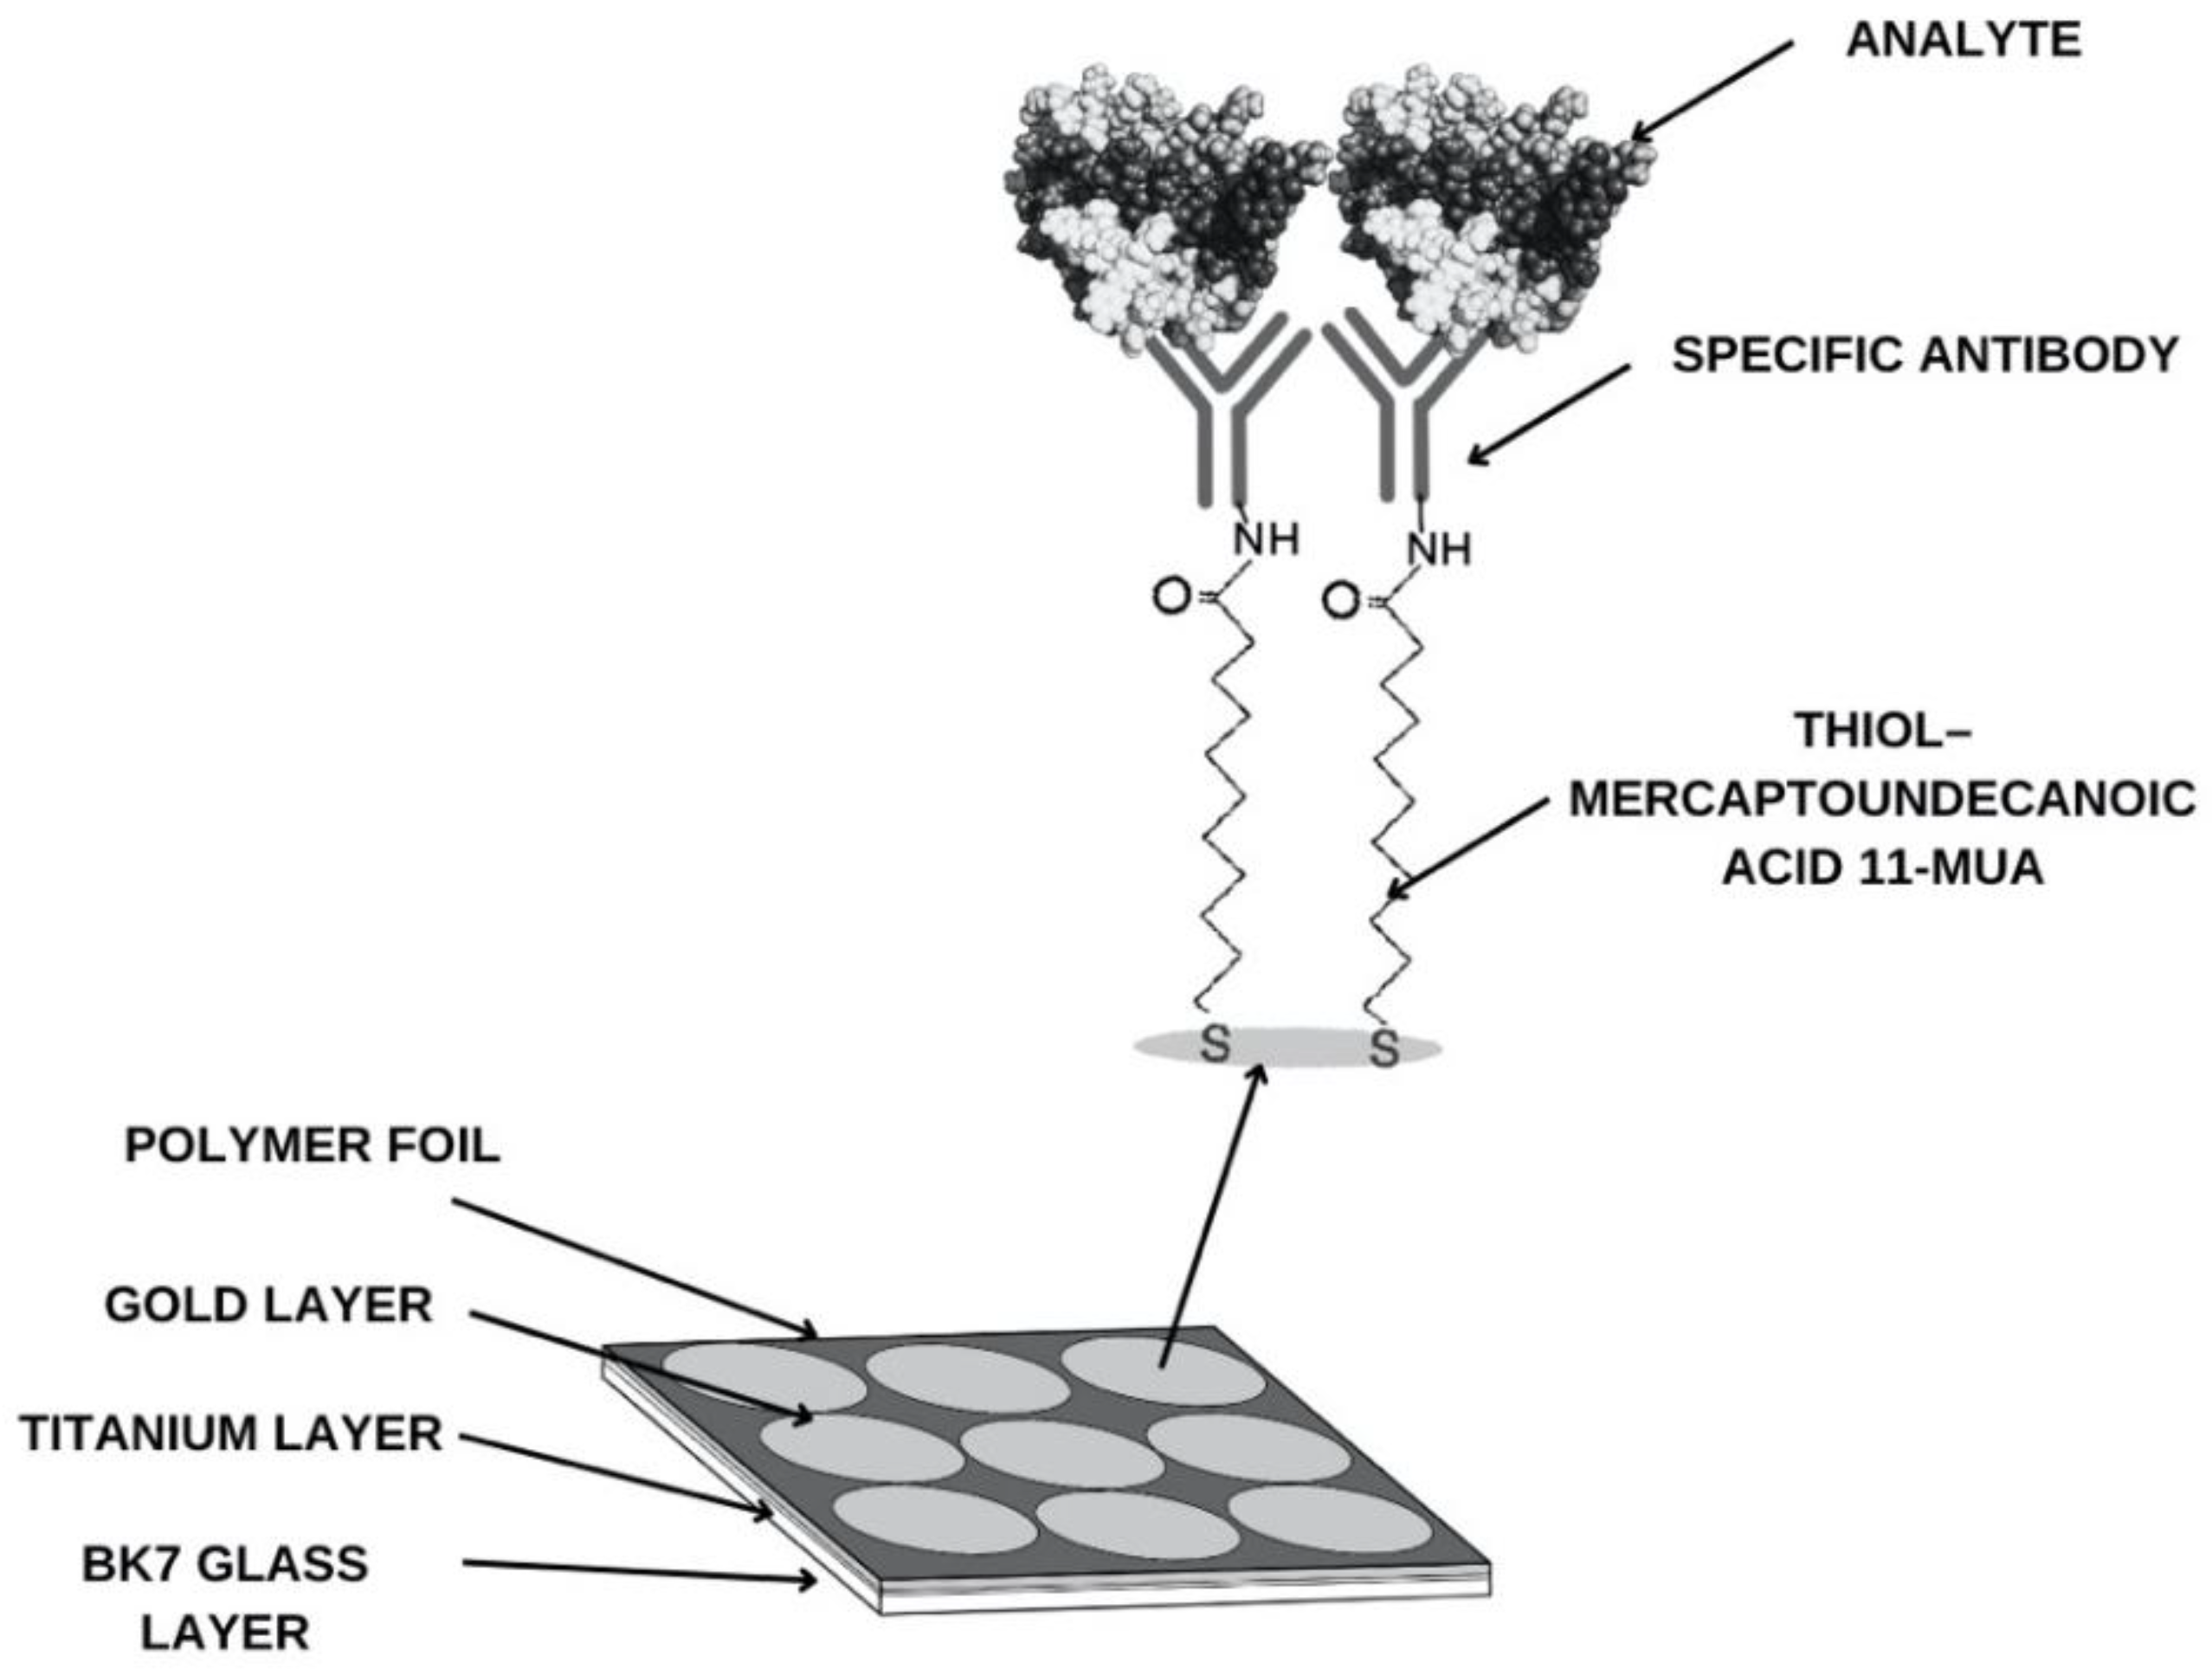
Measurement chips—BK7 glass plates with a sputtered titanium and gold layer—are also used for research. The sensor's base structure is shown in
Figure 2. According to the procedure, to determine the compound being tested in biological material and capture it from the sample, it is necessary to create a suitable receptor layer. To do this, the chip is immersed in an alcoholic thiol solution for approximately 24 hours. The chip is then washed with water and absolute alcohol, dried in an argon stream, and a polymer foil is applied to isolate the measurement sites. The next step involves creating the appropriate groups for antibody attachment. This is accomplished using EDC/NHS coupling chemistry. A mixture of EDC (0.4 M) and NHS (0.1 M) solutions is applied to the measurement sites for approximately 10 minutes. EDC converts the carboxyl group of the thiol into an ester group. NHS forms an active, short-lived NHS ester. After aspirating the excess solution, the appropriate concentration of antibody is applied. Over the next 10 minutes, a covalent amide bond forms between the antibody's amino groups. After aspirating the excess antibody, ethanolamine is used in the next step to prevent nonspecific adsorption. After another 10 minutes and aspirating the solution, the active sites are washed twice with PBS buffer.
According to the measurement procedure diagram (
Figure 1.), after generating the receptor layer, the chip is placed on the prism of the SPRi device using immersion oil. The device's movable arms allow for selecting the appropriate SPR angle, and measurements are taken at a wavelength of 635 nm. Data is acquired for the receptor. The sample is then placed on the measurement site of the gold plate. After 10 minutes, the sample is rinsed with PBS buffer, and excess solution is aspirated. Another data acquisition is then performed, this time for the analyte layer. The analytical signal is the difference in the intensity of the reflected light before and after interaction with the analyte. As shown in the curve in
Figure 1, when the receptor layer (curve A) adsorbs the next layer of molecules, i.e., the analyte layer (curve B), the reflection curve shifts toward higher angles relative to the preceding layer. This shift is crucial for obtaining quantitative results, including the concentration of the relevant compounds.
3. Experimental
3.1. Confirmation of Layer Formation on the Sensor Surface
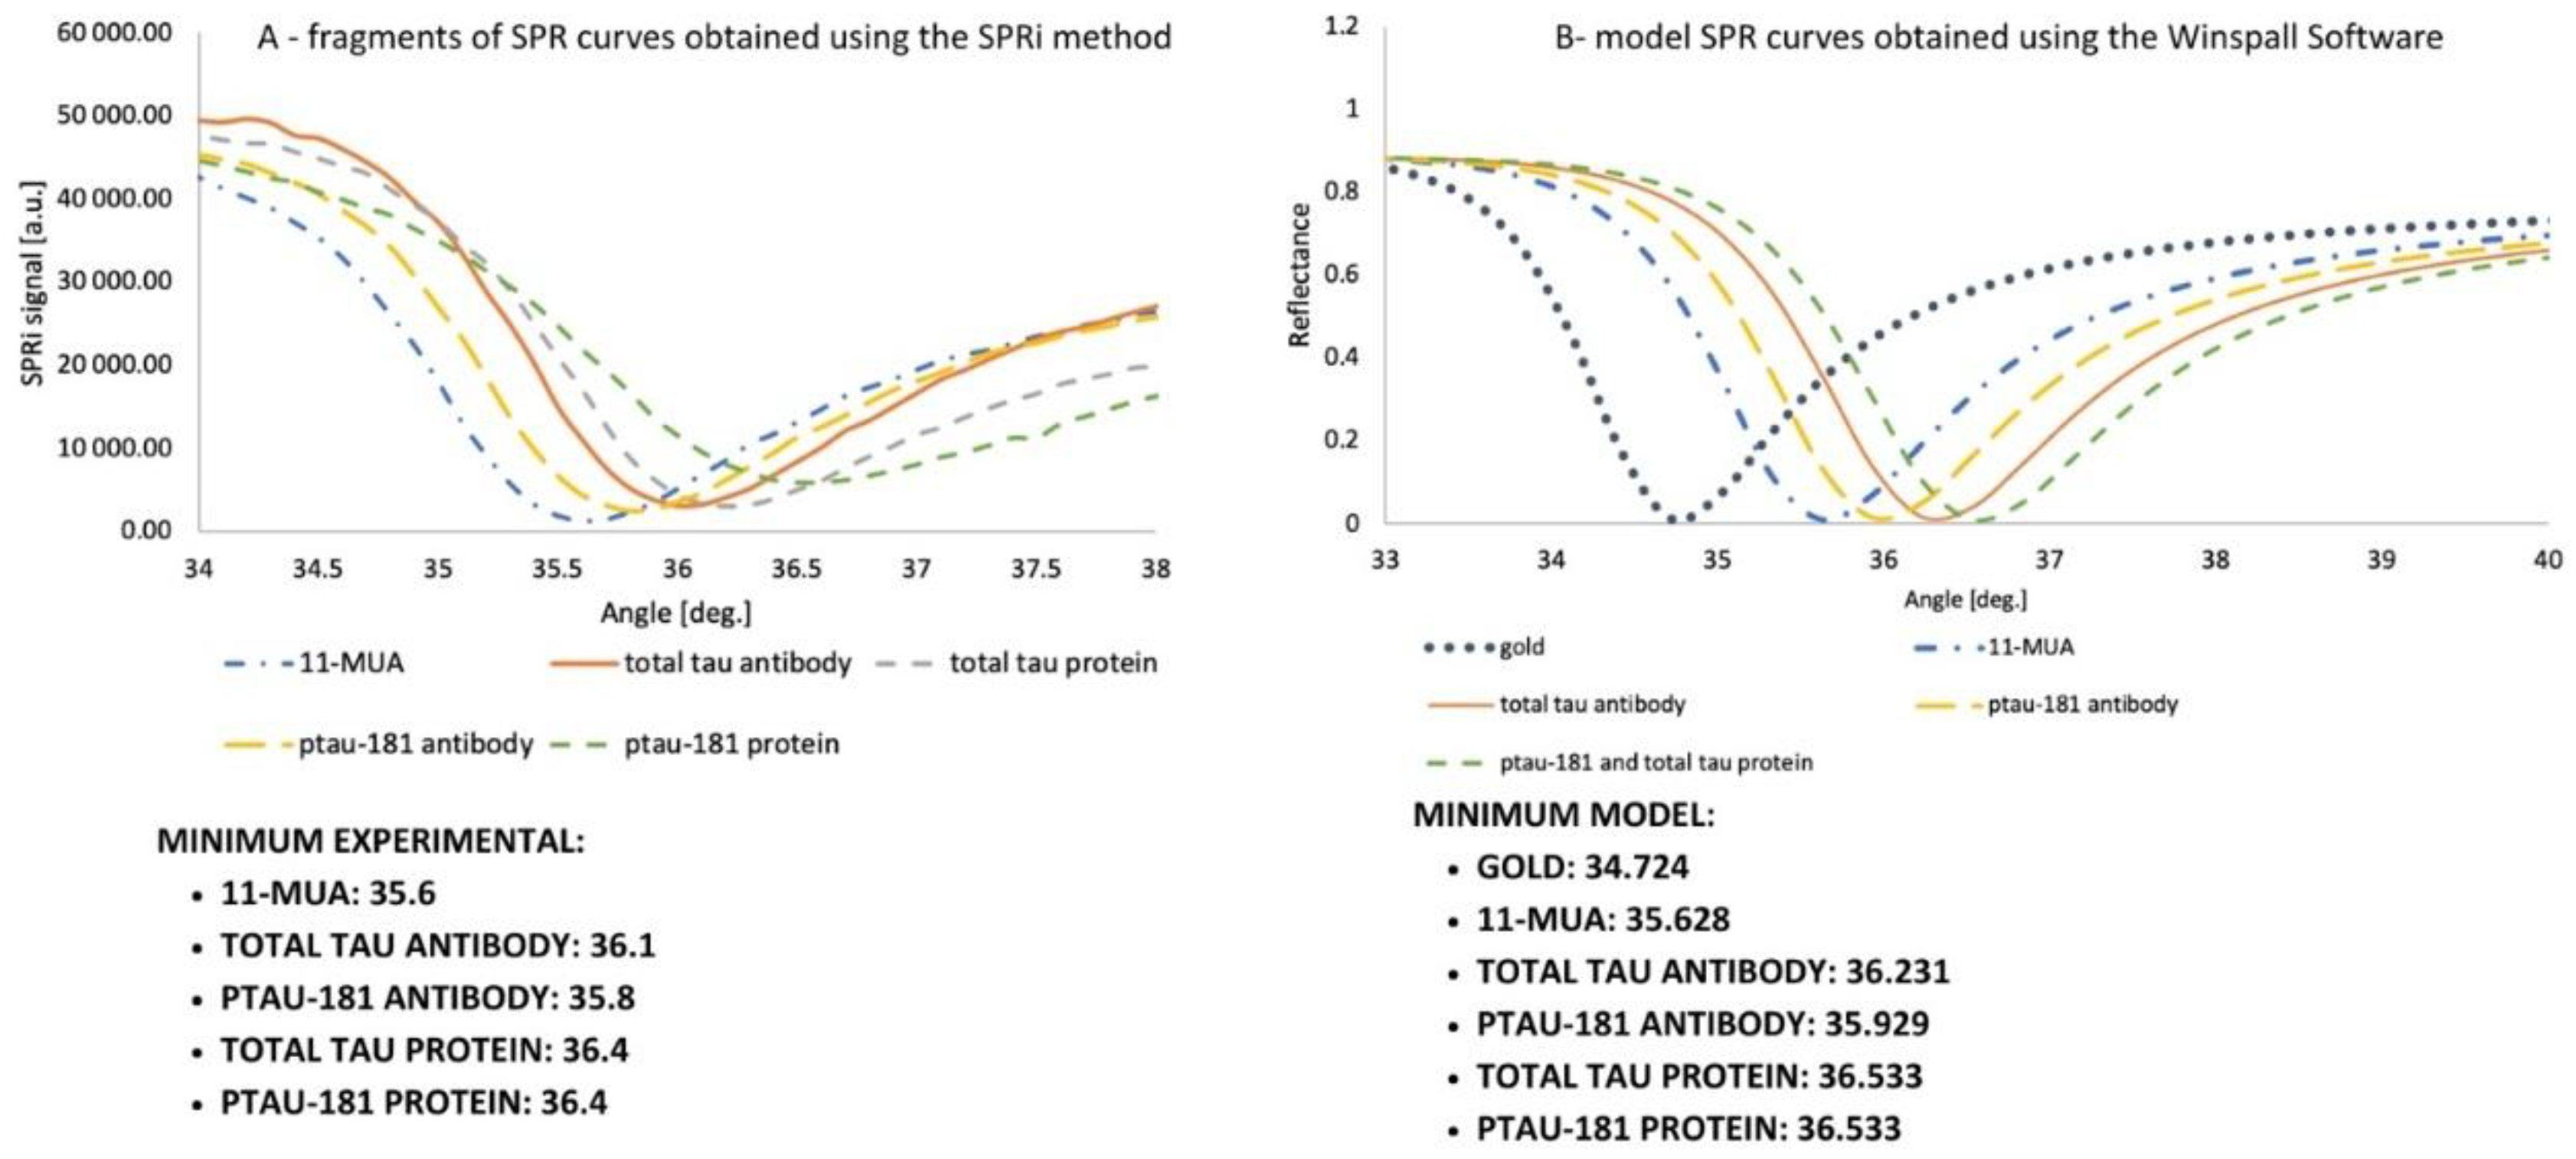
The curves illustrate the shifts caused by the adsorption of successive layers forming the biosensor. The experimental curves were examined as follows: a layer of 11-MUA was prepared on the chip, and a polymer film was applied. Six of the nine measurement sites available on the gold plate were used for the studies. For total tau, 11-MUA was measured in the first row. In contrast, the second row contained an antibody at a concentration of 1000 ng/mL, immobilized according to the EDC/NHS chemistry protocol with ethanolamine application and rinsed once with PBS buffer. The third site also featured antibody immobilization, similar to the second site. However, in the final step, 100 ng/mL total tau protein was applied for 10 minutes, the excess was aspirated, and the site was rinsed with PBS buffer. In the second row of the gold plate, three locations were used for ptau-181, similarly to the total tau. Data were acquired at angles ranging from 34 to 38 degrees, in 0.1-degree increments. The curve was repeated in two independent analyses, and the obtained SPRi signal values are the arithmetic mean of the two results. The curve is presented in
Figure 3A. The angles at which the curve reaches a minimum in the SPRi signal value are also listed. These layers were also examined similarly using SPR modeling in Winspall (
Figure 3.B). Minima for these curves were also determined. Analyzing the minima at the given angles confirmed that they were similar – the experimental analysis of the curves was performed correctly, confirming the formation of layers on the gold surface.
3.2. Structure of the Receptor Layer. Selection of the Appropriate Antibody Concentration
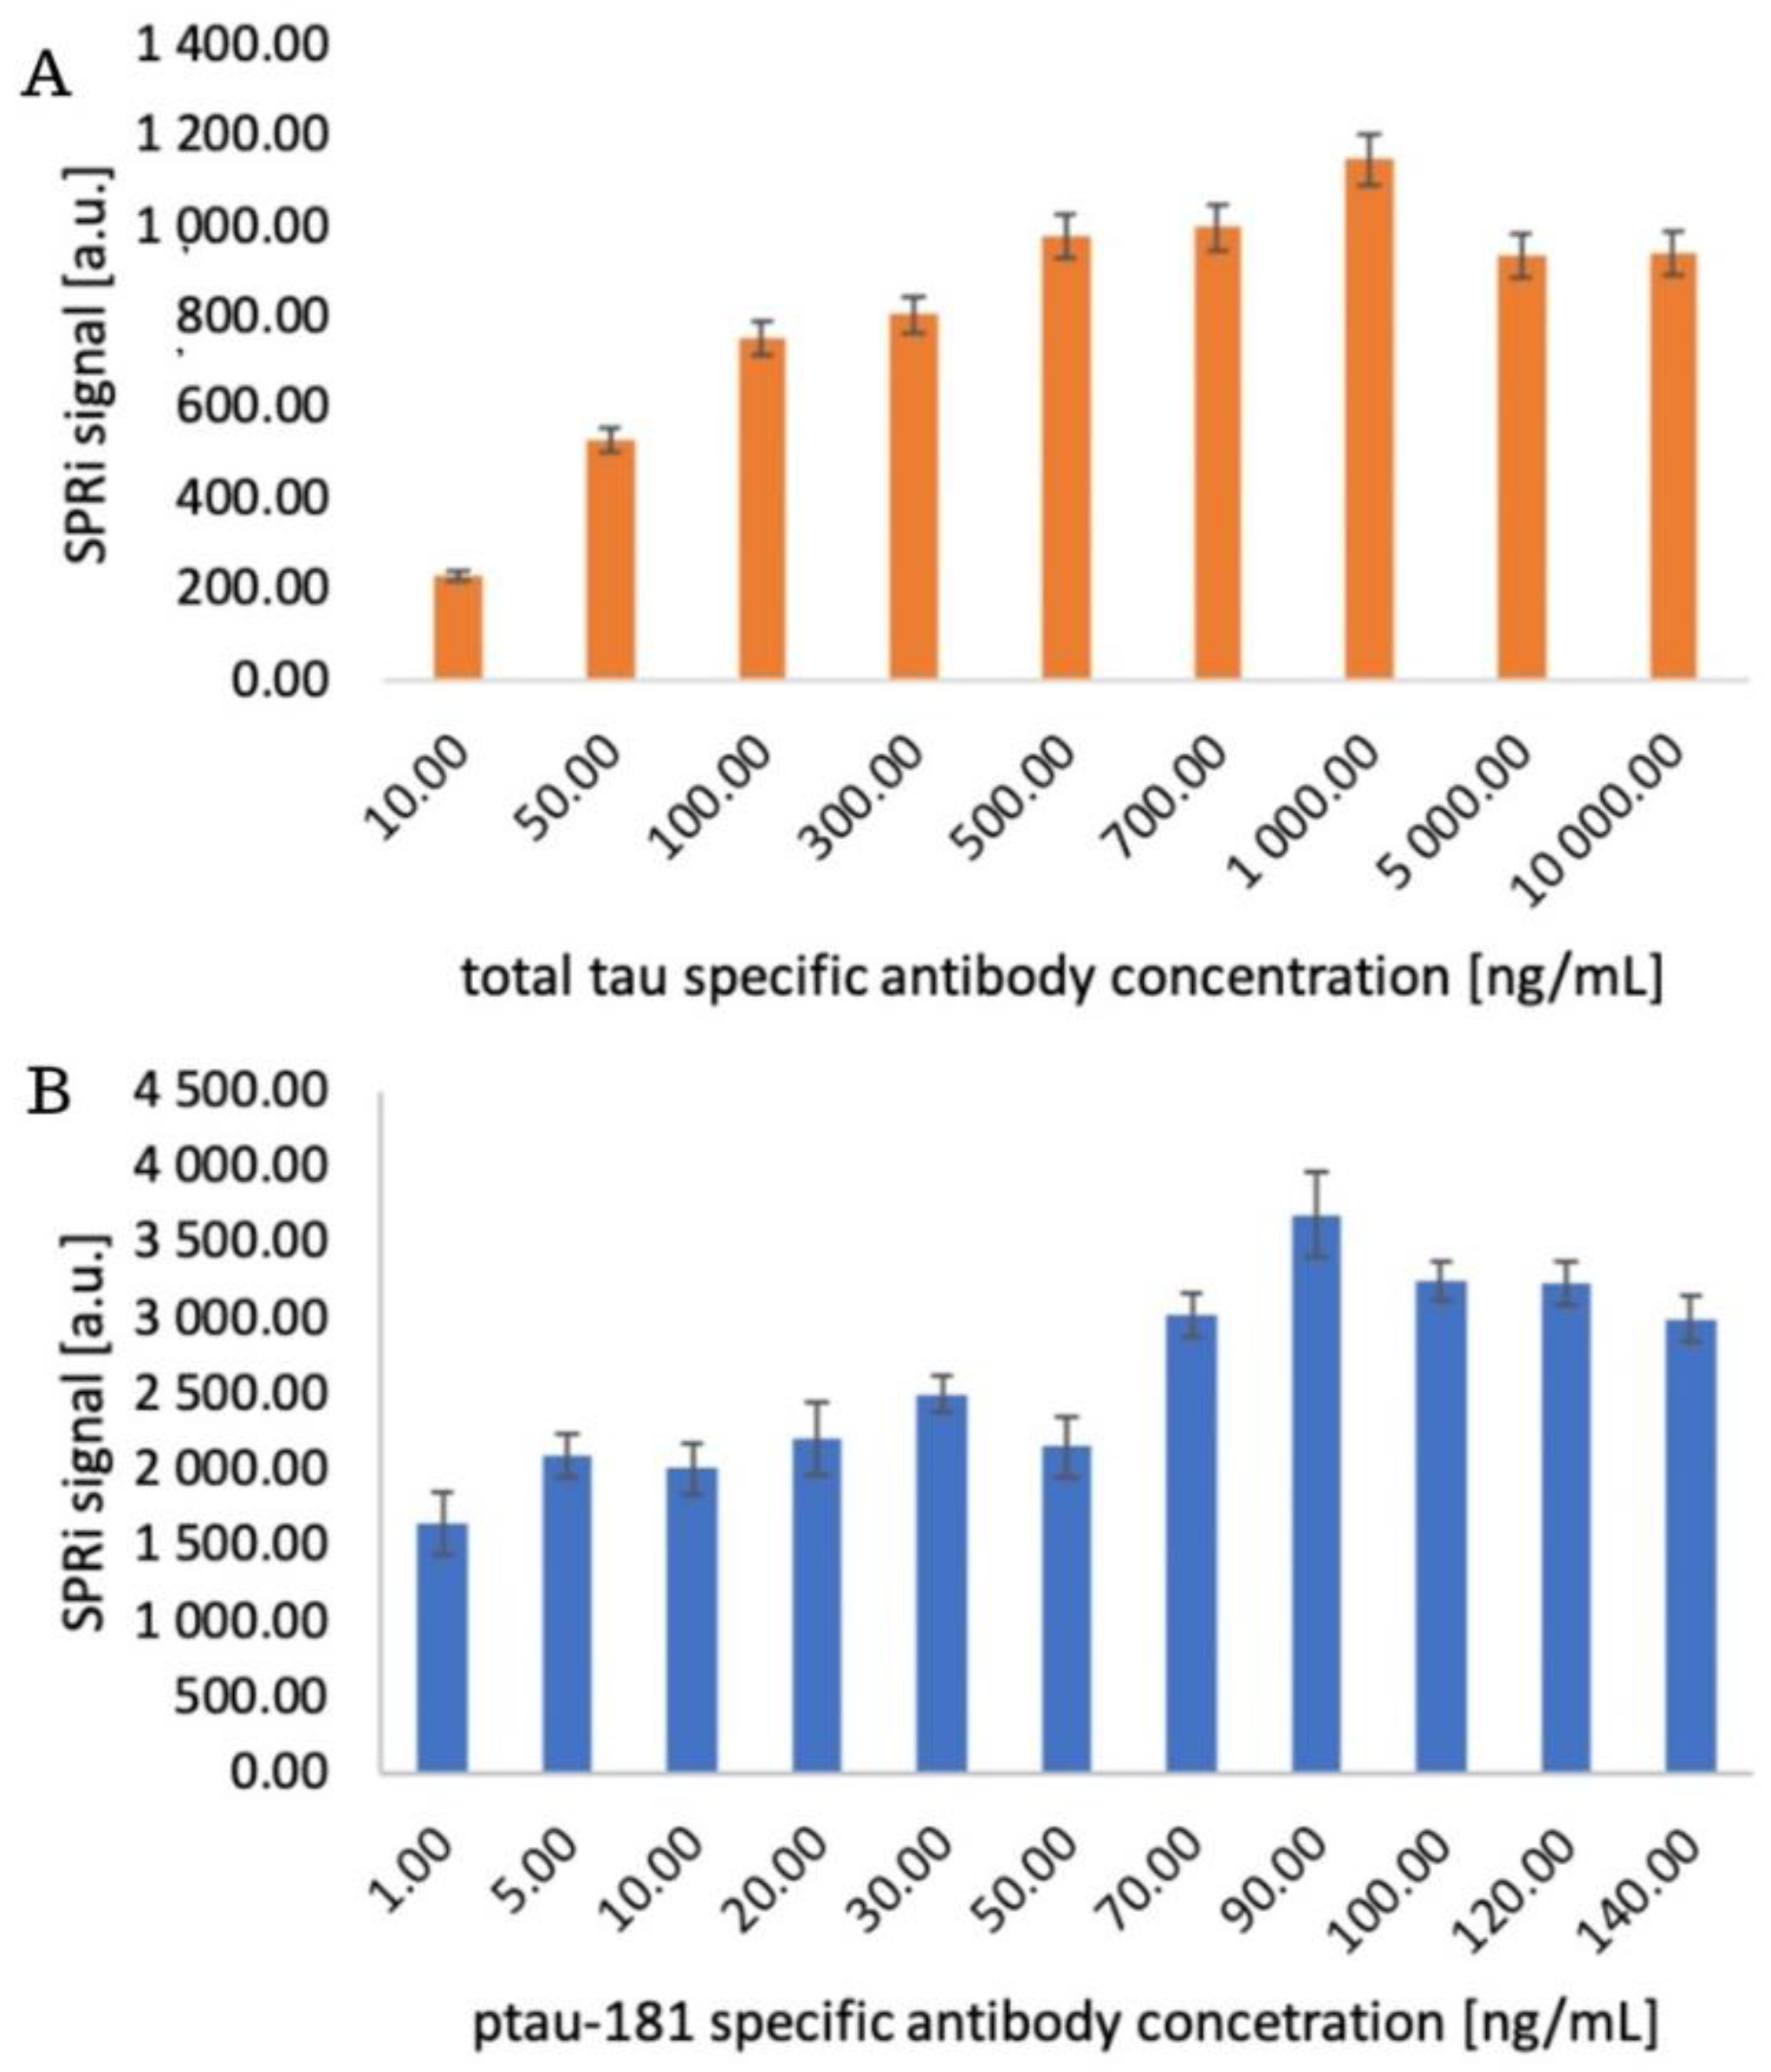
The appropriate concentration of the receptor layer, in this case antibodies sensitive to ptau-181 and total tau, is selected to achieve optimal immobilization densities on the sensor surface, ensuring high measurement sensitivity, preserving the antibody's biological activity, and avoiding spherical effects and surface saturation. The chip with the immobilized 11-MUA layer was placed on an SPRi prism, and the appropriate angle was selected for data acquisition. The 11-MUA measurement represents a comparison before antibody layer application, so the increase in the SPRi signal was observed after receptor layer immobilization. A mixture of EDC and NHS was applied to each active site according to the procedure. After removing the excess using a peristaltic pump, various antibody concentrations were applied to the sites:
- for total tau: 10, 50, 100, 300, 500, 700, 1000, 5000, 10000 ng/mL
- for ptau-181: 15, 10, 20, 35, 50, 70, 90, 100, 120, 140 ng/mL.
After 10 minutes, the excess antibody solutions were removed, and ethanolamine was applied for another 10 minutes. The chip was then rinsed with PBS buffer, and the signal from the receptor layers was measured. After data acquisition in the form of quantitative signals, bar graphs were generated illustrating the SPRi signal levels at various receptor layer concentrations. The graphs are presented in
Figure 4. In both saturation studies, the signal increases gradually to a specific value and then stabilizes—a plateau on the saturation curve characterizes this. Above 1000 ng/mL for total tau and 90 ng/mL for ptau-181, antibody binding to the sensor surface is no longer observed. This difference in concentrations may result from variations in antibody affinity, as well as differences in immobilization efficiencies.
3.3. Analytical Response of the Biosensor. Limit of Detection and Quantification
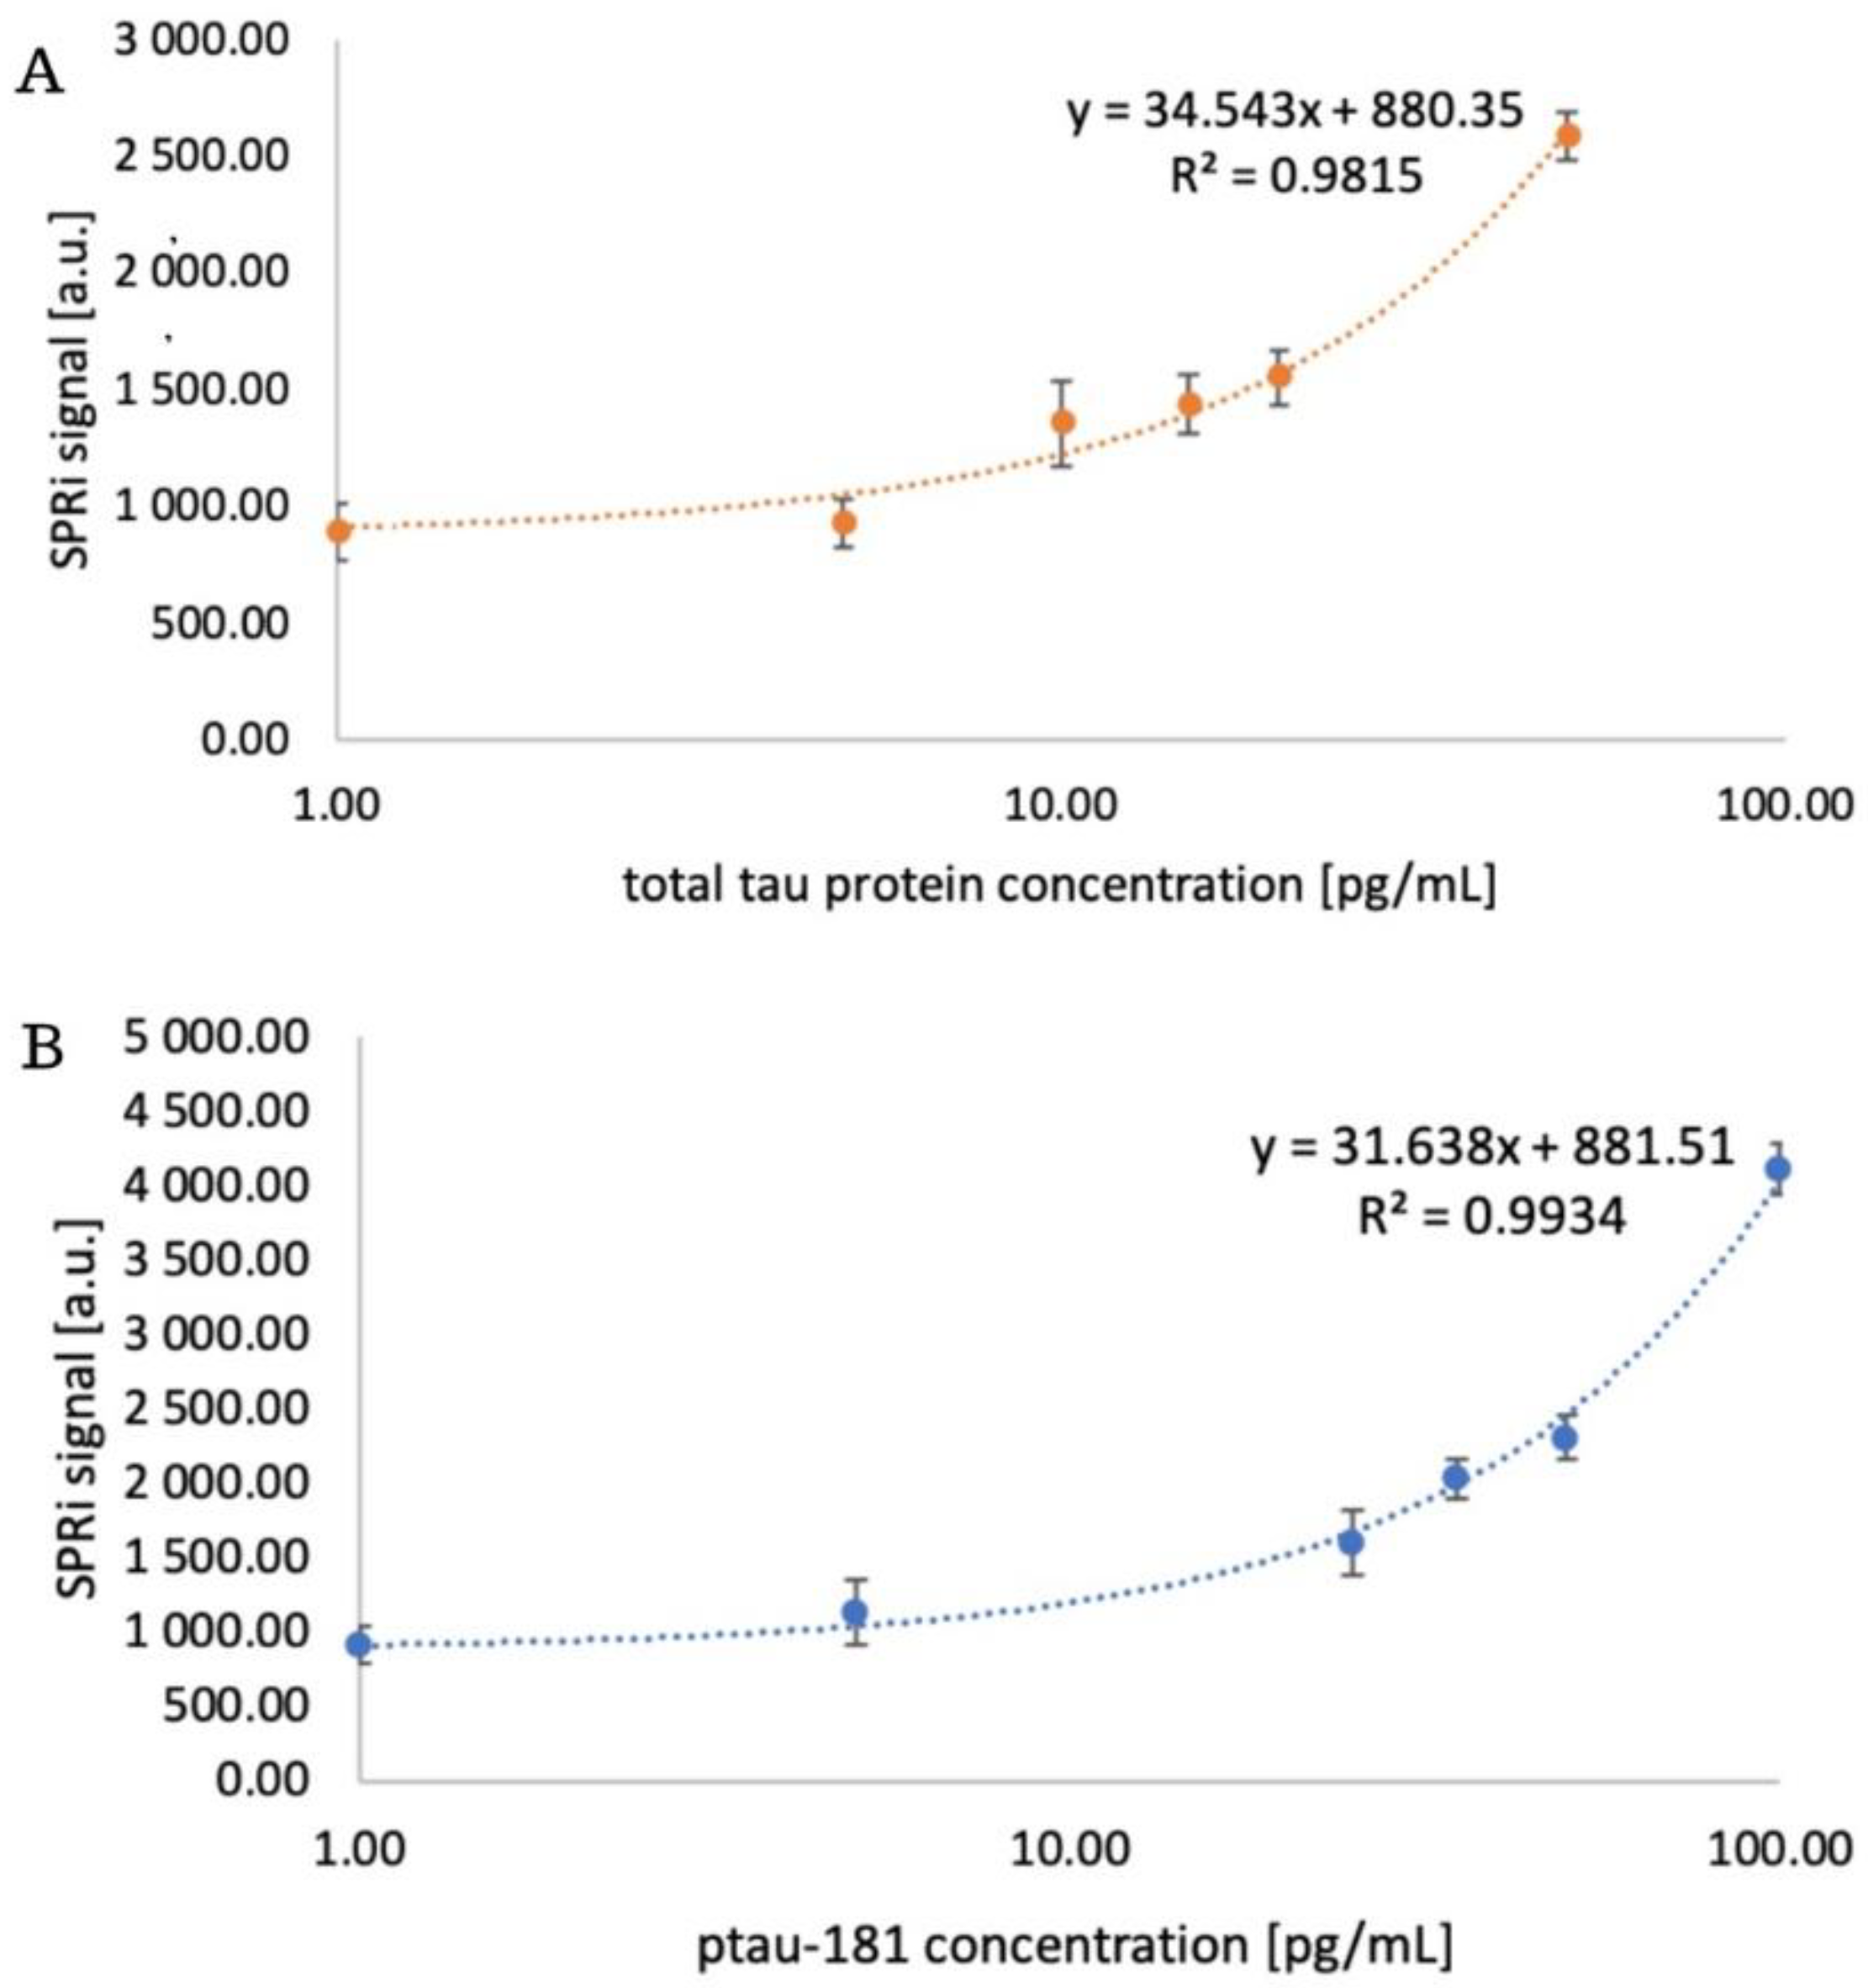
The analytical response of the biosensor was examined, enabling a quantitative determination of how the biosensor responds to changes in analyte concentration. This will also be used to assess its validation parameters in subsequent stages of the study. Antibodies at concentrations of 1000 ng/mL for the total tau-sensitive antibody and 90 ng/mL for ptau-181 were immobilized on two 11-MUA-coated measurement chips according to the procedure. After all immobilization steps, the chip was placed on an SPRi primer, the appropriate angle was selected, and data acquisition for the receptor layer was performed. Various concentrations of standard protein solutions were then applied to the chip:
- total tau: 1, 5, 10, 15, 20, 50 pg/mL
- ptau-181: 1, 5, 25, 35, 50, 100 pg/mL.
After 10 minutes, the analyte layer was acquired by washing with PBS buffer. Subsequently, after performing appropriate mathematical manipulations, quantitative signals were obtained, and calibration curves were plotted, along with their corresponding equations. These are presented in
Figure 5.
The experiment also determined the limit of detection (LOD) and limit of quantification (LOQ). To obtain these parameters, the following formulas were used: LOD = (3.3 × SD)/a and LOQ = (10 × SD)/a, where SD is the standard deviation and a is the slope of the simple calibration curve. The obtained values are presented in
Table 1.
3.4. Precision and Accuracy, Repeatability of the Method
To verify important validation parameters – precision and accuracy – four points from the calibration curve and the LOQ value for total tau and ptau-181 were selected, and standard solutions were prepared. The chosen concentration values are presented in
Table 2. The solutions were tested in four independent analyses. The receptor layer was prepared according to the immobilization protocol. The standard deviation (SD), the mean of the obtained results, and the coefficient of variation (CV) were determined. Small SD values indicate that the results are clustered close to the mean, indicating high precision, while CV indicates dispersion around the mean. For most analytical methods, values below 20% indicate good precision. The relative error [RE] was also calculated as a parameter of the accuracy of the method used (
Table 2). RE values indicate perfect accuracy for total tau and good accuracy for ptau-181. These values are less than 15%, indicating acceptable accuracy.
To test the repeatability of the method, a real sample was measured three times in independent experiments. The measurements were repeated three times. The CV was then calculated, which was 5.81% for ptau-181 and 7.31% for total tau, respectively. Low values of this coefficient indicate good repeatability of the method.
3.5. Selectivity of the Method
The method's selectivity was tested by analyzing the signal generated by the tested proteins in the presence of potential interferents. Standard solutions were prepared, the compositions of which are presented in
Table 3. Human albumin is often used as an interferent because it is the most abundant component of plasma, so that any method will be exposed to its presence. Furthermore, it can exist in various forms and modifications, for example, oxidized or bound to ligands, which can have different effects on the signal [
21]. Examining Ptau-181 and total tau as mutual interferents also allows us to verify whether the analytical test being performed responds to the relevant proteins and whether receptor-analyte binding is specific. The obtained recovery values indicate that the analysis is not influenced by interferents present in the analyte samples. This allows us to conclude that the analytical method under study has reasonable specificity.
3.6. Determination of Proteins in Patients' Blood Plasma
Confirming the biosensor's performance requires assays in biological material. In this case, assays were performed in 17 plasma from patients diagnosed with Alzheimer's disease, as well as in a group of healthy, but smoking, 18 patients serving as a control group. The plasma samples did not require dilution due to the low analyte concentrations in the samples. Two measurement chips were prepared with immobilized specific antibodies: one with an antibody specific to ptau-181 at a concentration of 90 ng/mL, and the other with an antibody specific to total tau at a concentration of 1000 ng/mL. After this step, the chip was rinsed with PBS buffer, placed on the prism of the SPRi device, and images of the receptor layer were taken. Samples were then applied to the active sites. The interaction time was chosen to be 3 minutes due to the complexity and lack of sample dilution. Previous analysis of interaction time showed no significant differences in the interaction after 3, 6, or 9 minutes. However, interaction times of 6 and 9 minutes required more time-consuming rinsing and cleaning of the active sites to ensure interference-free measurement. Therefore, 3 minutes was optimal for the analyte-antibody interaction time. After this time, PBS buffer was applied to the chip for 1 minute, the excess was aspirated, and the chip was rinsed again with a single layer of PBS. Data acquisition was performed for the analyte layer. After conversion to a quantitative signal, concentration results were obtained for both groups. Additionally, the ptau-181/total tau ratio was calculated. The results are presented in
Appendix A Table A.1. The mean concentrations in the samples from Alzheimer's disease patients were 65.88 pg/mL for ptau-181 and 23.59 pg/mL for total tau, respectively. In healthy subjects, the concentrations obtained were 3.83 pg/mL for ptau-181 and 4.24 pg/mL for total tau.
4. Statistical Analysis and Discussion
Two SPRi biosensors sensitive to the proteins ptau-181 and total tau were constructed for use in assaying these proteins in the blood plasma of Alzheimer's disease patients. The first step was to determine whether layers actually formed on the sensor surface by analyzing each layer over a wide range of angles. The results were compared with the Winspall model, confirming the accuracy of the analysis and the presence of the layers. Optimal receptor layer concentrations were also selected, determined by analyzing multiple concentrations of antibodies specific for total tau and ptau-181. The optimal concentration was chosen as the one that produced the highest SPRi signal, and subsequent concentrations showed a decrease in signal until a plateau was reached. These concentrations were 90 ng/mL for ptau-181 and 1000 ng/mL for total tau. The next step was to examine the analytical response of the biosensor, where the dynamic ranges for ptau-181 and total tau were determined to be 1 to 100 pg/mL and 1 to 50 pg/mL, respectively. The limits of detection and quantification of the method were also calculated, achieving LOD = 0.18 pg/mL (total tau), LOD = 0.037 pg/mL (ptau-181), LOQ = 0.85 pg/mL (total tau), and LOQ = 0.112 pg/mL (ptau-181). The obtained analytical parameters indicate the high sensitivity of the developed method. Classic SPR biosensors based on optical fibers typically exhibit a detection limit for total tau and phosphorylated tau of 1.6-2.4 pg/mL, which means that the values obtained in this study are lower by more than an order of magnitude [
22].
Electrochemical immunosensors for ptau-181 detection are widely described in the literature. Typical systems using modified electrodes and classical voltammetric techniques achieve LODs of 0.2–0.3 pg/mL [
23]. More advanced and sophisticated sensor platforms based on EIS (electrochemical impedance spectroscopy) and nanostructures enable the detection of ptau-181 even in the femtogram range. However, these methods are highly complex, more expensive, and more difficult to reproduce [
24]. The LOD for ptau-181 obtained in this study represents a compromise between high sensitivity and the simplicity of the measurement equipment. Many scientific articles focus solely on the limit of detection, omitting the LOQ. In this experiment, a low LOQ was obtained, indicating that the SPRi biosensor enables not only qualitative detection of tau proteins but also their reliable analysis within clinically relevant concentrations. Validation parameters, including precision, accuracy, repeatability, and selectivity, were also examined. Low RE, CV, and SD values indicate good precision and accuracy. Testing the natural sample in several independent measurements also confirmed the good repeatability of the analytical method. The selectivity test revealed no interference with the assay and no cross-reactions. This demonstrates the feasibility of using the analytical process in further stages of the experiment.
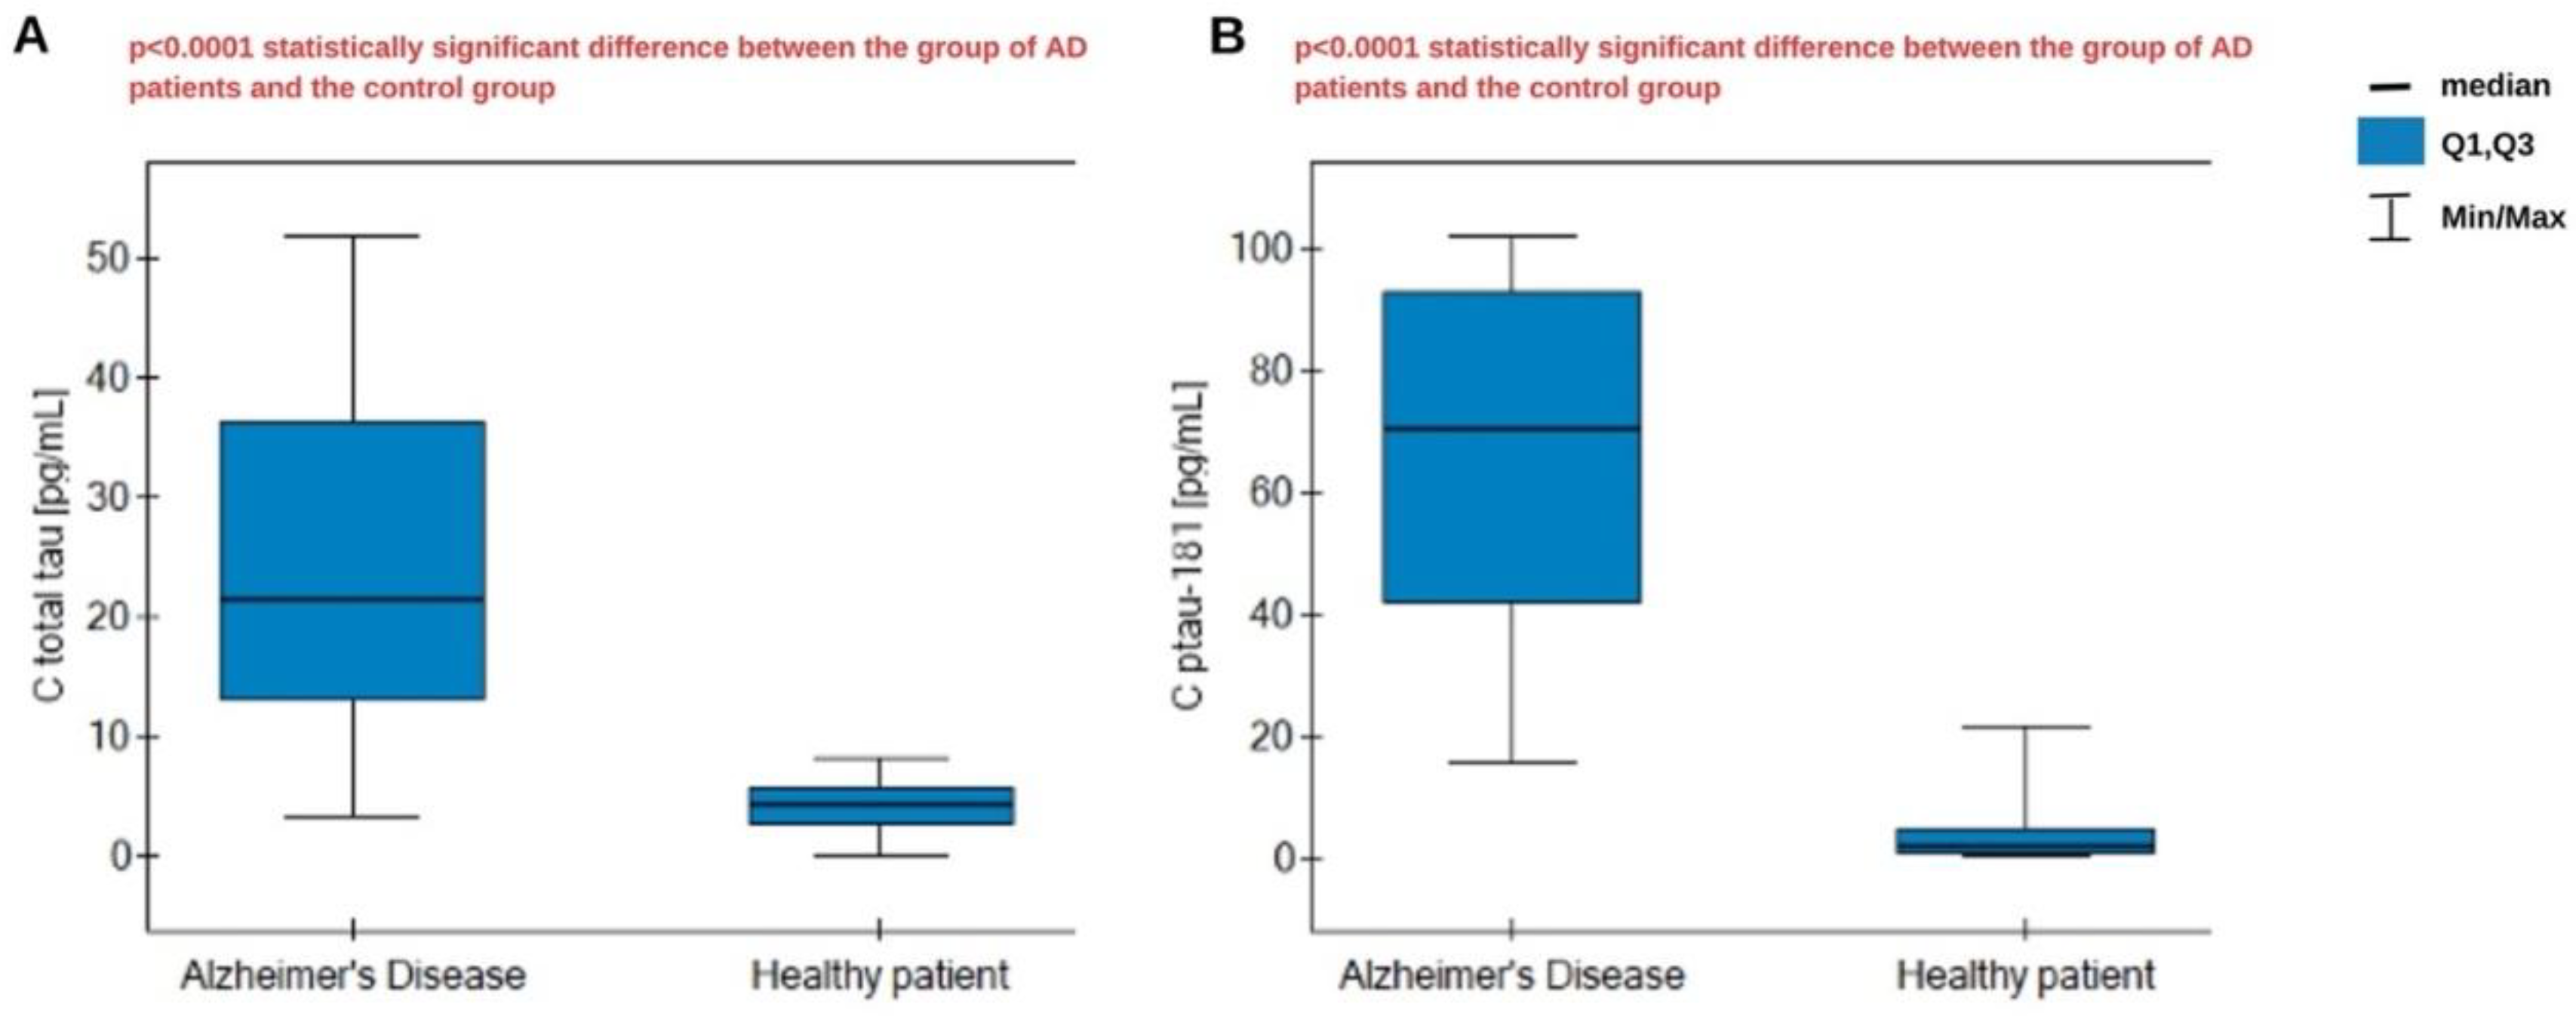
The assay was performed in biological material consisting of plasma from Alzheimer's disease patients, as well as a control group of healthy, smoking patients. The samples did not require prior dilution because of their low analyte content. The obtained results were statistically analyzed. The Shapiro-Wilk test indicates a non-normal distribution, so statistical analysis was conducted using nonparametric tests. The U Mann-Whitney test was used, which confirmed statistically significant differences in concentrations between the AD group and the control group for both proteins – total tau and ptau-181. The results are presented in
Figure 6. We observe significantly higher concentrations in the AD group. The medians are, respectively, 21.38 pg/mL for total tau in AD patients and 4.41 pg/mL in the control group, and 70.25 pg/mL for ptau-181 in AD patients and 1.775 pg/mL in the control group. Overall, we obtained higher concentrations for ptau-181. In the course of Alzheimer's disease, excessive tau phosphorylation occurs in the central nervous system, resulting in the accumulation of tau in the form of neurofibrillary tangles. This pathological phosphorylation leads to the secretion and persistence of phosphorylated tau isoforms in the circulation, even when the total tau amount is limited. This means that the ratio of ptau-181 to total tau may be elevated, especially in the early stages of the disease when tau pathology is active [
25].
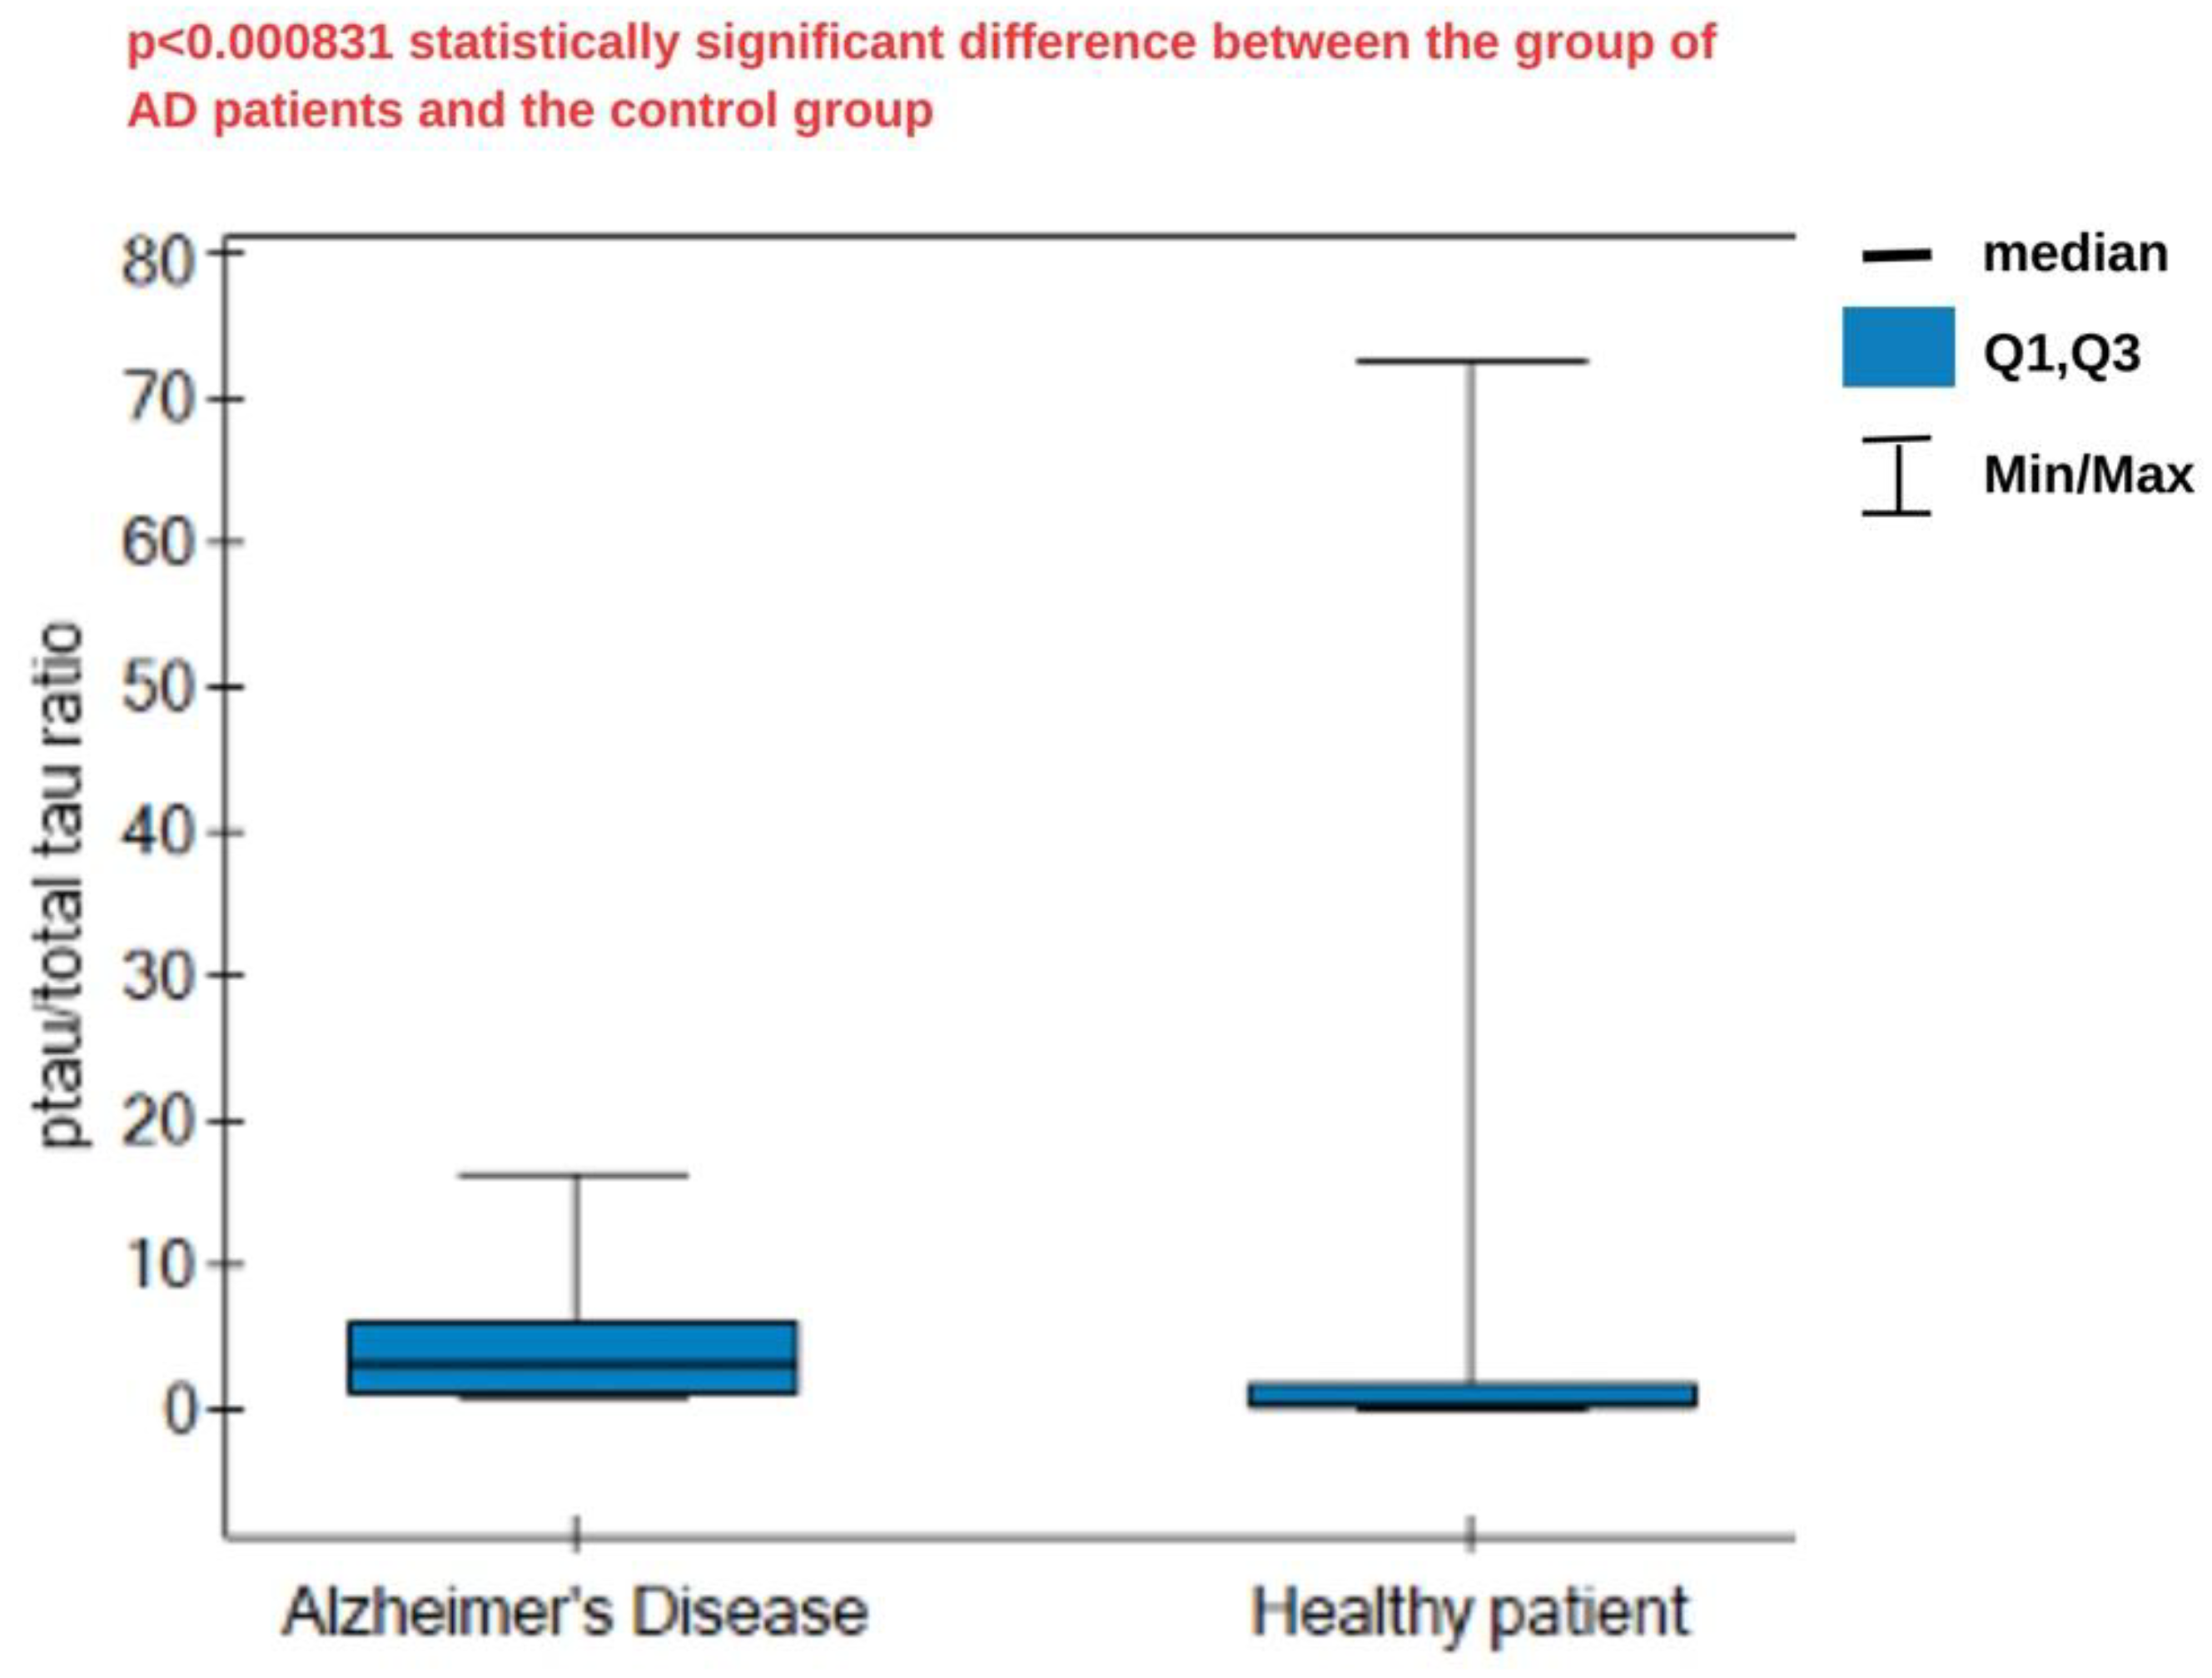
Following this reasoning, the ratio of ptau-181 to total tau concentrations was calculated and statistically analyzed. The results are presented in
Figure 7. The median ratio was higher in the AD group (3.21) compared to the control group (0.355), and these differences were statistically significant. A high ratio reflects the greater specificity of tau changes typical of AD, associated with phosphorylation, compared to general neuronal damage. Lower ratios indicate a predominance of nonspecific damage, without the distinct phosphorylation characteristic of AD. No cutoff values were found in the literature to specifically separate healthy patients from those with disease, so analysis and the establishment of specific criteria require more extensive statistical analysis.
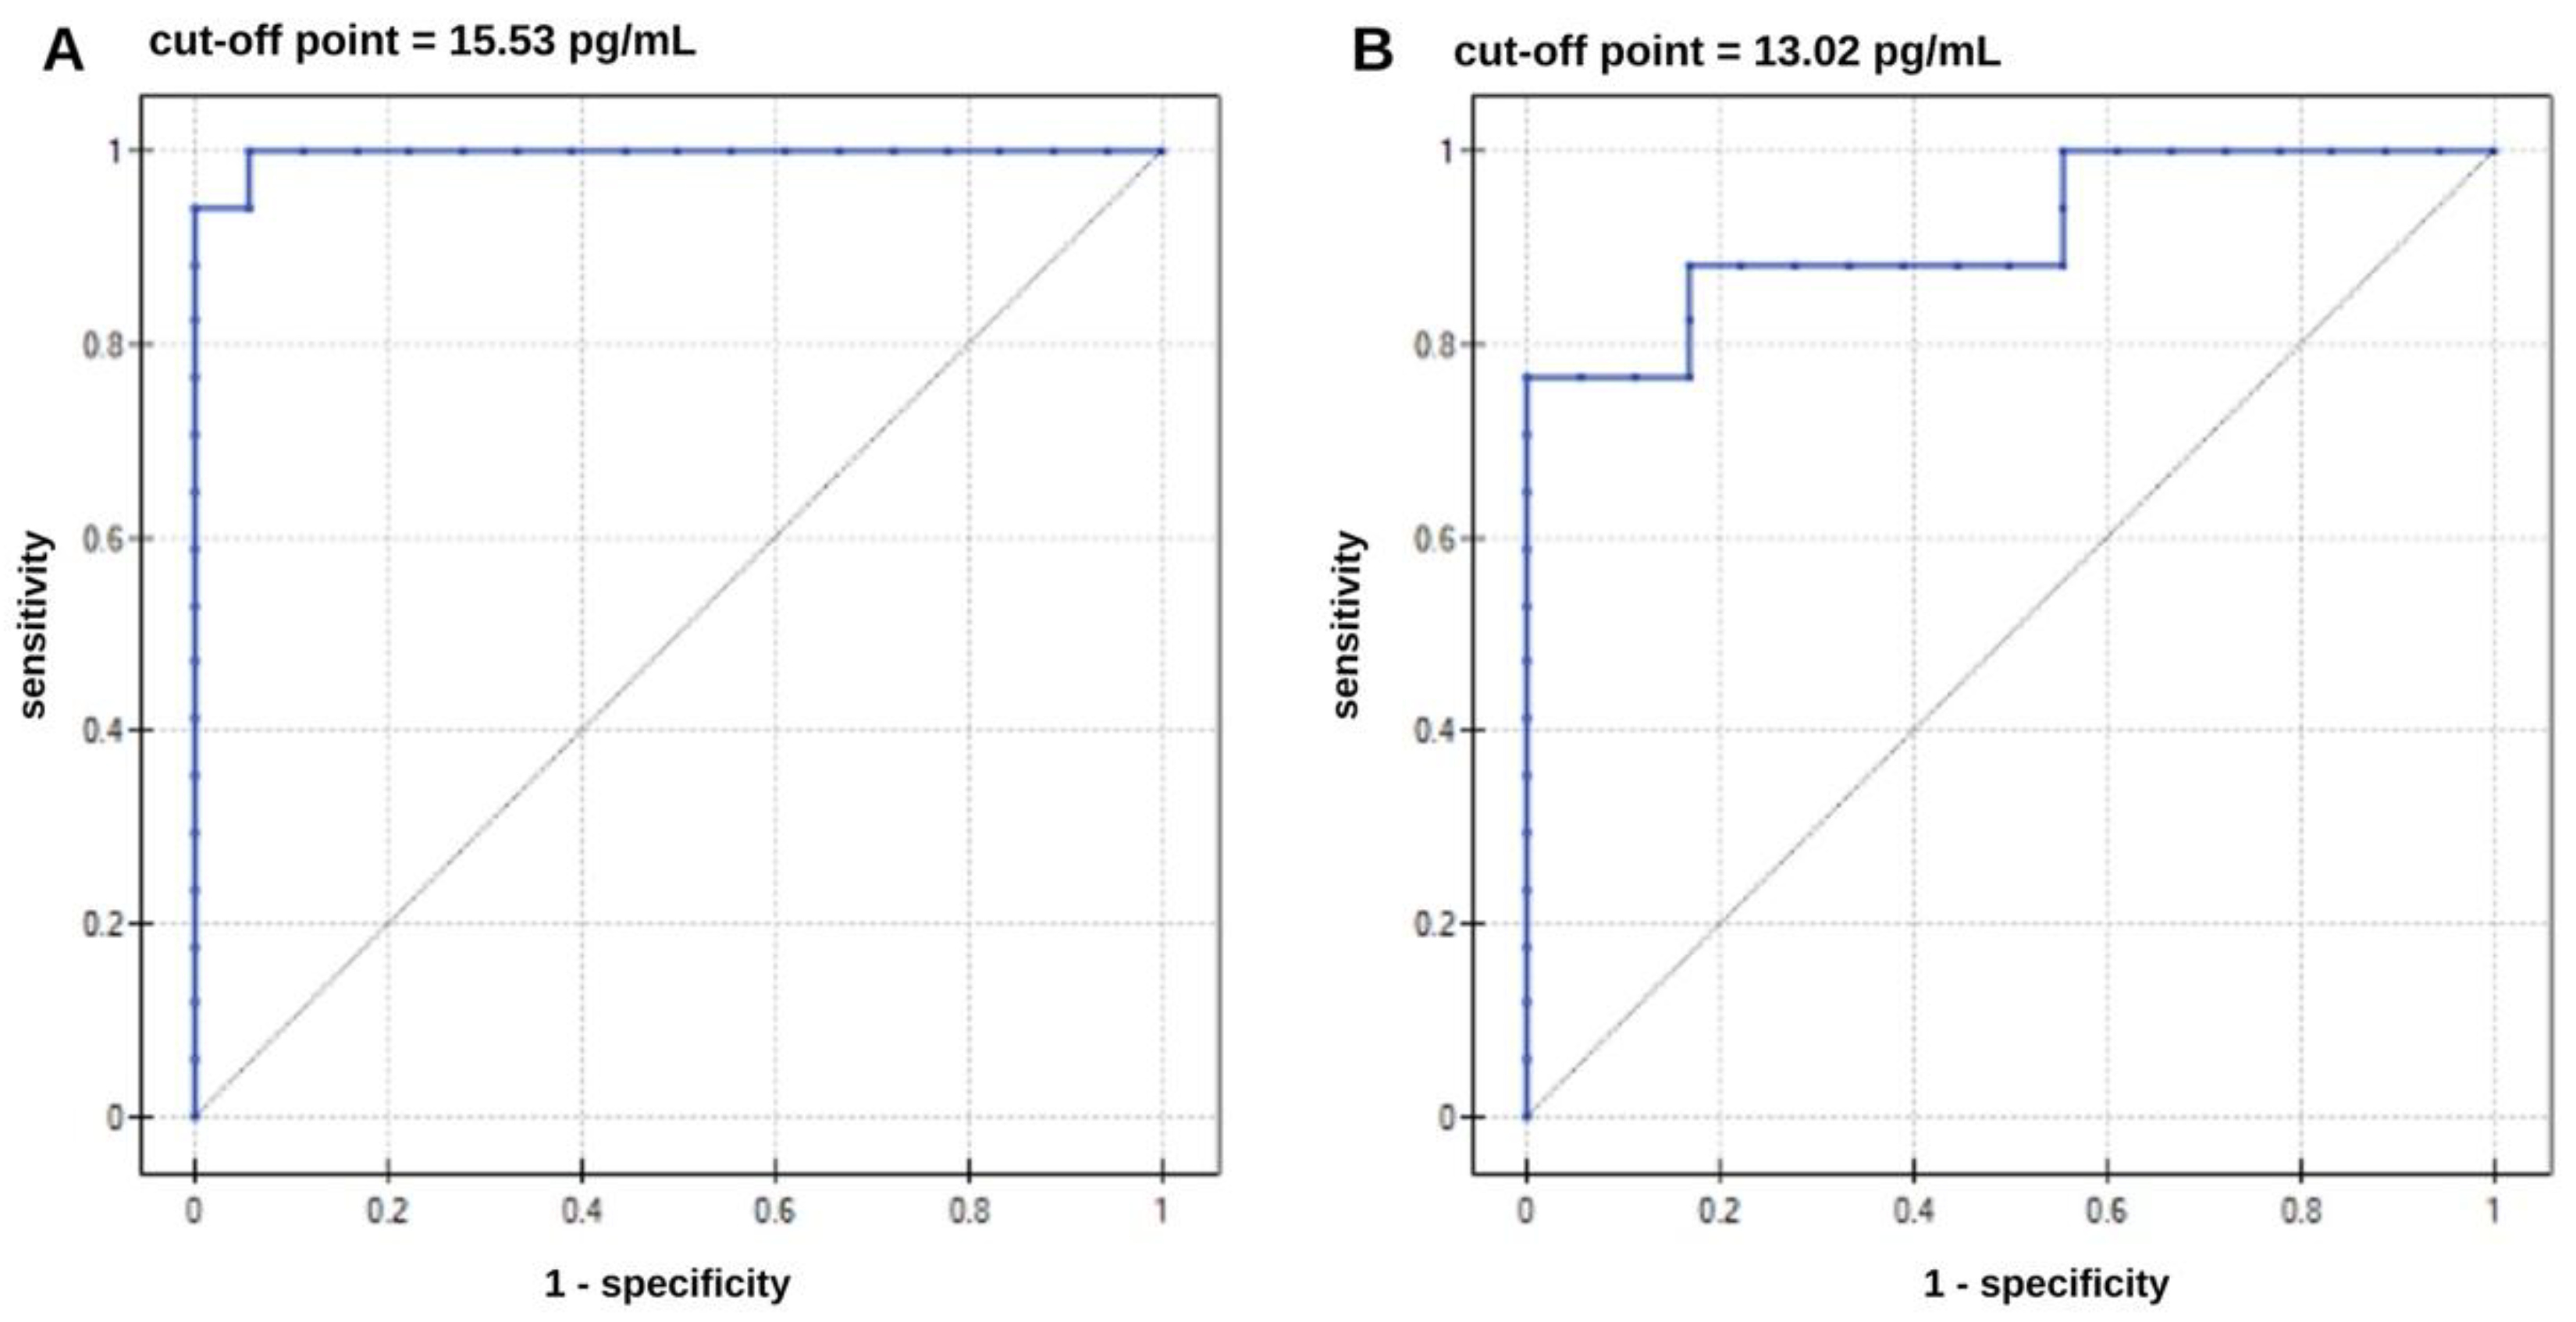
The next step in the statistical analysis was to perform an ROC analysis to determine whether it was possible to distinguish AD patients from the control group. ROC curves are presented in
Figure 8. The ROC curve data are presented in
Table 4. The results are highly statistically significant, as indicated by the p parameter. Analyzing the data in
Table 4, it can be said that increased ptau-181 and total tau concentrations increase the risk of developing Alzheimer's disease. Concentration values equal to or higher than the cutoff point may be borderline values that may indicate the presence of the disease. The area under the curves (AUC) determines the correct allocation of patients to the AD and healthy groups. The AUC parameter was evaluated using the cross-validation method. For ptau-181, the result obtained was very close to unity, while for total tau, a less specific marker of AD, the result was slightly worse. The test demonstrated the best sensitivity for ptau-181 (100%) and specificity at 94%. For total tau, the sensitivity is not satisfactory, at 75%. A positive predictive value (PPV) indicates the probability that a person with a positive test result has Alzheimer's disease. In contrast, a negative predictive value (NPV) indicates that the person has no disease if the test result is negative for AD. In both cases, these values are high and satisfactory.