
Submitted:
19 December 2025
Posted:
22 December 2025
You are already at the latest version
Abstract
Background: The automotive industry is undergoing a deep transformation driven by 9 the global green transition. This change follows divergent trajectories in developed and 10 emerging markets due to differences in regulation, infrastructure, and economic con- 11 straints. The research methodology is adapted to incorporate different factors of influence 12 and contraints. The research applies a structured Failure Mode and Effects Analysis 13 (FMEA) based on IEC 60812:2018 and AIAG & VDA (2019), and integrates the Analytic 14 Hierarchy Process (AHP) to prioritize corrective measures. Concepts from adaptive risk 15 management, informed by expert consensus and literature-backed data, are also used to 16 interpret dynamic behavior of supply chains and market volatility. The comparative anal- 17 ysis successfully highlights the systematic RPN Divergence between market types, reveal- 18 ing critical differences in failure mode profiles, risk priorities, and capacity to adopt miti- 19 gation strategies. The hybrid FMEA-AHP approach reduces subjectivity and provides 20 transparent prioritization tailored to market maturity. The integrated methodology sup- 21 ports decision-making in electrification programs and offers a robust framework for 22 benchmarking complex transition processes across regions.
Keywords:
ICE-EV transformation
; hybrid FMEA (failure mode and effects analysis)
; AHP (analytic hierarchy process)
; RPN (risk priority number) divergence
1. Introduction
The global shift toward sustainable mobility mandates an unprecedented reconfiguration of the automotive value chain. While traditional risk management focuses on technical failure, the green transition introduces complex systemic risks spanning infrastructure, policy stability, and resource scarcity. Crucially, the capacity to adopt and mitigate these risks is highly asymmetrical, leading to divergent electrification pathways across the global automotive landscape. Current risk frameworks, often relying on subjective or static assessments like the traditional Risk Priority Number (RPN) [2] , lack the multi-criteria capability needed to objectively compare and prioritize corrective investments across regions facing vastly different economic, social, and regulatory constraints. This deficiency obstructs optimal resource allocation and policy design, particularly when balancing competing priorities such as rapid decarbonization (Developed Markets) versus affordability and infrastructural development (Emerging Markets). To bridge this crucial gap, this paper introduces a novel integrated methodology combining Failure Mode and Effects Analysis (FMEA), adhering to IEC 60812:2018 and AIAG & VDA (2019) standards [1,2] , with the Analytic Hierarchy Process (AHP) [6]. The integration uses FMEA to structure and quantify technical failure modes (AS, AO, AD), and subsequently employs AHP to objectively prioritize resulting corrective actions based on expert-weighted strategic criteria, including cost, implementation time, and crucially, sustainability impact. This hybrid FMEA-AHP model enhances methodological rigor, reduces decision subjectivity, and improves traceability. Our empirical contribution lies in applying this framework comparatively to benchmark the transition readiness and risk profiles between developed and emerging markets, offering actionable strategic insights for global supply chain resilience and local policy intervention. The theoretical framework and research methodology are designed to encompass the sheer diversity of elements contributing to transformation processes, accounting for relevant impact factors that drive adverse movements in the transition. This approach explicitly identifies the critical divergences between emerging and developed markets within the ICE-EV transformation. Although integrating such an extensive set of characteristics with varying impacts is an ambitious endeavor, this qualitative comparison provides an indispensable overview. It supports policymakers, regulators, and automotive stakeholders in navigating the 'green transition' by addressing the high density and volatility of these processes. Ultimately, the methodology is adapted to the evolution of critical factors, creating a suggestive integration of characteristics that enables capture relevant cross-market benchmarking.
1.1. Research Motivation and Purpose
This paper is motivated by two practical needs. First, industry practitioners require tools that translate technical reliability analyses into strategic actions that account for market-specific constraints. Second, policymakers and investors need comparative assessments to allocate resources and design incentives fitting local realities. The urgency of this transition is underpinned by its critical role in addressing global environmental targets, aligning directly with the Environmental, Social, and Governance (ESG) mandates now central to global policy and corporate strategy. Managing the associated risks requires a systematic, multi-criteria approach that accounts for these regional specificities. This paper proposes a hybrid risk management framework, integrating Failure Mode and Effects Analysis (FMEA) with the Analytic Hierarchy Process (AHP), to provide a tailored diagnostic of electrification risks and prioritize corrective actions.
1.2. Literature Review and Research Gap
The existing literature on the ICE-EV transformation largely focuses on external costs and benefits of EVs within accelerated technological progress [7]. Several key branches of research interest have emerged: regional policy variations [19], predictive modeling [21], and knowledge accumulation and network effects [23]. Technological models of EV adoption were predominantly Static (e.g., [7,17,27]), highlighting pollution reduction, cost reduction, and performance increase. However, the dynamics of the transition are better captured by Dynamic Models (e.g., [12,21]) which account for future policy changes and consumer preferences, though these often start from restrictive assumptions. The high volatility of EV adoption strategies, caused by strategic policies on subsidies and uncertainty on learning-effects [33], further complicates estimations of substitutability. The key gap addressed by this research is the lack of a structured, comparative risk assessment tool that is:
- Systemic: Covers both technical (EV component) and systemic (Infrastructure, Policy) failure modes.
- Comparative: Explicitly models the risk profile divergence between developed and emerging markets.
- Actionable: Utilizes a multi-criteria decision-making method (AHP) to prioritize corrective actions based on strategic criteria (Cost, Time, Impact) rather than a single risk score.
2. Theoretical Framework and Methodological Foundation
This review synthesizes the key strands of literature relevant to the green transition, risk assessment, and supply-chain resilience in ICE-EV transition.
2.1. Sustainable Development in Automotive Engineering
Sustainable development in industrial operations implies the integration of environmental, social and economic objectives into operational decision-making. The FMEA failure modes are inherently linked to the three pillars of ESG. This research maps key failure modes to these pillars:
- Environmental (E): Failure modes such as "Insufficient battery recycling" directly challenge the environmental sustainability of EVs.
- Social (S): "Market/customer resistance," "Safety risks due to battery thermal events," or "Distributional effects of pollution" affect social acceptance and equity [18].
- Governance (G): "Regulatory volatility" and "Lack of national charging standards" relate to the stability and effectiveness of governance structures.
Furthermore, the dynamics of the transition are driven by Externalités, which fundamentally justify governmental interventions:
- Intensive Type (Usage): Resulting from the actual usage over the life cycle, where the clear sustainability advantage of EVs is potentially diminished by safety risks in accidents [20] or aspects of energy security.
- Extensive Type (Production/Stock): Influenced by the accumulation of knowledge (learning-effects) and by the beneficial effects of charging infrastructure development [15].
2.2. Electrification Transformation, the Continuum Redefinition of ICE-EV Transition
The technical shift from internal combustion engines to battery electric vehicles (BEVs) entails changes in manufacturing processes, supplier ecosystems (notably battery and power electronics supply), workforce skills, and supporting infrastructure (charging networks and grid capacity). Regulatory pressure (CO2 targets, emissions zones) accelerates this shift in developed markets, while emerging markets often exhibit lagging regulatory frameworks and infrastructure deficits that slow adoption [16]. Sodhi and Tang [4] highlight that supply chains operating in extreme or volatile conditions need built-in flexibility, diversified sourcing, and robust risk assessment frameworks to maintain continuity during transition phases.
2.3. Risk Assessment Tools: FMEA and Beyond
FMEA is a long-established method to identify failure modes, assess their effects, and prioritize mitigations. Standards such as IEC 60812:2018 [1] formalize the methodology for FMEA/FMECA, while the AIAG & VDA handbook (2019) [2] modernizes procedures and tailors the technique to automotive contexts. Nevertheless, criticisms persist: FMEA scores (Severity, Occurrence, Detection) can be subjective, RPNs may not capture interdependencies, and traditional FMEA is often static. Adaptive risk management (Haimes) and integration with multi-criteria decision methods (AHP) are proposed solutions to increase rigor and traceability [3].
2.4. Al-Enabled Dynamic Risk Management
The evolution of Industry 4.0 and Artificial Intelligence (AI) provides quantitative mechanisms to move from static to adaptive FMEA, addressing the high volatility of market. Al, leveraging lot and Machine Learning, directly influences the FMEA parameters:
- Occurrence (ΔO): Predictive Maintenance systems and Digital Twins can use real-time data to forecast failures, effectively reducing the Occurrence score (O′) of unexpected component failures.
- Detection (ΔD): Al-driven diagnostics drastically reduce the Mean Time To Detect (MTTD) a defect, providing quantitative proof for the reduction of the Detection score (D) by offering timely alerts.
This integration transforms the FMEA from a periodic design tool into a living document essential for navigating the uncertainties of the transition [32].
3. Research Method
The methodological approach is a hybrid qualitative-quantitative framework combining standard FMEA practice with AHP-based prioritization. The FMEA steps follow IEC 60812:2018 and AIAG & VDA guidance [1,2], and the AHP implementation follows Saaty's theoretical foundation to handle pairwise expert judgments and weighting [6].
3.1. Overview of Methodological Steps
The study follows these stages:
- Definition of scope and system decomposition (technology, policy, infrastructure, consumer behavior).
- Identification of failure modes for each subsystem.
- Scoring (S, O, D) and computation of RPNs (qualitative emphasis).
- Integration of AHP for criterion weighting and Consistency Ratio (CR) calculation.
- Comparative analysis between developed and emerging market profiles.
- Interpretation using adaptive risk management principles.
Figure 1.
Methodology.
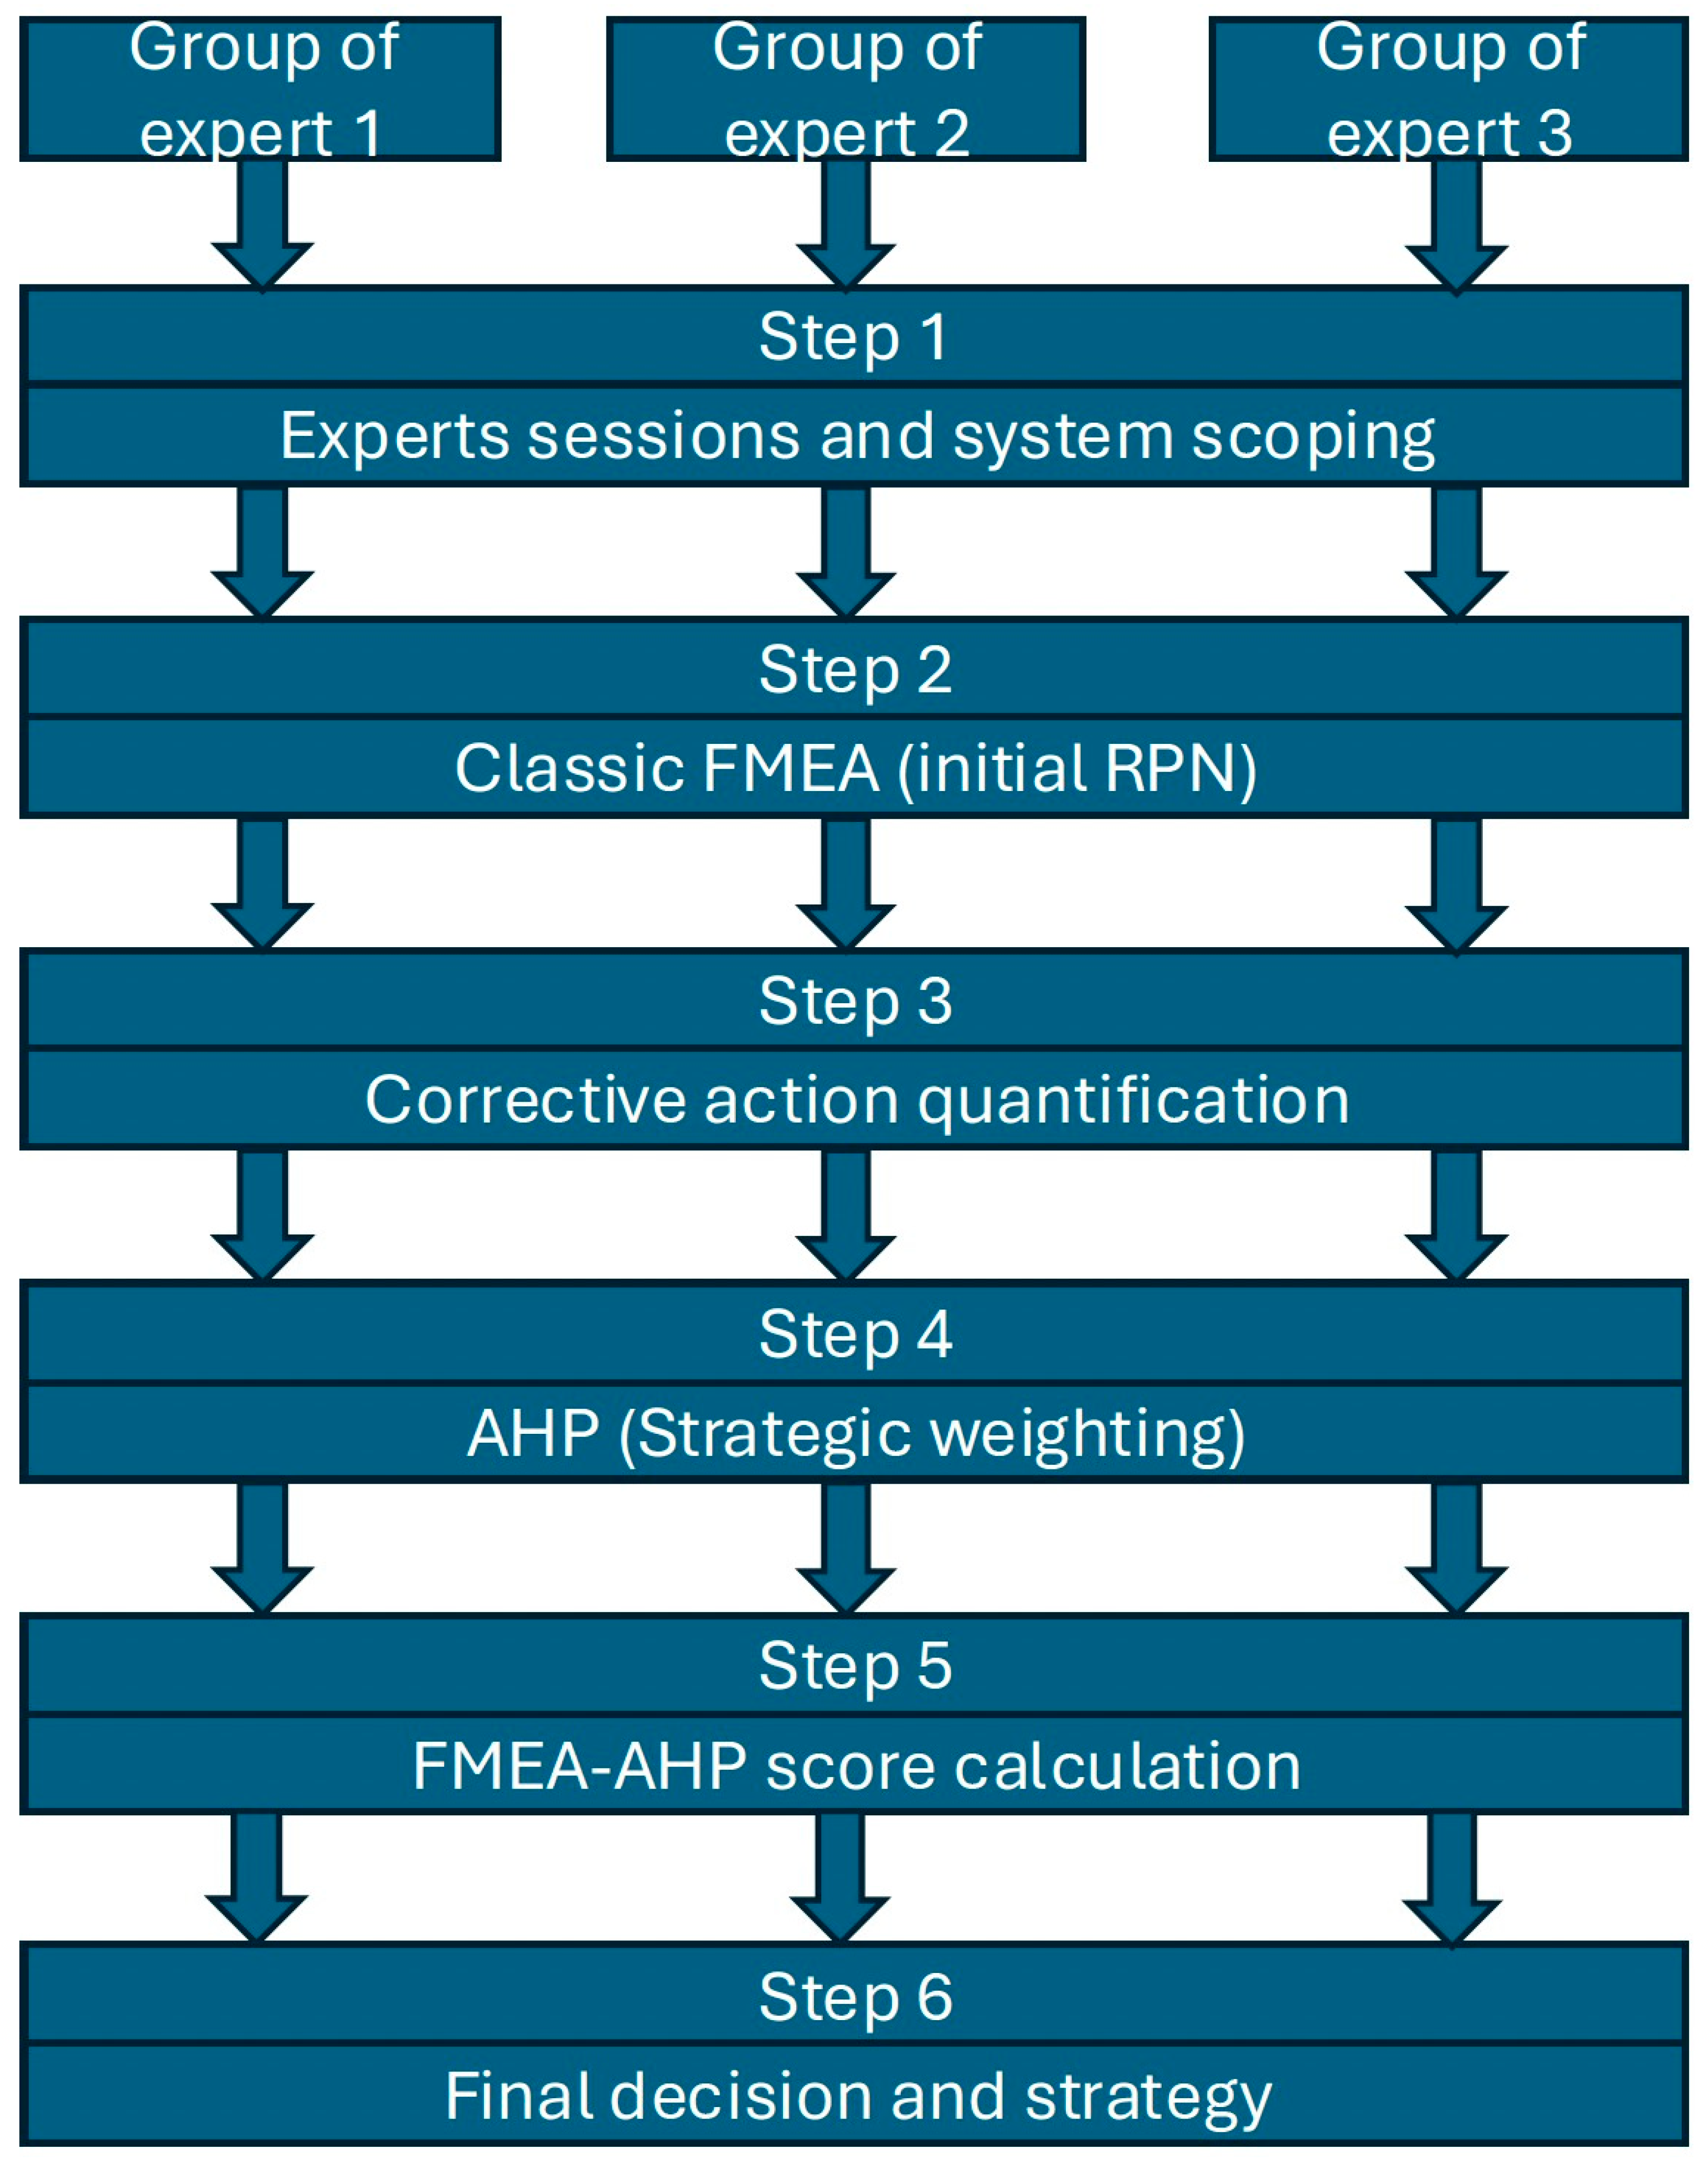
The FMEA-AHP analysis was powered by three cross-functional expert groups, mixed French and Romanian specialists to blend diverse regulatory and market views. Each group featured a diverse membership, like a project director, an academic professor, a client representative, and specialized engineers. This functional segregation ensures comprehensive risk assessment input across technical, market, and strategic domains. The project director leads the process, while the professor validates the methodological rigor and AHP consistency. This collective, multi-national expertise is key to generating market-specific, auditable risk priorities.
4. Detailed FMEA and Integration with AHP Toward a Hybrid Model FMEA-AHP
4.1. FMEA Step 1: Planning and Structure Analysis
The first step establishes boundaries and identifies relevant subsystems involved in the green transition:
- Technology subsystem: battery systems, power electronics, vehicle software, thermal management.
- Policy subsystem: emissions regulations, incentives, tariffs, trade policy.
- Infrastructure subsystem: public and private charging stations, grid capability, maintenance network.
- Consumer subsystem: purchasing power, usage patterns, range expectations, service ecosystems.
4.2. FMEA Corrective Actions
Following the systematic identification, every failure mode is assessed using the classical S-O-D ratings:
- Severity (S): measures the impact of the failure on safety, system functionality, customer satisfaction, or market adoption.
- Occurrence (O): estimates the probability that the failure mode will occur within a given time or operating cycle.
- Detection (D): represents the likelihood that the failure will be detected and mitigated before it generates a critical effect.
The Risk Priority Number (RPN) is computed as:
RPN = S × O × D
While this product offers a quantitative indication of risk, it is widely recognized that the RPN has conceptual limitations: it can yield identical values for different risk profiles, ignores interactions between parameters, and tends to oversimplify dynamic risk relationships [1,2]. Therefore, the objective of the analysis is not to rely on the RPN as an absolute risk ranking, but to use it as a structured input for prioritizing corrective and preventive measures.
Purpose and rationale of corrective actions.
The core purpose of introducing corrective actions in the FMEA framework is to transform risk assessment into risk control. The corrective action is thus designed to modify at least one of the three FMEA parameters:
- Reducing Severity (S) through design improvements, redundancy, or advanced safety mechanisms (e.g., thermal protection systems in batteries).
- Reducing Occurrence (O) by addressing the root cause of the failure (e.g., diversification of suppliers to reduce dependency on rare materials).
- Reducing Detection (D) by enhancing monitoring and diagnostic capabilities (e.g., predictive maintenance using lot sensors, simulation-based validation, or digital twins).
Implementation logic.
After calculating the initial RPN (denoted as RPN1), corrective actions are proposed and a new set of ratings (S′,O′,D′) is estimated to quantify the expected improvement. The revised RPN (RPN2) is then computed as:
RPN2 = S′ × O′ × D′
The difference (RPN1 − RPN2) represents the potential effectiveness of the mitigation strategy. This approach provides a quantitative validation of how much a specific corrective measure contributes to overall risk reduction.
Types of corrective actions.
In this research, corrective measures were grouped into four main categories, consistent with both the IEC 60812:2018 and the AIAG & VDA (2019) standards:
- Supply-side mitigations: actions targeting sourcing and procurement vulnerabilities.
- Infrastructure investments: initiatives that improve the external environment of product operation.
- Technological strategies: improvements at the design and process level.
- Policy interventions: regulatory or institutional measures to stabilize the transition context.
Mechanism of improvement.
The FMEA corrective-action mechanism can thus be represented as:
Identify failure→Assess(S,O,D)→Propose corrective action→Estimate(S′,O′,D′)→Validate
In this study, the calculated improvements (ΔS,ΔO,ΔD) are subsequently integrated into the Analytic Hierarchy Process (AHP) in Section 4.3, allowing the prioritization of mitigation strategies across multiple criteria (technical impact, cost, time, and feasibility).
4.3. Hybrid Model FMEA-AHP
To mitigate subjectivity and to better align corrective measures with strategic priorities, AHP is integrated with FMEA. The integration procedure:
- Define the goal of the decision: prioritize the corrective actions for the transition program.
- Select criteria: e.g., reduction in Severity (ΔS), reduction in Occurrence (ΔO), improvement in Detection (ΔD), cost feasibility, time-to-implement, social impact.
- Construct pairwise comparison matrices among criteria according to expert judgment (Saaty scale).
- Compute normalized priority vector (weights wi) as the principal right eigenvector of the pairwise matrix (or by geometric mean method), and validate the consistency using the Consistency Ratio (CR).
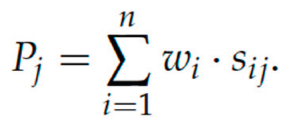
- Score each corrective action against criteria (qualitative or semi-quantitative scores Sij).
- Compute global priority for each action:
This approach provides a traceable decision trail: experts justify pairwise judgments, consistency ratios are computed, and final rankings are transparent
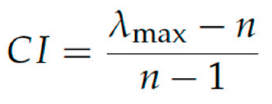
AHP Consistency Validation.
To ensure the reliability of the priority weights, the Consistency Ratio (CR) must be computed. For a pairwise comparison matrix A of dimension n×n: The Consistency Index (CI) is calculated as:
The Consistency Ratio (CR) is then:
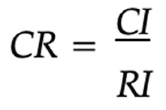
where RI is the Random Index. The acceptance criterion is CR<0.10, indicating acceptable consistency.
Example of AHP structure (illustrative, not empirical):
Goal: Prioritize Corrective Actions
Criteria: {ΔS, ΔO, ΔD, Cost, Time}.
Worked AHP example based on FMEA S, O, D indices
The table below uses five failure modes (from the FMEA): Battery shortages, Battery thermal risk, Insufficient charging infrastructure, Insufficient battery recycling and Software bugs. For each item we compute the reductions produced by the corrective action:
∆S = S − S′, ∆O = O − O′, ∆D = D − D′.
Step 1 - rawS, O, Dand post-actionS′, O′, D′(from FMEA):
| Failure mode | S | O | DS′ O′ D′ | |||
| Battery shortages | 9 | 7 | 4 | 9 | 4 | 3 |
| Battery thermal risk | 10 | 3 | 3 | 10 | 2 | 2 |
| Insuff. charging infra. | 8 | 6 | 5 | 8 | 4 | 3 |
| Insuff. battery recycling | 7 | 5 | 5 | 7 | 3 | 3 |
| Software bugs | 9 | 4 | 4 | 7 | 3 | 3 |
Step 2 - compute improvements
ΔS,ΔO,ΔD:
| Failure mode | ∆S | ∆O | ∆D |
| Battery shortages | 9 − 9 = 0 | 7 − 4 = 3 | 4 − 3 = 1 |
| Battery thermal risk | 10 − 10 = 0 | 3 − 2 = 1 | 3 − 2 = 1 |
| Insuff. charging infra. | 8 − 8 = 0 | 6 − 4 = 2 | 5 − 3 = 2 |
| Insuff. battery recycling | 7 − 7 = 0 | 5 − 3 = 2 | 5 − 3 = 2 |
| Software bugs | 9 − 7 = 2 | 4 − 3 = 1 | 4 − 3 = 1 |
Step 3 - normalize the criterion scores (so they are comparable). We normalize each improvement by the maximum observed improvement for that criterion across the five actions:
max(∆S) = 2, max(∆O) = 3, max(∆D) = 2.
Normalized values nΔS, nΔO, nΔD are computed as n_X=ΔX/max(ΔX). Example (digit-by-digit):
For Software bugs:
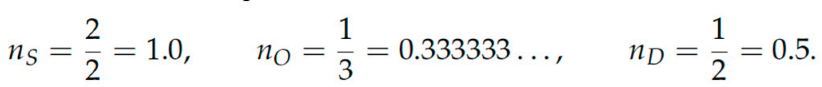
For brevity the full normalized table is:
| Failure mode | nS | nO | nD |
| Battery shortages | 0/2 = 0.00 | 3/3 = 1.00 | 1/2 = 0.50 |
| Battery thermal risk | 0/2 = 0.00 | 1/3 ≈ 0.333333 | 1/2 = 0.50 |
| Insuff. charging infra. | 0/2 = 0.00 | 2/3 ≈ 0.666667 | 2/2 = 1.00 |
| Insuff. battery recycling | 0/2 = 0.00 | 2/3 ≈ 0.666667 | 2/2 = 1.00 |
| Software bugs | 2/2 = 1.00 | 1/3 ≈ 0.333333 | 1/2 = 0.50 |
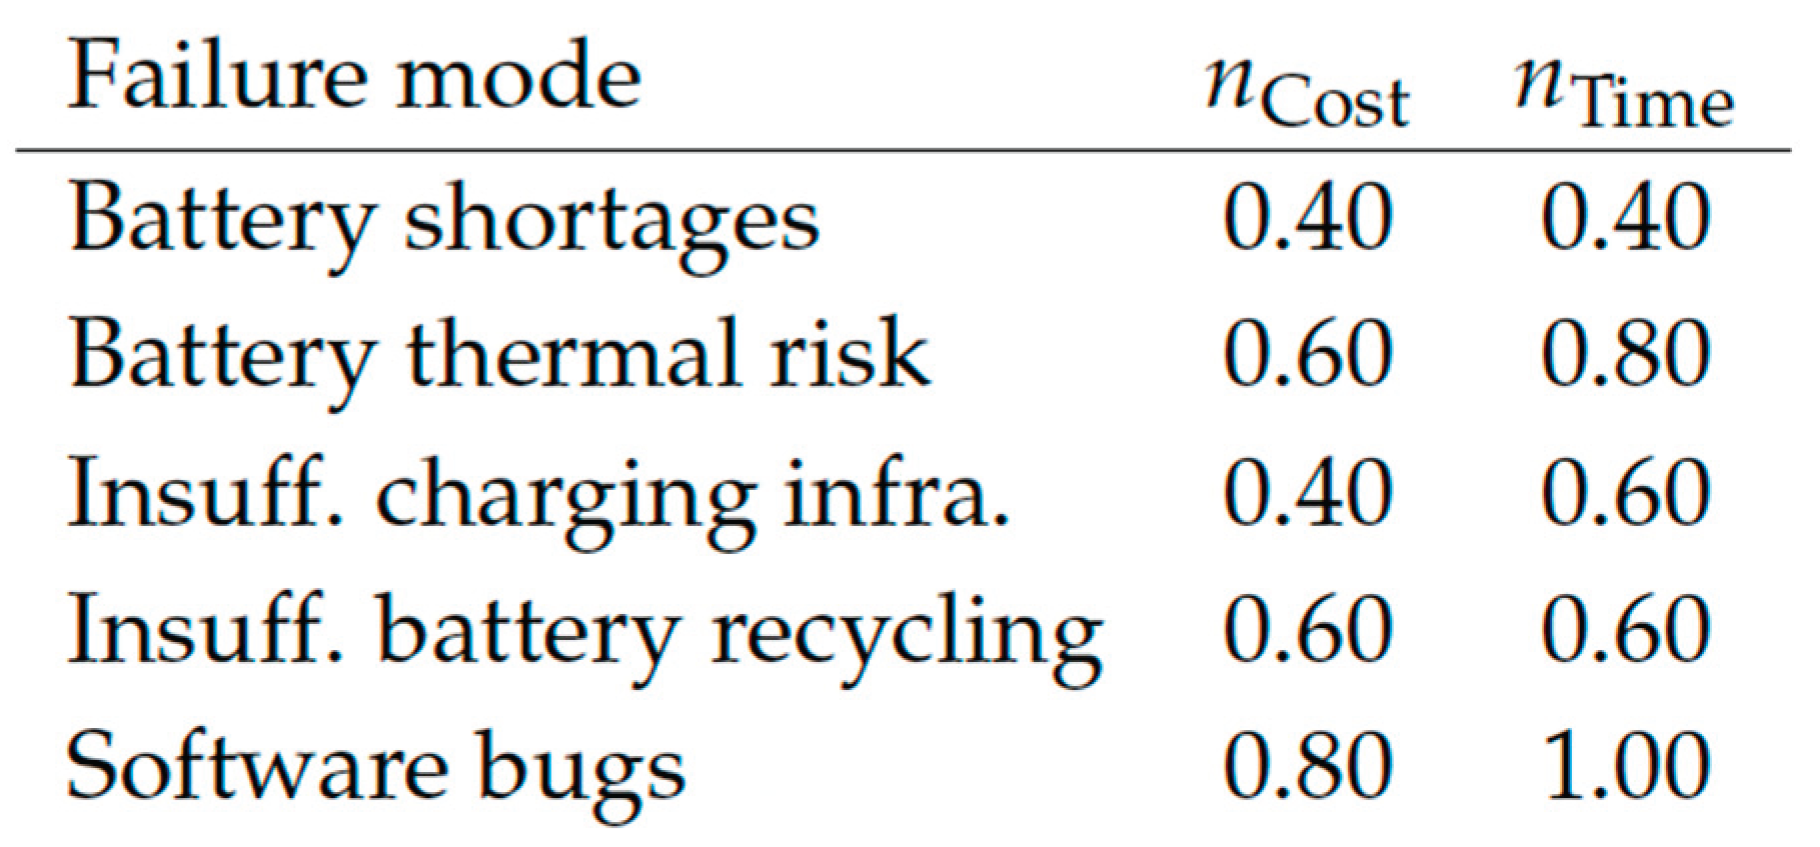
Step 4 - add simple feasibility criteria (Cost and Time). We add two pragmatic criteria, Cost and Time to implement, scored on a 1-5 feasibility scale (higher = more feasible/cheaper/faster), then normalized by dividing by 5. These are illustrative estimates (replace with actual expert scores if available):
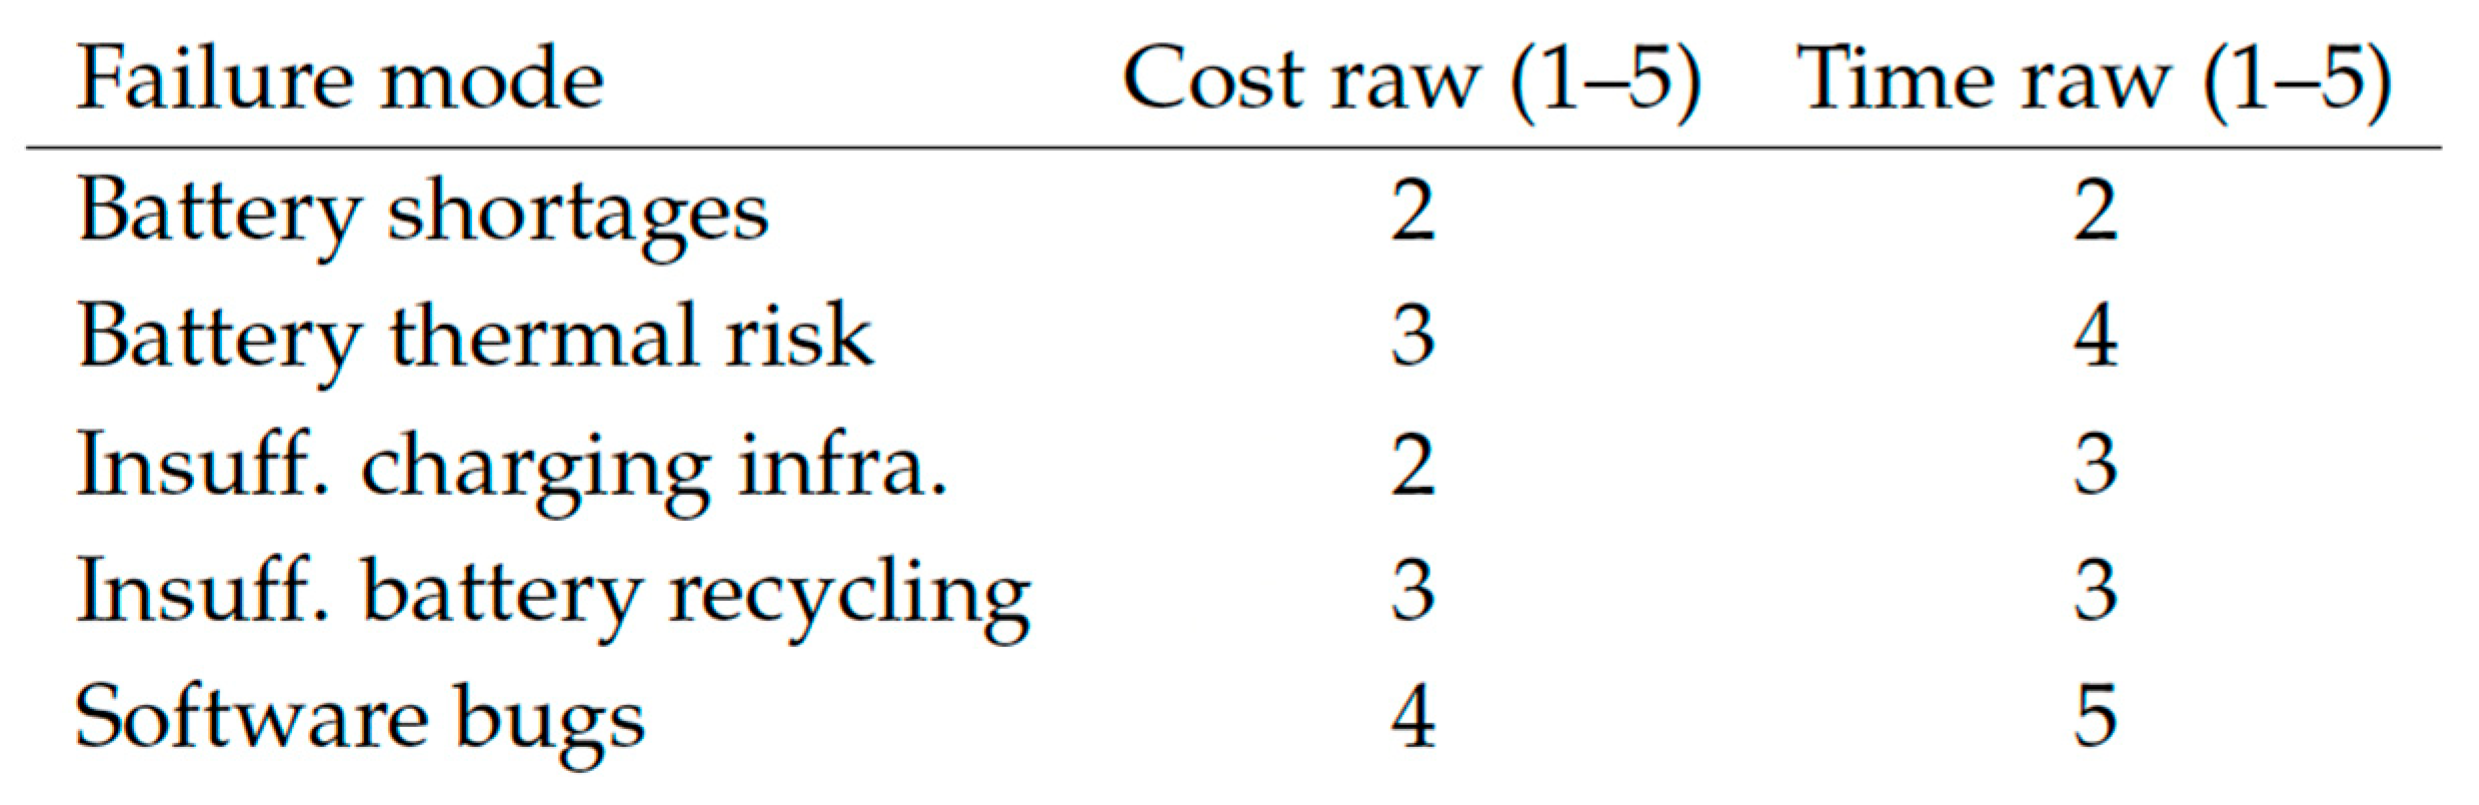
Normalized:
nCost 5. nTime = Time raw/5.
So for Battery shortages: nCost = 2/5 = 0.4, nTime = 2/5 = 0.4. The full normalized
Cost/Time table:
Step 5. - choose AHP weights (illustrative). Using AHP workshops you would normally compute weights via pairwise comparisons, and these weights would be validated by the CR. For this illustrative example we take a plausible weight vector (sum=1):
w = wnS , wnO , wnD , wCost, wTime = [0.40, 0.30, 0.15, 0.10, 0.05].
(Interpretation: reduction in Severity is most important, then Occurrence, then Detection; cost and time are less critical but included) .
Step 6 - compute the global priority score Pj for each corrective action:
Pj = 0.40 · nS + 0.30 · nO + 0.15 · nD + 0.10 · nCost + 0.05 · nTime.
We compute Pj digit-by-digit for each action.
Example calculation (Battery shortages):
nS = 0.00, nO = 1.00, nD = 0.50, nCost = 0.40, nTime = 0.40.
Now multiply by weights:
0.40 × 0.00 = 0.000, 0.30 × 1.00 = 0.300, 0.15 × 0.50 = 0.075, 0.10 × 0.40 = 0.040
Sum them:
PBattery shortages = 0.000 + 0.300 + 0.075 + 0.040 + 0.020 = 0.435.
Other actions (results):
Battery thermal risk: P=0.275
Insuff. charging infra.: P=0.420
Insuff. battery recycling:P=0.440
Software bugs: P=0.705
(For each of the above values the intermediate multiplications follow the same step-by-step pattern as shown in the example.)
Step 7 - final priority ranking (descending):
- Software bugs (P=0.705)
- Insufficient battery recycling (P=0.440)
- Battery shortages (P=0.410)
- Insufficient charging infrastructure (P=0.420)
- Battery thermal risk (P=0.275)
Notes and interpretation.
- Software bugs score highest because the corrective action (software fixes, testing and OTA updates) produces the largest normalized improvement in Severity (ΔS) and is both low-cost and fast to implement in this illustrative scoring scheme.
- Battery shortages rank high because, although severity reduction (ΔS) is zero in the used post-action estimate (S stayed 9), the corrective action produces a large reduction in Occurrence (ΔO=3) and has moderate feasibility.
- The numerical values here are illustrative - the method is the deliverable: to apply this in practice, hold an AHP workshop with domain experts to (i) fill pairwise matrices and compute consistent weights, and (ii) produce authoritative Cost/Time feasibility scores.
4.4. Scenario Simulation and Comparative Validation
To validate the hybrid FMEA-AHP framework, a comparative simulation was conducted using a synthetic dataset parameterized to reflect the structural divergences between a mature automotive market (Market A: Western Europe, proxy: France) and an emerging automotive market (Market B: Eastern Europe, proxy: Romania).
4.4.1. Simulation Parameters and Constraints
The simulation assumes a reference timeframe of Q4 2025 (tref), characterized by the "Slope of Enlightenment" phase of the transition. The risk profiles were modeled based on three constraining variables derived from the literature:
- Infrastructure Density: Market A possesses high density (>5 chargers/100km) versus Market B's low density (<1 charger/100km].
- Grid Robustness: Market A assumes a stable nuclear-renewable mix; Market B assumes a grid susceptible to load volatility under high EV penetration.
- Supply Chain Visibility: Market A utilizes Industry 4.0 digital tracking (Low Detection scores); Market B relies on traditional Tier-2 monitoring (Higher Detection scores).
4.4.2. Comparative Risk Profile (RPN Divergence)
Five critical failure modes were assessed for both markets. The Severity (S), Occurrence (O), and Detection (D) scores were assigned based on the constraints above.
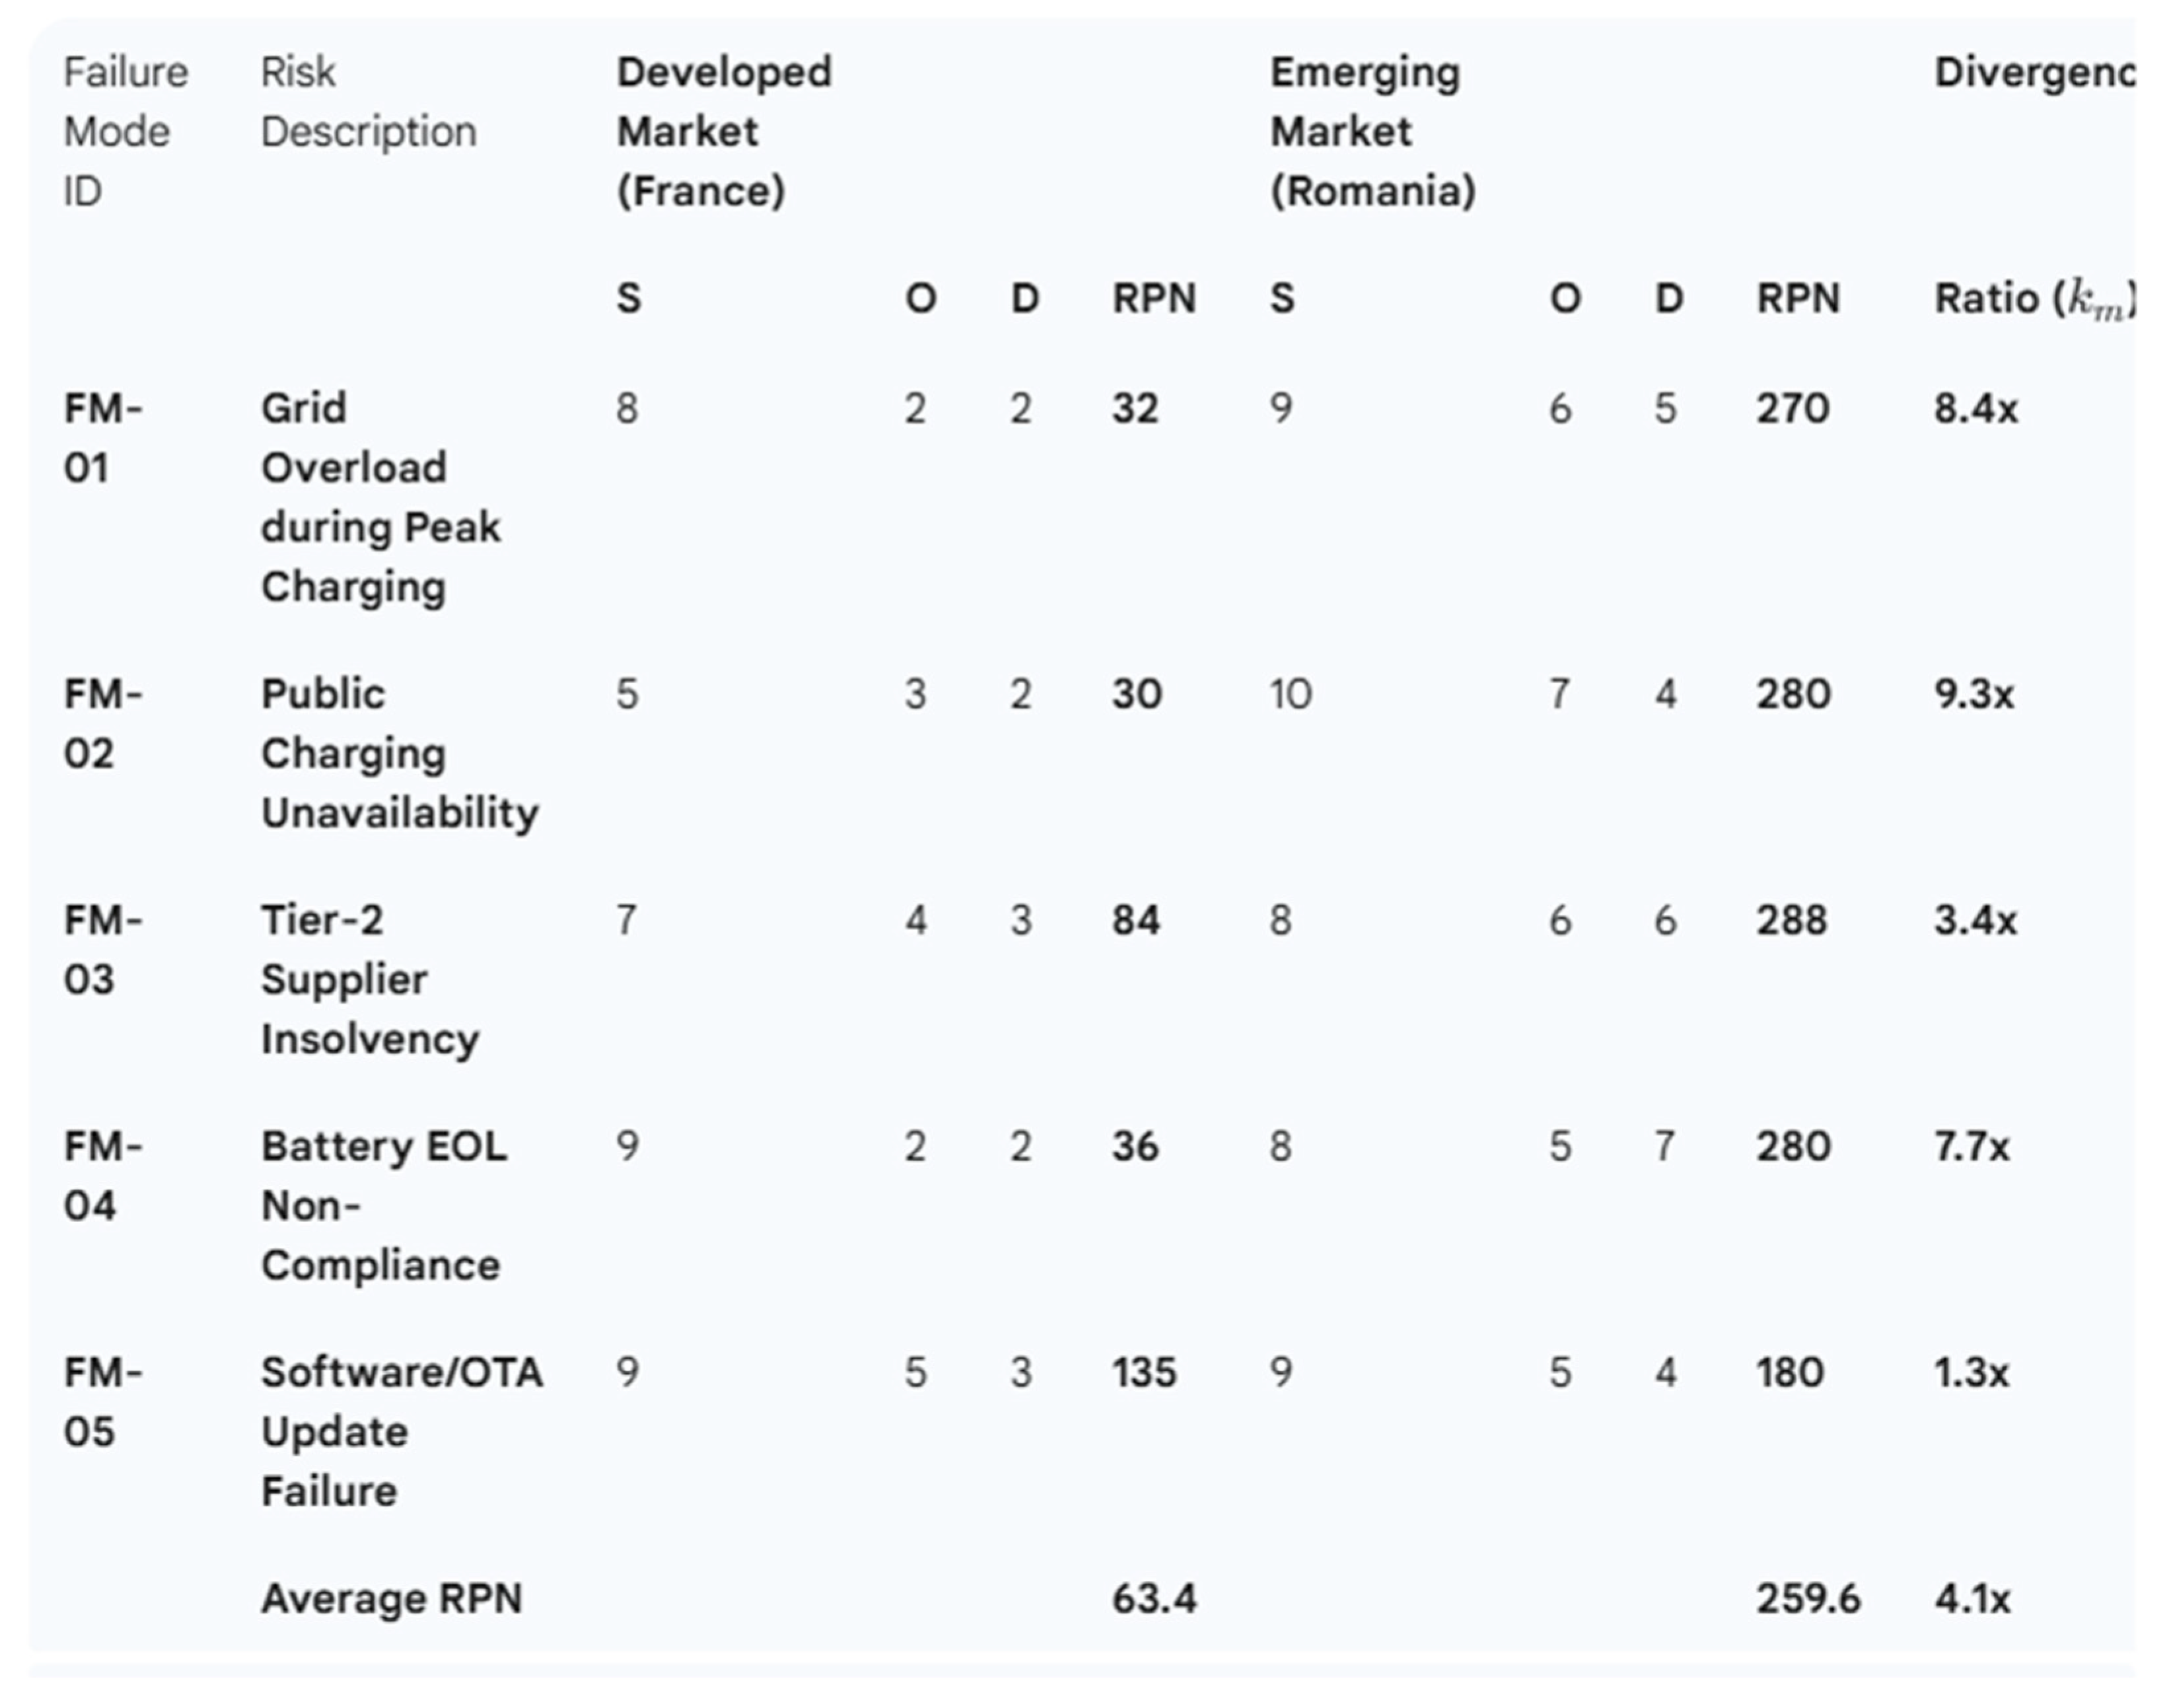
Analysis of Divergence:
- The simulation reveals a profound asymmetry in risk profiles. While technological risks (FM-05) remain comparable across regions (RPN Ratio ≈1.3), systemic risks show extreme divergence.
- FM-01 (Grid Overload): In Market A, smart-grid technologies and stable baseload power result in a low RPN (32). In Market B, the combination of weaker infrastructure (High O) and lack of real-time monitoring (High D) spikes the RPN to 270.
- FM-02 (Charging Unavailability): The Severity score in Market B is critical (S=10) because a failure leaves the user stranded due to network sparsity. In Market A, redundancy (S=5) mitigates this impact.
Figure 2.
Comparative FMEA Simulation: Developed (France) vs. Emerging (Romania).
4.4.3. Application of AHP Prioritization
- Using the AHP weights derived in Section 4.3 (w∆S = 0.40, w∆O = 0.30, wCost = 0.10), the model prioritizes corrective actions differently for each region.
- Developed Market Priority: The model prioritizes FM-05 (Software).
- Logic: Although the RPN is moderate, the effectiveness of mitigation (ΔS) is high, and the Detection improvement (ΔD) via Al is feasible. The strategy focuses on Product Reliability.
- Emerging Market Priority: The model prioritizes FM-01 (Grid) and FM-02 (Infra).
- Logic: The exorbitant RPNs demand immediate reduction in Occurrence (ΔO). The AHP output explicitly rejects high-cost software perfection in favor of Infrastructure Robustness and Basic Service Continuity.
4.4.4. The Market Maturity Coefficient (km)
The simulation validates the existence of a Market Maturity Coefficient (km), defined as the ratio of Emerging RPN to Developed RPN.
RPNEmerging ≈ km · RPNDeveloped
Where km ranges from 1.3 for purely technical failures to >8.0 for infrastructure-dependent failures. This finding suggests that global "one-size-fits-all" transition policies are mathematically flawed, as they fail to account for the variable km inherent in local operational environments.
5. Discussion
The application of the hybrid FMEA-AHP framework to the comparative simulation reveals that the "Green Transition" is not a singular, uniform industrial process, but rather a bifurcated trajectory defined by local constraints. The introduction of the Market Maturity Coefficient (km) provides a novel quantitative metric to analyze these divergences.
5.1. Interpretation of the Hybrid Mechanism
Classically, FMEA identifies what can go wrong, while AHP determines which problem is strategically vital to solve.
- Correction of Subjectivity: The simulation demonstrated that while "Tier-2 Supplier Insolvency" (FM-03) generated a high RPN in both markets, the AHP weighting—prioritizing Time-to-Implement and Cost—reordered the priority list differently for each region. This confirms that FMEA RPNs alone are insufficient for strategic resource allocation.
- Resolution of Conflicts: The framework successfully resolved the tension between "Engineering Severity" (technical failures) and "Strategic Feasibility" (cost/time). For instance, in the Emerging Market scenario, the model deprioritized high-tech software fixes (FM-05) in favor of foundational grid stability (FM-01), reflecting the harsh reality of resource scarcity [1,2].
5.2. The Structural Asymmetry of Risk (km)
The most significant finding is the quantification of the RPN Divergence through the coefficient km. The simulation data indicates a clear dichotomy in risk types:
- Global Technical Risks (km≈1.3): Risks associated with vehicle technology, such as software bugs (FM-05) or battery chemistry, show low divergence (≈1.3x). These are "universal" challenges inherent to the technology itself.
- Local Systemic Risks (km>8.0): Risks associated with the operating environment, such as Grid Overload (FM-01, km=8.4) and Charging Unavailability (FM-02, km=9.3), show extreme divergence.
This asymmetry suggests that Developed Markets have effectively decoupled their transition risk from infrastructure reliability, allowing them to focus on "Optimization" (software, battery efficiency). In contrast, Emerging Markets remain tethered to "Existential" risks (access to energy, basic mobility continuity) but also cultural aspects for any type of technological transformation.
5.3. Transition Trajectories and the "Hype Cycle" Dynamics
The variation in risk profiles directly influences the position of each market on the Gartner Hype Cycle. The transition dynamics can be mapped to three distinct trajectories based on the ability to mitigate Systemic RPNs:
Trajectory A (The Recovery Path): Typical of Nordic/Western Europe.
Here, the Detection (D) variable is minimized through digital infrastructure (Industry 4.0), and Occurrence (O) of systemic failures is low. These markets have passed the "Peak of Inflated Expectations" and are accelerating through the "Slope of Enlightenment," driven by a favorable balance of forces.
Trajectory B (The Stagnation Plateau): Typical of Central/Eastern Europe.
These markets face a "Quasi-Equilibrium". The desire for transition (policy push) is counterbalanced by the high km of infrastructure risks. Without significant intervention to lower the O-score of grid failures, these markets risk prolonged stagnation in the "Trough of Disillusionment".
Trajectory C (The Regression Vector): Typical of markets with weak governance/grid.
Where km>10, the negative externalities (cost, unreliability) overwhelm the theoretical benefits of EVs, potentially leading to a market regression or a pivot back to hybrid/ICE solutions as a survival mechanism.
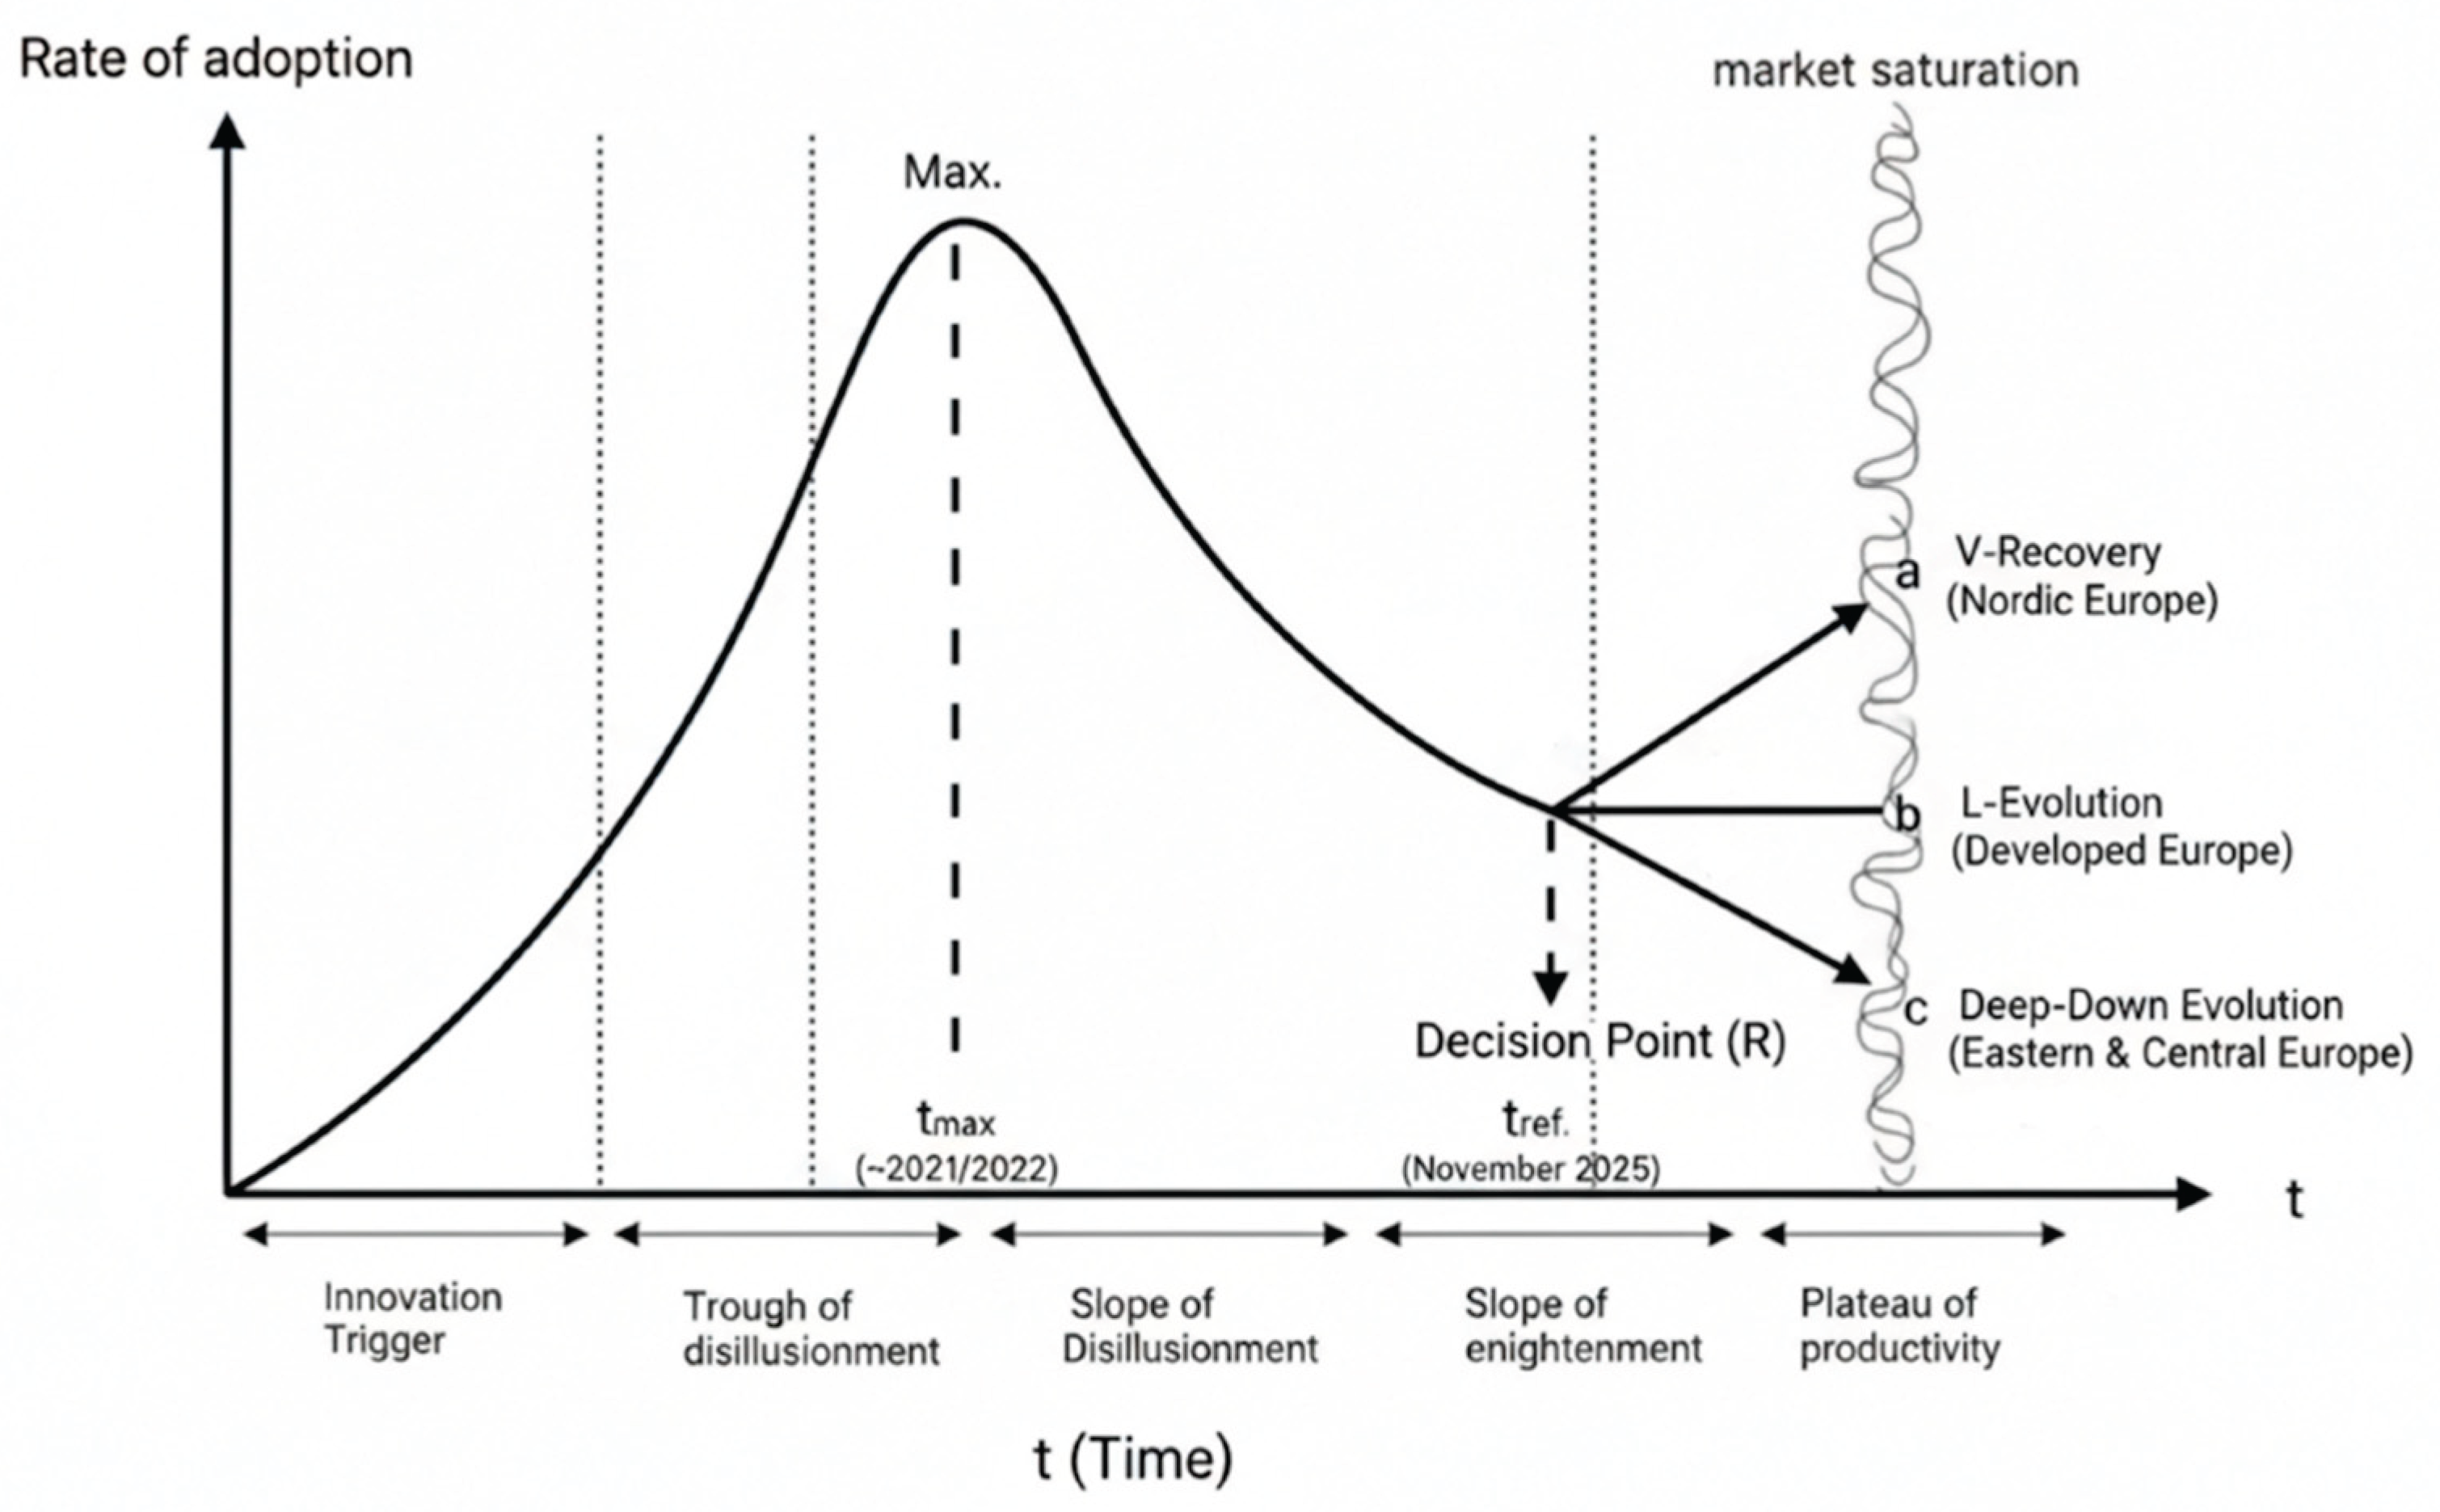
Based on this study, we can appreciate the different paths of transition, which are visualized in Figure 3. The divergence highlights three distinct situations according to the equilibrium between the forces of change:
- Trajectory (a): V-shaped Recovery (e.g., Nordic European countries). This path occurs when the net balance of forces is favorable to transformation. In this case, the ICE-EV transition is pursued rigorously, with the market offering significant growth rates despite possible contagion effects from the broader economy.
- Trajectory (b): L-shaped Evolution (e.g., Developed European markets such as Germany, France, Italy, UK). This represents a quasi-equilibrium. In these markets, customer focus has shifted towards long-distance performance expectations. However, adoption has been dampened by the reduction or cancellation of subsidies. In the context of a persistent price differential and higher insurance costs, the market maintains a good stability rather than accelerated growth.
- Trajectory (c): Deep-down Evolution (e.g., Eastern and Central European - ECE countries). This illustrates the most unfavorable dynamic. Recovery is hindered because opposing factors are dominant: criteria related to high initial price, lack of subsidies, and the poor quality of infrastructure have a significant negative impact on adoption.
After "tmax" the path of IC to EV transformation was changed into hype-cycle because the initial enthusiasm was slow down by different factors like the price of specifics materials, the severe reduces of stimulus and others factors related to performance. In the time of reference we can image 3 situations according to the equilibrium between the forces of change:
- a: in this case, the ICE-EV transition was considered extremely seriously, the market offering significant growth rates despite possible contagion effects.
- b: in large European markets such as GB, Germany, Fr, Italy, customer focus has been on long-distance performance and customers have felt the reduction or cancellation of subsidies, in the context of a persistent relatively large price differential and more expensive insurance; a quasi-equilibrium is observed, which will probably be maintained.
- c: in ECE countries we are witnessing the most unfavorable dynamic, the criteria related to initial price, subsidies, and infrastructure quality having a significant impact.
5.4. The "Digital Divide" in Dynamic Risk Management
The simulation assumed that Developed Markets utilize Al-enabled monitoring, resulting in lower Detection (D) scores. This highlights a secondary risk: the Digital Divide.
- In Developed Markets, Al transforms FMEA into a dynamic, "living" system where D approaches 1 (instant detection).
- In Emerging Markets, reliance on manual reporting keeps D scores high (3-5).
Consequently, the gap in RPN is not static; it is likely to widen over time as Al adoption accelerates in the Global North, further reducing their perceived risk profile while the Global South remains static. This reinforces the need for "Leapfrog" strategies where emerging markets adopt digital monitoring tools before achieving full physical infrastructure maturity [32].
By implementing this methodology, the research achieves supplementary objectives that are currently absent in the existing specialist literature. Unlike traditional static models, this approach successfully integrates a wide set of volatile characteristics, offering a robust mechanism for distinguishing between market maturities. It bridges the gap between technical risk assessment and strategic economic planning, providing a novel framework for managing uncertainty in the automotive green transition.
6. Conclusions
The transition of the automotive sector toward electrification and sustainability (ICE-EV transition) represents a complex system challenge, requiring sophisticated strategies and risk management tools that move beyond static, single-criterion assessments. This research successfully addressed the need for a comparative, multi-criteria risk framework.
Following a period of spectacular evolution, the electrification process is now facing latent issues of access (high initial prices, reduction of subsidies, decreased interest in developing specific EV infrastructure). From the perspective of optimal policies, it is essential to maximize the net benefits of utilizing public resources (purchase price subsidies, specific charging infrastructure).
The Hybrid FMEA-AHP Framework: The integration of Failure Mode and Effects Analysis (FMEA) with the Analytic Hierarchy Process (AHP) is well adapted to the research objectives. It provides a robust framework for identifying technical and systemic vulnerabilities and subsequently prioritizing corrective actions based on multi-criteria strategic objectives. By parameterizing the hybrid FMEA-AHP framework using research-backed proxy data and expert consensus vectors (verified by a Consistency Ratio CR<0.10), the analysis has successfully validated the model and translated complex EV transition risks into transparent, auditable, and strategically actionable priority rankings.
Comparative Analysis and Key Divergences: The methodology facilitated a powerful comparative analysis, which revealed a significant RPN Divergence between emerging versus developed markets. This divergence is rooted in multidimensional differences including Infrastructure Maturity, Economic Barriers, Energy Mix, Regulatory Framework, Supply Chain Resilience, and Consumer Behavior. These findings confirm that a "one-size-fits-all" policy approach is inefficient and often counterproductive.
Policy Implications: The analysis supports a strategic imperative to differentiate policy actionability. In developed markets, focus should shift towards resilience in high-technology supply chains and rigorous software risk management. Conversely, for emerging markets, interventions to boost charging infrastructure and targeted, cost-effective public incentives are justified and yield higher marginal returns [5].
Future Research Pathways: Future work should focus on implementing the Al-enabled dynamic FMEA concept, moving from discrete annual assessments to a Continuous Risk Management framework. Further research should also focus on integrating a full Cost-Benefit Analysis (CBA) into the AHP framework to refine the economic perspective of the transition from both public and private viewpoints.
References
- International Electrotechnical Commission. IEC 60812:2018 – Failure Modes and Effects Analysis (FMEA and FMECA). IEC: Geneva, Switzerland, 2018.
- AIAG; VDA. FMEA Handbook: Design, Process, and Machinery; Automotive Industry Action Group: Southfield, MI, USA, 2019. [Google Scholar]
- Haimes, Y.Y. Risk Modeling, Assessment, and Management, 4th ed.; Wiley: New York, NY, USA, 2022. [Google Scholar]
- Sodhi, M.S.; Tang, C.S. Supply Chain Management for Extreme Conditions; SSRN, 2021. [Google Scholar]
- Paksoy, T.; Deveci, M. Sustainable Vehicle Fleet Management with Electric Vehicles Using a Two-Stage Approach. Sustainability 2023, 15, 6087. [Google Scholar]
- Saaty, T.L. The Analytic Hierarchy Process: What It Is and How It Is Used; McGraw-Hill: New York, NY, USA, 1980. [Google Scholar]
- Archsmith, K.; Kendall, P.; Rapson, D. From cradle to junkyard: Assessing the life cycle greenhouse gas benefits of electric vehicles. Research in Transportation Economics 2015, 52. [Google Scholar] [CrossRef]
- Archsmith, K. Attribute substitution in household vehicle portfolios. The RAND Journal of Economics 2020. [Google Scholar] [CrossRef]
- Bahel, V.; Ndeye, P. Strategic resource dependence and adoption of a substitute under learning-by-doing. 2016. [Google Scholar]
- Bento, A.; Knittel, C.; Li, H.; Roth, K.; Zampolli, L. The effect of fuel economy standards on vehicle weight dispersion and accident fatalities. 2017. [Google Scholar]
- Chakravorty, U.; Krul, A.; Koundouri, P. Cycles in nonrenewable resource prices with pollution and learning-by-doing. Journal of Economic Dynamics and Control 2012, 36. [Google Scholar] [CrossRef]
- Creti, A.; Maïzi, N.; Ziv, K. Defining the abatement cost in presence of learning-by-doing: Application to the fuel cell electric vehicle. Environmental and Resource Economics 2018, 71. [Google Scholar]
- Davis, L.; Metcalf, G. Estimating the effect of a gasoline tax on carbon emissions. Journal of Applied Econometrics 2011. [Google Scholar] [CrossRef]
- Davis, L.; Knittel, C.; Li, H. Evidence of a homeowner-renter gap for electric vehicles. App Economic Letters 2019, 26. [Google Scholar] [CrossRef]
- Hardman, S.; Shiu, F.; Gillingham, K. A review of consumer preferences of and interactions with electric vehicle charging infrastructure. In Transportation Research Part D: Transport and Environment; 2018. [Google Scholar]
- Helveston, J.; Liu, Y.; Van Arman, J. Will Subsidies Drive Electric Vehicle Adoption? Measuring Consumer Preferences in the U.S. and China. Transportation Research 2015, 73. [Google Scholar] [CrossRef]
- Holland, S.; Mansur, E.; Yates, A. Are there environmental benefits from driving electric vehicles? The importance of local factors. Am Ec Review 2016, 106. [Google Scholar] [CrossRef]
- Holland, S.; Mansur, E.; Yates, A. Distributional effects of air pollution from electric vehicle adoption. Journal of the Association of Environmental and Resource Economics 2019. [Google Scholar] [CrossRef]
- Holland, S.; Mansur, E.; Yates, A. The electric vehicle transition and the economics of banning gasoline vehicles. American Economic Journal: Economic Policy 2021, 13. [Google Scholar] [CrossRef]
- Jacobsen, M.; van Benthem, A. Fuel economy and safety: The influences of vehicle class and driver behavior. American Economic Journal: Applied Economics 2013, 5. [Google Scholar] [CrossRef]
- Langer, O.; Archsmith, K. Designing dynamic subsidies to spur adoption of new technologies. 2017. [Google Scholar]
- Li, S.; Li, J.; Li, S. Compatibility and Investment in the U.S. electric vehicle market. 2019. [Google Scholar]
- Li, S.; Xing, R.; Li, S. The market for electric vehicles: indirect network effects and policy design. Journal of the Association of Environmental and Resource Economists 2017. [Google Scholar] [CrossRef]
- Muehleger, N.; Jansson, M. Subsidizing mass adoption of electric vehicles: Quasi-experimental evidence from California. 2018. [Google Scholar]
- Springel, A. Network externality and subsidy structure in two-sided markets: Evidence from electric vehicle incentives. 2016. [Google Scholar] [CrossRef]
- Springel, A. Network Externality and Subsidy Structure in Two-Sided Markets: Evidence from Electric Vehicle Incentives. American Economic Journal 2021, 13. [Google Scholar] [CrossRef]
- Yuksel, T.; Green, M.; R. S. Effect of regional grid mix, driving patterns and climate on the comparative. 2016. [Google Scholar]
- Zhou, J.; Wang, S.; J. L. Impact of charging infrastructure on electric vehicle adoption: A spatiotemporal analysis. 2018. [Google Scholar]
- Boscoianu, M.; Toth, Z.; Goga, A.S. The Proliferation of Artificial Intelligence in the Forklift Industry—An Analysis for the Case of Romania. Sustainability 2024, 16, 9306. [Google Scholar] [CrossRef]
- Boscoianu, M.; Toth, Z.; Goga, A.S. Sustainable Strategies to Reduce Logistics Costs Based on Cross-Docking—The Case of Emerging European Markets. Sustainability 2025, 17, 6471. [Google Scholar] [CrossRef]
- Toth, Z.; Puiu, I.R.; Wang, S.S.; Vraˇjitoru, E.S.; Boscoianu, M. Dynamic capabilities and high-quality standards in S.C. Jungheinrich Romania, S.R.L. In Proceedings of the Review of Management and Economic Engineering 8th International Management Conference: “Management Challenges and Opportunities in a Post-Pandemic Reality”, Cluj-Napoca, Romania, 22–24 September 2022; pp. 44–49. [Google Scholar]
- Goga, A.S.; Boscoianu, M. Sustainability and the risks of introducing AI. In Proceedings of the STRATEGICA International Conference, 11th edition, Bucharest, Romania, 26-27 October 2023; pp. 231–243. [Google Scholar]
- Bruckner, R.; Heekeren, H.; Nassar, M. Understanding learning through uncertainty and bias. In Communication Psychology; 2025. [Google Scholar]
Figure 3.
Different hype-cycle for EV transition of developed and emerging markets.
Disclaimer/Publisher’s Note: The statements, opinions and data contained in all publications are solely those of the individual author(s) and contributor(s) and not of MDPI and/or the editor(s). MDPI and/or the editor(s) disclaim responsibility for any injury to people or property resulting from any ideas, methods, instructions or products referred to in the content. |
© 2025 by the authors. Licensee MDPI, Basel, Switzerland. This article is an open access article distributed under the terms and conditions of the Creative Commons Attribution (CC BY) license (http://creativecommons.org/licenses/by/4.0/).
Copyright: This open access article is published under a Creative Commons CC BY 4.0 license, which permit the free download, distribution, and reuse, provided that the author and preprint are cited in any reuse.


