Submitted:
19 December 2025
Posted:
22 December 2025
You are already at the latest version
Abstract
Small molecules either derived from cell metabolic reactions or produced by gut bacterial flora have shown the potential of affecting gene expression, which suggests the possibility of interactions able to modulate cellular functions. In this context, the reported experi-ments were aimed at verifying a possible interplay between lactate and butyrate in modu-lating the efficacy of antineoplastic drugs. Butyrate is a product of gut bacterial flora, shown to be endowed with anticancer properties; conversely, increased lactate levels in cancer cells were found to be associated with higher proliferation and drug resistance. For the reported experiments, we adopted two cell cultures from clinically relevant, but dif-ferent cancer forms: pancreatic and triple-negative mammary adenocarcinomas. In spite of their different tissue origin, the two cell cultures appeared to similarly respond to the effects of the two metabolites, which were found to modulate in opposite ways the expres-sion of key genes involved in DNA repair by homologous recombination. As a conse-quence, changed efficacy of this repair pathway and modified response to PARP inhibi-tors were observed. Notably, our results also suggest that the counteracting effect between these two metabolites may be leveraged to address additional challenges limiting the suc-cess of anticancer therapies.
Keywords:
lactate
; butyrate
; cancer cells
; DNA repair
; homologous recombination
1. Introduction
Ever increasing evidences suggest that cell metabolic pathways can give rise to small molecules endowed with regulatory properties on gene expression [1,2]. The modulation of cellular functions operated by these metabolites is believed to be useful in helping adaptation to changes in microenvironment, resulting in improved cellular functions.
In this context, some recent studies by our research group contributed to highlight the role of lactate in working as a signaling molecule in cancer cells [3,4,5,6]. As well known, neoplastic change is characterized by highly upregulated glucose uptake and glycolysis, resulting in substantially increased lactate production (the so-called Warburg effect) [7]. This metabolite was found to induce histones’ hyperacetylation and/or lactylation, two epigenetic changes leading to increased DNA transcription [8,9]. We showed that the enhanced lactate levels which characterize neoplastic tissues can be involved in the reduced efficacy of commonly used antineoplastic agents [5,6], also favoring the onset of drug resistance [3,4]. Coherently with the role of the upregulated glycolytic metabolism observed in embryonic tissues, in cancer cells this metabolite was also found to promote cell proliferation and infiltrative growth [10].
It can be hypothesized that the cell-intrinsic regulatory mechanism linked to metabolic reactions could be modified by the interaction with molecular species of external origin, such as those derived from the individual microbiota. The possibility that microbial interactions linked to dietary habits could impact on carcinogenesis and on the therapeutic response of cancer cells is an actively debated question, not only related to neoplasms arising in the digestive tract [11].
Butyrate is one of the main metabolites derived from gut bacterial fermentation and has been recognized to play a major role in the microbiota-associated anticancer benefits [12]. The molecular mechanisms involved in the antineoplastic effects of butyrate are different, but they can be mainly attributed to histone deacetylases (HDAC) inhibition [13]. The increased histone acetylation induced by butyrate was found to be correlated with cell cycle arrest (caused by the reduced expression of the cell-cycle related genes) and with apoptosis induction (linked to the reduced expression of the bcl-2 family genes) [14,15]. Interestingly, this molecule was also shown to impact on cell metabolic regulation [16]. In butyrate-exposed cancer cells, improved mitochondrial function and oxidative metabolism were observed; these effects were found to be linked to the inhibition of glucose transporter-1 expression [17] and to the activated hexokinase activity [18]. Additionally, in HeLa and HepG2 cultures butyrate was found to cause sirtuin-3 inhibition, leading to activation of the pyruvate dehydrogenase complex and to reversion of the Warburg effect [19].
These observations led us to explore whether the modulation of gene expression induced by this metabolite could potentially counteract some of the epigenetic effects linked to the increased lactate levels characterizing cancer cells, which could give a further mechanistic explanation of the anticancer effects of butyrate.
To test this hypothesis, we used two human neoplastic cell cultures, representative of clinically relevant tumor forms: the pancreatic adenocarcinoma BxPC-3 and the triple-negative breast adenocarcinoma MDA-MB-231. In previous experiments, we had already observed that in BxPC-3 cultures the expression of some proteins involved the homologous recombination pathway was related to LDH activity [20]; in addition, a study performed on MDA-MB-231 cells highlighted that increased lactate levels can lead to EGFR pathway activation via HB-EGF, and can promote infiltrative growth [6].
2. Results
2.1. Butyrate Reduces Lactate Production and Histone-3 Lactylation in Both BxPC-3 and MDA-MB-231 Cultures
The two selected cell cultures are representative of clinically relevant neoplastic diseases and were considered interesting models for the study because of their opposite features relative to lactate production and/or release. As also shown in our preliminary experiments (see Figure 1), BxPC-3 cells display an over-activated glycolytic metabolism [21], resulting in a high-level lactate production and release. On the contrary, and despite their increased glucose uptake [22], MDA-MB-231 cultures appear to release less lactate. This difference can be explained by the high pyruvate carboxylase activity of MDA-MB-231 cells [23]. Pyruvate carboxylase converts pyruvate to oxalacetate, which is rapidly consumed by the TCA cycle for sustaining cell biosynthetic reactions. For this reason, the pyruvate carboxylase reaction is essentially not reversible and, as a consequence, the generation of lactate by LDH is compromised.
This feature allowed to artificially expose MDA-MB-231 cultures to increased lactate levels for the identification of genes responsive to the lactate-induced epigenetic changes [6]. To this aim, we preliminary exposed the selected cell cultures to scalar doses of butyrate for 72 h, to identify the highest dose of compound compatible with cell viability. This experiment was performed in both cultures maintained in their conventional medium and in MDA-MB-231 cells preliminarily exposed to lactate (20 mM for 72 h, Lac-MDA-MB-231). 20 mM lactate is in line with the metabolite level detected in the microenvironment of cancer tissues [24] and, in previous experiments, it was found to induce gene expression changes [6].
Results (Figure 1A) showed that in all the three cultures no statistically significant effects on cell proliferation were observed for butyrate doses ≤ 1 mM. In MDA-MB-231 cultures, 2 mM butyrate appeared to reduce cell proliferation by 20%; interestingly, this effect was found to be completely eliminated by the 20 mM lactate exposure before butyrate treatment (Lac-MDA-MB-231). This result is in agreement with previous published data suggesting a proliferative advantage awarded by lactate in cell cultures [4].
An immunoblotting evaluation of PUMA protein in both BxPC-3 and MDA-MB-231 cells exposed to 1 mM butyrate for 72 h (also shown in Figure 1A) allowed to exclude apoptosis induction and confirmed the complete tolerability of 1 mM butyrate for the two cultures.
The data of Figure 1B show that, as previously anticipated, untreated BxPC-3 cells can release in medium a lactate concentration about 2-fold higher than that released by MDA-MB-231 cultures; although devoid of antiproliferative effects, 1 mM butyrate significantly reduced lactate levels in both cultures, suggesting that this dose of metabolite can induce a metabolic rewiring characterized by glycolysis inhibition.
As well known, one of the molecular mechanisms underlying the changes in gene expression induced by lactate is histone lactylation. Figure 1C shows that, when administered for 72 h, 1 mM butyrate caused in both cell cultures a statistically significant reduction of histone-3 lactylation (≈ 25% and ≈ 60% in BxPC-3 and MDA-MB-231 cultures, respectively).
This observation is in line with the idea that some lactate-induced epigenetic changes could be reversed by butyrate.
2.2. Butyrate and Lactate Modify in Opposite Ways Cisplatin Antineoplastic Effect
In previous studies butyrate was shown to increase the effects of different antineoplastic agents [25,26], while enhanced glycolysis and lactate production in cancer cells is a well-recognized marker of poor drug response [3,4,5,27]. Preliminarily, to explore the potential of butyrate in reversing the lactate-induced effects, we estimated the DNA damage signatures caused by cisplatin (CDDP) in cell cultures exposed to the two metabolites. Cells were treated with 10 μM CDDP for 18 h, after which DNA damage was assessed by an immunoblotting evaluation of γ-H2AX, a marker of DNA double strand breaks (DSBs) [28].
Figure 2A shows that in BxPC-3 cells exposed to butyrate, DNA DSBs signatures caused by CDDP were remarkably increased; a less striking, but statistically significant effect was also observed in MDA-MB-231 cultures (Figure 2B). Interestingly, when MDA-MB-231 cells were exposed to 20 mM lactate before CDDP treatment, the CDDP-induced DSBs evidenced by γ-H2AX labeling were significantly reduced. The effects observed at the level of DNA damage were confirmed by the results of viability experiments. As shown in Figure 2C, in both cell cultures the antiproliferative effect of 5 μM CDDP was significantly increased by butyrate administration (p < 0.01 in both cell lines). This result was also observed in Lac-MDA-MB-231 which, in agreement with previous observations [3], proved to be less susceptible to the antineoplastic action of the drug. These preliminary observations suggested that the two metabolites (butyrate and lactate) can modulate in opposite ways cell response to agents causing DNA damage and, specifically, to agents causing DSBs.
2.3. Butyrate and Lactate Can Differently Affect the Expression of Genes Involved in DNA Repair by Homologous Recombination
To proceed with our experiments, we referred to some previous data obtained in BxPC-3 [20] and MDA-MB-231 [6] cultures.
A preliminary study in BxPC-3 cells suggested that homologous recombination (HR) mediated repair is under the control of LDH activity. The reported experiments allowed to conclude that this correlation is not linked to the enzymatic function of LDH in glycolytic flux and in ATP generation, as required for DNA repair.
More recently, in MDA-MB-231 cultures we evidenced that exposure to 20 mM lactate leads to increased expression and release of urokinase-type plasminogen activator (uPA), a protease leading to HB-EGF release and consequent EGFR pathway activation. Interestingly, BxPC-3 is one of the cell cultures for which HB-EGF-mediated EGFR pathway activation has also been described [29]. In MDA-MB-231 cells, we also showed that the 20 mM lactate exposure leads to increased gene transcription and protein level of the G-Protein Coupled Estrogen Receptor 1 (GPER1), for which a role in DNA damage repair via HR was well documented [30,31,32].
Based on these premises, our study proceeded with the evaluation of the effects caused by butyrate and/or lactate on the expression of the three major players of HR-mediated repair (RAD51, BRCA1, BRCA2), of uPA and GPER1. For this experiment, cultures were preliminary exposed to 1 mM butyrate and/or 20 mM lactate for 72 h. The obtained results are shown in Figure 3 and Figure 4 for BxPC-3 and MDA-MB-231 cells, respectively. The bar graph in Figure 3A shows that in BxPC-3 cells exposure to 1mM butyrate significantly reduced the expression of the HR related genes, whereas no effect was observed concerning uPA expression. The observed effects reached the level of statistical significance with p < 0.05 for RAD51, BRCA2 and GPER1. Interestingly, superimposable results were observed in these cells when the butyrate treatment was replaced with a 16-h exposure to 20 mM oxamate (OXA), a well-studied LDH inhibitor [33]. In previous experiments performed on BxPC-3 cultures, a similar exposure to OXA was found to markedly reduce lactate production (≈70% inhibition) without affecting cell viability [20]. These data suggest that the reduced expression of HR genes observed in butyrate-exposed BxPC-3 cells can be explained by the above-described metabolic rewiring induced by this metabolite, characterized by glycolysis inhibition and reduced lactate production (see Figure 1).
The results of Figure 3A also suggest that, contrary to what previously observed in MDA-MB-231 cells (see [6] and below), uPA expression in BxPC-3 culture is not up-regulated by lactate, since the mRNA level of this protein appeared to be even increased by OXA exposure. For this reason, uPA protein was not considered for further analysis.
The immunoblotting evaluation of the HR proteins (Figure 3B) substantially confirmed the picture observed in the RT-PCR experiment shown in Figure 3A. In this experiment, all the observed effects reached the level of statistical significance, with p < 0.01 (RAD51 and BRCA1) and p < 0.05 (BRCA2 and GPER1). It is worth noting that, with the exception of GPER1 protein, the reduction of RAD51, BRCA1 and BRCA2 protein levels appeared to be even increased, when compared to the effects observed at the mRNA level. This result could be linked to the antiproliferative effect of butyrate [19], causing compromised mRNA translation of proteins mainly linked to cell cycle progression.
Similar experiments were also performed on the MDA-MB-231 culture. As stated above (paragraph 3.1), the metabolic characteristics of these cells allowed to explore the effect on gene expression caused not only by butyrate, but also by increased lactate levels and by the association of the two metabolites. The results of the RT-PCR experiments are reported in Figure 4A.
The bar graph shows that RAD51 expression was not significantly affected by lactate but, similarly to what observed in BxPC-3 cells, butyrate exposure caused a ≈30% reduction of the RAD51 mRNA level (p < 0.01); lactate co-administration partially counteracted the effect of butyrate, causing a less marked reduction of RAD51 (p < 0.05). Figure 4A also shows that the single butyrate treatment did not significantly affect the expression of BRCA1, BRCA2 and uPA, while statistically significant mRNAs’ upregulations were caused by lactate exposure (30-37% increased expressions, with p < 0.05-0.01). In the case of BRCA1 and BRCA2 these effects were found to be reduced by the butyrate coadministration and, in samples receiving the combined butyrate/lactate treatment, the mRNA expression of both genes did not show statistically significant changes compared to control cultures. Similarly to what observed in BxPC-3 cultures, butyrate appeared to strengthen the effect of lactate in increasing the mRNA level of uPA, and this gene was not considered for further experiments. Finally, butyrate was found to significantly reduce GPER1 expression (p < 0.05) and to almost completely abolish the lactate-induced up-regulation of this gene. The differences observed at the RNA levels were then confirmed by the immunoblotting evaluation. In agreement with the RT-PCR data, RAD51 protein level was not increased by lactate and was significantly reduced by butyrate exposure (p < 0.05). A significantly increased protein level was caused by lactate for BRCA1, BRCA2 and GPER1 (p < 0.05). In agreement with the RT-PCR data, these effects were counteracted by butyrate coadministration, which caused 30-45% reduced protein levels (p < 0.05 vs control, untreated cells); interestingly, in samples exposed to the metabolites’ combination, the effect of butyrate appeared to prevail over the lactate-induced upregulations.
Taken together, the results obtained in BxPC-3 and MDA-MB-231 cultures suggested that, because of their opposite effects on the expression genes involved in HR (BRCA1, BRCA2 and GPER1), the two considered metabolite could play a role in modulating this DNA repair mechanism.
2.4. The Gene Expression Changes Induced by Lactate and Butyrate Modify HR Efficiency
To verify whether the observed changes in protein levels might affect HR efficiency, we adopted an RT-PCR based assay, requiring cell transfection with a couple of specifically designed plasmids. In the transfected cells, these plasmids operate a recombination process by exploiting the cell molecular machinery involved in HR-mediated DNA repair. This assay was repeatedly adopted by the authors in experiments aimed at assessing the power of small-molecule inhibitors of HR, and proved to be a reliable tool to evaluate HR proficiency in different cell cultures [34,35,36,37,38]. Results are shown in Figure 5A-C. The bar graph in Figure 5A shows a comparison between the HR proficiency of the two used cell cultures.
In this preliminary experiment MDA-MB-231 showed reduced competence in plasmids’ recombination and the detected recombination product was 75%-lower than that observed in the BxPC-3 culture. This result is in line with published data [39] which explored DNA repair defects in triple negative breast cancer cell cultures: compared to the other examined cell lines, MDA-MB-231 cells were found to display low proficiency in most DNA repair pathways and appeared to be the least competent in HR-mediated repair.
In agreement with the results of the RT-PCR and immunoblotting experiments shown in Figure 3 and Figure 4, when the BxPC-3 culture was exposed to butyrate the detected HR product was reduced to about 50% (Figure 5B, p < 0.01) and a similar result was also observed in MDA-MB-231 (Figure 5C, p < 0.01). In these cells, the HR-promoting effect caused by lactate was confirmed, with a 40%-increased HR product; this effect was significantly reduced (p < 0.01), but not completely abolished, by butyrate coadministration.
These results were also verified by assessing in the treated cultures the levels of FANCI and FANCD2 proteins, two central components of the Fanconi anemia (FA) pathway. A substantial crosstalk between the FA and HR pathways has been evidenced, and activated FA pathway also showed the potential of promoting HR-mediated repair [40]. As well known, reduced HR function makes cells reliant on alternative and error prone repair pathways, which triggers FA proteins’ activation. As a consequence, increased FANCI and -D2 levels are observed and these proteins form a heterodimer recruited to the DNA damaged site for the activation of repair processes [41].
Figure 5D shows that, in response to the butyrate-induced inhibition of HR, a statistically significant compensatory increase in FANCI and FANCD2 was observed in BxPC-3 cells. This result was not evidenced in butyrate-exposed MDA-MB-231 cultures (Figure 5E); we can hypothesize that the quite low proficiency shown by these cells not only in HR but also in other DNA repair pathways [39] could also result in impaired FA/HR interaction. However, in lactate-exposed MDA-MB-231 cells HR upregulation resulted in a statistically significant reduction of both FANCI and FANCD2 (p < 0.01 vs control cells), a finding in line with the ascertained crosstalk between FA and HR pathways and with the protective effects exerted by this metabolite against DNA damage [42].
2.5. Butyrate and Lactate Induce Distinct Exometabolomic Changes Consistent with Their Effects on HR
Exometabolomic profiling of conditioned media has previously been exploited to monitor how cancer cells rewire nutrient uptake and secretion in response to oncogenic signals or treatments, and to integrate these extracellular signatures with gene-expression changes and DNA-damage response pathways, thereby gaining mechanistic insight into drug sensitivity and resistance [37]. Therefore, to investigate whether the distinct effects of butyrate and lactate on HR proficiency (described above) are accompanied by specific metabolic rewiring, we performed a 1H-NMR–based exometabolomic analysis on conditioned media collected from the same BxPC-3 and MDA-MB-231 cultures exposed to butyrate and/or lactate for 72 h that underwent HR efficiency evaluation. In BxPC-3 cells, the principal component analysis (PCA) showed a clear separation between control (CTR) and butyrate-treated (But) samples (Figure 6A), indicating a substantial remodeling of extracellular metabolite profiles.
In agreement with the glycolysis-inhibiting activity of butyrate reported in cancer cells [16,17,18,19], the volcano plot and heatmap (Figure 6B,C) showed that butyrate exposure resulted in a significant increase of glucose in the medium, together with reduced lactate and alanine levels. Concurrently, pyruvate and several TCA intermediates (citrate, succinate and fumarate) appeared to accumulate extracellularly. Most amino acids, including branched-chain and aromatic amino acids, glutamine, methionine, histidine, proline, threonine, arginine, asparagine and serine, as well as choline and phosphocholine, were also increased in conditioned media from butyrate-treated cultures, whereas aspartate, glutamate, niacinamide and D-glucosamine were significantly decreased. Overall, these data suggest that in BxPC-3 cells butyrate induces a metabolic rewiring characterized by reduced glucose consumption and impaired utilization of TCA intermediates, several amino acids and other metabolites required to sustain nucleotide synthesis and efficient DNA repair [43]. To explore the functional meaning of these alterations, joint pathway analysis was performed in the online platform MetaboAnalyst by integrating the differentially expressed metabolites (DEMs) with the expression changes of the genes investigated in the same experimental conditions (i.e., RAD51, BRCA1, BRCA2, GPER1, PLAU, BBC3, H2AX, FANCD2 and FANCI). This analysis revealed that HR and FA pathway, together with the TCA cycle, arginine biosynthesis and alanine, aspartate and glutamate metabolism, were the pathways with the highest topological impact (Figure 6D). These results are consistent with the tight functional interplay between FA and HR in the repair of replication-associated lesions [40,41] as well as with the recognized requirement for aspartate, glutamine and other TCA-linked metabolites to sustain de novo nucleotide synthesis and DNA repair [43]. Collectively, these findings support the notion that the butyrate-induced inhibition of HR in BxPC-3 cells occurs in a metabolically unfavorable context for high-fidelity DNA repair [44,45]. A similar approach was applied to MDA-MB-231 cells, where the metabolic effects of both butyrate and lactate, alone or in combination, were investigated. The PCA score plot (Figure 7A) evidenced four distinct clusters corresponding to control (CTR), butyrate- (But), lactate- (Lac) and butyrate/lactate coadministration-treated (But/Lac) samples, indicating that each treatment was associated with a specific exometabolomic profile.
In agreement with the results obtained in BxPC-3 cells, butyrate increased extracellular glucose, pyruvate and TCA intermediates (citrate, succinate, fumarate), together with glutamine, choline, phosphocholine, pantothenic acid and pyridoxine (Figure 7B,E). The levels of acetate, 3-hydroxybutyrate and 3-methyl-2-oxovaleric acid were also increased, while alanine, serine, arginine, glutamate and creatinine were reduced, and methylguanidine appeared significantly increased, suggesting enhanced oxidative stress. These data indicate that, also in MDA-MB-231 cells, butyrate induces a condition of mitochondrial and redox stress, accompanied by reduced amino-acid uptake and accumulation of incompletely oxidized substrates [16,17,18,19], also in agreement with the dual role of butyrate as an HDAC inhibitor and metabolic modulator [46]. On the contrary, lactate exposure caused an almost specular effect. In line with the role of lactate as an oxidative substrate and signaling molecule in cancer cells [3,4,24], Lac-treated MDA-MB-231 cultures displayed increased pyruvate, alanine and glutamate in the medium, together with reduced glucose, glutamine, choline, phosphocholine, pantothenate, TCA intermediates, acetate, 3-hydroxybutyrate, 3-methyl-2-oxovalerate, methylguanidine, formate, pyridoxine, serine, arginine, valine and glycine (Figure 7C,E). This pattern is compatible with efficient lactate uptake and oxidation, activation of pyruvate–alanine cycling, reduced reliance on branched-chain amino acids for anaplerosis and lower oxidative stress. These changes are consistent with the role of lactate as an oxidative fuel in breast cancer cells [47,48] and with recent evidence that lactate and lactylation can promote the activity of HR proteins such as MRE11 in response to DNA damage [42,49]. Interestingly, in the But/Lac condition many metabolites showed intermediate or partially normalized values compared to those observed in the single treatments (Figure 7D,E). Glutamine, phosphocholine, pantothenic acid, pyruvate, threonine, myo-inositol, asparagine and 3-methyl-2-oxovalerate were significantly increased, while serine was reduced in the medium. Joint pathway analysis, integrating metabolite changes with the expression of the same genes previously investigated, identified pyruvate metabolism, amino-acid metabolism (alanine, aspartate and glutamate; glycine, serine and threonine; arginine biosynthesis), TCA cycle, HR and FA as the most impacted pathways for butyrate and lactate single treatments (Figure 7F,G). Notably, in the combined But/Lac condition only HR and FA pathway remained as high-impact nodes (Figure 7H). Given the close functional interplay between HR and FA pathways in the repair of replication-associated lesions and interstrand crosslinks [50,51], these data suggest that lactate can mitigate several butyrate-induced metabolic defects but does not fully restore DNA repair pathway homeostasis at the transcriptional/protein level at the investigated timepoint. Together with the HR assays, these exometabolomic results support a model in which butyrate drives a metabolically and epigenetically unfavorable state for HR, whereas lactate promotes an oxidative, HR-permissive state, and the combination yields an intermediate phenotype in which DNA repair pathways remain the major functional impacted aspect.
2.6. The HR-Modulatory Effects of Butyrate and Lactate Modify CELL response to PARP and RAD52 Inhibitors
As well documented, reduced HR efficiency is a feature predicting susceptibility of cancer cells to PARP inhibitors (PARPi) [52] and can also make cancer cells responsive to RAD52 inhibitors [53]. RAD52 is involved in DSBs repair [54] and was found to be essential for the viability of BRCA1 and BRCA2 deficient cells, but not for that of normal cells, which suggested this protein as an attractive therapeutic target for the hereditary pancreatic, breast and ovarian cancers syndromes. To conclude our study, we then verified whether the HR-modulatory effect exerted by lactate and butyrate in BxPC-3 and MDA-MB-231 cultures could affect the cell response to olaparib and talazoparib (two widely studied PARPi) and to D-I03, a recently developed and selective RAD52 inhibitor [55]. Results are shown in Figure 8; for each inhibitor, the bar graphs show the effects caused by a 72-h co-treatment with 1 mM butyrate in BxPC-3, MDA-MB-231 and lactate-exposed MDA-MB-231 (Lac-MDA-MB-231) cultures. The single administration of butyrate did not affect cell proliferation in the three cultures. In BxPC-3 cells, the single treatments with the PARPi(s) and with D-I03 did not affect cell proliferation, which on the contrary was significantly reduced when each of the three inhibitors was administered in association with butyrate (p < 0.01 for all the three compounds). As expected, and in agreement with the low proficiency in DNA repair shown for these cells [39], MDA-MB-231 cultures showed higher response to the three tested inhibitors, with a statistically significant difference vs the untreated cultures. Lactate exposure was found to reduce the effect of the three inhibitors (Lac-MDA-MB-231 cultures), a result reaching the level of statistical significance in the case of olaparib.
The lower response of the Lac-MDA-MB-231 cultures to the studied inhibitors are in complete agreement with the lactate-induced upregulation of HR process shown in Figure 4 and Figure 5B and is in line with the effect exerted by this metabolite in increasing drug resistance [3,4]. However, and as also shown by the data of Figures 4B, 5C and 5E, when MDA-MB-231 cultures were exposed to both metabolites the effect of butyrate prevailed over the lactate-induced drug resistance: in Lac-MDA-MB-231 cultures the effects of all the three tested inhibitors were significantly increased by butyrate, with a remarkable difference observed in the case of the two PARPi.
Overall, the results of the viability experiments described in Figure 8 are in agreement with all the results shown in the preliminary experiments, which fully supports the hypothesis of a butyrate/lactate mediated control on HR function.
3. Discussion
LDH expression has been recognized as one of the major determinants affecting tumor prognosis [56]. A recent meta-analysis revealed that high LDH activity was positively correlated with the presence of stemness scores and was able to predict poor chemotherapy response in multiple human cancers [57,58]. As suggested by several studies, in tumor cells part of the deleterious effects linked to the increased LDH expression and activity can be ascribed to lactate, the product of LDH reaction [3,4,5,6]. By causing histone hyperacetylation or lactylation, this metabolite was found to promote stem properties, infiltrative growth and drug resistance [8,9]. The data reported in this manuscript suggest that at least one of the lactate-induced deleterious effects (drug resistance) could be effectively dampened by a second metabolite, butyrate. In agreement with this hypothesis, in butyrate exposed cells our experiments showed reduced lactate production (Figure 1B) and reduced histone-3 lactylation, a lactate-specific mechanism affecting gene expression [8].
We hypothesized that the lactate-induced cancer promoting effects could be restrained by butyrate for its potential of enhancing mitochondrial function and promoting oxidative metabolism reactions [17]. The biological effects exerted by both metabolites are usually mediated by HDAC inhibition. Specifically, lactate was found to be linked to Class I HDAC (HDAC1, 2, 3) [59]. Interestingly, beside operating histone acetylation, these enzymes were also found to catalyze the addition of lactate residues to histones and other proteins. High level of protein lactylation seems to be linked to the high intracellular lactate concentration associated with the Warburg effect, a condition which also leads to the inhibition of the deacetylase activity [59].
Broader action on HDACs was instead described for butyrate, since this metabolite was shown to inhibit several Class I and II enzymes; its function is usually associated with cell cycle arrest, cell differentiation and/or apoptosis [59]. Based on these premises, the counteracting effects observed in our experiments could be explained by a different specificity of butyrate and lactate for distinct HDAC enzymes.
The exometabolomic analyses performed in the two cell cultures further support this hypothesis and provide a mechanistic link between the epigenetic effects of the metabolites and the observed modulation of HR. In BxPC-3 cells, butyrate exposure caused a marked reduction of glycolytic flux, as indicated by increased extracellular glucose and reduced lactate, together with accumulation of TCA intermediates and decreased uptake of several amino acids. In particular, the reduced levels of aspartate, glutamate and niacinamide in conditioned media are compatible with a limitation of nucleotide synthesis and NAD+ turnover, two conditions known to compromise DNA replication and repair [43]. In MDA-MB-231 cells, butyrate induced a similar metabolic stress signature, with increased TCA intermediates, ketone and acetate overflow and accumulation of the oxidative stress marker methylguanidine, whereas lactate produced a specular pattern characterized by increased pyruvate and alanine release and reduced TCA and ROS-related metabolites. Joint pathway analyses integrating metabolite changes with the expression of RAD51, BRCA1, BRCA2, FANCD2 and FANCI consistently highlighted HR and the FA pathway among the most impacted pathways, and in the combined butyrate/lactate condition these pathways remained predominant despite partial normalization of other metabolic parameters. These findings reinforce the idea that the opposite effects of lactate and butyrate are mediated not only by their direct epigenetic actions on chromatin [8,9,13,59,60], but also by a profound remodeling of cellular metabolism that selectively favors or impairs HR-mediated DNA repair.
Together with other short-chain fatty acids, butyrate is obtained from the fermentation of complex substrates, operated by different bacterial species in human intestine [61]. Microbiome-derived butyrate is rapidly taken up by colonocytes, but also enters the circulation, reaching the liver and different peripheral tissues [62]. In colonocytes, butyrate primarily functions as an energy substrate [63] and the metabolite fraction that is not utilized by these cells is transported by the portal vein to the liver [62]. Hepatocytes were shown to exploit butyrate for ketogenesis and triacylglycerol synthesis [64]. In both colon and liver, this metabolite was also found to exert anti-inflammatory and antitumor effects, which can be ascribed to its immunomodulatory properties [65]. Because of the high butyrate concentration detected in human colon lumen, intestine and liver are particularly exposed to the health effects of this metabolite; in the systemic circulation the level of butyrate was found to be ≤ 15 μM, about 2% of that measured in the colon [62]. For this reason and to benefit from the healthy properties of the metabolite, oral supplementation of butyrate was proposed. However, this procedure appeared to cause only transiently increased blood levels of the metabolite [66,67]. On the other hand, and despite this discouraging finding, ever increasing evidences indicate a protective role for butyrate also in pathologic conditions affecting sites different from liver and intestine.
Clinical observations suggested that the epigenetic changes induced by butyrate can protectively modulate immune response: bacterial butyrate was found to protect children from developing atopy [68]. Furthermore, higher fecal levels of this metabolite were found to be associated with a reduced risk to develop asthma and food allergy [69].
Other studies recognized butyrate as a modulator of neurological health, linked to its interaction with the gut–brain axis [70]. Clinical evidences indicated that butyrate can alleviate neurological disorders, such as Alzheimer’s and Parkinson’s diseases and autism spectrum disorders [71,72,73]. These effects were found to be linked to increased histone acetylation, causing reduced neuroinflammation and enhanced neurotransmitters’ modulation [68]. The anti-inflammatory properties of this metabolite could probably be involved also in protective effects against atherosclerosis progression: in cultured endothelial cells, butyrate was found to reduce VCAM1 expression [74] and pro-inflammatory cytokines production [75]. Furthermore, reduced aortic atherosclerosis and improved plaque stability was observed in the ApoE-/- mice model after an oral supplementation with butyrate [76].
Although the health beneficial effects of butyrate have already been described, to our knowledge the experiments reported in this manuscript show for the first time a counteracting effect on gene regulation induced by lactate and butyrate, two metabolites affecting cancer cell biological properties. Since poor drug response is one of the best characterized and most clinically relevant consequences of the increased lactate production of cancer cells, our experiments explored the effects caused by the two metabolites on DNA repair. Specifically, opposing effects of lactate and butyrate on HR-mediated repair were evidenced.
In addition to highlight a counteracting effect caused by the two metabolites, the butyrate-induced HR inhibition observed in our experiments also suggest supplementation with this metabolite as a possible way to extend the use of PARPi to the cancer forms poorly responsive to these inhibitors; this could be an interesting therapeutic attempt, also considering the good tolerability of this anticancer treatment.
Besides fostering drug resistance, lactate was also described as a promoter of immune-inflammatory responses [56]. Since immune-modulatory and anti-inflammatory properties have been shown for butyrate [65], our results also suggest that the counteracting effect between these two metabolites could not be limited to DNA repair, but could also be relevant in the management of these critical issues, often affecting the success of anticancer treatments.
4. Materials and Methods
4.1. Cell Cultures and Treatments
MDA-MB-231 and BxPC3 cells (ATCC, Manassas, VA, USA) were grown in low-glucose (1g/l) Dulbecco’s minimal essential medium (DMEM) (31885-023, Thermo Fisher Sci., Waltham, MA, USA) and Roswell Park Memorial Institute (RPMI) (R0883, Merck, Darmstadt, Germany) respectively. Media were supplemented with 100 U/mL penicillin/streptomycin (P0871, Merck, Darmstadt, Germany), 2 mM glutamine (G7513, Merck, Darmstadt, Germany) and 10% FBS (ECS5000L, Euroclone, Milan, Italy). L-lactate (439220100, Thermo Fisher Scientific, Waltham, USA) was dissolved in PBS (D8537, Merck, Darmstadt, Germany) and added to DMEM medium at a final concentration of 20 mM. MDA-MB-231 cell culture were exposed to 20 mM lactate for 72 h before experiments. Sodium butyrate (B-5887, Merck, Darmstadt, Germany) was obtained in lyophilized form; it was dissolved in ultra-pure water (W4502, Merck, Darmstadt, Germany) and stored at -20 °C. MDA-MB-231 and BxPC-3 cell cultures were exposed to 1 mM butyrate for 72 h. CDDP (HY-17394, Med Chem Express, Monmouth Junction, NJ, USA) was obtained in lyophilized form; it was dissolved in 0.9% NaCl and stored at −20 °C. OXA (O2751, Merck, Darmstadt, Germany) was obtained in lyophilized form and was dissolved in RPMI medium at a final concentration of 20 mM. Olaparib (Selleck Chemicals, Houston, TX, USA) was obtained in lyophilized form and was dissolved in DMSO (C6164, Merck, Darmstadt, Germany); MDA-MB-231 and BxPC-3 cell cultures were exposed to 10 μM olaparib for 72 h. Talazoparib (S7048, Selleck Chemicals, Houston, TX, USA) was obtained in lyophilized form: it was dissolved in DMSO and used at a final concentration of 2 μM (72 h). D-I03 (Merck, Darmstadt, Germany) was obtained in lyophilized form: it was dissolved in DMSO and used at a final concentration of 15 μM (72 h).
4.2. Cell Proliferation Experiments
Cell proliferation was assessed by crystal violet staining. Crystal violet (CV, C0775, Merck, Darmstadt, Germany) was obtained in lyophilized form and dissolved in distilled water. Control and lactate exposed MDA-MB-231 and BxPC-3 cells (4 x 10³ cells/well) were seeded in 96-multiwell plates and let to adhere overnight. Cultures were then exposed to the selected inhibitors for 72 h. At the end of treatment, medium was removed and cells were fixed with 1% glutaraldehyde (G6257, Merck Darmstadt, Germany) for 20 min. Fixed cultures were then stained with a 0.01% CV solution for 30 min. After staining, they were washed with PBS (D8537, Merck, Darmstadt, Germany) for three times and CV was solubilized by shaking in 70% ice-cold ethanol for 30 min at room temperature. Absorbance was measured at 570 nm using a Multiskan EX plate reader (Thermo Fisher Scientific). For each experiment and treatment, changes in cell number over the 72-hour period were calculated.
4.3. Evaluation of Lactate Level
MDA-MB-231 and BxPC-3 cells were treated with 1 mM butyrate for 72 h. Following treatment, cells were seeded in triplicate into 24-well plates (2 x 10⁵ cells/well) and allowed to adhere overnight. The culture medium was then replaced with 300 μL Krebs-Ringer buffer per well. The concentration of lactate released into the buffer was measured after 3 h of incubation at 37 °C, following the procedure described in [5].
4.4. Real-Time PCR
Real-time PCR (RT-PCR) was performed on BxPC-3 cultures and on control and lactate-exposed MDA-MB-231 cells (20 mM for 72 h) treated with 1 mM butyrate for 72 h. BxPC-3 cells were also treated with 20 mM OXA for 16 h. Exponentially growing cells cultured in T25 flasks were used for RNA extraction, which was performed with an RNA isolation kit (83912, Merck, Darmstadt, Germany). RNA quantity and purity were assessed spectrophotometrically using an ONDA Nano Genius photometer (OPTO-LAB Instruments, Modena, Italy). Complementary DNA (cDNA) was synthesized from total RNA using the Revert Aid First Strand cDNA Synthesis Kit (K1691, lot 00291984, Thermo Fisher Scientific) following these steps: denaturation at 65 °C for 5 min, primer annealing at 25 °C for 5 min, reverse transcription for 1 hour at 42 °C and enzyme inactivation for 5 min at 70 °C. Quantitative RT–PCR was performed using 20 ng of cDNA, Sso-Advanced™ Universal SYBR® Green Supermix (1725271, lot 64545727; Bio-Rad, Hercules, CA, USA), and specific primer mixtures. All primers used in the PCR experiments were predesigned (KiCqStart®, Merck). The used reference genes were CYP33, RPLP0, and B2M. The list of the oligonucleotide primer pairs (Merck, Darmstadt, Germany) is shown in Table 1. For all genes, primer annealing was performed at 60 °C, and amplification was carried out on a CFX96™ Real-Time PCR System (Bio-Rad, Hercules, CA, USA) using the following program: initial denaturation at 95 °C for 30 s, followed by 40 cycles of 95 °C for 15 s and 60 °C for 30 s. Relative gene expression levels were calculated using the 2−ΔCT method.
4.5. Immunoblotting Experiments
These experiments were performed on control and lactate-exposed MDA-MB-231 and on BxPC-3 cells. Cultures from T25 flasks at approximately 80% confluence were harvested and lysed in 50 µL RIPA buffer supplemented with protease and phosphatase inhibitors (cOmplete™, 04693116001, Merck; Halt™, 78420, Thermo Fisher Scientific). For each sample, proteins were quantified using the Bradford assay (B6916, Merck) and 70 µg samples were separated by electrophoresis on 4–12% precast polyacrylamide gels (Bolt™, 04120, Thermo Fisher Scientific), under a constant voltage of 170 V. Proteins were subsequently transferred onto low-fluorescence Hybond™ PVDF membranes (10600060, lot A30730600; Cytiva, GE Healthcare, Chicago, IL, USA) using the Bolt™ transfer system at 60 mA for 16 h. Membranes were then blocked for 1 h with 5% BSA (A9418, Merck) dissolved in TBS-Tween and then incubated with the appropriate primary antibody. Actin served as the loading control in all experiments. The antibodies (primary and secondary) used for the immunoblotting experiments are listed in Table 2. Membrane fluorescence was detected using Chemi-Doc MP Imaging System (Bio-Rad, California, USA), and band intensities were quantified with the ImageJ software (version 1.53a).
4.6. Homologous Recombination Assay
Homologous recombination (HR) activity was evaluated using a commercially available assay kit (Norgen, Thorold, ON, Canada), as previously described [77]. Control and lactate-exposed MDA-MB-231 and BxPC-3 cells were treated with 1 mM butyrate for 72 h. Following treatment, cells were seeded (2 × 10⁵ cells per well) into 24-well plates and allowed to adhere overnight. Co-transfection with the two reporter plasmids was carried out using Lipofectamine™ 2000 (11668030, Invitrogen, Thermo Fisher Scientific), according to the manufacturer’s instructions. Following transfection, cells were washed with PBS, collected, and genomic DNA was extracted using the Illustra Tissue and Cell Genomic Prep Mini Spin Kit (GE Healthcare). DNA concentration and purity were determined with an ONDA Nano Genius photometer (OPTO-LAB Instruments, Modena, Italy). HR efficiency was quantified by real-time PCR using 25 ng of template DNA, the primer mixtures supplied with the assay kit, and the manufacturer’s recommended cycling conditions. Relative HR efficiency was calculated using the 2−ΔΔCt method, by comparing the ratio (recombination product / backbone plasmid) in treated samples versus untreated controls.
4.7. NMR Exometabolomic Analysis
Sample preparation. Metabolomic studies on cell culture media to investigate treatment-induced changes on mitochondrial function and oxidative metabolism in BxPC-3 cells were performed as described in [37]. Culture media of the same cells used for the Homologous Recombination assay were collected right before DNA extraction, immediately frozen in liquid nitrogen and stored at −80 °C. Right before NMR analysis, culture media of cells exposed to the different treatments were thawed on ice, centrifuged at 20,000 g 4 °C for 15min. 400 μL of each sample were diluted with 100 μL of a prepared NMR buffer for a final concentration of 150 mM buffer phosphate pH 7.4, 1 mM 2,2′,3,3′-deuterotrimethylsilylproprionic acid (TSP) as chemical shift reference, 0.04% sodium azide, and 20% D2O (for the lock signal) into a 5 mm NMR tube.
NMR analysis. All the NMR experiments were recorded with a Bruker Ultrashield Plus FT-NMR 600 MHz ADVANCE NEO equipped with a Cryoprobe™ QCI 1H/19F–13C/15N–D with a SampleJet™ autosampler with temperature control. For each sample, the probe was automatically locked, tuned, matched, and shimmed. Before measurement, the samples were kept for 5 min inside the NMR probe head for temperature equilibration at 298 K. Two NMR spectra were recorded for each sample: a monodimensional (1D) 1H NMR spectrum with a standard pulse sequence water suppression (noesygppr1d, Bruker), with 128 scans, 64k data points, a spectral width of 30 ppm, an acquisition time of 1.835 s, a relaxation delay of 4 s, and a mixing time of 100 ms and a 1D 1H spin-echo Carr-Purcell-Meiboom-Gill sequence (cpmgpr1d, Bruker) to suppress large NMR signals arising from high molecular weight molecules (i.e., serum proteins). In the cpmg experiments, the total echo time was to 38.4 ms consisting of 128 repetitions with a τ time of 300 μs and a 180° pulse of approximately 36 μs. Each spectrum was recorded with a total of 128 scans, 64k data points, a repetition time of 4 s, and an acquisition time of 1.835 s. The free induction decay was multiplied with an exponential window function with 0.3 Hz line broadening prior to Fourier transformation. All the 1H NMR chemical shifts are referenced to the TSP signal.
Metabolomic analysis. Obtained spectra were analysed MestRENova 15.01 Chemometris package from spectra processing, bucketing, and normalization to statistical principal component analysis (PCA). For bucketing, a width of 0.04 ppm was used, and the samples were normalized based on the total intensity (each bucket integration is divided by the integration of the total spectrum). The significant NMR buckets, resulted from MetRENova, were assigned by Assure2.2 Bruker program, the Human Metabolome Database (https://hmdb.ca/) and Chenomx Profiler (Chenomx NMR suite 8.5 evaluation). The identification and quantification of the different metabolites was obtained automatically by Assure 2.2, using an external standard (10 mM dimethyl malonic acid), and the PULCON method. The consumption or the production/release of each metabolite was calculated by comparing their amounts with those in the procedural blank (medium incubated in the same experimental conditions but without cells). Only significant (p < 0.05 as reference value, Welch’s t-test or one-way ANOVA followed by Bonferroni’s post hoc test) consumption/release values were included in the respective figure.
4.8. Statistical Analyses
Results were obtained from at least two independent experiments, performed with triplicate samples. Data were analyzed using the GraphPad InStat and Prism 5 softwares. For each experiment, the adopted statistical evaluation is described in the corresponding paragraph of the Results section. Data were expressed as mean values ± SE; the significance level was set at p < 0.05. For the exometabolomic analysis, thresholds for statistical significance were set at -log10(p-value) = 1.3 (i.e., p-value = 0.05) and log2(fold change) = 0 (i.e., fold change = 1). Joint pathway analysis was performed using the online platform MetaboAnalyst (https://www.metaboanalyst.ca/home.xhtml), selecting the “Pathway Analysis” function and the following parameters: Fisher’s exact test for enrichment analysis, degree centrality for topology measure, combined queries for integration method.
Author Contributions
Conceptualization, G.D.S.; methodology, V.R., M.M., M.G. and M.V.; software, V.R., M.M., M.V. and G.D.S.; validation, V.R., M.M. and G.D.S.; formal analysis, M.M. and G.D.S.; investigation, V.R. and M.M.; resources, G.D.S.; data curation, V.R., M.M., M.D. and M.G.; writing—original draft preparation, G.D.S.; writing—review and editing, M.M., M.D. and G.D.S.; visualization, M.M. and G.D.S.; supervision, M.G.; project administration, G.D.S.; funding acquisition, S.G., A.C. and G.D.S. All authors have read and agreed to the published version of the manuscript.
Funding
This research was funded by the Roberto and Cornelia Pallotti Legacy for Cancer Research (G.D.S), the Associazione Italiana per la Ricerca sul Cancro AIRC (IG Project 2018, id 21386 to A.C.; Post-doc Fellowship 2023, id 28174 to M.M.), by the Italian Institute of Technology (A.C.; S.G.), by the University of Bologna (RFO funds) (G.D.S). The APC was funded by the University of Bologna.
Institutional Review Board Statement
Not applicable
Informed Consent Statement
Not applicable
Data Availability Statement
The original contributions presented in this study are entirely included in the article. Further inquiries can be directed to the corresponding author.
Conflicts of Interest
The authors declare no conflicts of interest
Abbreviations
The following abbreviations are used in this manuscript:
| But CDDP |
Butyrate Cisplatin |
| DSB FA HDAC |
Double Strand Breaks Fanconi Anemia Histone Deacetylase |
| HR Lac |
Homologous Recombination Lactate |
| LDH OXA PARPi RT-PCR |
Lactate Dehydrogenase Oxamate Poly-ADP-Ribose Polymerase Inhibitor Real Time PCR |
References
- Hornisch, M.; Piazza, I. Regulation of gene expression through protein-metabolite interactions. NPJ Metab. Health Dis. 2025, 3, 7. [Google Scholar] [CrossRef]
- van der Knaap, J.A.; Verrijzer, C.P. Undercover: gene control by metabolites and metabolic enzymes. Genes Dev. 2016, 30, 2345–2369. [Google Scholar] [CrossRef]
- Govoni, M.; Rossi, V.; Di Stefano, G.; Manerba, M. Lactate Upregulates the Expression of DNA Repair Genes, Causing Intrinsic Resistance of Cancer Cells to Cisplatin. Pathol. Oncol. Res. 2021, 27, 1609951. [Google Scholar] [CrossRef]
- Rossi, V.; Govoni, M.; Farabegoli, F.; Di Stefano, G. Lactate is a potential promoter of tamoxifen resistance in MCF7 cells. Biochim. Biophys. Acta Gen. Subj. 2022, 1866, 130185. [Google Scholar] [CrossRef]
- Rossi, V.; Govoni, M.; Di Stefano, G. Lactate Can Modulate the Antineoplastic Effects of Doxorubicin and Relieve the Drug’s Oxidative Damage on Cardiomyocytes. Cancers 2023, 15, 3728. [Google Scholar] [CrossRef]
- Rossi, V.; Hochkoeppler, A.; Govoni, M.; Di Stefano, G. Lactate-Induced HBEGF Shedding and EGFR Activation: Paving the Way to a New Anticancer Therapeutic Opportunity. Cells 2024, 13, 1533. [Google Scholar] [CrossRef]
- Schwartz, L.; Supuran, C.T.; Alfarouk, K.O. The Warburg Effect and the Hallmarks of Cancer. Anticancer Agents Med. Chem. 2017, 17, 164–170. [Google Scholar] [CrossRef] [PubMed]
- Zhang, D.; Tang, Z.; Huang, H.; Zhou, G.; Cui, C.; Weng, Y.; Liu, W.; Kim, S.; Lee, S.; Perez-Neut, M.; et al. Metabolic regulation of gene expression by histone lactylation. Nature 2019, 574, 575–580. [Google Scholar] [CrossRef] [PubMed]
- Nguyen, N.T.B.; Gevers, S.; Kok, R.N.U.; Burgering, L.M.; Neikes, H.; Akkerman, N.; Betjes, M.A.; Ludikhuize, M.C.; Gulersonmez, C.; Stigter, E.C.A.; et al. Lactate controls cancer stemness and plasticity through epigenetic regulation. Cell Metab. 2025, 37, 903–919.e10. [Google Scholar] [CrossRef] [PubMed]
- Gu, X.; Zhu, Y.; Su, J.; Wang, S.; Su, X.; Ding, X.; Jiang, L.; Fei, X.; Zhang, W. Lactate-induced activation of tumor-associated fibroblasts and IL-8-mediated macrophage recruitment promote lung cancer progression. Redox Biol. 2024, 74, 103209. [Google Scholar] [CrossRef]
- Abdeen, S.K.; Mastandrea, I.; Stinchcombe, N.; Puschhof, J.; Elinav, E. Diet-microbiome interactions in cancer. Cancer Cell 2025, 43, 680–707. [Google Scholar] [CrossRef]
- Sun, J.; Chen, S.; Zang, D.; Sun, H.; Sun, Y.; Chen, J. Butyrate as a promising therapeutic target in cancer: From pathogenesis to clinic (Review). Int. J. Oncol. 2024, 64, 44. [Google Scholar] [CrossRef]
- Davie, J.R. Inhibition of histone deacetylase activity by butyrate. J. Nutr. 2003, 133, 2485S–2493S. [Google Scholar] [CrossRef]
- Ruemmele, F.M.; Schwartz, S.; Seidman, E.G.; Dionne, S.; Levy, E.; Lentze, M.J. Butyrate induced Caco-2 cell apoptosis is mediated via the mitochondrial pathway. Gut 2003, 52, 94–100. [Google Scholar] [CrossRef] [PubMed]
- Bernhard, D.; Ausserlechner, M.J.; Tonko, M.; Löffler, M.; Hartmann, B.L.; Csordas, A.; Kofler, R. Apoptosis induced by the histone deacetylase inhibitor sodium butyrate in human leukemic lymphoblasts. FASEB J. 1999, 13, 1991–2001. [Google Scholar] [CrossRef] [PubMed]
- Zhang, L.; Liu, C.; Jiang, Q.; Yin, Y. Butyrate in Energy Metabolism: There Is Still More to Learn. Trends Endocrinol. Metab. 2021, 32, 159–169. [Google Scholar] [CrossRef] [PubMed]
- Zhang, Q.; Qin, Y.; Sun, X.; Bian, Z.; Liu, L.; Liu, H.; Mao, L.; Sun, S. Sodium butyrate blocks colorectal cancer growth by inhibiting aerobic glycolysis mediated by SIRT4/HIF-1α. Chem. Biol. Interact. 2024, 403, 111227. [Google Scholar] [CrossRef]
- Amoêdo, N.D.; Rodrigues, M.F.; Pezzuto, P.; Galina, A.; da Costa, R.M.; de Almeida, F.C.; El-Bacha, T.; Rumjanek, F.D. Energy metabolism in H460 lung cancer cells: effects of histone deacetylase inhibitors. PLoS One 2011, 6, e22264. [Google Scholar] [CrossRef]
- Xu, S.; Liu, C.X.; Xu, W.; Huang, L.; Zhao, J.Y.; Zhao, S.M. Butyrate induces apoptosis by activating PDC and inhibiting complex I through SIRT3 inactivation. Signal Transduct. Target. Ther. 2017, 2, 16035. [Google Scholar] [CrossRef]
- Balboni, A.; Govoni, M.; Rossi, V.; Roberti, M.; Cavalli, A.; Di Stefano, G.; Manerba, M. Lactate dehydrogenase inhibition affects homologous recombination repair independently of cell metabolic asset. Biochim. Biophys. Acta Gen. Subj. 2021, 1865, 129760. [Google Scholar] [CrossRef]
- Rong, Y.; Wu, W.; Ni, X.; Kuang, T.; Jin, D.; Wang, D.; Lou, W. Lactate dehydrogenase A is overexpressed in pancreatic cancer and promotes cancer cell growth. Tumour Biol. 2013, 34, 1523–1530. [Google Scholar] [CrossRef]
- Grover-McKay, M.; Walsh, S.A.; Seftor, E.A.; Thomas, P.A.; Hendrix, M.J. Role for glucose transporter 1 protein in human breast cancer. Pathol. Oncol. Res. 1998, 4, 115–120. [Google Scholar] [CrossRef]
- Phannasil, P.; Thuwajit, C.; Warnnissorn, M.; Wallace, J.C.; MacDonald, M.J.; Jitrapakdee, S.; dos Santos, M.P.; Schwartsmann, G.; Roesler, R.; Brunetto, A.L.; et al. Pyruvate Carboxylase Is Up-Regulated in Breast Cancer. PLoS One 2015, 10, e0129848. [Google Scholar] [CrossRef]
- de la Cruz-López, K.G.; Castro-Muñoz, L.J.; Reyes-Hernández, D.O.; García-Carrancá, A.; Manzo-Merino, J. Lactate in the.
- regulation of tumor microenvironment and therapeutic approaches. Front. Oncol. 2019, 9, 1143. [CrossRef] [PubMed]
- dos Santos, M.P.; Schwartsmann, G.; Roesler, R.; Brunetto, A.L.; Abujamra, A.L. Sodium butyrate enhances the cytotoxic effect of antineoplastic drugs in human lymphoblastic T-cells. Leuk. Res. 2009, 33, 218–221. [Google Scholar] [CrossRef]
- Louis, M.; Rosato, R.R.; Battaglia, E.; Néguesque, A.; Lapotre, A.; Grant, S.; Bagrel, D. Modulation of sensitivity to doxorubicin by sodium butyrate in breast cancer cells. Int. J. Oncol. 2005, 26, 1569–1574. [Google Scholar] [PubMed]
- Peng, J.; Cui, Y.; Xu, S.; Wu, X.; Huang, Y.; Zhou, W.; Wang, S.; Fu, Z.; Xie, H. Altered glycolysis results in drug-resistant tumors. Oncol. Lett. 2021, 21, 369. [Google Scholar] [CrossRef]
- Firsanov, D.V.; Solovjeva, L.V.; Svetlova, M.P. H2AX phosphorylation at DNA double-strand breaks. Clin. Epigenet. 2011, 2, 283–297. [Google Scholar] [CrossRef]
- Sloss, C.M.; Wang, F.; Palladino, M.A.; Cusack, J.C. Activation of EGFR by proteasome inhibition requires HB-EGF. Oncogene 2010, 29, 3146–3152. [Google Scholar] [CrossRef] [PubMed]
- Zach, L.; Yedidia-Aryeh, L.; Goldberg, M. Estrogen and DNA damage modulate mRNA levels of genes involved in homologous recombination repair. J. Transl. Genet. Genom. 2022, 6, 266–280. [Google Scholar] [CrossRef]
- Caldon, C.E. Estrogen signaling and DNA damage response in breast cancers. Front. Oncol. 2014, 4, 106. [Google Scholar] [CrossRef] [PubMed]
- Yedidia-Aryeh, L.; Goldberg, M. The interplay between the response to DNA double-strand breaks and estrogen. Cells 2022, 11, 3097. [Google Scholar] [CrossRef]
- Hashimoto, T.; Ushikubo, G.; Arao, N.; Hatabi, K.; Tsubota, K.; Hosoi, Y. Oxamate inhibits stemness and radiosensitizes glioblastoma cells. Int. J. Mol. Sci. 2025, 26, 5710. [Google Scholar] [CrossRef]
- Roberti, M.; Schipani, F.; Bagnolini, G.; Milano, D.; Giacomini, E.; Falchi, F.; Balboni, A.; Manerba, M.; Farabegoli, F.; De Franco, F.; et al. Rad51/BRCA2 disruptors synergize with olaparib in pancreatic cancer. Eur. J. Med. Chem. 2019, 165, 80–92. [Google Scholar] [CrossRef]
- Schipani, F.; Manerba, M.; Marotta, R.; Poppi, L.; Gennari, A.; Rinaldi, F.; Armirotti, A.; Farabegoli, F.; Roberti, M.; Di Stefano, G.; et al. Mechanistic understanding of RAD51 defibrillation. Int. J. Mol. Sci. 2022, 23, 8338. [Google Scholar] [CrossRef]
- Myers, S.H.; Poppi, L.; Rinaldi, F.; Veronesi, M.; Ciamarone, A.; Previtali, V.; Bagnolini, G.; Schipani, F.; Ortega Martínez, J.A.; Girotto, S.; et al. An 19F NMR fragment-based approach for the discovery and development of BRCA2-RAD51 inhibitors to pursuit synthetic lethality in combination with PARP inhibition in pancreatic cancer. Eur. J. Med. Chem. 2024, 265, 116114. [Google Scholar] [CrossRef]
- Masi, M.; Poppi, L.; Previtali, V.; Nelson, S.R.; Wynne, K.; Varignani, G.; Falchi, F.; Veronesi, M.; Albanesi, E.; Tedesco, D.; et al. Investigating synthetic lethality and PARP inhibitor resistance in pancreatic cancer through enantiomer differential activity. Cell Death Discov. 2025, 11, 106. [Google Scholar] [CrossRef] [PubMed]
- Milordini, G.; Zacco, E.; Masi, M.; Armaos, A.; Di Palma, F.; Oneto, M.; Gilodi, M.; Rupert, J.; Broglia, L.; Varignani, G.; et al. Computationally-designed aptamers targeting RAD51-BRCA2 interaction impair homologous recombination and induce synthetic lethality. Nat. Commun. 2025, in press. [Google Scholar] [CrossRef]
- Lee, K.J.; Mann, E.; Wright, G.; Piett, C.G.; Nagel, Z.D.; Gassman, N.R. Exploiting DNA repair defects in triple negative breast cancer to improve cell killing. Ther. Adv. Med. Oncol. 2020, 12, 1758835920958354. [Google Scholar] [CrossRef] [PubMed]
- Michl, J.; Zimmer, J.; Tarsounas, M. Interplay between Fanconi anemia and homologous recombination pathways in genome integrity. EMBO J. 2016, 35, 909–923. [Google Scholar] [CrossRef]
- Ishiai, M.; Kitao, H.; Smogorzewska, A.; Tomida, J.; Kinomura, A.; Uchida, E.; Saberi, A.; Kinoshita, E.; Kinoshita-Kikuta, E.; Koike, T.; et al. FANCI phosphorylation functions as a molecular switch to turn on the Fanconi anemia pathway. Nat. Struct. Mol. Biol. 2008, 15, 1138–1146. [Google Scholar] [CrossRef]
- Chen, H.; Li, Y.; Li, H.; Chen, X.; Fu, H.; Mao, D.; Chen, W.; Lan, L.; Wang, C.; Hu, K.; et al. NBS1 lactylation is required for efficient DNA repair and chemotherapy resistance. Nature 2024, 631, 663–669. [Google Scholar] [CrossRef] [PubMed]
- Cucchi, D.; Gibson, A.; Martin, S.A. The emerging relationship between metabolism and DNA repair. Cell Cycle 2021, 20, 943–959. [Google Scholar] [CrossRef]
- Koprinarova, M.; Botev, P.; Russev, G. Histone deacetylase inhibitor sodium butyrate enhances cellular radiosensitivity by inhibiting both DNA non homologous end joining and homologous recombination. DNA Repair (Amst) 2011, 10, 970–977. [Google Scholar] [CrossRef] [PubMed]
- Groselj, B.; Sharma, N.L.; Hamdy, F.C.; Kerr, M.; Kiltie, A.E. Histone deacetylase inhibitors as radiosensitisers: effects on DNA damage signalling and repair. Br. J. Cancer 2013, 108, 748–754. [Google Scholar] [CrossRef]
- Geng, H.W.; Yin, F.Y.; Zhang, Z.F.; Gong, X.; Yang, Y. Butyrate suppresses glucose metabolism of colorectal cancer cells via GPR109a-AKT signaling pathway and enhances chemotherapy. Front. Mol. Biosci. 2021, 8, 634874. [Google Scholar] [CrossRef] [PubMed]
- Lemma, S.; Di Pompo, G.; Porporato, P.E.; Sboarina, M.; Russell, S.; Gillies, R.J.; Baldini, N.; Sonveaux, P.; Avnet, S. MDA-MB-231 breast cancer cells fuel osteoclast metabolism and activity: A new rationale for the pathogenesis of osteolytic bone metastases. Biochim. Biophys. Acta Mol. Basis Dis. 2017, 1863, 3254–3264. [Google Scholar] [CrossRef]
- Gao, J.; Guo, Z.; Cheng, J.; Sun, B.; Yang, J.; Li, H.; Wu, S.; Dong, F.; Yan, X. Differential metabolic responses in breast cancer cell lines to acidosis and lactic acidosis revealed by stable isotope assisted metabolomics. Sci. Rep. 2020, 10, 21967. [Google Scholar] [CrossRef]
- Chen, Y.; Wu, J.; Zhai, L.; Zhang, T.; Yin, H.; Gao, H.; Zhao, F.; Wang, Z.; Yang, X.; Jin, M.; et al. Metabolic regulation of homologous recombination repair by MRE11 lactylation. Cell 2024, 187, 294–311. [Google Scholar] [CrossRef]
- Romick-Rosendale, L.E.; Lui, V.W.Y.; Grandis, J.R.; Wells, S.I. The Fanconi anemia pathway: repairing the link between DNA damage and squamous cell carcinoma. Mutat. Res. 2013, 743-744, 78–88. [Google Scholar] [CrossRef]
- Michl, J.; Zimmer, J.; Tarsounas, M. Interplay between Fanconi anemia and homologous recombination pathways in genome integrity. EMBO J. 2016, 35, 909–923. [Google Scholar] [CrossRef]
- Petropoulos, M.; Karamichali, A.; Rossetti, G.G.; Freudenmann, A.; Iacovino, L.G.; Dionellis, V.S.; Sotiriou, S.K.; Halazonetis, T.D. Transcription-replication conflicts underlie sensitivity to PARP inhibitors. Nature 2024, 628, 433–441. [Google Scholar] [CrossRef] [PubMed]
- Carley, A.C.; Jalan, M.; Subramanyam, S.; Roy, R.; Borgstahl, G.E.O.; Powell, S.N. Replication Protein A Phosphorylation Facilitates RAD52-Dependent Homologous Recombination in BRCA-Deficient Cells. Mol. Cell Biol. 2022, 42, e0052421. [Google Scholar] [CrossRef]
- Van Dyck, E.; Stasiak, A.Z.; Stasiak, A.; West, S.C. Binding of double-strand breaks in DNA by human Rad52 protein. Nature 1999, 398, 728–731. [Google Scholar] [CrossRef]
- Huang, F.; Goyal, N.; Sullivan, K.; Hanamshet, K.; Patel, M.; Mazina, O.M.; Wang, C.X.; An, W.F.; Spoonamore, J.; Metkar, S.; et al. Targeting BRCA1- and BRCA2-deficient cells with RAD52 small molecule inhibitors. Nucleic Acids Res. 2016, 44, 4189–4199. [Google Scholar] [CrossRef]
- Zhang, Q.; Luo, Y.; Qian, B.; Cao, X.; Xu, C.; Guo, K.; Wan, R.; Jiang, Y.; Wang, T.; Mei, Z.; et al. A systematic pan-cancer analysis identifies LDHA as a novel predictor for immunological, prognostic, and immunotherapy resistance. Aging (Albany NY) 2024, 16, 8000–8018. [Google Scholar] [CrossRef]
- Fiume, L.; Manerba, M.; Vettraino, M.; Di Stefano, G. Inhibition of lactate dehydrogenase activity as an approach to cancer therapy. Future Med. Chem. 2014, 6, 429–445. [Google Scholar] [CrossRef]
- Wang, M.; Zhou, Q.; Cao, T.; Li, F.; Li, X.; Zhang, M.; Zhou, Y. Lactate dehydrogenase A: a potential new target for tumor drug resistance intervention. J. Transl. Med. 2025, 23, 713. [Google Scholar] [CrossRef] [PubMed]
- Moreno-Yruela, C.; Zhang, D.; Wei, W.; Bæk, M.; Liu, W.; Gao, J.; Danková, D.; Nielsen, A.L.; Bolding, J.E.; Yang, L.; et al. Class I histone deacetylases (HDAC1-3) are histone lysine delactylases. Sci Adv. 2022, 8(3), eabi6696. [Google Scholar] [CrossRef] [PubMed]
- Davie, J.R. Inhibition of histone deacetylase activity by butyrate. J. Nutr. 2003, 133, 2485S–2493S. [Google Scholar] [CrossRef] [PubMed]
- Louis, P.; Flint, H.J. Formation of propionate and butyrate by the human colonic microbiota. Environ. Microbiol. 2017, 19, 29–41. [Google Scholar] [CrossRef] [PubMed]
- Dalile, B.; Van Oudenhove, L.; Vervliet, B.; Verbeke, K. The role of short-chain fatty acids in microbiota-gut-brain communication. Nat. Rev. Gastroenterol. Hepatol. 2019, 16, 461–478. [Google Scholar] [CrossRef]
- Donohoe, D.R.; Garge, N.; Zhang, X.; Sun, W.; O’Connell, T.M.; Bunger, M.K.; Bultman, S.J. The microbiome and butyrate regulate energy metabolism and autophagy in the mammalian colon. Cell Metab. 2011, 13, 517–526. [Google Scholar] [CrossRef]
- Cavaleri, F.; Bashar, E. Potential Synergies of β-Hydroxybutyrate and Butyrate on Metabolism, Inflammation, Cognition, and General Health. J. Nutr. Metab. 2018, 2018, 7195760. [Google Scholar] [CrossRef]
- Siddiqui, M.T.; Cresci, G.A.M. The Immunomodulatory Functions of Butyrate. J. Inflamm. Res. 2021, 14, 6025–6041. [Google Scholar] [CrossRef]
- Egorin, M.J.; Yuan, Z.M.; Sentz, D.L.; Plaisance, K.; Eiseman, J.L. Plasma pharmacokinetics of butyrate after intravenous administration of sodium butyrate or oral administration of tributyrin or sodium butyrate to mice and rats. Cancer Chemother. Pharmacol. 1999, 43, 445–453. [Google Scholar] [CrossRef]
- Cleophas, M.C.P.; Ratter, J.M.; Bekkering, S.; Quintin, J.; Schraa, K.; Stroes, E.S.; Netea, M.G.; Joosten, L.A.B. Effects of oral butyrate supplementation on inflammatory potential of circulating peripheral blood mononuclear cells in healthy and obese males. Sci. Rep. 2019, 9, 775. [Google Scholar] [CrossRef]
- Cait, A.; Cardenas, E.; Dimitriu, P.A.; Amenyogbe, N.; Dai, D.; Cait, J.; Sbihi, H.; Stiemsma, L.; Subbarao, P.; Mandhane, P.J. Reduced genetic potential for butyrate fermentation in the gut microbiome of infants who develop allergic sensitization. J. Allergy Clin. Immunol. 2019, 144, 1638–1647.e3. [Google Scholar] [CrossRef]
- Roduit, C.; Frei, R.; Ferstl, R.; Loeliger, S.; Westermann, P.; Rhyner, C.; Schiavi, E.; Barcik, W.; Rodriguez-Perez, N.; Wawrzyniak, M.; et al. High levels of butyrate and propionate in early life are associated with protection against atopy. Allergy 2019, 74, 799–809. [Google Scholar] [CrossRef] [PubMed]
- Kalkan, A.E.; BinMowyna, M.N.; Raposo, A.; Ahmad, M.F.; Ahmed, F.; Otayf, A.Y.; Carrascosa, C.; Saraiva, A.; Karav, S. Beyond the Gut: Unveiling Butyrate’s Global Health Impact Through Gut Health and Dysbiosis-Related Conditions. Nutrients 2025, 17, 1305. [Google Scholar] [CrossRef]
- Fattorusso, A.; Di Genova, L.; Dell’Isola, G.B.; Mencaroni, E.; Esposito, S. Autism Spectrum Disorders and the Gut Microbiota. Nutrients 2019, 11, 521. [Google Scholar] [CrossRef]
- Sun, M.-F.; Shen, Y.-Q. Dysbiosis of gut microbiota and microbial metabolites in Parkinson’s Disease. Ageing Res. Rev. 2018, 45, 53–61. [Google Scholar] [CrossRef]
- Liu, S.; Gao, J.; Zhu, M.; Liu, K.; Zhang, H.-L. Gut Microbiota and Dysbiosis in Alzheimer’s Disease. Mol. Neurobiol. 2020, 57, 5026–5043. [Google Scholar] [CrossRef] [PubMed]
- Zapolska-Downar, D.; Siennicka, A.; Kaczmarczyk, M.; Kołodziej, B.; Naruszewicz, M. Butyrate inhibits cytokine-induced VCAM-1 and ICAM-1 expression in cultured endothelial cells. J. Nutr. Biochem. 2004, 15, 220–228. [Google Scholar] [CrossRef] [PubMed]
- Bailón, E.; Cueto-Sola, M.; Utrilla, P.; Rodríguez-Cabezas, M.E.; Garrido-Mesa, N.; Zarzuelo, A.; Xaus, J.; Gálvez, J.; Comalada, M. Butyrate in vitro immune-modulatory effects might be mediated through apoptosis induction. Immunobiology 2010, 215, 863–873. [Google Scholar] [CrossRef]
- Aguilar, E.C.; Leonel, A.J.; Teixeira, L.G.; Silva, A.R.; Silva, J.F.; Pelaez, J.M.; Capettini, L.S.; Lemos, V.S.; Santos, R.A.; Alvarez-Leite, J.I. Butyrate impairs atherogenesis by reducing plaque inflammation and NFκB activation. Nutr. Metab. Cardiovasc. Dis. 2014, 24, 606–613. [Google Scholar] [CrossRef]
- Bagnolini, G.; Milano, D.; Manerba, M.; Schipani, F.; Ortega, J.A.; Gioia, D.; Falchi, F.; Balboni, A.; Farabegoli, F.; De Franco, F.; et al. Synthetic lethality in pancreatic cancer: discovery of a new RAD51–BRCA2 small molecule disruptor that inhibits homologous recombination and synergizes with olaparib. J. Med. Chem. 2020, 63, 2588–2619. [Google Scholar] [CrossRef] [PubMed]
Figure 1.
(A): Effect of butyrate on cell viability. No statistically significant effect was observed for doses ≤ 1 mM. The 2 mM dose caused a ≈ 20% reduced cell proliferation in MDA-MB-231 cultures, with a statistically significant difference vs the lactate exposed cells (Lac-MDA-MB-231; p < 0.05, as assessed by Student’s t-test). The tolerability of 1 mM butyrate for the cell cultures was confirmed by an immunoblotting evaluation of PUMA protein, which allowed to exclude apoptosis induction by 1 mM butyrate. (B),(C): In both cell cultures, 1 mM butyrate significantly reduced lactate production and histone-3 lactylation. * and ** indicate a statistically significant difference in treated vs control cells with p < 0.05 and 0.01, respectively, as assessed by Student’s t-test.
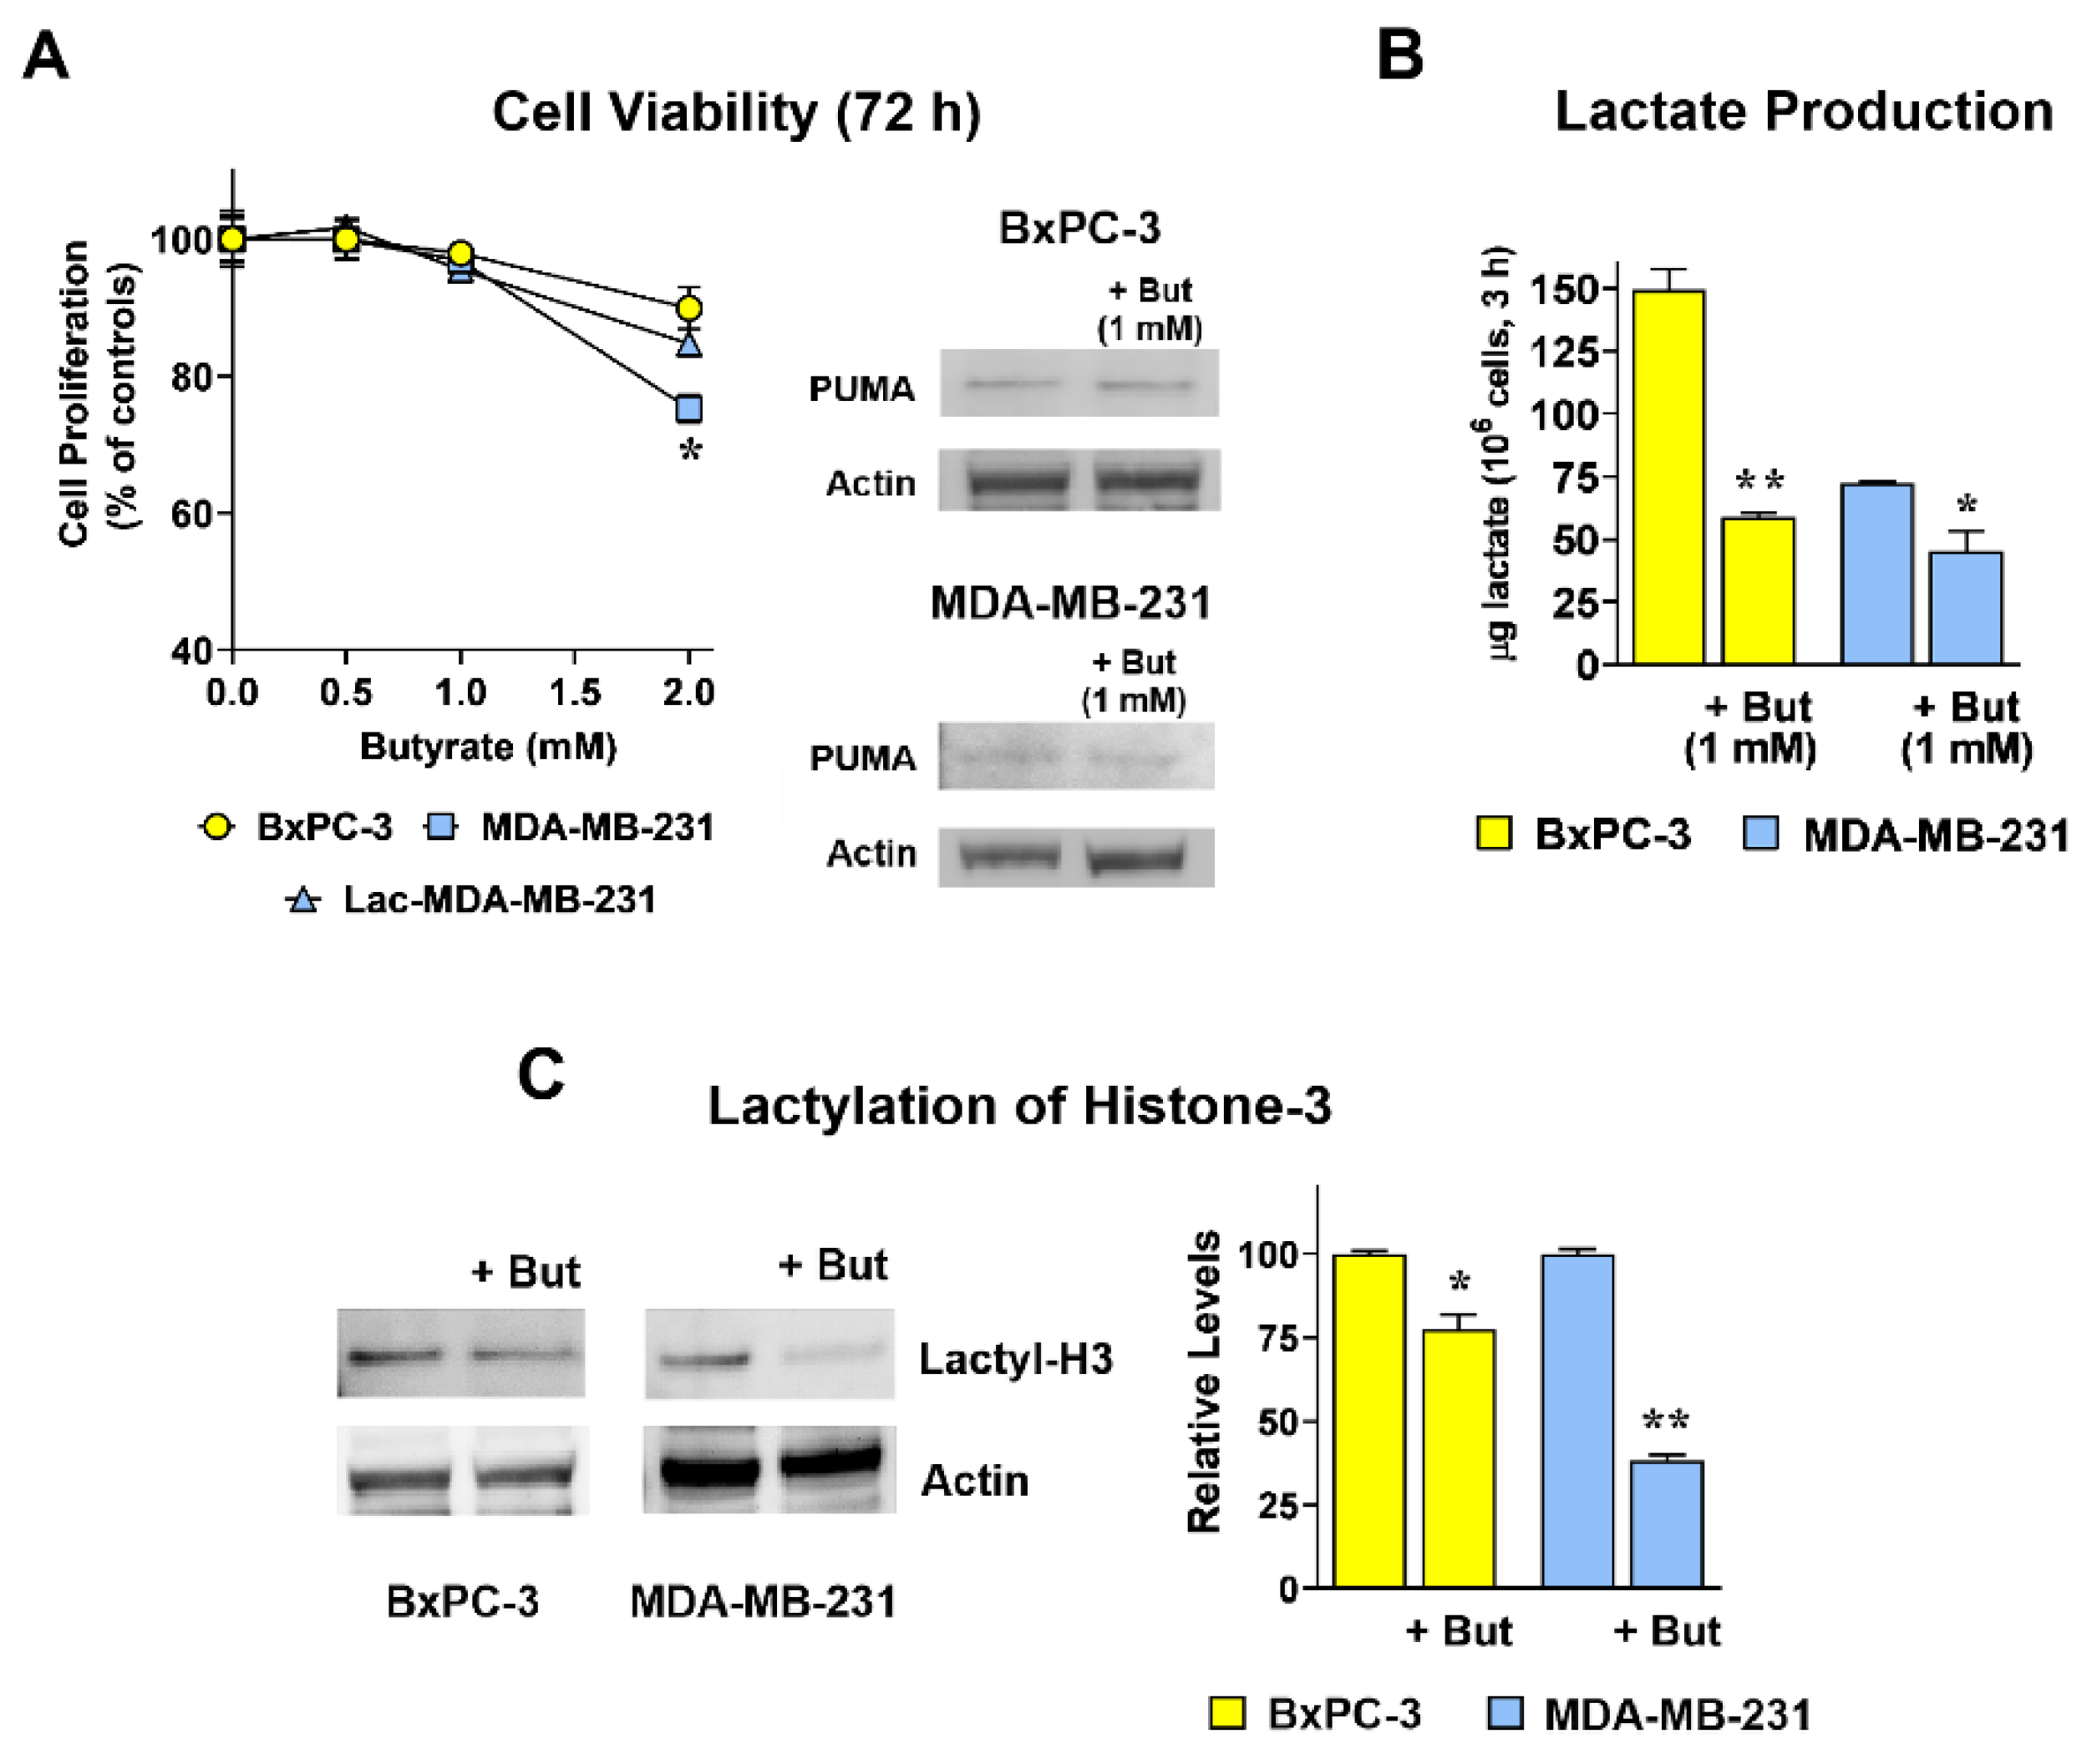
Figure 2.
(A), (B): 1 mM butyrate significantly increased the DNA damage signatures caused by CDDP (10 μM, 18 h) in the two cell cultures; (B) also shows that in MDA-MB-231 cells lactate exposure resulted in an opposite effect, significantly reducing DNA damage. * p < 0.05 vs the untreated cultures. (C) Butyrate significantly increased the antiproliferative effect of CDDP (5 μM, 72 h). As shown in the bar graph, in the Lac-MDA-MB-231 culture the effect of CDDP was significantly lower than that observed in the parental cell line. Data were analyzed by ANOVA followed by Tukey’s post-test: ** indicate a statistically significant difference vs cultures exposed to the single CDDP treatment, with p < 0.01. §§ indicate a statistically significant difference vs MDA-MB-231 cells exposed to CDDP, with p < 0.01.
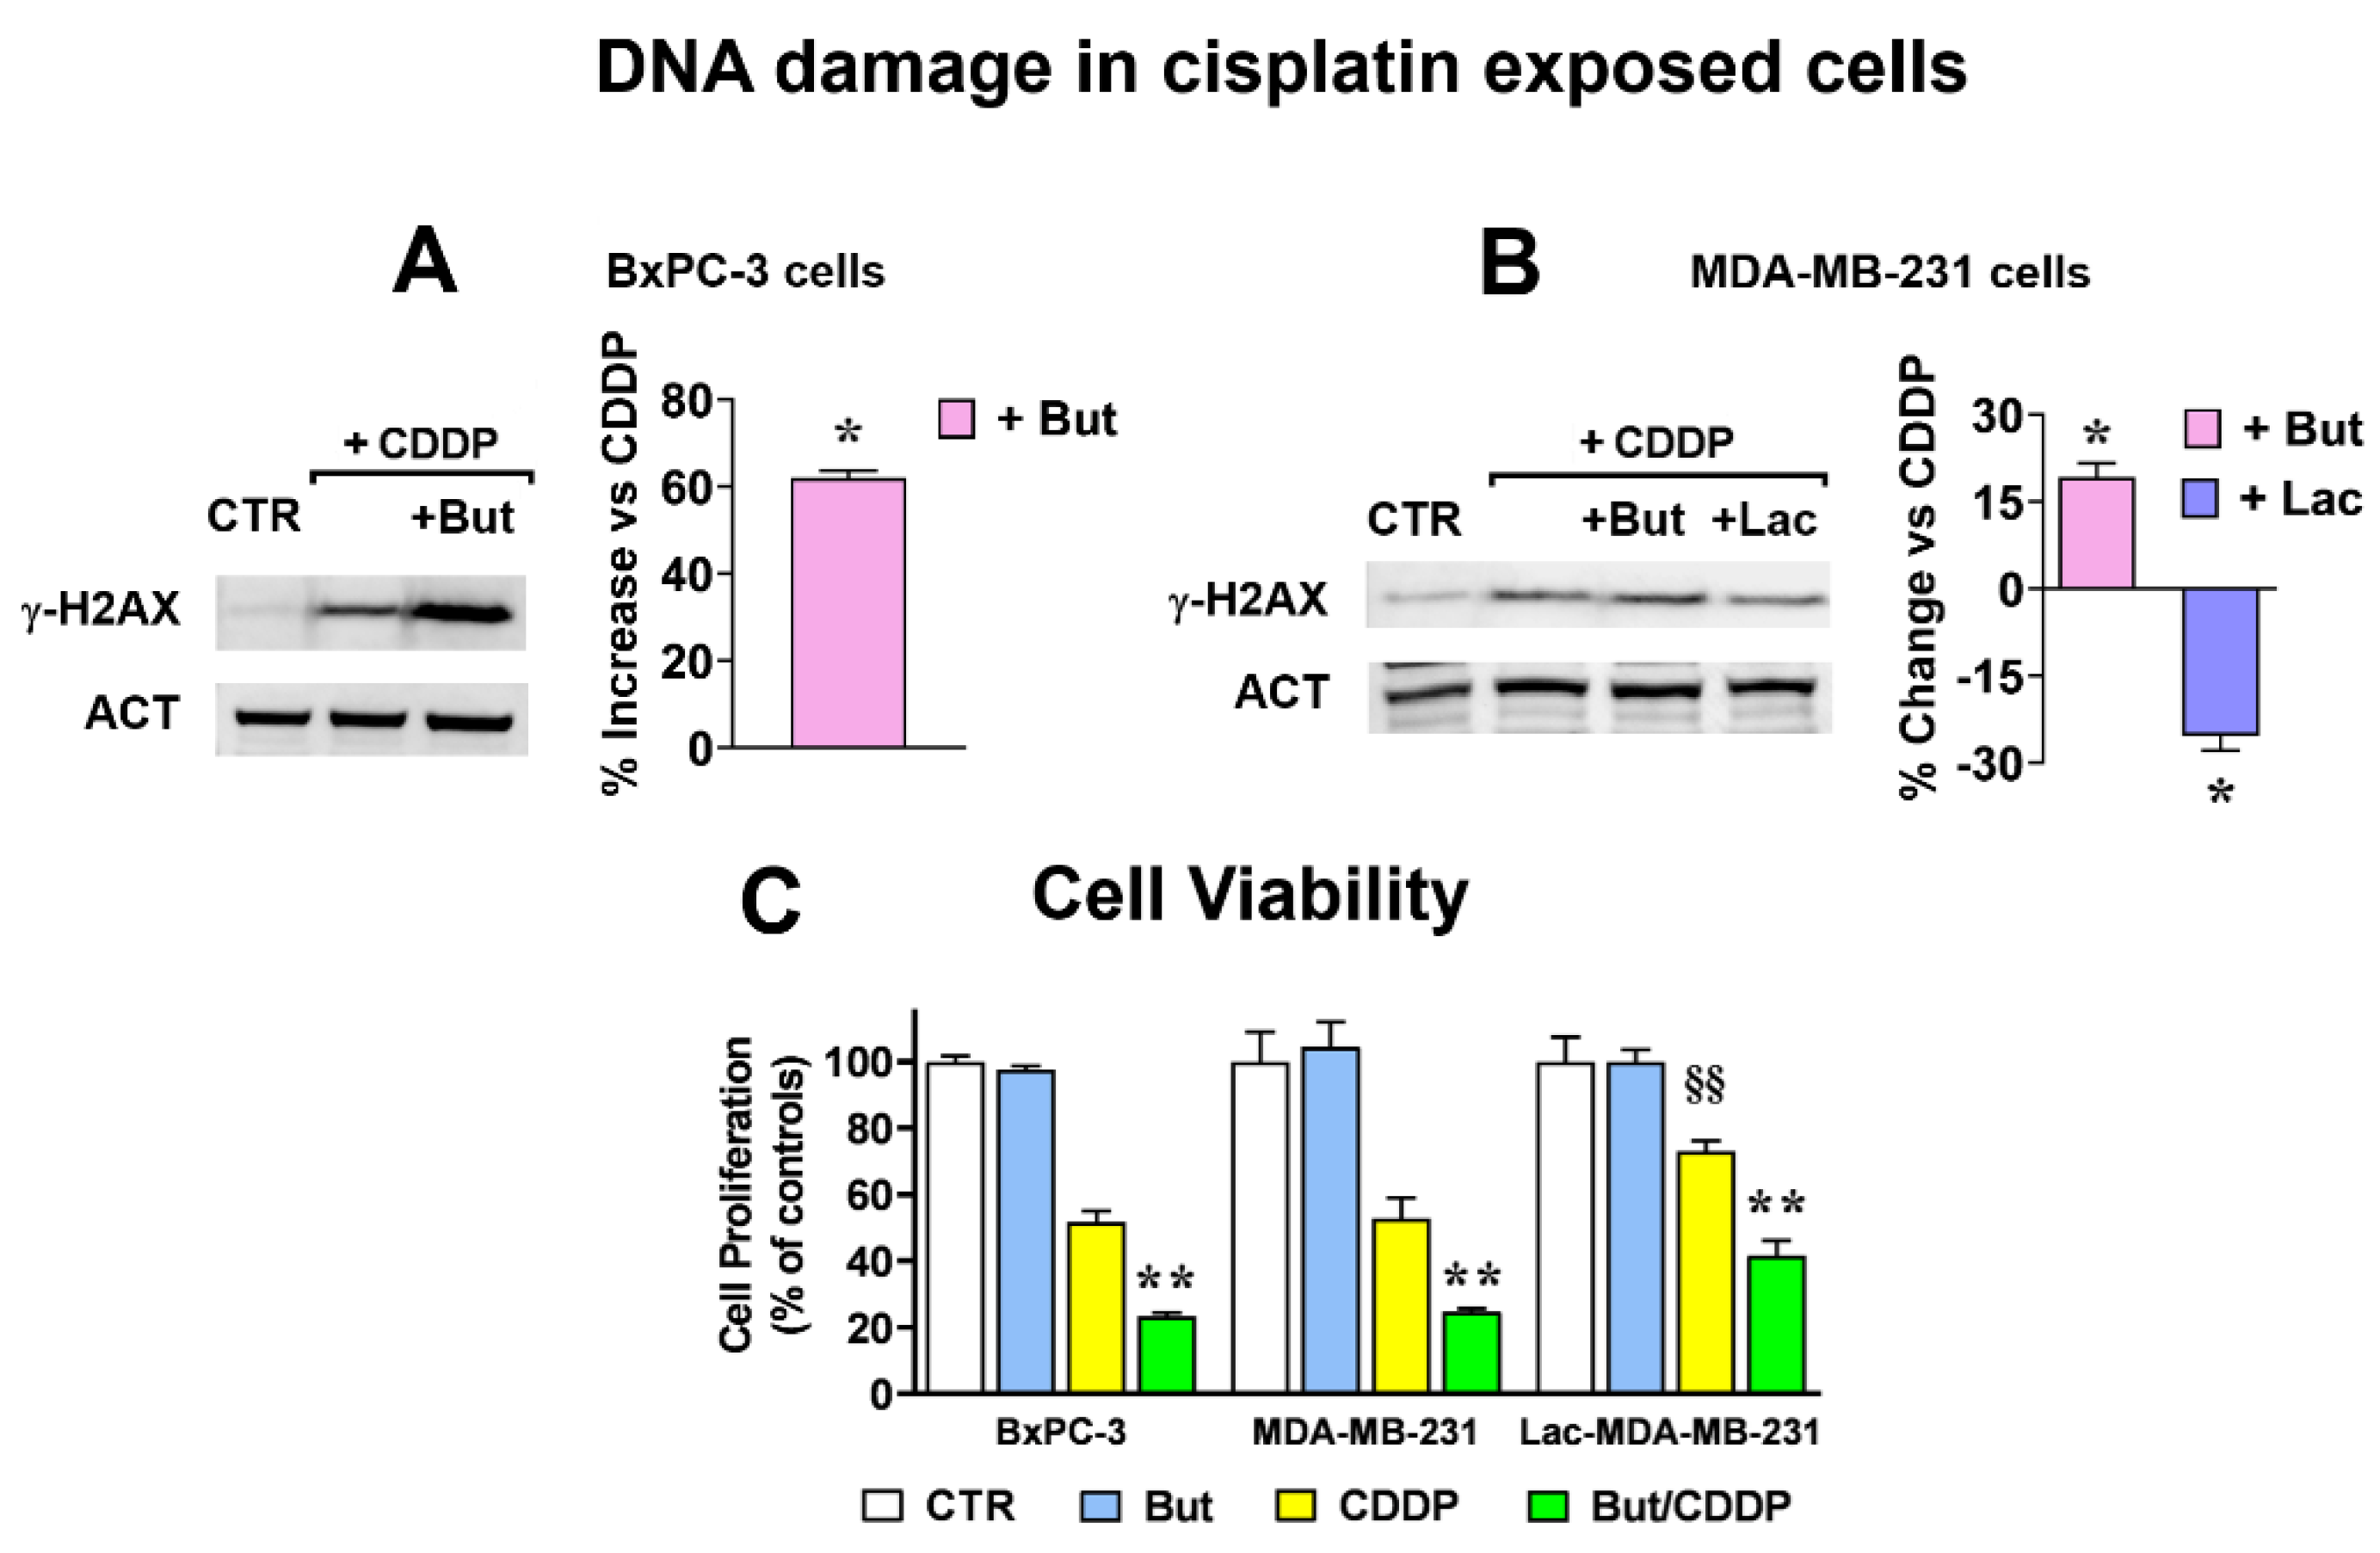
Figure 3.
(A) Changes in gene expression caused by butyrate and OXA in BxPC-3 cultures. With the exception of uPA, butyrate exposure caused a significantly reduced gene expression. * p < 0.05 vs untreated cells, as assessed by paired t-test. (B) The changes in gene expression were confirmed by the immunoblotting evaluation of proteins. * and ** indicate a statistically significant difference in treated vs control cells with p < 0.05 and 0.01, respectively, as assessed by paired t-test.
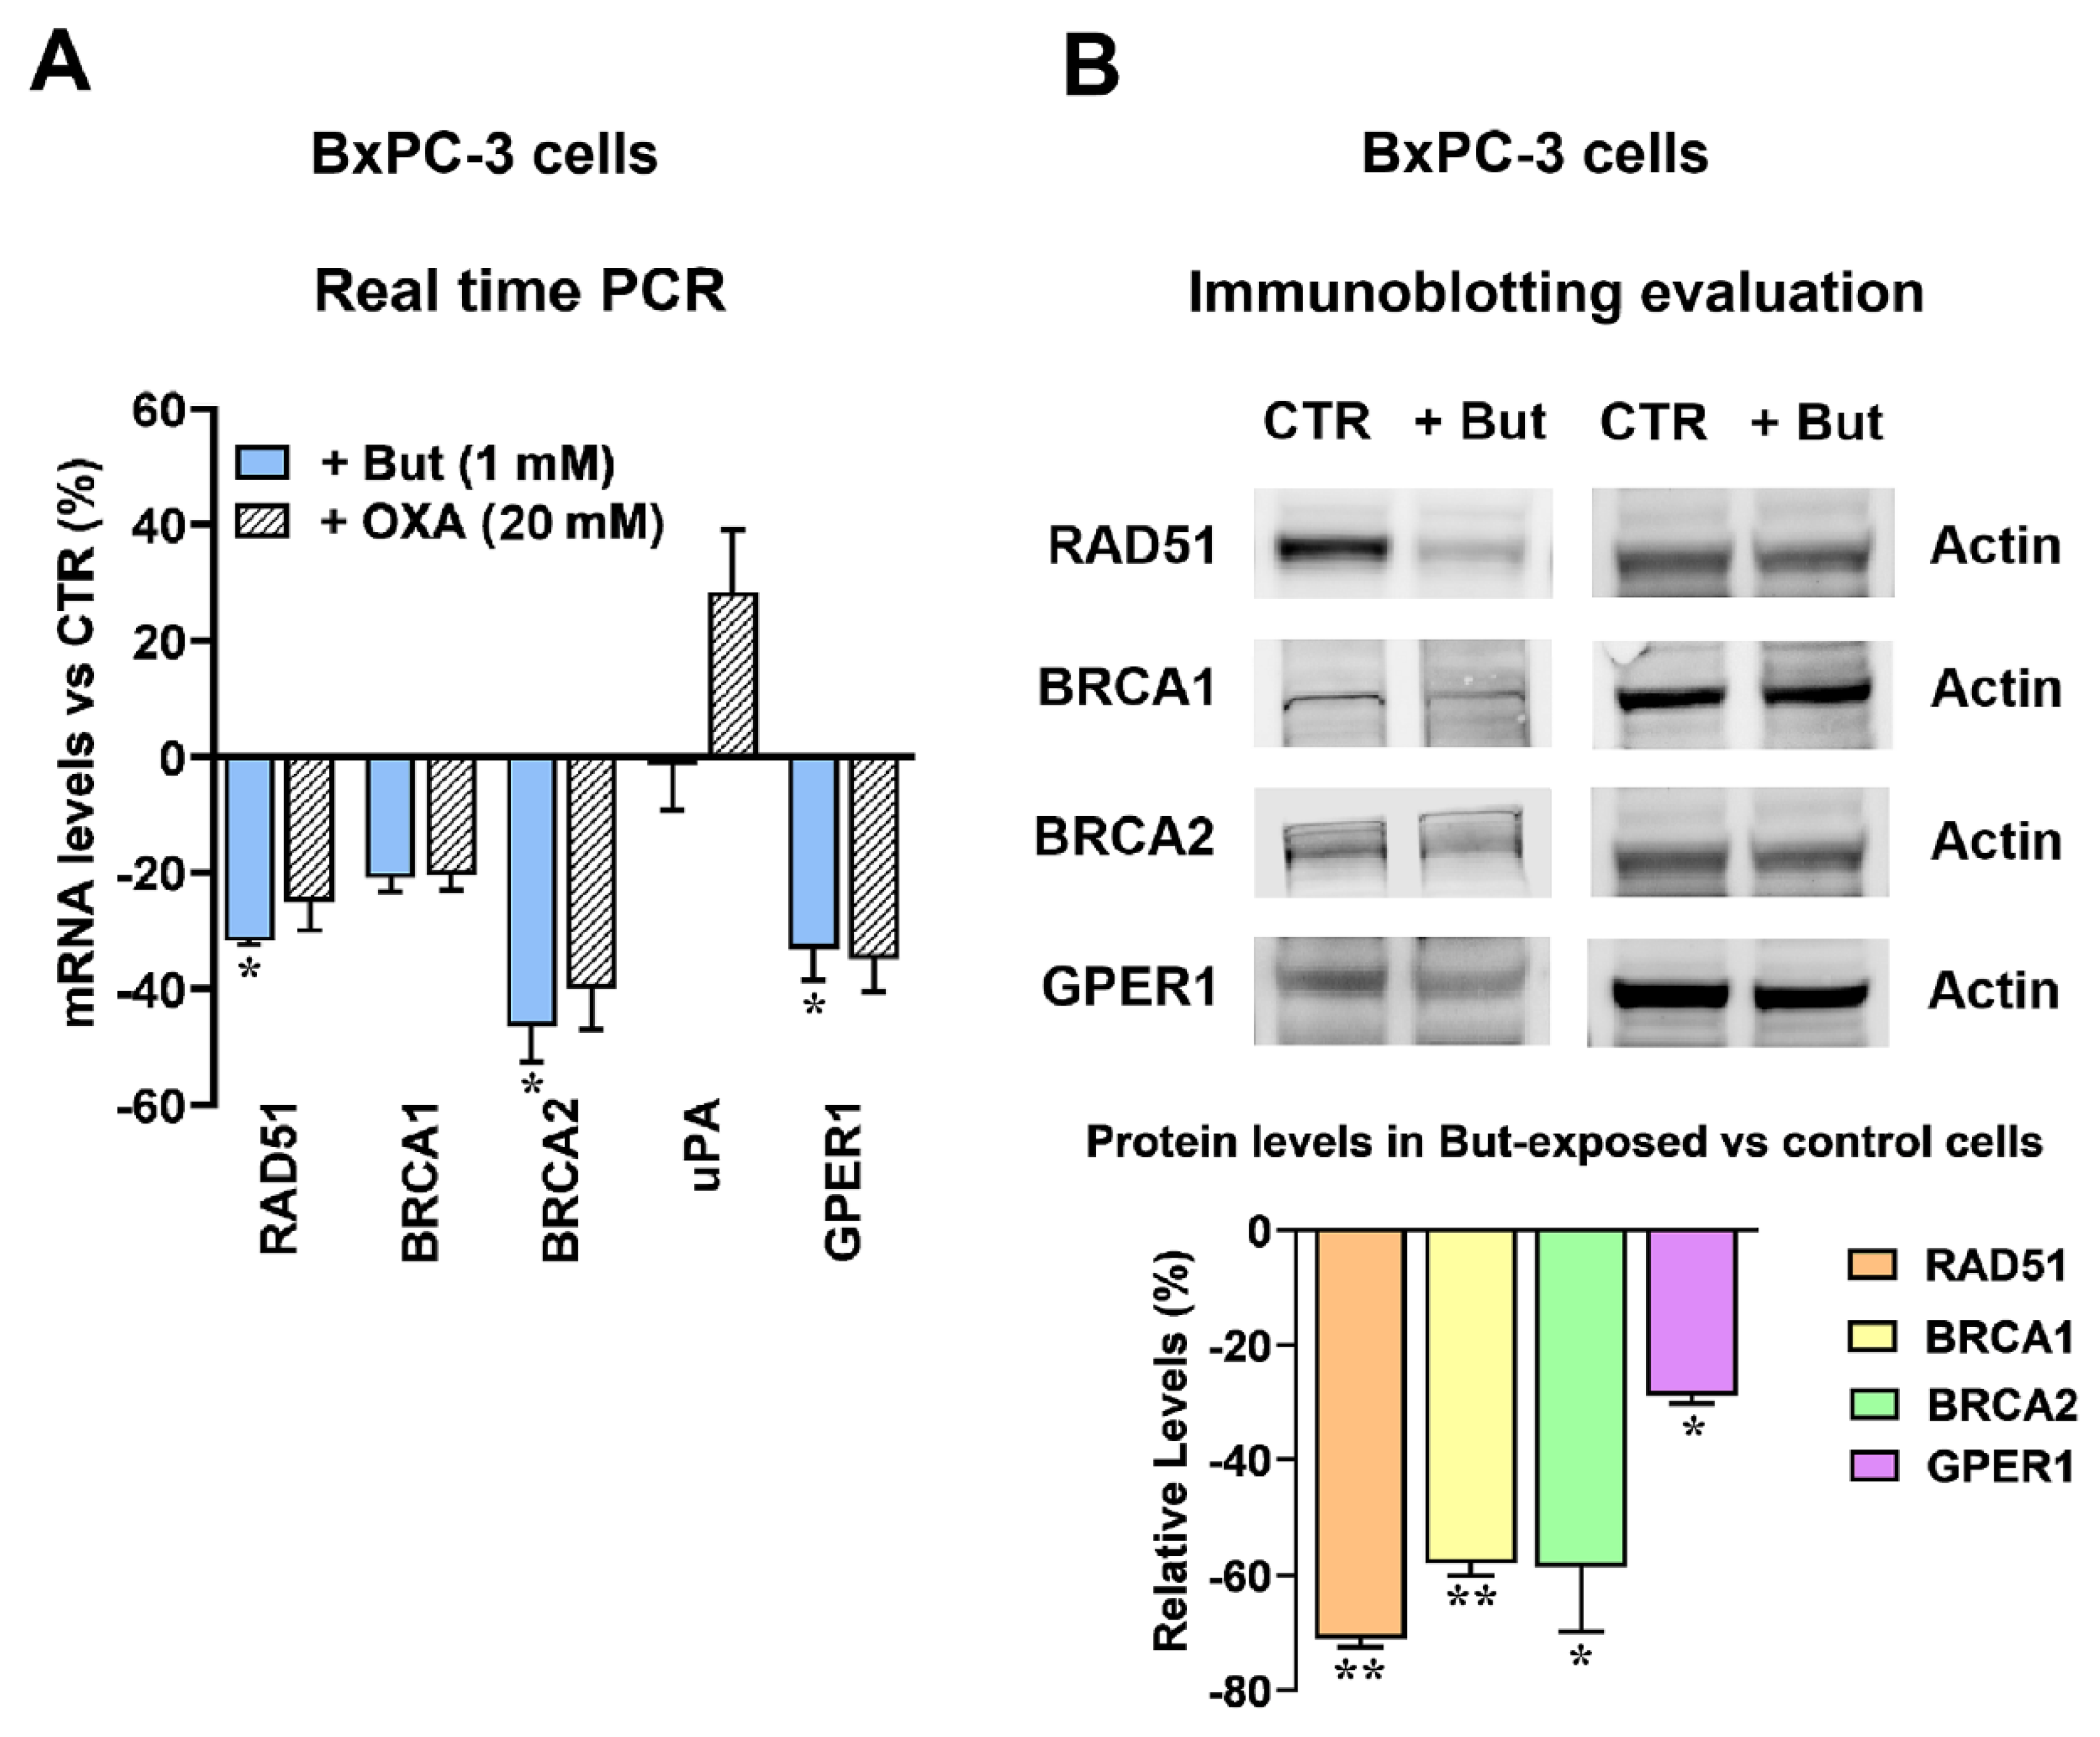
Figure 4.
(A) Changes in gene expression caused by butyrate and lactate in MDA-MB-231 cultures. Data were analyzed by ANOVA, followed by Tukey’s post-test. * and ** indicate a statistically significant difference in treated vs control cells with p < 0.05 and 0.01, respectively. (B) The changes in gene expression were confirmed by the immunoblotting evaluation of proteins. * Indicates a statistically significant difference in treated vs control cells with p < 0.05, as evaluated by ANOVA followed by Tukey’s post-test.
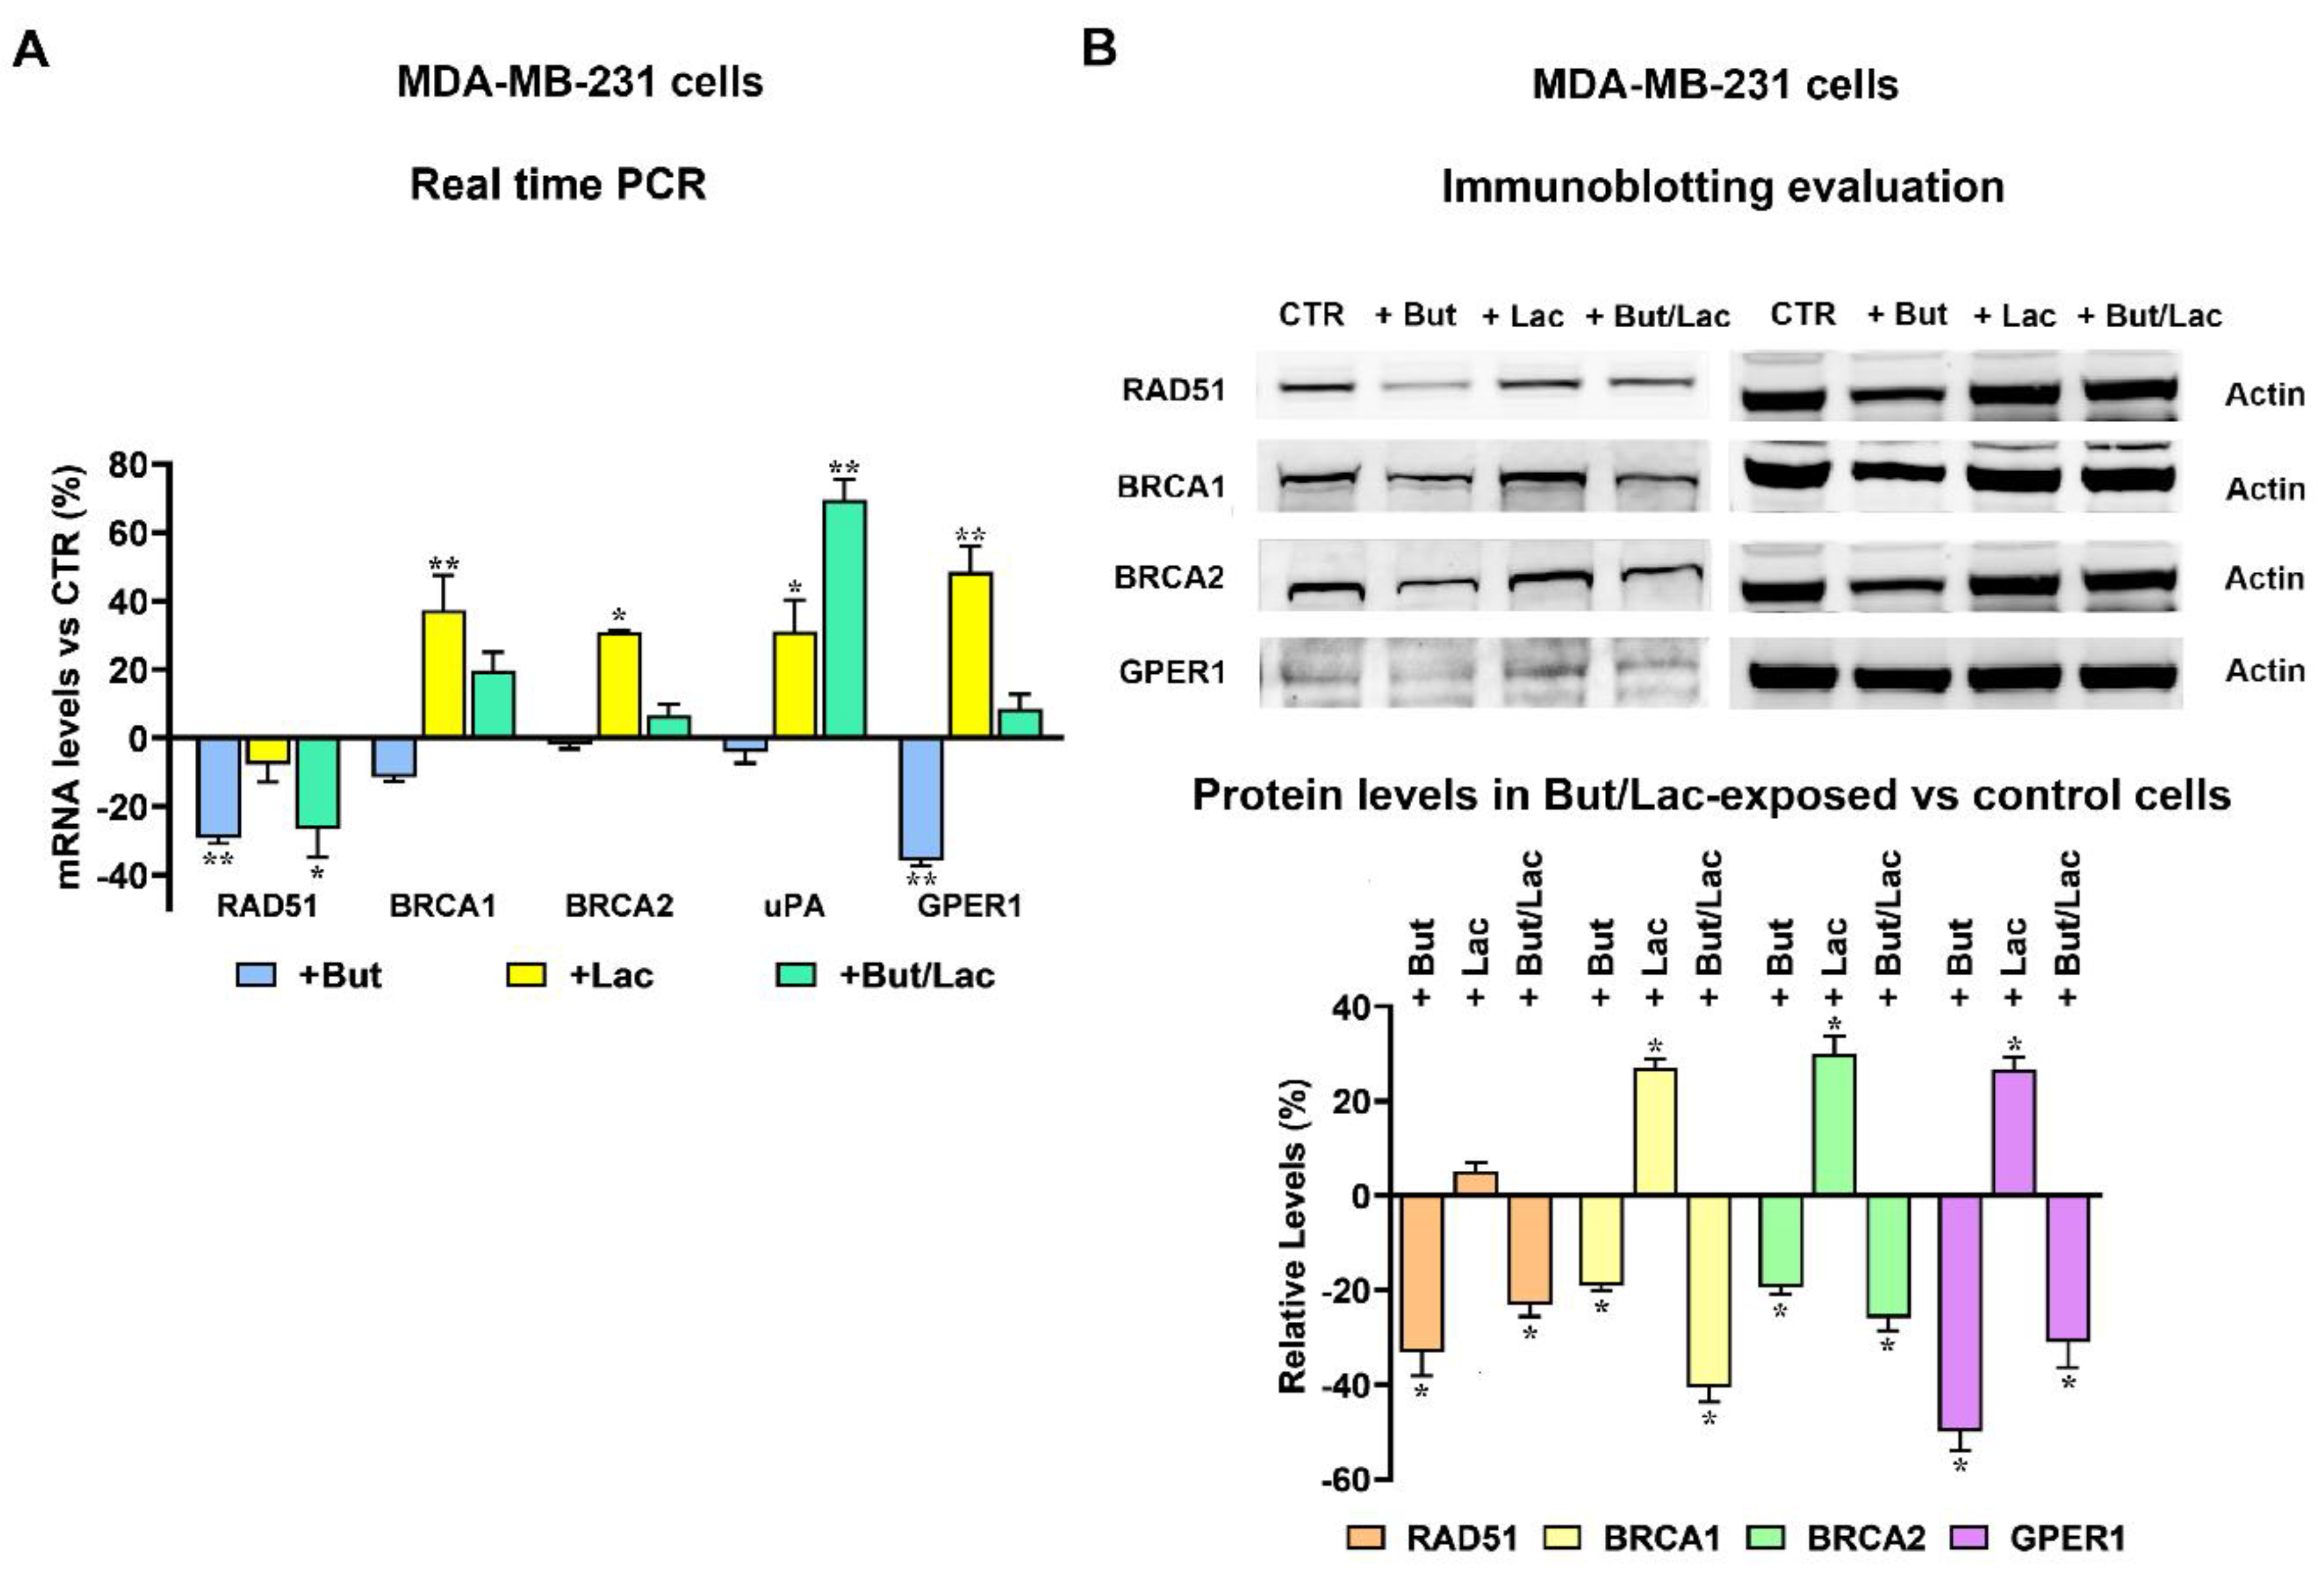
Figure 5.
(A-C) Evaluation of HR function in the two cell cultures. Compared to BxPC-3 cells, MDA-MB-231 cultures showed a 75%-reduced HR function. In both cell lines, butyrate treatment caused a 50% inhibition of HR function, which, on the contrary, appeared to be significantly increased by lactate in MDA-MB-231 cells. Data were analyzed by t-test (B) or ANOVA, followed by Tukey’s post-test (C); ** indicate a statistically significant difference in treated vs control cells with p < 0.01; §§ indicate a statistically significant difference vs lactate-exposed cells with p < 0.01. (D,E) Immunoblotting evaluation of FANCI and FANCD2 proteins in butyrate and/or lactate exposed cultures. In BxPC-3 cultures the reduced HR function caused by butyrate led to significantly increased FANCI and -D2 protein levels; In MDA-MB-231 cultures the upregulated HR function caused by lactate resulted in significantly reduced FANCI and -D2 protein levels (red boxes). Data were analyzed by t-test (D) or ANOVA, followed by Tukey’s post-test (E); ** indicate a statistically significant difference in treated vs control cells with p < 0.01.
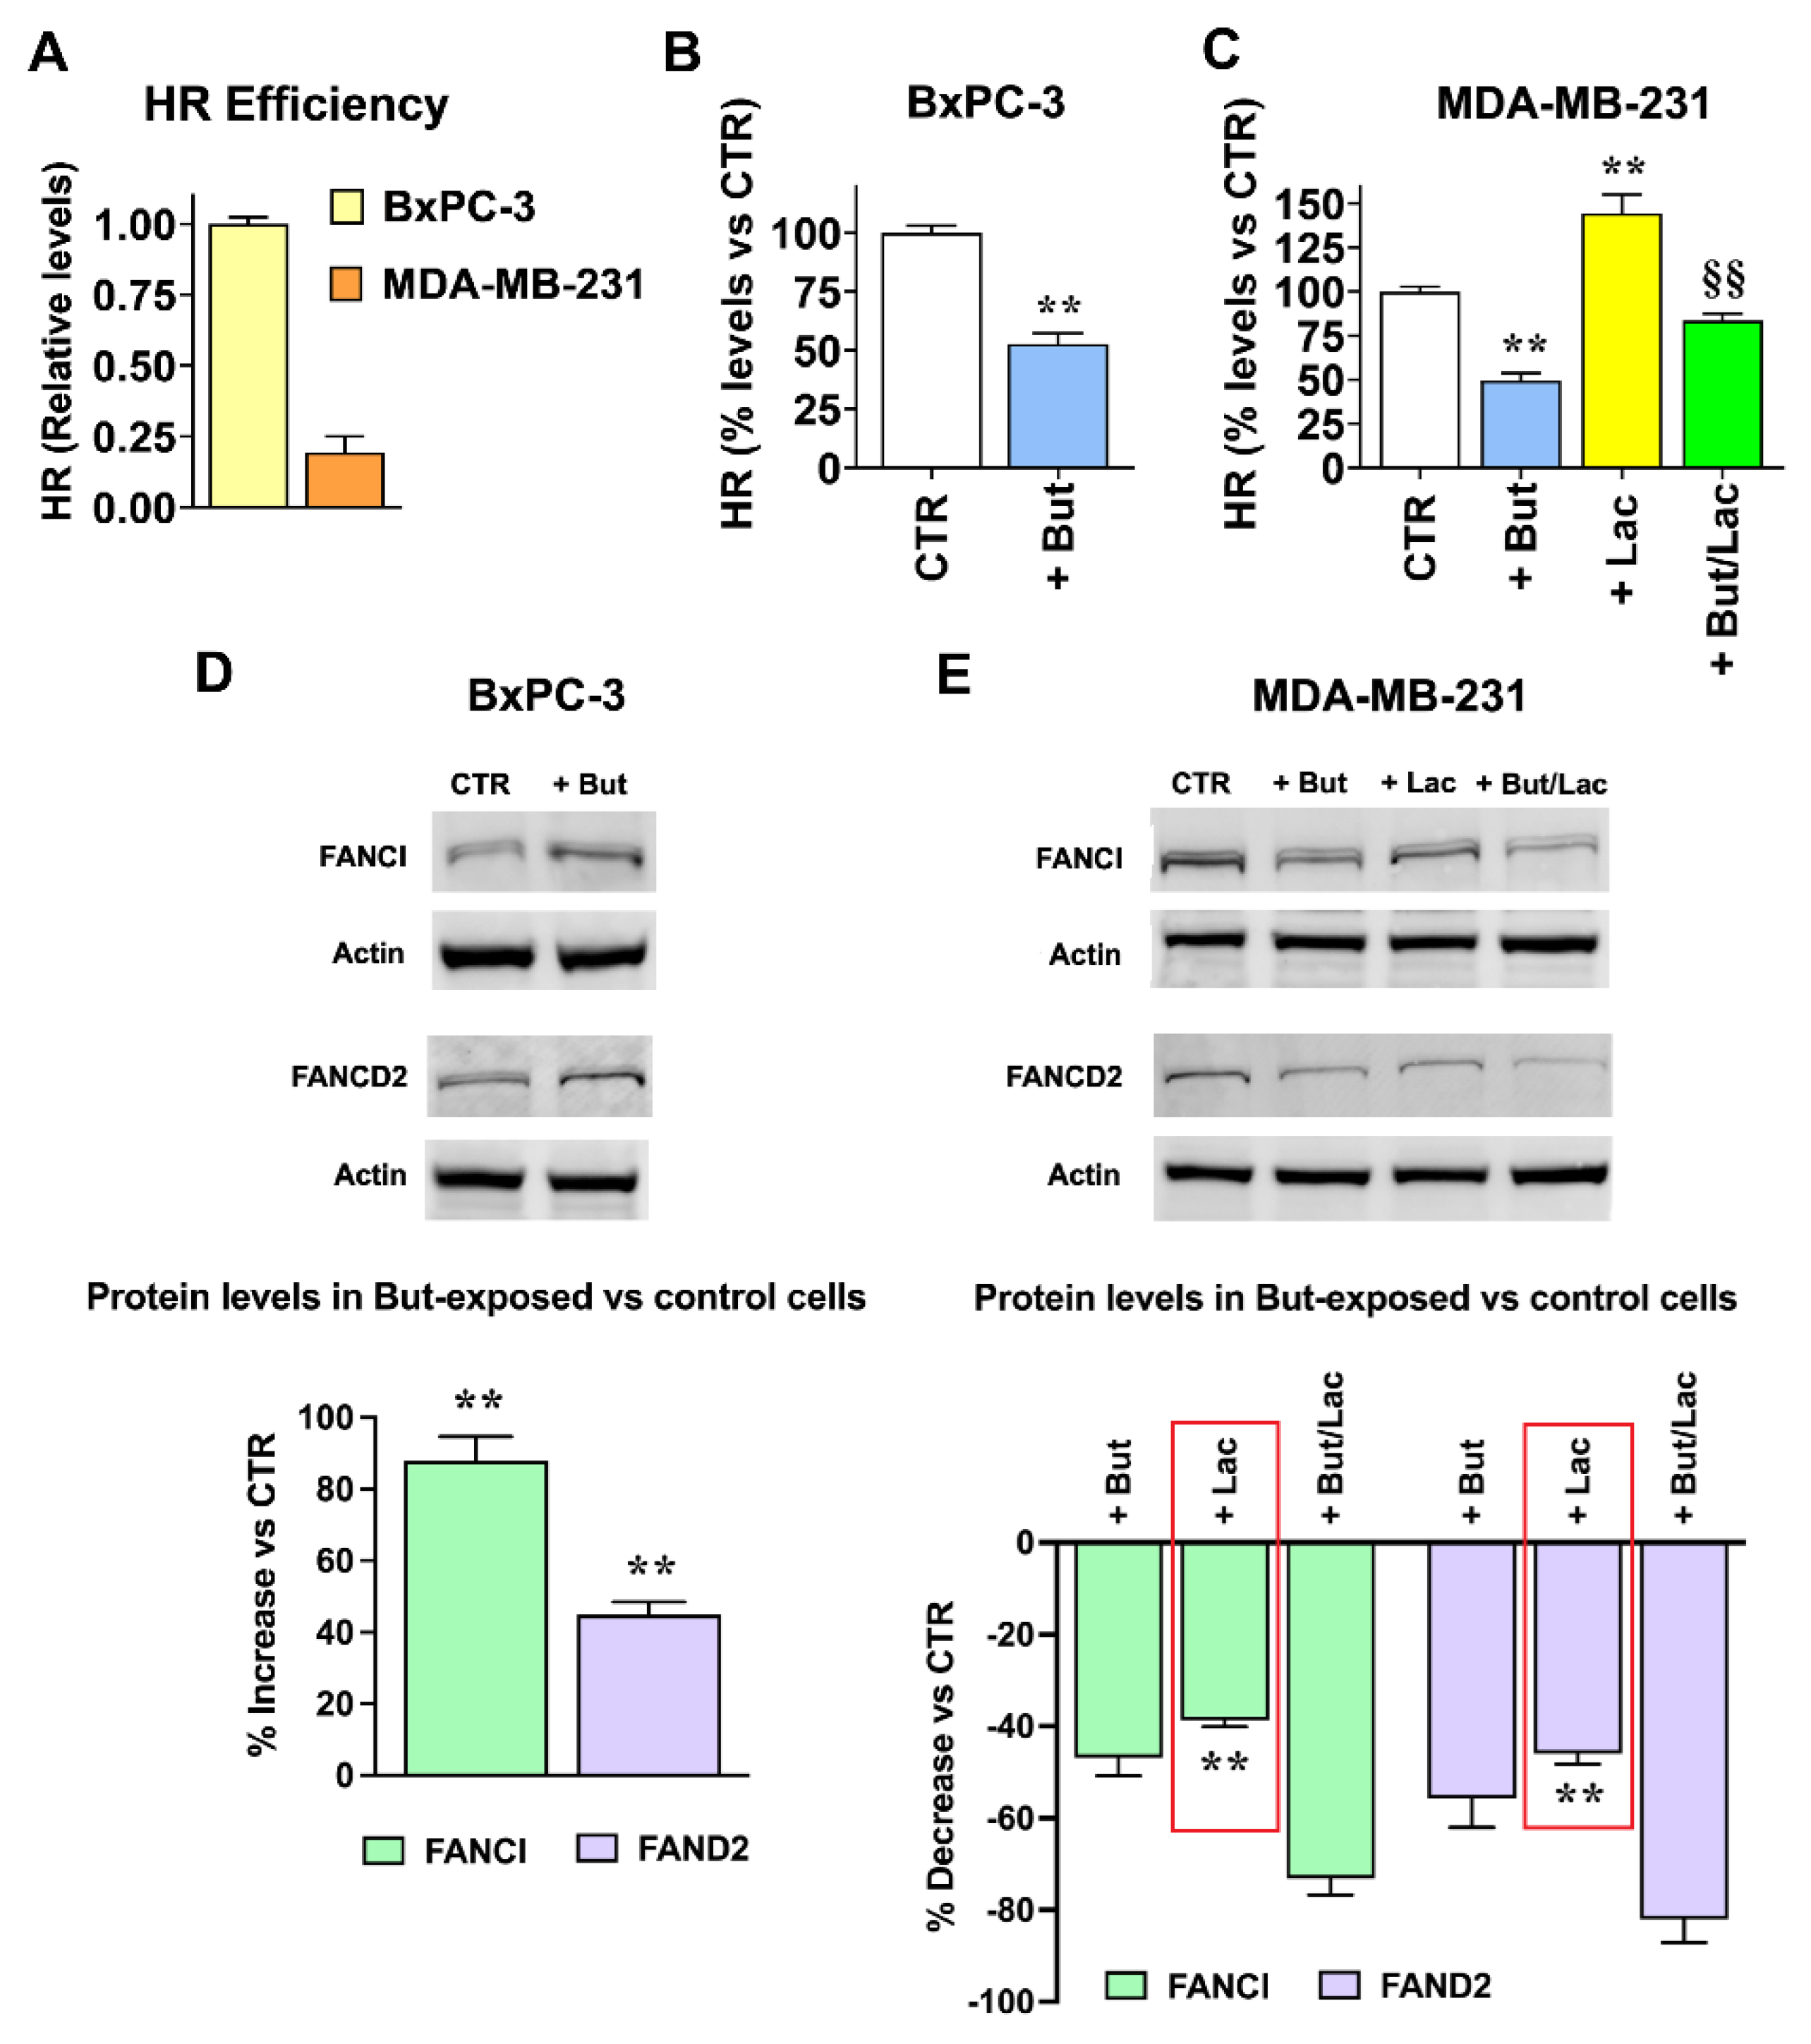
Figure 6.
Exometabolomic profiling of BxPC-3 cells exposed to butyrate. (A) Principal component analysis (PCA) score plot of BxPC-3 cells cultured for 72 h in control conditions (CTR) or in the presence of 1 mM sodium butyrate (But). Each point represents an independent biological replicate. (B) Volcano plot of differentially expressed metabolites (DEMs) in conditioned media from But-treated vs CTR cells. Thresholds were set at log2(fold change) = 0, and –log10(p-value) = 1.3 (significantly increased metabolites in red, significantly decreased metabolites in blue). Statistical analysis was performed using Welch’s t-test (But vs CTR) for each metabolite separately. (C) Heatmap of significantly altered metabolites in BxPC-3 conditioned media after 72 h treatment with But, reported as relative expression compared to CTR. (D) Joint pathway analysis performed in MetaboAnalyst (https://www.metaboanalyst.ca/home.xhtml) on BxPC-3 DEMs and differentially expressed genes (RAD51, BRCA1, BRCA2, GPER1, PLAU, BBC3, H2AX, FANCD2, FANCI). Dot size reflects pathway impact (degree centrality), and dot color encodes –log10(p-value). Enrichment analysis was performed using Fisher’s exact test, topology analysis using degree centrality, and integration using the “combine queries” option. Data are presented as mean of n = 3 biologically independent samples per condition.
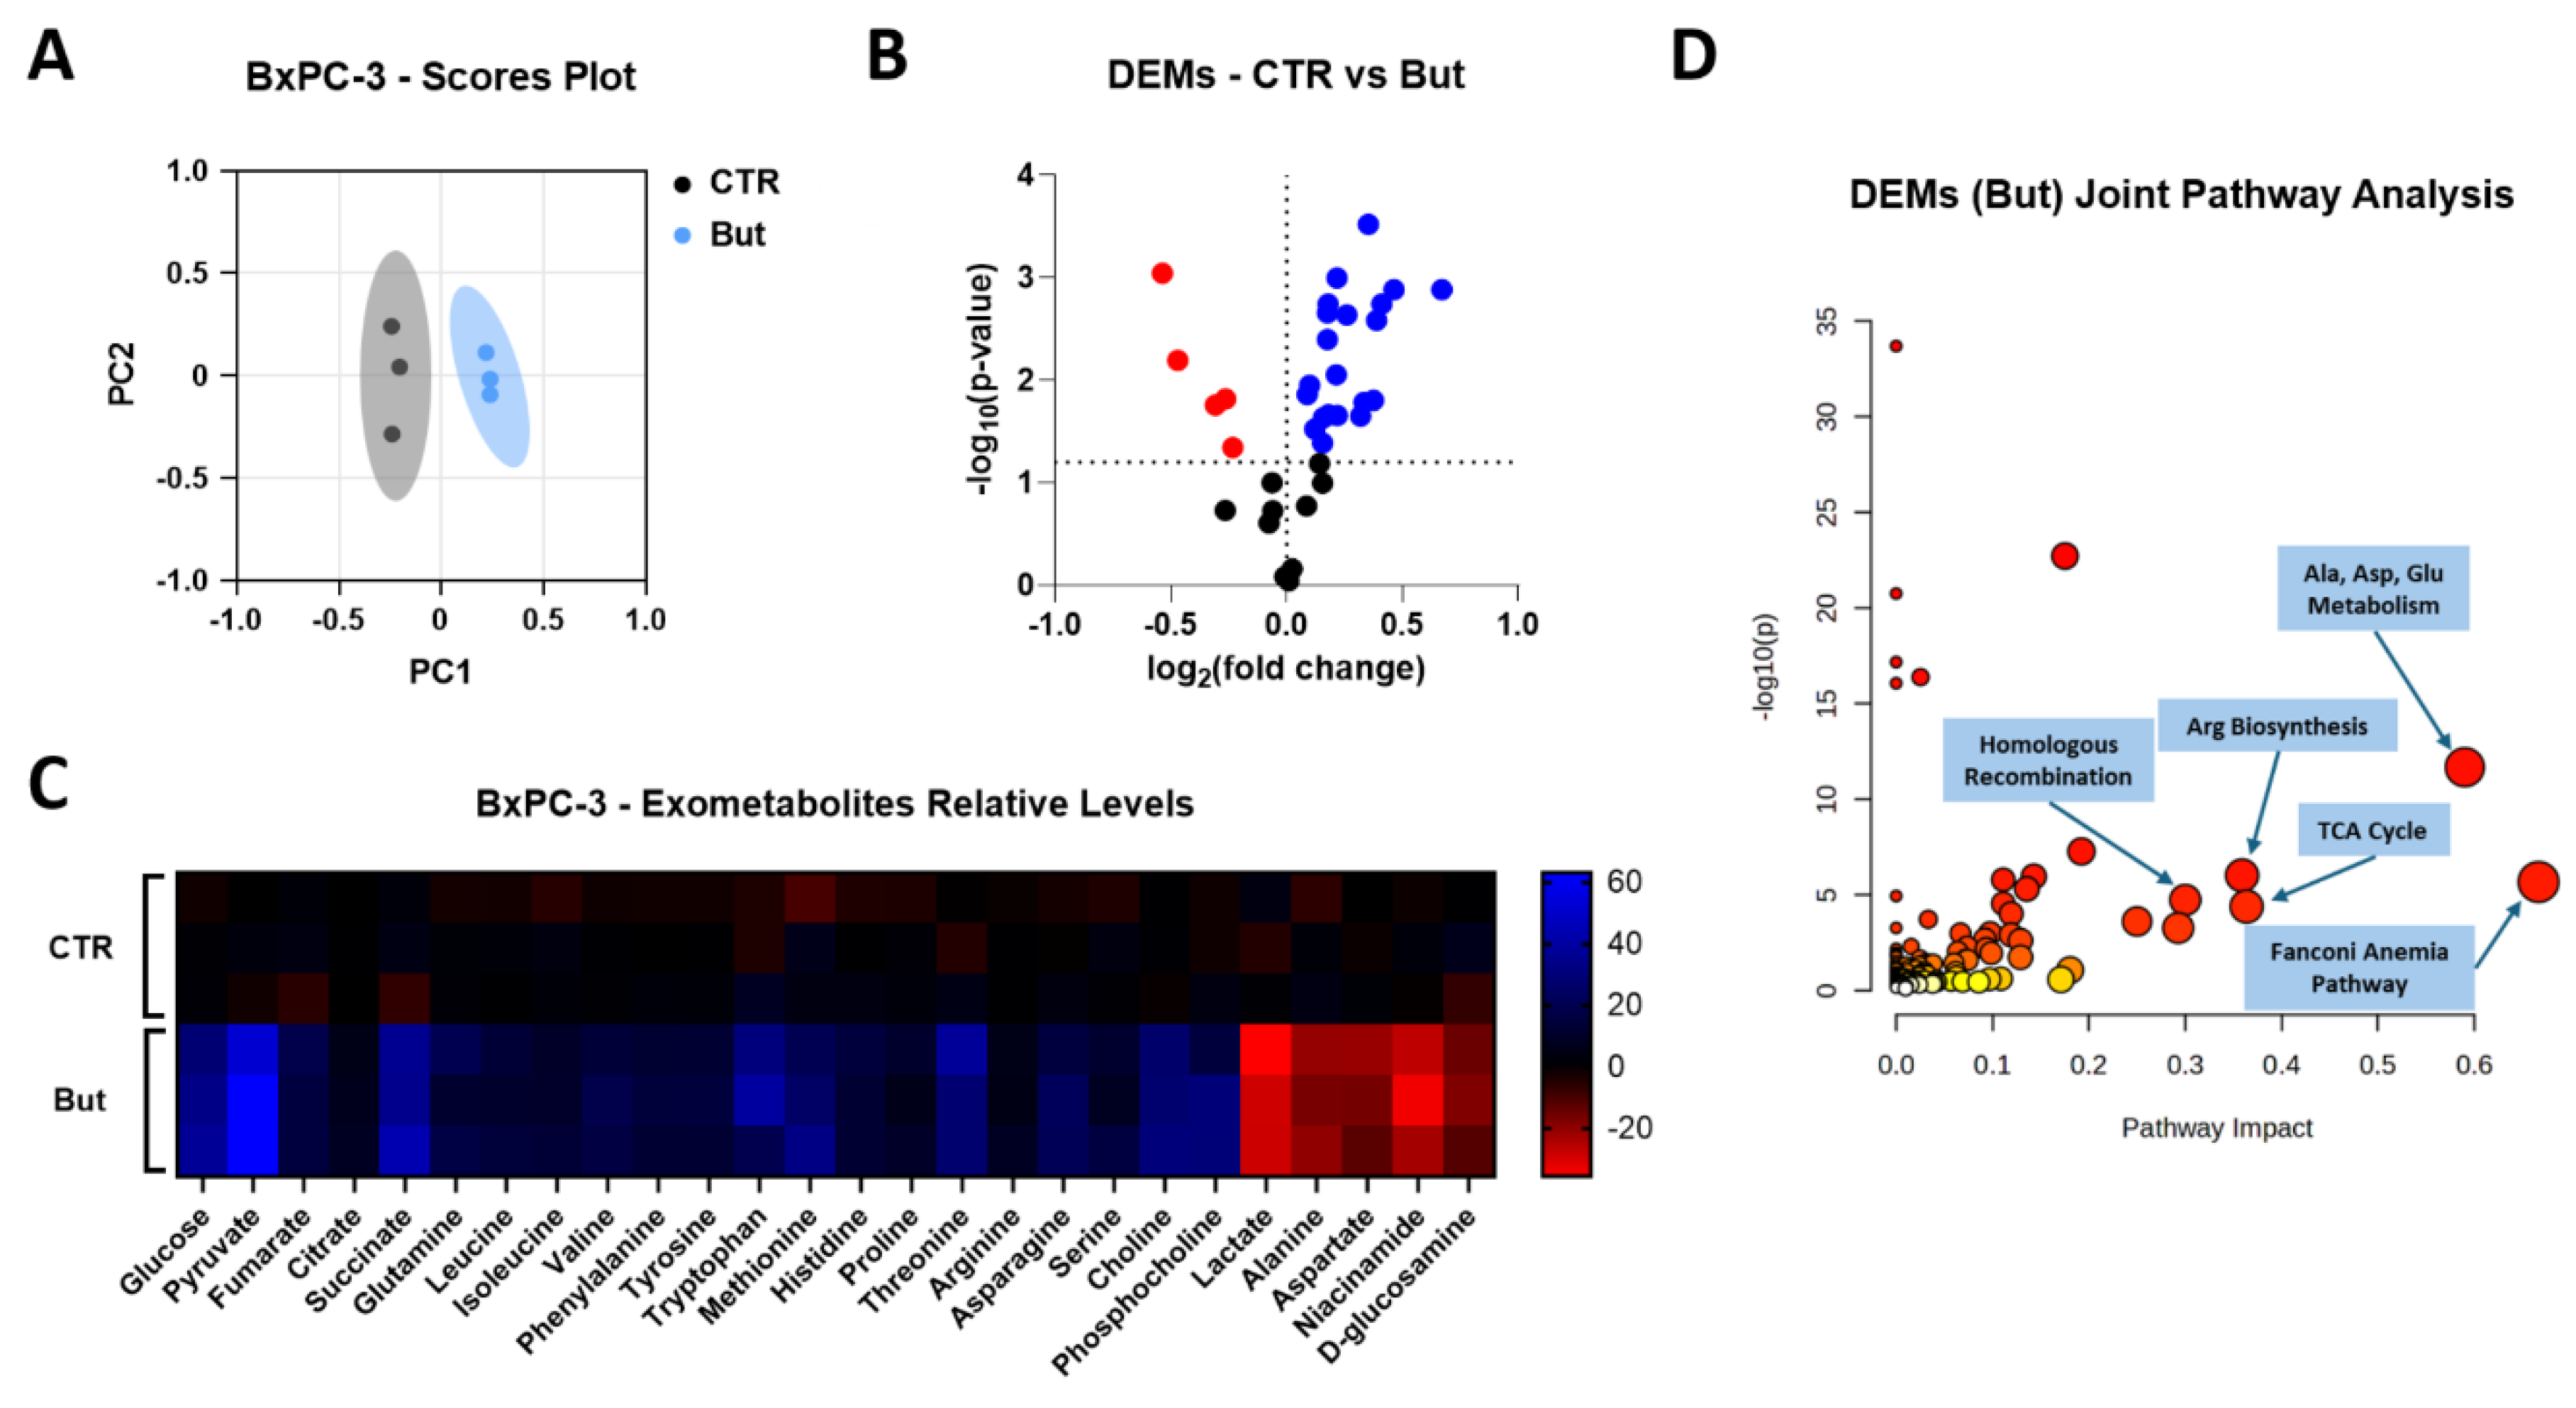
Figure 7.
Exometabolomic changes induced by butyrate and lactate in MDA-MB-231 cultures. (A) PCA scores plot of exometabolomic data obtained from MDA-MB-231 cultures maintained in control conditions (CTR) or exposed for 72 h to 1 mM butyrate (But), 20 mM lactate (Lac) or their combination (But/Lac). (B–D) Volcano plots showing DEMs in conditioned media from But-treated (B), Lac-treated (C) and But/Lac-treated (D) MDA-MB-231 cultures (vs CTR). Threshold were set at log2(fold change) = 0, and –log10(p-value) = 1.3 (significantly increased metabolites in red, significantly decreased metabolites in blue). Statistical analysis was performed by one-way ANOVA followed by Bonferroni’s post hoc test for each metabolite separately. (E) Heatmap of significantly altered metabolites in MDA-MB-231 conditioned media after 72 h treatment with But, Lac or But/Lac, reported as relative expression compared to CTR. (F–H) Joint pathway analyses performed in MetaboAnalyst on MDA-MB-231 DEMs and differentially expressed genes (RAD51, BRCA1, BRCA2, GPER1, PLAU, BBC3, H2AX, FANCD2, FANCI) for But (F), Lac (G) and But/Lac (H) vs CTR. Dot size reflects pathway impact (degree centrality), and dot color encodes –log10(p-value). Enrichment analysis was performed using Fisher’s exact test, topology analysis using degree centrality, and integration using the “combine queries” option. Data are presented as mean of n = 3 biologically independent samples per condition.
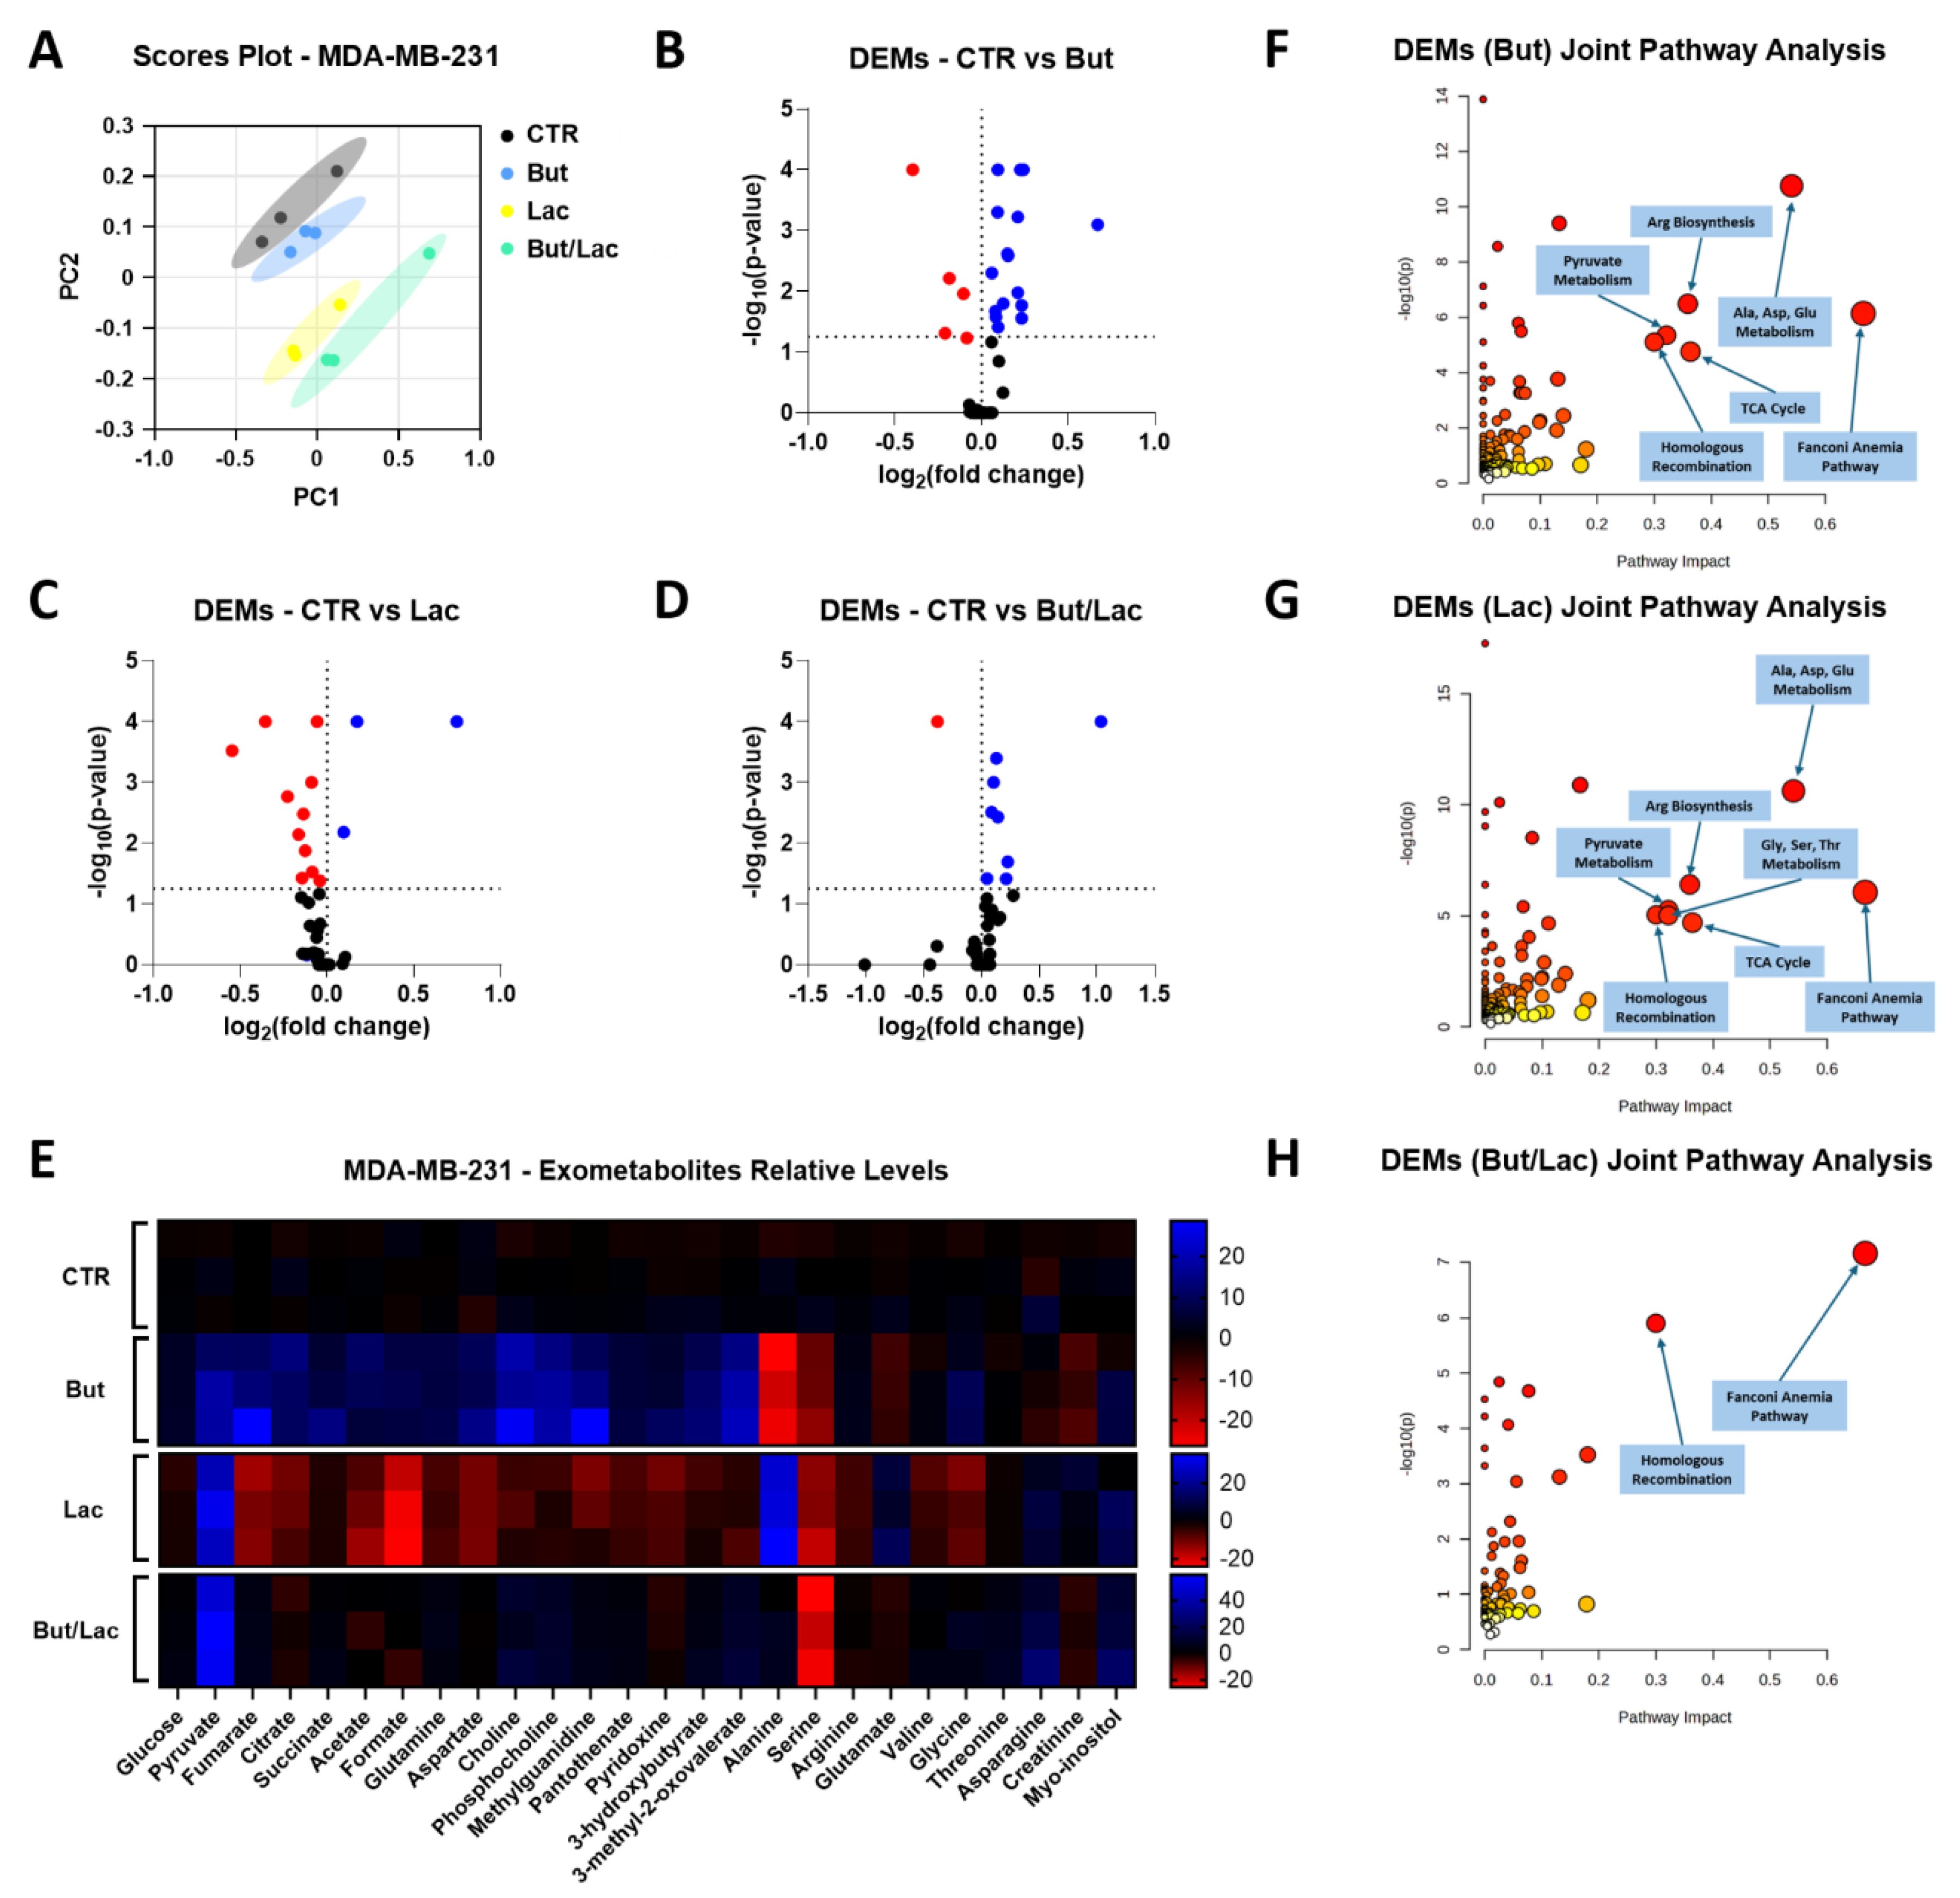
Figure 8.
Effects caused by the PARPi (Olaparib, 10 μM; Talazoparib, 2 μM) and by the RAD52 inhibitor (D-I03, 15 μM) on the proliferation of the cell cultures exposed to butyrate and/or lactate. Data were analyzed by ANOVA, followed by Tukeys’ post-test. * Indicates a statistically significant difference in treated vs control cells with p < 0.05. ## Indicate a statistically significant difference in treated vs control cells with p < 0.01. ** Indicate a statistically significant difference vs the single PARPi or D-I03 treatment, with p < 0.01. § Indicates a statistically significant difference between the effect caused by Olaparib in MDA-MB-231 cells vs Lac-MDA-MB-231 cultures.
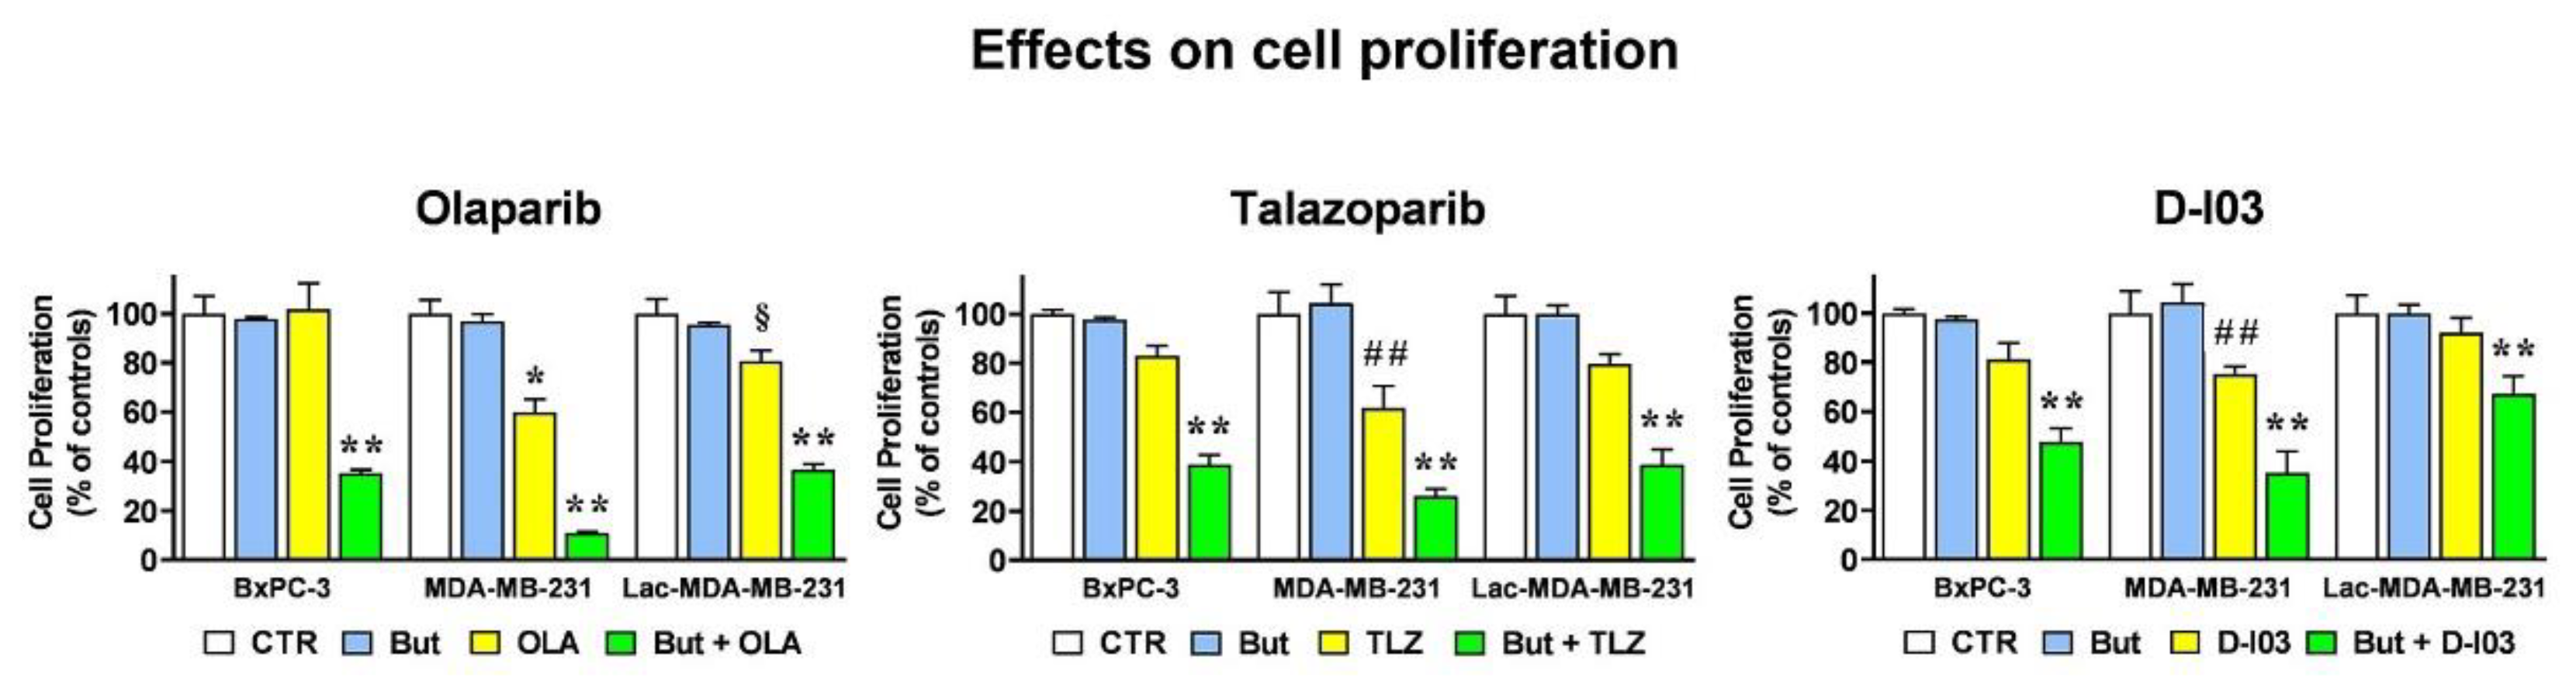

Table 1.
Details of oligonucleotide primer pairs used in the RT-PCR experiments.
| Gene | ID | Forward (5′-3′) | Reverse (5′-3′) |
|---|---|---|---|
| RAD51 | NM_001164269 | CAAATGCAGATACTTCAGTGGAA | TCCAGCTTCTTCCAATTTCTTCA |
| BRCA1 | NM_007294 | TATCCGCTGCTTTGTCCTCA | TGCAGGAAACCAGTCTCAGT |
| BRCA2 | NM_000059 | GAGAGTTCCCAGGCCAGTA | ACTGGAAAGGTTAAGCGTCA |
| uPA | NM_001145031 | GAAAACCTCATCCTACACAAG | ATTCTCTTTTCCAAAGCCAG |
| GPER1 | NM_001039966 | TTCCGCGAGAAGATGACCATCC | TAGTACCGCTCGTGCAGGTTGA |
| CYP33A (PPIE) | NM_006112 | GCTGCCTGTGCACTCATGAA | CAGTGCCATTGTGGTTTGTGA |
| RPLP0 | NR_002775 | CAGATTGGCTACCCAACTGTT | GGCCAGGACTCGTTTGTACC |
| B2M | NM_004048 | CATTCCTGAAGCTGACAGCATTC | TGCTGGATGACGTGAGTA |
Table 2.
Details of antibodies applied for protein detection.
| Experiments | Antibody | Host Species | Catalog No. | Producer | Dilution | Time |
|---|---|---|---|---|---|---|
| IB, primary | PUMA α / β | Mouse | Sc-374223 | Santa Cruz(a) | 1:500 | 16h (4 °C) |
| Lactyl-H3 | Rabbit | A21214 | ABClonal(b) | 1:3000 | 1h | |
| RAD51 | Rabbit | 70-012 | Bio Academia(c) | 1:1000 | 1h | |
| BRCA1 | Rabbit | 22362-1-AP | Proteintech(d) | 1:2000 | 16h (4 °C) | |
| BRCA2 | Rabbit | 9012 | Cell Signaling(e) | 1:1000 | 1h | |
| BRCA2* | Rabbit | A2435 | ABClonal | 1:750 | 16h (4 °C) | |
| GPER1 | Rabbit | A10217 | ABClonal | 1:1000 | 1h | |
| γ-H2AX | Rabbit | Ab11174 | Abcam(f) | 1:2000 | 1h | |
| FANCI | Rabbit | Ab245219 | Abcam | 1:1000 | 16h (4 °C) | |
| FAND2 | Rabbit | Ab178705 | Abcam | 1:2500 | 16h (4 °C) | |
| Actin | Rabbit | A2066 | Merck | 1:1000 | 2h | |
| IB, secondary | Rabbit IgG Cy5-labeled |
Goat | 111-175-144 | Jackson Immuno Research(g) |
1:2500 | 1h |
| Mouse IgG Alexa-Fluor 647-labeled |
Donkey | 715-605-151 | Jackson Immuno Research |
1:1000 | 1h |
(a): Santa Cruz Biotechnology Inc., Dallas, TX, USA. (b): AB clonal: German GmbH, Düsseldorf, Germany. (c): Bio academia: Osaka University, Osaka, Japan. (d): Proteintech: Rosemont, USA. (e): Cell Signaling: Danvers, MA,USA. (f): Abcam: Cambridge, UK. (g): Jackson Immuno Research: Cambridgeshire CB7 4 EX, UK. * This antibody was used in MDA-MB-231 cultures.
Disclaimer/Publisher’s Note: The statements, opinions and data contained in all publications are solely those of the individual author(s) and contributor(s) and not of MDPI and/or the editor(s). MDPI and/or the editor(s) disclaim responsibility for any injury to people or property resulting from any ideas, methods, instructions or products referred to in the content. |
© 2025 by the authors. Licensee MDPI, Basel, Switzerland. This article is an open access article distributed under the terms and conditions of the Creative Commons Attribution (CC BY) license (http://creativecommons.org/licenses/by/4.0/).
Copyright: This open access article is published under a Creative Commons CC BY 4.0 license, which permit the free download, distribution, and reuse, provided that the author and preprint are cited in any reuse.


