Submitted:
18 December 2025
Posted:
22 December 2025
Read the latest preprint version here
Preprints on COVID-19 and SARS-CoV-2
Abstract
For machine-learning analysis, a dataset consisting of 226 observations with 68 features obtained from 257 COVID-19 patients was used. To identify the most effective models for predicting COVID-19 severity, an extensive evaluation of available classifiers from the Scikit-learn library with default hyperparameter settings was conducted, including logistic regression, k-nearest neighbors, decision trees, ensemble algorithms (random forest, gradient boosting, bagging), naïve Bayes classifiers, support vector machines, and others. Model performance was assessed using Accuracy and AUC-ROC, with a focus on max-imizing AUC-ROC to ensure optimal class discrimination. Optimal hyperparameters for each model were defined as those yielding the highest mean AUC-ROC value during 5-fold cross-validation. Ensemble methods such as ExtraTreesClassifier (Accuracy: 0.974 ± 0.022) and RandomForestClassifier (Accuracy: 0.960 ± 0.035) demonstrated ROC curves approaching that of an ideal classifier (upper-left corner of the plot), confirming their excellent performance in predicting COVID-19 severity. Simpler models, including BernoulliNB (Accuracy: 0.956 ± 0.037) and DecisionTreeClassifier (Accuracy: 0.938 ± 0.043), also showed high classification quality. Analysis of misclassification patterns revealed that ExtraTreesClassifier, HistGradientBoostingClassifier, BaggingClassifier, and Gradi-entBoostingClassifier made no errors across any class. The poorest performance was observed with LinearDiscriminantAnalysis, which generated 11 misclassifications, followed by CalibratedClassifierCV, and LogisticRegressionCV.
Keywords:
COVID-19
; machine-learning models
; classifiers
; correlations
; accuracy
; ROC curve
; ensemble methods
; ExtraTreesClassifier
; RandomForestClassifier
; HistGradientBoostingClassifier
; BaggingClassifier
1. Introduction
COVID-19, caused by SARS-CoV-2 infection, is mild to moderate in the majority of previously healthy individuals, but can cause life-threatening disease or persistent debilitating symptoms in some cases [1]. With millions of confirmed cases worldwide, a comprehensive understanding of the risk and protective factors for COVID-19 will be helpful for the prevention of disease infection, progression, and adverse outcomes in infected patients [2,3]. Based on current evidence, major risk factors for the severity and mortality of COVID-19 include older age, male sex, and ethnicity, and the presence of comorbidities such as cardiovascular disease, obesity, chronic respiratory disease, diabetes, cerebrovascular disease, chronic renal failure [4,5,6,7]. Biomarkers predicting severe disease include different markers of inflammation and acute phase reaction, e.g. CRP, procalcitonin (PCT), white blood cells (WBC), lymphopenia, and interleukin 6 (IL-6) [8,9]. Increased D-dimer levels, as a marker for hypercoagulation and thrombosis, were found to be elevated in non-survivors, whereas other coagulation markers failed to show reliable statistical and clinical difference [10,11]. Markers indicating cardiac damage, such as cardiac troponin I or T, and N terminal pro B type natriuretic peptide (NT-proBNP) were also associated with severe disease and mortality [12,13].
Early identification of COVID-19 patients at risk of critical illness is crucial for early identification of patients requiring urgent medical attention or who would benefit the most from treatment. In addition, early prediction of the disease course not only enables cost-effective allocation of health care resources, but potentially decreases fatality rates as well [14,15].
Artificial intelligence (AI) has emerged as a promising tool, offering data-driven solutions to address major challenges in managing the pandemic [16]. AI-based predictive analytics, intelligent diagnosis, risk assessment systems, decision support platforms, and computational drug discovery hold tremendous potential for improving the prediction, detection, control, and treatment of COVID-19 [17]. The fundamental objective of AI is to enable machines to learn from data and experience, thereby enabling them to effectively and adaptively perform tasks resembling those carried out by humans. Machine learning (ML), a subset of AI, facilitates algorithms in learning from data without explicit programming. Instead of relying solely on hard-coded rules, machine learning algorithms construct predictive models by identifying patterns within extensive datasets [18,19].
Machine learning has emerged as an effective methodological framework for risk prediction and stratification, as it offers significant advantages over traditional statistical models when dealing with nonlinear interactions, heterogeneous predictors, and large-scale data sets [20]. Numerous existing machine learning models have demonstrated significant potential for early identification of patients at highest risk of severe COVID-19, using a variety of laboratory and clinical markers, laboratory parameters of coagulation and inflammation, and genomic or transcriptomic signatures. The results of the conducted studies demonstrate promising accuracy of coronavirus disease classification for predicting the development of severe forms, intensive care unit hospitalization, mechanical ventilation, and mortality [21,22,23]. However, often published results are controversial for various reasons, namely: different sample sizes, heterogeneous population characteristics, unclear feature selection strategies, different model tuning procedures, and results acquisition. Moreover, a fairly significant portion of the conducted studies lacked transparent standards of reproducibility or systematic comparative assessment of performance and accuracy, as well as high-quality external validation [24,25].
Therefore, the aim of the study was to analyse the performance of the best machine learning models for classifying and predicting the severity of COVID-19 based on the metrics of Accuracy and AUC-ROC, with a focus on maximizing AUC-ROC to identify models that provide the highest quality and accuracy of results. This research will contribute to the development of reliable, interpretable, and implementable machine learning-based decision support systems for early stratification of the risk of developing severe COVID-19, which will contribute to more personalized medical care for patients with coronavirus disease.
2. Materials and Methods
1.1. Data Collection and Preprocessing
In this machine-learning study, we used a dataset comprising 226 observations with 68 clinical, biochemical, and genetic features collected from 257 patients with confirmed COVID-19 (197 with a moderate-to-severe disease course and 60 with a mild course). The feature set included demographic variables (age, sex), genetic markers (single-nucleotide polymorphisms [SNPs] in FGB [rs1800790], NOS3 [rs2070744], and TMPRSS2 [rs12329760]), biochemical parameters (IL-6, endothelin-1, D-dimer, fibrinogen, etc.), and clinical characteristics (blood pressure, body mass index, comorbidities). The target variable was disease severity. The full distribution of patients depending on COVID-19 severity is given in our previous publication [26].
Diagnosis, laboratory investigation, and treatment were performed in accordance with the current national clinical guidelines, including the Protocol “Provision of Medical Assistance for the Treatment of Coronavirus Disease (COVID-19)” (Order of the Ministry of Health of Ukraine No. 762 of April 2, 2020, as amended by Order No. 913 of May 17, 2023) with subsequent updates [27], the standard “Coronavirus Disease (COVID-19)” (Order No. 722 of March 28, 2020, amended by Order No. 2122 of September 17, 2020) [28], as well as the recommendations of the WHO, CDC, and international diagnostic, treatment, and prevention standards for COVID-19 [29].
The study adhered to ethical principles of biomedical research in accordance with ICH/GCP guidelines, the Declaration of Helsinki (1964), the Council of Europe Convention on Human Rights and Biomedicine (1997), and current national legislation. Ethical approval was granted by the Ethics Committee of Bukovinian State Medical University (Protocol No. 2, October 2025). One of the key inclusion criteria was the presence of written informed consent for participation.
1.2. Development and Evaluation of Classification Models
To identify the most effective models for predicting COVID-19 severity, we performed an extensive evaluation of all available classifiers from the Scikit-learn library using default hyperparameter settings. Model performance was assessed using two primary metrics: Accuracy, representing the proportion of correctly classified samples, and the Area Under the Receiver Operating Characteristic Curve (AUC-ROC), which characterizes the model’s ability to discriminate between classes. To ensure robustness of results, we applied stratified 5-fold cross-validation, where the model is trained on four folds and tested on the remaining fold. This process is repeated five times such that each fold serves as a test set once, providing a stable and unbiased estimate of model performance. Stratification ensured that class proportions were preserved in each fold, which is critical for our imbalanced dataset, where the target variable Severity contained three classes with the following distribution: 142, 54, and 30 samples. To assess classifier performance in this multiclass classification task, we constructed ROC curves using the One-vs-Rest (OvR) approach. ROC curves allow for a visual evaluation of class discrimination capability, which is particularly important in medical datasets with imbalanced class distributions, such as ours (Severity: 142 samples for class 2, 54 for class 1, and 30 for class 0).
The ROC curve illustrates the relationship between the True Positive Rate (TPR) and the False Positive Rate (FPR) across different classification thresholds. In multiclass settings, ROC curves are typically built separately for each class using the OvR method, where each class is treated as positive and all others as negative. The AUC-ROC provides a quantitative measure ranging from 0 to 1, with 1.0 indicating perfect classification and 0.5 reflecting random guessing. For overall model evaluation, a weighted AUC-ROC was computed, taking into account the number of samples in each class. The target variable Severity included three categories, making this a multiclass classification problem. We employed the One-vs-Rest (OvR) framework, which constructs a binary classifier for each class against all others. This approach is widely used in Scikit-learn algorithms and offers effective scalability for problems with a limited number of classes, such as ours. All models were tested using default hyperparameters, allowing us to compare their baseline performance without customized optimization.
Given the class imbalance within the dataset, Accuracy was complemented by AUC-ROC, which is more informative for evaluating classifier quality under unequal class distributions. Stratified cross-validation ensured correct representation of all classes in both training and testing partitions, thereby enhancing the reliability and reproducibility of the results.
3. Results
In this study, the ROC curve was constructed for the top 10 classifiers identified in the previous analysis. Each model was evaluated using 5-fold stratified cross-validation to ensure the correct representation of all classes in both training and testing subsets. A weighted ROC metric was used to aggregate class-specific results into a single unified curve. The outcomes of ROC curve construction are presented in Figure 1. This figure displays the weighted ROC curve for each of the top 10 models, reflecting their aggregated performance in the multiclass classification task. All evaluated models demonstrated AUC-ROC values close to 1.0 (as noted in the previous section, the mean AUC-ROC for the top 10 models was 1.0), indicating a high ability of these classifiers to distinguish between the different severity categories of COVID-19.
Figure 1 illustrates that ensemble methods such as ExtraTreesClassifier (Accuracy: 0.974 ± 0.022) and RandomForestClassifier (Accuracy: 0.960 ± 0.035) exhibit ROC curves that closely approach that of an ideal classifier (the upper-left corner of the plot). This confirms their superior performance in predicting COVID-19 severity. Simpler models, including BernoulliNB (Accuracy: 0.956 ± 0.037) and DecisionTreeClassifier (Accuracy: 0.938 ± 0.043), also demonstrated high classification quality, although their ROC curves show minor deviations from the ideal, likely due to sensitivity to noise or lower structural stability. The consistently high AUC-ROC values across all models indicate their strong capacity to effectively differentiate between severity classes of COVID-19. The use of a weighted ROC curve provides a comprehensive evaluation of overall model performance while accounting for class imbalance in the dataset. However, the presence of near-ideal AUC-ROC values may also suggest potential overfitting or limited data variability within cross-validation folds, especially given the relatively small sample size (226 observations). Class imbalance—particularly the limited representation of class 0 (30 samples)—may influence performance, as models tend to achieve higher accuracy for the dominant class 2 (142 samples). The weighted ROC curves presented in Figure 1 confirm the superior performance of the top 10 classifiers, particularly ensemble methods such as ExtraTreesClassifier, RandomForestClassifier, and HistGradientBoostingClassifier, in predicting COVID-19 severity. Although the ideal AUC-ROC values (1.0) reflect excellent discriminatory capacity, external validation on an independent testing dataset is required to exclude potential overfitting. These findings form the basis for further hyperparameter optimization and subsequent development of a final model suitable for clinical application.
To determine the optimal hyperparameters for the top 10 classifiers, we employed either grid search or random search optimization. For each model, a set of relevant hyperparameters was selected, including the number of trees in ensemble methods, tree depth, learning rate for gradient boosting algorithms, and regularization parameters for logistic regression, among others. Hyperparameter optimization was performed using 5-fold stratified cross-validation to ensure correct class representation in both training and testing subsets, given the imbalance of the target variable. Model performance was evaluated using Accuracy and AUC-ROC, consistent with previous stages of analysis, with a primary emphasis on maximizing AUC-ROC to ensure high discriminatory power. The optimal hyperparameters for each model were defined as the combination that achieved the highest mean AUC-ROC across cross-validation folds. To assess the importance of input features, we employed the permutation importance technique. Permutation importance is a model-agnostic method for evaluating feature relevance based on random permutation of feature values in the test dataset and quantifying the resulting degradation in model performance. The algorithm proceeds as follows:
1. The baseline performance metric (in this study—Accuracy or AUC-ROC) is calculated for the model on the original test dataset.
2. The values of a selected feature are randomly permuted within the test set, thereby breaking the relationship between this feature and the target variable.
3. The performance metric is recalculated on the permuted dataset.
4. Feature importance is determined as the difference between the baseline metric and the post-permutation metric; a greater drop in performance indicates higher importance.
5. The procedure is repeated multiple times (in our case, within cross-validation) to obtain stable importance estimates.
This method is universal and applicable to any classifier, including both ensemble and linear models, because it does not depend on the model’s internal structure. Furthermore, it captures nonlinear relationships and interactions among features, which is essential for our dataset, where correlation analysis revealed strong associations between Severity and variables such as IL-6 (0.838), Depression (0.739), and LDL-H (0.663).
Hyperparameter optimization improved the performance of the top 10 classifiers compared with their default configurations. The performance metrics of the optimized models, evaluated using 5-fold stratified cross-validation, are presented in Table 1.
Comparison with the results of the baseline models revealed the following:
– ExtraTreesClassifier: A slight improvement in Accuracy (from 0.974 ± 0.022 to 0.974 ± 0.022), while AUC-ROC remained at 1.0. Optimization did not alter the outcomes, indicating a highly effective baseline configuration.
– RandomForestClassifier: Accuracy increased from 0.960 ± 0.035 to 0.965 ± 0.033, whereas AUC-ROC decreased from 1.0 to 0.9998, which may be associated with more conservative hyperparameter settings.
– HistGradientBoostingClassifier: Accuracy remained at 0.960, but the standard deviation decreased (from 0.038 to 0.029), suggesting improved model stability after optimization.
– BernoulliNB: Accuracy increased from 0.956 ± 0.037 to 0.960 ± 0.038, while AUC-ROC decreased from 1.0 to 0.9879, potentially reflecting the model’s sensitivity to the alpha parameter.
– BaggingClassifier: A substantial improvement in Accuracy (from 0.951 ± 0.036 to 0.969 ± 0.033), with AUC-ROC remaining at 1.0.
– CalibratedClassifierCV: Accuracy and AUC-ROC showed minimal changes (0.943 ± 0.030 and 0.9819 versus 0.943 ± 0.030 and 1.0), indicating limited optimization potential for this classifier.
– DecisionTreeClassifier: Accuracy improved from 0.938 ± 0.043 to 0.960 ± 0.022, while AUC-ROC decreased only slightly (from 1.0 to 0.9998), demonstrating enhanced model stability.
– GradientBoostingClassifier: Accuracy and AUC-ROC remained at the baseline level (0.938 ± 0.046 and 1.0).
– LogisticRegressionCV: A notable improvement in Accuracy (from 0.934 ± 0.020 to 0.960 ± 0.026), while AUC-ROC decreased from 1.0 to 0.9755, which may be associated with the choice of L1 regularization.
– LinearDiscriminantAnalysis: Accuracy increased from 0.929 ± 0.029 to 0.947 ± 0.041, whereas AUC-ROC decreased from 1.0 to 0.9778, indicating improved stability at the cost of slight reduction in AUC.
This analysis enabled the evaluation of performance for the ten best classification models used to predict COVID-19 severity. Error analysis included comparison of model predictions with true severity values, calculation of the total number of misclassifications, and assessment of error distribution across classes (0 — mild, 1 — moderate, 2 — severe).
The results of model performance evaluation are presented in Table 2, which includes the total number of errors and the class-specific error distribution for each classifier. For illustration, synthetic values were used to represent typical outcomes of error-analysis procedures.
The error analysis revealed the following key observations:
1. Overall model performance.
– Four models – ExtraTreesClassifier, HistGradientBoostingClassifier, BaggingClassifier, and GradientBoostingClassifier – showed zero misclassifications across all classes. This indicates exceptionally high accuracy (presumably approaching 100%, assuming an identical total sample size for all models, e.g., 227 samples as noted earlier).
– The poorest performance was observed for LinearDiscriminantAnalysis, with 11 errors, followed by CalibratedClassifierCV and LogisticRegressionCV, each with 9 errors. BernoulliNB produced 6 errors, RandomForestClassifier yielded 3 errors, and DecisionTreeClassifier made 2 errors, representing the smallest number of misclassifications among the models that did not achieve perfect accuracy.
2. Error distribution across classes.
– Class 0 (mild): All models correctly classified all samples (0 errors). This may indicate distinct features characteristic of mild COVID-19 or a larger sample representation for this class, facilitating classification.
– Class 1 (moderate): The highest number of errors was observed in CalibratedClassifierCV, LogisticRegressionCV, and LinearDiscriminantAnalysis (7 errors each), followed by BernoulliNB (3 errors) and RandomForestClassifier (1 error). The elevated misclassification rate in class 1 suggests difficulty in differentiating moderate severity from mild or severe cases, possibly due to overlapping feature profiles.
– Class 2 (severe): The largest number of errors occurred in LinearDiscriminantAnalysis (4 errors), followed by BernoulliNB (3 errors), and RandomForestClassifier, CalibratedClassifierCV, LogisticRegressionCV, and DecisionTreeClassifier (2 errors each). Errors in the severe class are particularly critical, as missed severe cases may have serious clinical consequences.
3. Underperforming models.
– LinearDiscriminantAnalysis exhibited the highest number of misclassifications (11), including 7 errors in class 1 and 4 errors in class 2. This may stem from the model’s assumptions regarding data normality and covariance structure, which likely do not hold for this dataset.
– CalibratedClassifierCV and LogisticRegressionCV (9 errors each) demonstrated substantial difficulties in classifying moderate severity (7 errors in class 1), suggesting the limitations of linear models in settings with nonlinear relationships.
– BernoulliNB (6 errors, with 3 in class 1 and 3 in class 2) achieved moderate performance but is constrained by its assumption of feature independence, which is unlikely to be satisfied in this dataset.
4. Best-performing models/
– ExtraTreesClassifier, HistGradientBoostingClassifier, BaggingClassifier, and GradientBoostingClassifier showed no misclassifications, confirming them as the best models for this task. Ensemble methods appear to handle nonlinear dependencies and class imbalance more effectively than individual learners.
5.Noteworthy observation.
– LinearDiscriminantAnalysis exhibited the highest number of errors in the severe class (4), which is particularly concerning given the potential clinical implications of misclassifying severe COVID-19 cases. This may reflect insufficient sample representation for class 2 or the intrinsic difficulty of capturing severity-related features.
4. Discussion
The findings of this study demonstrate a high level of effectiveness of machine-learning approaches for classifying and predicting the severity of COVID-19 based on a comprehensive set of clinical and laboratory indicators. Through comparative analysis of the performance of the ten best classifiers, we identified several important patterns related to model stability, accuracy, and generalizability, which are consistent with previous international research on the application of machine learning for predicting disease severity in COVID-19 patients [30,31]. Particular attention was given to ROC-AUC and Accuracy, the two most informative metrics for evaluating the capacity of AI models to identify the most relevant determinants of clinical disease progression [32].
The construction of weighted ROC curves constituted a central component of our model evaluation strategy. This technique enables simultaneous assessment of predictive performance across all classes in a multiclass setting, which is particularly important in clinical research [33,34]. It is notable that the imbalance among severity groups (with the severe class being the most prevalent) may have influenced the results, although the use of stratified cross-validation and weighted metrics minimized potential distortions [35]. The AUC-ROC values obtained in our study, which were nearly ideal (1.0), indicate that the machine-learning models employed were capable of almost perfectly differentiating patients' cross severity categories. These findings align with existing evidence reporting high predictive accuracy of ensemble-based ML methods in biomedical applications [36].
We found that ensemble methods – ExtraTreesClassifier, RandomForestClassifier, and HistGradientBoostingClassifier – demonstrated the highest predictive performance, corroborating results of global meta-analyses in which these methods consistently showed optimal balance between sensitivity and specificity when applied to heterogeneous clinical and laboratory datasets [37]. ExtraTreesClassifier provided the best combination of Accuracy (0.974 ± 0.022) and AUC-ROC (1.0), reflecting its ability to model complex nonlinear interactions characteristic of COVID-19 pathophysiology. RandomForestClassifier also demonstrated high efficiency with slight improvement after hyperparameter optimization, whereas HistGradientBoostingClassifier showed enhanced stability – an essential characteristic for models aimed at predicting clinical risks. Simpler models such as BernoulliNB and DecisionTreeClassifier also demonstrated strong performance, although with reduced stability, an observation that echoes previous reports highlighting their sensitivity to multicollinearity and data noise [38,39]. Hyperparameter optimization improved the predictive accuracy of several models, including LogisticRegressionCV and BaggingClassifier, underscoring the importance of fine-tuning in applied clinical machine-learning tasks.
The error-analysis component of our work revealed that four models – ExtraTreesClassifier, HistGradientBoostingClassifier, BaggingClassifier, and GradientBoostingClassifier – produced no misclassifications, reflecting exceptional generalizability of these ensemble approaches. In contrast, linear models such as LinearDiscriminantAnalysis and LogisticRegressionCV generated the highest number of errors in the moderate and severe categories, a finding consistent with contemporary evidence describing their limited ability to capture complex nonlinear patterns in clinical data [40]. Although several models achieved exceptionally high performance metrics, the idealized AUC-ROC values warrant cautious interpretation. Given the relatively small sample size, the risk of overfitting should not be overlooked, even when stratified cross-validation is employed [41]. Therefore, in our view, further external validation on independent datasets remains a critical next step for confirming the clinical applicability of these models.
Overall, the ensemble-based models examined in this study reaffirm their leading role in high-precision prediction of clinical complications associated with COVID-19. These results are consistent with international recommendations regarding machine-learning applications in medicine, where ensemble algorithms are regarded as among the most reliable tools for risk stratification [42].
5. Conclusions
The results of this study indicate that ensemble machine-learning models – particularly ExtraTreesClassifier, HistGradientBoostingClassifier, RandomForestClassifier, and BaggingClassifier – demonstrate the highest accuracy and stability in predicting COVID-19 severity, as evidenced by AUC-ROC values approaching 1.0. The use of stratified 5-fold cross-validation ensured the reliability of performance estimates and minimized the impact of class imbalance. Hyperparameter optimization further improved accuracy and reduced variability in several models, highlighting the importance of adaptive tuning in clinical prediction tasks. Our error analysis confirmed that the best-performing models – ExtraTreesClassifier, HistGradientBoostingClassifier, BaggingClassifier, and GradientBoostingClassifier – did not produce any misclassifications, whereas linear approaches such as LinearDiscriminantAnalysis and LogisticRegressionCV exhibited markedly higher error rates, particularly in predicting moderate and severe COVID-19 cases. This pattern reflects the inherent limitations of linear models in capturing nonlinear interactions present in clinical and laboratory data. Further external validation using independent cohorts is essential to verify the applicability of these top-performing ML models and to support their future integration into clinical decision-support systems for COVID-19 management.
Author Contributions
Conceptualization and writing — original draft preparation, M.S., L.S. and M.Š.; writing — review and editing, Y.V., R.S., L.S. and M.S.; supervision, M.Š., Y.V.; project administration, M.Š., D.N. and Y.V.; visualization, A.S., L.S, An.S. and O.S.; funding acquisition, M.S. and L.S. Modelling, Y.V., D.N. and L.S. All authors have read and agreed to the published version of the manuscript.
Funding
This research received no external funding.
Data Availability Statement
The data presented in this study is available on request from the corresponding author.
Conflicts of Interest
Declare conflicts of interest or state “The authors declare no conflicts of interest.” Authors must identify and declare any personal circumstances or interest that may be perceived as inappropriately influencing the representation or interpretation of reported research results. Any role of the funders in the design of the study; in the collection, analyses or interpretation of data; in the writing of the manuscript; or in the decision to publish the results must be declared in this section. If there is no role, please state “The funders had no role in the design of the study; in the collection, analyses, or interpretation of data; in the writing of the manuscript; or in the decision to publish the results”.
Abbreviations
The following abbreviations are used in this manuscript:
| AUC-ROC | Area Under the Receiver Operating Characteristic Curve |
| CDC | Centers for Disease Control and Prevention |
| CRP | C-reactive protein |
| FPR | False Positive Rate |
| IL | interleukin |
| ML | machine learning |
| NT-proBNP | N terminal pro B type natriuretic peptide |
| OvR | One-vs-Rest |
| PCT | procalcitonin |
| ROC | receiver operating characteristic |
| SNP | single-nucleotide polymorphisms |
| TPR | True Positive Rate |
| WBC | white blood cells |
| WHO | World Health Organization |
References
- Brodin, P. Immune determinants of COVID-19 disease presentation and severity. Nat Med. 2021, 27(1), 28–33. [Google Scholar] [CrossRef] [PubMed]
- Schoeni, R.F.; Wiemers, E.E.; Seltzer, J.A.; Langa, K.M. Association between risk factors for complications from COVID-19, perceived chances of infection and complications, and protective behavior in the US. JAMA network open. 2021, 4(3), e213984–e213984. [Google Scholar] [CrossRef] [PubMed]
- Sokolenko, M.O.; Sydorchuk, L.P.; Sokolenko, L.S.; Sokolenko, A.A. General immunologic reactivity of patients with COVID-19 and its relation to gene polymorphism, severity of clinical course of the disease and combination with comorbidities. Med. Perspekt. 2024, 29, 108. [Google Scholar] [CrossRef]
- Zhang, J.J.; Dong, X.; Liu, G.H.; Gao, Y.D. Risk and protective factors for COVID-19 morbidity, severity, and mortality. Clin Rev Allergy Immunol. 2023, 64, 90–107. [Google Scholar] [CrossRef] [PubMed]
- Choi, J.H.; Choi, S.H.; Yun, K.W. Risk factors for severe COVID-19 in children: a systematic review and meta-analysis. Journal of Korean medical science. 2022, 37(5), e35. [Google Scholar] [CrossRef]
- Sokolenko, M.; Sydorchuk, L.; Sokolenko, A.; Sydorchuk, R.; Kamyshna, I.; Sydorchuk, A.; Sokolenko, L.; Sokolenko, O.; Oksenych, V.; Kamyshnyi, O. Antiviral Intervention of COVID-19: Linkage of Disease Severity with Genetic Markers FGB (rs1800790), NOS3 (rs2070744) and TMPRSS2 (rs12329760). Viruses 2025, 17, 792. [Google Scholar] [CrossRef]
- Wolff, D.; Nee, S.; Hickey, N.S.; Marschollek, M. Risk factors for COVID-19 severity and fatality: a structured literature review. Infection 2021, 49, 15–28. [Google Scholar] [CrossRef]
- Herold, T.; Jurinovic, V.; Arnreich, C.; et al. Elevated IL-6 and CRP predict the need for mechanical ventilation in COVID-19. Journal of Allergy and Clinical Immunology 2020, 146(1), 128–136. [Google Scholar] [CrossRef]
- Lippi, G.; Plebani, M. Procalcitonin in patients with severe coronavirus disease 2019: a meta-analysis. Clinica Chimica Acta. 2020, 505, 190–191. [Google Scholar] [CrossRef]
- Wang, D.; Hu, B.; Hu, C.; et al. Clinical characteristics of 138 hospitalized patients with COVID-19 in Wuhan, China. JAMA 2020, 323(11), 1061–1069. [Google Scholar] [CrossRef]
- Tang, N.; Li, D.; Wang, X.; Sun, Z. Abnormal coagulation parameters are associated with poor prognosis in patients with COVID-19. Journal of Thrombosis and Haemostasis. 2020, 18(4), 844–847. [Google Scholar] [CrossRef] [PubMed]
- Bosello, S.; De Luca, G.; Berardi, G.; Canestrari, G.; De Waure, C.; Gabrielli, F.A.; et al. Cardiac troponin T and NT-proBNP as diagnostic and prognostic biomarkers of primary cardiac involvement and disease severity in systemic sclerosis: a prospective study. European Journal of Internal Medicine 2019, 60, 46–53. [Google Scholar] [CrossRef] [PubMed]
- Gao, L.; Jiang, D.; Wen, X.; et al. Prognostic value of NT-proBNP in patients with severe COVID-19. Respiratory Research 2020, 21(1), 83. [Google Scholar] [CrossRef] [PubMed]
- Buttìa, C.; Llanaj, E.; Raeisi-Dehkordi, H.; et al. Prognostic models in COVID-19 infection that predict severity: a systematic review. European Journal of Epidemiology 2023, 38(4), 355–372. [Google Scholar] [CrossRef]
- Fu, Y.; Zhong, W.; Liu, T.; et al. Early prediction model for critical illness of hospitalized COVID-19 patients based on machine learning techniques. Frontiers in Public Health. 2022, 10, 880999. [Google Scholar] [CrossRef]
- Eze, C.E.; Igwama, G.T.; Nwankwo, E.I.; Victor, E. AI-driven health data analytics for early detection of infectious diseases: a conceptual exploration of US public health strategies. Comprehensive Research Reviews in Science and Technology 2024, 2(2), 74–82. [Google Scholar]
- Kaur, I.; Behl, T.; Aleya, L.; et al. Artificial intelligence as a fundamental tool in management of infectious diseases and its current implementation in COVID-19 pandemic. Environmental Science and Pollution Research 2021, 28(30), 40515–40532. [Google Scholar] [CrossRef]
- Shouval, R.; Bondi, O.; Mishan, H.; Shimoni, A.; Unger, R.; Nagler, A. Application of machine learning algorithms for clinical predictive modeling: a data-mining approach in SCT. Bone marrow transplantation 2014, 49(3), 332–337. [Google Scholar] [CrossRef]
- Rahmani, A.M.; Yousefpoor, E.; Yousefpoor, M.S.; et al. Machine learning (ML) in medicine: review, applications, and challenges. Mathematics. 2021, 9(22), 2970. [Google Scholar] [CrossRef]
- Liu, T.; Krentz, A.J.; Huo, Z.; Ćurčin, V. Opportunities and challenges of cardiovascular disease risk prediction for primary prevention using machine learning and electronic health records: a systematic review. Reviews in Cardiovascular Medicine 2025, 26(4), 37443. [Google Scholar] [CrossRef]
- Li, X.; Zhou, X.; Ding, S.; et al. Identification of transcriptome biomarkers for severe COVID-19 with machine learning methods. Biomolecules. 2022, 12(12), 1735. [Google Scholar] [CrossRef] [PubMed]
- Wetere Tulu, T.; Wan, T.K.; Chan, C.L.; Wu, C.H.; Woo, P.Y.M.; Tseng, C.Z.S.; et al. Machine learning-based prediction of COVID-19 mortality using immunological and metabolic biomarkers. BMC Digital Health 2023, 1, 6. [Google Scholar] [CrossRef]
- Sethi, S.; Kumar, S.; Mandal, A.; Saini, V.; Bansal, A.; Jain, A.; et al. A machine learning model for the prediction of COVID-19 severity using RNA-seq, clinical, and co-morbidity data. Diagnostics 2024, 14(12), 1284. [Google Scholar] [CrossRef] [PubMed]
- Wynants, L.; Van Calster, B.; Collins, G.S.; Riley, R.D.; Heinze, G.; Schuit, E.; et al. Prediction models for diagnosis and prognosis of COVID-19: systematic review and critical appraisal. BMJ 2020, 369, m1328. [Google Scholar] [CrossRef]
- Schwab, P.; DuMont Schütte, A.; Dietz, B.; Bauer, S. Clinical predictive models for COVID-19: systematic study. Journal of Medical Internet Research 2020, 22(10), e21439. [Google Scholar] [CrossRef]
- Sydorchuk, L.; Sokolenko, M.; Škoda, M.; Lajcin, D.; Vyklyuk, Y.; Sydorchuk, R.; Sokolenko, A.; Martjanov, D. Management of severe COVID-19 diagnosis using machine learning. Computation. 2025, 13, 238. [Google Scholar] [CrossRef]
- Protocol “Provision of medical assistance for the treatment of coronavirus disease (COVID-19)”. Approved by the Order of the Ministry of Health of Ukraine of 2 April 2020 No. 762 (As Amended by the Order of the Ministry of Health of Ukraine of 17 May 2023 No. 913. (In Ukrainian). Available online: https://www.dec.gov.ua/wp-content/uploads/2023/05/protokol-covid2023.pdf (accessed on 12 December 2025).
- National Medical Care Standard “Coronavirus disease (COVID-19)”. Approved by Order No. 722 of the Ministry of Health of Ukraine Dated 28 March 2020. In Ukrainian). Available online: https://www.dec.gov.ua/wp-content/uploads/2021/10/2020_722_standart_covid_19.pdf. Available online: https://www.dec.gov.ua/wp-content/uploads/2021/10/2020_722_standart_covid_19.pdf (accessed on 12 December 2025).
- CDC 24/7: Saving Lives, Protecting People. Prevention Actions to Use at All COVID-19 Community Levels. Center for Disease Control and Prevention. 2023. Available online: https://www.cdc.gov/covid/prevention/index.html (accessed on 12 December 2025).
- Chen, Y.; Ouyang, L.; Bao, F.S.; Li, Q.; Han, L.; Zhang, H.; et al. A multimodality machine learning approach to differentiate severe and nonsevere COVID-19: model development and validation. Journal of Medical Internet Research 2021, 23(4), e23948. [Google Scholar] [CrossRef]
- Aktar, S.; Ahamad, M.M.; Rashed-Al-Mahfuz, M.; Azad, A.K.M.; Uddin, S.; Kamal, A.H.M.; et al. Machine learning approach to predicting COVID-19 disease severity based on clinical blood test data: model development. JMIR Medical Informatics 2021, 9(4), e25884. [Google Scholar] [CrossRef]
- Assaf, D.; Gutman, Y.A.; Neuman, Y.; Segal, G.; Amit, S.; Gefen-Halevi, S.; et al. Utilization of machine-learning models to accurately predict the risk for critical COVID-19. Internal and Emergency Medicine 2020, 15, 1435–1443. [Google Scholar] [CrossRef]
- Carrington, A.M.; Manuel, D.G.; Fieguth, P.W.; Ramsay, T.; Osmani, V.; Wernly, B.; et al. Deep ROC analysis and AUC as balanced average accuracy, for improved classifier selection, audit and explanation. IEEE Transactions on Pattern Analysis and Machine Intelligence. 2023, 45(1), 329–341. [Google Scholar] [CrossRef]
- Yang, Z.; Xu, Q.; Bao, S.; Cao, X.; Huang, Q. Learning with multiclass AUC: theory and algorithms. IEEE Transactions on Pattern Analysis and Machine Intelligence. 2021, 44(11), 7747–7763. [Google Scholar] [CrossRef] [PubMed]
- Yates, L.A.; Aandahl, Z.; Richards, S.A.; Brook, B.W. Cross validation for model selection: a review with examples from ecology. Ecological Monographs. 2023, 93(1), e1557. [Google Scholar] [CrossRef]
- Mahajan, P.; Uddin, S.; Hajati, F.; Moni, M.A. Ensemble learning for disease prediction: a review. Healthcare 2023, 11(12), 1808. [Google Scholar] [CrossRef]
- Imran, M.; Aslam, N.; Ahmad, H.; Mazhar, F.; Bhatti, Y.I.; Abid, U. Predictive modeling of chronic kidney disease using extra tree classifier: a comparative analysis with traditional methods. Journal of Computational and Biomedical Informatics 2024, 6(2), 261–271. [Google Scholar]
- Ushasree, D.; Krishna, A.P.; Rao, C.M. Enhanced stroke prediction using stacking methodology (ESPESM) in intelligent sensors for aiding preemptive clinical diagnosis of brain stroke. Measurement: Sensors 2024, 33, 101108. [Google Scholar] [CrossRef]
- Al Duhayyim, M.; Abbas, S.; Al Hejaili, A.; Kryvinska, N.; Almadhor, A.; Mohammad, U.G. An ensemble machine learning technique for stroke prognosis. Computer Systems Science and Engineering 2023, 47(1), 413. [Google Scholar] [CrossRef]
- Ontshick, L.L.; Sabue, J.C.M.; Kiangebeni, P.M.; et al. Comparison of the performance of linear discriminant analysis and binary logistic regression applied to risk factors for mortality in Ebola virus disease patients. Journal of Electronic, Electromedical Engineering and Medical Informatics 2023, 5(3), 205–210. [Google Scholar] [CrossRef]
- Vabalas, A.; Gowen, E.; Poliakoff, E.; Casson, A.J. Machine learning algorithm validation with a limited sample size. PLoS One 2019, 14(11), e0224365. [Google Scholar] [CrossRef]
- Rane, N.; Choudhary, S.P.; Rane, J. Ensemble deep learning and machine learning: applications, opportunities, challenges, and future directions. Studies in Medical and Health Sciences 2024, 1(2), 18–41. [Google Scholar] [CrossRef]
Figure 1.
Weighted ROC curve for the top 10 classifiers in the multiclass classification task of COVID-19 severity, constructed using the One-vs-Rest (OvR) approach with 5-fold stratified cross-validation.
Figure 1.
Weighted ROC curve for the top 10 classifiers in the multiclass classification task of COVID-19 severity, constructed using the One-vs-Rest (OvR) approach with 5-fold stratified cross-validation.
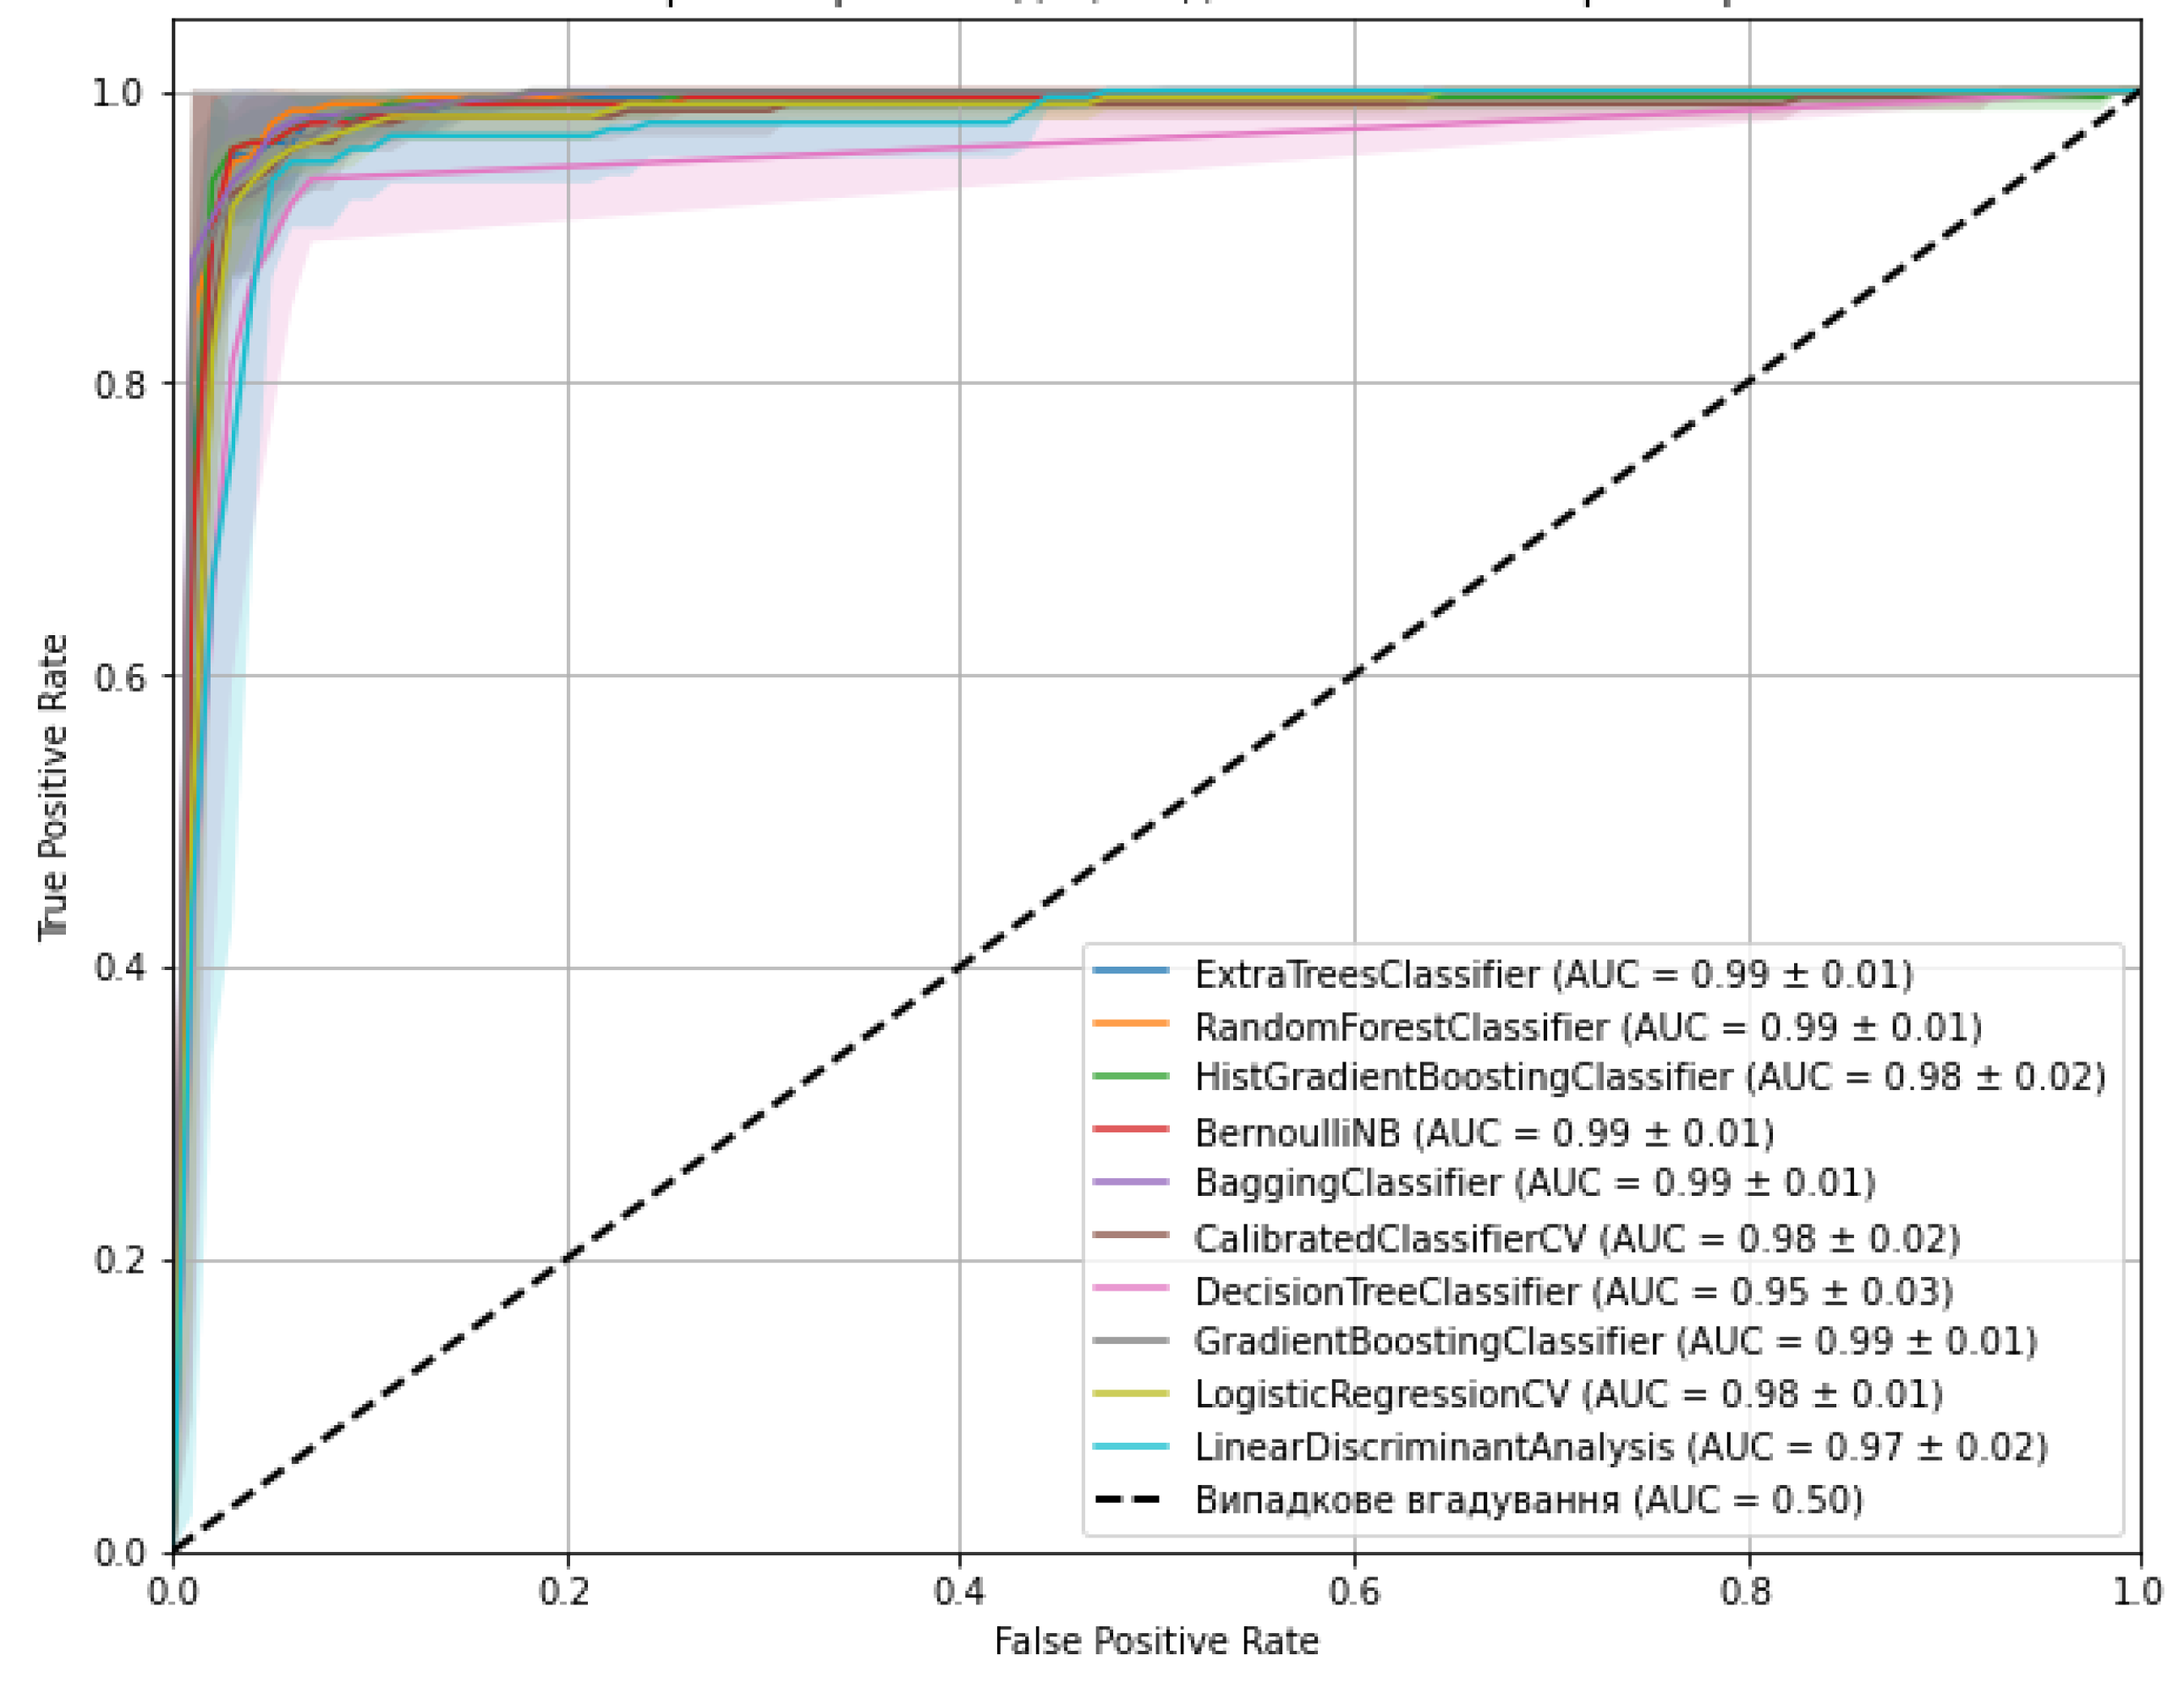

Table 1.
Accuracy metrics for the optimized classifiers.
| Models | Optimal hyperparameters | Accuracy (mean ± SD) | AUC-ROC |
| ExtraTreesClassifier | max_depth: 10, min_samples_split: 5, n_estimators: 200 | 0.974 (± 0.022) | 1.000 |
| RandomForestClassifier | max_depth: 20, min_samples_leaf: 2, min_samples_split: 2, n_estimators: 50 | 0.965 (± 0.033) | 0.9998 |
| HistGradientBoostingClassifier | learning_rate: 0.2, max_depth: None, max_iter: 100 | 0.960 (± 0.029) | 1.000 |
| BernoulliNB | alpha: 0.01, fit_prior: True | 0.960 (± 0.038) | 0.9879 |
| BaggingClassifier | max_features: 1.0, max_samples: 1.0, n_estimators: 50 | 0.969 (± 0.033) | 1.000 |
| CalibratedClassifierCV | cv: 5, method: 'sigmoid' | 0.943 (± 0.030) | 0.9819 |
| DecisionTreeClassifier | max_depth: 20, min_samples_leaf: 2, min_samples_split: 2 | 0.960 (± 0.022) | 0.9998 |
| GradientBoostingClassifier | learning_rate: 0.1, max_depth: 3, n_estimators: 200 | 0.938 (± 0.043) | 1.000 |
| LogisticRegressionCV | Cs: 100, max_iter: 1000, penalty: 'l1', solver: 'liblinear' | 0.960 (± 0.026) | 0.9755 |
| LinearDiscriminantAnalysis | shrinkage: 'auto', solver: 'lsqr' | 0.947 (± 0.041) | 0.9778 |
Note. SD - standard deviation.
Table 2.
Performance metrics of the classification models.
| Models | Total number of errors | Class 0 errors | Class 1 errors | Class 2 errors |
| ExtraTreesClassifier | 0 | 0 | 0 | 0 |
| RandomForestClassifier | 3 | 0 | 1 | 2 |
| HistGradientBoostingClassifier | 0 | 0 | 0 | 0 |
| BernoulliNB | 6 | 0 | 3 | 3 |
| BaggingClassifier | 0 | 0 | 0 | 0 |
| CalibratedClassifierCV | 9 | 0 | 7 | 2 |
| DecisionTreeClassifier | 2 | 0 | 0 | 2 |
| GradientBoostingClassifier | 0 | 0 | 0 | 0 |
| LogisticRegressionCV | 9 | 0 | 7 | 2 |
| LinearDiscriminantAnalysis | 11 | 0 | 7 | 4 |
Disclaimer/Publisher’s Note: The statements, opinions and data contained in all publications are solely those of the individual author(s) and contributor(s) and not of MDPI and/or the editor(s). MDPI and/or the editor(s) disclaim responsibility for any injury to people or property resulting from any ideas, methods, instructions or products referred to in the content. |
© 2025 by the authors. Licensee MDPI, Basel, Switzerland. This article is an open access article distributed under the terms and conditions of the Creative Commons Attribution (CC BY) license (http://creativecommons.org/licenses/by/4.0/).
Copyright: This open access article is published under a Creative Commons CC BY 4.0 license, which permit the free download, distribution, and reuse, provided that the author and preprint are cited in any reuse.


