
Submitted:
17 December 2025
Posted:
17 December 2025
You are already at the latest version
Abstract
Background/Objectives: Missing data in clinical observational studies, such as out-of-hospital cardiac arrest (OHCA) registries, can compromise statistical validity. Single imputation methods are simple alternatives to complete-case analysis (CCA) but do not account for imputation uncertainty. Multiple imputation (MI) is the standard for handling missing at random (MAR) data, yet its implementation remains challenging. This study evaluated the performance of MI in association analysis compared with CCA and single imputation methods.
Methods: Using a simulation framework with real-world Singapore OHCA registry data (N=13,274 complete cases), we artificially introduced 20%, 30% and 40% missingness under MAR. MI was implemented using predictive mean matching (PMM), random forest (RF), and classification and regression trees (CART) algorithms, with 5-20 imputations. Performance was assessed based on bias and precision in a logistic regression model evaluating the association between alert issuance and bystander CPR.
Results: CART outperformed PMM, providing more accurate β coefficients and stable CIs across missingness levels. Although K-Nearest Neighbours (KNN) produced similar point estimates, it underestimated imputation uncertainty. PMM showed larger bias, wider and less stable CIs, and in some settings performed similarly to CCA. MI methods produced wider CIs than single imputation, appropriately capturing imputation uncertainty. Increasing the number of imputations had minimal impact on point estimates but modestly narrowed CIs.
Conclusion: MI performance depends strongly on the chosen algorithm. CART and RF methods offered the most robust and consistent results for OHCA data, whereas PMM may not be optimal and should be selected with caution. MI using tree-based methods (CART/RF) remains the preferred strategy for generating reliable conclusions in OHCA research.
Keywords:
out-of-hospital cardiac arrest
; bystander cpr
; emergency medical services
; missing
; multiple imputation
1. Introduction
Missing data are a common challenge in all types of studies, particularly in large-scale clinical observational studies such as those using out-of-hospital cardiac arrest (OHCA) registries. How we handle missingness directly impacts the validity of our analyses and the reliability of study conclusions. Guidelines, like STROBE [1,2], stress the importance of reporting missing data transparently and explaining the methods used to address it. In this series of papers on imputation methods, we aim to highlight the impact of imputation method choice on research conclusions and provide a practical framework for clinicians involved in OHCA research.
In the first paper of this series (Paper I [3]), we compared various single imputation methods (both statistical and machine learning) for analysing association in a real-world OHCA dataset. We found that complete-case analysis (CCA), where missing data are simply ignored, was not ideal. It led to more biased results (i.e. the estimated association did not accurately reflect the true relationship between variables) and wider confidence intervals (CIs), meaning the results were less precise. On the other hand, single imputation methods like K-Nearest Neighbours (KNN) and missingness-indicator (MxI) performed better. They helped reduce bias and provide more reliable results, while still being relatively simple to implement. Hence, they can serve as useful alternatives to CCA for drawing more accurate conclusions.
While single imputation methods are convenient, they do not fully capture the uncertainty caused by missing data, as they only provide one guess for each missing value. This can lead to artificially narrow CIs and the distribution of imputed data might not align with the original distribution. Though methods like KNN can handle some complex relationships, they may still struggle to address more intricate patterns, especially when the missing data are influenced by unobserved factors.
Multiple imputation (MI) offers a more robust solution to this issue [4]. First developed by Rubin in the late 1970’s [5,6,7], MI is now widely used, especially when the missing data are thought to be missing at random (MAR) [8,9]. Rather than filling in just one value for each missing data point, MI generates several different sets of imputed values. These sets are then combined to produce final estimates and more accurate standard errors, that better reflect the uncertainty of the missingness. Austin et al. provide an accessible practical tutorial on MI and show its advantages in clinical research [4].
The most common and flexible MI procedure is the Multiple Imputation by Chained Equations (MICE) algorithm [10]. MICE allows researchers to customize the imputation process, including which variables to use, the imputation model and how many imputations (m) to generate. This flexibility makes MICE adaptable to various data type and research goals [11]. However, effective implementation of MICE requires careful planning and greater computational resources, as well as methodological expertise [12,13].
While MI is increasingly supported by many software tools, there is limited practical guidance for clinicians, and few studies compare different MI configurations using a real-world dataset like those in OHCA. As a result, many clinicians still rely on simpler methods, even though MI could provide more accurate results. Key questions remain, such as how to choose the optimal MI model, how many imputations are necessary, and how MI compares to simpler methods like KNN and MxI. These are important considerations for the OHCA research community.
Building on Paper I [3], the objective of this article (Paper II) is to evaluate the performance of MI under different configurations (e.g. imputation models and number of imputations) and directly compare these results with CCA and the top-performing single imputation method (KNN) in association analysis. Through this simulation, we aim to offer a more comprehensive comparison, guiding the selection of the most appropriate missing data strategy while balancing statistical accuracy and computational feasibility. The remainder of this paper is structured as follows: Section 2 describes the methodology, including the simulation design and the imputation models examined. Section 3 presents the comparative analysis results. Section 4 discusses the implications for OHCA research and offers practical recommendations for applying MI in clinical studies.
2. Materials and Methods
2.1. Study Design and Setting
Data were obtained from two prospectively maintained registries: the Pan-Asian Resuscitation Outcomes Study (PAROS) [14] and the Singapore Community First Responder system, myResponder [15]. The study included cases that could have triggered myResponder alerts between January 1, 2016, and December 31, 2020.
The analysis of interest is the association between alert issuance (binary exposure) and bystander CPR (BCPR, binary outcome), adjusted for potential confounders, including age, gender, witness type, arrest location, call time, and first rhythm.
Following the simulation framework described in Paper I [3] , we used the same reference dataset to generate 1000 artificial datasets with MAR missingness at 20%, 30% and 40%. Missing covariates were age, witness type and call time. The same seed number was used for reproducibility purposes. This methodological setup allows Paper II to evaluate the performance of MI methods under conditions identical to those used previously. Further details on the cohort and the creation of missing data are provided in Paper I [3].
2.2. Methods to Handle Missing Data
This paper, building on previous work, extends that investigation by directly comparing the single imputation approaches with a suite of MI methods. Unlike single imputation, which replaces each missing value with a single value, MI generates several plausible, but different, complete datasets to account for the uncertainty inherent in missing data. This iterative process involves three main steps: (1) imputation, (2) analysis and (3) pooling (Figure 1).
The most widely used MI algorithm, MICE, imputes missing values sequentially on a variable-by-variable basis. For each variable with missing data, a separate imputation model can be specified based on the variable type. MICE can be implemented in R using the mice() function from the mice package [10]. The selection of an appropriate imputation method and the number of imputations (m) are important inputs for the validity and performance of MI. The model specifies the relationships between the observed and missing variables, guiding how the missing values are estimated. The default imputation methods in mice() are predictive mean matching (PMM) for continuous variables, logistic regression for dichotomous variables, and polynomial regression for unordered categorical variables. In this study, we focused on a set of commonly used imputation methods, available in mice(), that are suitable for any type of data:
- Predictive mean matching (PMM): a non-parametric imputation method similar to regression, designed to preserve the original distribution and avoid impossible or unrealistic values. For each missing value, PMM first uses a regression model to predict a value. It then randomly selects the final imputed value from the actual observed value of the cases whose predicted values are closest to the predicted value for that missing case [16].
- Classification and regression trees (CART): a non-parametric tree-based ML imputation method that does not require explicit specification of an imputation model. It predicts missing values by recursively partitioning the data through a series of binary splits. These splits are determined by finding optimal cut points in predictors that divide the sample into more homogeneous subsamples. For each missing value, it uses the rules from the tree to assign a plausible value. This method is robust against outliers, can handle multicollinearity and skewed distributions, as well as incorporate interactions and non-linear relationships [17].
- Random forest (RF): a non-parametric tree-based ML imputation method that builds upon the concept of CART. It introduces controlled variation via bootstrapping to create an extensive collection of distinct regression trees. For a given missing value, the RF model generates potential imputed values from all the individual trees in the forest. The final imputation is a random draw from this set of values. It shares the same robustness and flexibility advantages as CART while minimising the risk of overfitting individual trees [18].
2.3. Statistical Analysis
To evaluate the performance of the various imputation approaches, we used the reference dataset (containing no missing values) as our population of interest. On this reference data, we established the “true” association by fitting a multivariable logistic regression model. This model evaluated the association between alert issuance and BCPR, adjusting for several key covariates: age, gender, witness type, call time, arrest location and first rhythm.
We maintained the simulation framework described in our previous work, which involved creating 1000 amputed datasets (i.e. artificially introducing missingness), applying the imputation methods and conducting the same association analysis on these imputed datasets. The performance of each imputation method was assessed using the following metrics: bias (deviation of estimates from the true value), empirical SE (variability of estimates across repetitions), and nominal coverage of 95% CI (proportion of CIs containing the true value). We also assessed model-specific metrics, including the root mean squared error (RMSE) and the Akaike Information Criterion (AIC). The distribution of these performance metrics was analysed to assess variability across simulations and comparability with the reference values. Supplementary Figure S1 in Paper I [3] illustrates the flowchart of the simulation process.
For the multiple imputation methods, the same process was repeated using different number of imputations (m = 5, 10, 15, 20). We investigated its influence on the method performance, as according to recent paper(s), the number of imputations may align with the missingness proportion [7,12]. We also compared the computational time for each imputation method. Since MICE is an iterative procedure, we monitored convergence via trace plots on a random subset of the 1000 iterations. We examined the plots for the mean and standard deviation of the imputed values, looking for lines that overlapped randomly without long-term trends. These patterns confirmed that no convergence issues occurred. All the statistical analyses were performed using R software version 4.3.2 and RStudio version 2024.09.0+375 on a computer equipped with an Intel Core i7-1365U, 32 GB of RAM, and running Windows 11 Education, Version 24H2.
3. Results
Patient and OHCA event characteristics for the entire cohort (N=13,274) were previously detailed in Table 1 of Paper I [3]. Here, we focus on the performance of the MI methods with PMM, RF and CART imputation in the multivariable logistic regression analysis of BCPR. These approaches were compared against CCA and the single imputation methods, particularly the top-performing KNN.
The mean β coefficients and their 95% CIs resulting from the various imputation methods were compared against the reference (REF) values to assess bias and uncertainty. As shown in Figure 2, all methods produced varying degrees of proximity to the reference lines, though the closeness varied across covariates and missingness proportions. Crucially, none of the MI methods altered the statistical significance of the results compared to the reference (i.e. whether the CI consistently included zero). However, the lower bound of the CI for PMM's estimate of age approached the zero line at 30% and 40% missingness, making the result visibly borderline.
The performance was not uniform across covariates with missing values, like age, witness type, and arrest location (public), which exhibited more noticeable shifts or wider intervals. CART generally offered the closest β coefficient estimate to the reference and maintained the most stable CIs among the MI methods across all covariates, suggesting it is the most robust MI approach in this analysis. RF also provided mean β coefficients in close agreement with the reference, but its stability was slightly lower than CART, particularly for covariates with missing data (Figure 2a). PMM showed the largest deviation from the reference line and the widest 95% CIs, indicating higher uncertainty and bias relative to the other MI methods. Its mean coefficient for first rhythm (shockable) was similar to CCA.
The 95% CIs of the MI imputation methods generally overlapped with the reference β coefficient, particularly at lower missingness proportions. This confirmed their ability to capture the true association. As expected, MI methods incorporated uncertainty around the imputed values, which resulted in wider CIs compared to the single imputation methods. This highlights the tendency of single imputation methods to underestimate the true variability, leading to overly narrow CIs and potentially inflated risk of a type I error (i.e. they are more likely to exclude zero when no true association exists, causing the researcher to falsely conclude that a variable is statistically significant).
Supplementary Figure S1 visually summarises the bias across the 1000 iterations for all covariates, showing the difference between the estimated and the true β. The MI methods (PMM, RF, CART) exhibited a median bias closer to zero compared to CCA and most SI methods. While the variability (box width) of bias increased for all methods at higher missingness proportions, it remained smaller for MI compared to SI methods.
Among the single imputation methods, KNN often maintained the closest alignment to the reference and produced results similar to the MI methods, demonstrating a consistent ability to preserve the mean β coefficients. Overall, MI with CART imputation offered the closest coefficient estimate to the reference and reasonable confidence intervals.
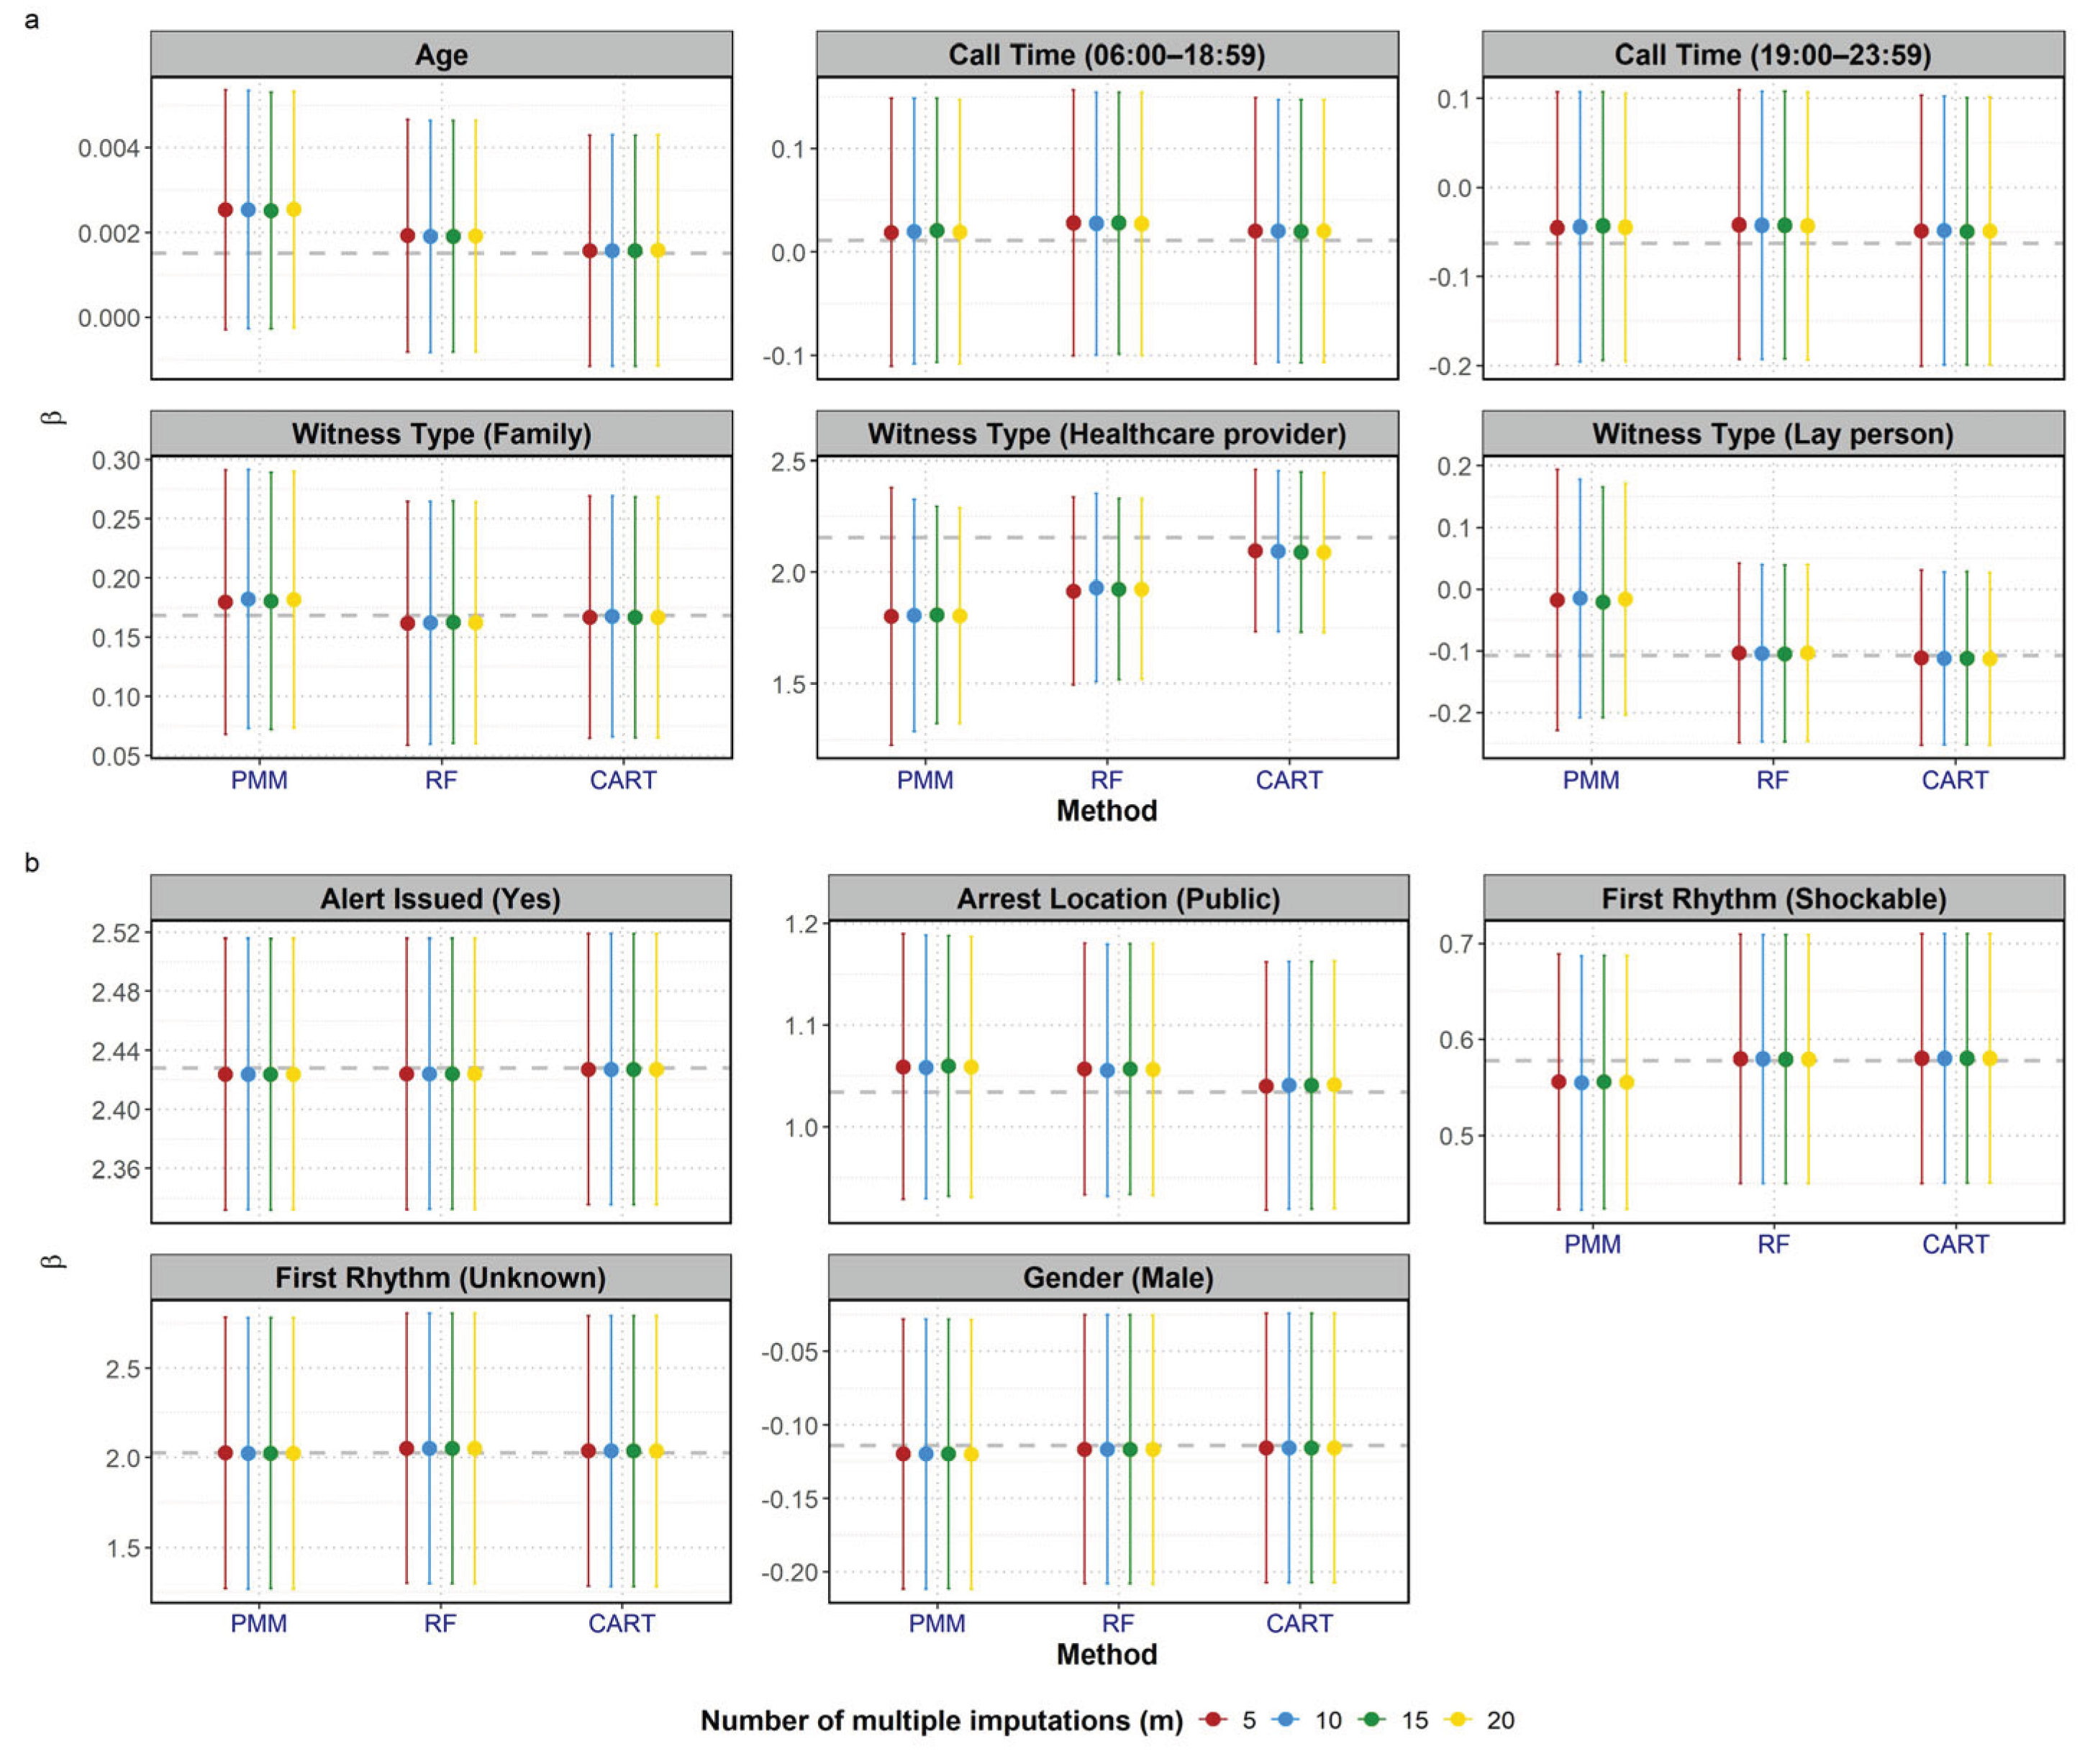
We also investigated the influence of the number of imputations on the performance of MI methods. Figure 3 presents the mean β coefficients and 95% CIs across all covariates at a fixed missingness proportion of 20%, when varying m at 5, 10, 15 and 20. Overall the influence of m was minimal compared to the influence of the imputation methods. The point estimates from the three methods (PMM, RF and CART) consistently clustered together across the different values of m. For a fixed m, the relative performance of the methods remained consistent: CART was the closest to the reference line, while PMM showed the largest deviation among the three MI methods. While the point estimates were stable, the 95% CIs appeared to narrow slightly as the number of imputations increased from 5 to 20. This is most visually apparent in the PMM results for witness type (healthcare provider) and witness type (lay person), where the difference between the m=5 CIs and the m=20 CIs was most noticeable.
The median RMSE across simulations for the MI methods was higher than for the single imputation ones, but their overall variability was smaller compared with the ML-based single imputation approaches. The MI methods produced AIC values close to the reference AIC, indicating a good recovery of the overall analytical model fit. Specifically, CART achieved the lowest AIC median, outperforming PMM, which showed a minor increase in AIC with higher missingness (Supplementary Figures S4 and S5). Furthermore, all three methods presented smaller empirical SEs across all variables and good coverage of the 95% CIs. CART proved to be the most robust MI method in maintaining coverage, whereas PMM and RF showed some minor reduction in coverage for the witness type (healthcare provider) covariate (Supplementary Table S1).
4. Discussion
This study used a simulation framework based on real-world Singapore OHCA data to systematically evaluate the performance of CCA, common single imputation approaches, and MI methods in estimating associations from a multivariable logistic regression model. By comparing the resulting β coefficients and confidence intervals with a reference dataset without missingness, our findings provide practical and methodological guidance for clinicians conducting OHCA research.
Paper I [3] established the performance of CCA and various single imputation methods. As noted previously, CCA generally suffered from wider confidence intervals and greater potential for bias especially when data are MAR. Among single imputation methods, KNN demonstrated the most consistent ability to preserve mean β coefficients and reasonable uncertainty, aligning closely with reference values across missingness proportions. Its performance was often comparable to the MI method with CART, suggesting that KNN can serve as a pragmatic option when computational resources or methodological expertise are limited.
However, all single imputation methods underestimate uncertainty because they treat imputed values as if they were observed, as reflected by the narrower CIs of the investigated single imputation methods. Multiple imputation is widely recommended for handling MAR missingness, because it incorporates uncertainty around the imputed values through Rubin’s rule. As seen in Figure 2, MI methods produced wider, more realistic confidence intervals and maintained correct statistical significance for all covariates compared with the reference dataset. Among the MI methods, CART emerged as the most robust, producing β coefficients closest to the reference and stable confidence intervals across covariates. RF also performed well but showed slightly less stability, especially for covariates with missing data. In contrast, PMM, despite being the default imputation method for continuous variables, demonstrated the greatest deviation from reference values and the widest CIs, approaching CCA performance for some covariates. PMM relies on observed cases in the dataset that look similar to the case with missing data, therefore they might perform poorly when there are not enough similar cases in the original dataset. Tree-based methods (CART and RF) should be preferred when nonlinear relationships exist in the data as they are able to naturally capture that.
The observed stability of the mean β coefficients across different number of imputations is consistent with the literature showing that a small number of imputations is generally sufficient to obtain valid estimation of point estimates. In our study, increasing m produced negligible effects on β estimates. However, confidence intervals narrowed slightly as m increased, particularly in PMM, reflecting reduced simulation error.
Several authors proposed how to choose the m required, with a simple rule-of-thumb being the number of imputations to be greater than or equal to the missingness proportion [7,12,19,20,21]. A more sophisticated rule for proper standard error estimates can be implemented using the howManyImputations R package [21]. The mice() function uses 5 as default, which can be used as a starting point [12]. Higher values of m are recommended to obtain more accurate standard errors. The ideal m should be selected such that the resulting pooled estimates do not differ much across repetitions of the multiple imputation.
Although MI provides statistically valid inference, it also presents challenges that may hold back adoption in clinical research. Firstly, implementing MI, especially for large datasets or complex imputation models, can be computationally intensive and time-consuming. Supplementary Figure S3a shows that the ML-based approaches (MF, KNN, RF and CART) were the most computationally expensive, with RF requiring the longest elapsed time, followed by MF. This is expected given its need to build numerous decision trees. Advanced single imputation methods like KNN also required significant time, with MF surpassing MI methods when the number of imputations is low (m=5). Furthermore, Figure S3b shows that computation time for all MI methods increases with the number of imputations, with RF having the highest cost per imputation and PMM remaining the fastest MI method. However, given a reasonable size of dataset, the resulting difference in computational time between MI and SI methods may be negligible, and easily outweighed by the statistical benefits of obtaining unbiased estimates and correctly specified uncertainty.
As a second challenge, selecting and correctly specifying the appropriate imputation model for each variable (e.g., handling interactions, non-linear relationships, or different variable types) is important to avoid biased results [22]. Thirdly, diagnostic checks are needed to ensure that the imputation algorithm has converged, that the MAR assumption is reasonable, and that the imputed values follow the expected variable distributions. All these steps demand technical expertise that can be difficult to carry out without professional training.
Despite its advantages, MI is not universally necessary or optimal for every analysis. MI adds complexity relative to KNN or MxI. These simpler single imputation methods may offer reasonable preliminary estimates when uncertainty quantification is not the primary objective. However, when single imputation is used, its fundamental statistical limitations must be clearly acknowledged. SI methods (including advanced options like missForest, which is popular in clinical research) produce a single complete dataset, failing to account for the uncertainty caused by the missing data. As a consequence, this limitation leads to two critical problems that worsen as more missing values are imputed: confidence intervals will be narrower than they should actually be and the associations between variables will appear stronger than they actually are, potentially leading to an inflated risk of false positives.
In recent years, deep learning-based imputation techniques have gained popularity and demonstrated the potential to outperform traditional methods. However, their practical use remains limited by substantial computational demands and challenges related to portability and interpretability [23,24,25,26]. Future work could further explore whether these approaches offer meaningful advantages when applied to OHCA datasets. Our study relied on simulations from a single national OHCA database. Therefore, external validation of these findings in other clinical contexts and patient populations is necessary to confirm the generalizability of the performance metrics. To bridge the gap between methodological advances and clinical practice, our follow-up work will provide a general framework for clinician use and develop user-friendly software tools. This effort aims to promote the adoption of best practices for missing data handling in OHCA research, simplifying the implementation of advanced imputation methods for clinicians with the ultimate goal of facilitating more robust and reliable clinical conclusions.
Supplementary Materials
The following supporting information can be downloaded at the website of this paper posted on Preprints.org: https://www.mdpi.com/article/doi/s1.
Author Contributions
Conceptualization, SES, MEHO and FJS; methodology, SJZ, SES and FJS; software, SJZ; formal analysis, SJZ; data curation, SJZ; writing—original draft preparation, SJZ; writing—review and editing, SES, MEHO and FJS; visualization, SJZ; supervision, SES and FJS. All authors have read and agreed to the published version of the manuscript.
Funding
This research was supported by the NMRC STaR Grant, project ID: MOH-000982.
Institutional Review Board Statement
The Centralized Institutional Review Board (2010/270/C, 17 May 2010; 2013/604/C, 12 Sep 2013; 2018/2937, 16 Oct 2018 of approval) and Domain Specific Review Board (C/10/545, 4 Nov 2010 and 2013/00929, 19 Dec 2013) granted approval with waiver of patient informed consent for the Singapore PAROS registry.
Informed Consent Statement
Patient informed consent was waived for the Singapore PAROS registry.
Data Availability Statement
The raw data supporting the conclusions of this article will be made available by the authors on request.
Acknowledgments
During the preparation of this manuscript, the author(s) used ChatGPT (GPT-4 turbo) and Gemini (2.5 Flash) for the purposes of improvement in grammar, spelling and readability. The authors have reviewed and edited the output and take full responsibility for the content of this publication.
Conflicts of Interest
The authors declare that they have no competing interests. The funders had no role in the design of the study; in the collection, analyses, or interpretation of data; in the writing of the manuscript; or in the decision to publish the results. All authors had access to the data in the study and had final responsibility for the decision to submit for publication.
Abbreviations
The following abbreviations are used in this manuscript:
| AIC | Akaike Information Criterion |
| BCPR | Bystander Cardiopulmonary Resuscitation |
| CART | Classification and Regression Trees |
| CC | Complete-Case |
| CCA | Complete-Case Analysis |
| CFR | Community First Responder |
| CI | Confidence Interval |
| KNN | K-Nearest Neighbours |
| MAR | Missing At Random |
| MF | missForest |
| MI | Multiple Imputation |
| MICE | Multiple Imputation by Chained Equations |
| ML | Machine Learning |
| MxI | Missingness-Indicator |
| OHCA | Out-Of-Hospital Cardiac Arrest |
| PAROS | Pan-Asian Resuscitation Outcomes Study |
| PMM | Predictive Mean Matching |
| RF | Random Forest |
| RMSE | Root Mean Squared Error |
| SI | Single Imputation |
References
- Von Elm, E.; Altman, D.G.; Egger, M.; Pocock, S.J.; Gøtzsche, P.C.; Vandenbroucke, J.P. The Strengthening the Reporting of Observational Studies in Epidemiology (STROBE) statement: guidelines for reporting observational studies. The lancet 2007, 370, 1453–1457. [Google Scholar] [CrossRef]
- Vandenbroucke, J.P.; Elm, E.v.; Altman, D.G.; Gøtzsche, P.C.; Mulrow, C.D.; Pocock, S.J.; Poole, C.; Schlesselman, J.J.; Egger, M.; Initiative, S. Strengthening the Reporting of Observational Studies in Epidemiology (STROBE): explanation and elaboration. Annals of internal medicine 2007, 147, W-163-W-194. [Google Scholar] [CrossRef]
- Zhan, S.J.; Saffari, S.E.; Ong, M.E.H.; Siddiqui, F.J. Missing Data in OHCA Registries: How Imputation Methods Affect Research Conclusions—Paper I. Journal of clinical medicine 2025, 14, 6345. [Google Scholar] [CrossRef]
- Austin, P.C.; White, I.R.; Lee, D.S.; van Buuren, S. Missing Data in Clinical Research: A Tutorial on Multiple Imputation. Canadian journal of cardiology 2021, 37, 1322–1331. [Google Scholar] [CrossRef] [PubMed]
- Rubin, D.B. Formalizing Subjective Notions About the Effect of Nonrespondents in Sample Surveys" (T&M). Journal of the American Statistical Association 1977, 72, 538. [Google Scholar]
- RUBIN, D.B. Inference and missing data. Biometrika 1976, 63, 581–592. [Google Scholar] [CrossRef]
- Rubin, D.B.; Wiley, I. Multiple imputation for nonresponse in surveys; Wiley: New York, 1987. [Google Scholar]
- Nichol, G.; Thomas, E.; Callaway, C.W.; Hedges, J.; Powell, J.L.; Aufderheide, T.P.; Rea, T.; Lowe, R.; Brown, T.; Dreyer, J.; et al. Regional Variation in Out-of-Hospital Cardiac Arrest Incidence and Outcome. JAMA: the journal of the American Medical Association 2008, 300, 1423–1431. [Google Scholar] [CrossRef] [PubMed]
- Riva, G.; Ringh, M.; Jonsson, M.; Svensson, L.; Herlitz, J.; Claesson, A.; Djärv, T.; Nordberg, P.; Forsberg, S.; Rubertsson, S.; et al. Survival in Out-of-Hospital Cardiac Arrest After Standard Cardiopulmonary Resuscitation or Chest Compressions Only Before Arrival of Emergency Medical Services: Nationwide Study During Three Guideline Periods. Circulation (New York, N.Y.) 2019, 139, 2600–2609. [Google Scholar] [CrossRef]
- van Buuren, S.; Groothuis-Oudshoorn, K. mice: Multivariate Imputation by Chained Equations in R. Journal of Statistical Software 2011, 45, 1–67. [Google Scholar] [CrossRef]
- Enders, C.K. Multiple imputation as a flexible tool for missing data handling in clinical research. Behaviour research and therapy 2017, 98, 4–18. [Google Scholar] [CrossRef]
- White, I.R.; Royston, P.; Wood, A.M. Multiple imputation using chained equations: Issues and guidance for practice. Statistics in medicine 2011, 30, 377–399. [Google Scholar] [CrossRef]
- Saffari, S.E.; Volovici, V.; Ong, M.E.H.; Goldstein, B.A.; Vaughan, R.; Dammers, R.; Steyerberg, E.W.; Liu, N. Proper Use of Multiple Imputation and Dealing with Missing Covariate Data. World neurosurgery 2022, 161, 284–290. [Google Scholar] [CrossRef]
- Ong, M.E.H.; Shin, S.D.; De Souza, N.N.A.; Tanaka, H.; Nishiuchi, T.; Song, K.J.; Ko, P.C.-I.; Leong, B.S.-H.; Khunkhlai, N.; Naroo, G.Y.; et al. Outcomes for out-of-hospital cardiac arrests across 7 countries in Asia: The Pan Asian Resuscitation Outcomes Study (PAROS). Resuscitation 2015, 96, 100–108. [Google Scholar] [CrossRef] [PubMed]
- Ming Ng, W.; De Souza, C.R.; Pek, P.P.; Shahidah, N.; Ng, Y.Y.; Arulanandam, S.; White, A.E.; Leong, B.S.-H.; Ong, M.E.H. myResponder Smartphone Application to Crowdsource Basic Life Support for Out-of-Hospital Cardiac Arrest: The Singapore Experience. Prehospital Emergency Care 2021, 25, 388–396. [Google Scholar] [CrossRef] [PubMed]
- Little, R.J.A. Missing-Data Adjustments in Large Surveys. Journal of business & economic statistics 1988, 6, 287. [Google Scholar] [CrossRef]
- Breiman, L.; Friedman, J.H.; Olshen, R.A.; Stone, C.J. Classification and regression trees. Classification and regression trees 1984. [Google Scholar]
- Doove, L.L.; Van Buuren, S.; Dusseldorp, E. Recursive partitioning for missing data imputation in the presence of interaction effects. Computational statistics & data analysis 2014, 72, 92–104. [Google Scholar] [CrossRef]
- Carpenter, J.R.; Bartlett, J.W.; Morris, T.P.; Wood, A.M.; Quartagno, M.; Kenward, M.G. Multiple Imputation and its Application; Wiley, 2023. [Google Scholar]
- Bodner, T.E. What Improves with Increased Missing Data Imputations? Structural Equation Modeling: A Multidisciplinary Journal 2008, 15, 651–675. [Google Scholar] [CrossRef]
- von Hippel, P.T. How Many Imputations Do You Need? A Two-stage Calculation Using a Quadratic Rule. Sociological methods & research 2020, 49, 699–718. [Google Scholar] [CrossRef]
- Slade, E.; Naylor, M.G. A fair comparison of tree-based and parametric methods in multiple imputation by chained equations. Statistics in medicine 2020, 39, 1156–1166. [Google Scholar] [CrossRef]
- Liu, M.; Li, S.; Yuan, H.; Ong, M.E.H.; Ning, Y.; Xie, F.; Saffari, S.E.; Shang, Y.; Volovici, V.; Chakraborty, B.; et al. Handling missing values in healthcare data: A systematic review of deep learning-based imputation techniques. Artificial intelligence in medicine 2023, 142, 102587. [Google Scholar] [CrossRef]
- Li, S.C.-X.; Jiang, B.; Marlin, B. MisGAN: Learning from Incomplete Data with Generative Adversarial Networks; Cornell University Library, arXiv.org: Ithaca, 2019. [Google Scholar]
- Xu, D.; Hu, P.J.-H.; Huang, T.-S.; Fang, X.; Hsu, C.-C. A deep learning–based, unsupervised method to impute missing values in electronic health records for improved patient management. Journal of biomedical informatics 2020, 111, 103576. [Google Scholar] [CrossRef] [PubMed]
- Peralta, M.; Jannin, P.; Haegelen, C.; Baxter, J.S.H. Data imputation and compression for Parkinson's disease clinical questionnaires. Artificial intelligence in medicine 2021, 114, 102051. [Google Scholar] [CrossRef] [PubMed]
Figure 1.
Multiple imputation process flowchart using out-of-hospital cardiac arrest registry data for Singapore (Jan 2006 – Dec 2020).
Figure 1.
Multiple imputation process flowchart using out-of-hospital cardiac arrest registry data for Singapore (Jan 2006 – Dec 2020).
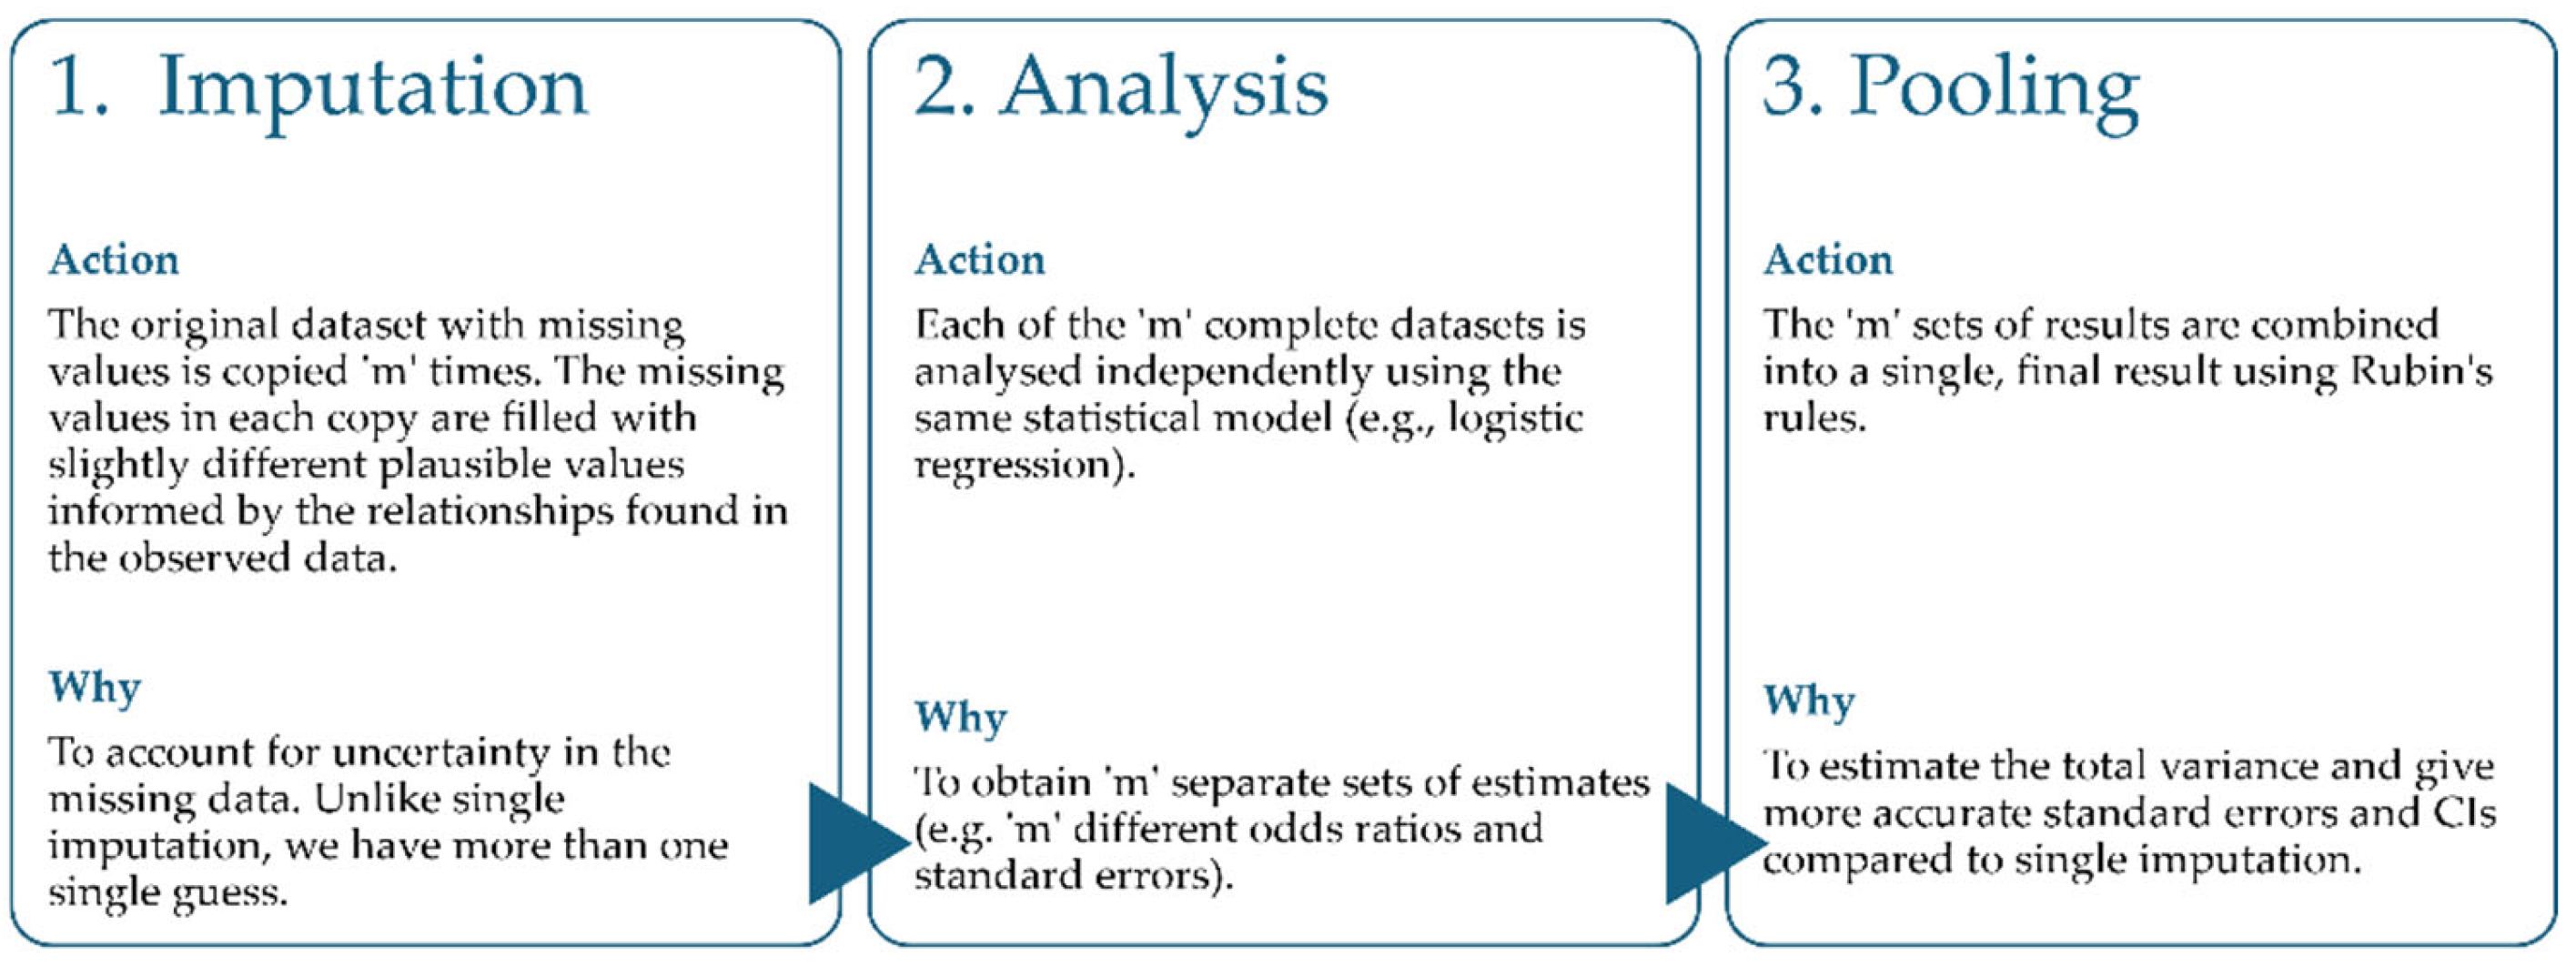
Figure 2.
Mean β coefficients and 95% confidence intervals (CIs) for the effect of each covariate on BCPR, based on 1000 simulations: (a) for covariate with missing values and (b) for covariate with non-missing values. Results for missing data proportions of 20%, 30%, and 40% are shown in orange, green, and purple, respectively. Dashed grey line represents the “true” coefficient from the reference dataset with no missing data. REF: no missing data (reference); CC: complete-case; MxI: missingness-indicator; MF: missForest; KNN: k-Nearest Neighbours; PMM: predictive mean matching; RF: random forest; CART: classification and regression trees.
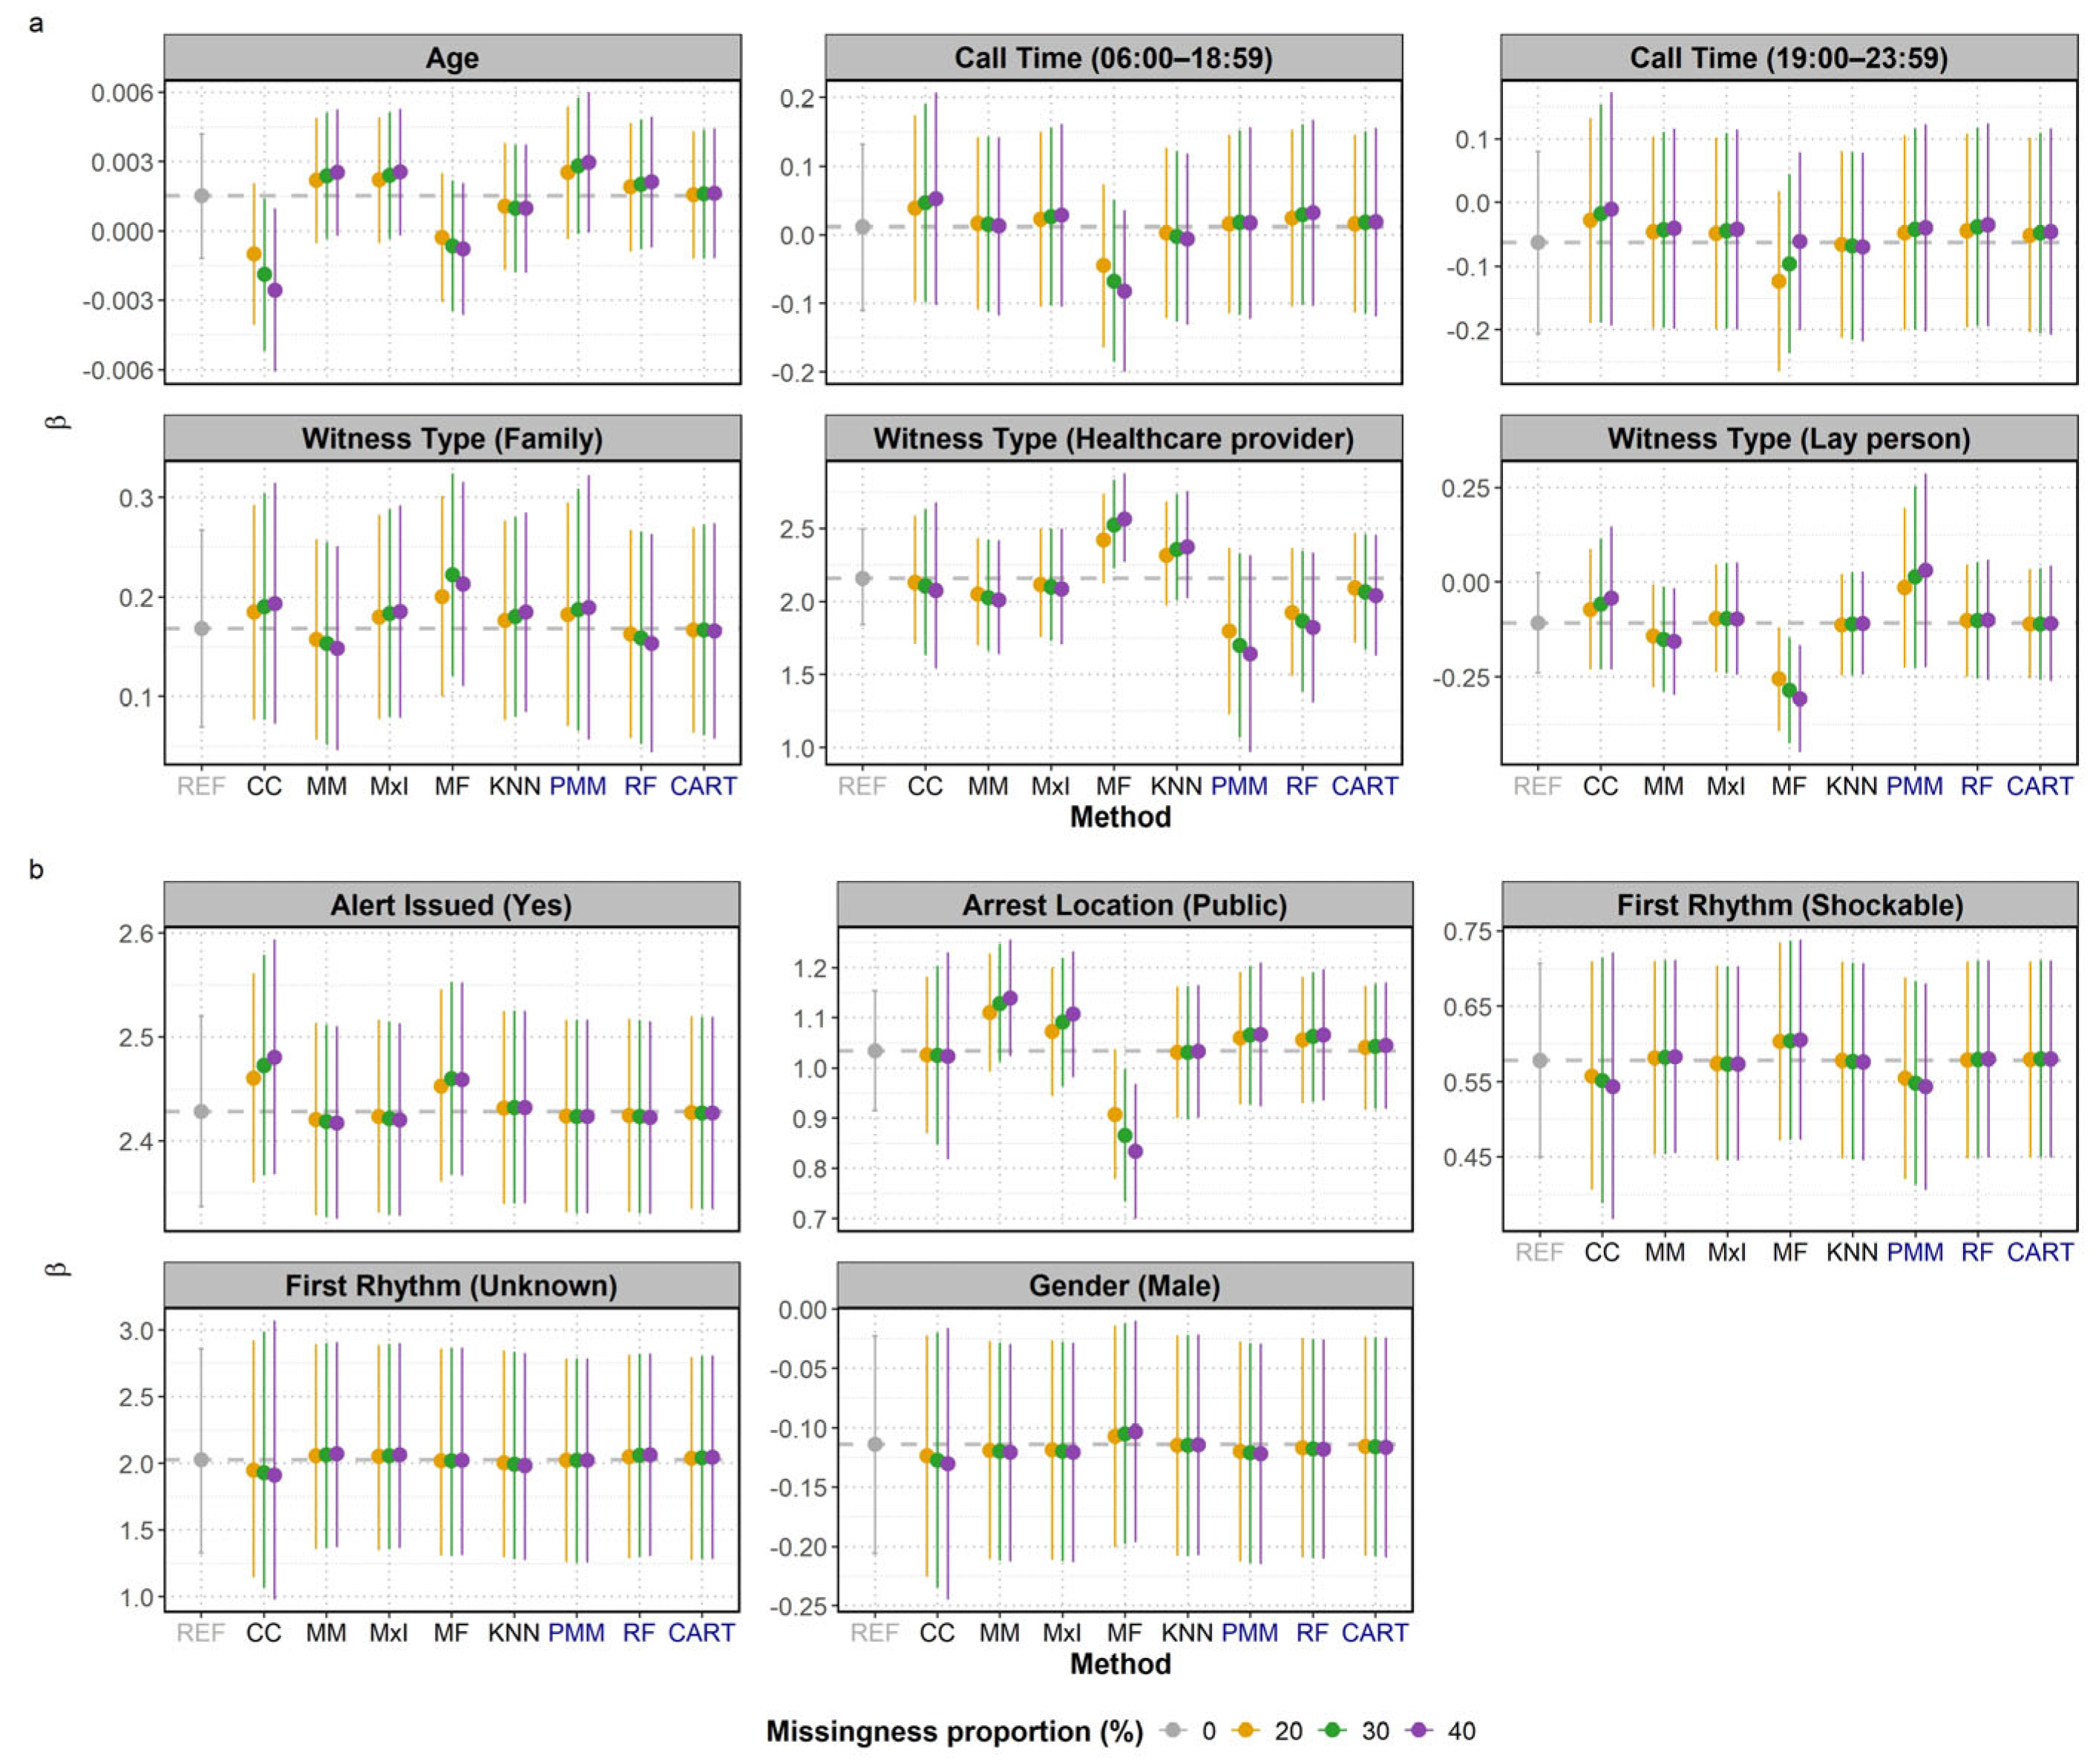
Figure 3.
Mean β coefficients and 95% confidence intervals (CIs) for the effect of each covariate on BCPR, based on 100 simulations with 20% missingness proportion, for different numbers of multiple imputations (m): (a) for covariate with missing values and (b) for covariate with non-missing values. Results for m values of 5, 10, 15 and 20 are shown in red, blue, green, and yellow, respectively. Dashed grey line represents the “true” coefficient from the reference dataset with no missing data. PMM: predictive mean matching; RF: random forest; CART: classification and regression trees.
Disclaimer/Publisher’s Note: The statements, opinions and data contained in all publications are solely those of the individual author(s) and contributor(s) and not of MDPI and/or the editor(s). MDPI and/or the editor(s) disclaim responsibility for any injury to people or property resulting from any ideas, methods, instructions or products referred to in the content. |
© 2025 by the authors. Licensee MDPI, Basel, Switzerland. This article is an open access article distributed under the terms and conditions of the Creative Commons Attribution (CC BY) license (http://creativecommons.org/licenses/by/4.0/).
Copyright: This open access article is published under a Creative Commons CC BY 4.0 license, which permit the free download, distribution, and reuse, provided that the author and preprint are cited in any reuse.


