Submitted:
17 December 2025
Posted:
17 December 2025
You are already at the latest version
Abstract
The increasing prevalence of obesity among adolescents pose a public health concern. The primary objective of this study was to evaluate the effect of a 50-minutes wise intervention based on values alignment that aimed to improve eating habits in adolescents. Additionally, a qualitative approach was employed to explore the perceived barriers and motivations related to reducing the consumption of unhealthy foods. A randomized clinical trial with two parallel groups was conducted, involving 592 adolescents (Mage = 14.31, DT = 0.66; 50.3% female, 46.1% male, 3.6% non-binary). Assessments were carried out at three time points. Hierarchical linear modelling results indicated a short-term, one-week increase in healthy food intake, in the alignment of healthy eating habits with adolescents' values, and an increase in the perceived appeal of healthy eating. However, the intervention did not reduce the consumption of unhealthy foods. Qualitative analysis identified the taste of processed foods, peer influence, and their addictive qualities as the main motivations and obstacles to dietary change. Overall, these results suggest that the intervention temporarily promotes healthier food choices and improves attitudes toward healthy eating; however, it does not effectively reduce the consumption of unhealthy foods.
Keywords:
healthy food intake
; unhealthy food intake
; values-alignment intervention
; adolescents
; wise intervention
1. Introduction
Obesity rates have risen significantly in recent years, posing a major challenge to global public health (World Health Organization [WHO], 2022). Traditional diets have been increasingly displaced by ultra-processed foods high in sugar, fat, and salt (see systematic review: Petridi et al., 2024), contributing to a global obesity crisis with severe human and economic consequences (Bryan et al., 2019). In the United States, 16.1% of adolescents are overweight and 19.3% are obese (Fryar et al., 2020). A similar trend is observed in Spain, where the prevalence of adolescent overweight and obesity has increased in recent years, positioning the country among those in the European Union countries with the highest rates (Bravo-Saquicela et al., 2022). According to the Spanish Agency for Food Safety and Nutrition (2023), 17.4% of Spanish adolescents aged 13 to 17 are overweight, and 6.2% are obese.
Obesity during childhood and adolescence is especially concerning due to its strong associations with a range of physical and mental health issues (Balasundaram & Krishna, 2021; Barton, 2012). Childhood obesity is a strong predictor of obesity in adulthood (Simmonds et al., 2016), and adolescent overweight increases the risk of morbidity and mortality later in life (Horesh et al., 2021). Given the its high prevalence and significant impact, preventive strategies that foster healthy eating habits are essential. Adolescence is a key developmental stage in which many health-related habits are formed, offering a strategic window for preventative interventions (Bryan et al., 2019). Even modest improvements in dietary habits during this period could yield substantial public health benefits by reducing diet-related diseases and mortality (Wang et al., 2011). However, despite ongoing research efforts, a cost-effective, sustainable approach for changing adolescents’ dietary preferences has yet to be established (Kobes et al., 2018).
1.1. Existing School Programs and Their Limitations
Because dietary preferences begin forming early in life, schools represent a valuable setting for promoting healthy eating among large populations of young people (Bryan et al., 2019). Numerous universal preventive interventions have been implemented in educational settings to improve adolescents’ eating habits (see reviews and meta-analyses: Ashton et al., 2019; Kobes et al., 2018; Smith et al., 2020; Stice et al., 2006). However, many meta-analyses have reported that over half of these interventions are ineffective (Pastor & Tur, 2020; Stice et al., 2006). Among those that do show positive results, the effects are generally marginal with small effect sizes (Hale et al., 2014; Jacob et al., 2021; Peirson et al., 2015; Stice et al., 2006). Moreover, many interventions are lengthy, lasting several weeks, and often influence only a limited number of targeted outcomes (e.g., Ashton et al., 2019; Stice et al., 2006).
Several meta-analyses have also examined the implementation strategies used in school-based interventions. Multicomponent strategies—those combining educational content, environmental changes, and family or teacher involvement—are among the most commonly employed (e.g., Jacob et al., 2021; Smith et al., 2020). Nonetheless, these traditional multicomponent approaches have often failed to produce the desired level of effectiveness (Smith et al., 2020). Another common limitation is that many programs rely on directive methods that prescribe specific behaviors adolescents should adopt or avoid, assuming that warnings about health risks are sufficient to drive behavior change (Steinberg, 2015). However, certain developmental characteristics of adolescence, such as heightened sensitivity to autonomy and social status, may limit the effectiveness of such approaches (Yeager et al., 2018). Adolescents who perceive adults as attempting to control their behavior may react with resistance, potentially producing effects opposite to those intended (Stice et al., 2006).
1.2. Brief Interventions: An Overview
In response to this challenge, recent years have seen increasing interest in a class of interventions known as “wise interventions” (WIs). These brief, theory-driven techniques aim to shift how individuals interpret themselves, others, or their social contexts (see review by Walton & Wilson, 2018). WIs are particularly well suited to adolescence, as they can be designed to respect of adolescents’ autonomy and social identity. Unlike traditional interventions, WIs provide new information and encourage reflection, allowing adolescents to form their own conclusions (Yeager et al., 2018). This approach is more congruent with adolescents’ developmental needs and may be more effective at fostering lasting behavior change.
Given that WIs have demonstrated effectiveness across multiple domains in modifying adolescent behavior (e.g., Calvete et al., 2021; Calvete et al., 2023; Fernández-González et al., 2020; Miu & Yeager, 2015; Schleider & Weisz, 2018), their application to improving adolescents’ dietary habits may offer a promising strategy for fostering positive change. In this context, Bryan et al. (2016, 2019) designed and evaluated the effectiveness of a WI aimed at enhancing adolescents’ daily dietary choices. Their intervention, referred to as a values-alignment intervention (VAI), adopted a different approach from traditional methods. Traditional approaches typically focus on educating individuals about nutrition and the importance of healthy choices for long-term health (Jacob et al., 2021); however, long-term benefits tend to have limited impact on adolescents. Moreover, emphasizing future health does little to counteract the effects of marketing (Bryan et al., 2019), which continuously targets children and adolescents to create positive associations with unhealthy foods and increase their consumption (Potvin Kent et al., 2014; Qutteina et al., 2019). Consequently, previous studies have identified marketing as a major risk factor contributing to unhealthy eating behaviors among adolescents (Boyland et al., 2016; Qutteina et al., 2019; Tatlow-Golden & Garde, 2020).
To address this issue, Bryan et al. (2016) proposed an intervention aiming to counteract the positive emotional associations generated by marketing by framing the rejection of unhealthy foods—and the adoption of healthier alternatives—as a means of upholding values important to adolescents: (1) autonomy from adult control and (2) social justice. These values have been shown to gain particular importance during adolescence (Bryan et al., 2016). In line with this, the randomized trial by Bryan et al. (2016) demonstrated that the VAI produced immediate changes in eating behavior, with adolescents showing increased consumption of healthy foods and reduced intake of unhealthy foods the following day. The study also found statistically significant improvements in attitudinal variables related to healthy eating. Moreover, these authors developed an expanded second version of the VAI intervention and found that, after two consecutive sessions, adolescents who received the intervention made significantly healthier food and drink choices over the following three months (Bryan et al., 2019). These findings suggest that framing unhealthy eating as inconsistent with adolescents’ core values may offer a cost-effective approach to promoting positive changes in dietary habits, attitudes, and decision-making.
1.3. The Present Study
Given the above, and in light of the fact that the VAI has not yet been replicated in other adolescent samples, the primary objective of this study was to adapt Bryan et al.’s (2019) intervention to improve obesity-related dietary behaviors among Spanish adolescents and to evaluate its effectiveness. Based on prior research, it was hypothesized that adolescents who received the VAI would report significantly greater increases in healthy food consumption and decreases in unhealthy food intake compared to those in the control group, who received a traditional educational intervention on healthy habits. Additionally, it was expected that adolescents in the experimental condition would show greater alignment with healthy eating habits and perceive healthy eating as more appealing compared to those in the control condition A secondary objective was to qualitatively explore the reasons adolescents consume unhealthy foods and the challenges they face in reducing their intake.
2. Materials and Methods
2.1. Study Design and Procedure
A randomized controlled trial using a parallel-group design was conducted (clinical trials ID: NCT05865444). Six educational centers were invited to participate, selected from a broader list of schools in Bizkaia to ensure a balanced representation of socioeconomic backgrounds. Of these, one school did not respond and two declined, resulting in an initial sample of students from three schools (N = 631; see Figure 1). Participation was voluntary, and informed consent was obtained from both adolescents and their families, who were given the option to decline their children's participation. Only 6% of families declined, and one adolescent chose not to participate in the study.
Randomization was conducted at the classroom level within each grade, with half of the classrooms in each grade randomly assigned to one of the two conditions. All questionnaires and intervention tasks were administered via classroom computers using the Qualtrics© platform, with the exception of narrative writing and interactive activity components (described in the Interventions section), which were completed manually on paper. Interventions were delivered in a single session lasting approximately 50 minutes. Assessments were conducted at three time points: (1) pretest (immediately before the intervention), (2) posttest (one week after the intervention), and (3) follow-up (three months after the intervention). Both the interventions and assessments were administered by trained research assistants during regular school hours. The study was approved by the Ethics Committee of Deusto (internal code: ETK-43/21-22). All personal data were protected in accordance with Organic Law 15/1999 of December 13 on the Protection of Personal Data.This section may be divided by subheadings. It should provide a concise and precise description of the experimental results, their interpretation, as well as the experimental conclusions that can be drawn.
2.2. Participants
A total of 631 adolescents were invited to participate, of whom 592 obtained consent from their families and agreed to participate themselves (50.3% female, 46.1% male, and 3.6% non-binary). Participants ranged in age from 12 to 16 years (Mage = 14.31, SD = 0.66). Of these, 291 were assigned to the experimental condition (i.e., VAI) and 301 to the control condition (i.e., educational intervention). In the experimental group, 259 participants completed the posttest and 275 completed the three-month follow-up. In the control group, 301 completed the pretest, 274 completed the posttest and 276 completed the three-month follow-up. In total, 509 adolescents (250 in the experimental group and 259 in the control group) completed all three assessments, yielding a retention rate of 86% (see Figure 1). Attrition analyses revealed no significant differences in condition, age, or outcome variables between those who completed all assessments (n = 509) and those who did not (n = 83).
Based on the classification system of the National Institute of Statistics of Spain, the distribution of their mothers, fathers, or legal guardians’ occupations was as follows: scientific and intellectual professionals (24.4%), accounting and administrative employees (15.4%), restaurant and security service workers and salespeople (14.1%), technicians and support professionals (11%), artisans and skilled workers in the manufacturing and construction industries (10.8%), homemakers (6.4%), directors and managers (4.1%), machinery operators (3%). Additionally, 0.1% of the sample were retired, 3% were unemployed, and 7.9% of participants did not respond to this item.
2.3. Measures
Healthy Food Intake
Healthy food intake was measured using items from Stok et al. (2015). Participants responded to two questions: “On average, how many pieces of fruit do you eat per day?” and “On average, how many servings of cooked or raw vegetables do you eat per day? (A serving refers to a plate or small portion).” Five response options were provided: “none,” “1,” “2,” “3,” “4,” or “more than 4 pieces/servings per day.” Participants answered these questions based on their eating habits during the previous week. The two items were summed to create a healthy eating index. Ordinal alpha coefficients were .54 at pretest, .61 at posttest, and .57 at three-month follow-up.
Unhealthy Food Intake
Unhealthy food intake was also assessed using Stok et al.’s (2015) questionnaire. Participants responded to the following questions: “On average, how many snacks do you eat per day?” and “On average, how many glasses of soft drinks or energy drinks do you consume per day?” Examples of snacks and unhealthy beverages were provided. Response options were: “none,” “1,” “2,” “3,” “4,” or “more than 4 pieces/servings per day.” cores were summed to create an index of unhealthy eating. Participants answered these questions based on their eating habits during the previous week. Ordinal alpha coefficients were .64 at pretest, .63 at posttest, and .57 at three-month follow-up.
Alignment of Healthy Eating Habits with Adolescent Values
The alignment between healthy eating habits and adolescents’ values was measured using seven items developed by Bryan et al. (2019). Four items assessed the extent to which healthy eating was associated with social justice (e.g., “When I choose to eat healthily, I’m helping make the world a better place”), and three assessed the value of autonomy (e.g., “When I eat healthily, I feel like I’m taking control of my food choices”). Responses were given on a five-point Likert scale ranging from 1 (“strongly disagree”) to 5 (“strongly agree”). Ordinal alpha coefficients were .84 at pretest, .88 at posttest, and .87 at three-month follow-up.
Perceived Attractiveness of Healthy Eating
The perceived attractiveness of healthy eating was assessed using three items developed by Bryan et al. (2016) (e.g., “I respect people who eat healthy more than those who eat unhealthily”). Responses were recorded on a five-point Likert scale ranging from 1 (“do not identify with this at all”) to 5 (“strongly identify with this”). Ordinal alpha coefficients were .64 at pretest, .67 at posttest, and .62 at three-month follow-up, respectively.
At the three-month follow-up, adolescents responded to two open-ended questions regarding their dietary habits. The questions were: “What do you think are the reasons why you sometimes consume unhealthy foods (e.g., hamburgers, candy, Doritos, Cheetos, potato chips, etc.) or sugary beverages (e.g., Coca-Cola, Red Bull, etc.)?” and “What difficulties do you encounter when trying to consume fewer unhealthy foods and drinks? In other words, when attempting to reduce your intake of unhealthy items, what obstacles do you encounter?”
2.4. Interventions
The original VAI and the educational intervention developed by Bryan et al. (2019) were designed as a 100-minute intervention delivered across two consecutive sessions. However, for the present study, the intervention was adapted by reducing its duration to a single 50-minute session.
Values-Alignment Intervention
The experimental group received a VAI consisting of three core components: reading materials, writing exercises, and an interactive activity. First, participants read recent articles exposing the deceptive and manipulative marketing practices of food companies, with an emphasis on their harmful impact on society—particularly on children and socioeconomically disadvantaged groups. Testimonials from other adolescents were also presented to foster a sense of collective indignation and highlight strategies to resist these practices. These materials framed the rejection of unhealthy foods as a means of standing up against injustice and promoting healthier choices.
Next, participants completed two written reflections. In the first, they analyzed why people might feel upset or outraged by food industry practices. In the second, they reflected on how adolescents can respond to these practices through their dietary choices, emphasizing how their actions could serve as a positive example for younger children. Finally, participants engaged in an interactive activity titled “Make it True.” In this activity, they examined real advertisements for junk food and altered them—by drawing, writing, or changing the slogans—to expose the misleading elements and create “truthful” versions that revealed the manipulative intent behind the original messaging.
Educational Intervention
The control group received a traditional educational intervention adapted from Bryan et al. (2019), consisting of two parts: reading materials and written exercises. Participants first read scientific content about nutrition and digestion, with an emphasis on how these biological processes are linked to weight and overall health. The materials also emphasized the benefits of regular physical activity. Additionally, participants read testimonials from adults (e.g., family members and health professionals) highlighting how healthy eating habits benefit adolescents’ well-being and raise awareness about the long-term consequences of poor nutrition.
After reading the materials, participants completed two written reflections. These reflections prompted them to evaluate what they had learned and consider how they might apply this knowledge to adopt healthier eating habits.
2.5. Overview of the Statistical Approach
Hierarchical linear modeling (HLM 8; Raudenbush et al., 2019) was used to analyze the quantitative data, with a full information maximum likelihood (FIML) estimator and robust standard errors. FIML estimates parameters using all available data, including cases with missing values. Separate models were estimated for each outcome variable: healthy food intake, unhealthy food intake, alignment of healthy eating habits with adolescent values, and perceived attractiveness of healthy eating.
Each model included level 1, level 2, and level 3 components. At level 1, regression equations modeled within-subject variation in repeated measures over time (e.g., healthy food intake), coded as 0, 1, and 2. Because preliminary analyses suggested curvilinear trends, a quadratic term (Time²) was also included in the model. At level 2, the experimental condition (0 = control, 1 = values intervention) was included as a predictor of both intercepts and slopes, with both specified as random effects. Finally, at level 3, we accounted for classroom-level clustering (n = 27).
Qualitative responses were analyzed in multiple phases to ensure the rigor of the findings. In the first phase, the first author conducted a thematic analysis (Braun & Clarke, 2006) using an inductive approach, whereby general categories were derived from the data (Miles et al., 2014; Patton, 2015; Thomas, 2006). These categories captured both the reasons adolescents cited for consuming unhealthy foods and the difficulties they reported in maintaining a healthy diet. To enhance the internal validity of the study, the categories were reviewed by the first and last authors, who reached consensus regarding the content and number of categories for each question.
Subsequently, two additional authors independently coded the responses manually, allowing for a single participant’s response to be classified under multiple categories. Inter-rater reliability was assessed using Cohen’s kappa coefficient. Discrepancies between the two coders were independently recoded by a third evaluator and then resolved through consensus among all evaluators. This procedure aligns with established criteria for rigor in qualitative research (Lincoln & Guba, 1985; Stahl & King, 2020), specifically regarding dependability, understood as the consistency of the analytical process. Finally, the frequency of each category was analyzed to identify both the reasons for consuming unhealthy foods and the challenges adolescents face in reducing their consumption.
3. Results
3.1. Descriptive Statistics and Preliminary Analyses
Table 1 presents the means, standard deviations, and correlations among all study variables. All correlation coefficients were statistically significant, except those between healthy food intake and unhealthy food intake, and between unhealthy food intake and the alignment of healthy eating habits with adolescent values, across all time points. Pretest comparisons revealed no significant differences (all p > .05) between the experimental and control groups on any of the variables analyzed.
3.2. Effects of the Values-Alignment Intervention
Table 2 presents the coefficients of the predictive models. The intervention had no significant effects on unhealthy food intake. However, it significantly moderated both the linear and quadratic components of the trajectories for healthy food intake, the alignment of healthy eating habits with adolescent values, and the perceived attractiveness of healthy eating. Figure 2 illustrates the effects of the VAI on these variables.
Participants in the VAI group reported an initial increase in healthy food intake following the intervention, although scores declined slightly between the one-week posttest and the three-month follow-up. In contrast, the control group showed no change in healthy food intake. Regarding the alignment of healthy eating habits with adolescent values, the experimental group demonstrated an upward trend from pretest to the three-month follow-up, with a slight decrease between the one-week posttest and three-month follow-up assessments. For perceived attractiveness of healthy eating, the experimental group showed a slight decline from pretest to posttest, followed by a recovery at the follow-up, while the control group remained stable. Table 3 presents the random effects of the models.
3.3. Results of Qualitative Analysis
A thematic qualitative content analysis (Braun & Clarke, 2006) was conducted on responses to two independent questions. The first question explored why adolescents sometimes consume unhealthy foods. A total of 91% of participants responded to this question, resulting in 539 responses. Of these, 29 were excluded due to a lack of meaningful content (e.g., responses such as “I don’t know” or answers irrelevant to the question), resulting in a final sample of 510 responses. The analysis identified 12 categories related to the reasons for consuming unhealthy foods. Cohen’s kappa was .88, indicating a high level of inter-rater agreement (McHugh, 2012).
The second question examined the difficulties adolescents face in reducing their consumption of unhealthy foods and beverages. A total of 89% of adolescents responded, resulting in 527 responses. Of these, 115 were excluded from the analysis due to a lack of meaningful content, resulting in a final sample of 412 responses. The analysis identified 12 categories. The kappa coefficient was .83, again indicating strong inter-rater reliability (McHugh, 2012). Table 4 presents the identified categories and their descriptions, along with frequency counts and representative quotes for each question.
4. Discussion
The primary aim of this study was to evaluate the effectiveness of an adapted version of a VAI in improving dietary habits among Spanish adolescents. A secondary objective was to qualitatively explore the reasons adolescents consume unhealthy foods and the barriers they face in reducing such consumption. Overall, while the VAI did not significantly reduce unhealthy food intake, it showed short-term benefits in increasing healthy food intake, alignment of healthy eating habits with adolescent values and enhancing the social appeal of healthy eating—although these effects diminished over time. Key findings are discussed in more detail below.
First, the VAI was effective in increasing the perceived alignment of healthy eating with personal values and boosting healthy food intake one week after the intervention. Participants in the VAI group reported a stronger sense that healthy eating was consistent with values they consider important. As noted by Bryan et al. (2016), common adolescent values include independence and justice. For example, participants reported a heightened sense that choosing healthy foods supported the value of justice, understood as the desire to contribute to a fairer and more equitable world. These findings are consistent with prior research by Bryan et al. (2016), who observed similar effects immediately after intervention. Moreover, recent work has shown that when a behavior aligns with personal values, it becomes more meaningful and intrinsically motivating (Hecht et al., 2023). In line with this, adolescents who received the VAI also showed a short-term increase in healthy food intake.
However, contrary to expectations, none of these effects were maintained at the three-month follow-up. This pattern is consistent with previous studies employing traditional methodologies, which have shown that the effects of dietary interventions often emerge in the short term but diminish over time (Ashton et al., 2019). Nevertheless, in contrast to the findings of the present study, Bryan et al. (2019) reported that the VAI, delivered in two consecutive sessions, produced lasting changes in eating behavior, leading to increased consumption of healthy foods and reduced intake of unhealthy foods at the three-month follow-up.
The discrepancies in long-term effectiveness between the two studies may be explained by several factors, the most salient being that the present study employed an adapted version of the intervention. Bryan et al.’s (2019) original VAI was designed to be completed over 100 minutes across two consecutive days. In contrast, for the present study the intervention was adapted and condensed into a single 50-minute session. Consequently, the findings suggest that one session may not be sufficient to produce long-term changes, although it is effective in generating short-term improvements, specifically one week after the intervention. It is possible that, after receiving the VAI, adolescents had a heightened awareness of the manipulative nature of food marketing, which may have facilitated the increase in healthy food consumption, at least during the first week. However, without reinforcement, the influence of daily routines and the challenges identified in the qualitative findings (see Table 4) may have gradually undermined the intervention’s impact. This suggests that adding a second session could be critical for reinforcing and sustaining the effects over time.
Other methodological differences, such as cluster randomization and food consumption measurements, may also have contributed to the results obtained. For example, Bryan et al. (2019) used objective data—specifically, daily records of food purchases in the school cafeteria throughout the study period—the present study relied on self-reported measures of food consumption over the past week. Compared to objective measures, self-reports are more susceptible to recall bias and social desirability bias (Paulhus, 2007), which may have limited our ability to detect actual behavioral changes over time.
Similarly, while motivational techniques may be sufficient to increase the frequency of healthy eating—particularly when such behaviors already exist to some degree—reducing the consumption of unhealthy foods presents a more complex challenge (Constantinides et al., 2021; Kachwaha et al., 2024). These behaviors are often ingrained in daily habits and strongly reinforced by the surrounding environment (Louey et al., 2024), making them resistant to change even in the short term. Because these behaviors tend to be activated automatically in familiar contexts, effective change may require not just motivation but also the substitution of habitual behaviors with new, more adaptive ones (Gardner, 2015). As illustrated in the qualitative analysis, adolescents frequently cited the influence of their social and physical environments—such as peer interactions, pervasive advertising, and the easy availability of ultra-processed foods—as significant barriers to healthier choices.
In the qualitative results, participants most commonly reported that they consume unhealthy foods because these items are perceived as more flavorful and appealing. Social contexts also emerged as contributing factors, including time spent with friends, family gatherings, and other group events. When asked about the challenges they face in reducing unhealthy consumption, adolescents again emphasized that unhealthy foods are tastier and more attractive than healthy options. Some also noted that certain foods produce a sense of dependency or addiction, which makes self-control and limiting intake more difficult. These findings are consistent with those of a recent systematic review of the main barriers to healthy eating (for review see Louey et al., 2024) and offer important insights for refining the VAI and designing future interventions.
4.1. Limitations and Strengths
This study has several limitations that should be acknowledged. First, all assessments were based on self-report measures, which may be influenced by recall errors and social desirability bias (Paulhus, 2007). Future research should consider supplementing self-reports with additional data sources, such as families reports or objective records of dietary behavior, to improve the accuracy and reliability of findings. Another limitation concerns the single-session format of the intervention. Although brevity is one of the strengths of WIs (Walton & Wilson, 2018), the results of this study suggest that a one-time session may not be sufficient to sustain behavior change. Future adaptations might include a reinforcement session addressing the impact of food marketing and the specific barriers reported by adolescents in this study. These modifications could strengthen the intervention’s alignment with adolescents’ real-life needs and experiences.
Despite these limitations, the study also has notable strengths. It employed a randomized controlled trial design, enhancing the internal validity of the results. Additionally, the sample was large and diverse, drawn from several educational institutions, and the study incorporated a three-month follow-up, allowing for the evaluation not only of the immediate effects of the intervention but also its progression over time. Additionally, the inclusion of qualitative content analysis provided rich insights into adolescents’ motivations and challenges related to unhealthy eating—an important complement to the quantitative data.
In summary, this study suggests that a single 50-minute session of the VAI can produce short-term improvements in healthy food consumption, alignment with adolescent values, and the social appeal of healthy eating. Although these effects did not persist over time, the fact that a brief, one-hour intervention led to measurable behavior change—even temporarily—suggests the potential of this approach. Future research should explore whether increasing the number of sessions or incorporating follow-up reminders could enhance the intervention’s impact, making it a cost-effective strategy for use in educational and community settings.
Author Contributions
Conceptualization, E.C., I.O., L. F-G., N.C. and A.E.; methodology, E.C., I.O., L. F-G., N.C. and A.E.; formal analysis, E.C.; writing—original draft preparation, N. G-M. and E.C.; writing—review and editing, I.O., L. F-G., N.C., A.E.; J. D-B. and L. M. All authors have read and agreed to the published version of the manuscript.
Funding
Please add: This research was funded by the Basque Government under Grant IT1532-22 and Red PROEMO under Grant RED2022-134247-T.
Institutional Review Board Statement
The study was conducted in accordance with the Declaration of Helsinki, and approved by the Research Ethics Committee of the University of Deusto (Ref: ETK-43/21-22). And the approval date is July 26th, 2022.
Informed Consent Statement
Informed consent was obtained from all subjects involved in the study.
Data Availability Statement
The data are available from the corresponding author on reasonable request.
Conflicts of Interest
The authors declare no conflicts of interest.
References
- Agencia Española de Seguridad Alimentaria y Nutrición (2023). Situación ponderal de la población infantil y adolescente en España.
- Ashton, L. M.; Sharkey, T.; Whatnall, M. C.; Williams, R. L.; Bezzina, A.; Aguiar, E. J.; Collins, C. E.; Hutchesson, M. J. Effectiveness of interventions and behaviour change techniques for improving dietary intake in young adults: A systematic review and meta-analysis of RCTs. Nutrients 2019, 11, 825. [Google Scholar] [CrossRef] [PubMed]
- Balasundaram, P.; Krishna, S. Obesity effects on child health. In StatPearls; StatPearls Publishing, 2025; Available online: https://www.ncbi.nlm.nih.gov/books/NBK570613/.
- Barton, M. Childhood obesity: A life-long health risk. Acta Pharmacologica Sinica 2012, 33, 189–193. [Google Scholar] [CrossRef]
- Boyland, E. J.; Nolan, S.; Kelly, B.; Tudur-Smith, C.; Jones, A.; Halford, J. C.; Robinson, E. Advertising as a cue to consume: A systematic review and meta-analysis of the effects of acute exposure to unhealthy food and nonalcoholic beverage advertising on intake in children and adults. The American Journal of Clinical Nutrition 2016, 103, 519–533. [Google Scholar] [CrossRef]
- Braun, V.; Clarke, V. Using thematic analysis in psychology. Qualitative Research in Psychology 2006, 3, 77–101. [Google Scholar] [CrossRef]
- Bravo-Saquicela, D. M.; Sabag, A.; Rezende, L. F. M.; Rey-López, J. P. Has the prevalence of childhood obesity in Spain plateaued? A systematic review and meta-analysis. International Journal of Environmental Research and Public Health 2022, 19, 5240. [Google Scholar] [CrossRef]
- Bryan, C. J.; Yeager, D. S.; Hinojosa, C. P. A values-alignment intervention protects adolescents from the effects of food marketing. Nature Human Behaviour 2019, 3, 596–603. [Google Scholar] [CrossRef] [PubMed]
- Bryan, C. J.; Yeager, D. S.; Hinojosa, C. P.; Chabot, A.; Bergen, H.; Kawamura, M.; Steubing, F. Harnessing adolescent values to motivate healthier eating. Proceedings of the National Academy of Sciences 2016, 113, 10830–10835. [Google Scholar] [CrossRef]
- Calvete, E.; Cortazar, N.; Fernández-González, L.; Echezarraga, A.; Beranuy, M.; León, A.; González-Cabrera, J.; Orue, I. Effects of a brief preventive intervention in cyberbullying and grooming in adolescents. Psychosocial Intervention 2021, 30, 75–84. [Google Scholar] [CrossRef]
- Calvete, E.; Fernández-González, L.; Orue, I. A growth mindset and self-affirmation intervention to reduce violent and risky online behaviors: The moderating role of previous victimization. Journal of Interpersonal Violence 2023, 38, 5875–5901. [Google Scholar] [CrossRef]
- Constantinides, S. V.; Turner, C.; Frongillo, E. A.; Bhandari, S.; Reyes, L. I.; Blake, C. E. Using a global food environment framework to understand relationships with food choice in diverse low-and middle-income countries. Global Food Security 29 2021, 100511. [Google Scholar] [CrossRef]
- Fernández-González, L.; Calvete, E.; Sánchez-Álvarez, N. Efficacy of a brief intervention based on an incremental theory of personality in the prevention of adolescent dating violence: A randomized controlled trial. Psychosocial Intervention 2020, 29, 9–18. [Google Scholar] [CrossRef]
- Fryar, C. D., Carroll, M. D., & Afful, J. (2020). Prevalence of overweight, obesity, and severe obesity among children and adolescents aged 2–19 years: United States, 1963–1965 through 2017–2018 (NCHS Health E-Stats). National Center for Health Statistics. Available online: https://www.cdc.gov/nchs/data/hestat/obesity-child-17-18/overweight-obesity-child-H.pdf.
- Gardner, B. A review and analysis of the use of ‘habit’ in understanding, predicting and influencing health-related behaviour. Health Psychology Review 2015, 9, 277–295. [Google Scholar] [CrossRef] [PubMed]
- Hale, D. R.; Fitzgerald-Yau, N.; Viner, R. M. A systematic review of effective interventions for reducing multiple health risk behaviors in adolescence. American Journal of Public Health 2014, 104, e19–e41. [Google Scholar] [CrossRef]
- Hecht, C. A.; Bryan, C. J.; Yeager, D. S. A values-aligned intervention fosters growth mindset–supportive teaching and reduces inequality in educational outcomes. Proceedings of the National Academy of Sciences 2023, 120. [Google Scholar] [CrossRef]
- Horesh, A.; Tsur, A. M.; Bardugo, A.; Twig, G. Adolescent and childhood obesity and excess morbidity and mortality in young adulthood—a systematic review. Current Obesity Reports 2021, 10, 301–310. [Google Scholar] [CrossRef]
- Jacob, C. M.; Hardy-Johnson, P. L.; Inskip, H. M.; Morris, T.; Parsons, C. M.; Barrett, M.; Hanson, M.; Woods-Townsend, K.; Baird, J. A systematic review and meta-analysis of school-based interventions with health education to reduce body mass index in adolescents aged 10 to 19 years. International Journal of Behavioral Nutrition and Physical Activity 2021, 18, 1–22. [Google Scholar] [CrossRef]
- Kachwaha, S.; Kim, S. S.; Das, J. K.; Rasheed, S.; Gavaravarapu, S. M.; Pandey Rana, P.; Menon, P. Behavior Change Interventions to Address Unhealthy Food Consumption: A Scoping Review. Current Developments in Nutrition 2024, 8, 102104. [Google Scholar] [CrossRef]
- Kobes, A.; Kretschmer, T.; Timmerman, G.; Schreuder, P. Interventions aimed at preventing and reducing overweight/obesity among children and adolescents: A meta-synthesis. Obesity Reviews 2018, 19, 1065–1079. [Google Scholar] [CrossRef] [PubMed]
- Lincoln, Y. S.; Guba, E. G. Naturalistic inquiry; Sage Publications, 1985. [Google Scholar]
- Louey, J.; He, J.; Partridge, S. R.; Allman-Farinelli, M. Facilitators and barriers to healthful eating among adolescents in high-income countries: a mixed-methods systematic review. Obesity Reviews 2024, 25, e13813. [Google Scholar] [CrossRef]
- McHugh, M. L. Interrater reliability: The kappa statistic. Biochemia Medica 2012, 22, 276–282. [Google Scholar] [CrossRef] [PubMed]
- Miles, M. B.; Huberman, A. M.; Saldaña, J. Qualitative data analysis: A methods sourcebook, 3rd ed.; Sage Publications, 2014. [Google Scholar]
- Miu, A. S.; Yeager, D. S. Preventing symptoms of depression by teaching adolescents that people can change: Effects of a brief incremental theory of personality intervention at 9-month follow-up. Clinical Psychological Science 2015, 3, 726–743. [Google Scholar] [CrossRef]
- Pastor, R.; Tur, J. A. Effectiveness of interventions to promote healthy eating habits in children and adolescents at risk of poverty: Systematic review and meta-analysis. Nutrients 2020, 12, 1891. [Google Scholar] [CrossRef]
- Patton, M. Q. Qualitative research & evaluation methods: Integrating theory and practice; Sage Publications, 2015. [Google Scholar]
- Paulhus, D. L.; Vazire, S. The self-report method. Handbook of research methods in personality psychology 2007, 1, 224–239. [Google Scholar]
- Peirson, L.; Fitzpatrick-Lewis, D.; Morrison, K.; Ciliska, D.; Kenny, M.; Ali, M. U.; Raina, P. Prevention of overweight and obesity in children and youth: A systematic review and meta-analysis. CMAJ Open 2015, 3, E23–E33. [Google Scholar] [CrossRef]
- Petridi, E.; Karatzi, K.; Magriplis, E.; Charidemou, E.; Philippou, E.; Zampelas, A. The impact of ultra-processed foods on obesity and cardiometabolic comorbidities in children and adolescents: A systematic review. Nutrition Reviews 2024, 82, 913–928. [Google Scholar] [CrossRef]
- Potvin Kent, M.; Bagnato, M.; Remedios, L.; Soares Guimarães, J.; Gillis, G.; Soto, C.; Hatoum, F.; Pritchard, M. Child and adolescent exposure to unhealthy food marketing across digital platforms in Canada. BMC Public Health 2024, 24, 1740. [Google Scholar] [CrossRef]
- Qutteina, Y.; De Backer, C.; Smits, T. Media food marketing and eating outcomes among pre-adolescents and adolescents: A systematic review and meta-analysis. Obesity Reviews 2019, 20, 1708–1719. [Google Scholar] [CrossRef]
- Raudenbush, S. W., Bryk, A. S., Cheong, Y. F., Congdon, R. T., & du Toit, M. (2019). HLM 8.0 for Windows [Software manual]. Scientific Software International.
- Schleider, J.; Weisz, J. R. A single-session growth mindset intervention for adolescent anxiety and depression: 9-month outcomes of a randomized trial. Journal of Child Psychology and Psychiatry 2018, 59, 160–170. [Google Scholar] [CrossRef]
- Simmonds, M.; Llewellyn, A.; Owen, C. G.; Woolacott, N. Predicting adult obesity from childhood obesity: A systematic review and meta-analysis. Obesity Reviews 2016, 17, 95–107. [Google Scholar] [CrossRef] [PubMed]
- Smith, J. D.; Fu, E.; Kobayashi, M. A. Prevention and management of childhood obesity and its psychological and health comorbidities. Annual Review of Clinical Psychology 2020, 16, 351–378. [Google Scholar] [CrossRef] [PubMed]
- Stahl, N. A.; King, J. R. Understanding and Using Trustworthiness in Qualitative Research. Journal of Developmental Education 2020, 44, 26–28. [Google Scholar]
- Steinberg, L. How to improve the health of American adolescents. Perspectives on Psychological Science 2015, 10, 711–715. [Google Scholar] [CrossRef]
- Stice, E.; Shaw, H.; Marti, C. N. A meta-analytic review of obesity prevention programs for children and adolescents: The skinny on interventions that work. Psychological Bulletin 2006, 132, 667–691. [Google Scholar] [CrossRef]
- Stok, F. M.; de Vet, E.; de Wit, J. B. F.; Luszczynska, A.; Safron, M.; de Ridder, D. T. D. The proof is in the eating: Subjective peer norms are associated with adolescents' eating behaviour. Public Health Nutrition 2015, 18, 1044–1051. [Google Scholar] [CrossRef]
- Tatlow-Golden, M.; Garde, A. Digital food marketing to children: exploitation, surveillance and rights violations. Global Food Security 2020, 27, 100423. [Google Scholar] [CrossRef]
- Thomas, D. R. A general inductive approach for analyzing qualitative evaluation data. American Journal of Evaluation 2006, 27, 237–246. [Google Scholar] [CrossRef]
- Walton, G. M.; Wilson, T. D. Wise interventions: Psychological remedies for social and personal problems. Psychological Review 2018, 125, 617–655. [Google Scholar] [CrossRef] [PubMed]
- Wang, Y. C.; McPherson, K.; Marsh, T.; Gortmaker, S. L.; Brown, M. Health and economic burden of the projected obesity trends in the USA and the UK. The Lancet 2011, 378, 815–825. [Google Scholar] [CrossRef]
- World Health Organization. European regional obesity report 2022; World Health Organization Regional Office for Europe, 2022. [Google Scholar]
- Yeager, D. S.; Dahl, R. E.; Dweck, C. S. Why interventions to influence adolescent behavior often fail but could succeed. Perspectives on Psychological Science 2018, 13, 101–122. [Google Scholar] [CrossRef] [PubMed]
Figure 1.
Consort diagram.
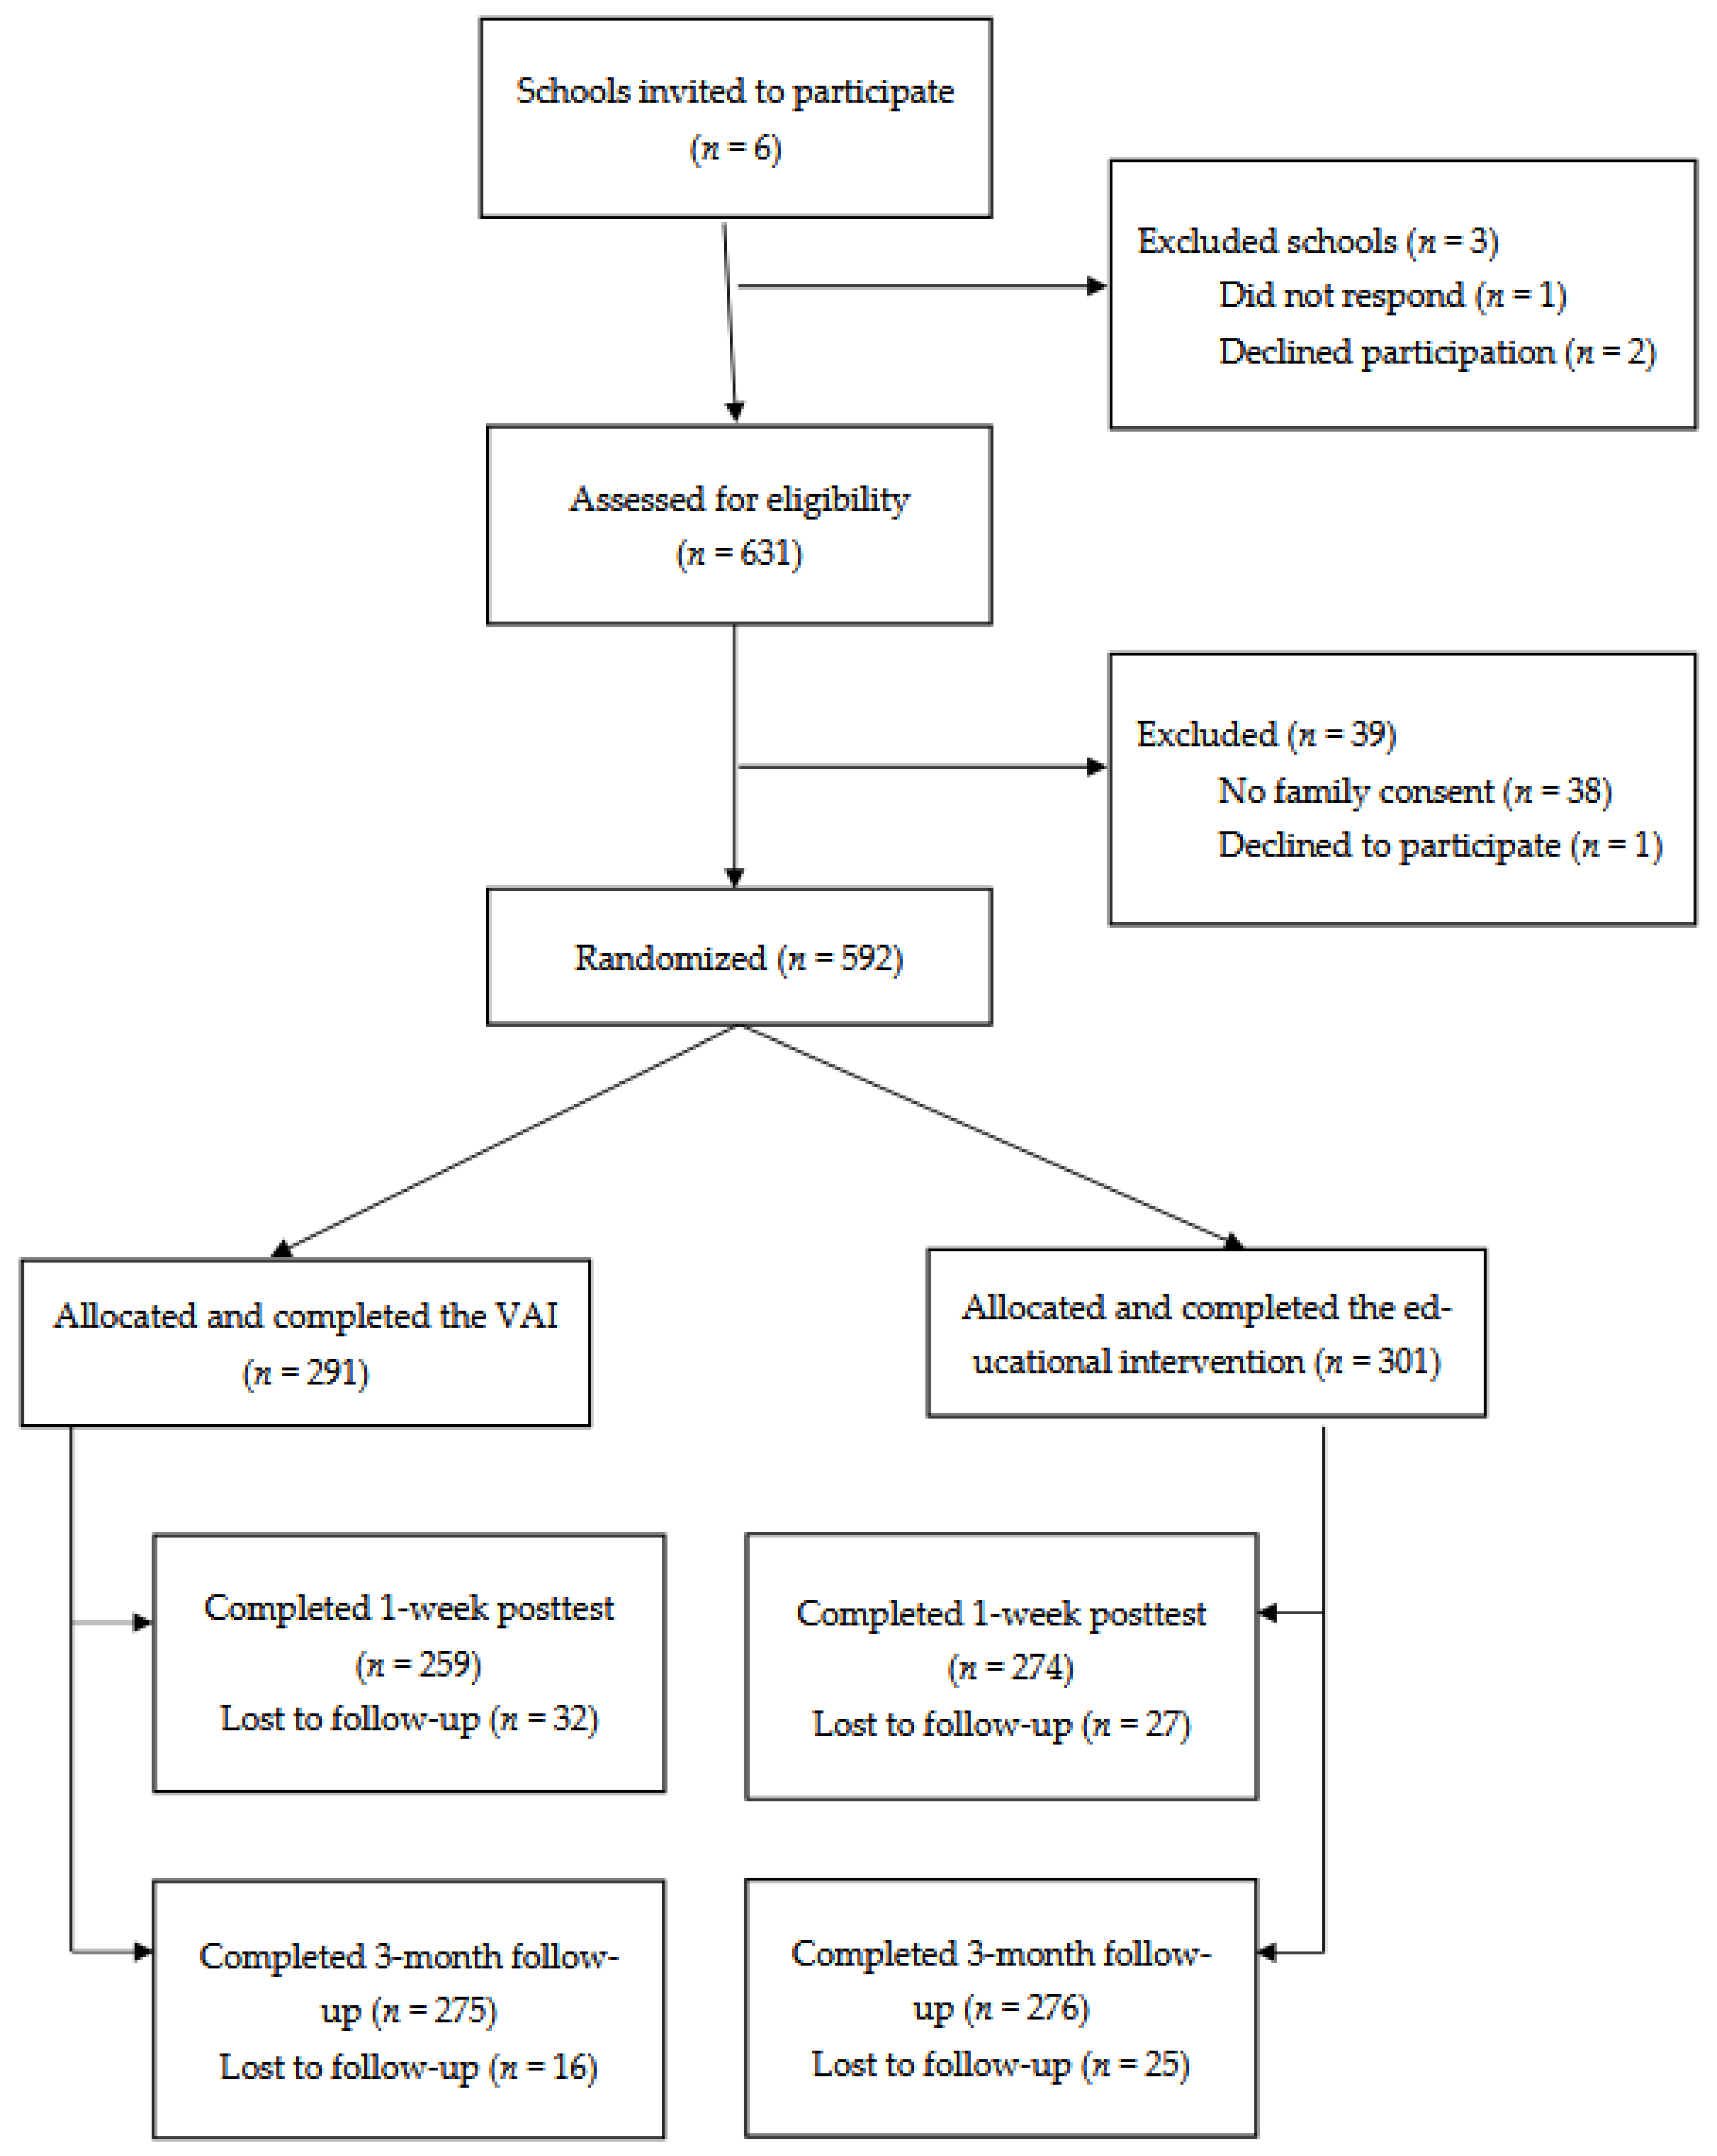
Figure 2.
Figures 2a–2c. The Effect of the Preventive Intervention on Healthy Food Intake (2a), the Alignment of Healthy Eating Habits with Adolescent Values (2b), and the Perceived Attractiveness of Healthy Eating (2c).
Figure 2.
Figures 2a–2c. The Effect of the Preventive Intervention on Healthy Food Intake (2a), the Alignment of Healthy Eating Habits with Adolescent Values (2b), and the Perceived Attractiveness of Healthy Eating (2c).
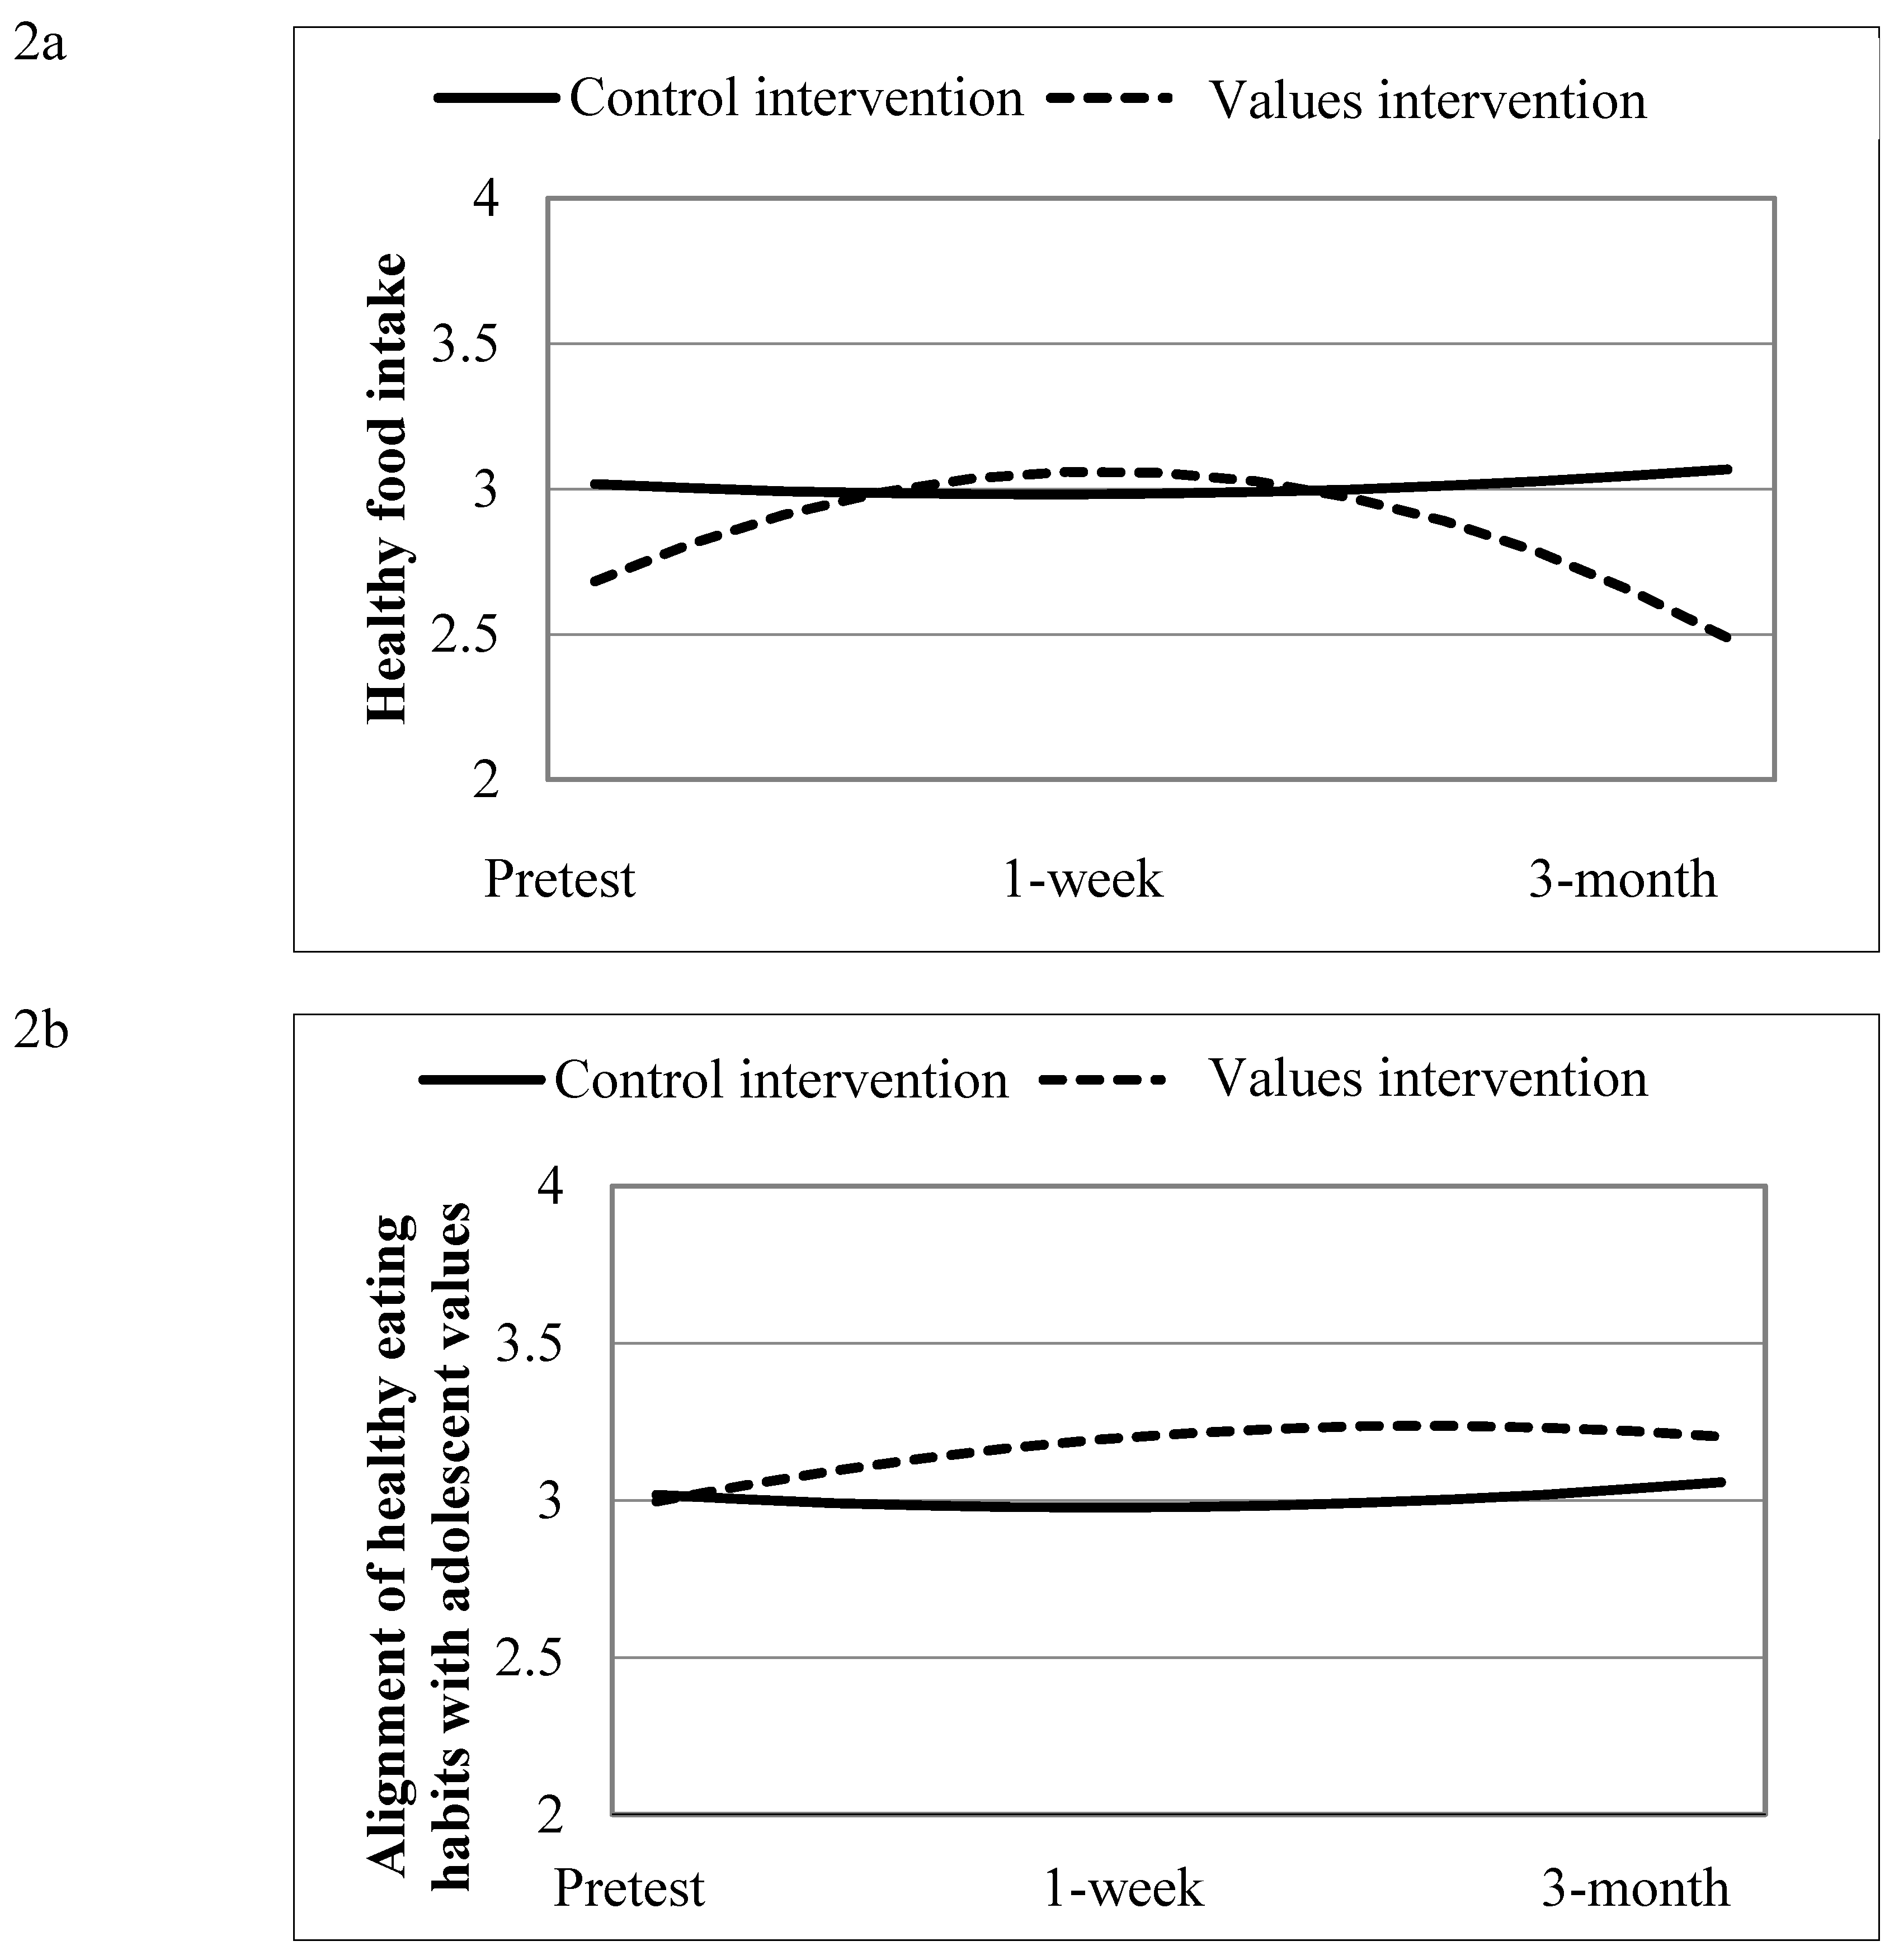
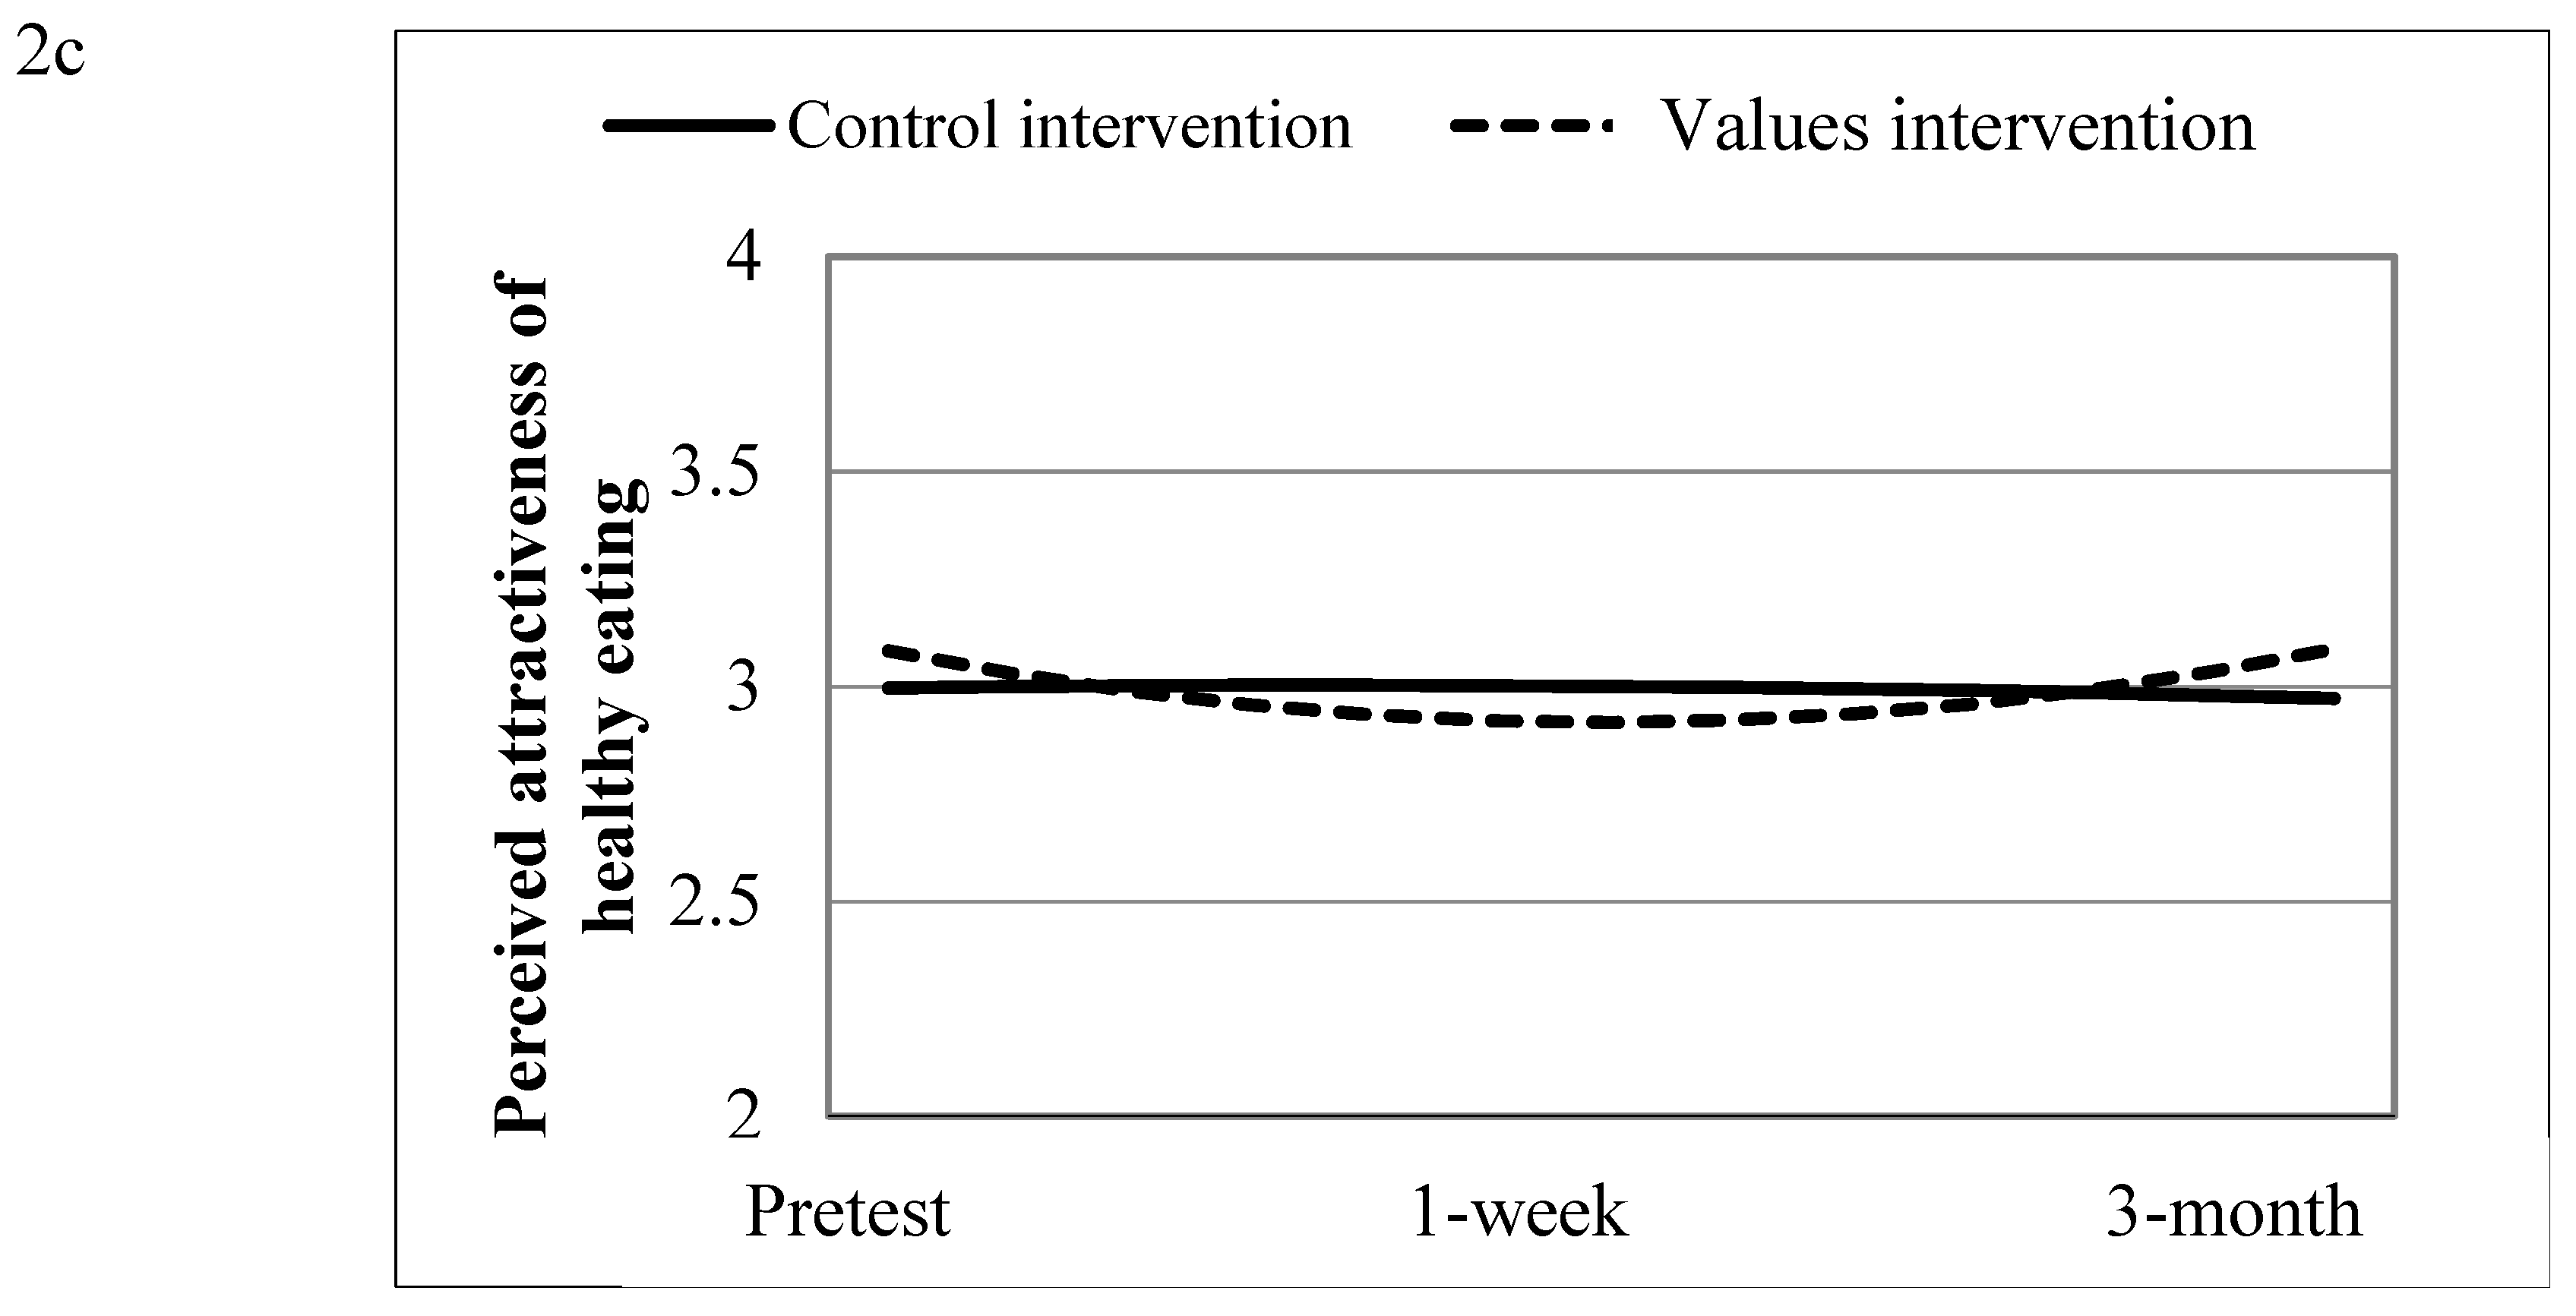

Table 1.
Pearson Correlations, Means, and Standard Deviations of the Study Variables.
| 1 | 2 | 3 | 4 | 5 | 6 | 7 | 8 | 9 | 10 | 11 | 12 | |
|---|---|---|---|---|---|---|---|---|---|---|---|---|
| 1. T1 Healthy food intake | 1 | |||||||||||
| 2. T1 Unhealthy food intake | .07 | 1 | ||||||||||
| 3. T1 Value alignment | .15** | –.02 | 1 | |||||||||
| 4. T1 Perceived attractiveness | .21** | –.13** | .41** | 1 | ||||||||
| 5. T2 Healthy food intake | .75** | .01 | .22** | .25** | 1 | |||||||
| 6. T2 Unhealthy food intake | –.02 | .74** | –.07 | –.15** | .03 | 1 | ||||||
| 7. T2 Value alignment | .20** | –.04 | .67** | .45** | .25** | –.07 | 1 | |||||
| 8. T2 Perceived attractiveness | .24** | –.10* | .39** | .66** | .25** | –.13* | .55** | 1 | ||||
| 9. T3 Healthy food intake | .66** | –.06 | .16** | .21** | .69** | -.07 | .26** | .26** | 1 | |||
| 10. T3 Unhealthy food intake | –.04 | .67** | -.06 | -.16** | –.05 | .68** | –.05 | –.17** | –.03 | 1 | ||
| 11. T3 Value alignment | .14** | –.03 | .50** | .36** | .15** | –.07 | .64** | .41** | .25** | –.04 | 1 | |
| 12. T3 Perceived attractiveness | .19** | –16** | .23** | .54** | .15** | –.15** | .40** | .58** | .26** | –.16** | .52** | 1 |
| Mean | 3.77 | 2.07 | 2.45 | 3.22 | 3.85 | 1.91 | 2.54 | 3.16 | 3.70 | 1.80 | 2.66 | 3.22 |
| SD | 1.93 | 1.91 | 0.8 | 0.78 | 1.98 | 1.78 | 0.90 | 0.83 | 1.88 | 1.73 | 0.88 | 0.75 |
Note. T1 = time 1 (pretest); T2 = time 2 (posttest); T3 = time 3 (3-month follow-up). *p ≤ .01. **p ≤ .001.
Table 2.
Models Testing the Effect of the Values-Alignment Intervention.
| Fixed Effect | Coefficient | SE | t | DF | p-value |
|---|---|---|---|---|---|
| Healthy food intake | |||||
| Intercept | 3.84 | 0.08 | 48.24 | 26 | < .001 |
| Condition | –0.16 | 0.13 | –1.26 | 559 | .209 |
| Time | –0.05 | 0.11 | –0.49 | 559 | .621 |
| Condition x Time | 0.57 | 0.19 | 3.08 | 559 | .002 |
| Time2 | 0.04 | 0.05 | 0.81 | 559 | .418 |
| Condition x Time2 | –0.34 | 0.09 | –3.99 | 559 | < .001 |
| Unhealthy food intake | |||||
| Intercept | 1.94 | 0.16 | 12.06 | 26 | < .001 |
| Condition | 0.22 | 0.19 | 1.17 | 559 | .245 |
| Time | –0.08 | 0.12 | –0.67 | 559 | .506 |
| Condition x Time | –0.04 | 0.22 | –0.20 | 559 | .844 |
| Time2 | –0.02 | 0.05 | –0.46 | 559 | .643 |
| Condition x Time2 | 0.02 | 0.12 | 0.20 | 559 | .843 |
| Alignment of healthy eating habits with adolescent values | |||||
| Intercept | 2.48 | 0.07 | 34.92 | 26 | < .001 |
| Condition | –0.02 | 0.09 | –0.18 | 559 | .859 |
| Time | –0.06 | 0.06 | -0.94 | 559 | .350 |
| Condition x Time | 0.29 | 0.09 | 3.17 | 559 | .002 |
| Time2 | 0.06 | 0.03 | 1.92 | 559 | .056 |
| Condition x Time2 | –0.11 | 0.05 | –2.17 | 559 | .030 |
| Perceived attractiveness of healthy eating | |||||
| Intercept | 3.21 | 0.06 | 53.73 | 26 | < .001 |
| Condition | 0.02 | 0.07 | 0.34 | 559 | .737 |
| Time | 0.01 | 0.09 | 0.12 | 559 | .901 |
| Condition x Time | –0.23 | 0.11 | –2.01 | 559 | .045 |
| Time2 | –0.01 | 0.04 | –0.24 | 559 | .809 |
| Condition x Time2 | 0.12 | 0.06 | 2.08 | 559 | .038 |
Table 4.
Categories, Descriptions and Frequencies.
| Category | Description | Example | Frequency | |
| Addiction | Consumption of unhealthy foods because certain products generate a sense of dependency or craving that makes it difficult to stop eating them. | Q1 | “Because they have ingredients that make your body want more.” | 6.1% |
| Q2 | “They are made so that when you eat them, you get hooked and want to eat more.” | 10.4% | ||
| Social | Consumption of unhealthy foods driven by a perceived dependence on certain products that makes it difficult to stop eating them. | Q1 | “Because I usually have dinner or eat out with friends.” | 12.7% |
| Q2 | “My friends often eat or drink unhealthy foods, and after seeing them so often, I end up feeling the urge to eat them too.” | 7.5% | ||
| Emotional state | Consumption used as a way to manage or cope with emotional states such as sadness, stress, or anxiety. | Q1 | “Because I’m feeling anxious or stressed, and eating helps me let off steam.” | 1.6% |
| Q2 | “Anxiety, emotional hunger, etc.” | 2.7% | ||
| Habit | Consumption that occurs as part of a routine or automatic behavior, without a clear reason. | Q1 | “I think I eat more unhealthy foods because I’m just used to it.” | 0.6% |
| Q2 | “They’re used to eating fewer healthy foods and drinks, so it’s very hard to switch to healthy eating.” | 3.2% | ||
| Energy and sport | Consumption motivated by a desire for physical energy or recovery in the context of sports or exercise. | Q1 | “Because they’re a quick way to restore energy.” | 2.7% |
| Q2 | N/A | N/A | ||
| Hunger | Consumption primarily motivated by hunger, rather than by emotions or external situations. | Q1 | “Because I’m hungry.” | 4.3% |
| Q2 | “Hunger, urge to eat.” | 1.7% | ||
| Justification | Consumption explained or justified by the individual through reasoning that makes the behavior seem acceptable or less harmful. | Q1 | “Eating hamburgers once in a while isn’t bad.” | 2.2% |
| Q2 | N/A | N/A | ||
| Price | Consumption influenced by the perception that unhealthy products are cheaper or more economically accessible than healthy ones. | Q1 | “Because that food is cheaper.” | 1.8% |
| Q2 | “Unhealthy foods are cheaper than healthy ones.” | 3.2% | ||
| Reward | Consumption used as a form of self-reward or personal treat. | Q1 | “I don’t eat much, but when I do, I’d say it’s like a reward.” | 1.2% |
| Q2 | N/A | N/A | ||
| Unhealthy foods taste better | Consumption driven by the perception that unhealthy foods have a more appealing taste or are more tempting. | Q1 | “Because they look good, and when you see them, you feel like eating them.” | 56,9% |
| Q2 | “The temptation to eat them and the bad taste of healthy food.” | 38.1% | ||
| Comfort | Consumption chosen for practical reasons, due to the availability of unhealthy products, or because they require less time and effort than healthier options. | Q1 | “Because they’re easy to make and you can find them everywhere. When you don’t want to think about what to eat, you go for the easiest option or order fast food so you don’t have to make an effort.” | 7.5% |
| Q2 | “Because you find them everywhere.” | 9% | ||
| Marketing | Consumption influenced by exposure to advertising and the constant presence of unhealthy products in media and public spaces. | Q1 | “I think we eat it because when it’s advertised on TV, they sell it as very tasty and appealing.” | 2.5% |
| Q2 | “I think there’s more advertising for foods like burgers and sodas than for healthier foods, and they’re more accessible to us.” | 5.8% | ||
| Prohibition | External restriction on the consumption of certain foods, which may increase desire. | Q1 | N/A | N/A |
| Q2 | “I guess that when something is restricted, it makes you end up eating more.” | 1.2% | ||
| Unhealthy foods are more filling | Perception that unhealthy foods satisfy hunger better or provide greater satiety than healthy options. | Q1 | N/A | N/A |
| Q2 | I feel more cravings for those kinds of foods because I don’t feel fully satisfied.” | 1% | ||
| No difficulty | Perception of not encountering any obstacles when trying to reduce the consumption of unhealthy foods. | Q1 | N/A | N/A |
| Q2 | “I don’t find any obstacles.” | 16.3% |
Disclaimer/Publisher’s Note: The statements, opinions and data contained in all publications are solely those of the individual author(s) and contributor(s) and not of MDPI and/or the editor(s). MDPI and/or the editor(s) disclaim responsibility for any injury to people or property resulting from any ideas, methods, instructions or products referred to in the content. |
© 2025 by the authors. Licensee MDPI, Basel, Switzerland. This article is an open access article distributed under the terms and conditions of the Creative Commons Attribution (CC BY) license (http://creativecommons.org/licenses/by/4.0/).
Copyright: This open access article is published under a Creative Commons CC BY 4.0 license, which permit the free download, distribution, and reuse, provided that the author and preprint are cited in any reuse.


