1. Introduction
Aquaculture, especially Brazilian fish farming, has shown continuous growth over the past decades and has consolidated its relevance as one of the most dynamic segments of animal production. This advancement results from a combination of increasing global demand for aquatic protein, technological improvements, territorial expansion, and diversification of farming systems. In the Brazilian context, production growth has been particularly significant. According to data from the Municipal Livestock Production (PPM), national aquaculture output increased from 476.5 thousand tons in 2013 to 791.5 thousand tons in 2023, representing a growth of more than 66% over a decade [
1]. Nile tilapia (
Oreochromis niloticus) stands out as the main cultivated species, with production increasing from 169.3 thousand to 442.2 thousand tons in the same period, consolidating Brazil as the world’s fourth-largest producer [
1].
The territorial expansion of fish farming has also been documented through studies based on remote sensing, which points to a significant increase in the number of earthen ponds, especially in the South and Southeast regions [
2]. This growth is associated with water availability, favorable geomorphological characteristics, and the development of integrated production models, such as the use of reservoirs and the alignment of aquaculture practices with family farming. Technical reports from Embrapa Fisheries and Aquaculture reinforce that earthen ponds are one of the predominant systems in the country and present greater adaptability for species such as Nile tilapia and tambaqui (
Colossoma macropomum), which respond positively to controllable environmental conditions [
3].
The intensification of earthen pond use alters the environmental dynamics of microbasin, including changes in land use and land cover, increased landscape fragmentation, and modifications in surface hydrological flows. Recent studies have shown that the expansion of ponds modifies ecosystem processes and may affect physicochemical parameters of environmental interest, including the dynamics of carbon dioxide (CO₂) concentration [
4,
5]. This variable is highly relevant because it is directly associated with the carbon balance of ponds and the metabolic processes of aquatic organisms, especially algae.
In earthen ponds, photosynthesis plays a fundamental role in regulating dissolved oxygen and CO₂ levels. During the daytime, sunlight activates algal photosynthesis, promoting CO₂ absorption and the release of molecular oxygen (O₂), which contributes to increased dissolved oxygen in the water [
6]. Conversely, during nighttime, photosynthesis ceases and cellular respiration predominates, a process in which algae consume O₂ and release CO₂. In ponds with high organism density or high organic load, this dynamic can result in critical drops in dissolved oxygen levels, often requiring the activation of aerators to prevent stress or mortality events among fish [
7].
The environmental stability of ponds depends on continuous monitoring of key variables such as phytoplankton density, dissolved oxygen, temperature, and CO₂ concentration. Adequate control of these parameters helps reduce extreme oxygen fluctuations and maintain conditions conducive to the growth of cultivated organisms [
8]. Moreover, understanding CO₂ fluxes is essential both for ensuring animal welfare and for supporting models that quantify the carbon footprint of aquaculture activities, a topic that has gained relevance amid global transitions toward sustainable production systems.
Globally, atmospheric CO₂ levels reached approximately 420 ppm in 2023, representing one of the highest values recorded since the pre-industrial period, according to the World Meteorological Organization (WMO) bulletin [
9]. This context reinforces the need to develop methodologies capable of assessing the contribution of different production systems to the global carbon balance, including fish farming in earthen ponds.
Given this scenario, the main objective of this study was to develop and test an electronic system to estimate CO₂ concentration in earthen ponds used in fish farming. The system was implemented in experimental greenhouses installed over three ponds and equipped with electronic sensors integrated into a microcontroller. The secondary objectives included (i) collecting continuous data to assess the temporal dynamics of CO₂ during daytime and nighttime periods; and (ii) verifying the existence of correlations between ambient temperature and CO₂ concentration. The results obtained will serve as a basis for improving environmental monitoring methodologies, with the future perspective of estimating the carbon footprint of earthen ponds, thereby contributing to the advancement of sustainable aquaculture in Brazil.
2. Materials and Methods
2.1. Assembly of the Embedded Electronic System
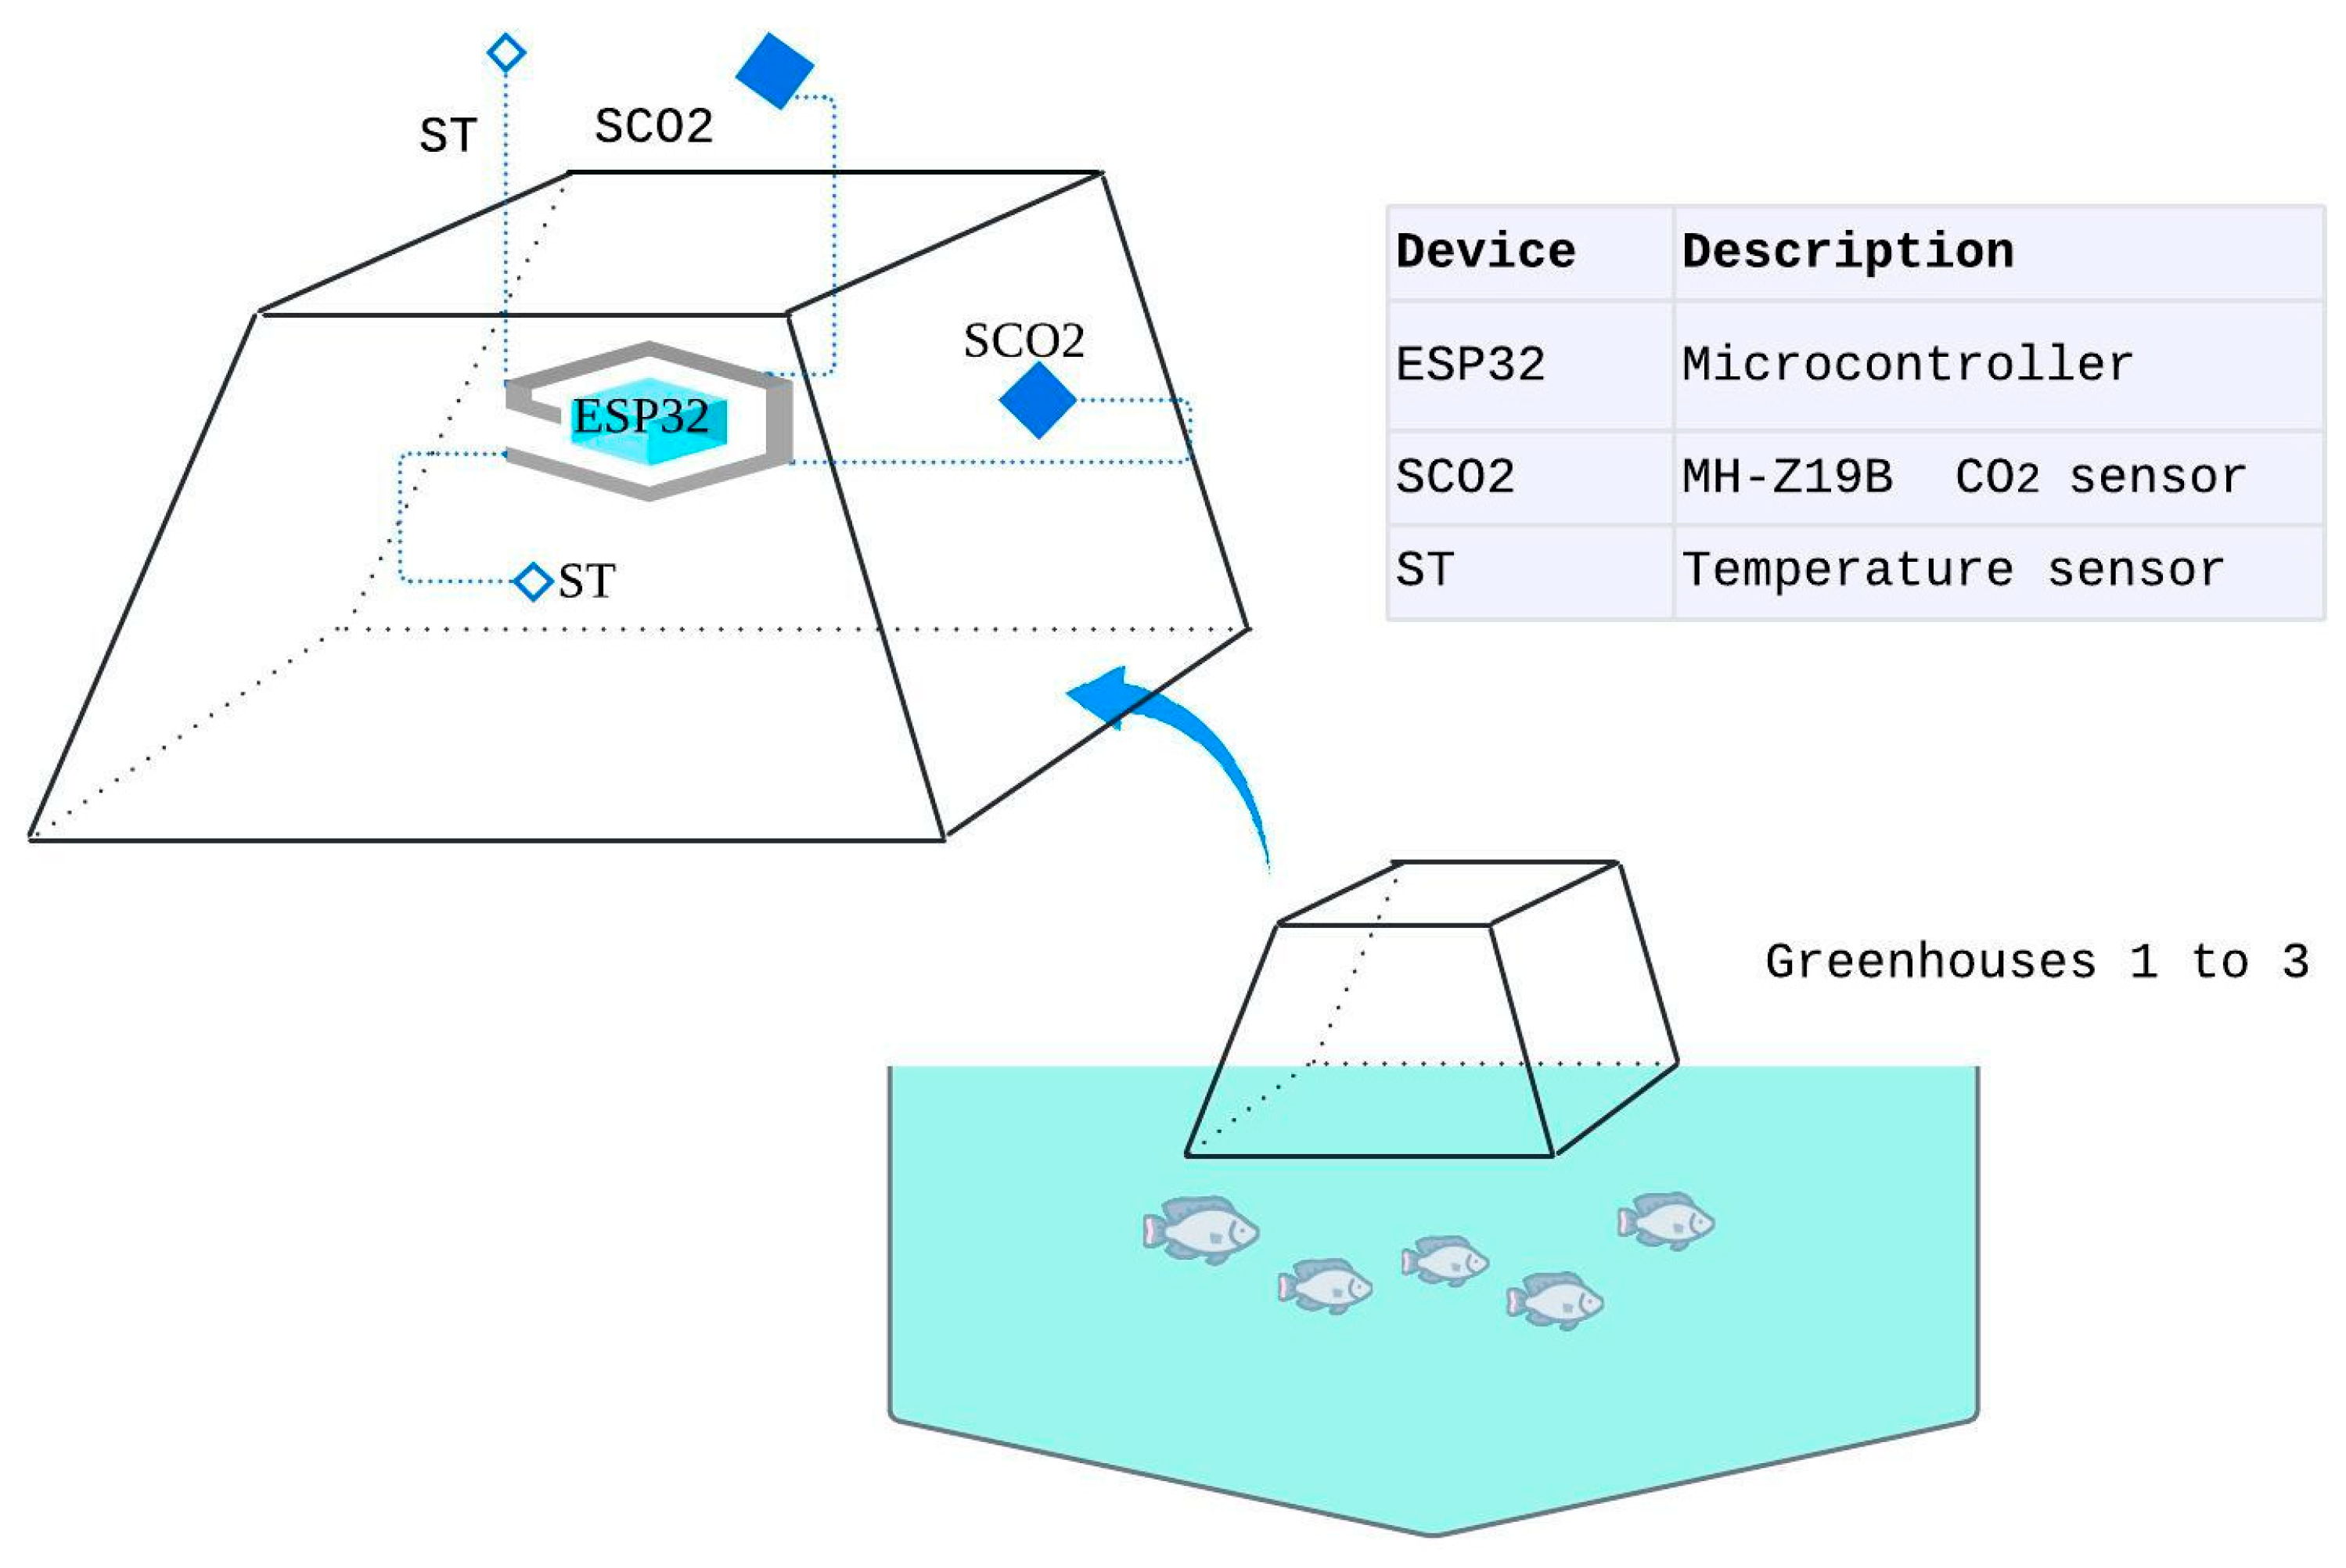
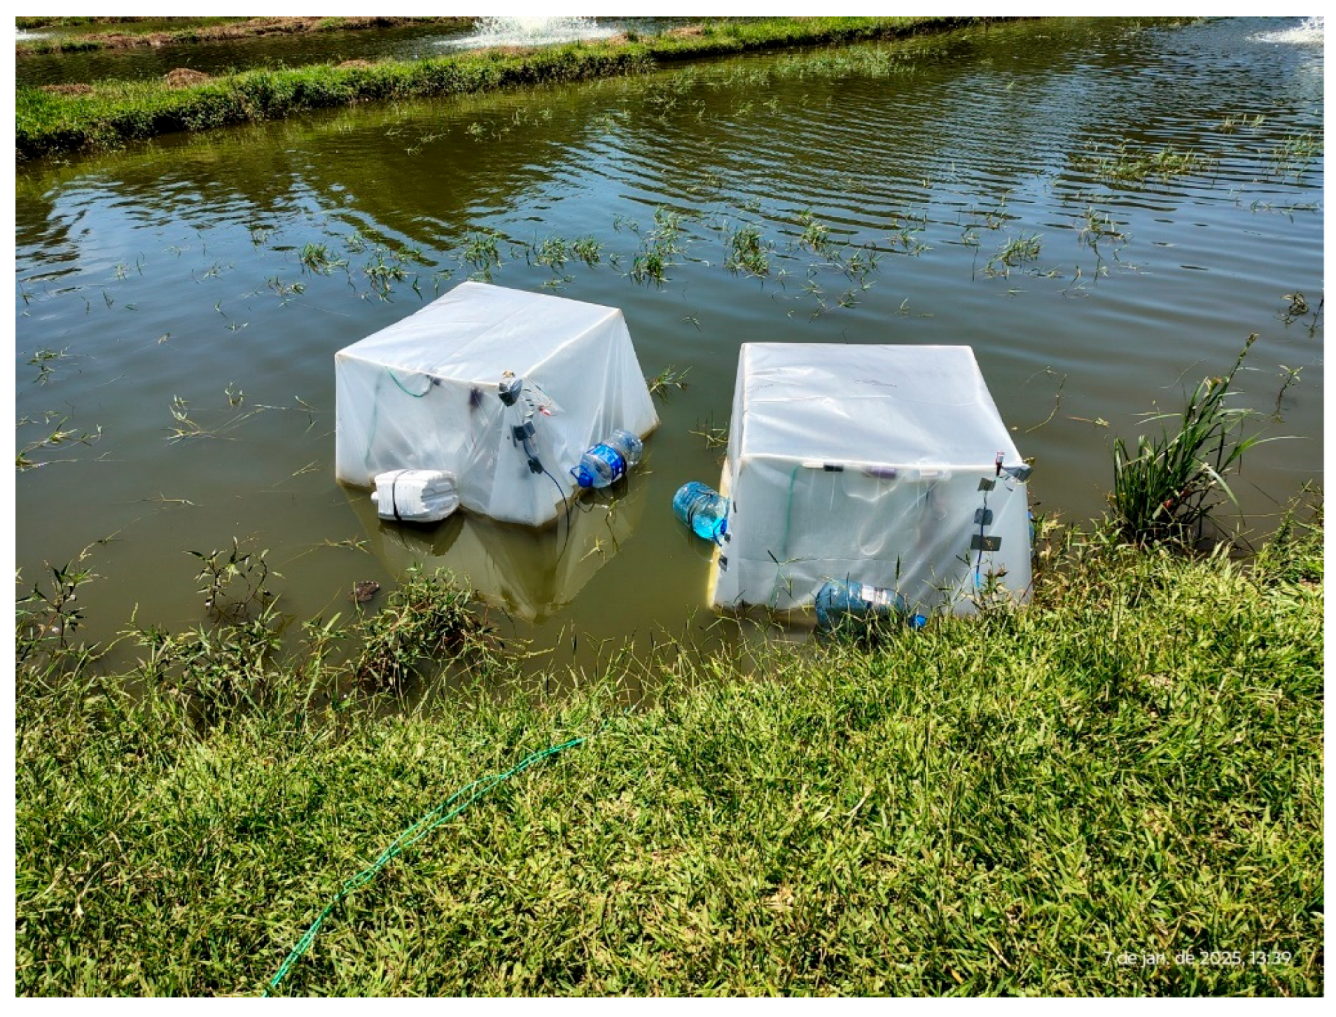
The assembly of the embedded electronic system inside the greenhouses was carried out at the facilities of the Western Paraná State University, in the municipality of Toledo. To estimate the dynamics of carbon concentration during fish farming, an experiment was developed using three identical greenhouses constructed in the shape of a truncated pyramid. The greenhouses had a square base measuring 1.0 m per side, a square top measuring 0.8 m per side, and four rods measuring 0.61 m in length, resulting in an internal volume of 0.496 m³.
Three greenhouses were positioned directly over earthen ponds using plastic flotation devices. The structures were built with iron framing and covered with transparent 150-micron plastic, properly sealed to avoid gas exchange with the external environment. The truncated-pyramid shape was chosen due to its ease of transport and storage, allowing the greenhouses to be nested inside one another.
Each greenhouse was equipped with an ESP32 microcontroller, containing a Tensilica Xtensa LX5 microprocessor with two processing cores, to which the electronic sensors were connected. The internal sensors included a CO₂ sensor (indoor SCO₂) and a temperature sensor (indoor ST), installed 35 cm above the water surface. Externally, CO₂ and temperature sensors were mounted to record reference environmental variables.
Figure 1 presents a single-line diagram of the system.
2.2. Description of Materials
Table 1 presents the materials and components used in the construction of greenhouses, the embedded electronic system, and the measurement devices.
2.3. Calibração dos Sensores e Programação
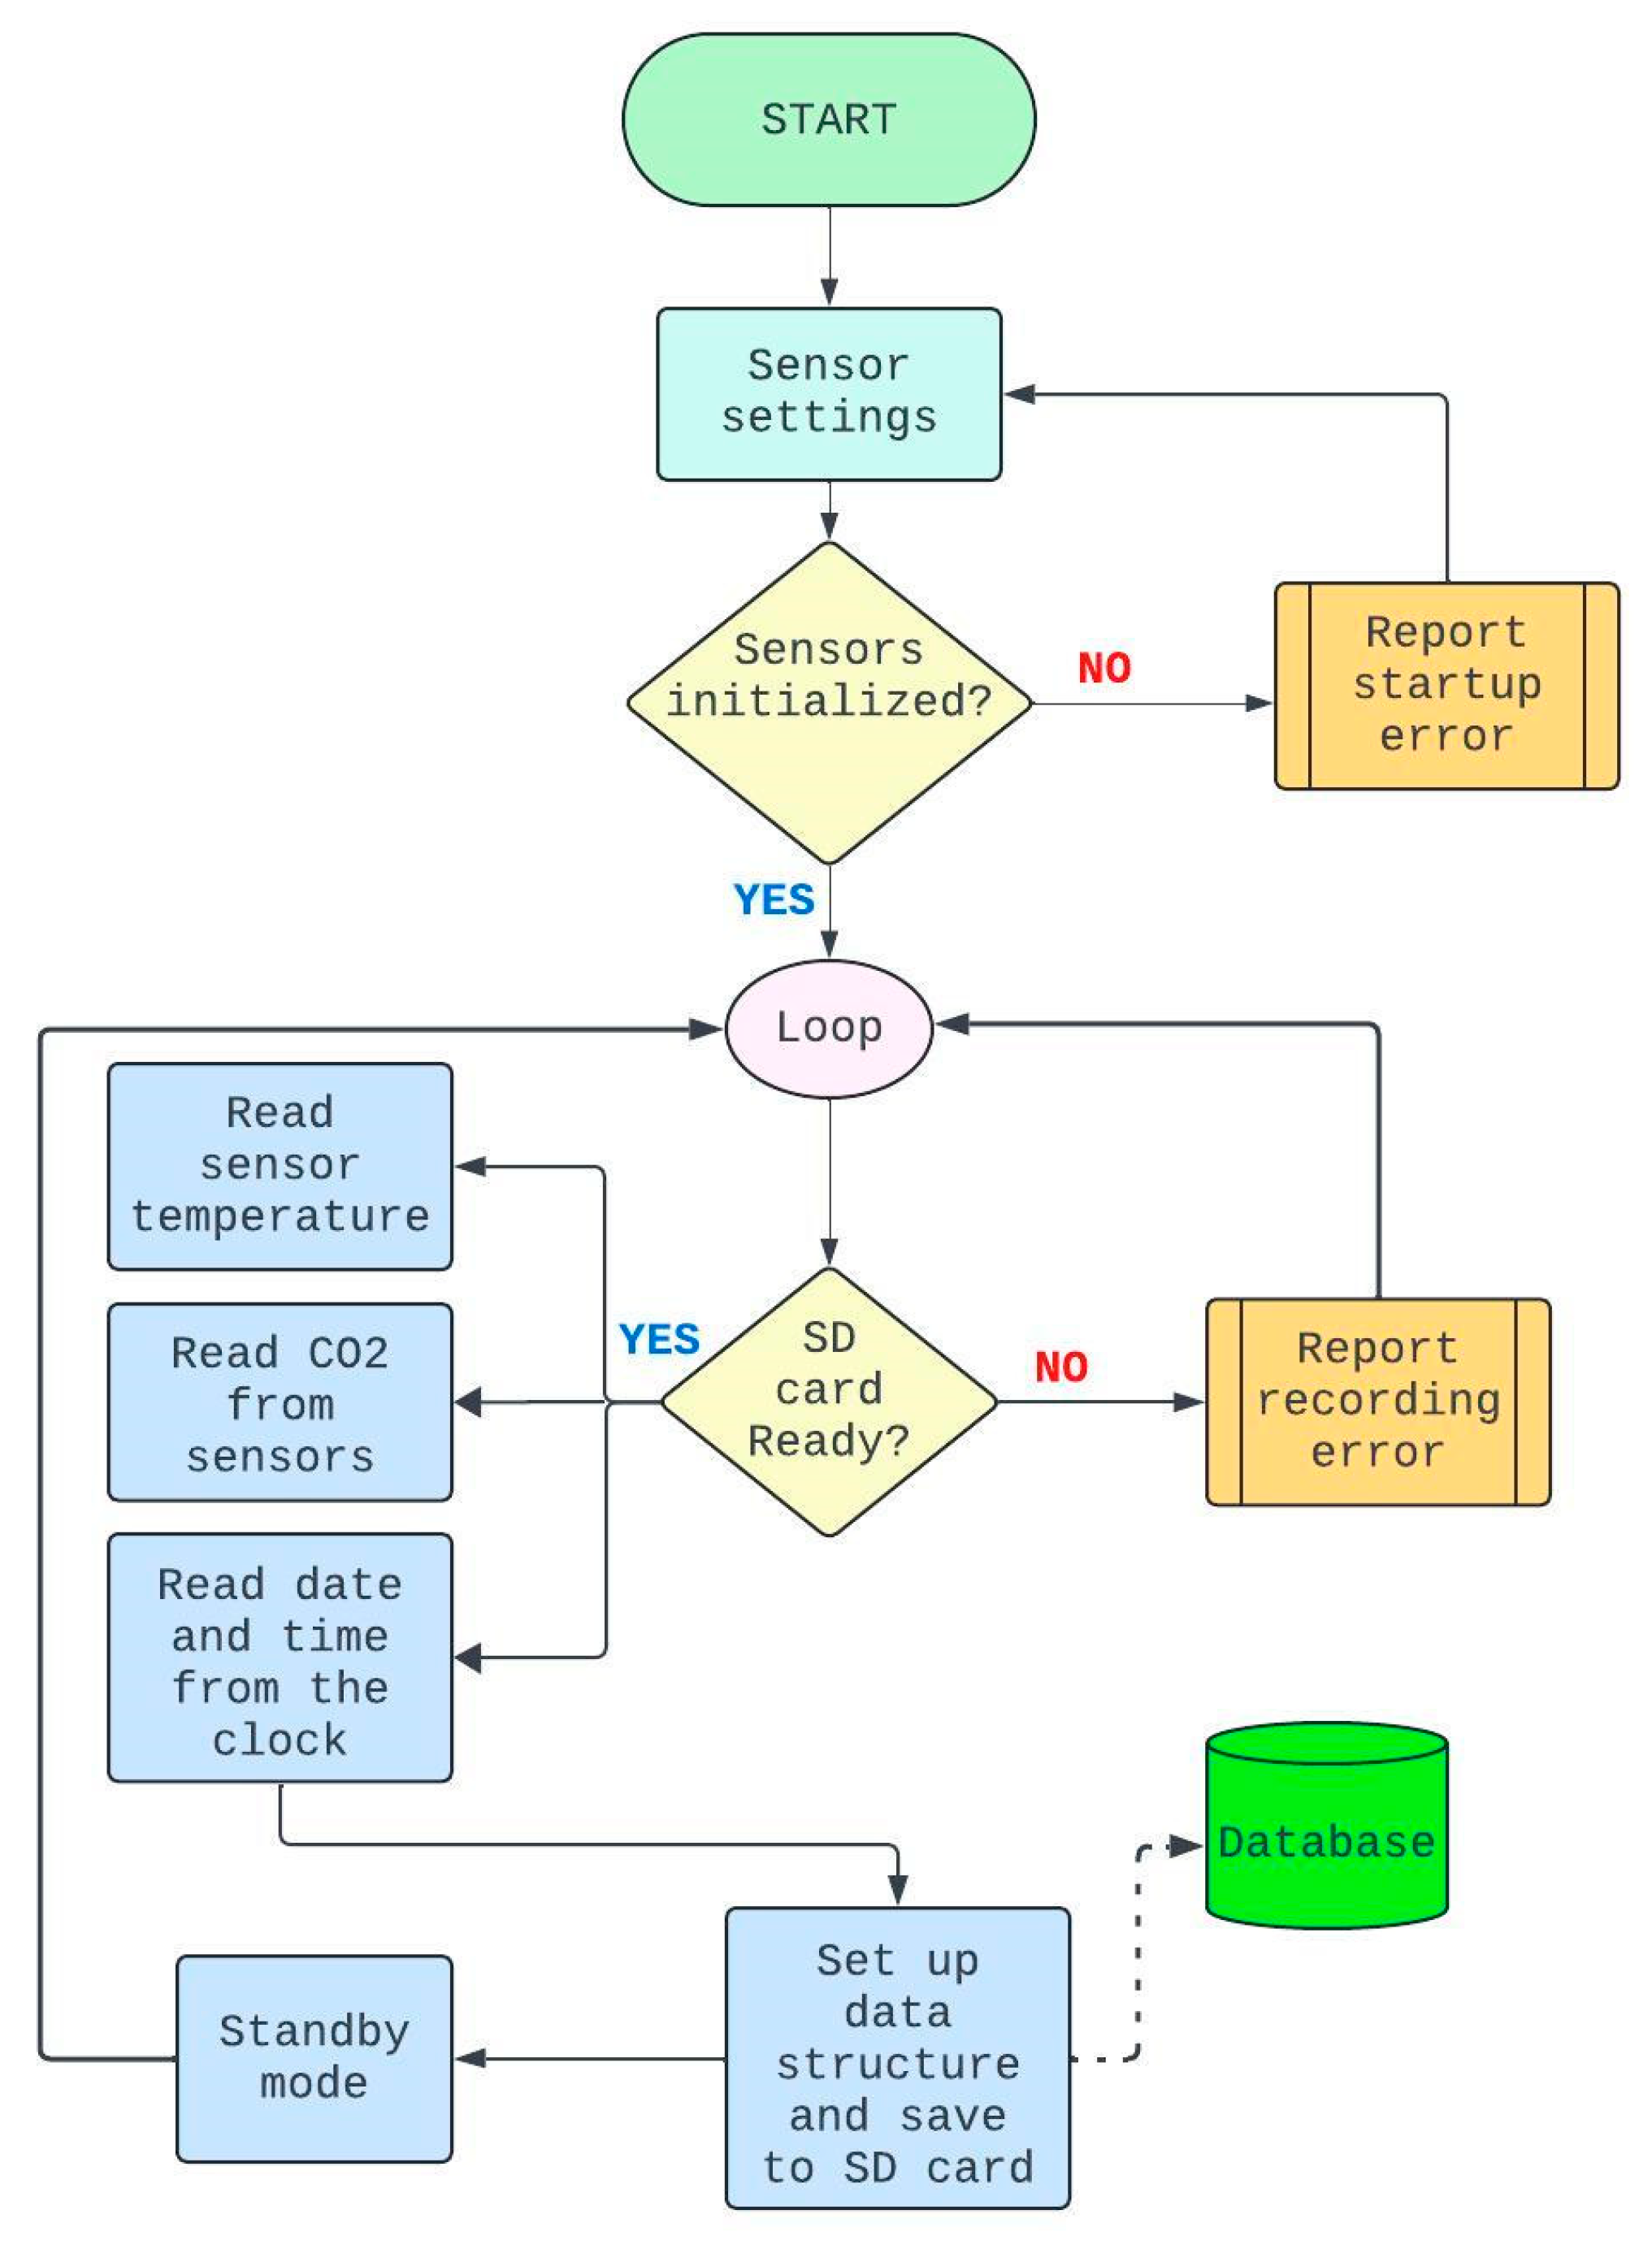
The electronic circuit assembly followed the specifications of technical manuals, complemented by consultations of repositories and specialized forums on ESP32 applications. After assembly, communication tests were performed with all sensors, adjusting the logical routine according to the flowchart presented in
Figure 2. Programming of the microcontroller was conducted using the Arduino IDE software, with successive tests of data reading and storage.
For calibration, all sensors were exposed to the same environmental conditions for a continuous eight-hour period in an outdoor environment with air circulation. Simultaneous readings were compared to verify compatibility and reduce discrepancies among individual sensors. This step was essential, given the importance of differences between internal and external readings for the research objectives.
2.4. Data Collection
Preliminary tests allowed the identification of necessary adjustments in the hardware and in the methodological use of the greenhouses. The sensors were programmed to record readings on a microSD card every 1 minute, and readings showing excessively abrupt variations within 20-minute intervals were discarded. Subsequently, the mean of each 20-minute interval (three values per hour) was calculated and used for temporal analysis of CO₂ concentration dynamics.
The experiments were conducted on December 1 and 18, 2024, and January 7, 2025. January 7 was classified as a clear-sky day, whereas December 1 and 18 were classified as cloudy days, according to INMET records [
10]. The internal and external CO₂ readings from the greenhouses were used to evaluate concentration dynamics in earthen ponds. Additionally, ambient temperature data supported correlation analyses between temperature and CO₂ concentration.
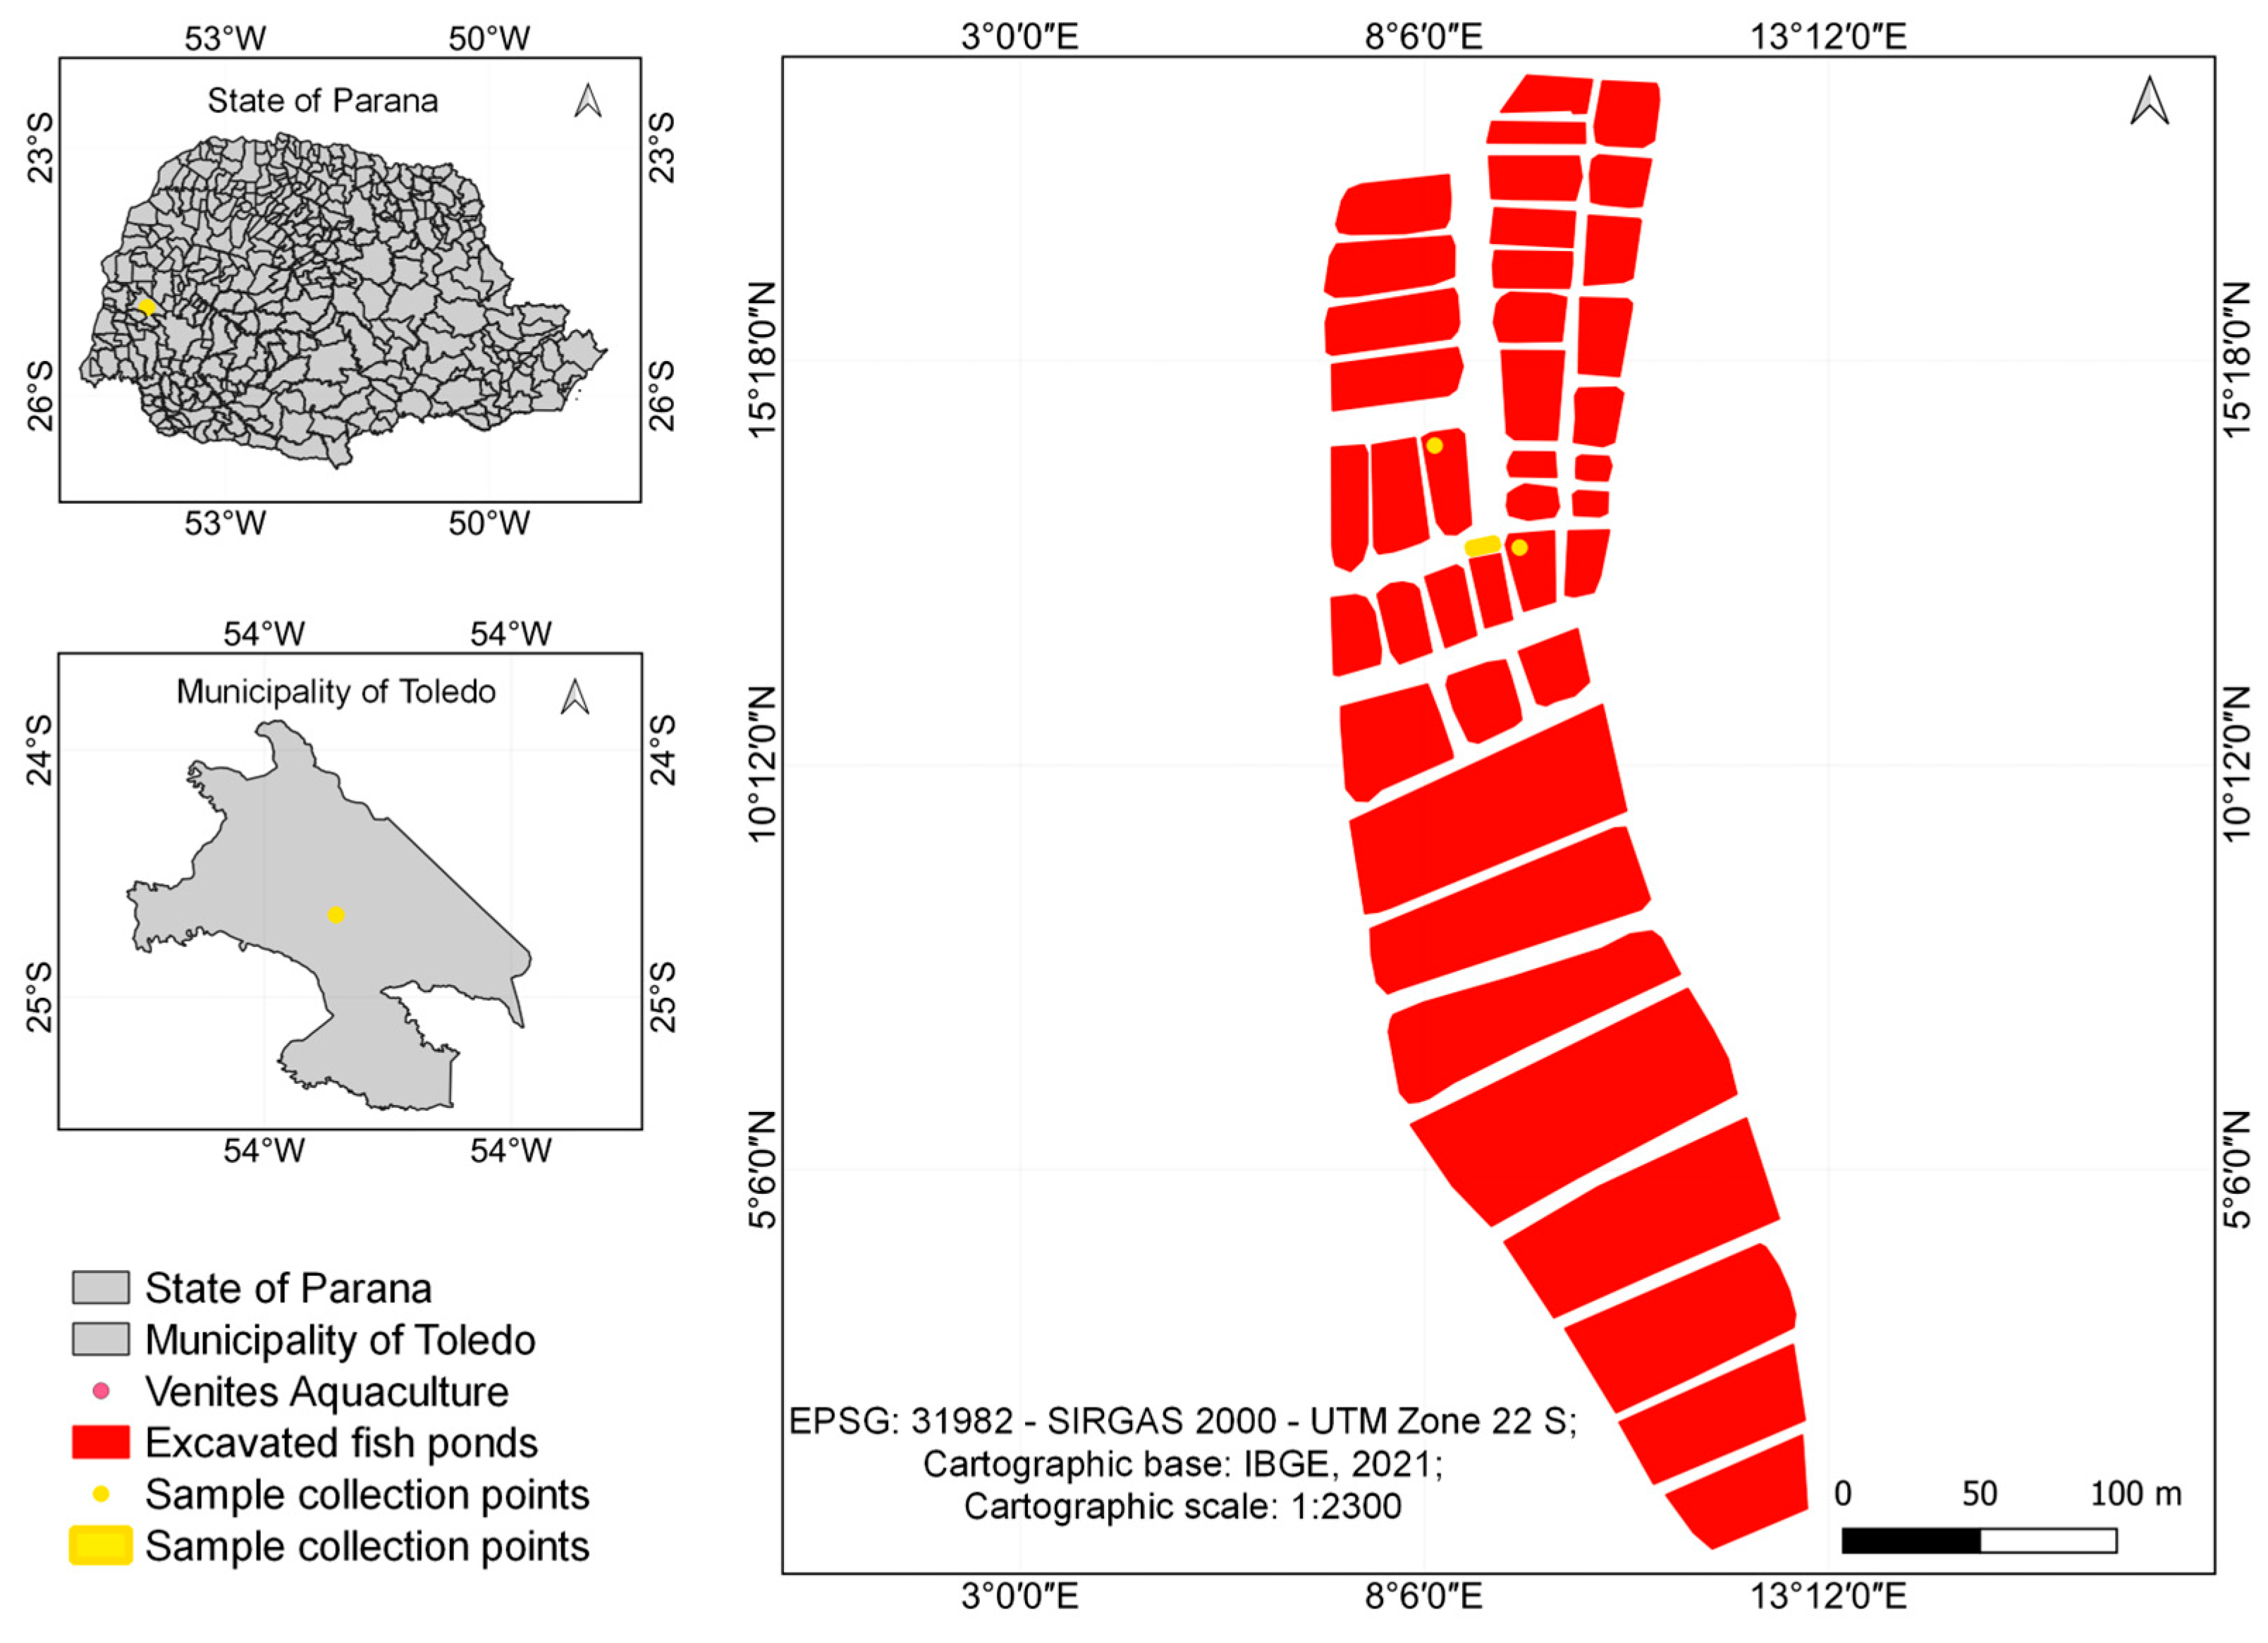
The system was installed in a fish farm located in the municipality of Toledo, in the western region of Paraná. The observed ponds had an average depth of 1.6 m and housed approximately 80,000 juvenile Nile tilapia.
Figure 3 presents the map of the sampling area.
The collected data were used to construct temporal curves of CO₂ concentration for clear-sky days, cloudy days, and nighttime. Correlation graphs between temperature and CO₂ were also produced. Statistical analyses were performed in RStudioⓇ [
11], using the ggplot2 package [
12], with 5% confidence intervals. To assess significance, the F-test and Pearson correlation were applied.
3. Results
3.1. Electronic Circuit
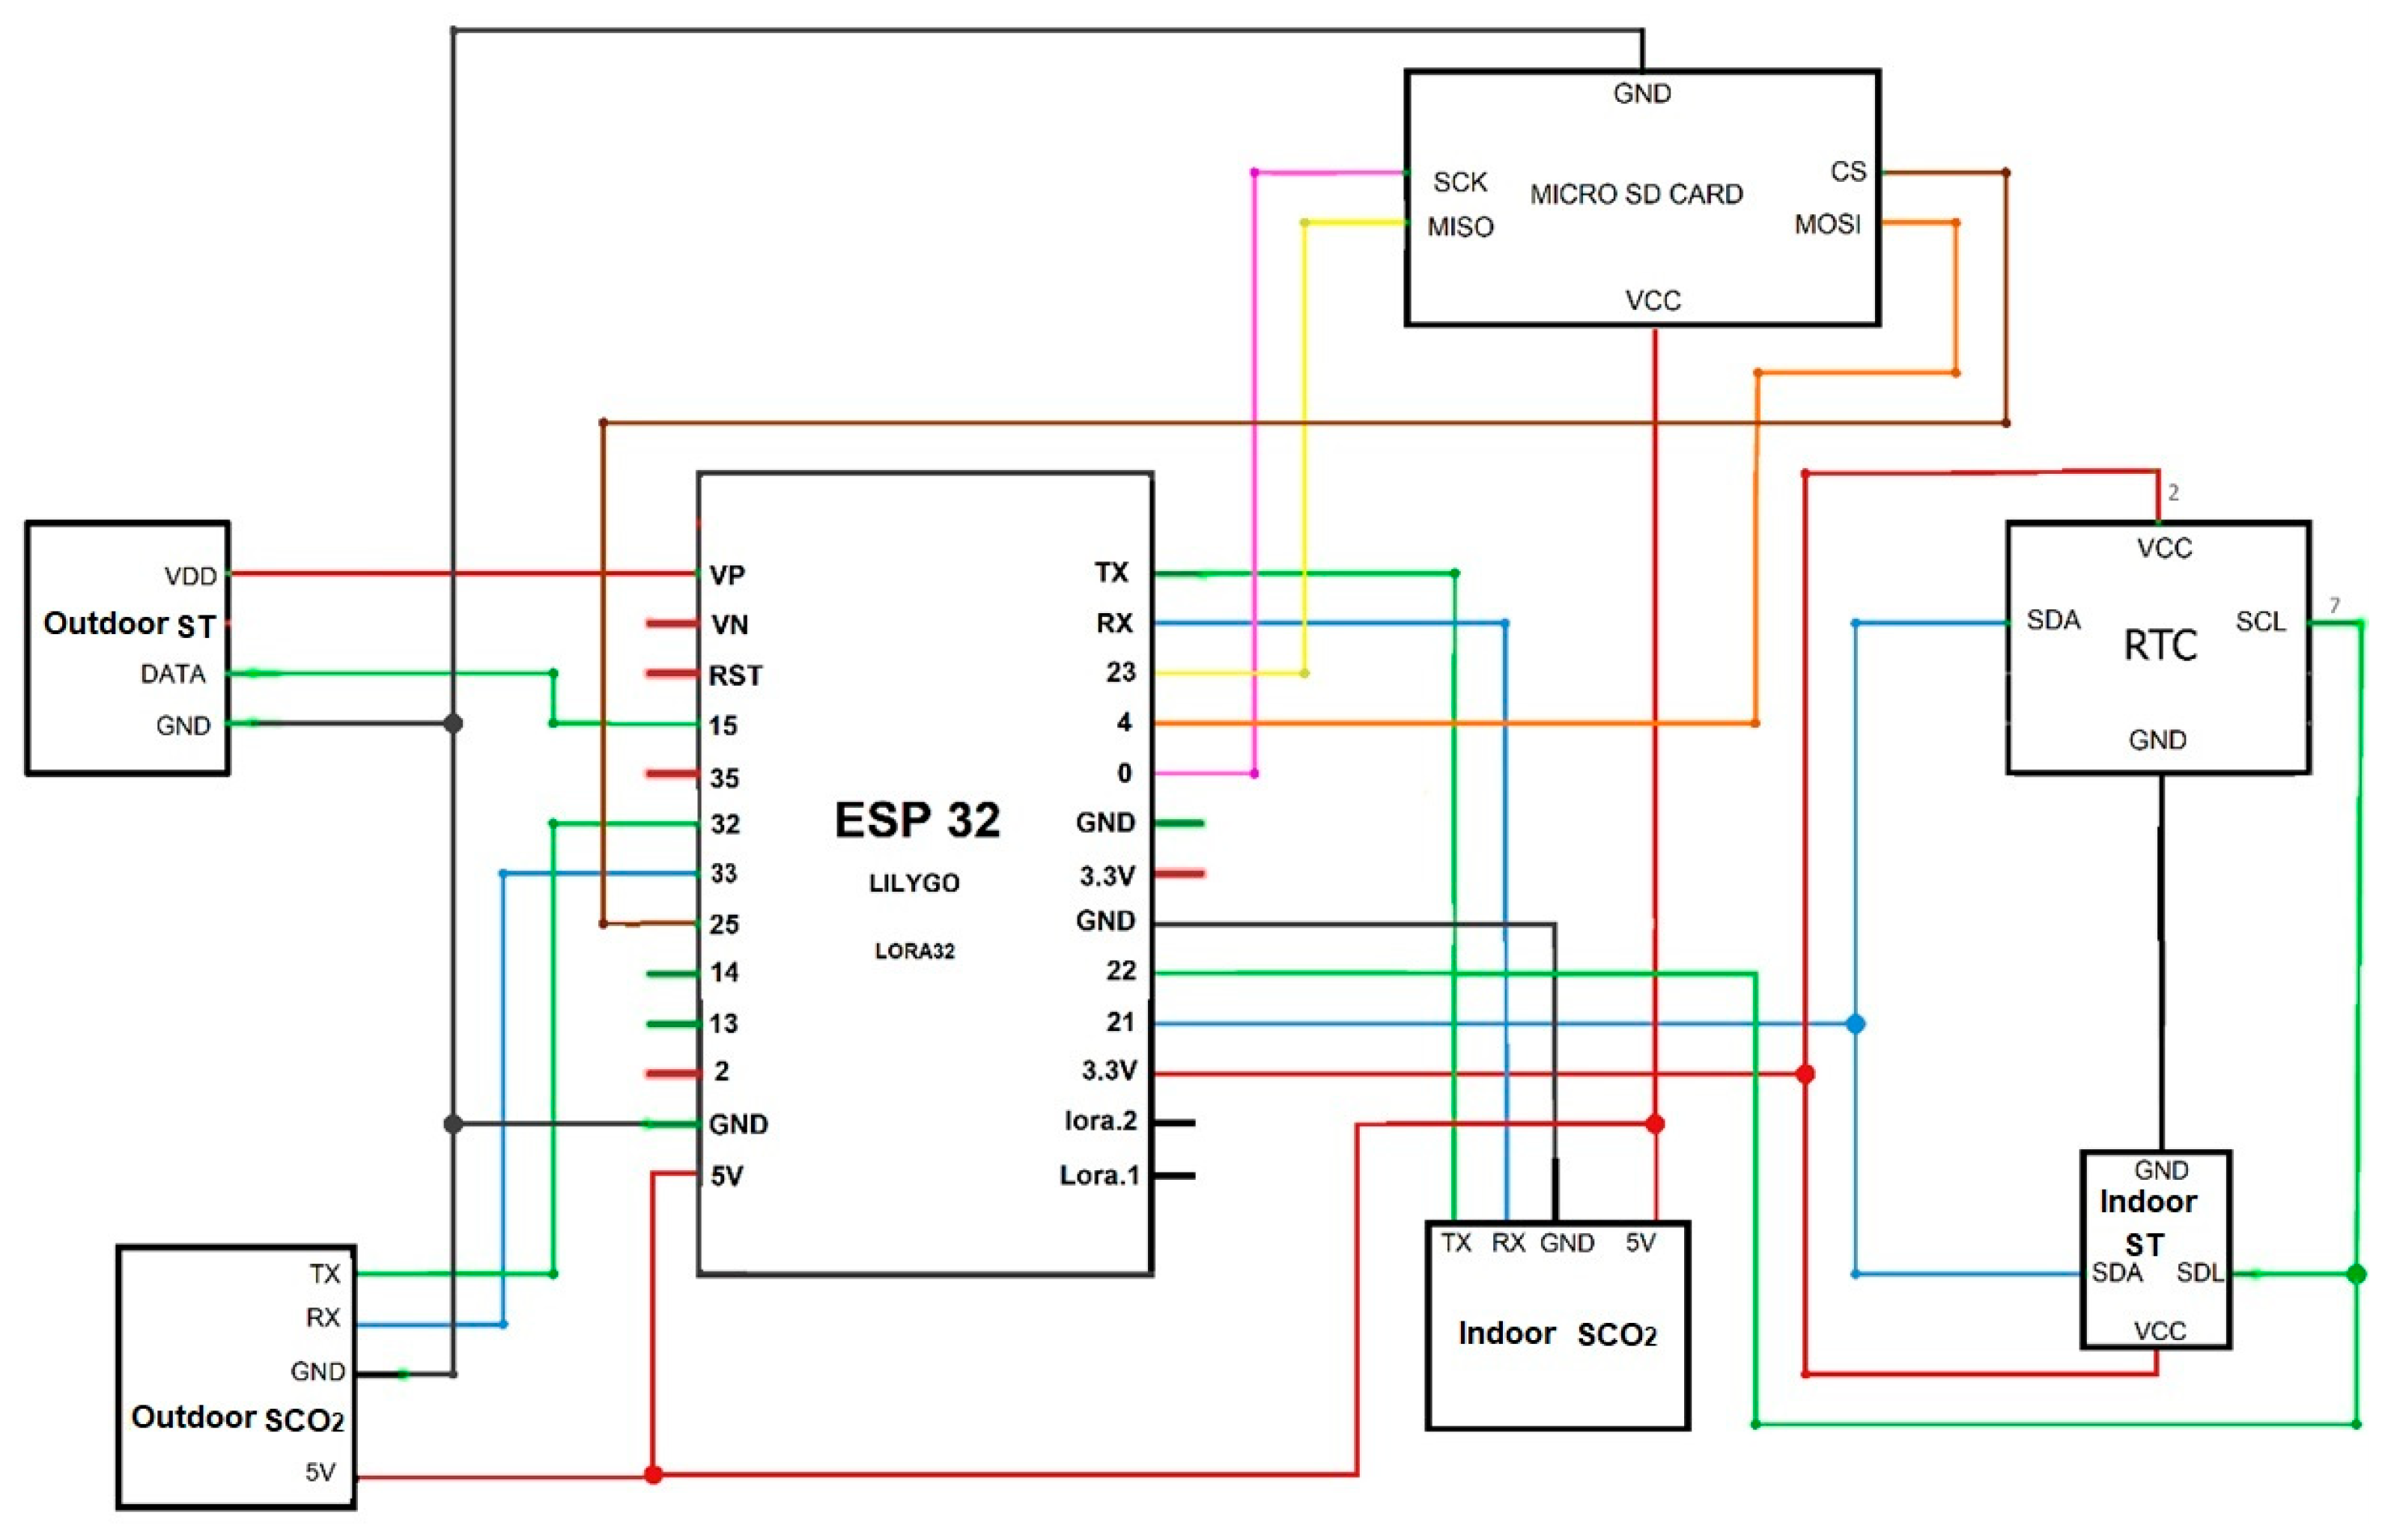
The electronic circuit with all hardware devices connected is shown in
Figure 4. The ESP32 microcontroller constitutes the core of the system, providing high flexibility for configuring data input and output channels, as well as expanding connections through additional modules. This architecture enables an increase in the number of electronic sensors connected to the system according to research demands and optimizes communication among components. Furthermore, a single channel can be configured via software to function either as a power supply line or as a data communication interface, increasing the versatility of the equipment in field applications.
3.2. Microcontroller Programming
The microcontroller programming was structured to ensure energy efficiency, operational flexibility, and reliability in data acquisition. The use of microcontrollers in environmental monitoring systems is widely adopted due to their low cost, customization capacity, and adaptability to different applications [
13]. The code was organized into independent modules, facilitating maintenance and organization. Specific libraries were used for SD card control, RTC management, sensor readings, and power-saving routines.
Table 2 presents the structure of module import instructions used in the source code.
During the initialization stage, serial communication, sleep mode activation, and RTC synchronization were configured. The system checks the timestamp to determine whether the reading cycle should be executed, respecting the programmed interval (minutosEntreLeituras), as shown in
Table 3.
In the main loop, the system evaluates the condition prontoParaLeitura to decide whether it should proceed with data acquisition. When this condition is met, the microcontroller records internal and external temperature and CO₂ readings, stores them in the file carbon.txt on the SD card, and prints the values to the console for debugging purposes.
Table 4 presents the programmed logical instructions.
To increase the system's autonomy in field conditions—especially during battery-powered operation—energy optimization mechanisms were implemented, including the use of sleep mode (sleepESP32), which significantly reduces current consumption between cycles. Energy management strategies are essential in continuous environmental monitoring systems, particularly in aquaculture, where sensors must operate for long periods under field conditions [
14]. Finally, data were stored in semicolon-delimited text format, ensuring compatibility with statistical software. The structure of the final file is shown in
Table 5.
3.3. Embedded Electronic System Inside the Chamber
The final model of the embedded electronic system installed inside the chambers, developed to monitor and estimate CO₂ concentration in aquatic environments, is presented in
Figure 5. The structure integrates the ESP32 microcontroller, internal and external temperature and CO₂ sensors, an RTC module, a microSD storage unit, and a rechargeable battery. All components were mounted to ensure mechanical protection, structural stability, and safety during transportation and field use.
The internal layout was designed to minimize interference and allow adequate air circulation inside the chamber, ensuring that the measurements accurately represented environmental variations. Installing the sensors above the water surface enabled the system to capture the gaseous dynamics within the internal microenvironment of the chamber, while the external sensors provided reference values for comparison.
3.4. Preliminary Tests of the Electronic System
The preliminary tests made it possible to verify the operational efficiency of the system and the suitability of the proposed methodology. The literature indicates that embedded technologies are essential for continuous monitoring of environmental variables and for preliminary estimations of carbon footprint in aquaculture [
15,
16,
17].
3.4.1. Results for Clear-Sky and Cloudy Weather Conditions
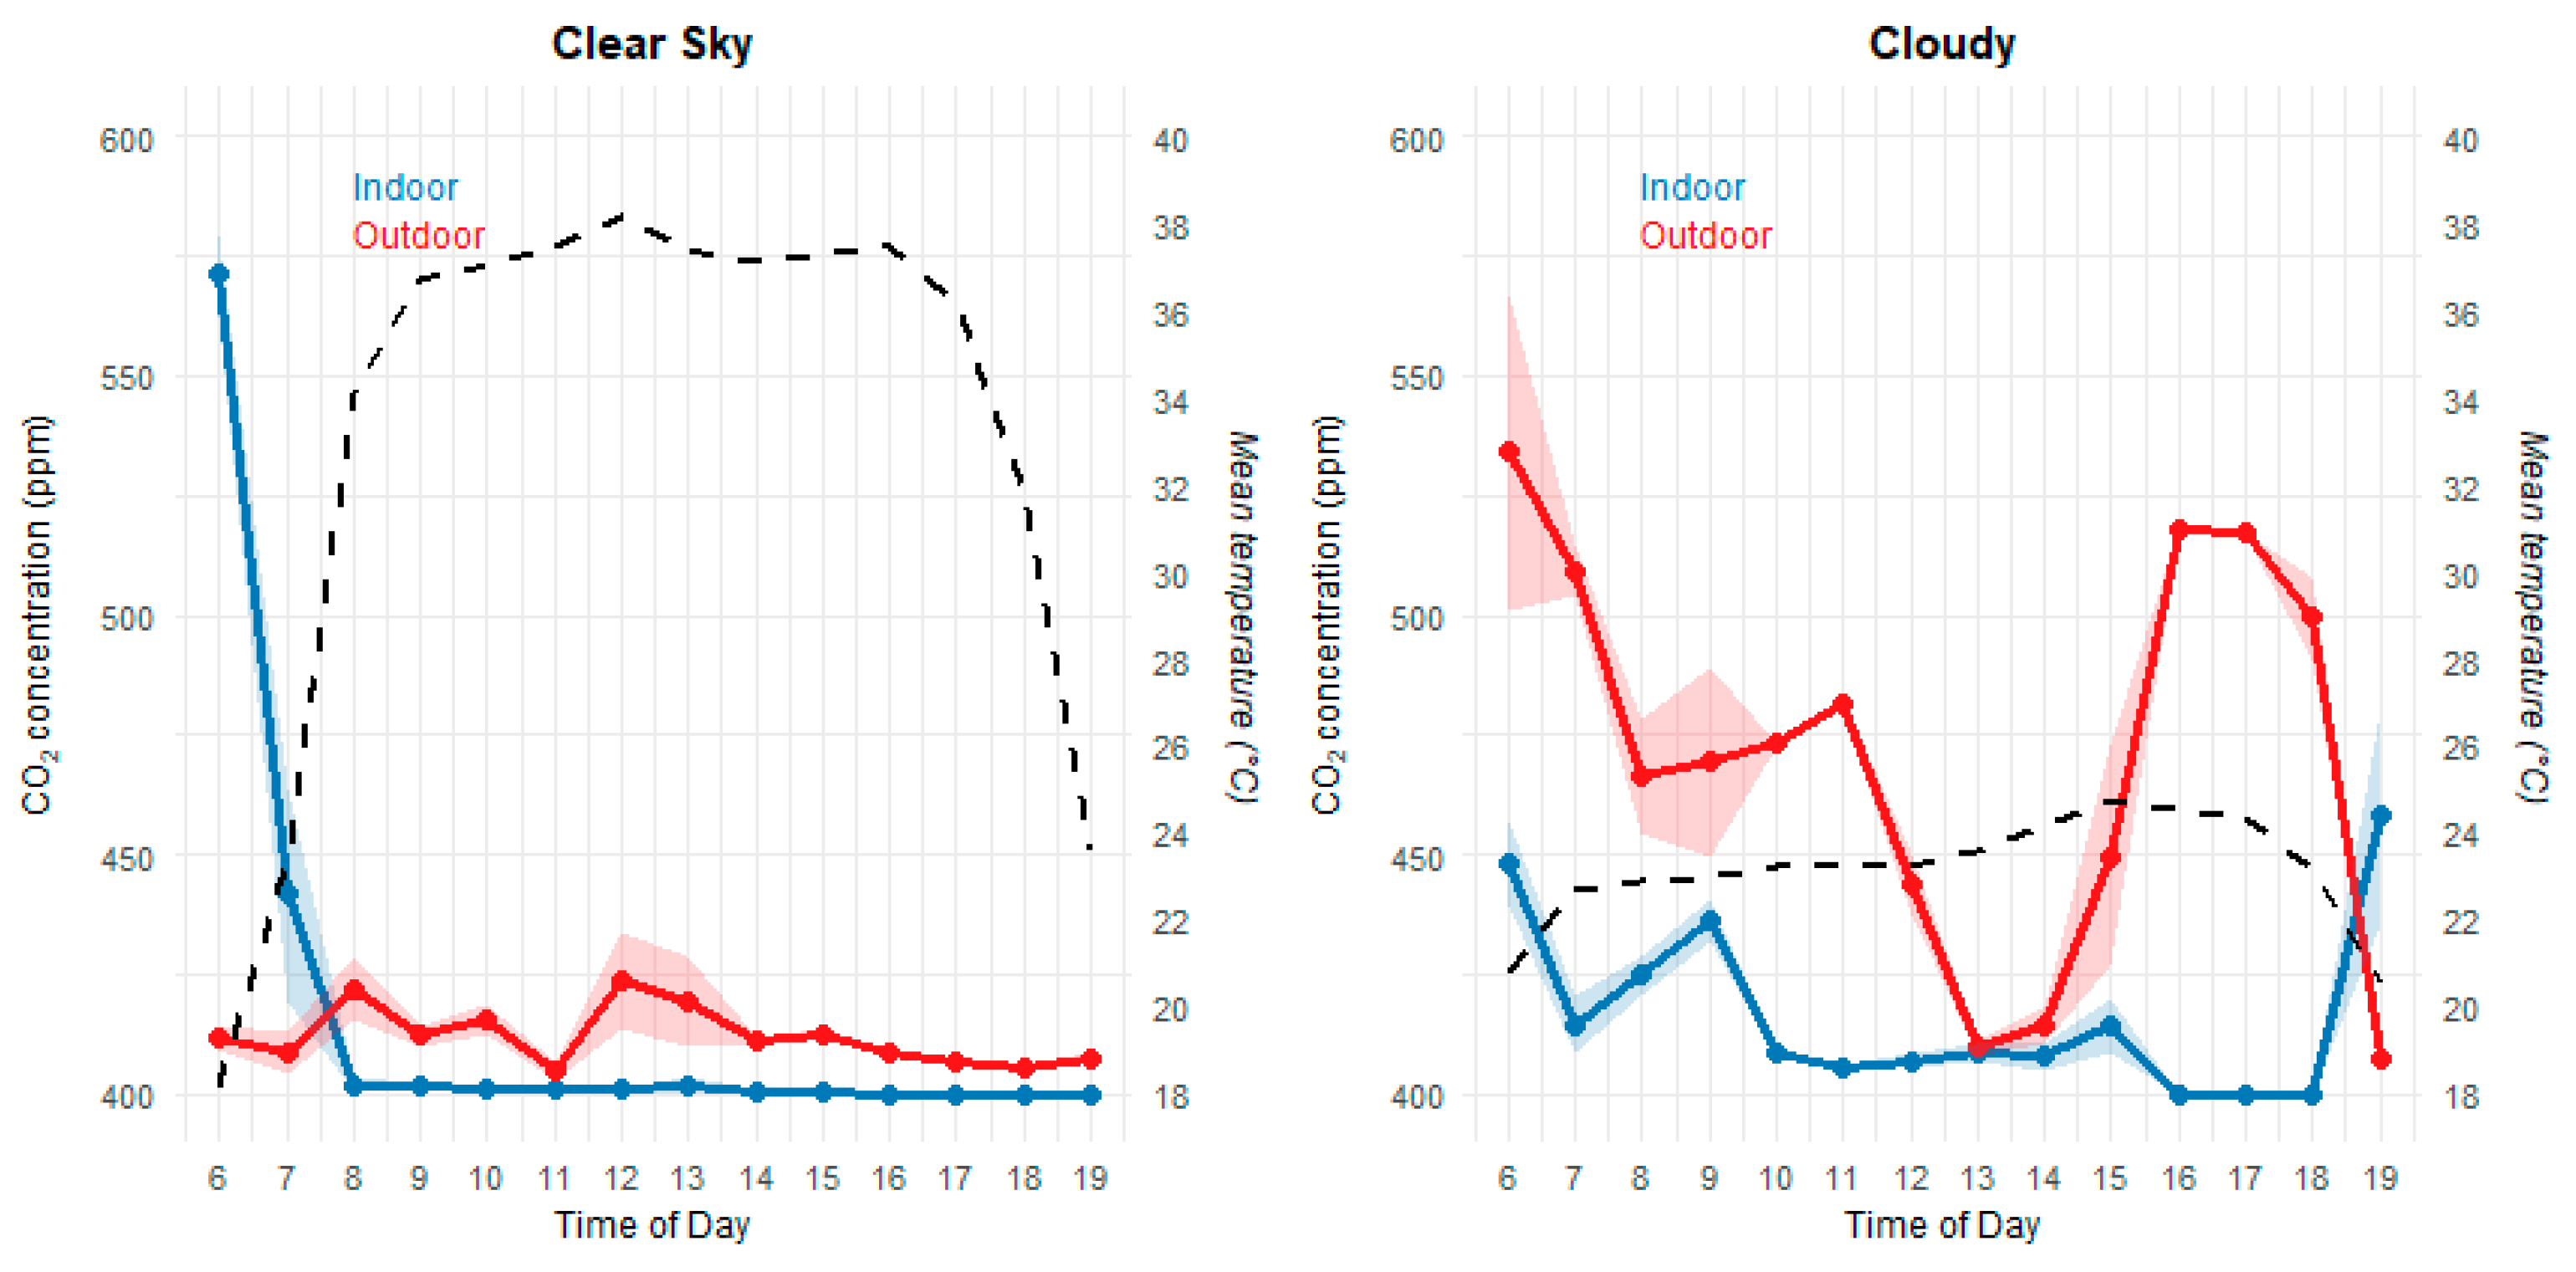
The results related to carbon dioxide (CO₂) concentration during clear-sky and cloudy periods are shown in
Figure 6. The one-way ANOVA revealed that, on the cloudy day, there was a significant difference between indoor and outdoor environments (F(1, 44) = 12.35, p = 0.001, n = 46), with higher concentrations outdoors. On the clear-sky day, no significant difference was observed (F(1, 46) = 1.87, p = 0.179, n = 48), indicating a more homogeneous distribution. During periods of high solar radiation, a decrease in internal CO₂ concentration was observed, reaching the sensor’s lower detection limit (≈400 ppm).
Solar radiation directly influences the photosynthetic process of microalgae, a key mechanism for CO₂ uptake in aquaculture ponds [
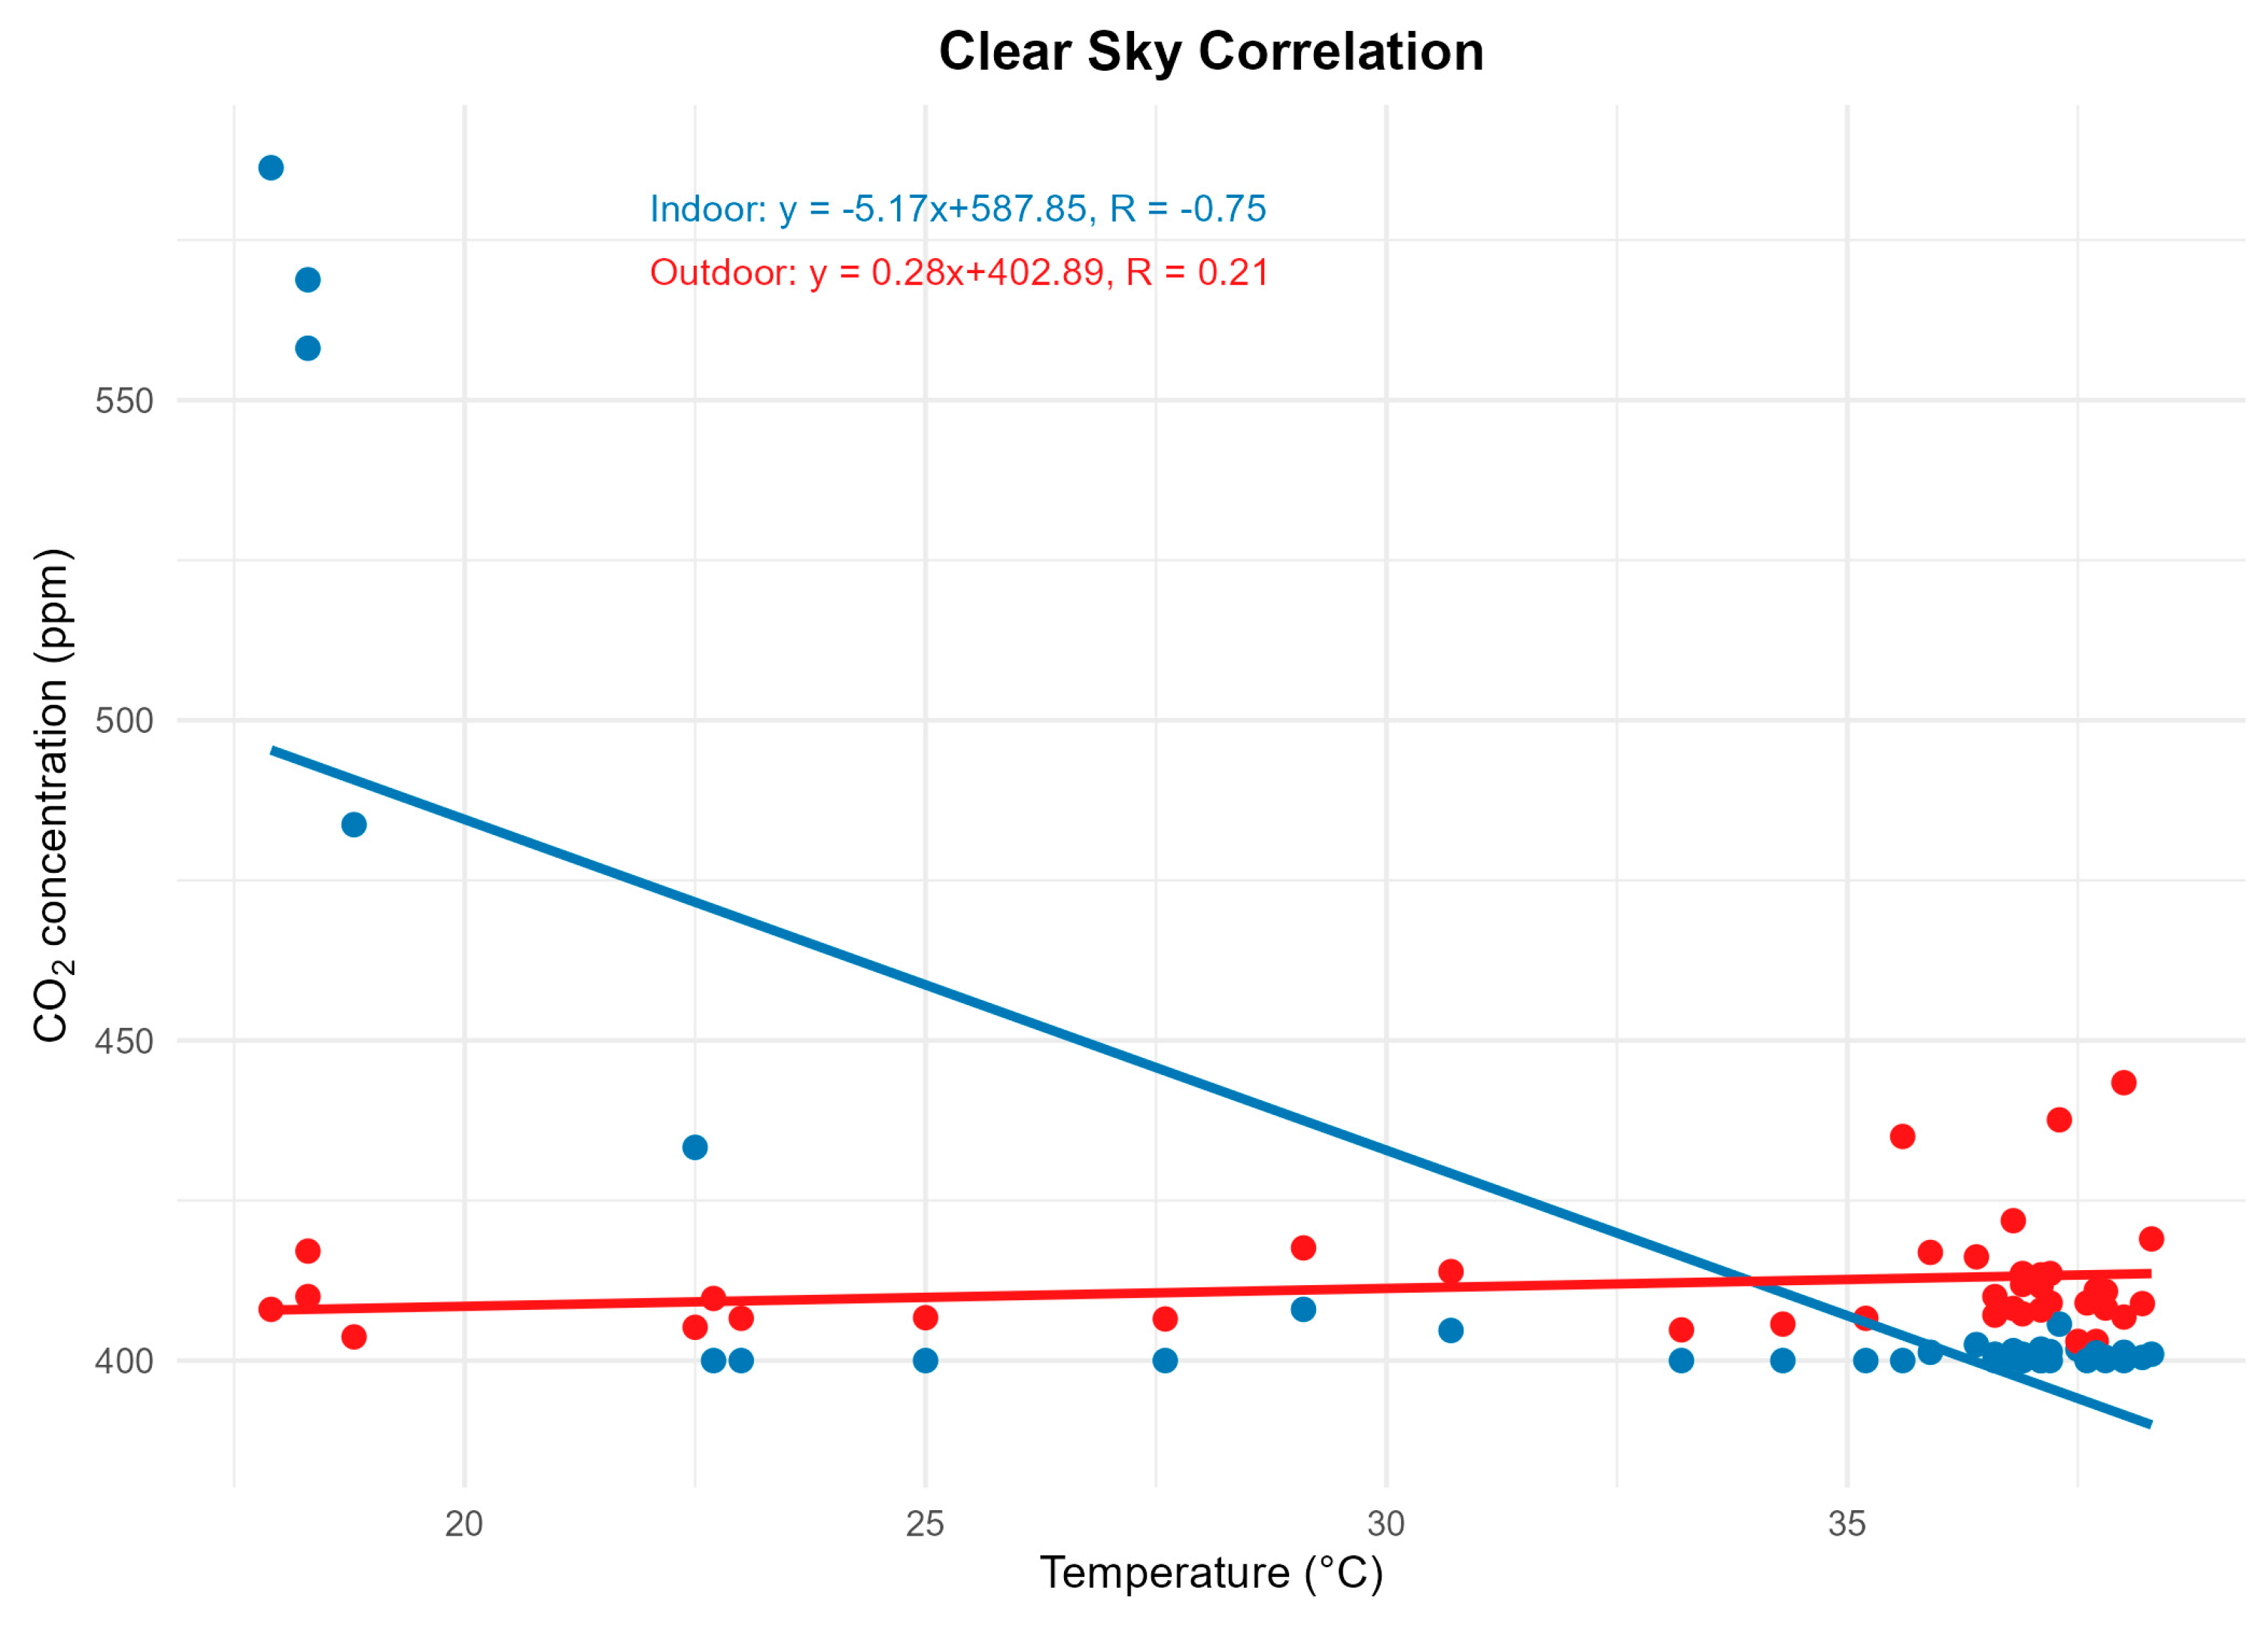
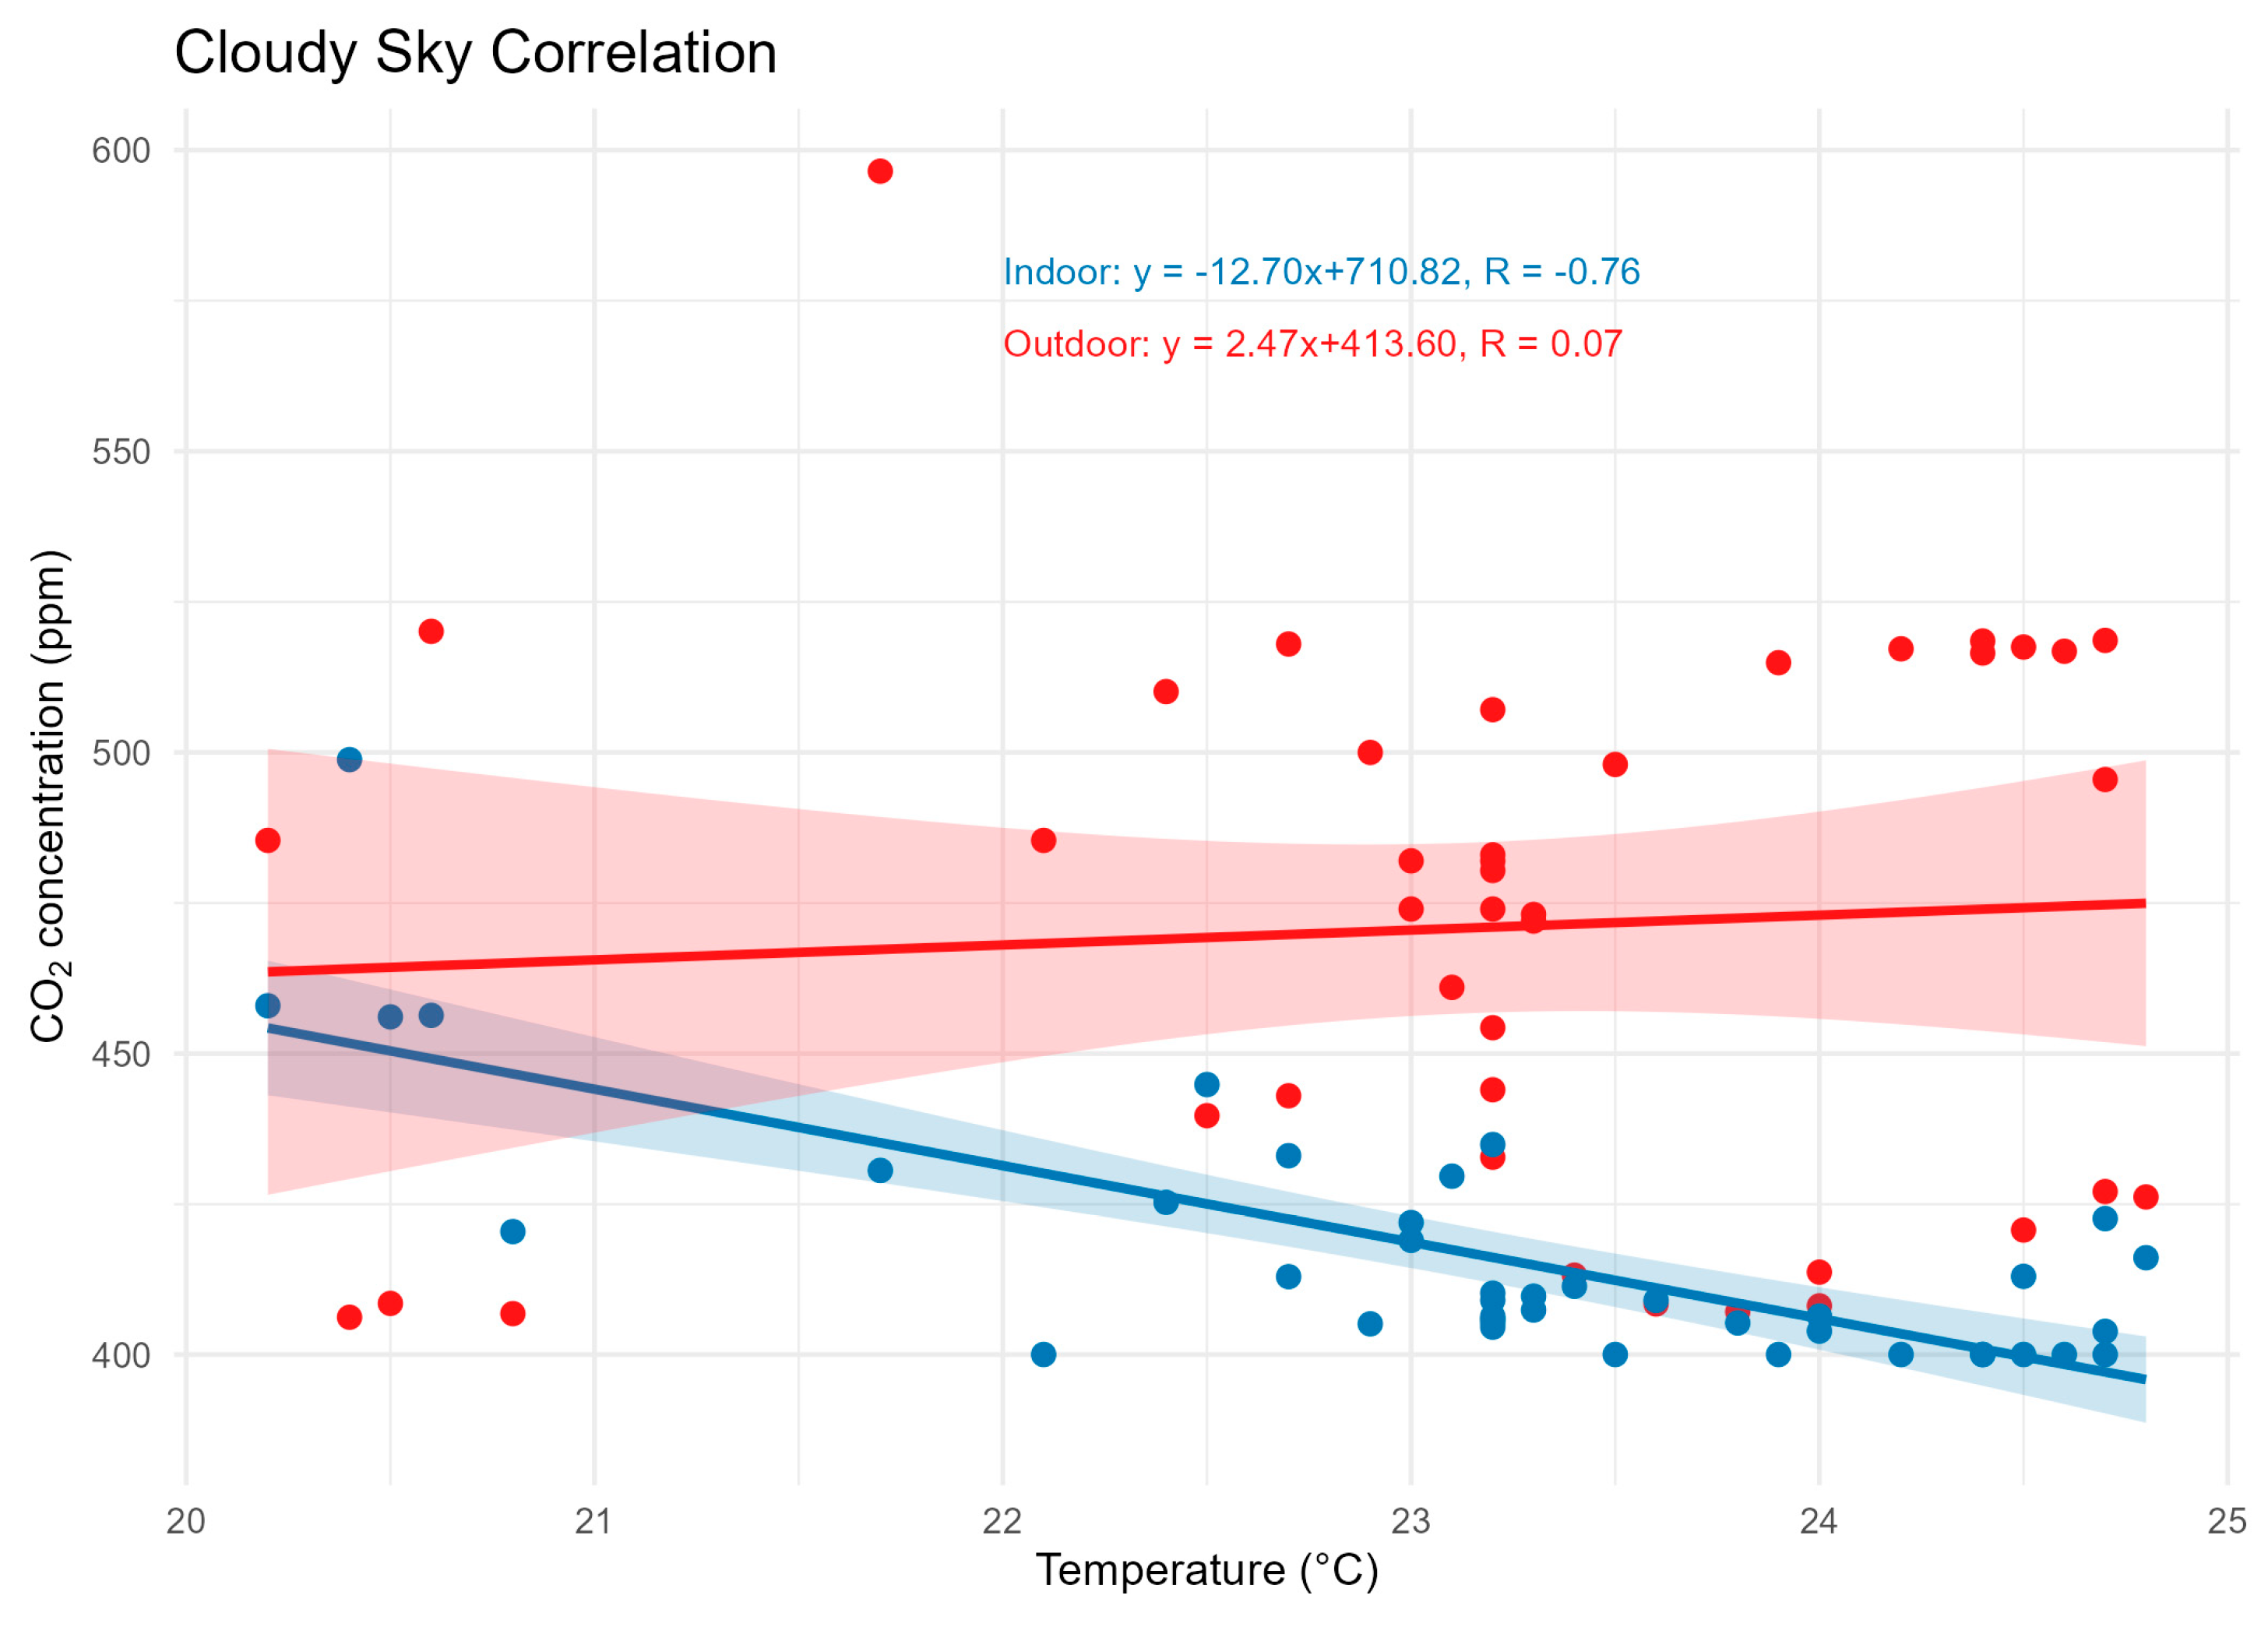
18]. Temperature ranged from 18–38 °C on the clear-sky day and 20–25 °C on the cloudy day. Negative correlations between temperature and CO₂ were recorded in both scenarios, with R² = 0.75 (clear sky) and R² = 0.76 (cloudy sky), as shown in
Figure 7 and
Figure 8.
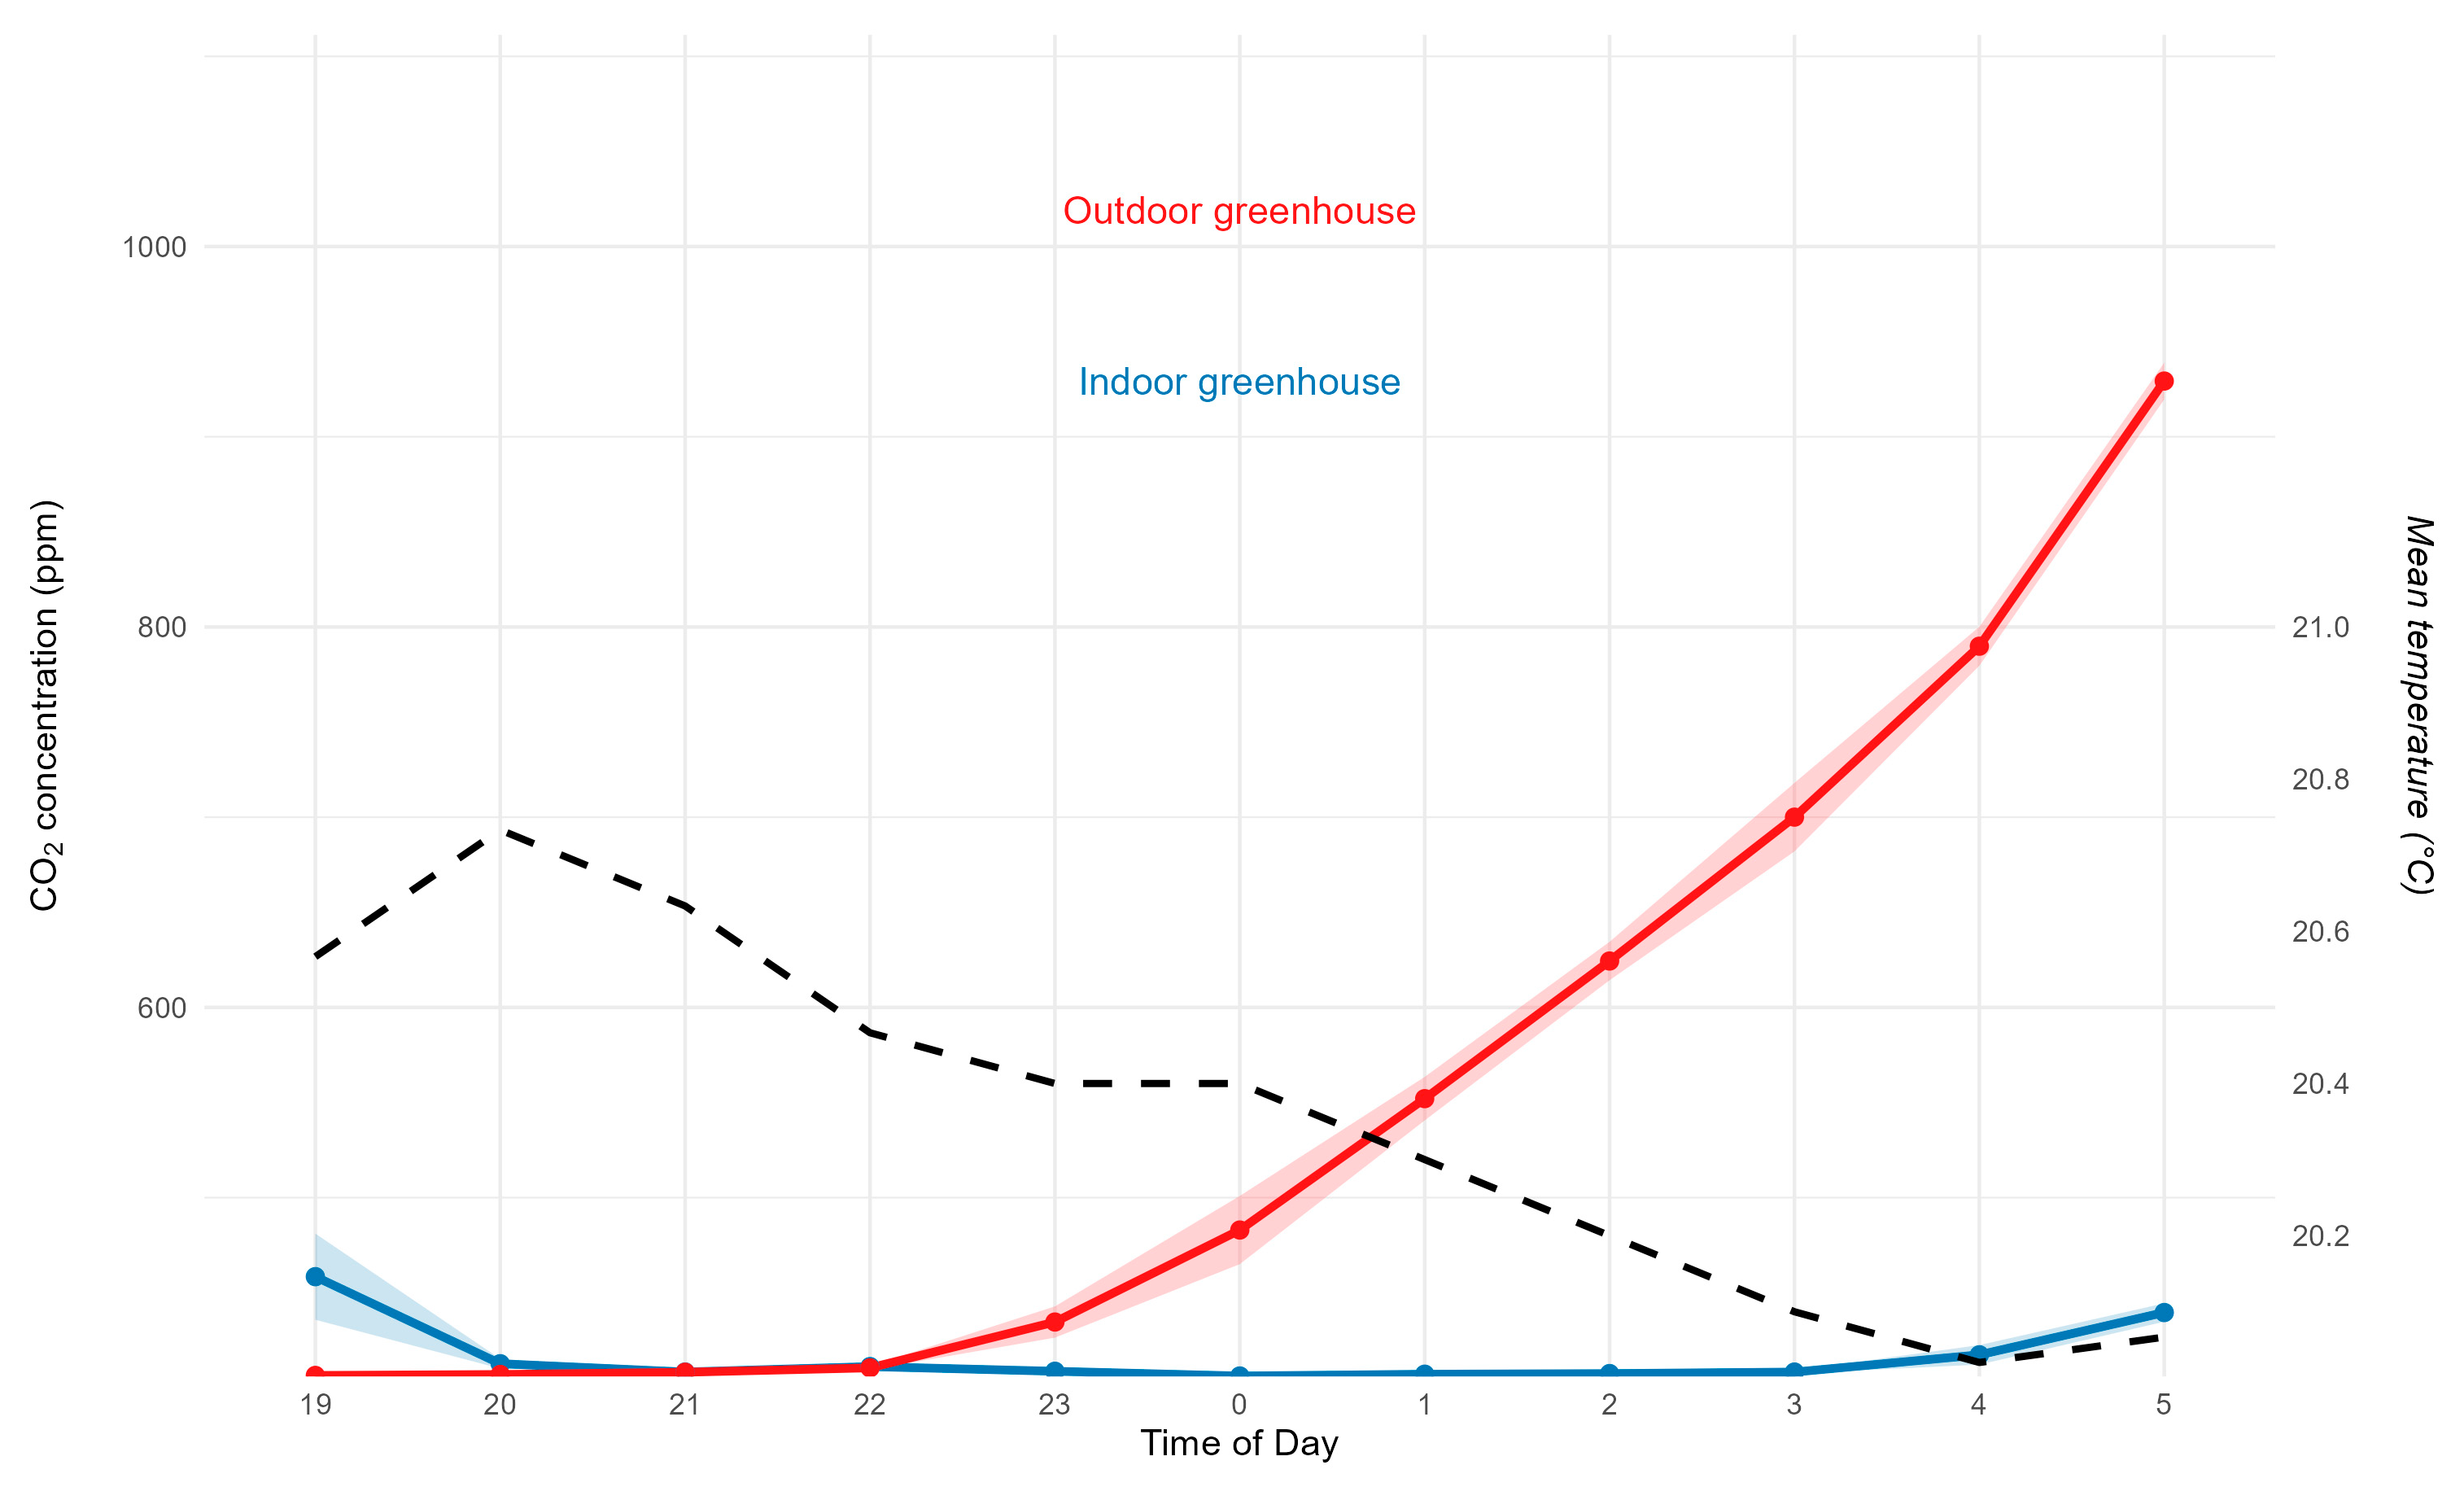
3.4.2. Results for the Nighttime Period
The data regarding CO₂ concentration during the nighttime period (7:00 p.m. to 5:00 a.m.) are presented in
Figure 9.
The mean values were 417 ppm for the internal sensors and 558.7 ppm for the external sensors, with a significant difference between environments (F(1, 94) = 18.51, p < 0.0001). After 10:00 p.m., an exponential increase in external CO₂ was observed, possibly caused by thermal inversion and plant respiration, as reported in other studies [
19,
20,
21]. Internal concentrations remained stable (~410 ppm), a pattern associated with the physical barrier of the chamber, which reduces gas exchange.
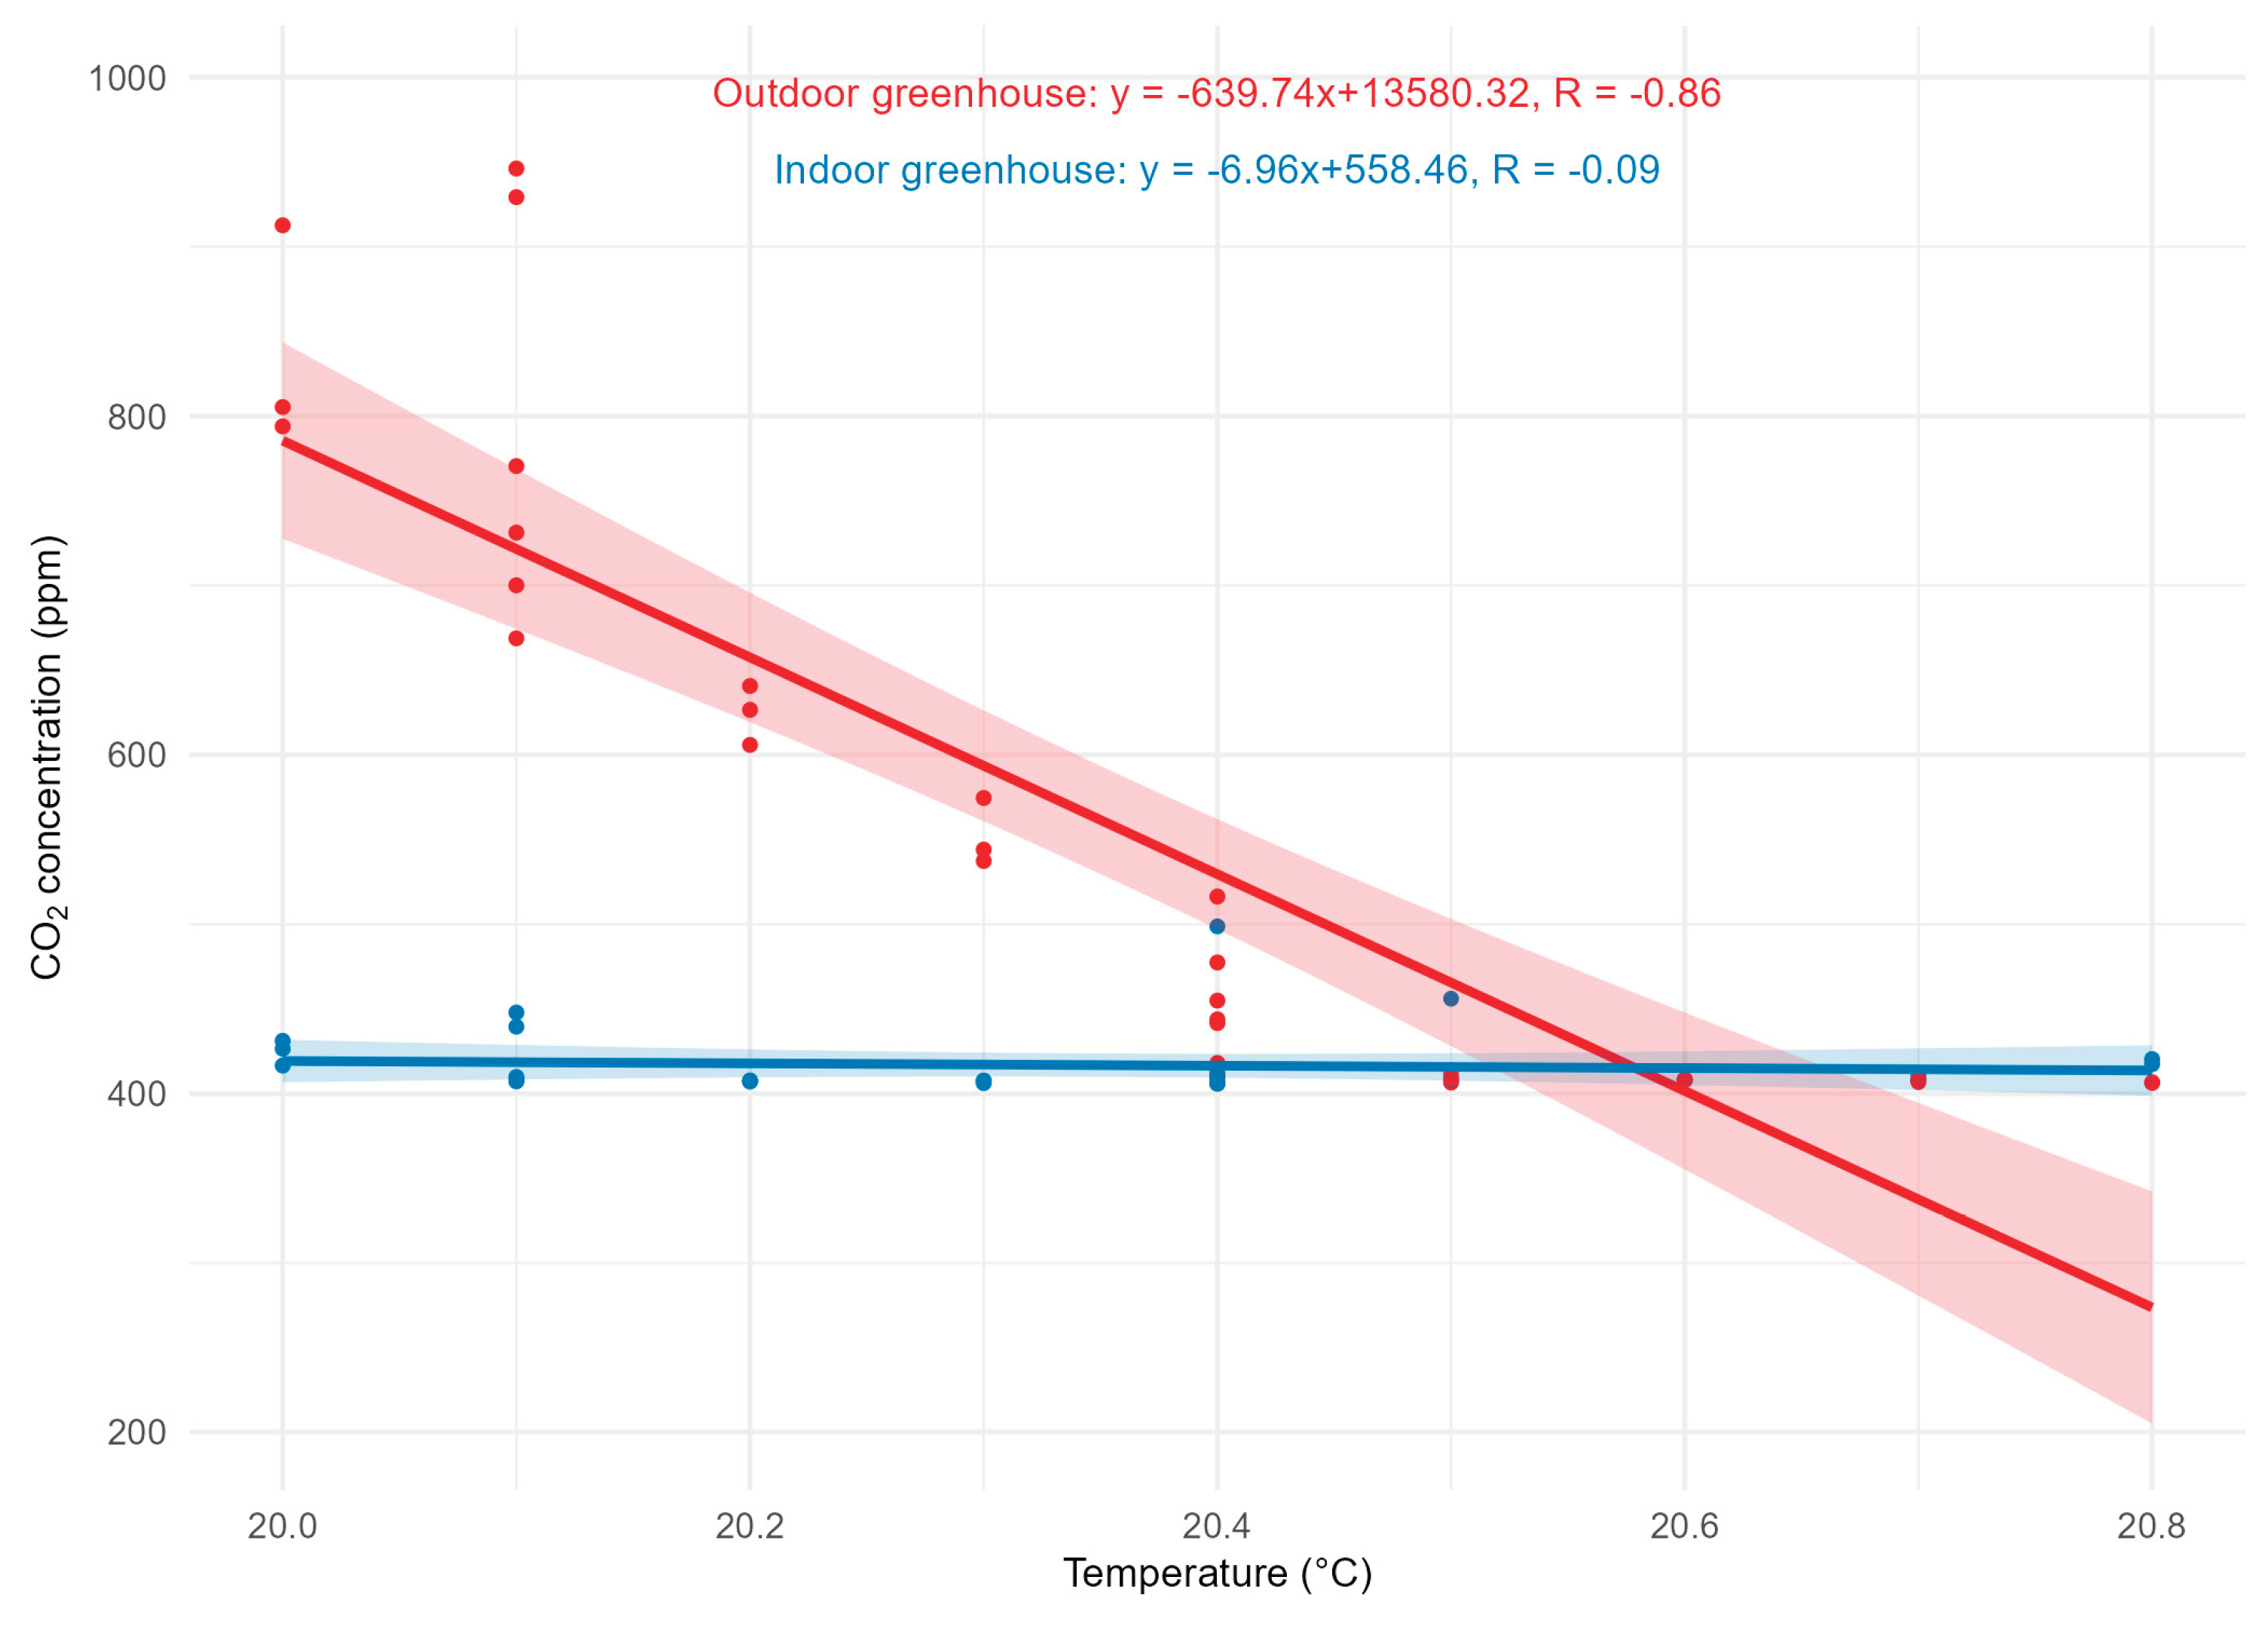
Temperature ranged between 20–20.8 °C. The correlation between temperature and CO₂ was negative in the external environment, whereas no significant correlation was observed internally, as shown in
Figure 10.
4. Discussion
The results obtained in this study demonstrate that the embedded electronic system, based on the ESP32 microcontroller and CO₂ and temperature sensors, provides adequate performance for environmental monitoring in earthen fishponds, enabling continuous data acquisition and the characterization of temporal variations in carbon dioxide (CO₂) concentrations under different climatic conditions. The capability to simultaneously record internal and external values in relation to the chambers provided insights into the influence of environmental conditions and aquatic dynamics on the concentration of this gas, an essential parameter for the sustainable management of fish farming.
4.1. Influence of Climatic Conditions on CO₂ Variation
The results showed that climatic conditions play a decisive role in the dynamics of atmospheric CO₂. On clear-sky days, internal concentrations approached the lower limit of the sensor (≈400 ppm), while in the external environment, a continuous reduction occurred throughout the morning and early afternoon. This trend is associated with increased solar radiation, which stimulates the photosynthesis of microalgae present in the ponds, reducing CO₂ dissolved in the water and, consequently, in the adjacent atmospheric microenvironment [
6,
7].
A similar phenomenon was described by [
18], who reported that high radiation intensities promote higher photosynthetic rates in microalgae exposed to elevated CO₂ concentrations. Conversely, on cloudy days, the lower availability of radiation reduces photosynthesis, increasing CO₂ concentration. This sensitivity of photosynthesis to light confirms its relevance as a regulator of gas fluxes in earthen fishponds.
In addition to solar radiation, meteorological factors such as wind speed and relative humidity influence the transport and dispersion of CO₂. Urban and rural studies show that stronger winds promote enhanced air mixing and therefore reduce local CO₂ concentrations [
22]. This helps explain part of the variability observed during cloudy periods, especially when associated with higher humidity and reduced air circulation.
4.2. Nighttime Dynamics and CO₂ Accumulation
During the nighttime period, external CO₂ concentration showed a progressive accumulation pattern, reaching values above 550 ppm, whereas inside the chamber the values remained more stable. The external increase can be explained by the predominance of plant and aquatic organism respiration, the absence of photosynthesis, and the occurrence of thermal inversions typical of subtropical rural environments [
23].
Similar situations have been documented in rural regions of Japan, where temperature reduction and low nighttime turbulence favored CO₂ accumulation near the ground [
22]. The internal stability of the chambers is related to the physical barrier imposed by the 150-micron plastic covering, which reduces gas exchange and maintains more constant microclimatic conditions, corroborating observations by [
15] regarding semicontrolled microenvironments in protected structures.
4.3. Performance and Applicability of the Electronic System
The adoption of embedded systems for environmental monitoring has increased in aquaculture due to their low cost, operational efficiency, and ability to collect continuous data [
13,
14]. In the present study, the ESP32 proved to be a robust and energy-efficient platform, especially when operated in sleep mode between readings—an approach widely used in agricultural IoT systems.
This type of architecture has been advocated by several authors as a viable alternative for enhancing the digitalization of aquaculture and providing a basis for more sustainable management models [
15,
16]. The integration of CO₂ sensors is particularly relevant, considering that this gas plays a central role in metabolic processes, biogeochemical cycles, and carbon balance in earthen ponds [
7,
8].
The system’s ability to clearly differentiate CO₂ dynamics between internal and external environments validates its potential as an instrument for more advanced studies, including future estimations of carbon footprint. This advancement is essential in a sector that is rapidly expanding in Brazil—an expansion documented through remote-sensing studies conducted by Embrapa [
2]—and that faces increasing demand for sustainability and environmental certification.
4.4. Connections with Carbon Footprint and Sustainability
Continuous monitoring of atmospheric CO₂ and CO₂ related to the biological activity of fishponds represents a necessary step toward the future development of methodologies for quantifying the carbon footprint in inland aquaculture. Recent literature highlights the urgency of integrating real environmental variables into emission estimation models [
17]. The system presented in this study provides empirical data capable of supporting such models.
Furthermore, the dynamics of CO₂ in earthen ponds depend not only on phytoplankton photosynthesis but also on fish respiration, organic decomposition, and air–water gas exchange—all influenced by temperature and meteorological conditions [
6]. Thus, the present work contributes to an integrated understanding of these processes, which is fundamental for adopting resilient and environmentally responsible production practices.
5. Conclusion
The electronic monitoring system developed in this study demonstrated solid technical and operational feasibility for tracking the temporal dynamics of carbon dioxide (CO₂) in earthen aquaculture ponds. By integrating an ESP32 microcontroller with low-cost environmental sensors, the proposed architecture resulted in a lightweight, easily deployable, and economically accessible platform suitable for field applications, particularly in small- and medium-scale operations.
Clear differences were observed between internal and external environments under contrasting meteorological conditions. On clear-sky days, mean CO₂ concentrations were 401 ppm inside the floating chamber and 412.2 ppm outside. Under cloudy conditions, the means increased to 416.7 ppm internally and 470.9 ppm externally. These findings indicate that the floating chamber provided a stable and representative microenvironment while still capturing real atmospheric fluctuations driven by weather patterns.
The system also recorded characteristic diurnal and nocturnal behaviors, including nighttime accumulation of CO₂ in the external environment and enhanced stability within the chamber. Such patterns highlight the device’s ability to detect atmosphere–water interactions relevant to carbon dynamics in aquaculture systems.
Overall, the results establish a robust foundation for future development of methodologies aimed at estimating the carbon footprint of freshwater aquaculture. Although the CO₂ sensor used in this prototype is limited by a lower detection threshold of approximately 400 ppm, the experimental design allows for the integration of higher-sensitivity sensors and additional variables—such as dissolved oxygen, pH, and turbidity—in future iterations. These improvements will enhance the precision, scalability, and applicability of environmental monitoring frameworks intended to support sustainable fish-farming management
Author Contributions
Conceptualization, H.R.M. and O.J.L.J.; methodology, H.R.M.; software, R.L.B. and O.J.L.J.; validation, A.F., H.R.M., and O.J.L.J.; formal analysis, A.F. and H.R.M.; investigation, H.R.M. and O.J.L.J.; data curation, H.R.M.; writing—original draft preparation, H.R.M.; writing—review and editing, H.R.M.; supervision, A.F.; project administration, O.J.L.J. All authors have read and agreed to the published version of the manuscript.
Funding
This research received no external funding.
Data Availability Statement
The raw data supporting the conclusion of this article will be made available by the authors on request.
Acknowledgments
The authors thank the technical and laboratory team of the Aquaculture Management and Studies Group (GEMAq) at the Western Paraná State University (UNIOESTE) for their support during the development and testing of the electronic system. This study was carried out with the support of the Coordenação de Aperfeiçoamento de Pessoal de Nível Superior (CAPES), a Brazilian Government agency focused on the training of human resources.
Conflicts of Interest
The authors declare no conflicts of interest.
Abbreviations
The following abbreviations are used in this manuscript:
| AM2302/DHT22 |
Digital Temperature and Humidity Sensor |
| ANOVA |
Analysis of Variance |
| BMP180 |
Barometric Pressure and Temperature Sensor |
| CAPES |
Brazilian Federal Agency for Support and Evaluation of Graduate Education |
| CO₂ |
Carbon Dioxide |
| Embrapa |
Brazilian Agricultural Research Corporation |
| ESP32 |
Low-power Dual-core Microcontroller |
| GEMAq |
Aquaculture Management and Studies Group |
| GPS |
Global Positioning System |
| IDE |
Integrated Development Environment |
| INMET |
Brazilian National Institute of Meteorology |
| LoRa |
Long-Range Radio Communication Protocol |
| O₂ |
Oxygen |
| ppm |
Parts per Million |
| RTC |
Real-Time Clock |
| SD |
Secure Digital (Memory Card) |
| UNIOESTE |
Western Paraná State University |
References
- Instituto Brasileiro de Geografia e Estatística; IBGE. Pesquisa Pecuária Municipal – PPM; SIDRA/IBGE, 2024. [Google Scholar]
- São José, F.D.; Novo, Y.D.C.; Farias, A.; Magalhães, L.; Fonseca, M. Mapeamento de viveiros escavados para aquicultura no Brasil por sensoriamento remoto; Embrapa Territorial, 2022. [Google Scholar]
- Lima, A.F.; da Silva, A.P.; Rodrigues, A.P.O.; de Sousa, D.N.; Bergamin, G.T.; de Lima, L.K.F.; Flores, R.M.V. Manual de piscicultura familiar em viveiros escavados; Embrapa, 2024. [Google Scholar]
- Werneck, P.R.; Macedo, H.R.; Morsoleto, F.M.S.; Lira, K.C.S.; Feiden, A. Use of georeferencing as a sustainable planning tool for aquaculture production in small municipalities: a case study for Ouro Verde do Oeste/PR. Research, Society and Development 2023, 12, e17012338683. [Google Scholar] [CrossRef]
- Morsoleto, F.M.S.; Werneck, P.R.; Macedo, H.R.; Pisol, C.D.; Vanelli, J.; Makrakis, S.; Ballester, E.L.C.; Feiden, A. Sustainable planning geotechnologies for fish farming expansion in small municipalities: A case study of Pato Bragado, Brazil. Latin American Journal of Aquatic Research 2024, 52, 563–574. [Google Scholar] [CrossRef]
- Boyd, C.E.; Tucker, C.S. Pond Aquaculture Water Quality Management; Springer: New York, 2012. [Google Scholar]
- Boyd, C.E. Water Quality: An Introduction; Springer Nature: Cham, 2019. [Google Scholar]
- Bunting, S.W. Principles of Sustainable Aquaculture: Promoting Social, Economic and Environmental Resilience; Routledge: London, 2013. [Google Scholar]
- World Meteorological Organization (WMO). Greenhouse Gas Bulletin No. 20: The State of Greenhouse Gases in the Atmosphere Based on Global Observations through 2023; WMO: Geneva, 2024. [Google Scholar]
- Instituto Nacional de Meteorologia (INMET). Glossário de Meteorologia. Available online: https://portal.inmet.gov.br/glossario/glossario (accessed on 10 December 2025).
- R Core Team. R: A Language and Environment for Statistical Computing; R Foundation for Statistical Computing: Vienna, Austria, 2022; Available online: https://www.R-project.org/.
- Wickham, H. ggplot2: Elegant Graphics for Data Analysis; Springer: New York, 2016. [Google Scholar] [CrossRef]
- Mitu, N.S.; Vassilev, V.; Tabany, M.R. Low cost, easy-to-use, IoT and cloud-based real-time environment monitoring system using ESP8266 microcontroller. International Journal of Internet of Things and Web Services 2021, 6, 30–44. Available online: https://repository.londonmet.ac.uk/6999/.
- Jiang, J.; Shi, G.; Zhao, D.; Shi, B.; Li, Z.; Zhu, Z. Research on life cycle of wireless network for measuring environmental parameters in aquaculture. Transactions of the Chinese Society of Agricultural Engineering 2014, 30, 147–154. Available online: https://www.tcsae.org/nygcxb/article/abstract/20140722.
- Stanghellini, C.; Incrocci, L.; Gázquez, J.C.; Dimauro, B. Carbon dioxide concentration in Mediterranean greenhouses: how much lost production? In International Symposium on High Technology for Greenhouse System Management: Greensys 2007; Acta Horticulturae; Volume 801, pp. 1541–1550. [CrossRef]
- Zhang, C.; Liu, H.; Wang, C.; Zong, Z.; Wang, H.; Zhao, X.; Li, Y. Testing and analysis on the spatial and temporal distribution of light intensity and CO2 concentration in solar greenhouse. Sustainability 2023, 15, 7001. [Google Scholar] [CrossRef]
- Streit, S.A.F. Análise das metodologias de pegada de carbono na aquicultura continental: uma revisão sistemática. Master Dissertation, Universidade Federal do Rio Grande do Sul, 2023. Available online: https://lume.ufrgs.br/bitstream/handle/10183/276270/001200396.pdf?sequence=1 (accessed on 10 December 2025).
- Chunzhuk, E.A.; Grigorenko, A.V.; Kiseleva, S.V.; Chernova, N.I.; Vlaskin, M.S.; Ryndin, K.G.; Dudoladov, A.O. Effects of light intensity on the growth and biochemical composition in various microalgae grown at high CO₂ concentrations. Plants 2023, 12, 3876. [Google Scholar] [CrossRef] [PubMed]
- Marrero, M.; Carrilho, J.D.; da Silva, M.G. Effects of meteorological factors on CO₂ concentrations. AIVC Conference Proceedings, 2018; Available online: https://www.aivc.org/resource/effects-meteorological-factors-co2-concentrations.
- Pathakoti, M.; Gaddamidi, S.; Gharai, B.; Syamala, P.S.; Rao, P.V.N.; Choudhury, S.B.; Dadhwal, V.K. Influence of meteorological parameters on atmospheric CO₂ at Bharati, the Indian Antarctic research station. Polar Research 2018, 37, 1442072. [Google Scholar] [CrossRef]
- Saliba, M.; Micallef, A. Analysis and observations concerning concentrations of greenhouse gases measured over 11 years in the central Mediterranean region. WIT Transactions on Ecology and the Environment 2024, 262, 693–703. [Google Scholar] [CrossRef]
- Imasu, R.; Tanabe, Y. Diurnal and seasonal variations of CO₂ concentration in urban, suburban, and rural areas around Tokyo. Atmosphere 2018, 9, 367. [Google Scholar] [CrossRef]
- Anderegg, W.R.; Ballantyne, A.P.; Smith, W.K.; Majkut, J.; Rabin, S.; Beaulieu, C.; Pacala, S.W. Tropical nighttime warming as a dominant driver of variability in the terrestrial carbon sink. PNAS 2015, 112, 15591–15596. [Google Scholar] [CrossRef] [PubMed]
|
Disclaimer/Publisher’s Note: The statements, opinions and data contained in all publications are solely those of the individual author(s) and contributor(s) and not of MDPI and/or the editor(s). MDPI and/or the editor(s) disclaim responsibility for any injury to people or property resulting from any ideas, methods, instructions or products referred to in the content. |
© 2025 by the authors. Licensee MDPI, Basel, Switzerland. This article is an open access article distributed under the terms and conditions of the Creative Commons Attribution (CC BY) license (http://creativecommons.org/licenses/by/4.0/).