
Submitted:
16 December 2025
Posted:
18 December 2025
You are already at the latest version
Abstract
Abstract
Introduction: We have followed the onset of the acquired immune deficiency disease (AIDS) pandemic and human immunodeficiency virus (HIV) infection from its recognition in the US since 1981 (1) describing the disease’s impact on T-lymphocytes (2), leading to pulmonary and renal diseases, cancer (3) and fibrosis (4). The development of an effective therapeutic combination anti-retroviral therapy (cART) has revolutionized HIV’s impact globally and HIV infection is now regarded as a chronic disease. A major inflammatory component for chronic HIV is the gastrointestinal tract (GIT) which is a major site for HIV replication and persistence (5). However, few tools are currently available to assess the innate immune system (InImS) in HIV patients. In this study, we present data on InImS biomarkers in patients on cART showing that inflammation predicts mortality (1). Patients and Methods: From patients enrolled in a colorectal neoplasia prediction study (6) we followed 34 adult HIV positive Veterans on cART comparing colon InImS expression of a Paneth cell product, p87; the denominator) and blood ferritin (the numerator) to derive the FERAD ratio, and p87 expression by immunohistochemistry available in some of our HIV patients, and compare expression to 2,252 without HIV. Stool and colonoscopically-obtained tissue specimens were run in a p87 ELISA and immunohistochemistry for both fixed and native antigens, using the Adnab-9 antibody. Results: There were no significant differences in demographics aside from lower BMI in HIV patients (24.93±6.30 versus 28.0±6.13 kg/m2) p< 0.0001. HIV patients also had lower serum creatinine (0.99±0.23 versus 1.28±1.89; p< 0.0001) and were heavier smokers 88.9% vs 43.7% (OR 10.29[CI1.28-82.77];p< 0.008) and more frequent alcohol drinkers 71.4% vs 25.1% (OR 6.0 [CI1.7-20.9]) than controls. Native p87 antigen was elevated in HIV patients compared to controls in the ascending, transverse and descending colon (0.794±0.890 versus 0.170±0.201 respectively; p< 0.000004; 1.062±0.730 versus 0.202±0.377 respectively; p< 0.000003; and 0.611±0.182 versus 0.174±0.251 respectively; p< 0.0009), respectively; and Helicobacter pylori (H. pylori) detection was higher in HIV patients (84.6% versus 36%;p< 0.0002). We also ran these assays in cancer patients, for comparison. Conclusions: Colonic inflammation as expressed by p87, a Paneth cell product is significantly elevated in HIV patients and likely represents continued HIV activity leading to inflammation. Increased rates of smoking and drinking alcohol further contribute to inflammation, but there may be an ability to reduce p87 expression by intervention with folates (7) and manipulation of the abnormal HIV patient microbiome (8) may be effective therapies that warrant further study.
Keywords:
HIV (human immunodeficiency virus)
; p87
; Adnab-9
; inflammation
; Innate Immune System
; Paneth cells
; H. pylori
; cART (combination anti-retroviral therapy)
; FERAD ratio
; NLR-(absolute neutrophil: absolute lymphocyte ratio)
1. Introduction
The acquired immune deficiency syndrome (AIDS) was first recognized in 1981 [1] and human immunodeficiency virus (HIV) in 1983. 91.4 million people have acquired HIV and 44.1 million have died from HIV-related causes. Its role in CD4+ T cell depletion, progressive immunodeficiency and vulnerability to opportunistic and intercurrent infections and the reversal of immunodeficiency with combination anti-retroviral therapies (cART), reversed immunodeficiency and has restored a normal lifespan in the most people living with HIV. The gastrointestinal tract (GIT) is a major site of HIV replication, persistence and pathology [9,10]. the HIV latent reservoir and contributes to ongoing inflammation that contributes to noncommunicable diseases such as atherosclerosis [5] few tools are available to assess innate immunity in patients on cART. We established database with over 2,000 participants of the Non-Invasive Prediction of Colorectal Neoplasia (NIPCON) study [6] to investigate intervention with folates [7], microbiome status, and persistence of pathology [9,10] and mortality [1]. We now present innate immune system biomarkers associated with Paneth cells, in patients on cART where inflammation also predicts mortality [5]. We also measured p87, derived from Paneth cells, from colonic effluent and stool and also in extracted colonic biopsies. We used available ferritin levels to derive the FERAD ratio (ferritin/fecal p87) and the FEREFF ratio (ferritin/effluent p87). To assess other predictive ratios, we used the absolute neutrophil/ leucocyte count.
2. Patients and Methods
The numbers of patients initially enrolled with subsequent attrition is detailed in Figure 1 below.
Figure 1 is a schematic diagram which summarizes the retention (n=2305 from HIV and controls)) and separation of patients (who withdrew or were removed n=151).
Study Population
We followed 34 adult HIV positive Veterans on cART enrolled in a colorectal neoplasia predictive study [6] utilizing the gut InImS expression of the Paneth cell product p87 (the denominator) and blood ferritin (the numerator) to derive a ratio (FERAD) compared with the 2,252 available controls without HIV (HIV-).
Stool and Colonoscopy-Obtained Tissue Specimens
These were run on p87 ELISA and immunohistochemistry assays for both fixed and native antigens, using the Adnab-9 antibody which recognizes p87.
FERAD Ratio Calculation
We compared the historic, biomarker baseline response in the test and control patients, using the FERAD ratio (ferritin/fecal p87) in the HIV+ patients and the HIV- control group, one in patients with cancer and the other in those without. We had previously refined the interrelationship of the FERAD ratio, correlating it to available online PDL-1 responses for diverse cancers [11].
The p87 Molecule
This moiety is bound by the Adnab-9 murine monoclonal, raised against colorectal adenoma antigens. At initiation of the study, the antibody was commercially available (Dako, Carpinteria, CA, 93013, USA).
Specimen Collection, Data and Inclusion and Exclusion Criteria
Briefly, fecal and other body fluid specimens were collected after obtaining written informed consent. Inclusion criteria included willingness to participate in a long-term study, and having a routine diagnostic colonoscopy ordered by the patient’s physician. Smoking and drinking were evaluated both by quantitation comparing the means (T-test) and proportions (Chi-square). There was also a phase-2 section of the study where approximately 10% of enrollees had cold forceps colonoscopic biopsies from 6 colonic regions [6]. These were placed in 10% buffered formalin and fixed in a paraffin block which was sectioned into 5-micron slices for immunohistochemistry. Non-fixed tissue was extracted as described previously, comparing fixed and native antigens. The follow-up repeat colonoscopy was usually after 4-5 years. Exclusion criteria were a state of health that precluded colonoscopy, the inability to annotate stool cards dates, and non-compliance.
Colonic Washings (Effluent) Derivation and Other Bodily Fluid
These were also collected colonoscopically from aggregated rectal pools. Unstimulated-saliva and urine samples were likewise collected, and stored at -70 °C. In preliminary reports, stored fecal samples yielded identical results after storage for 10 years. At room temperature, p87 protein was unaffected after exposure to ambient temperatures for 6 days. This was of importance as most participants mailed in their stool cards with local mail delivery, averaging approximately 5 days.
Protein Determination
The fecal sample protein concentrations were achieved by the Lowry method was followed by ELISA testing in accordance with the manufacturers’ directions and was preceded by diluting the stool in phosphate-buffered saline.
ELISA p87 Assay
5µg protein was plated in triplicate wells of a 96-well microtiter plates. The plates were incubated overnight at 4 °C with the primary Adnab-9 antibody that binds the p87 antigen placed on half the plate and the other half with a negative control monoclonal antibody of indifferent binding to the same IgG2a epitope (UPC10) to assess background binding. Preliminary blocking of the plate by a 5% bovine serum albumin solution prevented non-specific binding. All washes between the primary and secondary antibodies applications were performed with PBS and 5% Tween-20. The reagents using the ABC technique as instructed were supplied by Vector Labs (Newark, CA 94560, USA) or by DakoCytomation Inc, (Carpinteria, 93013 USA) California, for immunohistochemistry. The sandwich ELISA final step was to add 40µl of p-nitro-phenyl phosphate to develop a yellow-color that was read on a Thermo-Fisher (Carlsbad CA, 92008, USA) cyto-spectrophotometer at 405nm. The results were expressed as optical density (OD) minus background. For high background on the control wells and a readout of zero in test samples, we treated it as 0.001. The same reagents were used to run western blots on BioRad electrophoresis equipment and transfer blotters (Hercules, CA 94547 USA) using 10% nitrocellulose gels incorporating molecular weight markers and PVDF membranes for protein transfer. The InImS markers, FERAD ratio and FERREF ratio (ferritin/p87 binding to colonic effluent) were also compared.
Permissions
Wayne State University Institutional Review Board and other participating medical centers reviewed and approved the above protocols (H09-62-94).
Statistics
Contingency tables measuring 2 × 2 were analyzed by chi-squared and/or Fisher’s exact test. Ordinal data were analyzed by Student’s t test with statistical analyses performed using an online statistics package (Vassar Stats http://vassarstats.net/ and last access was 25 May 2025). Sensitivity, specificity, and positive predictive value were determined. Significance was determined when the probability was p<0.05.
Linear correlation was analyzed by the least-squares method. The r coefficient values were depicted on graphs where applicable. Probability values were regarded as significant at the <0.05 level. Where samples were limited, we used a 1-tailed t-test if the results were congruous with similar measured trends.
We compared the historic, biomarker baseline response in the test and control patients, using the FERAD ratio in the HIV+ patients and the control group. one in patients with cancer and the other in those without. The p87 molecule is bound by the Adnab-9 murine monoclonal, raised against colorectal adenoma antigens [6]. At initiation of the study, the antibody was commercially available (Dako, Carpinteria, CA, 93013, USA). We had previously refined the interrelationship of the FERAD ratio, correlating it to available online PDL-1 responses for diverse cancers [11]. Briefly, fecal and other body fluid specimens were collected after obtaining written informed consent. Inclusion criteria included willingness to participate in a long-term study, and having a routine diagnostic colonoscopy ordered by the patient’s physician. Smoking and drinking were evaluated both by quantitation comparing the means (T-test) and proportions (Chi-square). There was also a phase-2 section of the study where approximately 10% of enrollees had cold forceps colonoscopic biopsies from 6 regions of the colon [6]. These were placed in 10% buffered formalin and fixed in a paraffin block which was sectioned into 5-micron slices for immunohistochemistry. Non-fixed tissue was extracted as described previously, comparing fixed and native antigens. The follow-up repeat colonoscopy was usually after 4-5 years. Exclusion criteria were a state of health that precluded colonoscopy, the inability to annotate stool cards dates, and non-compliance.
Colonic washings (effluent) were also collected colonoscopically from aggregated pools in the rectum. Unstimulated-saliva and urine samples were likewise collected, and stored at -70 °C. In preliminary reports, stored fecal samples yielded identical results after storage for 10 years. At room temperature, p87 protein was unaffected after exposure to ambient temperatures for 6 days. This was of importance as most participants mailed in their stool cards with local mail delivery, averaging approximately 5 days. Protein determination of the fecal samples by the Lowry method was followed by ELISA testing in accordance with the manufacturers’ directions and was preceded by diluting the stool in phosphate-buffered saline. Then, 5µg protein was plated in triplicate wells of a 96-well microtiter plates. The plates were incubated overnight at 4 °C with the primary Adnab-9 antibody that binds the p87 antigen placed on half the plate and the other half with a negative control monoclonal antibody of indifferent binding to the same IgG2a epitope (UPC10) to assess background binding. Preliminary blocking of the plate by a 5% bovine serum albumin solution prevented non-specific binding. All washes between the primary and secondary antibodies applications were performed with PBS and 5% Tween-20. The reagents using the ABC technique as instructed were supplied by Vector Labs (Newark, CA 94560, USA) or by DakoCytomation Inc, (Carpinteria, 93013 USA) California, for immunohistochemistry.
The sandwich ELISA final step was to add 40µl of p-nitro-phenyl phosphate to develop a yellow-color that was read on a Thermo-Fisher (Carlsbad CA, 92008, USA) cyto-spectrophotometer at 405nm. The results were expressed as optical density (OD) minus background. If the background was high on the control wells and a 0 read resulted we treated it as 0.001. The same reagents were used to run western blots on BioRad electrophoresis equipment and transfer blotters (Hercules, CA 94547 USA) using 10% nitrocellulose gels incorporating molecular weight markers and PVDF membranes for protein transfer. The InImS markers, FERAD ratio and FERREF ratio (ferritin/p87 binding to colonic effluent) were also compared.
Wayne State University Institutional Review Board and other participating medical centers reviewed and approved the above protocols (H09-62-94). Contingency tables measuring 2 × 2 were analyzed by chi-squared and/or Fisher’s exact test. Ordinal data were analyzed by Student’s t test with statistical analyses performed using an online statistics package (Vassar Stats http://vassarstats.net/ and last access was 25 May 2025). Sensitivity, specificity, and positive predictive value were determined. Significance was determined when the probability was p<0.05.
Linear correlation was analyzed by the least-squares method. The r coefficient values were depicted on graphs where applicable. Probability values were regarded as significant at the <0.05 level. Where samples were limited, we used a 1-tailed t-test if the results were congruous with similar measured trends.
3. Results
The demographics of HIV+ patients and commonly used medications and cancer diagnoses are shown in Table 1 below.
In comparing HIV patients to controls BMI was lower (24.93±6.30 versus 28.0±6.13 kg/m2) p<0.0001. Accordingly in deference to likely lean body mass we found serum creatinine levels to be significantly lower in HIV patients as compared to controls: (0.99±0.23 versus 1.28±1.89; p<0.0001). In terms of habits, we found HIV+ patients to be heavier smokers, ) and more frequent alcohol drinkers 71.4% vs 25.1% (OR 6.0 [CI1.7-20.9]) than controls. In terms of inflammation, history of H. pylori infection was increased in HIV+ patients as compared to controls: 84.6% versus 36%; p<0.0002. The proportion of various cancers within the HIV+ group is shown below in Figure 2. What is most intriguing is the lack of stomach cancer in the HIV+ patients in Figure 2. This is particularly interesting as H. pylori is quite common in many parts of the globe where gastric cancer is rare, the so-called Asian/African enigma which begs scrutiny of first world countries.
Comparing HIV+ patients to non-cancer HIV-controls, there were no significant differences in demographics aside from lower BMI in HIV+ patients (24.93±6.3 versus 28.77±6.3 kg/m2); p<0.009. HIV patients also had lower serum creatinine (0.98±0.23 versus 1.31±2.24;p<0.0007). We found that HIV+ patients were smokers (88.9%) compared to 42% of all controls (OR 11.21 [CI1.39-90.43]; p<0.006); and 71.4% were drinkers compared to 24.7% of controls (OR 7.64 [CI2.36-24.76]; p<0.0004). Table 2 shows the demographics of the 2 control groups that were compared to the HIV+ patient parameters in Table 1.
We note that 88.9% of HIV+ patients smoked as compared to 41.4% of the cancer control group which was significant (OR15[CI1.64-37.06];p<0.008). Of the non-cancer controls only 35.8% smoked (Figure 3 below).
T-test of quantitative amounts of HIV+ smokers versus non-cancer controls (1.08±2.08 versus 0.369±0.583)p=0.028; HIV+ smokers vs cancer controls (1.08±2.08 versus 0.479±0.493);p<0.05; Cancer smoker controls 0.479±0.493 vs non cancer controls 0.369±0.583), p=0.18 2-Tailed; p=0.092 1-Tailed).
When considering alcohol, HIV+ drinkers drank more (71.4%)than non-cancer controls (24.6%) analyzed by non-ordinal Ψ-square (OR7.67[2.37-24.89]; p<0.0004. HIV+ drinkers versus cancer drinkers imbibe 24% (OR7.90[2.39-26.09]; significant at p<0.0004. Drinking non-cancer controls (24.6%) versus cancer patient controls (24%) were not significant (p=1). The aforementioned habits were probably engendered by risk-taking behavior that allows for increased HIV exposure. The lack of Health-Seeking behavior described in Table 4 below, in the HIV+ patients may be a reverse corollary to the above supposition.
Figure 3 below shows the graphic depiction of the habits of the study patients.
The numbers of cancers used as the cancer control group are shown below in Figure 4 below.
Native p87 antigen was elevated compared to controls in the ascending, transverse and descending colons (0.794±1.090 versus 0.174±0.204 respectively; p<0.003; 1.062±0.895 versus 0.206±0.383 respectively; p<0.003; and 0.611±0.223 versus 0.179±0.254 respectively; p<0.02), respectively and results are shown graphically in Figure 5 below.
H.pylori exposure was higher in HIV+ patients (85 versus 32% all controls);OR11.7[2.57-53.41];p<0.002). The difference in non-cancer controls (31%); versus HIV+ patients was also significant (OR12.35[2.69-56.7];p<0.0002; and, also for the cancer controls (34.3%); (OR10.53[2.26-49.09];p<0.0006.
Since HIV-associated inflammation is a concomitant of the disease, we looked at the various organ systems involved for a better understanding of the degree of inflammation as summarized in Table 3 below.
There do appear to be only 2 disparities in testing as shown above, mainly in significantly better lung function the reason for which is uncertain. Since only 18% of HIV+ patients had testing compared to 53% of controls, there may have been more self-selection amongst more health seeking behavior amongst the small demographic of healthier HIV+ patients. The controls include a relatively large group of lung cancer cases which may have also resulted in decreased FEV1. The higher proportion of hepatitis C is likely due to lifestyle choices in HIV+ patients. We also looked for differences regarding health seeking behavior that may shed light on patient outcomes and contrasted HIV+ patients with controls as shown in Table 4 below.

Table 4.
Health Seeking Behavior in HIV+ Patients and Controls.
| Health Seeking | Testing Sought | Outcome in HIV | Outcome in HIV- | p-Value |
|---|---|---|---|---|
| Colon | Colonoscopy | 79.0% | 57.0% | Pearson<0.014 |
| Respiratory | Influenza shot | 57.0% | 41.9% | 0.3 NSS |
| GIT | Fecal blood test | 50.0% | 47.0% | NSS |
| Metabolic | Hemoglobin A1c | 56.0% tested | 56.0%tested | 1 NSS |
| Prophylactic | ASA | 6.25% | 17.4% | NSS p=0.14 |
GIT- gastro intestinal tract; Pearson- Chi-square test. NSS-not statistically significant.
Of interest is the correlation between age and BMI which is maintained to a certain extent as can be seen in Figure 6 as opposed to that of a large group of controls in Figure 7.
There is a direct correlation between BMI and age of HIV+ patients with 2 outliers excluded. Generally, there was a correlation between BMI and age in HIV+ patients and HIV- controls at p=0.013 with equal variance and also with unequal variance if the 1-tail t-test was used.
Figure 7 is a correlation graph from a large group of HIV- controls where no correlation is evident.
Below in Figure 8 it is shown that there are no significant differences between HIV+ and HIV- controls.
Since the numbers of HIV+ patients with available vitamin D levels are small, we were not able to show significance, only a weak trend at best.
This issue of hypovitaminosis D in HIV+ patients is most intriguing. Usually, levels of vitamin D are similar in HIV+ patients as in the general population as hinted to by Figure 8 above, wherein there does not appear to be a statistical difference in our dataset.
In terms of patient survival, HIV+ patients versus non-cancer control patients showed a significant overall survival whereas cancer controls’ survival was not statistically different when compared with HIV+ patients, as can be seen in Figure 9 below.
In terms of patient survival, HIV versus non-cancer control patients showed a significant overall survival whereas cancer controls survival was not statistically different when compared with HIV patients, as can be seen in Figure 9 below.
Figure 9 is a Bar Diagram Showing a Statistically Significant Decrease in Survival Only Between HIV+ Patients and Non-Cancer Controls.
4. Discussion
Regarding HIV and the GIT, despite cART, patients suffer long-term inflammation. The causes of inflammation include gut bacterial dysbiosis [8], virus replication with multiple microenvironmental effects [9,10]. The eventual outcome is premature aging of the gut, which probably results from factors described above and other factors. Gut hyperpermeability and bacterial translocation correlates with accelerated aging and inflammation. These observations are related to localized changes in the ileum and colon rather than feces. Since Paneth cells modulate the microbiome, their products, when decreased in the colon, may have a role in gut aging and inflammation.
The average FERAD ratio in our patients was higher than in most cancers [11] and we believe that it reflects an increase in the level of activity of the InImS. The significant increase of p87 native antigen in the colon as depicted in Figure 5 supports this notion and others have published data supporting the role of an enhanced InImS predicts the restoration and recovery of mucosal immunity and may limit gut inflammation [12]. There appears to be a subtle interplay between the HIV and the gut InImS using in-vitro models of infection [13]. A recent review [14] deals with the interplay of a panoply of microbes and the InImS and metabolomic shifts [14,15,16,17] which may shed light on the increased colonic p87 expression as we have described. Simply put, the HIV organism overcomes the InImS by circumventing its initial response of suppression of protein biosynthesis, activating transcription factors like ATF4 to interfere with signaling response of the GCN2-ATF4 effector to initiate viral transcription and this viral strategy is distinct and novel [13]. We did not document CD4-T-cell status in our patients which constitutes a drawback. It should be considered that the role of Paneth cells that secrete p87 are not always beneficial as they can sense retroviral infections and their reaction may result in the induction of IL-1β production and initiate gut epithelial disruption. It is likely that the elevation of p87 could be attributed to chronic InImS activation [18] which is superior in predicting disease outcomes than viral load in the face of persistent inflammation [19]. The hijacking of anti-viral InImS mechanisms to establish persistent viral infections may be at play not only in the colon but throughout the GIT [20]. Issues of age and BMI, as we have reported above, has also been recently researched in the HIV literature including dysbiosis and translocation [20]. Others have reevaluated HIV versus BMI [21] which we have also investigated and found a correlation as seen in Figure 6 for HIV patients and no correlation for controls as seen in Figure 7.
While many use InImS biomarkers to predict mortality [11], we used InImS Paneth cell markers to assess expression directly at the tissue level and found that most of its colonic expression is significantly increased in the colons of HIV+ patients compared to controls. Pro-inflammatory Independent pathologist assessment of inflammatory cells within the HIV affected colons are also significantly increased, supporting the notion that the InImS may be driving the inflammation. Proinflammatory habits such as smoking and drinking alcohol may contribute to the increase in HIV+ patients where these habits are more prevalent. The decrease in creatinine in HIV+ patients may be due to the lower BMI, suggesting decreased muscle mass. Since oral folic acid can decrease fecal p87 [7], we may be able to intervene and detect impaired InImS pattern recognition gut inflammation [22], suggesting an additional advantage of mortality reduction and prediction [5].
We also need to be cognizant that hypovitaminosis D serves as an independent risk marker for cardiovascular disease and metabolic disorders but the exact interventions are yet to be defined [23,24,25].
There is a subtle interplay between Vitamin D and HIV disease on many fronts, set in motion by the binding of Vitamin D with its receptor releasing SNPs within pathways conferring resistance to HIV and reducing inflammation, pulmonary TB and mortality [23]. In the InImS affecting macrophages, by increasing cathelicidin, a molecular weight antimicrobial peptide which originates from the CAMP gene resulting in a LL39 moiety, activated by proteinase K by cleavage and the action of leukocytes and is immunomodulatory and synergistic with interferon alfa [24]. It has therefore been suggested that pre-treatment of hypovitaminosis D for HIV patients treated with efavirenz [25] and tenofovir who may also have co-infection with hepatitis C. The Institute of Medicine aims for effectiveness at a 20ng/ml level [24], a level achieved by our controls but not our HIV+ patients (Figure 8). This immune modulation of vitamin D and has reported both in replate and non-replete scenarios [26,27,28,29,30].
5. Conclusions
The exposure of humans to HIV is staggering with a projected prevalence of 36.7 million with a strong likelihood that hypovitaminosis D intensifies the disease by degrading the immune system and is theoretical remediable [23,24,25]. It has been pointed out that hypovitaminosis D afflicts both the HIV and general population similarly but risk factors vary, inditing both cART and factors resulting in hypovitaminosis D. Most-pointedly, non-nucleoside reverse transcriptase inhibitors, with the possible exclusion of zidovudine [22], with linkage of hypovitaminosis D with CD4 counts [23]. There have been inroads made in HIV treatment in more affluent societies which have apparently not been spared from the effects of hypovitaminosis D in at-risk populations [31].
Author Contributions
Conceptualization, M.T. and M.C.; methodology, M-AR.; software, M.T; validation, M-P.M.; formal analysis, M.B.; investigation, J.H.; resources, B.M.; data curation, M-AR.; writing—original draft preparation, M.T.; writing—review and editing, M.T.; M.L; visualization, M.T.; supervision, M-AR; project administration, B.M. All authors have read and agreed to the published version of the manuscript.
Funding
This work did not receive external funding.
Institutional Review Board Statement
The study was conducted in accordance of the Declaration of Helsinki and approved by the Institutional Review Board of Wayne State University School of Medicine protocol code H09-62-94.
Informed Consent Statement
Informed consent was obtained from all the participants under the auspices of the Wayne State University School of Medicine Institutional Review Board.
Acknowledgments
The opinions expressed in this paper do not necessarily reflect those of the US Federal Government. We are grateful to the R&D Departments of the VA centers for their support. We are grateful for the help of our librarian Andrea Snyer. While this paper is dedicated to the hemophiliac population who were initially severely affected by the HIV pandemic particularly the Spanish and Israeli patients, we have to laud one outstanding figure, Dr. Luiz Fernando Bare, the Vice-President of the World Federation of Hemophilia who died of AIDS on Tuesday, July 24, 1984. Luiz was a dedicated physician who single-handedly, and against all odds, ran a cryoprecipitate facility in his home country of Brazil, despite his contracting HIV, as he himself had hemophilia. We pled his case for assistance before the President of the World Federation of Hemophilia (WFH), Frank Schnabel who helped overcome the local opposition to Luiz’s and his facility, which was producing low-cost and relatively safe reagents for local hemophiliacs without heeding the fierce opposition arrayed against him. Frank later wrote of Luiz to his mentor, Dr. Augusto Gonzaga and Luiz’s parents.The WFH have lost a courageous crusader. Luiz Fernando is a saintly man. Where did he find the energy to sustain himself beyond the limits of human endurance? Where did he find so much compassion? Where did he find such a commitment to life, so profound that Luiz Fernando overcame exhaustion and fatigue. These sacrifices could never overwhelm his spirit- only his immune system. Without a moment’s thought of himself he gave his life so others might survive. The WFH has its first martyr and its first hero. To the Brazilian hemophiliacs who have lost their brother we share your grief. Though Luiz Fernando no longer walks amongst us his spirit will always live in our hearts”. To be sure, there were fatalities in hemophiliacs before the AIDS pandemic. One, Mark Antony Barnett was a plucky individual who refused to allow his disability to dictate his young life, which sadly ended 4/6/1975, while he was still in his teens. He was commemorated by his Betar Scout group with a Sports Day, a year after his passing.
Data Availability Statement
Data Availability Statement: Data Availability Statements are available in the VHA directive 1200.12 of 3/9/2009. The VHA Handbook addresses both the use of data for research and the clinicalThe authors declare no conflict of interests. and administrative data repositories for research. It also addresses the development and use of data research repositories.
Conflicts of Interest
The authors declare no conflict of interest.
References
- Zakowski, P; Fligiel, S; Berlin, OGW; Johnson, BL. Disseminated Mycobacterium avium-intracellulare Infection in Homosexual Men Dying of Acquired Immunodeficiency. JAMA. 1982, 248, 2980–2982. [Google Scholar] [CrossRef]
- Grody, WW; Fligiel, S; Naeim, F. Thymus involution in the acquired immunodeficiency syndrome. Am J Clin Pathol 1985, 84, 85–95. [Google Scholar] [CrossRef] [PubMed]
- Nash, G; Fligiel, S. Kaposi’s sarcoma presenting as pulmonary disease in the acquired immunodeficiency syndrome: diagnosis by lung biopsy. Hum Pathol. 1984, 15, 999–1001. [Google Scholar] [CrossRef] [PubMed]
- Nash, G; Fligiel, S. Pathologic features of the lung in the acquired immune deficiency syndrome (AIDS): an autopsy study of seventeen homosexual males. Am J Clin Pathol 1984, 81, 6–12. [Google Scholar] [CrossRef] [PubMed]
- Hunt, PW; Sinclair, E; Rodriguez, B; et al. Gut epithelial barrier dysfunction and innate immune activation predict mortality in treated HIV infection. J Infect Dis. 2014, 210, 1228–38. [Google Scholar] [CrossRef] [PubMed] [PubMed Central]
- Tobi, M; Antaki, F; Rambus, M-A; et al. The Non-Invasive Prediction of Colorectal Neoplasia [NIPCON] Study 1995-2022: A comparison of fecal Guaiac-based FOBT and an Anti-Adenoma Antibody, Adnab-9. Int J Med Sci 2023, 24, 17257. [Google Scholar] [CrossRef]
- Tobi, M; Khoury, N; Al-Subee, O; Sethi, S; Talwar, H; Kam, M; Hatfield, J; Levi, E; Hallman, J; Moyer, MP; Kresty, L; Lawson, MJ; McVicker, B. Predicting Regression of Barrett’s Esophagus-Can All the King’s Men Put It Together Again? Biomolecules 2024, 14(9), 1182. [Google Scholar] [CrossRef] [PubMed] [PubMed Central]
- Singh, S; Giron, LB; Shaikh, MW; et al. Distinct intestinal microbial signatures linked to accelerated systemic and intestinal biological aging. Microbiome 2024, 12(1), 31. [Google Scholar] [CrossRef] [PubMed] [PubMed Central]
- Moyer, MP; Huot, RI; Ramirez, A, Jr.; Joe, S; Meltzer, MS; Gendelman, HE. Infection of human gastrointestinal cells by HIV-1. AIDS Res Hum Retroviruses 1990, 6(12), 1409–15. [Google Scholar] [CrossRef] [PubMed]
- Moyer, MP; Gendelman, HE. HIV replication and persistence in human gastrointestinal cells cultured in vitro. J Leukoc Biol 1991, 49(5), 499–504. [Google Scholar] [CrossRef] [PubMed]
- Tobi, M; Talwar, H; Rossi, NF; Lockette, W; McVicker, B. A Practical Format to Organize Cancer Constellations Using Innate Immune System Biomarkers: Implications for Early Diagnosis and Prognostication. Int J Transl Med (Basel) 2024, 4, 726–739. [Google Scholar] [CrossRef] [PubMed] [PubMed Central]
- Verhoeven, D; George, MD; Hu, W; et al. Enhanced innate antiviral gene expression, IFN-α, and cytolytic responses are predictive of mucosal immune recovery during simian immunodeficiency virus infection. J Immunol. 2014, 192, 3308–18. [Google Scholar] [CrossRef] [PubMed] [PubMed Central]
- Jiang, G; Santos Rocha, C; Hirao, LA; Mendes, EA; Tang, Y; Thompson, GR, 3rd; Wong, JK; Dandekar, S. HIV Exploits Antiviral Host Innate GCN2-ATF4 Signaling for Establishing Viral Replication Early in Infection. mBio 2017, 8(3), e01518-16, Cell culture. [Google Scholar] [CrossRef] [PubMed] [PubMed Central]
- Fraschilla, I; Evavold, CL. Biting the hand that feeds: Metabolic determinants of cell fate during infection. Front Immunol 2022, 13, 923024. [Google Scholar] [CrossRef] [PubMed]
- Hortin, GL; Landt, M; Powderly, WG. Changes in plasma amino acid concentrations in response to HIV-1 infection. Clin Chem 1994, 40(5), 785–9. [Google Scholar] [CrossRef] [PubMed]
- Dröge, W; Murthy, KK; Stahl-Hennig, C; et al. Plasma amino acid dysregulation after lentiviral infection. AIDS Res Hum Retroviruses 1993, 9(9), 807–9. [Google Scholar] [CrossRef] [PubMed]
- Stone, JD; Heise, CC; Miller, CJ; Halsted, CH; Dandekar, S. Development of malabsorption and nutritional complications in simian immunodeficiency virus-infected rhesus macaques. AIDS 1994, 8(9), 1245–56. [Google Scholar] [CrossRef] [PubMed]
- Hirao, LA; Grishina, I; Bourry, O; et al. Early mucosal sensing of SIV infection by Paneth cells induces IL-1β production and initiates gut epithelial disruption. PLoS Pathog 2014, 10(8), e1004311. [Google Scholar] [CrossRef] [PubMed] [PubMed Central]
- Lv, T; Cao, W; Li, T. HIV-Related Immune Activation and Inflammation: Current Understanding and Strategies. J Immunol Res. 2021, 2021, 7316456. [Google Scholar] [CrossRef] [PubMed] [PubMed Central]
- Brenchley, JM; Price, DA; Schacker, TW; et al. Microbial translocation is a cause of systemic immune activation in chronic HIV infection. Nat Med 2006, 12(12), 1365–71. [Google Scholar] [CrossRef] [PubMed]
- Hill, SV; Hao, J; Newlin-Bradner, M; Long, DM; Budhwani, H; Simpson, T. Re-evaluating the relationship between youth with HIV and BMI in an age of increasing rates of overweight and obese youth. BMC Res Notes 2024, 17, 97. [Google Scholar] [CrossRef] [PubMed] [PubMed Central]
- Glavan, TW; Gaulke, CA; Santos Rocha, C; et al. Gut immune dysfunction through impaired innate pattern recognition receptor expression and gut microbiota dysbiosis in chronic SIV infection. Mucosal Immunol 2016, 9(3), 677–88. [Google Scholar] [CrossRef] [PubMed] [PubMed Central]
- Jiménez-Sousa, MÁ; Martínez, I; Medrano, LM; Fernández-Rodríguez, A; Resino, S. Vitamin D in Human Immunodeficiency Virus Infection: Influence on Immunity and Disease. Front Immunol 2018, 9, 458. [Google Scholar] [CrossRef] [PubMed] [PubMed Central]
- Yin, M. Vitamin D, bone, and HIV infection. Top Antivir Med 2012, 20(5), 168–72. [Google Scholar] [PubMed] [PubMed Central]
- Comsey, GA. Association between initiation of antiretroviral therapy with efavirenz and decreases in 25-hydroxyvitamin D. Antivir Ther. 2019, 15, 425–429. [Google Scholar]
- Qurban, R; Saeed, S; Kanwal, W; Junaid, K; Rehman, A. Potential immune modulatory effect of vitamin D in HIV infection: A review. Clin Nutr ESPEN 2022, 47, 1–8. [Google Scholar] [CrossRef] [PubMed]
- Griffin, AT; Arnold, FW. Review of metabolic, immunologic, and virologic consequences of suboptimal vitamin D levels in HIV infection. AIDS Patient Care STDS.;Epub 2012, 26, 516–25. [Google Scholar] [CrossRef] [PubMed]
- Pinzone, MR; Di Rosa, M; Malaguarnera, M; et al. Vitamin D deficiency in HIV infection: an underestimated and undertreated epidemic. Eur Rev Med Pharmacol Sci. 2013, 17, 1218–32. [Google Scholar] [PubMed]
- Orkin, C; Wohl, DA; Williams, A; Deckx, H. Vitamin D deficiency in HIV: a shadow on long-term management? AIDS Rev 2014, 16(2), 59–74. [Google Scholar] [PubMed]
- Mody, A; Bartz, S; Hornik, CP; et al. Effects of HIV infection on the metabolic and hormonal status of children with severe acute malnutrition. PLoS One 2014, 9(7), e102233. [Google Scholar] [CrossRef] [PubMed] [PubMed Central]
- Mueller, NJ; Fux, CA; Ledergerber, B; et al. Swiss HIV Cohort Study. High prevalence of severe vitamin D deficiency in combined antiretroviral therapy-naive and successfully treated Swiss HIV patients. AIDS 2010, 24(8), 1127–34. [Google Scholar] [CrossRef] [PubMed]
Figure 1.
Overview of the Study from which the Patients and Controls were Drawn.
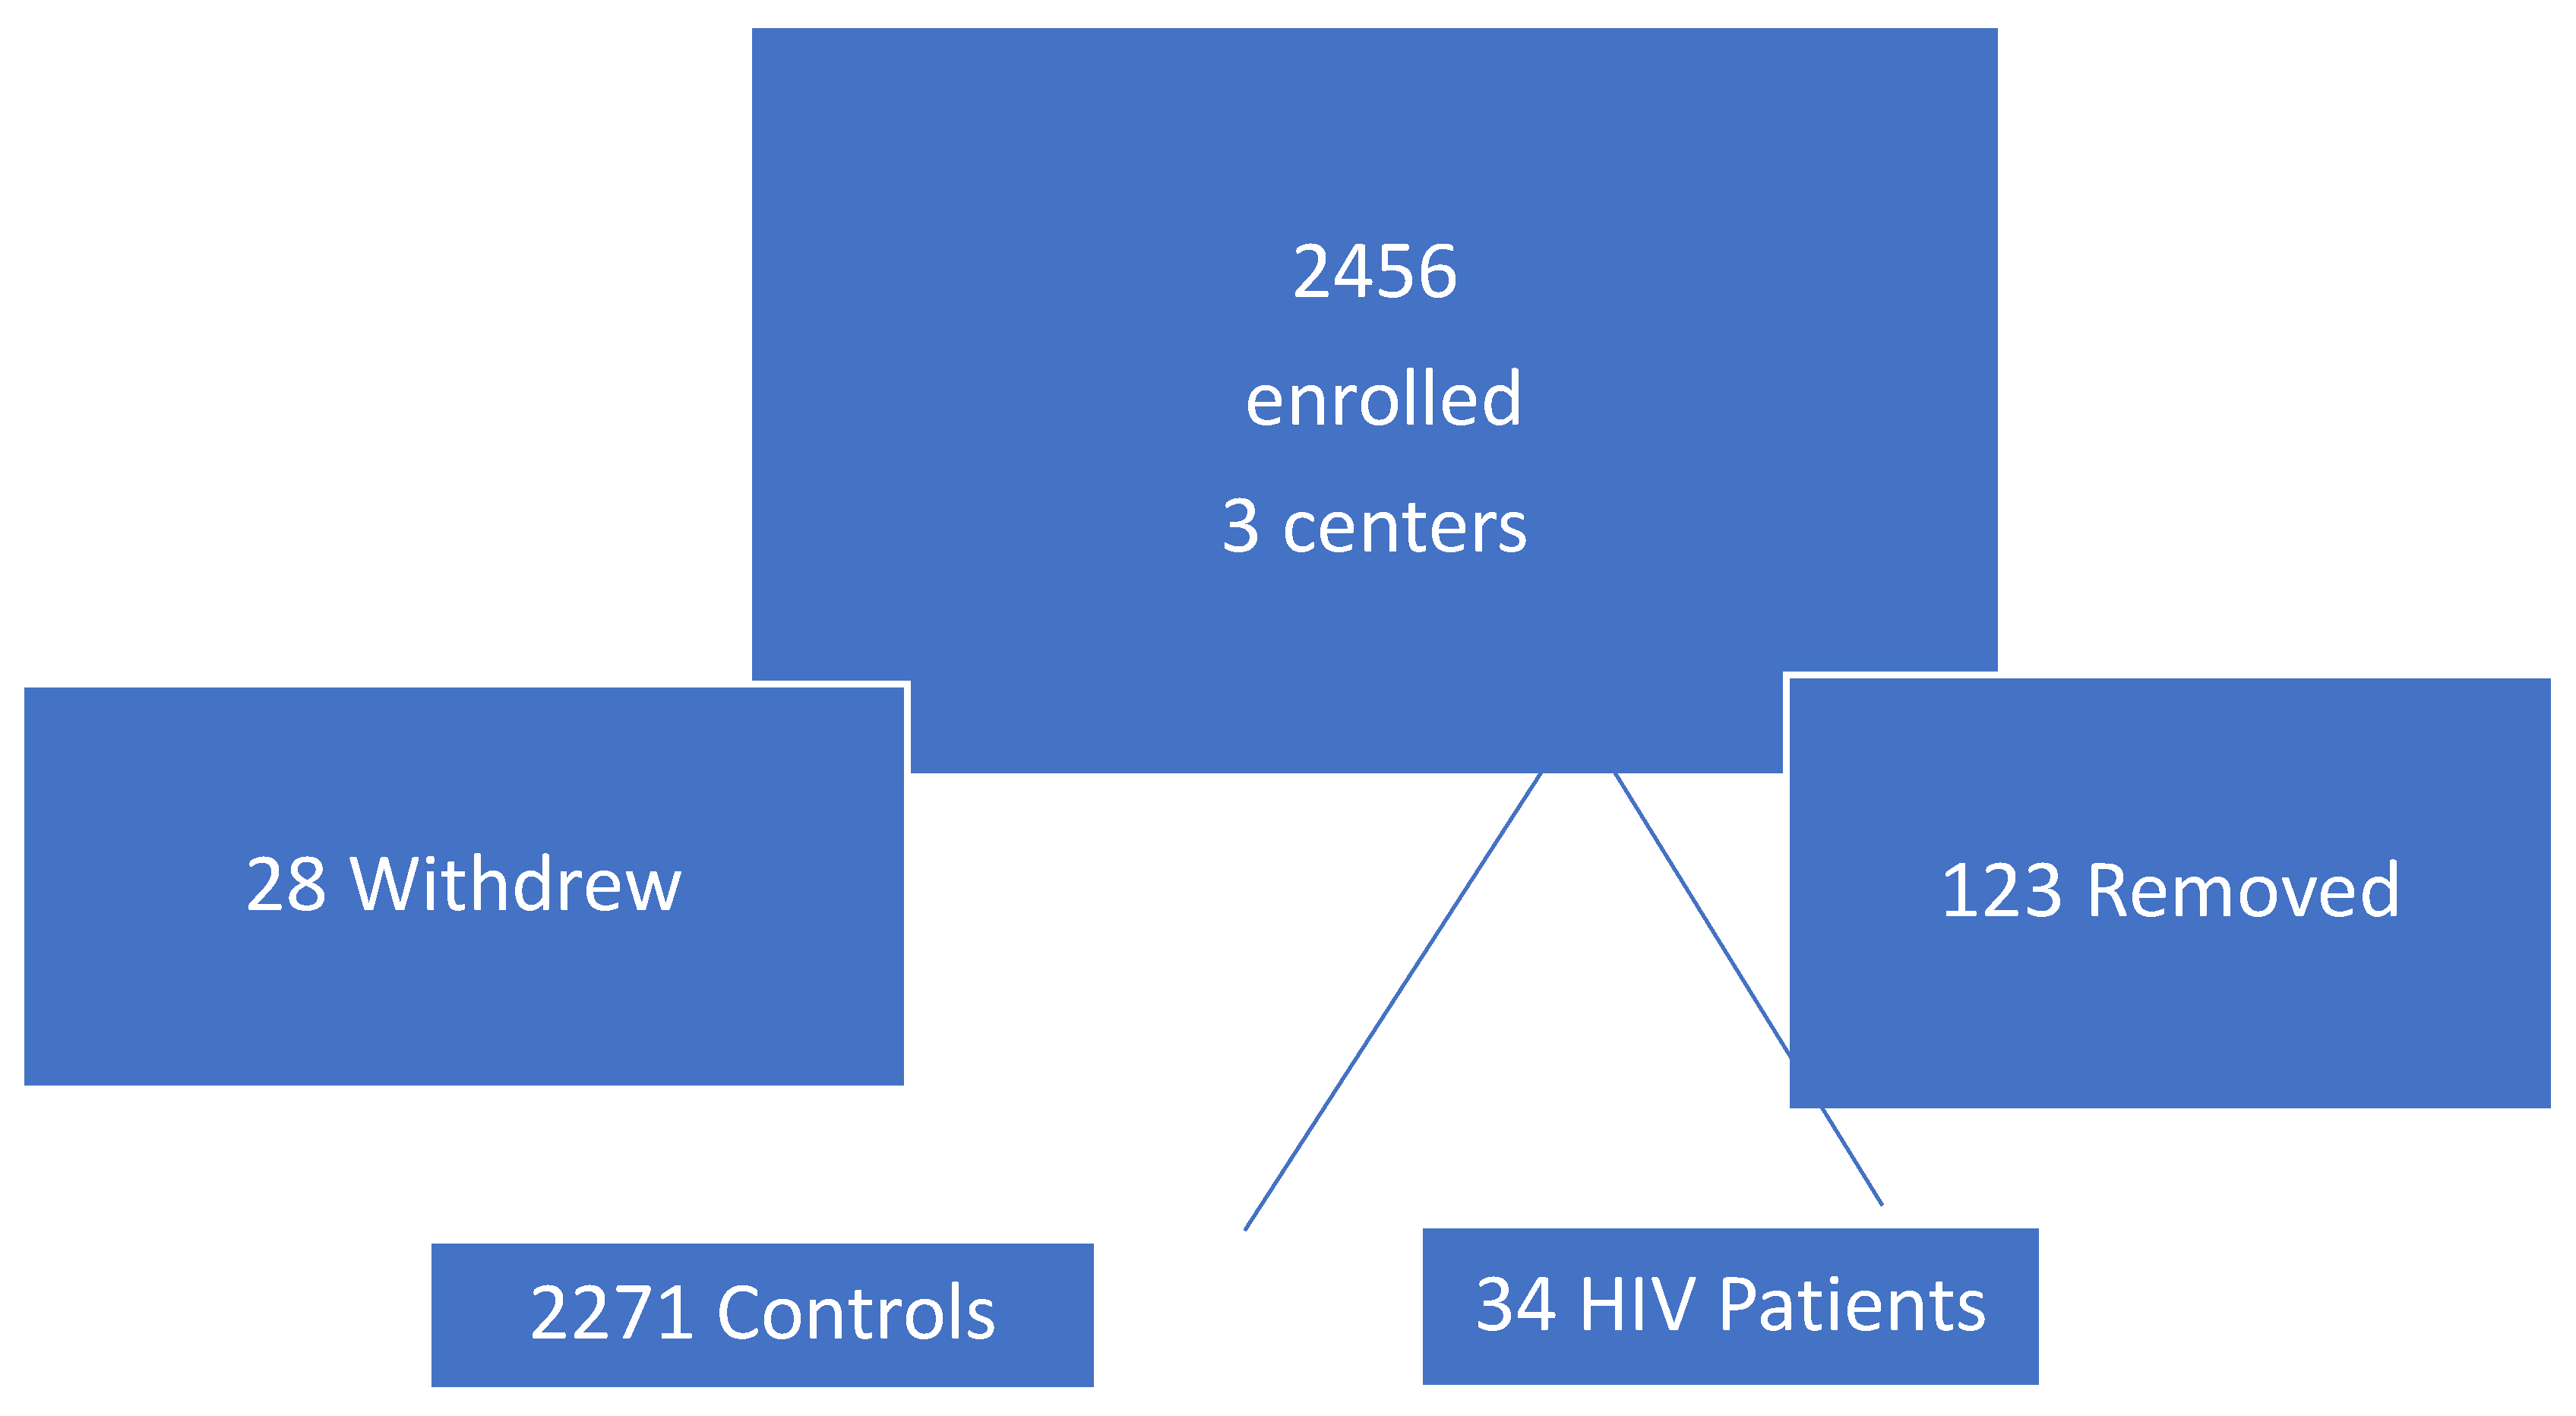
Figure 2.
is a Pie Chart Showing the Breakdown of the Various Cancers in the HIV Group.
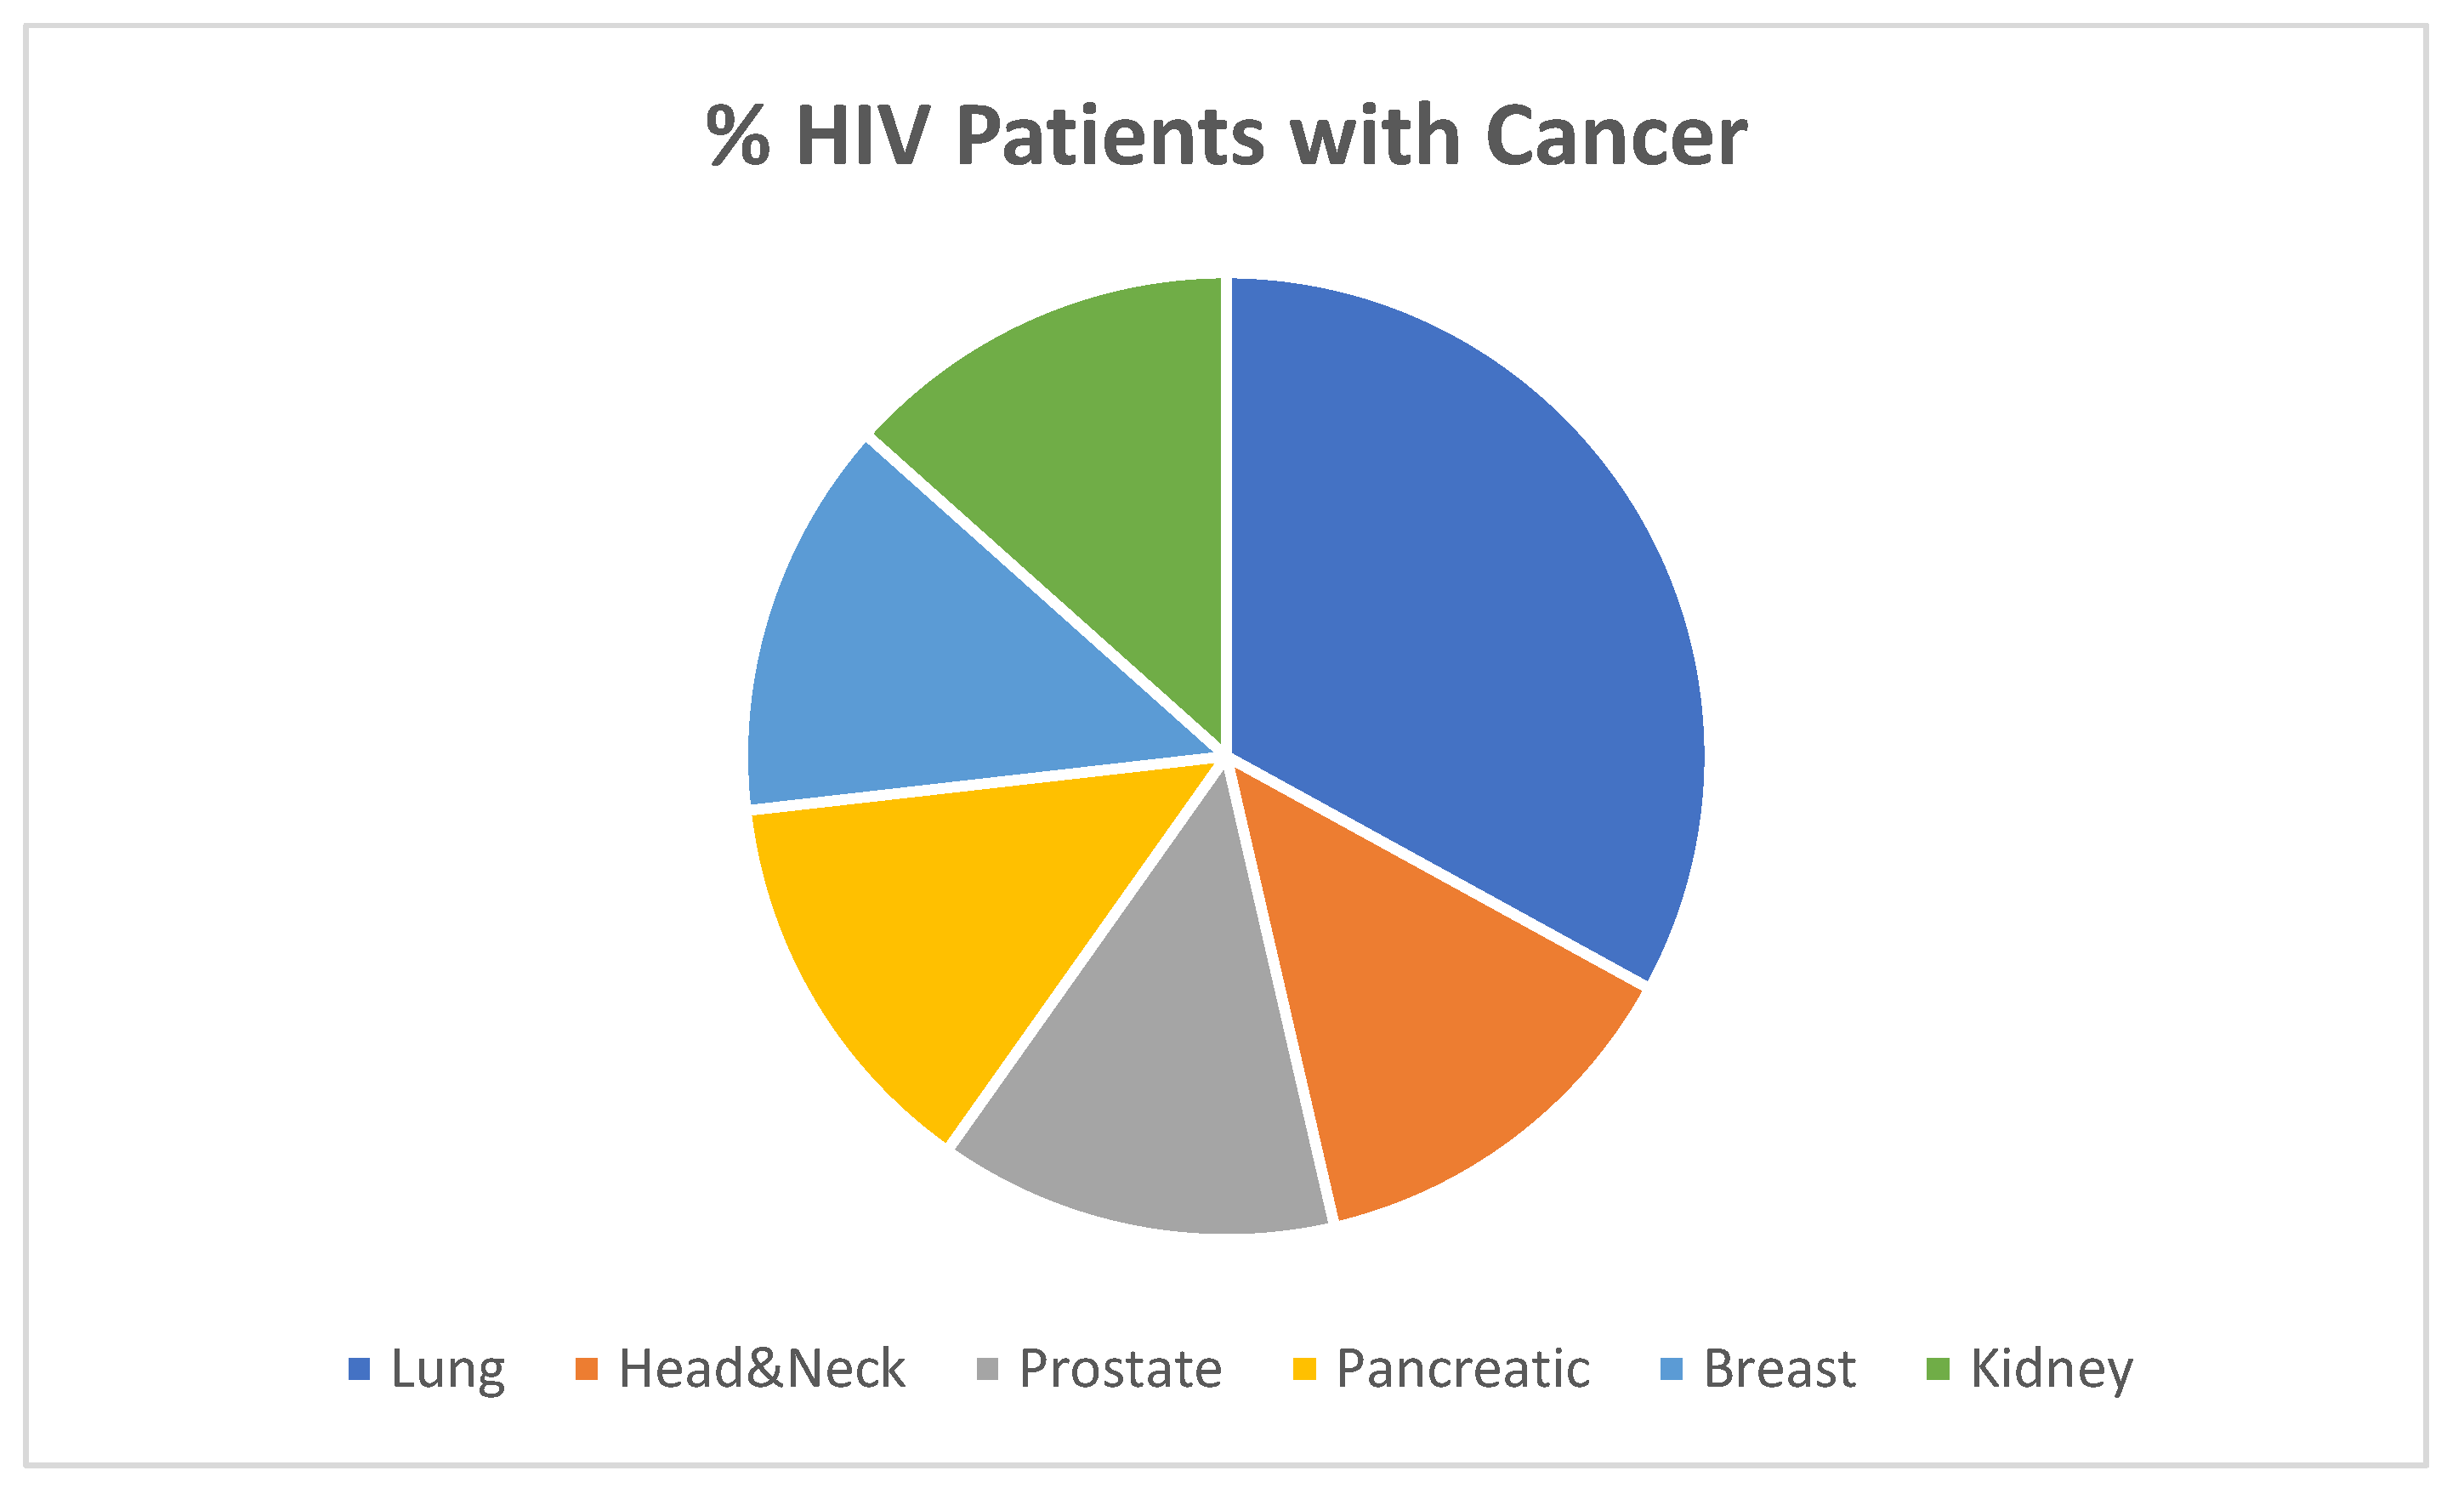
Figure 3.
A Bar Diagram of Active Smokers and Drinkers.
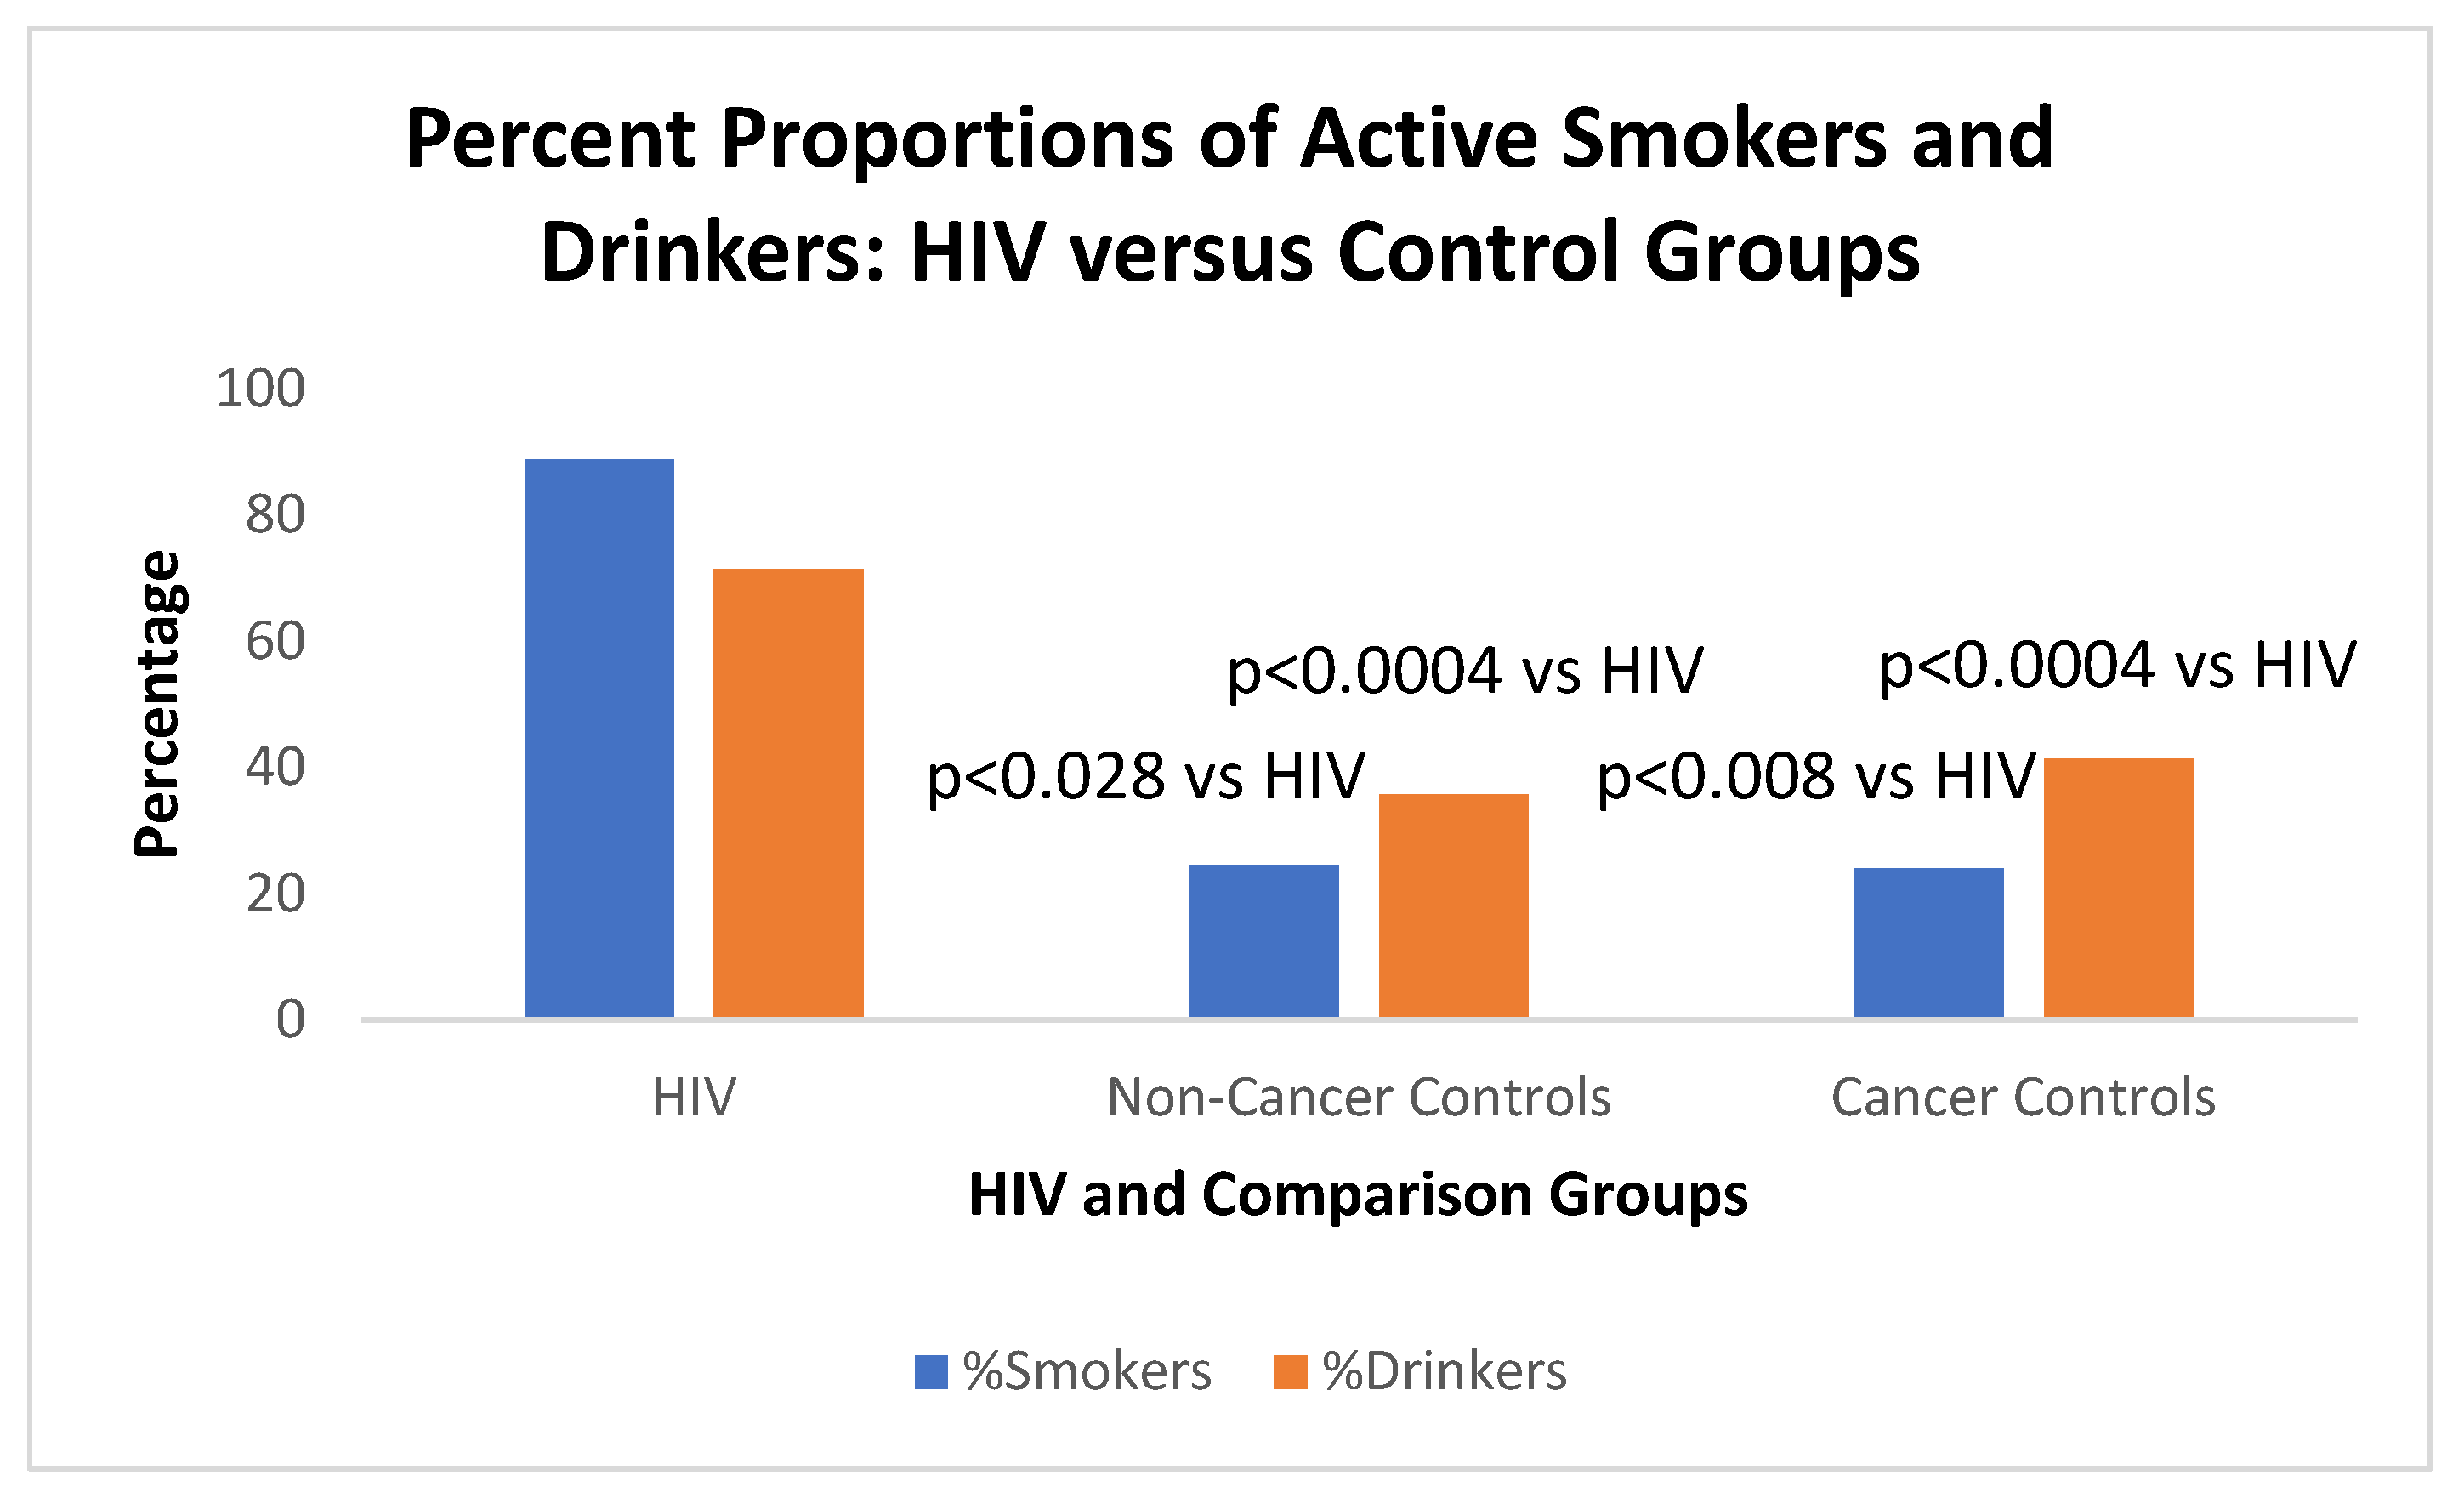
Figure 4.
A Bar Diagram showing the cancer control numbers in decreasing numbers from each grouping.
Figure 4.
A Bar Diagram showing the cancer control numbers in decreasing numbers from each grouping.
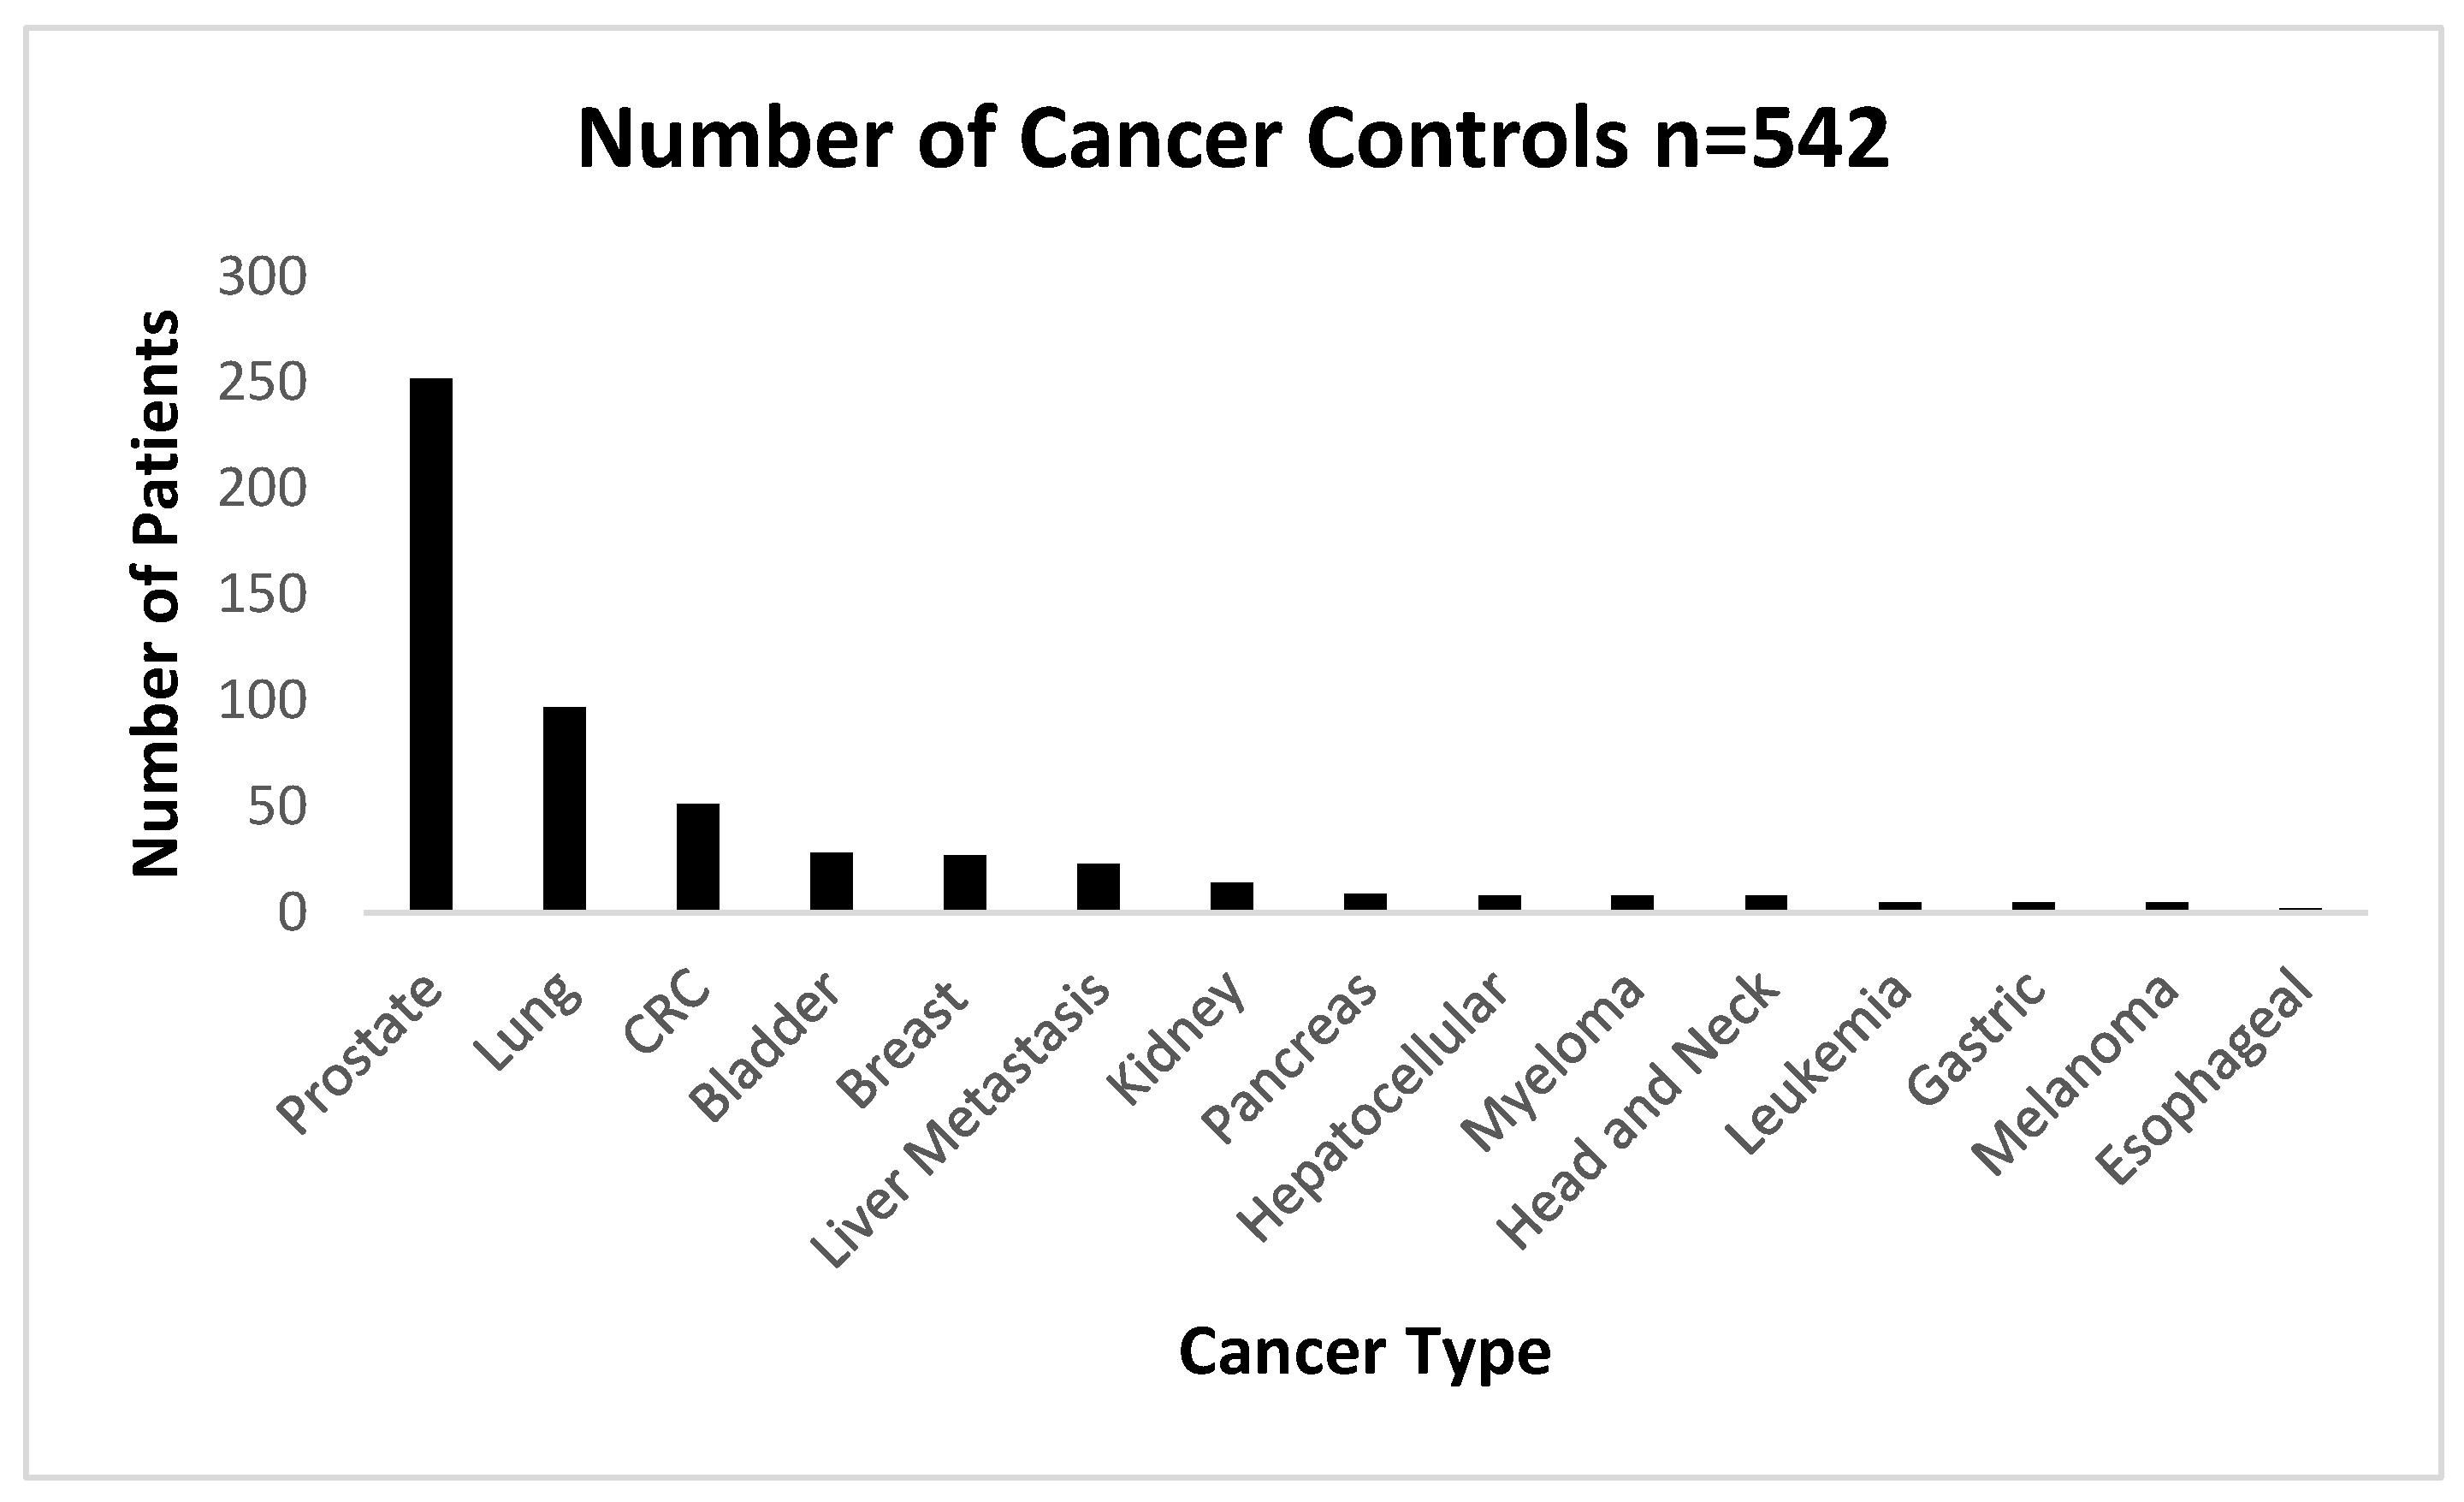
Figure 5.
Bar Diagrams show that HIV+ Patients had significantly higher p87 antigen levels in all regions of the mid-colon, when compared to controls.
Figure 5.
Bar Diagrams show that HIV+ Patients had significantly higher p87 antigen levels in all regions of the mid-colon, when compared to controls.
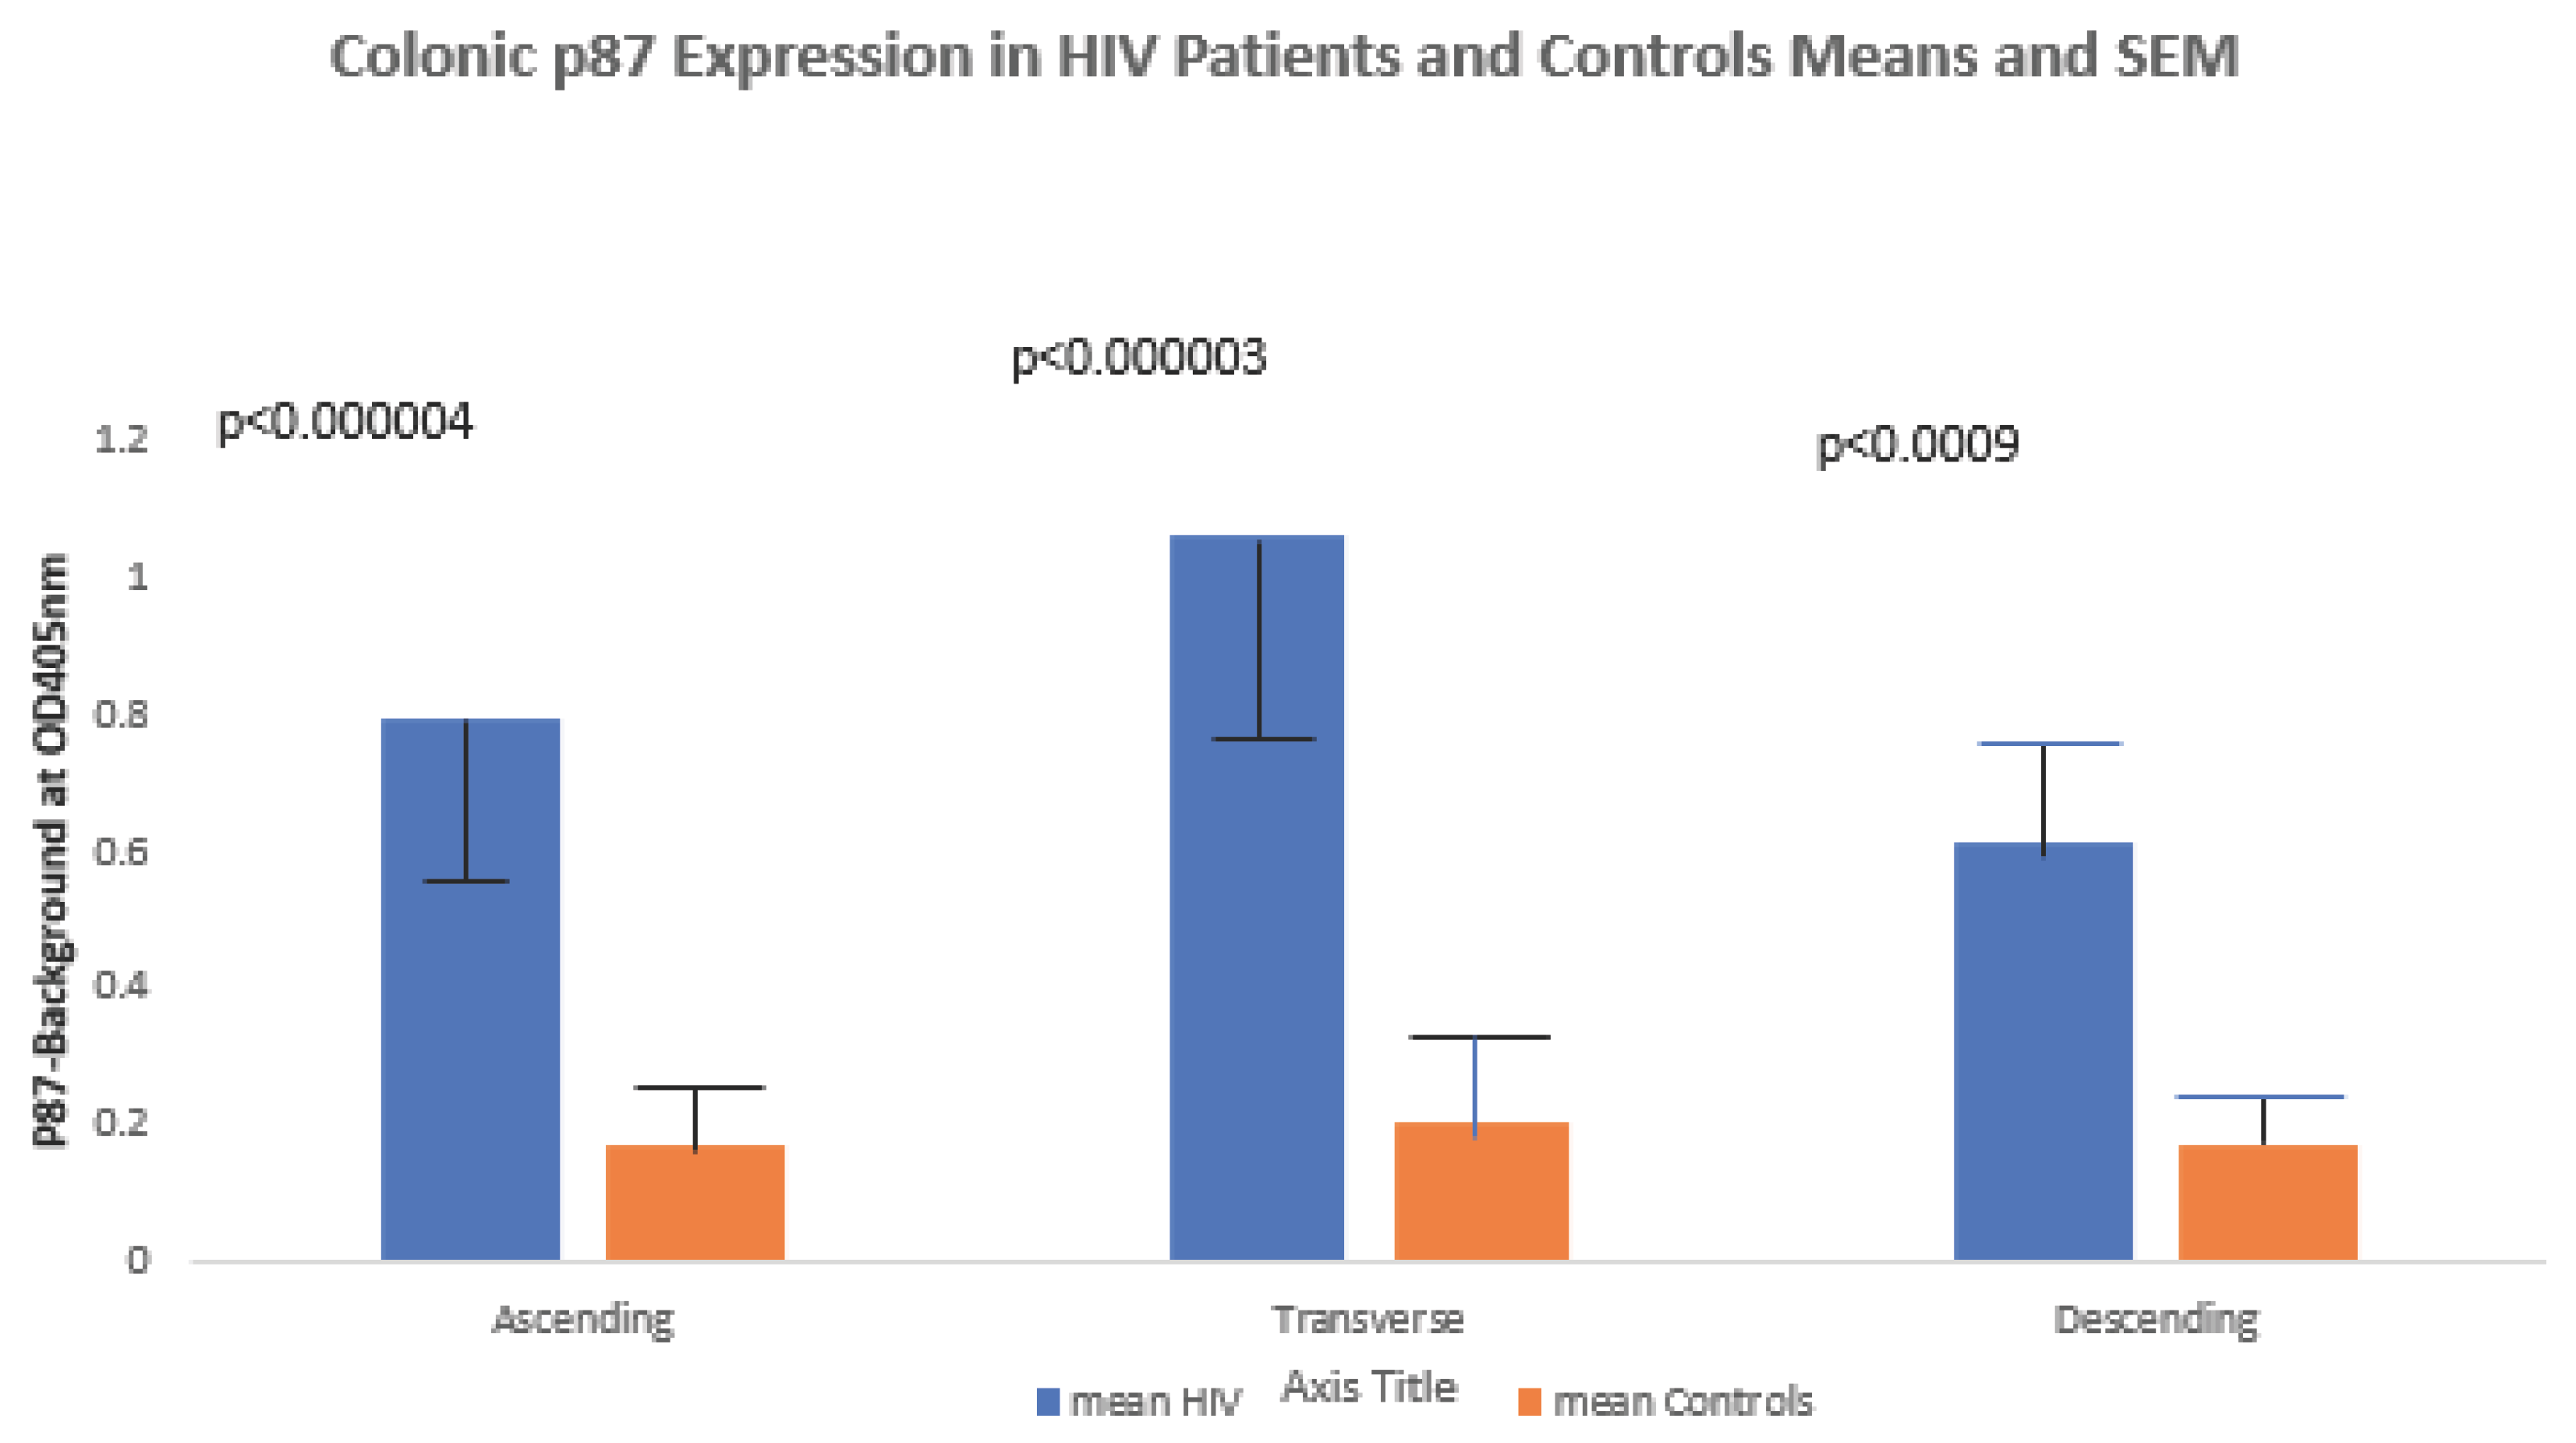
Figure 6.
Shows a direct correlation between BMI and Age in HIV+ patients.
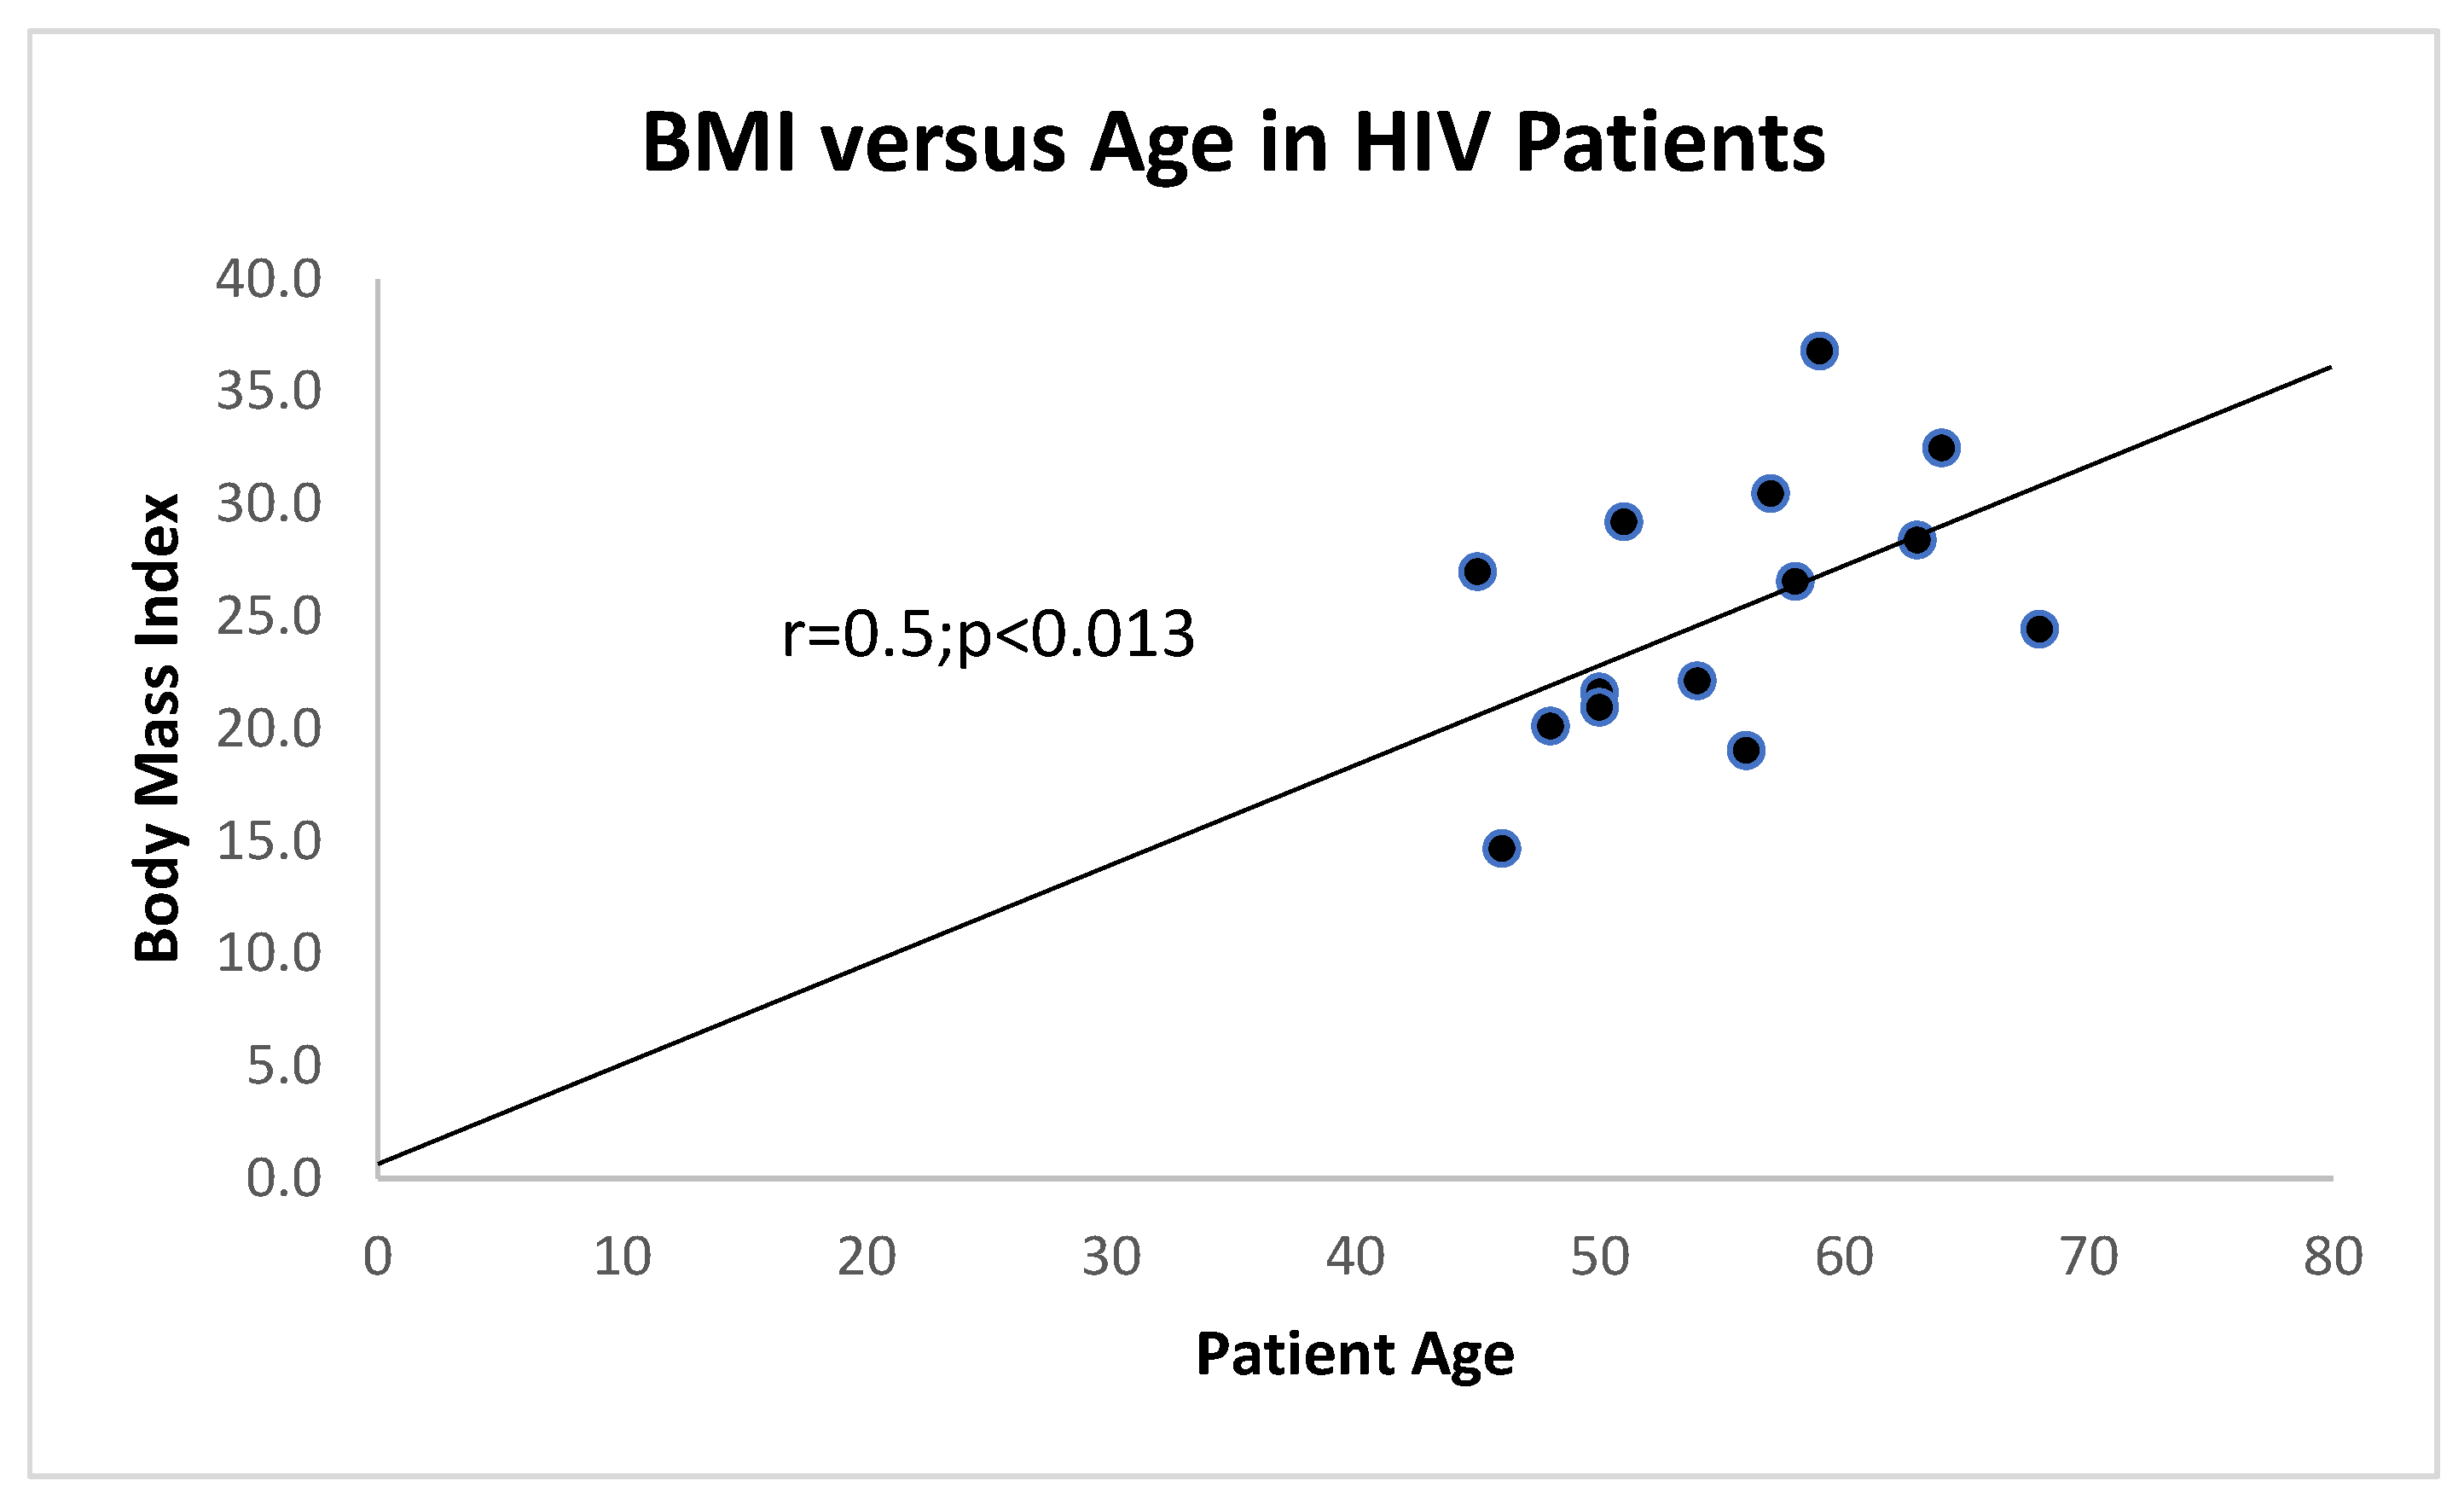
Figure 7.
is a Scattergram depicting a non-significant correlation between BMI and Age in controls. In contrast to Figure 6, where there was a positive correlation between BMI and age in HIV+ and HIV- controls.
Figure 7.
is a Scattergram depicting a non-significant correlation between BMI and Age in controls. In contrast to Figure 6, where there was a positive correlation between BMI and age in HIV+ and HIV- controls.
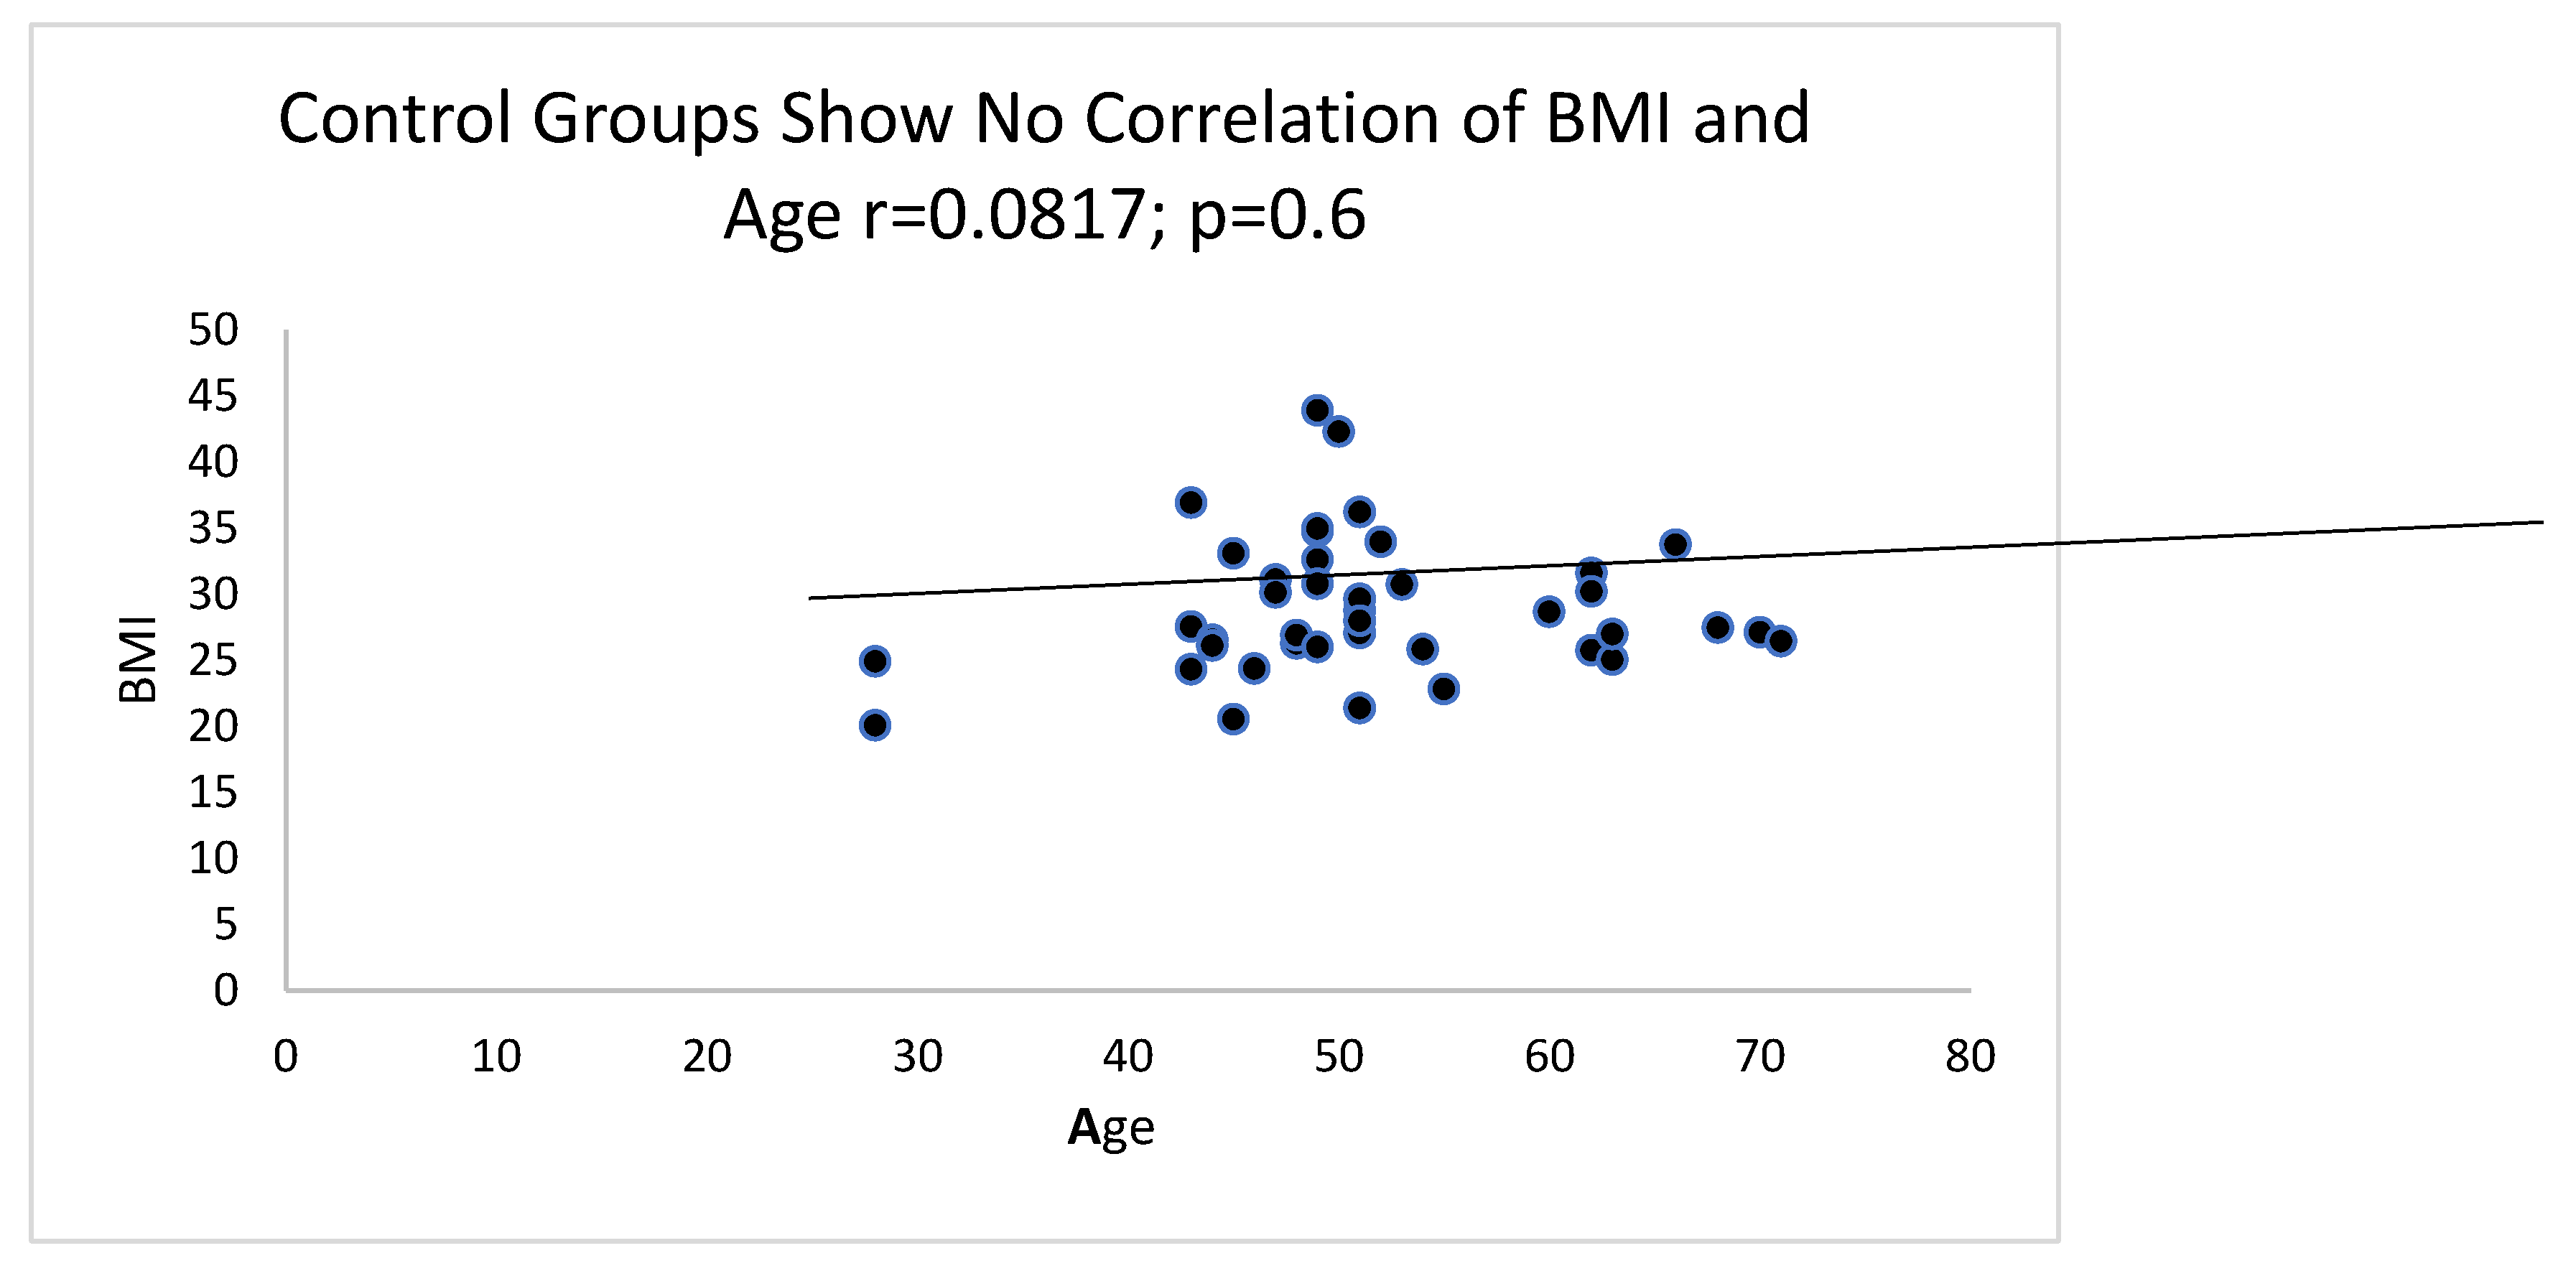
Figure 8.
Bar Diagram Showing Lower Vitamin D Levels in HIV+ Patients.
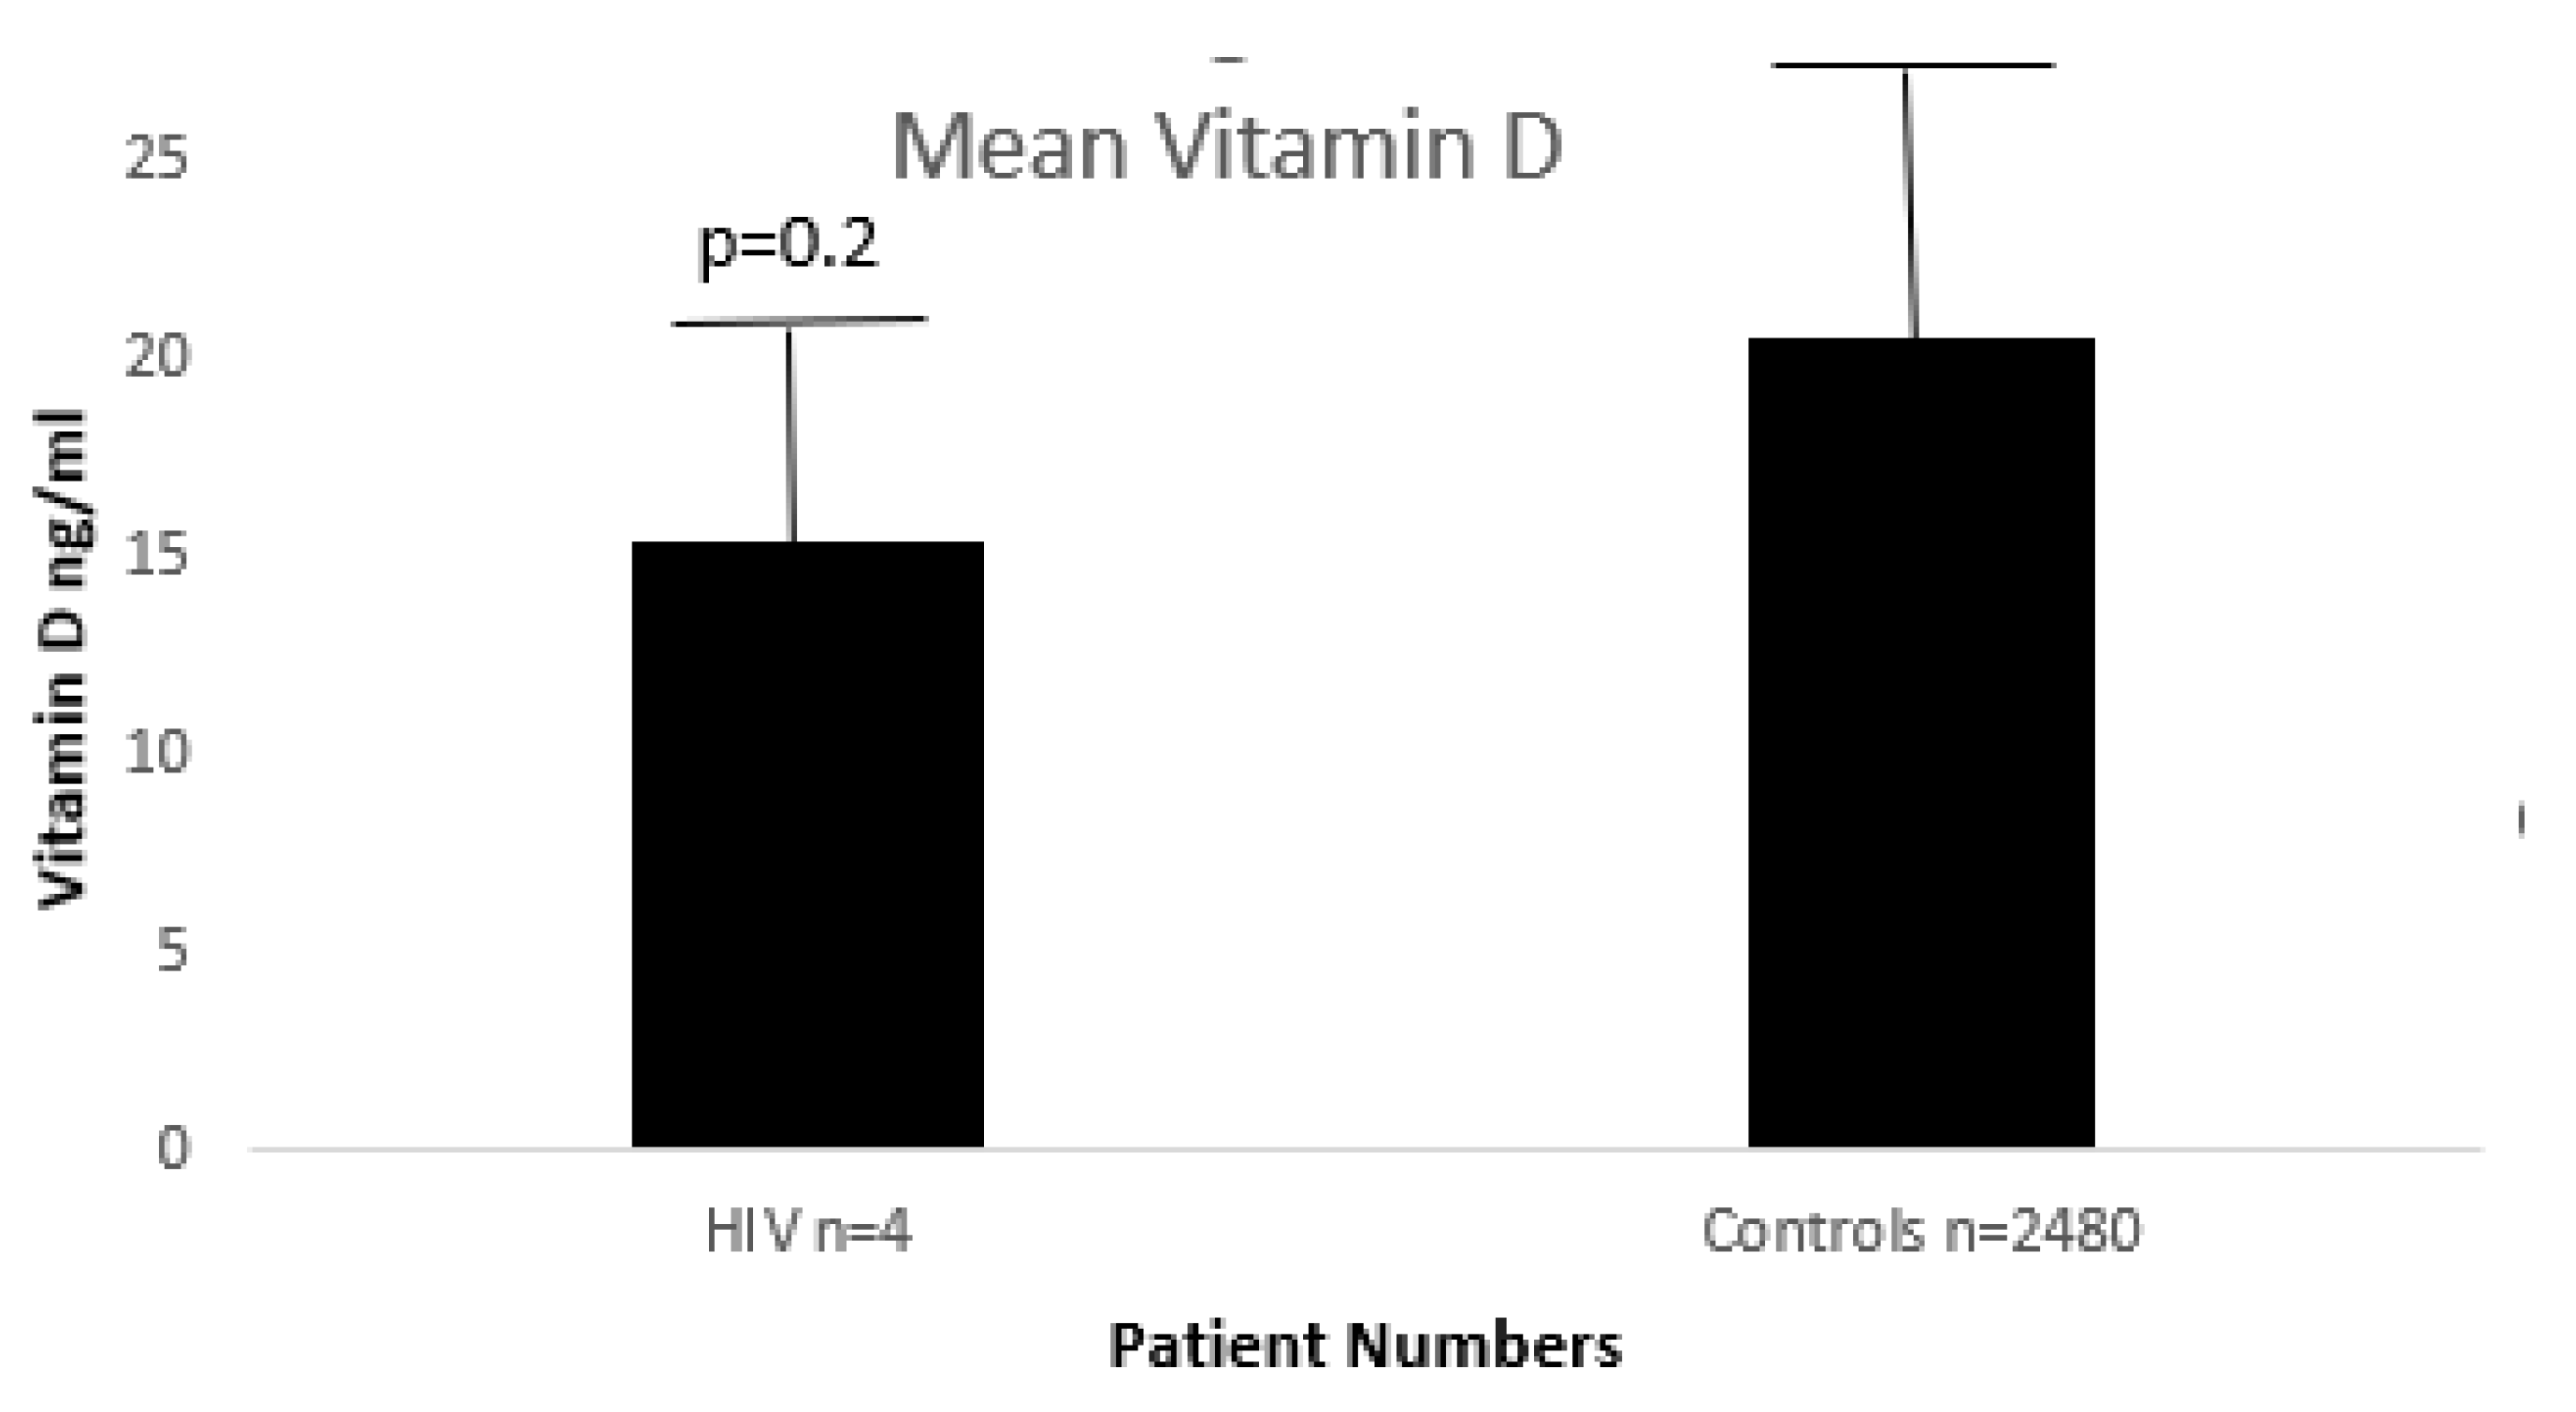
Figure 9.
A Bar Diagram Showing Similar Mean Values of Vitamin D in HIV and Controls.
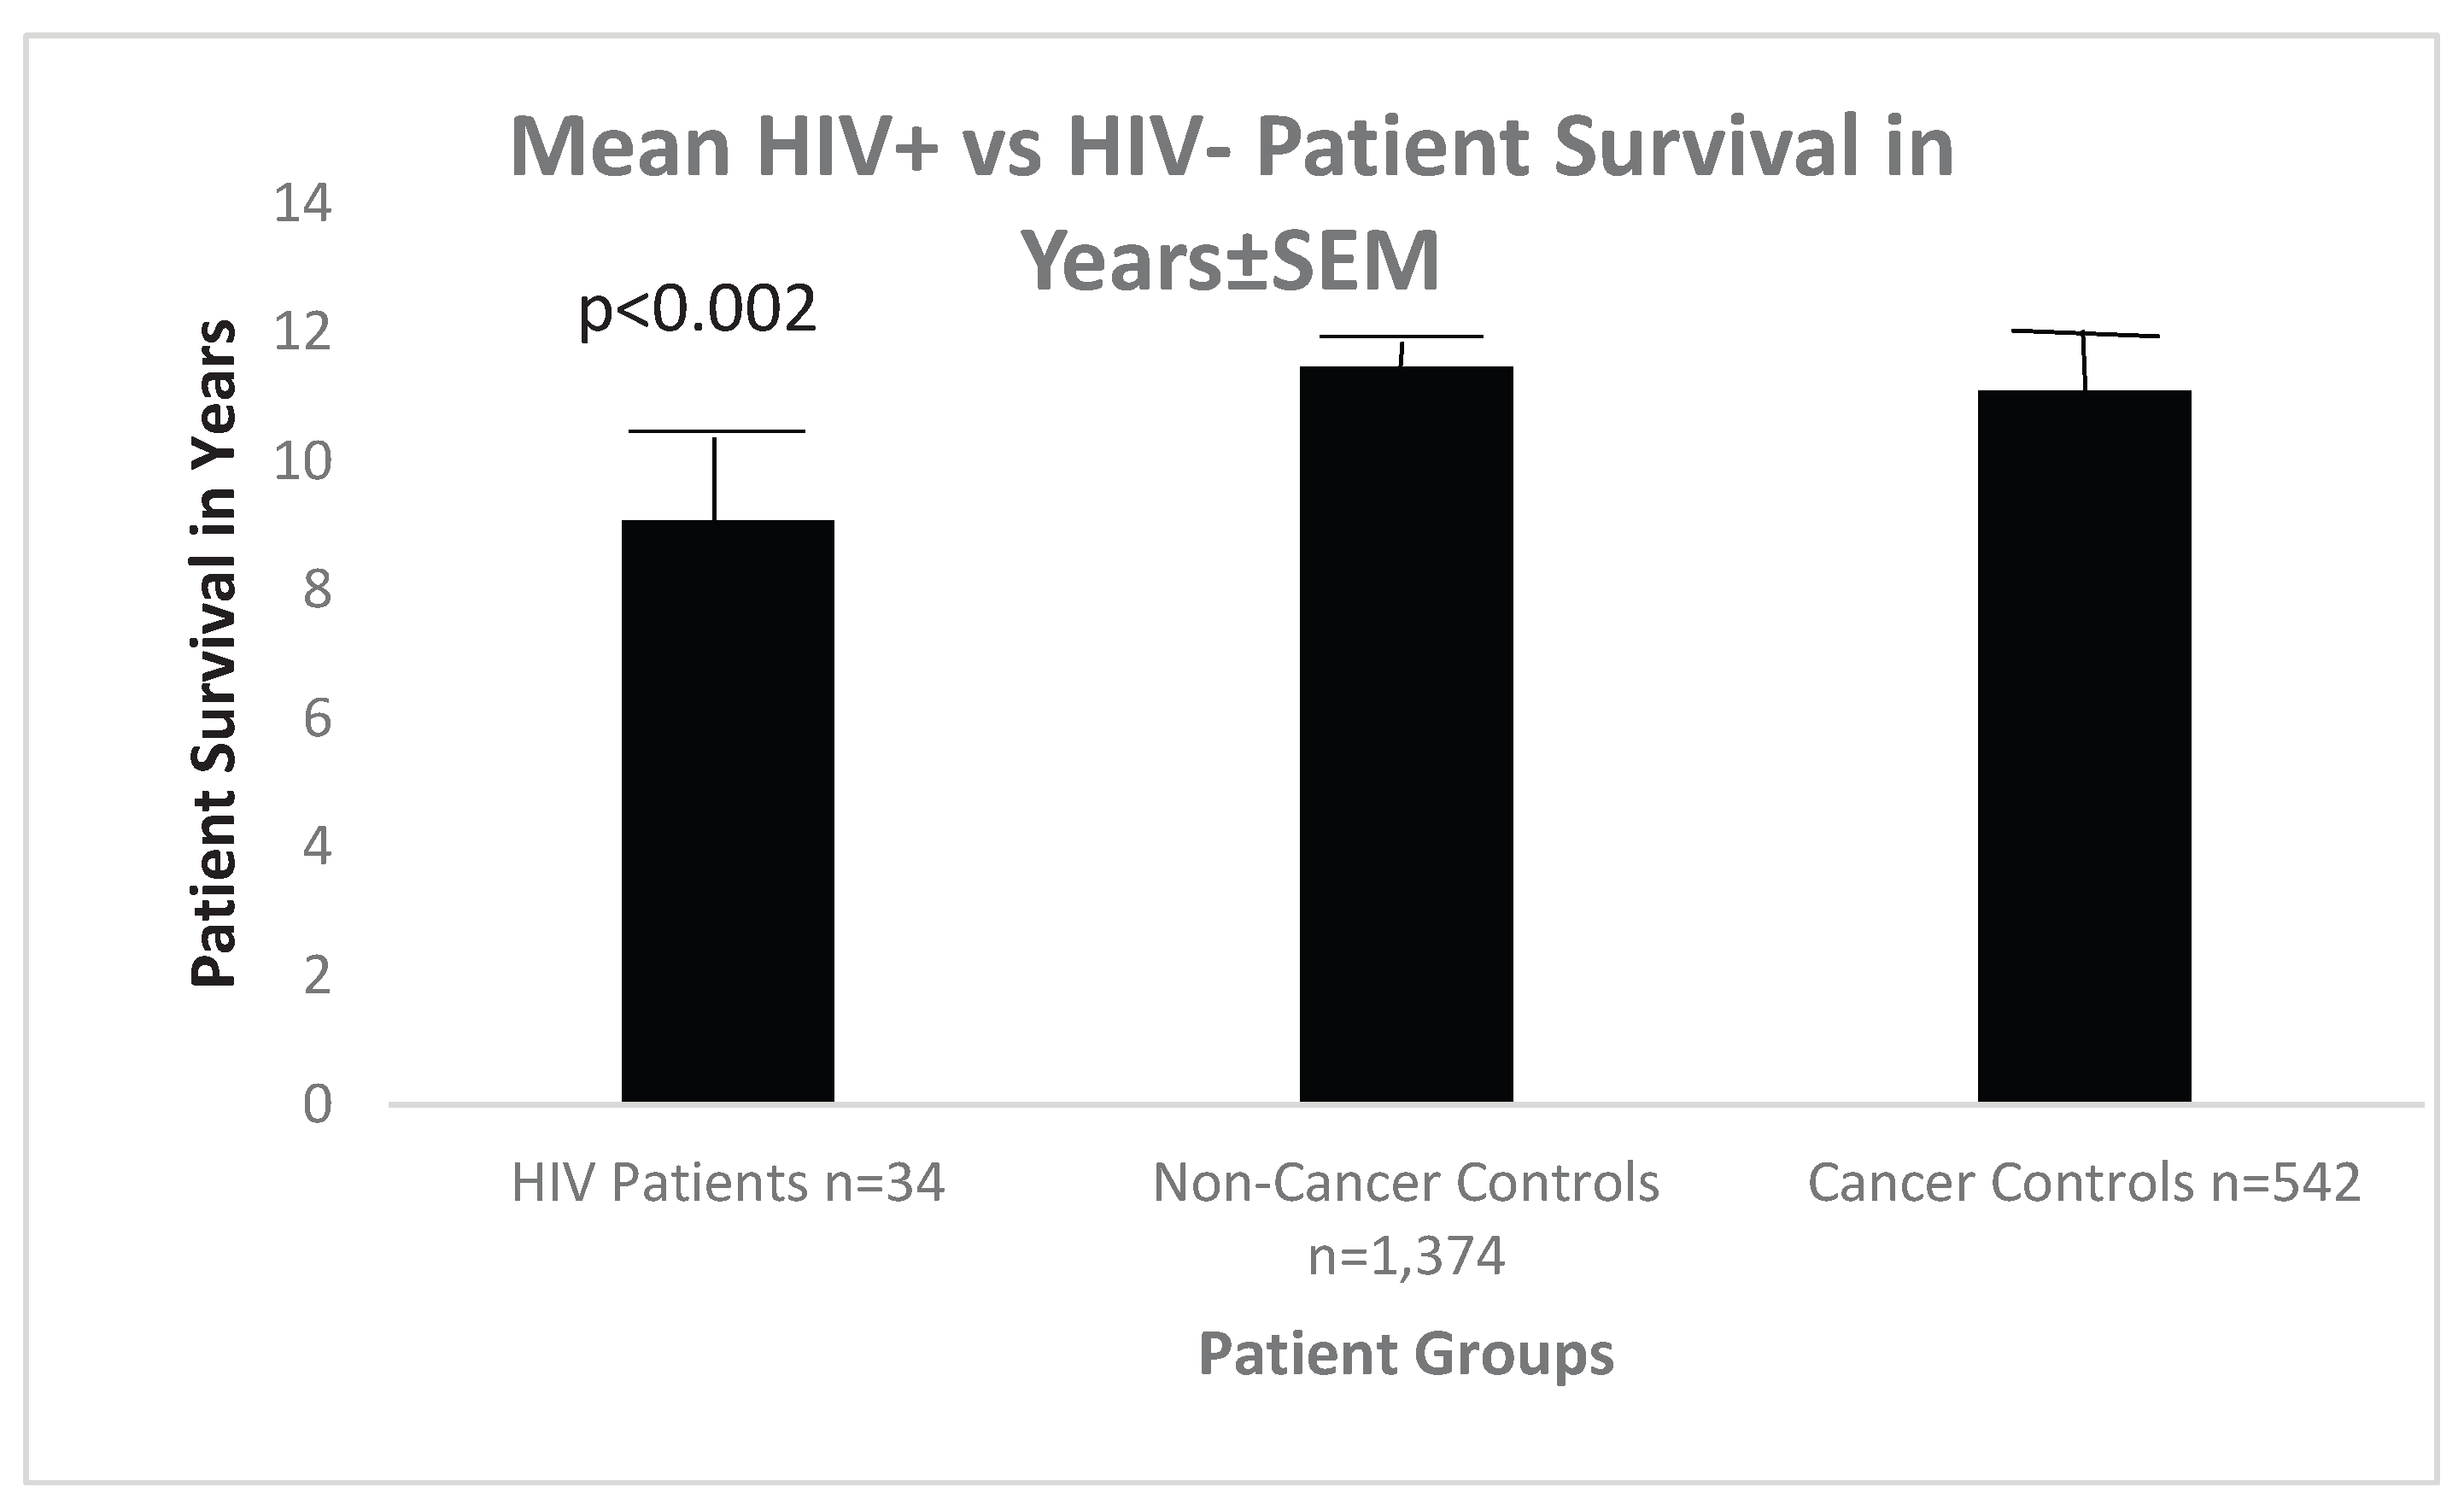
Table 1.
HIV Patients Demographics.
| Parameters | Age±sd | Sex M:F | Ethnicity B:W:H | HIV/C Duration yrs±sd | Mean FERAD ratio |
|---|---|---|---|---|---|
| *HIV n=34 | 54.6±6.12 | 31:3 91.2% |
25:7:2 |
8.29±7.15 | 54,004 NSS |
| Controls n=2,252 | 60.6±12.3 p<0.008 |
1908:238 106und. |
1076:1005:25 A=6;140 Unk |
16.02±5.55 | 49,956±112,448 |
n-Number; C-controls; sd-Standard deviation; M-male; F-female; B:W:H:A:Unk- black: white: Hispanic; Asian; Und-undesignated yrs=Years; *Cancers represented: Colorectal and pancreatic cancer; Prostate, kidney/bladder, head & neck, small cell lung cancer; breast; liver metastasis; . Prevalent Meds: efavirenz, stavudine, emtricitabine, tenofovir.
Table 2.
Demographic Comparison of the Two Control Groups.
| Representative Patients | 542 Cancers | 1,374 Non-Cancer Cont. | p Value |
| Ethnicity | 62%B:35%W;3%O | 48.7%B;49.4%W;O1.87% | <0.0001 chi-square |
| Sex (%Male:Female) | 91.5%Male 8.5%F | 88%Male12.2%F | NSS by chi-square |
| Age (years±sd deviation) | 64.3±10.82 | 54.6±6.12 | <0.000002 t-Test |
| BMI (bodyweight/surface | 24.93±6.3 | 28.77±6.3 | NSS Students t-Test |
| % Smokers: FERAD ratio FEREFF ratio |
41.4% 54,537±127,708 15,259±62,998 |
35.8%(OR1.54[1.21-1.9] 45,047±102,789 12,787±68,810 |
P<0.0007 Ψsquare NSS=0.4 t-Test NSS=0.8 |
Footnotes: Cont- Controls; p-Probability; O=other; %-percentage; sd- Standard deviation; BMI-body mass index; NSS-not statistically significant. Overall, stool average protein was 359µg/ml. Students- Students t-Test.
Table 3.
Contrasts HIV+ Patients Parameters with those of Controls in various Organ Systems.
| Organ System | Test performed | HIV vs all controls | p-Value Significance |
|---|---|---|---|
| Lung | FEV1 | 2.99 vs 2.24 L/sec | p<0.02 |
| Prostate | PSA | 3.21 vs 4.09 u/dL | 0.26 NSS |
| Liver | Hepatitis C Mol.test+ | 46 vs 19% | OR3.52[1.49-8.27];p<0.006 |
| Kidney | Urinary and Blood Cr | 211.39 vs 197.69* | 0.96 NSS vs urine |
| hematologic | Platelets | 267.92 vs 277.43 | 0.96 NSS |
*Blood creatinine HIV 1±0.23 versus controls 1.27±1.90;p<0.0002. Mol- molecular testing.
Disclaimer/Publisher’s Note: The statements, opinions and data contained in all publications are solely those of the individual author(s) and contributor(s) and not of MDPI and/or the editor(s). MDPI and/or the editor(s) disclaim responsibility for any injury to people or property resulting from any ideas, methods, instructions or products referred to in the content. |
© 2025 by the authors. Licensee MDPI, Basel, Switzerland. This article is an open access article distributed under the terms and conditions of the Creative Commons Attribution (CC BY) license (https://creativecommons.org/licenses/by/4.0/).
Copyright: This open access article is published under a Creative Commons CC BY 4.0 license, which permit the free download, distribution, and reuse, provided that the author and preprint are cited in any reuse.


