Submitted:
16 December 2025
Posted:
17 December 2025
You are already at the latest version
Abstract
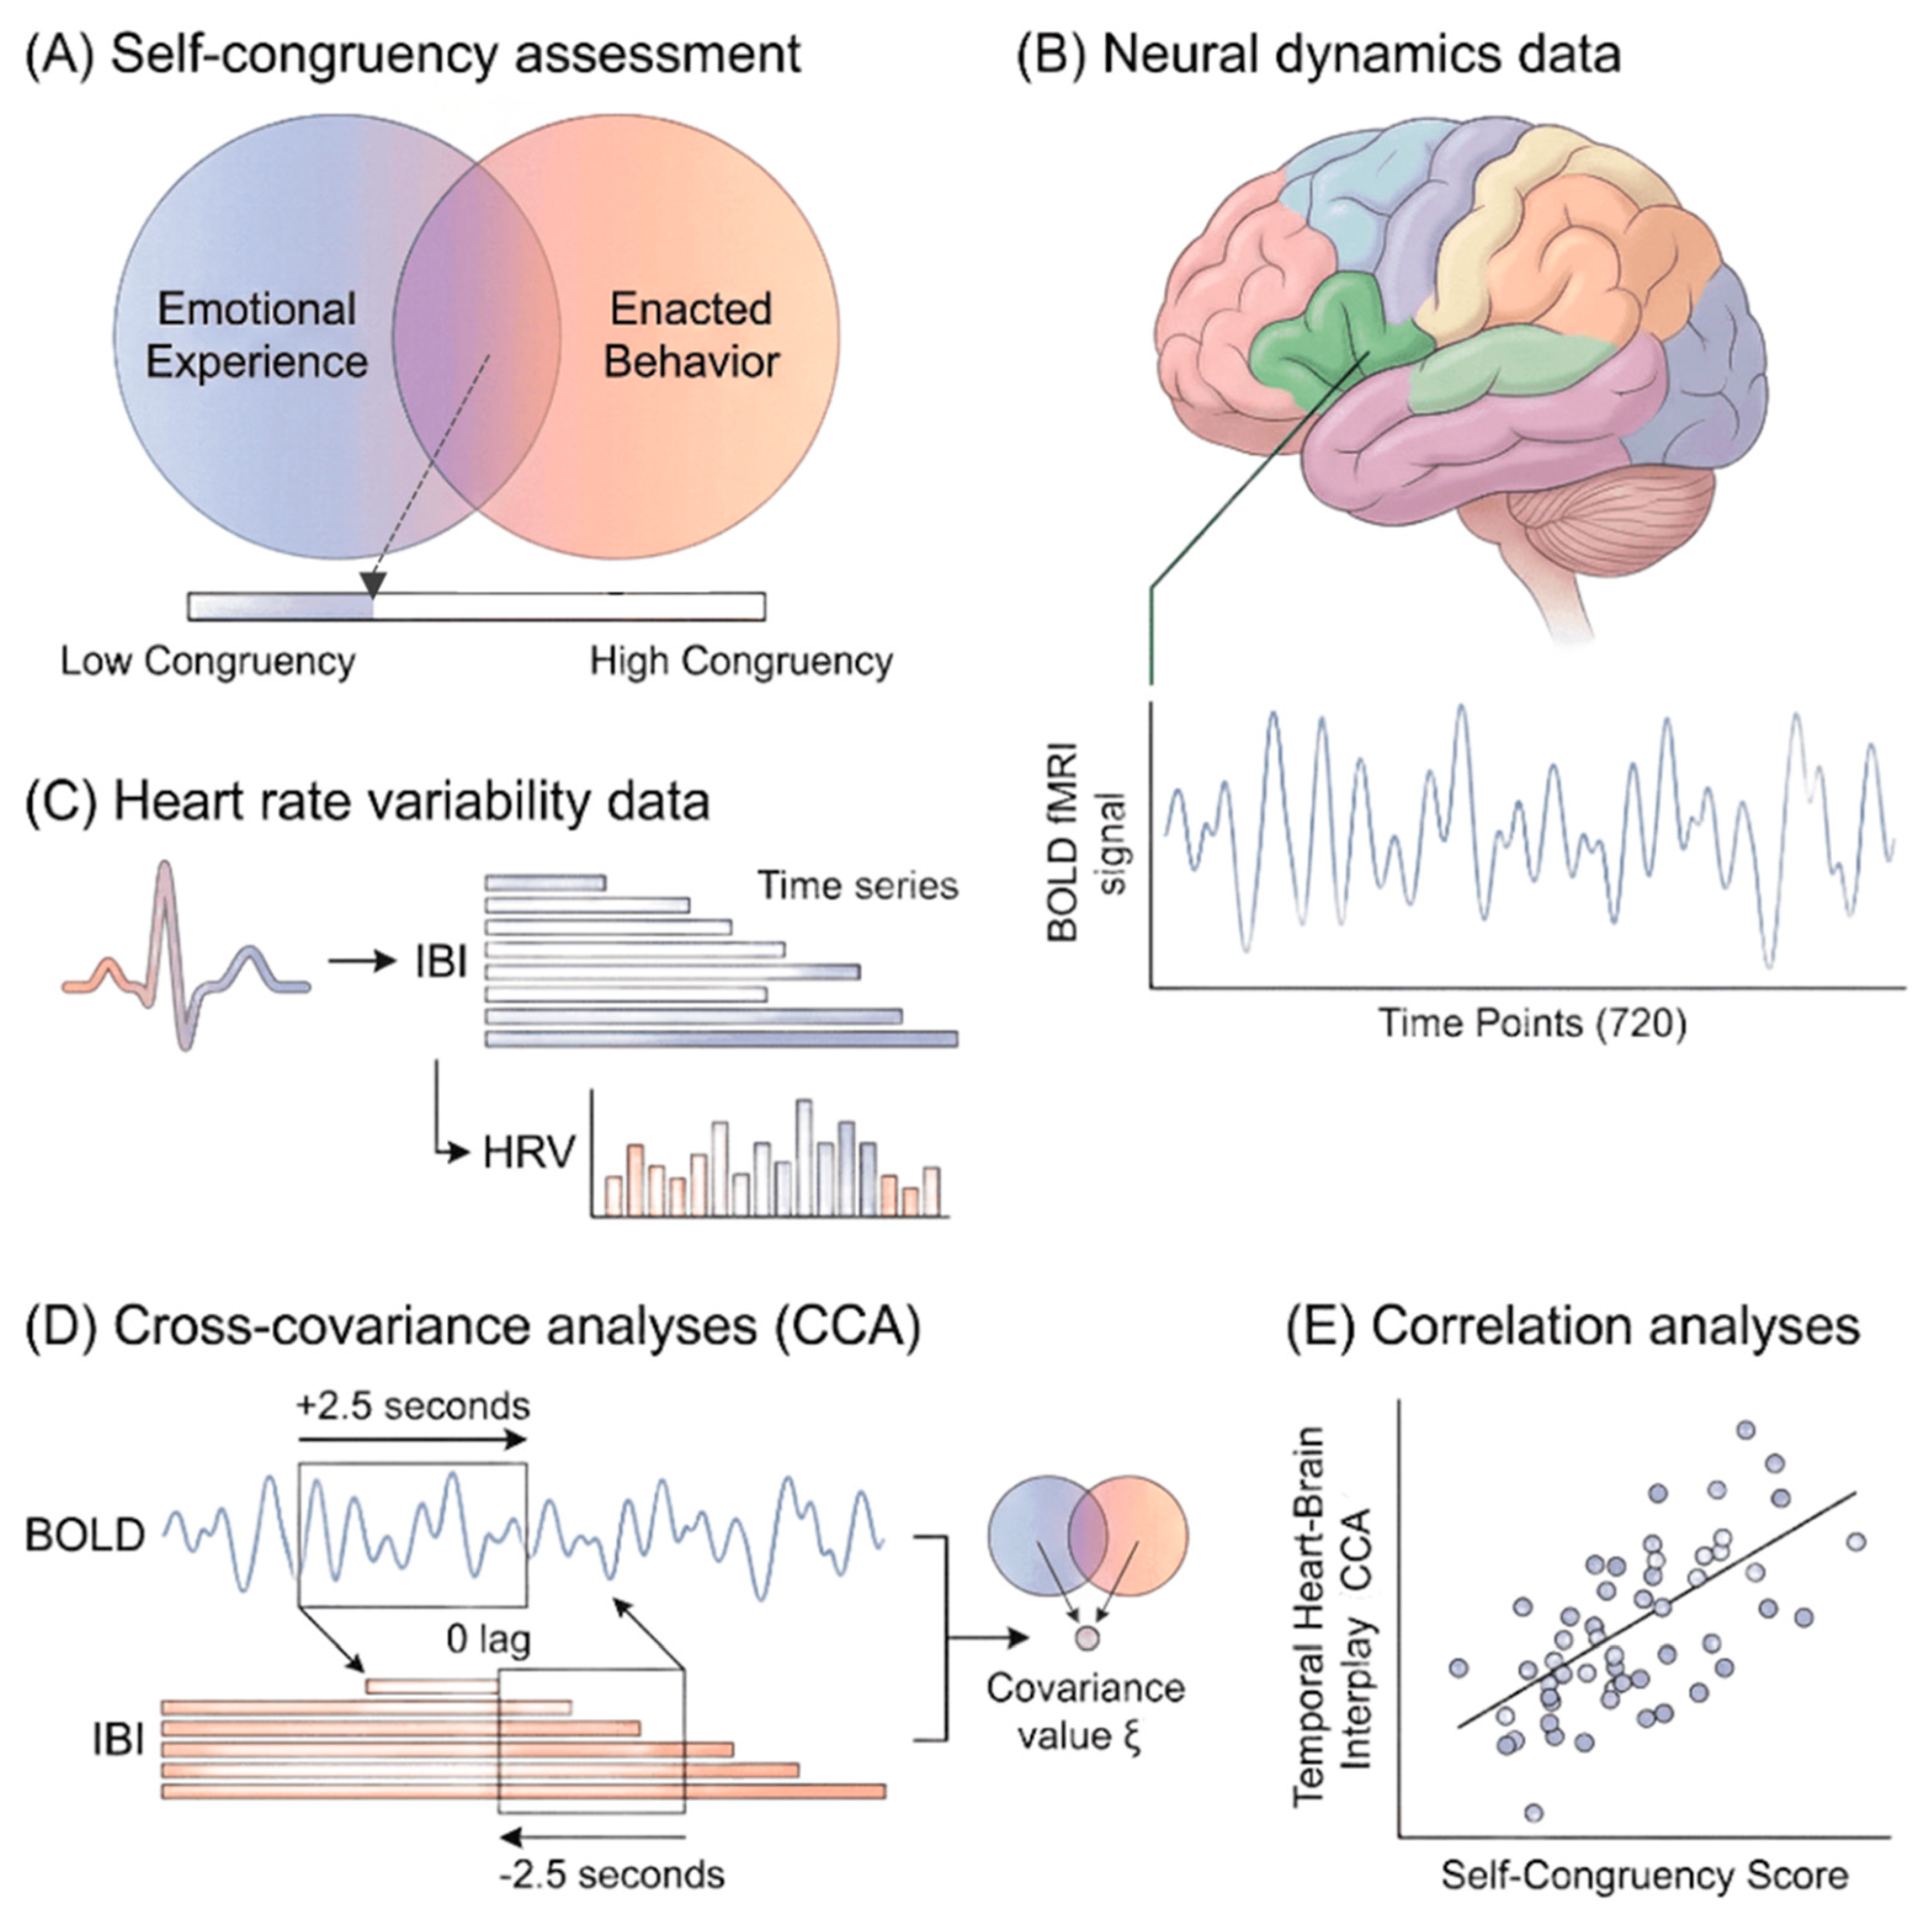
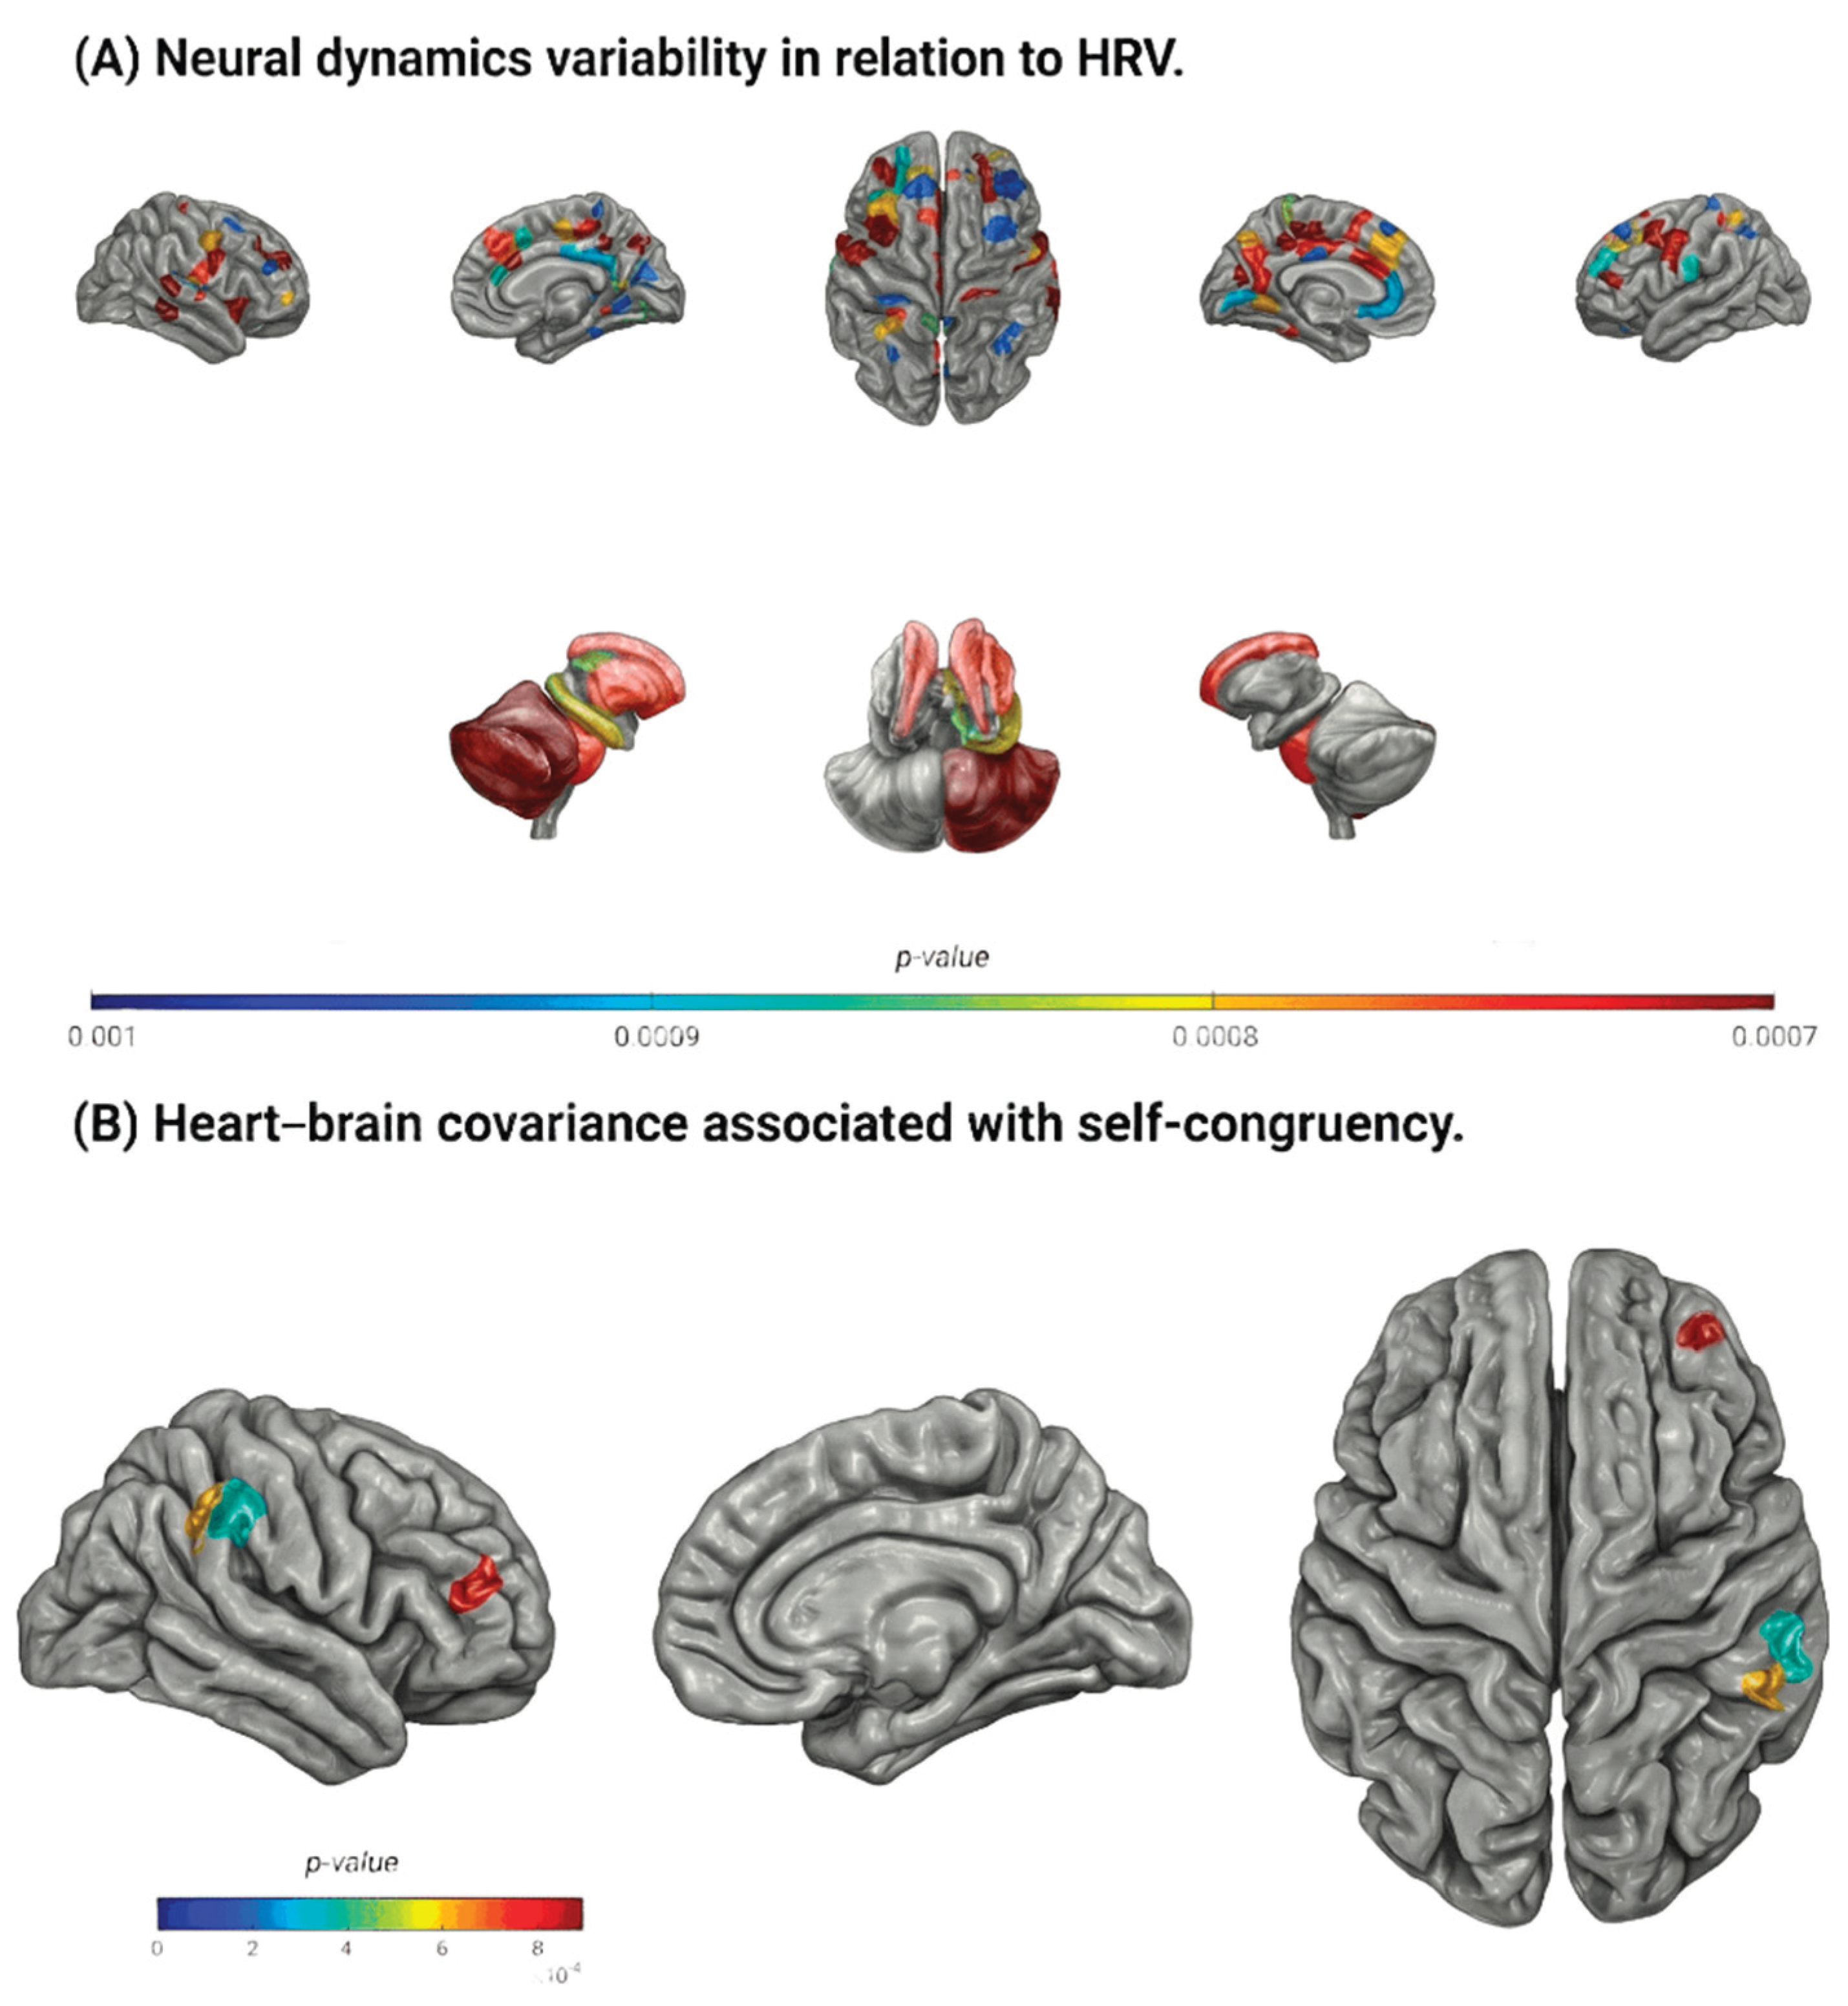
Self-congruency refers to the coherence between an individual’s emotional experience and their enacted behavior. Because discrepancies between internal states and outward actions (i.e., self-congruency) are linked to vulnerability in mental health, identifying physiological signatures associated with self-congruency may offer novel biomarkers for psychological well-being. Therefore, this study investigated whether temporal covariance between cardiac and neural activity reflects individual differences in self-congruency. Thirty-eight healthy adults underwent resting-state functional magnetic resonance imaging to quantify neural dynamics variability, while cardiac activity was recorded using photoplethysmography to derive heart rate variability (HRV) measures. Self-congruency was assessed using a graphic rating scale in which participants adjusted the spatial overlap between two circles representing their emotional experience and enacted behavior. Temporal coupling between cardiac HRV and regional BOLD activity was quantified using cross-covariance analysis across biologically plausible temporal shifts. At the group level, covariance predominantly reflected brain-to-heart influence, particularly within regions central to the neurovisceral integration model such as the ventromedial prefrontal and anterior cingulate cortices. In contrast, individuals with higher self-congruency displayed stronger heart-to-brain-directed interplay, especially within regions implicated in emotion regulation and empathy, including the right rostral middle frontal gyrus and supramarginal gyrus. These findings indicate that although top-down regulation characterizes global heart-brain dynamics, greater alignment between emotional experience and enacted behavior is associated with increased bottom-up cardiac influence on neural activity. Given the relevance of both heart-brain communication and self-congruency for mental health, these results suggest a potential physiological-psychological biomarker axis with implications for prevention strategies.
Keywords:
Introduction
Results
Demographic, Group Variables, and HRV Signal
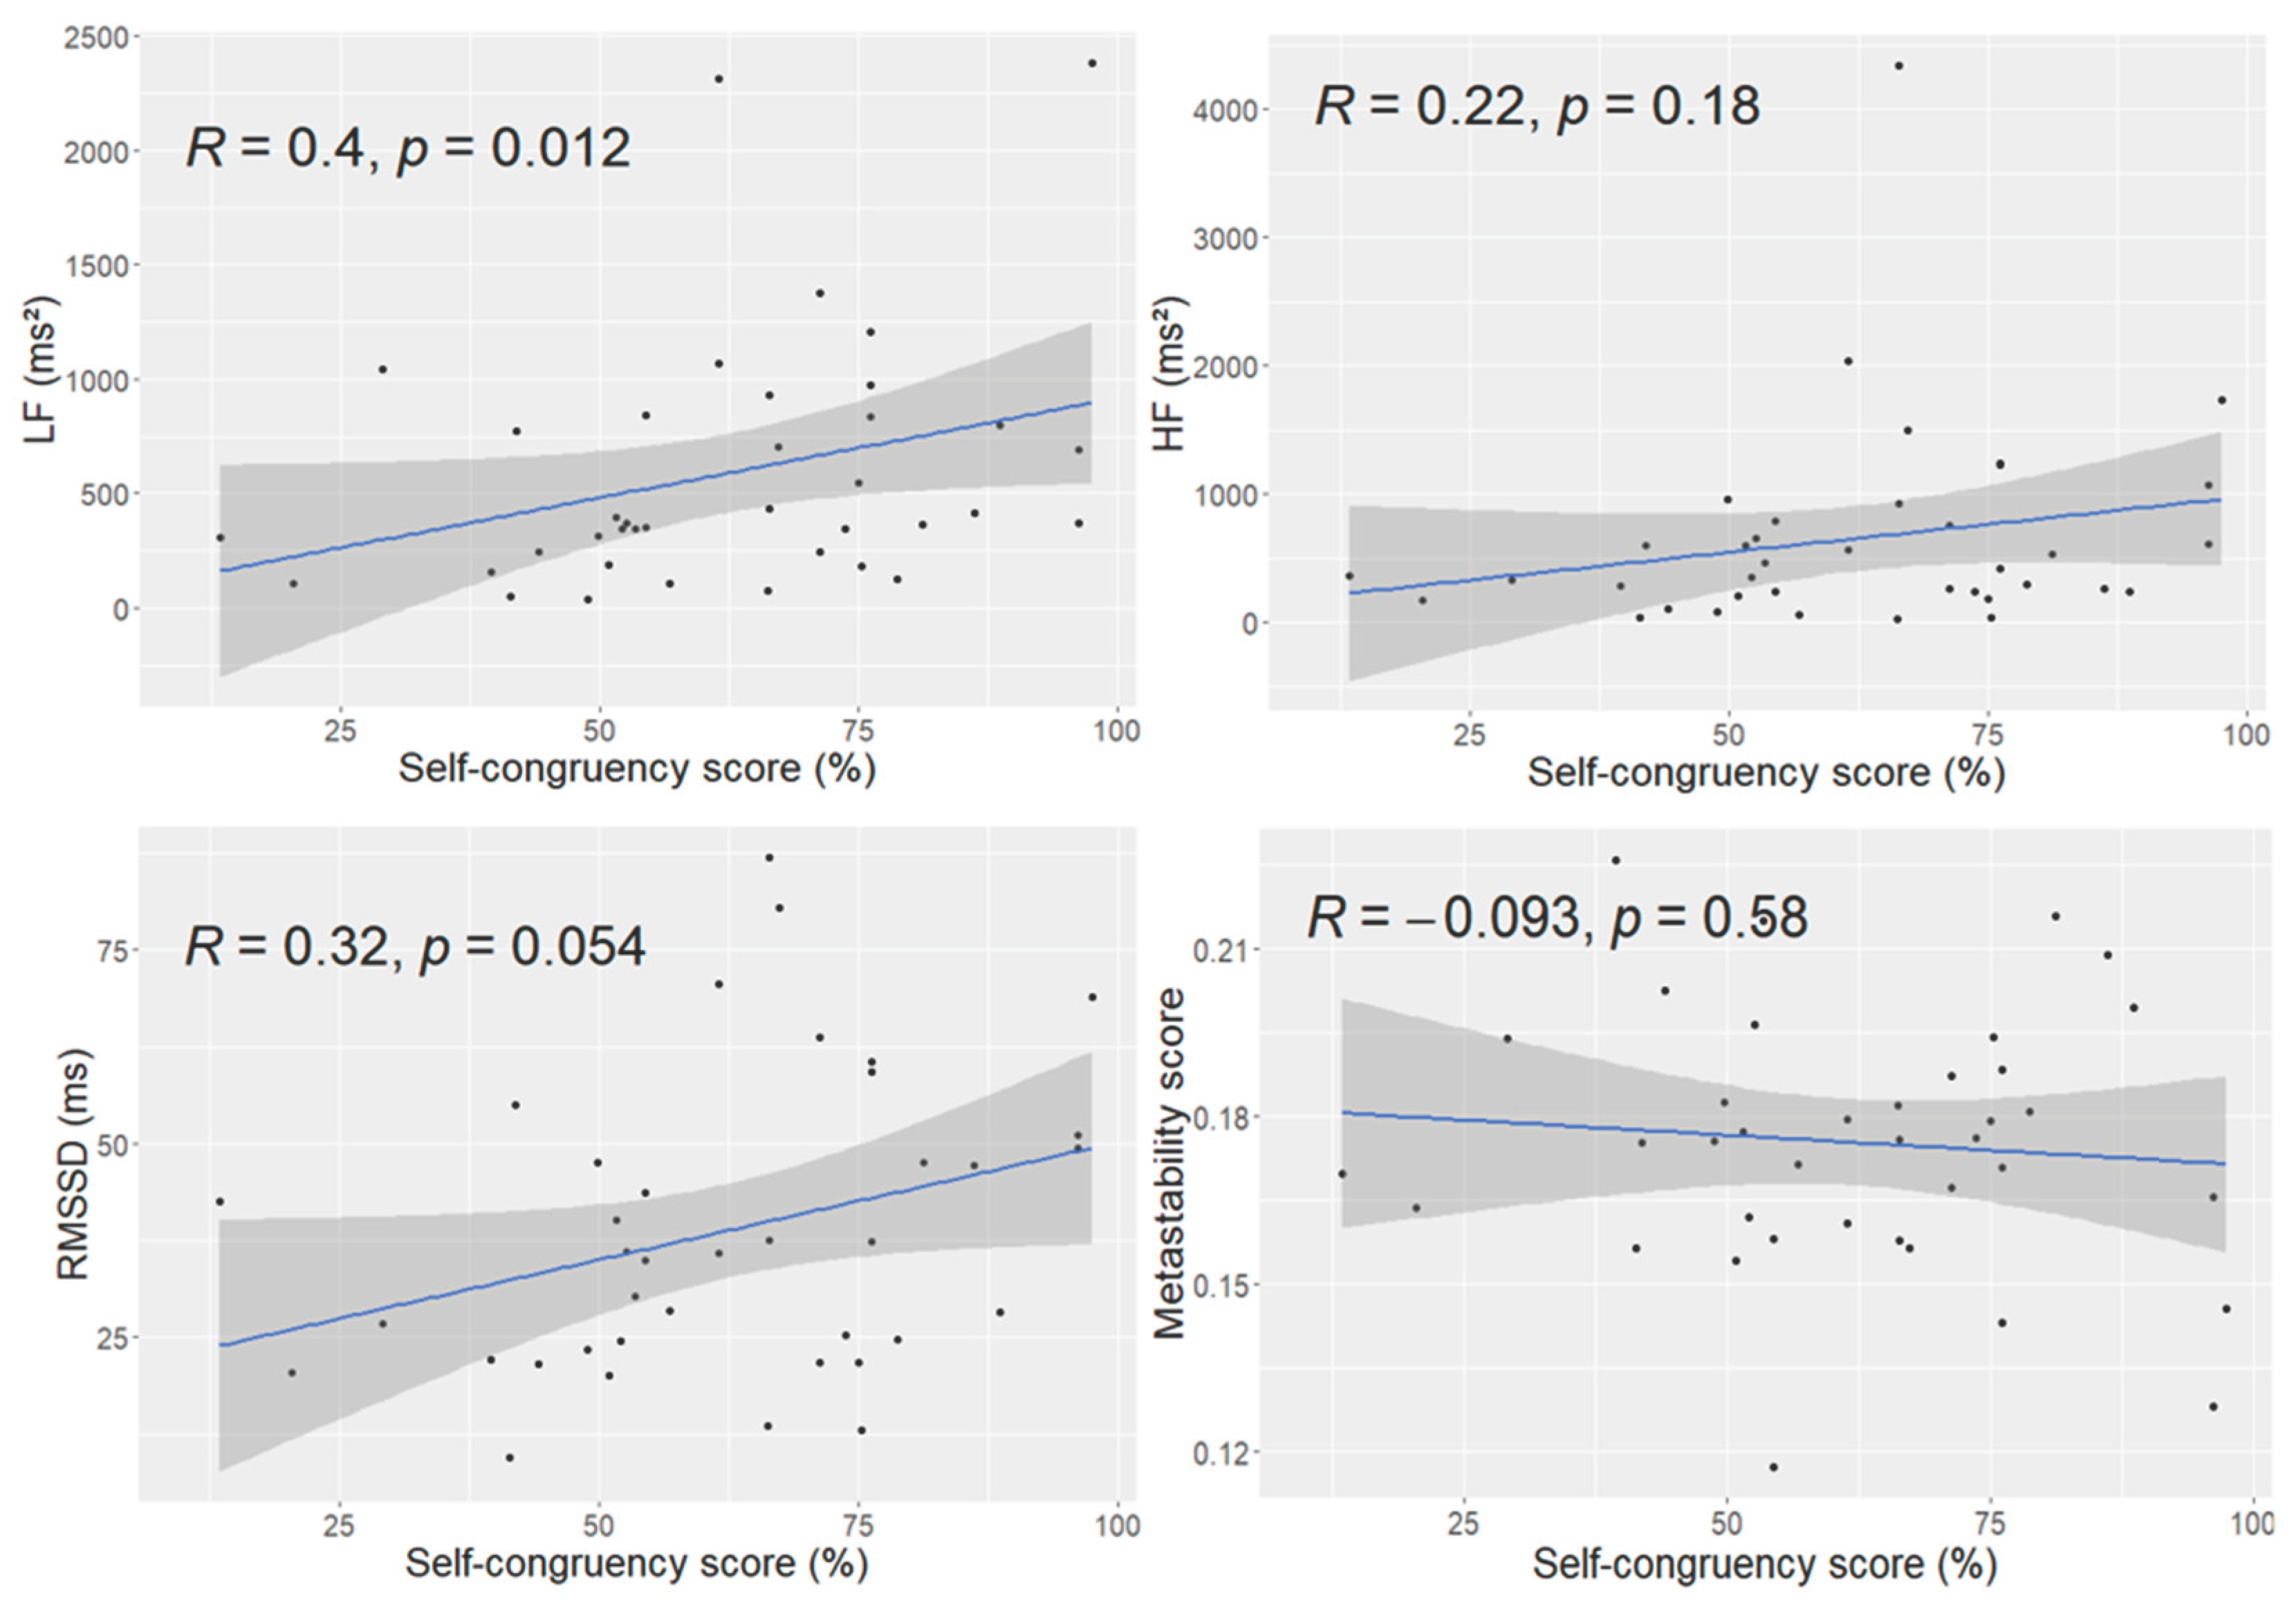
Global Relations of Self-Congruency with HRV Metrics and Neural Metastability
Temporal Relation Between Neural Dynamics and HRV
Relation Between Heart-Brain Covariance and Self-Congruency

| Brain regions | Shifts (s) | |||
|---|---|---|---|---|
| 2 | 2.5 | |||
| r | p (10-4) | r | p (10-4) | |
| rh-rostral middle frontal subregion 6 | - | NS | 0.52 | 8.93 |
| rh-supramarginal subregion 3 | - | NS | 0.52 | 7.85 |
| rh-supramarginal subregion 5 | 0.52 | 8.41 | 0.54 | 4.28 |
Discussion
Methods
Procedure
Participants
Group Variables
Data Acquisition and Preprocessing
Neural Data
Heart Rate Variability Data
Self-Congruency Data
Data Analysis
Demographic, Group Variables and HRV Signal
Global Relations of Self-Congruency with HRV Metrics and Neural Metastability
Temporal Relation Between Neural Dynamics and HRV
Relation Between Heart-Brain Covariance and Self-Congruency
Supplementary Materials
Author Contributions
Institutional Review Board Statement
Data Availability Statement
Acknowledgments
Conflicts of Interest
References
- Appelhans, B. M.; Luecken, L. J. Heart Rate Variability as an Index of Regulated Emotional Responding. Review of General Psychology 2006, 10(3), 229–240. [Google Scholar] [CrossRef]
- Berking, M.; Wupperman, P. Emotion regulation and mental health: Recent findings, current challenges, and future directions. In Current Opinion in Psychiatry; 2012; Vol. 25, Issue 2, pp. 128–134. [Google Scholar] [CrossRef]
- Bourdillon, N.; Yazdani, S.; Vesin, J.-M.; Schmitt, L.; Millet, G. P. RMSSD Is More Sensitive to Artifacts Than Frequency-Domain Parameters: Implication in Athletes’ Monitoring. ©Journal of Sports Science and Medicine 2022, 21, 260–266. [Google Scholar] [CrossRef]
- Bruehl, H.; Preißler, S.; Heuser, I.; Heekeren, H. R.; Roepke, S.; Dziobek, I. Increased Prefrontal Cortical Thickness Is Associated with Enhanced Abilities to Regulate Emotions in PTSD-Free Women with Borderline Personality Disorder. PLoS ONE 2013. [Google Scholar] [CrossRef] [PubMed]
- Campbell, J. D.; Trapnell, P. D.; Heine, S. J.; Katz, I. M.; Lavallee, L. F.; Lehman, D. R. Self-Concept Clarity: Measurement, Personality Correlates, and Cultural Boundaries. Journal of Personality and Social Psychology 1996, 70(1), 141–156. [Google Scholar] [CrossRef]
- Chalmers, J. A.; Quintana, D. S.; J-Anne Abbott, M.; Kemp, A. H.; Raquel Soares Ouakinin, S.; Marie Lachowski, A. Anxiety disorders are associated with reduced heart rate variability: a meta-analysis 2014. [CrossRef]
- Chang, C.; Metzger, C. D.; Glover, G. H.; Duyn, J. H.; Heinze, H. J.; Walter, M. Association between heart rate variability and fluctuations in resting-state functional connectivity. NeuroImage 2012, 68, 93. [Google Scholar] [CrossRef] [PubMed]
- Colzato, L. S.; Jongkees, B. J.; De Wit, Matthijs; Melle; van der Molen, J. W.; Steenbergen, L. Variable heart rate and a flexible mind: Higher resting-state heart rate variability predicts better task-switching. Cognitive, Affective, & Behavioral Neuroscience 2018, 18(4), 730–738. [Google Scholar] [CrossRef]
- Dattani, S.; Ritchie, H.; Roser, M. Mental Health. Our World in Data. 2021. Available online: https://ourworldindata.org/mental-health.
- Deco, G.; Kringelbach, M. L. Metastability and Coherence: Extending the Communication through Coherence Hypothesis Using A Whole-Brain Computational Perspective. Trends in Neurosciences 2016, 39(3), 125–135. [Google Scholar] [CrossRef]
- Deco, G.; Kringelbach, M. L.; Jirsa, V. K.; Ritter, P. The dynamics of resting fluctuations in the brain: Metastability and its dynamical cortical core. Scientific Reports 2017, 7(1). [Google Scholar] [CrossRef]
- Deng, Z.; Wei, D.; Xue, S.; Du, X.; Hitchman, G.; Qiu, J. Regional gray matter density associated with emotional conflict resolution: evidence from voxel-based morphometry. Neurosciences 2014, 500–507. [Google Scholar] [CrossRef]
- Domínguez-Arriola, M. E.; Víctor, ·; Olalde-Mathieu, E.; Garza-Villarreal, E. A.; Fernando, ·; Barrios, A. The Dorsolateral Prefrontal Cortex Presents Structural Variations Associated with Empathy and Emotion Regulation in Psychotherapists. Brain Topography 2022, 35, 613–626. [Google Scholar] [CrossRef]
- Enzi, B.; Amirie, S.; Brüne, · Martin. Empathy for pain-related dorsolateral prefrontal activity is modulated by angry face perception. Experimental Brain Research 2016, 234, 3335–3345. [Google Scholar] [CrossRef]
- Esteban, O.; Markiewicz, C. J.; Blair, R. W.; Moodie, C. A.; Ilkay Isik, A.; Erramuzpe, A.; Kent, J. D.; Goncalves, M.; DuPre, E.; Snyder, M.; Oya, H.; Ghosh, S. S.; Wright, J.; Durnez, J.; Poldrack, R. A.; Gorgolewski, K. J. fMRIPrep: a robust preprocessing pipeline for functional MRI. Nature Methods 2019, 16, 111–116. [Google Scholar] [CrossRef] [PubMed]
- Fetterman, A. K.; Robinson, M. D. Do you use your head or follow your heart? Self-location predicts personality, emotion, decision making, and performance. Journal of Personality and Social Psychology 2013, 105(2), 316–334. [Google Scholar] [CrossRef] [PubMed]
- Fingelkurts, A. A.; Fingelkurts, A. A. Making complexity simpler: Multivariability and metastability in the brain. International Journal of Neuroscience 2004, 114(7), 843–862. [Google Scholar] [CrossRef]
- Friedman, B. H. An autonomic flexibility–neurovisceral integration model of anxiety and cardiac vagal tone. Biological Psychology 2007, 74(2), 185–199. [Google Scholar] [CrossRef] [PubMed]
- Gogtay, N.; Giedd, J. N.; Lusk, L.; Hayashi, K. M.; Greenstein, D.; Vaituzis, A. C.; Nugent, T. F., III; Herman, D. H.; Clasen, L. S.; Toga, A. W.; Rapoport, J. L.; Thompson, P. M. Dynamic mapping of human cortical development during childhood through early adulthood. PNAS 2004, Vol. 101. Available online: https://www.pnas.org. [CrossRef]
- Griffa, A.; Ricaud, B.; Benzi, K.; Bresson, X.; Daducci, A.; Vandergheynst, P.; Thiran, J. P.; Hagmann, P. Transient networks of spatio-temporal connectivity map communication pathways in brain functional systems. NeuroImage 2017, 155, 490–502. [Google Scholar] [CrossRef]
- Hagmann, P.; Cammoun, L.; Gigandet, X.; Meuli, R.; Honey, C. J. Mapping the structural core of human cerebral cortex. PLoS Biol 2008, 6(7), 159. [Google Scholar] [CrossRef]
- Homma, I.; Masaoka, Y. Breathing rhythms and emotions. Experimental Physiology 2008, 93(9), 1011–1021. [Google Scholar] [CrossRef] [PubMed]
- Kernis, M.; Goldman, B. M. A Multicomponent Conceptualization of Authenticity: Theory and Reseach. Psychology 2006, 38, 283–357. [Google Scholar]
- Lee, H.; Frangou, S. Linking functional connectivity and dynamic properties of resting-state networks. Scientific Reports 2017, 7(1). [Google Scholar] [CrossRef] [PubMed]
- Light, A. E. Self-Concept Clarity, Self-Regulation, and Psychological Well-Being. Self-Concept Clarity 2017, 177–193. [Google Scholar] [CrossRef]
- Malik, M. Heart rate variability Standards of measurement, physiological interpretation, and clinical use. European Heart Journal 1996, 17, 354–381. Available online: http://eurheartj.oxfordjournals.org/. [CrossRef]
- Marteau, T. M.; Bekker, H. The development of a six-item short-form of the state scale of the Spielberger State—Trait Anxiety Inventory (STAI). British Journal of Clinical Psychology 1992, 31(3), 301–306. [Google Scholar] [CrossRef]
- Mather, M.; Thayer, J.; Ave, M.; Opin Behav Sci Author manuscript, C. How heart rate variability affects emotion regulation brain networks. Curr Opin Behav Sci 2018, 19, 98–104. [Google Scholar] [CrossRef]
- McCraty, R.; Atkinson, M.; Tomasino, D.; Bradley, R. T. The Coherent Heart Heart-Brain Interactions, Psychophysiological Coherence, and the Emergence of System-Wide Order. REVIEW December 2009, Vol. 5(Issue 2). [Google Scholar]
- McCraty, R.; Zayas, M. A. Cardiac coherence, self-regulation, autonomic stability and psychosocial well-being. Frontiers in Psychology 2014, 5(SEP), 1090. [Google Scholar] [CrossRef]
- Merri, M.; Farden, D. C.; Mottley, J. G.; Titlebaum, E. L. Sampling Frequency of the Electrocardiogram for Spectral Analysis of the Heart Rate Variability. IEEE TRANSACTIONS ON BIOMEDICAL ENGINEERING; 1990; Vol. 37. [Google Scholar]
- Michalski, L. J. Rostral Middle Frontal Gyrus Thickness is Associated with Perceived Stress and Depressive Symptomatology. Washington University, 2016. Available online: https://openscholarship.wustl.edu/art_sci_etds.
- Minarini, G. Root Mean Square of the Successive Differences as Marker of the Parasympathetic System and Difference in the Outcome after ANS Stimulation. In Autonomic Nervous System Monitoring - Heart Rate Variability; IntechOpen, 2020. [Google Scholar] [CrossRef]
- Nejati, V.; Majdi, R.; Salehinejad, M. A.; Nitsche, M. A. The role of dorsolateral and ventromedial prefrontal cortex in the processing of emotional dimensions. Scientific Reports 2021, 11(1). [Google Scholar] [CrossRef] [PubMed]
- Ochsner, K. N.; Gross, J. J. The cognitive control of emotion. In Trends in Cognitive Sciences; Elsevier Ltd, 2005; Vol. 9, Issue 5, pp. 242–249. [Google Scholar] [CrossRef]
- Palva, S.; Palva, J. M. New vistas for α-frequency band oscillations. Trends in Neurosciences 2007, 30(4), 150–158. [Google Scholar] [CrossRef] [PubMed]
- Park, G. The Mental Health from the Self-Regulation Perspective; What Research on Heart Rate Variability Revealed about the Interaction between Self-Regulation and Executive Attention Dysfunction In Acute Kidney Injury And Sex-Specific Implications. Medical Research Archives 2019, 7(3). Available online: http://journals.ke-i.org/index.php/mra.
- Saboul, D.; Pialoux, V.; Hautier, C. The impact of breathing on HRV measurements: Implications for the longitudinal follow-up of athletes. European Journal of Sport Science 2013, 13(5), 534–542. [Google Scholar] [CrossRef]
- Sallet, J.; Mars, R. B.; Noonan, M. P.; Neubert, F.-X.; Jbabdi, S.; O’reilly, J. X.; Filippini, N.; Thomas, A. G.; Rushworth, M. F. The Organization of Dorsal Frontal Cortex in Humans and Macaques. The Journal of Neuroscience 2013, 33(30), 12255–12274. [Google Scholar] [CrossRef]
- Schmitt, L.; Regnard, J.; Parmentier, A. L.; Mauny, F.; Mourot, L.; Coulmy, N.; Millet, G. P. Typology of Fatigue by Heart Rate Variability Analysis in Elite Nordic-skiers. International Journal of Sports Medicine 2015, 36(12), 999–1007. [Google Scholar] [CrossRef]
- Shaffer, F.; Ginsberg, J. P. An Overview of Heart Rate Variability Metrics and Norms. Front. Public Health 2017, 5, 258. [Google Scholar] [CrossRef] [PubMed]
- Sheldon, K. M.; Elliot, A. J. Goal striving, need satisfaction, and longitudinal well-being: The self-concordance model. Journal of Personality and Social Psychology 1999, 76(3), 482–497. [Google Scholar] [CrossRef]
- Sheldon, K. M.; Ryan, R. M.; Rawsthorne, L. J.; Ilardi, B. Trait self and true self: Cross-role variation in the Big-Five personality traits and its relations with psychological authenticity and subjective well-being. Journal of Personality and Social Psychology 1997, 73(6), 1380–1393. [Google Scholar] [CrossRef]
- Silani, G.; Lamm, C.; Ruff, C. C.; Singer, T. Right supramarginal gyrus is crucial to overcome emotional egocentricity bias in social judgments. Journal of Neuroscience 2013, 33(39), 15466–15476. [Google Scholar] [CrossRef] [PubMed]
- Silvani, A.; Calandra-Buonaura, G.; Dampney, R. A. L.; Cortelli, P. Brain-heart interactions: Physiology and clinical implications. In Philosophical Transactions of the Royal Society A: Mathematical, Physical and Engineering Sciences; Royal Society of London, 2016; Vol. 374, Issue 2067. [Google Scholar] [CrossRef]
- Spielberger, C. D.; Vagg, P. R. Psychometric Properties of the STAI: A Reply to Ramanaiah, Franzen, and Schill. Journal of Personality Assessment 1984, 48(1), 95–97. [Google Scholar] [CrossRef]
- Tahsili-Fahadan, P.; Geocadin, R. G. Heart–Brain Axis. Circulation Research 2017, 120(3), 559–572. [Google Scholar] [CrossRef]
- Task Force of the European Society of Cardiology the North American Society of Pacing Electrophysiology. Heart Rate Variability. Circulation 1996, 93(5), 1043–1065. [Google Scholar] [CrossRef]
- Thayer, J. F.; Åhs, F.; Fredrikson, M.; Sollers, J. J.; Wager, T. D. A meta-analysis of heart rate variability and neuroimaging studies: Implications for heart rate variability as a marker of stress and health. Neuroscience & Biobehavioral Reviews 2012, 36(2), 747–756. [Google Scholar] [CrossRef]
- Thayer, J. F.; Brosschot, J. F. Psychosomatics and psychopathology: looking up and down from the brain. Psychoneuroendocrinology 2005, 30(10), 1050–1058. [Google Scholar] [CrossRef]
- Thayer, J. F.; Hansen, A. L.; Saus-Rose, E.; Psychol, C. B. Heart Rate Variability, Prefrontal Neural Function, and Cognitive Performance: The Neurovisceral Integration Perspective on Self-regulation, Adaptation, and Health. Annals of Behavioral Medicine 2009, 37(2), 141–153. [Google Scholar] [CrossRef]
- Thayer, J. F.; Lane, R. D. A model of neurovisceral integration in emotion regulation and dysregulation. Journal of Affective Disorders 2000, 61(3), 201–216. [Google Scholar] [CrossRef] [PubMed]
- Thorpe, R. T.; Strudwick, A. J.; Buchheit, M.; Atkinson, G.; Drust, B.; Gregson, W. Tracking morning fatigue status across in-season training weeks in elite soccer players. International Journal of Sports Physiology and Performance 2016, 11(7), 947–952. [Google Scholar] [CrossRef]
- Wada, S.; Honma, M.; Masaoka, Y.; Yoshida, M.; Koiwa, N.; Sugiyama, H.; Iizuka, N.; Kubota, S.; Kokudai, Y.; Yoshikawa, A.; Kamijo, S.; Kamimura, S.; Ida, M.; Ono, K.; Onda, H.; Izumizaki, M. Volume of the right supramarginal gyrus is associated with a maintenance of emotion recognition ability. PLoS ONE 2021, 16. [Google Scholar] [CrossRef] [PubMed]
- Waugh, C. E.; Lemus, M. G.; Gotlib, I. H. The role of the medial frontal cortex in the maintenance of emotional states. Soc Cogn Affect Neurosci 2014, 9(12), 2001–2009. [Google Scholar] [CrossRef]
- Williams, D. W. P.; Cash, C.; Rankin, C.; Bernardi, A.; Koenig, J.; Thayer, J. F. Resting heart rate variability predicts self-reported difficulties in emotion regulation: A focus on different facets of emotion regulation. Frontiers in Psychology 2015, 6(MAR). [Google Scholar] [CrossRef] [PubMed]
- Wolff, N.; Zink, N.; Stock, A. K.; Beste, C. On the relevance of the alpha frequency oscillation’s small-world network architecture for cognitive flexibility. Scientific Reports 2017, 7(1). [Google Scholar] [CrossRef] [PubMed]
- World Health Organization. Mental disorders. 8 June 2022a. Available online: https://www.who.int/news-room/fact-sheets/detail/mental-disorders.
- World Health Organization. Mental health: strengthening our response. 17 June 2022b. Available online: https://www.who.int/news-room/fact-sheets/detail/mental-health-strengthening-our-response.
| Gender F [n]; M [n] |
Age [years] |
Fluid Intelligence [score /60] |
Anxiety level [score /36] |
Self-congruency [score %] |
|---|---|---|---|---|
| 26; 12 | 31.2 ± 12.5 (17.0 – 63.2) |
49.5 ± 6.0 (37.0 – 60.0) |
13.0 ± 5.5 (6.0 – 25.0) |
62.2 ± 19.9 (13.4 – 97.5) |
Disclaimer/Publisher’s Note: The statements, opinions and data contained in all publications are solely those of the individual author(s) and contributor(s) and not of MDPI and/or the editor(s). MDPI and/or the editor(s) disclaim responsibility for any injury to people or property resulting from any ideas, methods, instructions or products referred to in the content. |
© 2025 by the authors. Licensee MDPI, Basel, Switzerland. This article is an open access article distributed under the terms and conditions of the Creative Commons Attribution (CC BY) license (http://creativecommons.org/licenses/by/4.0/).


