
Submitted:
16 December 2025
Posted:
17 December 2025
You are already at the latest version
Abstract
Marathons are one of the ultimate challenges of human endeavor. In this paper, we apply recently introduced multifractal techniques which yield new classification parameters in the processing of physiological data captured on marathon runners. The comparison of their values gives a new insight on the way that runners of different level conduct their run, and ultimately, can be used in order to give advice on how to improve their performance.
Keywords:
physiological data
; marathon running
; wavelet analysis
; scaling invariance
; multifractal analysis
1. Introduction
Marathon pacing and the “wall”: Unlike shorter races, the marathon requires runners to balance energy supply, fatigue and psychological factors for several hours. Insufficient carbohydrate intake or an inappropriately high pace can produce a marked drop in speed at roughly 30 km – the so-called marathon wall [1]. The wall corresponds to the depletion of glycogen stores and a switch to slower fat oxidation, causing fatigue and difficulty in maintaining running pace. Physiologists have traditionally advised an even pace to avoid early fatigue [2]. However, analyses of elite performances show that the fastest marathons are not run steadily; they start relatively quickly, include speed oscillations in the middle and finish fast [3] and it was report-ed that runners who cover more than 50% of the race distance at speeds below their average pace optimize performance [4]. Indeed, it was observed that that the best results are obtained when runners oscillate between relatively high and low speeds rather than maintaining a constant pace [5]. An explanation is that pace fluctuations allow runners to use different metabolic pathways; surges generate lactate which can later be metabolized during slower phases, thereby stabilizing pH and delaying fatigue [6].
Variability and pacing strategy: Large cohorts show that most runners follow a positive pacing strategy – speed declines throughout the race and sometimes shows an end-spurt [7]. In a Frontiers study analyzing more than 200 000 performances, low-performance groups (LL) displayed the greatest pacing variability, while high-level (HL) runners were more even [4]. These results imply that pacing differs with performance level and that more skillful runners control their speed variations better than novices.
Physiological variability and fractal dynamics: Heart-rate variability (HRV) and locomotor variables such as speed or cadence are not random but show scale-invariant fluctuations. Early work using monofractal scaling (e.g., detrended-fluctuation analysis) found that heart-rate and speed time series from marathon runners exhibit long-range correlations; their short- and long-range scaling exponents (α₁ and α₂) in-creased during the race, indicating that variability diminishes and fatigue modifies the fractal structure [1]. However, monofractal methods assume that a single scaling ex-ponent describes all fluctuations, whereas physiological signals are heterogeneous and exhibit intermittent bursts (irregularity) that require multifractal analysis [8]. Multifractal analysis characterizes signals by a spectrum of singularities (Hölder exponents) rather than a single exponent; a wide spectrum indicates a rich repertoire of dynamics, whereas a narrow spectrum signifies loss of complexity and adaptability [9]. Enhanced multifractal properties are associated with healthy adaptive regulation, while a degraded spectrum (less width) has been linked to ageing, cardiac disease or reduced fitness [10]. Some traditional methods have been used to reveal hidden dynamics in the data:
- The analysis of Heart Rate Variability (HRV) allowed to monitor the autonomic nervous system’s response during marathons, analyzing the effects of fatigue and endurance on heart rate patterns [11],
- The different variants of multifractal analysis, either based on wavelet methods or on Detrended Fluctuation Analysis, emerged as a powerful tool to qualitatively assess physiological signals, offering a more comprehensive perspective on individual marathon performance by supplying new classification and model selection parameters based on scaling invariance exponents [11,12,13]; they allowed to identify scaling behavior in physiological signals like heart rate and speed, revealing the impacts of prolonged exercise and fatigue [9,13], and they proved useful in detecting fatigue- induced changes in physiological responses, distinguishing between elite and non-elite runners, and identifying individual pacing control mechanisms [14,15],
Several variants of multifractal analysis have been challenged on marathon runners data. A first one, the Wavelet Transform Modulus Maxima method (WTMM) allows to estimate the multifractal spectrum (i.e., the fractional dimension of the singularity sets of a given order) of a signal [16]. It has been applied to heart rate time series, demonstrating that heart rate variability can be described by scaling laws, see [13] where multifractal analysis is applied to the physiological signals of marathon runners, focusing on the detection of fatigue and the optimization of pacing strategies. Advanced multifractal techniques such as Multifractal Detrended Fluctuation Analysis (MF-DFA) and wavelet-based Legendre spectra were used to quantify the multifractality of time series data collected during marathon races [1]. They both quantify the multifractal properties of non-stationary time series. These studies have shown that multifractal techniques can effectively characterize the variability and complexity of physiological signals collected on marathon runners, offering new insights into endurance performance.
Classical signal analysis techniques often assume a minimal level of regularity in data (e.g., stationarity or smoothness), which is not always present in physiological responses during extreme conditions such as marathons; the implications of this question will be detailed in Sec. 2.1. Previous investigations demonstrated that physiological signals, particularly those related to running cadence and stride variability, exhibit complex dynamical behaviors that may not be well captured by traditional analysis methods [15,17]; to address these limitations, recent studies have explored the use of multifractal analysis, particularly via p-exponents, for analyzing variability in cadence and stride length in endurance sports [18,19]. These techniques allow for a more refined characterization of physiological responses that exhibit irregular fluctuations.
The weak-scaling exponent was designed for signals exhibiting negative pointwise regularity, where multifractal analysis via p-exponents struggles due extreme irregularity [20,21] (Table 1). The marathon context (extreme physiological conditions) matches the scenarios for which this method was developed [18,19,22]. It is particularly suited for physiological signals like heart rate variability (HRV) under stress (e.g., during marathons) where classical assumptions required for the applicability of of multifractal techniques may not hold [23]. Indeed, heart rate data during marathons that are highly irregular and fall outside the range of applicability of MF-DFA or traditional multifractal methods. In this article we show that weak-scaling leaders allow to handle such data, avoiding issues like saturation phenomena.
2. Materials and Methods
2.1. Multifractal Tools: p-Leaders, H_min, C_1 and C_2
Standard multifractal analyses rely on the Hölder exponent h, which measures local regularity; however, the classical formalism is limited to bounded functions. The p-exponent generalises Hölder regularity by replacing the classical supremum norm with an Lp-norm, allowing negative regularities that commonly occur in physical data [20]. p-leaders are multiresolution quantities built from wavelet coefficients and their neighbours; they provide a unified framework for estimating multifractal properties across scales and yield a robust multifractal formalism [20]. The p-leader multifractal formalism computes structure functions S(p,q) (q-th moments of p-leaders) and fits their scaling behaviour across scales to obtain cumulants
In the multifractal framework, a wide spectrum (large magnitude of C_2) indicates an adaptable regulatory system able to respond to a range of perturbations, while a narrow spectrum (small C_2) reflects rigidity or fatigue. C_1 is akin to the Hurst exponent; values above 0.5 reflect persistent correlations (the signal tends to continue increasing or decreasing), and values below 0.5 indicate anti-persistence (fluctuations alternate direction). H_min highlights abrupt fluctuations and may help detect sudden pace changes.
2.2. Physiological Interpretation of Multifractality Parameters
We now explore the relevance of the three multifractality parameters for detecting fatigue during a Marathon. In this study, three multifractal parameters are introduced:
H_min (minimal regularity): This parameter represents the strongest singularities (the sharpest and most abrupt changes) found within the physiological data. A higher value of H_min corresponds to more uniformity in the physiological signals, suggesting better management of physiological stress and less severe singularities, often linked to higher-ranked runners who maintain more consistent pacing throughout the marathon. In sports terms, higher values of H_min mean that the runner maintains smoother, steadier physiological regulation (e.g., fewer abrupt changes in heart rate variability), indicating better pacing strategy and resistance to fatigue.
C_1 (most common level of regularity): It can be considered as the typical regularity of physiological responses for a runner during the marathon. In sports terms, lower-performing runners usually have higher values of C_1, suggesting that their heart rate variability fluctuates more and usually is less stable or controlled. On other hand, higher-performing runners exhibit lower C_1, corresponding to more consistent physiological control and stable pacing strategies.
C_2 (multifractal spectrum’s width): This essentially reflects how much the regularity (or physiological responses) varies throughout the run. Positive or close to zero values indicate a narrower spectrum, meaning fewer fluctuations-i.e., a more stable physiological state during the marathon; negative values further from zero indicate broader, more pronounced multi- fractal spectra, meaning greater variability and complexity in physiological responses, often correlating with increased fatigue and less efficient pacing.
For illustrative purposes, an example of a realization of a multifractal random walk is shown in Figure 1. This is an important model widely used in signal processing for which multifractal spectra are simply shifted by the order of the fractional derivation (when the corresponding exponent is well defined), see [25,26]. Figure 2 shows that the Hölder and p-spectra are correctly estimated only when the data satisfy the admissibility conditions.
2.3. Evidence for Changes in Multifractal Properties During a Marathon
2.3.1. Within-Race Evolution
Loss of variability with fatigue: Billat et al. observed that the short- and long-range scaling exponents for heart rate and running speed increase during the second half of a marathon; this indicates a shift toward more persistent, less variable fluctuations [1]. This decrease in variability parallels the decline in pace observed when runners “hit the wall” at ~30 km [4]. Multifractal analysis should detect this change as a reduction in spectrum width (C2→0) and an increase in C1, reflecting more regular and less adaptive dynamics.
Entropy and entropy-cluster analyses: A 2024 entropic study on recreational marathoners showed that the first 26 km projected on the same principal-component axis as metabolic responses, while the final kilometers were on the opposite side, indicating a shift in physiological state as fatigue set in [27]. Heart-rate and cadence entropies were distinct from metabolic parameters, suggesting that these signals encode independent information [27]. Agglomerative clustering identified 2-4 distinct phases within each runner, showing that pacing and physiological responses evolve throughout the race [28]. These results imply that multifractal parameters (Hmin, C1, C2) will change at different segments of the marathon – typically remaining broad and negative (high variability) in the early kilometres and narrowing as fatigue reduces variability.
Timing of changes: Combining fractal and entropy analyses suggests that multifractal properties begin to change around the half-marathon mark and become pronounced near 30 km, where glycogen depletion and metabolic shifts lead to the wall [1]. We therefore expect Hmin to increase and C2 to approach zero during the later kilometers; these changes may be detected over windows of ~5 km or ~15 min.
2.3.2. Between-Runner Differences
Performance level: Analyses of pacing indicate that low-level runners exhibit greater speed variability and larger end-spurts, whereas high-level runners maintain more even pacing [4]. High-level runners also run much of the race below their average speed and use brief surges strategically [5]. From a multifractal perspective, we hypothesize that faster runners maintain a broader spectrum (more negative C_2) throughout the marathon because they deliberately vary speed and cadence, harnessing multiple metabolic systems. In contrast, low-level runners may show a narrower spectrum (C_2 closer to zero) during the early kilometers due to rigid pacing and experience a further collapse of multifractality when fatigue forces them to slow down.
Fitness and multifractality: A study examining 24h RR time-series found that the full-width at half-maximum (FWHM) of the multifractal spectrum decreased and the modal Hölder exponent h increased in older participants [10]. Fitter individuals had stronger anti-persistent correlation and greater spectrum width, whereas the least fit displayed the smallest FWHM [24]. These results suggest that aerobic fitness preserves multifractal complexity. By analogy, highly trained marathoners are likely to maintain larger |C2| values and lower H_min (more irregularity) than recreational runners.
Gender differences: In the pacing study, women marathoners generally paced more evenly than men, and differences between sexes were trivial in half-marathon [29]. Thus, sex may in-fluence multifractal signatures by modulating pacing variability.
In the present study, more recently, we examined how cadence and stride variability during marathons can be analyzed using multifractal techniques based on alternative regularity exponents such as p-exponents (see Sec. 2.1 below) [4]. In some cases, even this extended version of multifractal analysis cannot be performed, and the least demanding setting supplied by the weak-scaling pointwise regularity has to be used; indeed, it provides a robust framework for analyzing signals without assuming any a priori global regularity on the data; a first application of this alternative technique has been performed in [4], where the focus was put on cadence (in this study, the analysis of velocity was not performed due to GPS measurement inaccuracies).
The aim of the present work from the applicative side is to show that, in the case of the extremely irregular data collected on marathon runners, these assumptions are not met by most of these methods. This indicates the need for a multifractal analysis based on the weak-scaling exponent, which requires no assumption on the data.
Therefore, the study that we perform provides insights into how multifractality parameters using the weak-scaling exponent characterize changes in physiological signals due to fatigue, particularly around the 30th kilometer mark where perceived exertion is significantly increased.
Table 1 provides information about the subjects’ characteristics and their performance, offering context and perspective on the results obtained. It includes data on the time performance, marathon name, age, weight, and height of experimented marathon runners, where all participants are men except for M6. Additionally, runners M4 and M5 represent the same person but with two different performances. The rank is determined by calculating the percentage of time taken in the race relative to the record of each category to which the marathon runner belongs based on gender and age (a lower percentage of the record corresponds to a higher ranking for the marathon runner).
Description of the data: The heart rates of marathon runners were recorded using Garmin Forerunner 630 watches, see Figure 3 which shows one of these data before and after denoising. Each participant wore the device securely on their wrist to ensure accurate heart rate measurements. The watches were configured to capture real-time physiological data throughout the marathon. To ensure precise timing, runners manually started the recording upon crossing the start line and stopped it immediately after finishing. Following the race, the recorded data were synchronized with the Garmin Connect platform for further processing and analysis. Each heart rate time series consisted of approximately 10000 to 15000 sampled values per runner. This standardized procedure ensured the collection of reliable physiological and performance metrics. The dataset that we use is available at:
Table 2 provides information about the subjects’ characteristics and their performance, offering context and perspective on the results obtained. It includes data on the time performance, marathon name, age, weight, and height of experimented marathon runners, where all participants are men except for M6. Additionally, runners M4 and M5 represent the same person but with two different performances. The rank is determined by calculating the percentage of time taken in the race relative to the record of each category to which the marathon runner belongs based on gender and age (a lower percentage of the record corresponds to a higher ranking for the marathon runner).
Multifractality parameters are estimated using log-log regressions of quantities based on (θ,ω)-leaders, namely the the log-cumulants see [24,30]. Numerical estimations are performed using linear regressions over the range j=5 to j=8 (i.e., between 26s and 3min25s), corresponding to relevant physiological scales and ref. therein. Based on numerical studies regarding the selection of θ and ω parameters, see [24], and to ensure consistency, we adopt the same parameters θ(j) = j^0,25 and ω(j)=j that provide optimal parameterization, yielding accurate estimates of the theoretical spectrum for several models. It is important to note that, as part of future studies, a theoretical statistical investigation is necessary to robustly determine the most appropriate parameter selection across various types of signals.
3. Results and Discussion
Figure 4 shows that the better the ranking, the larger the H_min value. Conversely, when examining the figure for C_1, which represents the regularity almost everywhere versus the record, the opposite trend is observed: marathoner runners with lower performance levels have a higher C_1 value compared to those at the top ranks. These two observations suggest that the better the ranking, the narrower the multifractal spectrum of marathon runners. In other words, higher-performing runners exhibit more uniform regularity, indicating less “fractality”, i.e., the regularity exponent $h(x)$ varies over a small interval.
Besides, Figure 9, and particularly the C_1-H_min representation, confirms our conclusion: the smaller the gap, the better the ranking of marathon runners. When discussing the parameter C_2, we focus on its influence on the spectrum’s concavity. As C_2 approaches zero, the spectrum becomes less concave and narrower, indicating a more monofractal nature, where the pointwise regularity parameter remains constant. Conversely, as C_2 moves away from zero in the negative direction, the spectrum becomes more concave and broader, thus indicating higher “multifractality”. The analysis of the C_2 graph in relation to the record supports our conclusions: athletes with lower performance exhibit more negative C_2 values, corresponding to a higher degree of “multifractality”.
Figure 6.
Evolution of the couple (Hmin, C1) between the first half (red dots) and the last quarter (green dots) of the marathon. Runners in blue participated in the Paris Marathon, while those in black participated in other marathons.
Figure 6.
Evolution of the couple (Hmin, C1) between the first half (red dots) and the last quarter (green dots) of the marathon. Runners in blue participated in the Paris Marathon, while those in black participated in other marathons.
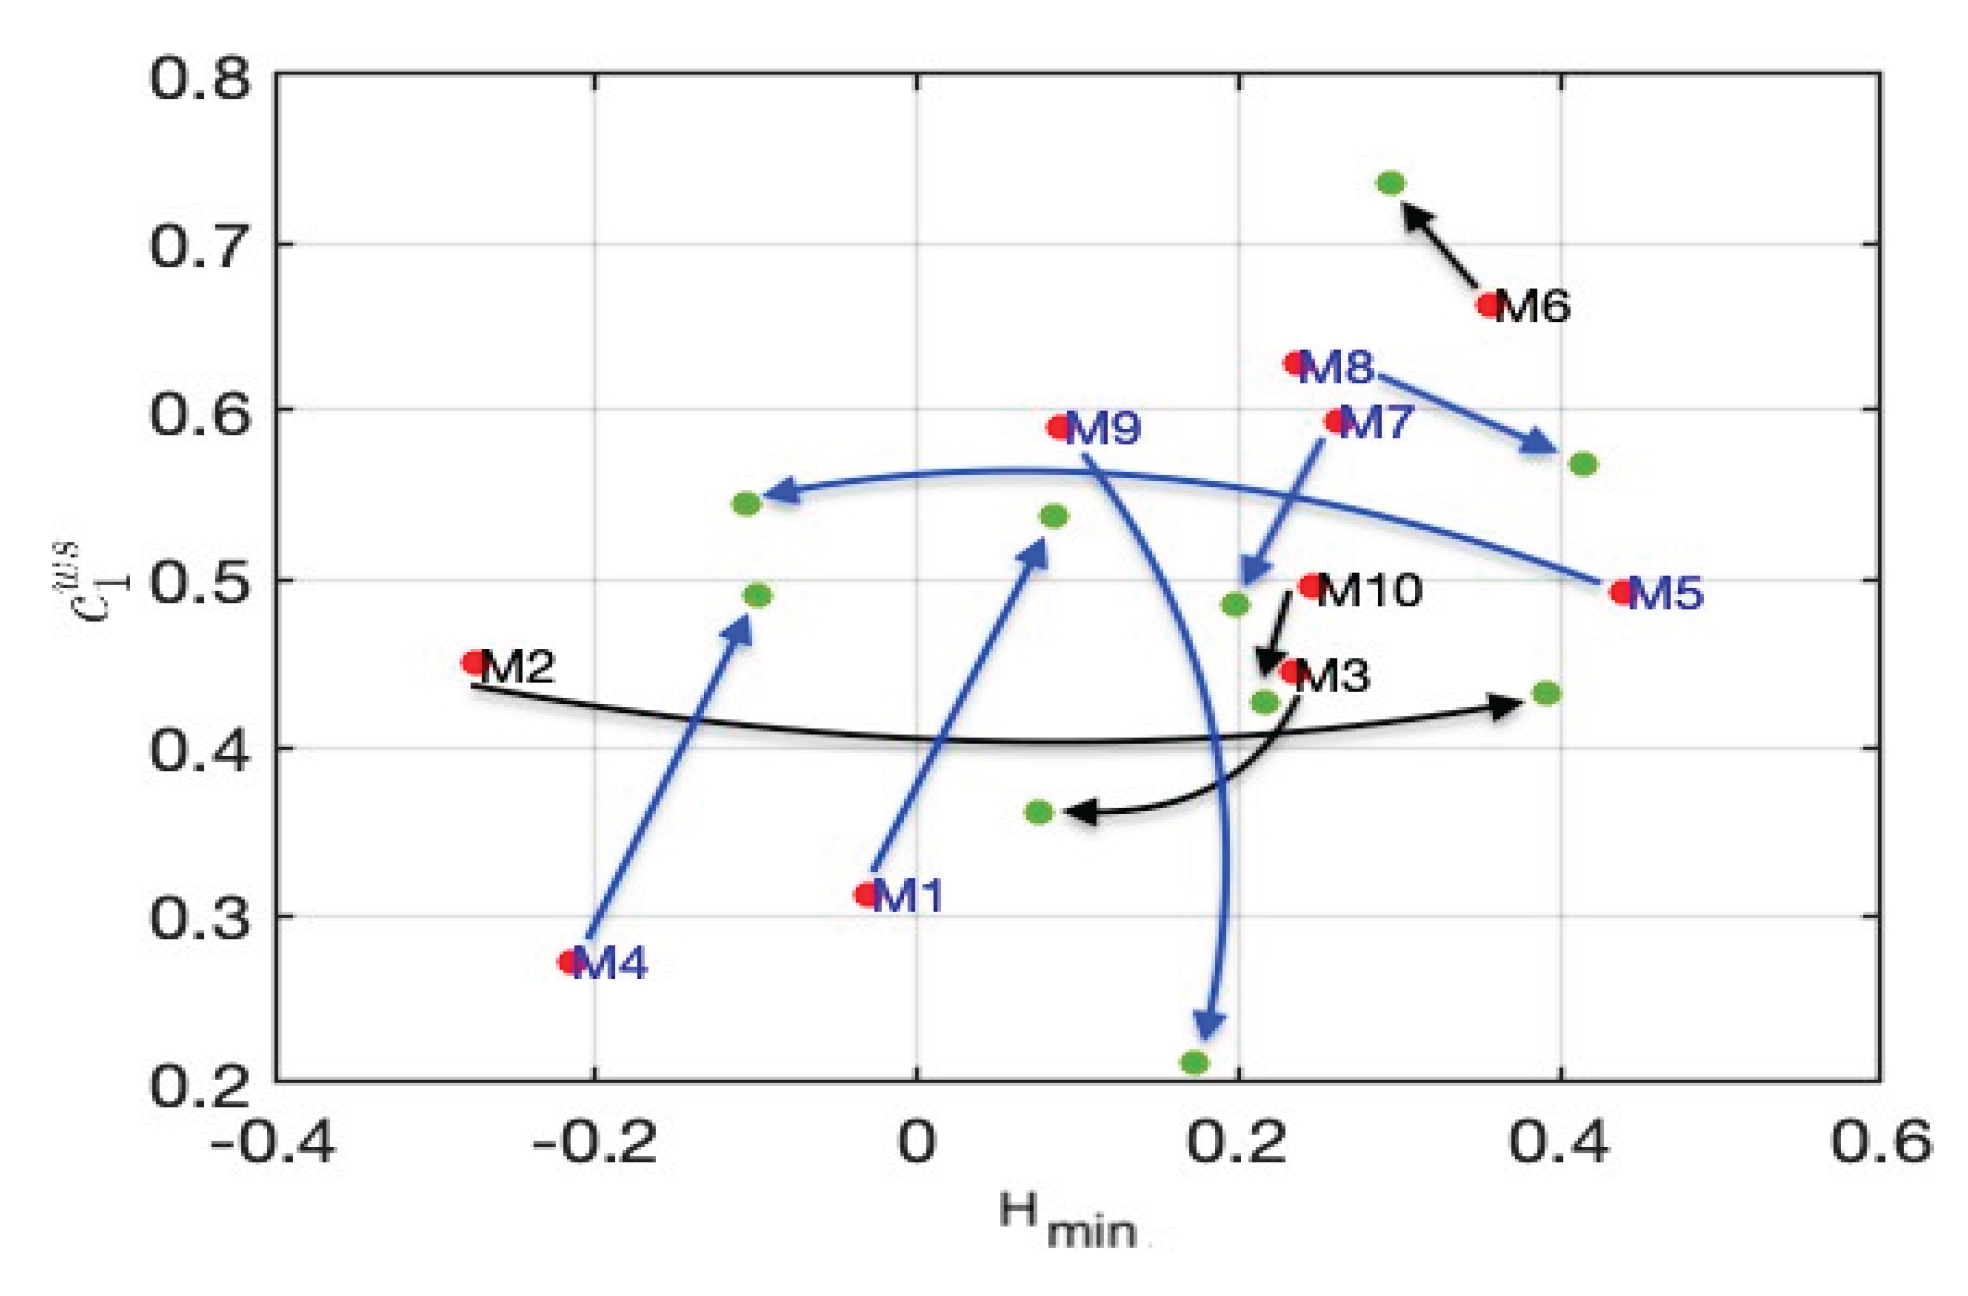
We enhanced the previous analysis by examining variations in multifractal parameters throughout the marathon. Note that, in all generality, when data do not present stationarity properties, their multifractal characteristics may vary with time and the output of a global multifractal analysis mixes these characteristics so that it is hard to infer from it pertinent information. Therefore, a preprocessing consisting in splitting the signal into homogeneous pieces is required, see [31] for such procedures and their use on finance data. However, here, this splitting can be done accurately by hand because of the a priori knowledge that we have on the data.
Indeed, it is well established that during the final 12 kilometers, many runners experience a significant increase in difficulty, with Borg RPE (Rate of Perceived Exertion) scores exceeding 15/20, indicating strenuous effort. An important issue is to explore how these changes impact multifractality parameters. Figure 6 illustrates the evolution of the multifractality parameters H_min and C_1 between the first and last quarters of the marathon, emphasizing the differences in physiological responses to fatigue beyond the 30th kilometer. Note that these two parameters do not necessarily exhibit the same type of variation: the variations of H_min and C_1 for marathoner M1, who finished last, and M4, who finished first, are very similar. This indicates that both the first and the last runners experienced the same variation in spectrum, meaning the same change in regularity. Despite finishing last, M1 managed to adjust and pace his race similarly to M4. It means that, despite his lower performance level, he was able to adequately self-pace his race, which is an important factor of performance.
M4 and M5 correspond to the same runners in different instances. Figure 5 indicates that his rates of change behave in a very different way; this can be interpreted as showing that the runner’s shape and training state have a strong influence on the pacing strategy and this can be captured by multifractal analysis.
Runner M6, being the only female participant, presents particularly interesting multifractal characteristic (with notably high H_min and C_1, and a minimal C_2). However, drawing definitive conclusions or generalizations from a single female participant is not scientifically realistic or robust. At this point, one can only say that the results of the only female runner indicate an interesting direction for future investigation. Additional female physiological data during marathon races are essential for a valid comparative analysis of multifractal characteristics between genders. This is a critical limitation of our study and suggests that future research should explicitly include a larger sample of female runners to meaningfully explore potential gender-based differences in physiological multifractality.
Our study suggests that multifractal analysis can provide valuable feedback for optimizing pacing strategies. Indeed, the analysis reveals that multifractal parameters detect changes in physiological signals due to fatigue, especially around the 30th kilometer mark. The study also shows that better-ranked runners had more uniform regularity in their physiological signals, confirming the results derived in [27,28].
4. Additional Considerations
Joyner’s contributions to this field established a conceptual framework for understanding the limits of human endurance performance [2]. His model has been employed to investigate the theoretical potential for marathon times under optimal conditions. Nevertheless, this approach did not consider the optimization of pacing strategy, as the constant speed was assumed to be optimal. However, a recent study analyzing the best performance on marathons, showed that marathon performance depends on pacing oscillations between asymmetric extreme values [5]. The variation of parameters between the two parts of the race provides insight into the evolution of the corresponding quantity. However, to assess the significance of this change, it must be compared to its initial value. Therefore, in the perspective of self-improving the runner’s performance in the next marathon, we propose the examination of the rate of change of the multifractal parameters (Hmin,C1,C2 ) in Figure 7, as a biofeedback for improving the pace management that could constitute the fourth dimension of the marathon performance. In light of the necessity for self-improvement in order to enhance performance in the forthcoming marathon, we propose the rate of change of the multifractality parameters as a biofeedback mechanism for the improvement of pace management. This could constitute the fourth dimension of the marathon performance.
5. Conclusions
In this study, a recently introduced technique, WS-MFA, has been employed to quantify the multifractality of time series collected during marathons. Its advantage over previously introduced techniques has been demonstrated for the data that are considered in the present article: it is the consequence of their extreme irregularity, a challenge that was not met previously in the domains of applications of other multifractal methods, and which was put in evidence by the (global and pointwise) function space modelling approach that we developed.
We have shown that WS-MFA provides a comprehensive view of the individual performance of marathon runners, identifying alterations in physiological signals resulting from fatigue and optimizing race pace strategies. Therefore, it yields a comprehensive perspective on individual performance offering a new way to understand the complex dynamics of physiological signals during marathons. This approach can help optimize training and pacing strategies to improve performance.
We examined the multifractality characteristics of marathons achieved by a diverse group of recreational runners, including individuals of varying age, gender, and performance levels. Considering the afore-mentioned diversity, we standardized the performance in percentage of the world performance for each individual category.
Our results show a possible use of multifractality parameters for fatigue detection: around the 30th kilometer (the typical onset points of heightened fatigue), changes in these parameters indicate increased physiological stress and altered pacing behavior.
They constitute sensitive indicators of when fatigue significantly alters physiological signals:
- Changes in (Hmin, C1,C2 ) from the first to the last segments of the race clearly highlight the physiological impact of fatigue on the runner. In particular, significant decreases in Hmin over the course of a marathon (particularly around the 30 km mark) suggest increased physiological stress and onset of fatigue.
- Early detection through multifractal analysis could help runners and coaches adjust pacing strategies proactively, thereby optimizing performance.
A major limitation of our study is the little amount of data that we analyzed. Clearly, a more comprehensive data set would be necessary in order to confirm our conclusions, encompassing not only the heart rate but also the cadence and speed, and bearing on more runners in order to apply statistical tools. It is imperative to persuade a greater number of marathon runners to share their data with the goal of validating it in open source. This would facilitate the development of an algorithm capable of providing an index of race optimization, thereby preventing the majority of recreational marathoners, and even some elites, from encountering the phenomenon commonly referred to as the “marathon wall.” In the context of the Olympic Games, the allocation of medals is contingent upon pacing strategies, underscoring the importance of this endeavor.
We note that WS-MFA is a very recent technique, and practical and statistical studies are still missing in order to optimize the shape of the (θ,ω) boxes that are used. Such studies should lead to sharper estimations of multifractality parameters.
Another important issue would consist in identifying the sources of multifractality by comparing the multifractality parameters that we derived with those of shuffled and surrogate data, see e.g., [32,33] where such analyses have been performed (in contexts of applications which differ from the one considered in the present article).
Another perspective of future research is to back the multifractality estimation parameters that we derived by statistical error bars, which would allow for firmly grounded classification tools. In this direction, a significant step was the introduction by P. Abry and H. Wendt of bootstrap methods to estimate scaling exponents, improving accuracy when only a few scales are available [34]. Bayesian methods introduced by S. Combrexelle, H. Wendt, N. Dobigeon, J.-Y. Tourneret, S. McLaughlin and P. Abry, significantly improved the estimation of these quantities [35], see also [36] where the underlying assumptions concerning the multiscale quantities are discussed and new statistical estimators of the multifractality parameters are proposed. A promising perspective is to apply these techniques to marathon runners’ data.
6. Patents
This section is not mandatory but may be added if there are patents resulting from the work reported in this manuscript.
Author Contributions
Conceptualization, V.B. and S.J.; methodology, G.S and W.B.; data curation, F.P.; writing—original draft preparation, G.S and W.B.; supervision, V.B and S.J.; All authors have read and agreed to the published version of the manuscript.
Institutional Review Board Statement
The study was conducted in accordance with the Declaration of Helsinki and approved by the Institutional Review Board of “CPP Sud-Est V, Grenoble, France; reference: 2018-A01496-49” for studies involving humans.
Informed Consent Statement
Informed consent was obtained from all subjects involved in the study. Written informed consent has been obtained from the patient(s) to publish this paper.
Data Availability Statement
The data presented in this study are available on request from the corresponding author.
Conflicts of Interest
The authors declare no conflicts of interest.
References
- Billat, V.; Mille-Hamard, L.; Meyer, Y.; Wesfreid, E. Detection of changes in the fractal scaling of heart rate and speed in a marathon race. Physica A: Stat. Mech. Its Appl. 2009, 388, 3798–3808. [CrossRef]
- Joyner, M.-J. Modeling: optimal marathon performance on the basis of physiological factors. J. Appl. Physiol. 1991, 70, 683–687. [CrossRef]
- Tucker, R.; Lambert, M.-I.; Noakes, T.-D. An analysis of pacing strategies during men’s world-record performances in track athletics. Int. J. Sports Physiol. Perform. 2006, 1, 233–245. [CrossRef]
- Billat, V.L.; Palacin, F.; Correa, M.; Pycke, J.R. Pacing strategy affects the sub-elite marathoner’s cardiac drift and performance. Front. Psychol. 2020, 10, 3026. [CrossRef]
- Pycke, J.-R.; Billat, V. Marathon performance depends on pacing oscillations between non symmetric extreme values. Int. J. Environ. Res. Public Health 2022, 19, 2463. [CrossRef]
- Billat, V. Interval training for performance: a scientific and empirical practice: special recommendations for middle-and long-distance running. Part I: aerobic interval training. Sports Med. 2001, 31, 13–31. [CrossRef]
- Bardet, J.-M.; Billat, V.; Kammoun, I. Modélisation des fréquences cardiaques instantanées durant un marathon et estimation de leurs paramètres fractals. J. Société Française de Statistique 2009, 150, 101–126.
- Ivanov, P.C.; Nunes Amaral, L.A.; Goldberger, A.L.; Havlin, S.; Rosenblum, M.G.; Struzik, Z.R.; Stanley, H.E. Multi-fractality in human heartbeat dynamics. Nature 1999, 399, 461–465. [CrossRef]
- Kantelhardt, J.W.; Zschiegner, S.A.; Koscielny-Bunde, E.; Havlin, S.; Bunde, A.; Stanley, H.E. Multifractal detrended fluctuation analysis of nonstationary time series. Physica A 2002, 316, 87–114. [CrossRef]
- Goldberger, A.-L.; Amaral, L.-A.N.; Hausdorff, J.-M.; Ivanov, P.-Ch.; Peng, C.-K; Stanley, H.-E. Fractal dynamics in physiology: alterations with disease and aging. Proc. Natl. Acad. Sci. 2002, 99 (Suppl. 1), 2466–2472. [CrossRef]
- P.C. Ivanov, L.A. Nunes Amaral, A.L. Goldberger, S. Havlin, M.G. Rosenblum, Z.R. Struzik, and H.E. Stanley. Multi-fractality in human heartbeat dynamics. Nature, 399:461–465, 1999. [CrossRef]
- A-L. Goldberger, L-AN. Amaral, J-M. Hausdorff, P-Ch. Ivanov, C-K Peng, and H-E. Stanley. Fractal dynamics in physiology: alterations with disease and aging. Proceedings of the national academy of sciences, 99(suppl1):2466–2472,2002. [CrossRef]
- E. Wesfreid, V-L. Billat, and Y. Meyer. Multifractal analysis of heartbeat time series in human races. Applied and Computational Harmonic Analysis, 18(3):329–335, 2005. [CrossRef]
- S-W. Ducharme and R-EA. van Emmerik. Multifractality of unperturbed and asymmetric locomotion. Journal of Motor Behavior, 2019.
- E-AF. Ihlen. Introduction to multifractal detrended fluctuation analysis in Matlab. Frontiers in physiology, 3:141, 2012. [CrossRef]
- J.-F. Muzy, E. Bacry, and A. Arneodo. Wavelets and multifractal formalism for singular signals: Application to turbulence data. Physical review letters, 67(25):3515, 1991. [CrossRef]
- P. Terrier and O. Dériaz. Kinematic variability, fractal dynamics and local dynamic stability of treadmill walking. Journal of neuroengineering and rehabilitation, 8:1–14, 2011. [CrossRef]
- C. K. Rhea, A. W. Kiefer, M. W. Wittstein, K. B. Leonard, R. P. MacPherson, W. G. Wright, and F. J. Haran. Fractal gait patterns are retained after entrainment to a fractal stimulus. PLoS One, 9(9):e106755, 2014. [CrossRef]
- E. Sejdic, K. A. Lowry, J. Bellanca, M. S. Redfern, and J. S. Brach. A comprehensive assessment of gait accelerometry signals in time, frequency and time-frequency domains. IEEE Transactions on Neural Systems and Rehabilitation Engineering, 22(3):603–612, 2013. [CrossRef]
- S. Jaffard, C. Melot, R. Leonarduzzi, H. Wendt, S.G. Roux, and P. Torres, M.E. and Abry. p-exponent and p-leaders, Part I: Negative pointwise regularity. Physica A, 448:300–318, 2016. [CrossRef]
- R. Leonarduzzi, H. Wendt, S.G. Roux, M.E. Torres, C. Melot, S. Jaffard, and P. Abry. p-exponent and p-leaders, Part II: Multifractal analysis. Relations to Detrended Fluctuation Analysis. Physica A, 448:319–339, 2016. [CrossRef]
- V.L. Billat, N. Blondel, and S. Berthoin. Determination of the velocity associated with the longest time to exhaustion at maximal oxygen uptake. European journal of applied physiology and occupational physiology, 80:159–161, 1999. [CrossRef]
- H. Wendt, P. Abry, K. Kiyono, J. Hayano, E. Watanabe, and Y. Yamamoto. Wavelet p-leader non gaussian multiscale expansions for heart rate variability analysis in congestive heart failure patients. IEEE T. Biomedical Engineering,66(1):80–87, 2019. [CrossRef]
- H. Wendt and P. Abry. Multifractality tests using bootstrapped wavelet leaders. IEEE Transactions on Signal Processing,55(10):4811–4820, 2007. [CrossRef]
- P. Abry, P. Chainais, L. Coutin, and V. Pipiras. Multifractal random walks as fractional Wiener integrals. IEEE Transactions on Information Theory, 55(8):3825–3846, 2009. [CrossRef]
- E. Bacry, J. Delour and J.F. Muzy. Multifractal random walk. Physical review E, 64(2):026103, 2001. [CrossRef]
- F. Palacin, L. Poinsard, J-R. Pycke, and V. Billat. A pilot study using entropy for optimizing self-pacing during a marathon. Entropy, 25(8):1119, 2023. [CrossRef]
- F. Palacin, L. Poinsard, and V. Billat. Multidimensional analysis of physiological entropy during self-paced marathon running. Sports, 12(9):252, 2024. [CrossRef]
- E. Wesfreid and V. Billat. Randomness and changes of heart rate and respiratory frequency during high altitude mountain ascents without acclimatization. Physica A: Statistical Mechanics and its Applications, 391(4):1575–1590,2012. [CrossRef]
- W. Ben Nasr, V. Billat, S. Jaffard, F. Palacin, and G. Saës. The weak scaling multifractal spectrum: Mathematical setting and applications to marathon runners’ physiological data. Proceedings of the FARF IV conference, pp. 105-153, Springer, 2022.
- S. Jaffard. Wavelet techniques in multifractal analysis. In M. Lapidus and M. van Frankenhuijsen, editors, Fractal Geometry and Applications: A Jubilee of Benoît Mandelbrot, Proc. Symp. Pure Math., volume 72(2), pages 91–152.AMS, 2004.
- P. Abry, Y. Malevergne, H. Wendt, M. Senneret, L. Jaffres, and B. Liaustrat. Shuffling for understanding multifractality, application to asset price time series. In 2019 27th European Signal Processing Conference (EUSIPCO), pages 1–5. IEEE, 2019.
- H. Wendt, L. Leon, J-Y. Tourneret, and P. Abry. Multifractal anomaly detection in images via space-scale surrogates. In 2022 IEEE International Conference on Image Processing (ICIP), pages 556–560. IEEE, 2022.
- H. Wendt, P. Abry, and S. Jaffard. Bootstrap for empirical multifractal analysis. IEEE signal processing magazine,24(4):38–48, 2007. [CrossRef]
- S. Combrexelle, H. Wendt, N. Dobigeon, J.-Y. Tourneret, S. McLaughlin, and P. Abry. Bayesian estimation of the multifractality parameter for image texture using a Whittle approximation. IEEE Transactions on Image Processing,24(8):2540–2551, 2015. [CrossRef]
- W. Ben Nasr and S. Halconruy, H. Jaffard. Questioning normality: A study of wavelet leaders distribution, available on : https://arxiv.org/pdf/2503.08821. preprint, 2025.
Figure 1.
A representation of a realization of a Multifractal Random Walk (MRW) with an exponent H=0.6 and λ=0.03.
Figure 1.
A representation of a realization of a Multifractal Random Walk (MRW) with an exponent H=0.6 and λ=0.03.
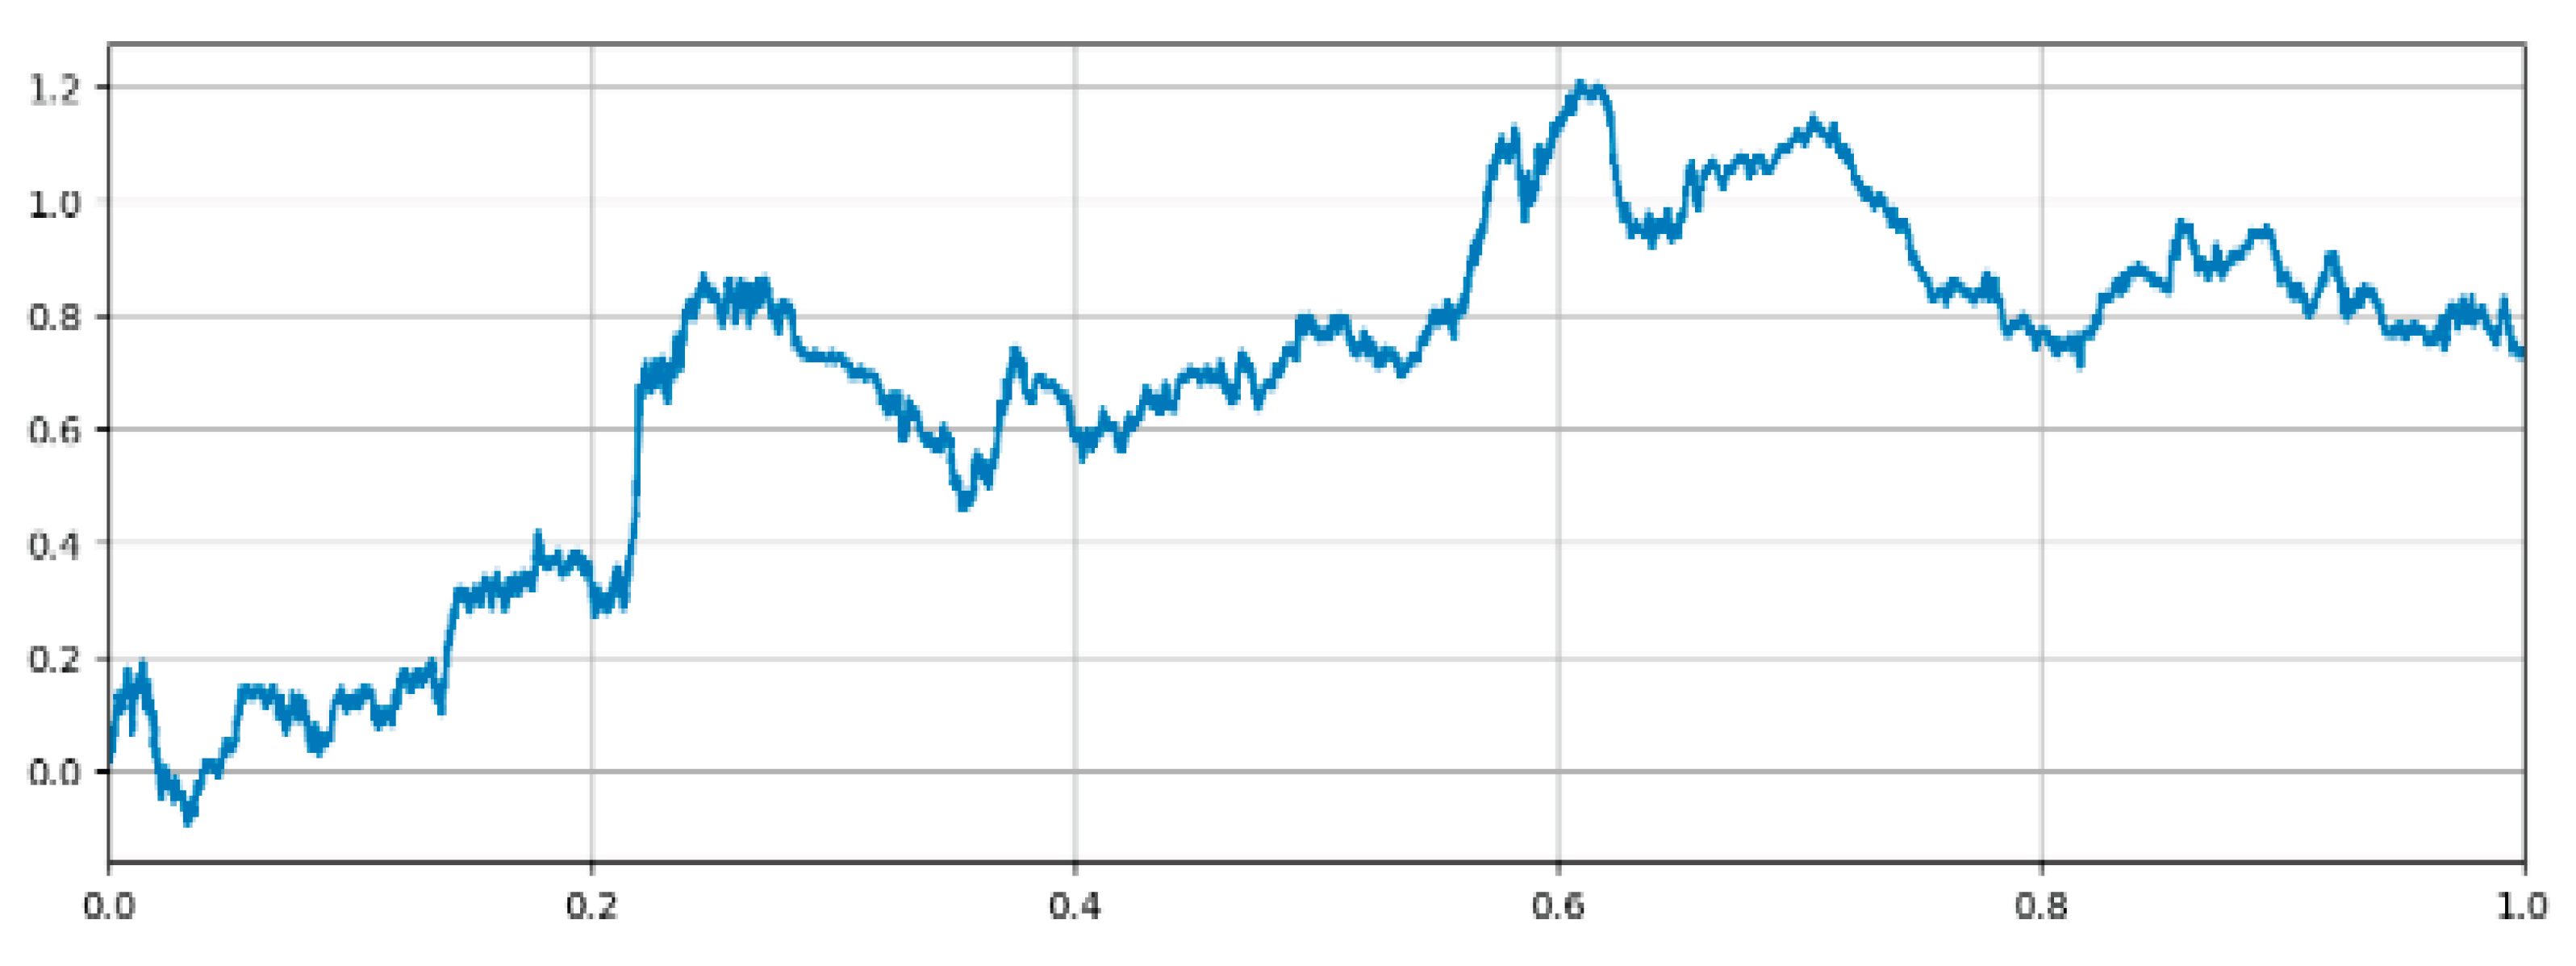
Figure 2.
The multifractal spectrum of an MRW with H=0.6 is shown in black: (top) the original process whitout fractional derivative, (middle) a fractional derivative of order 0.6, and (bottom) a fractional derivative of order 1. For each case, the corresponding Legendre spectrum is estimated using leaders (blue), 1-leaders (red), and (θ,ω)-leaders (purple). In the top figure, we see that the three estimation methods retrieve the theoretical spectrum. In the middle figure, the leaders do not provide a good estimation because H_min<0. In the bottom figure, both the 1-leaders and the leaders fail because the wavelet scaling function is significatively negative. Only the (θ,ω)-leaders provide a correct estimation of the spectrum in that last case.
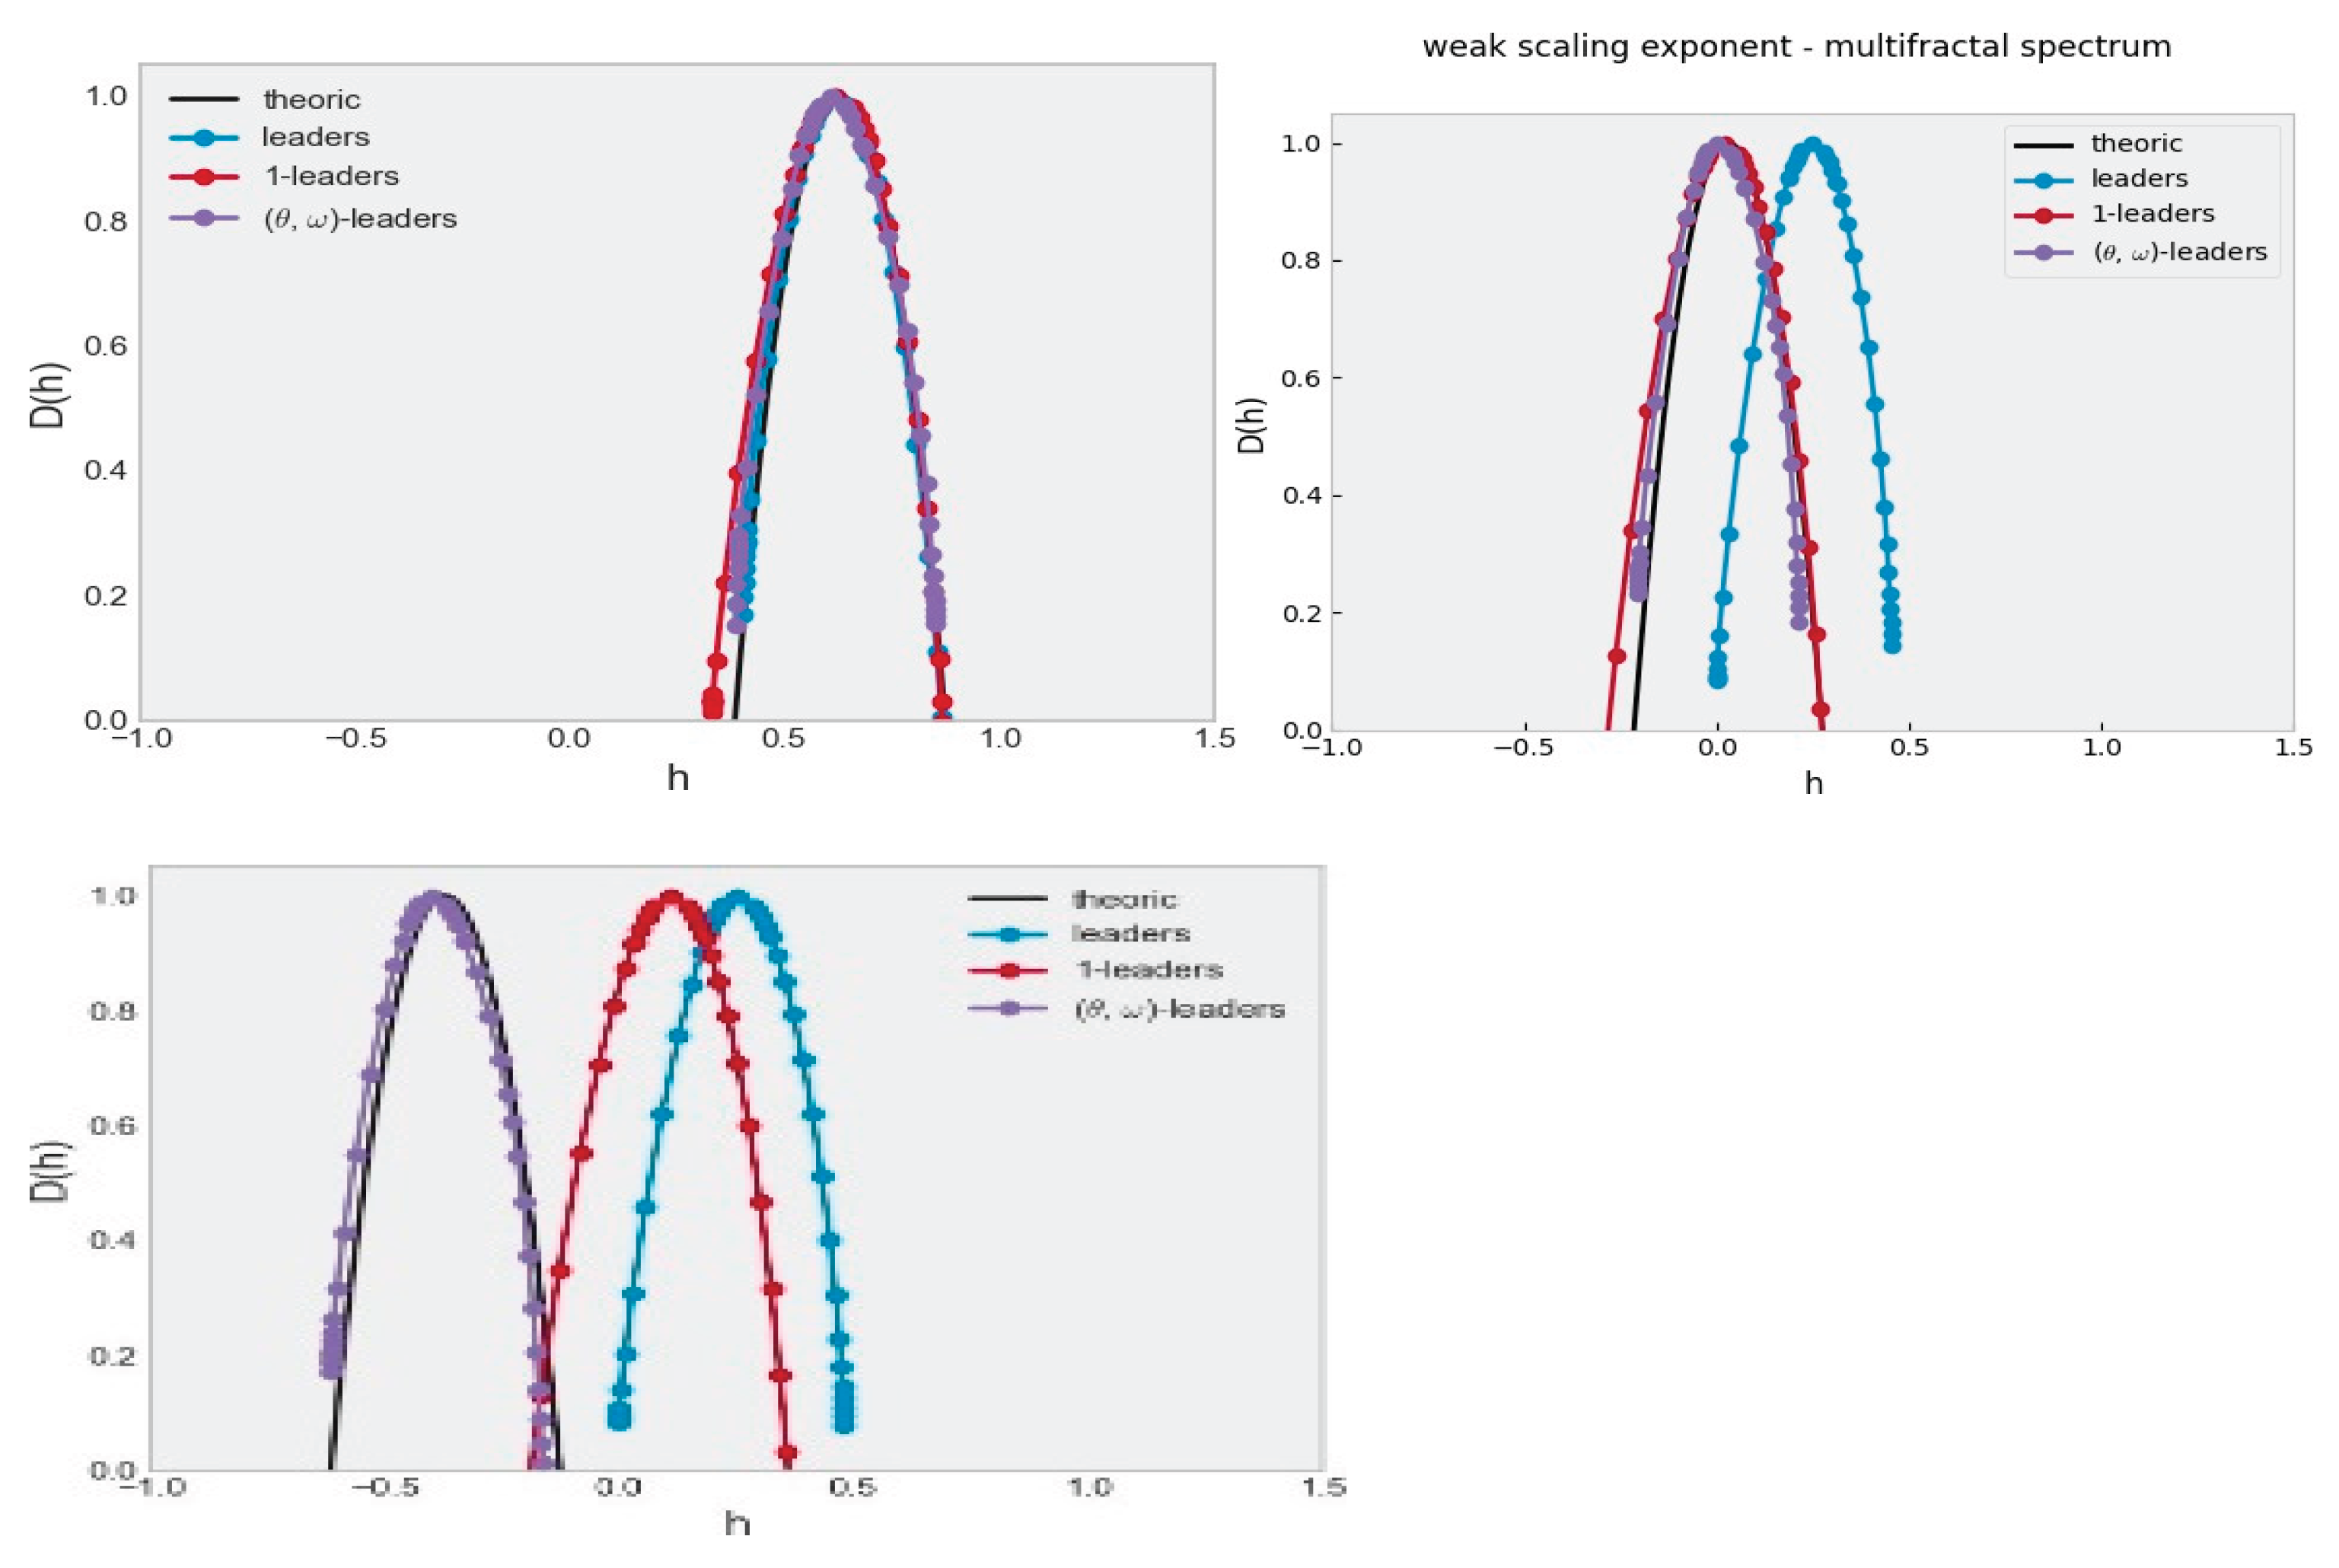
Figure 3.
Raw (top) and denoised (bottom) heart rate signals of the marathon runner M3. The raw signal contains some singularities and measurement artifacts, which have been removed in the denoised version using the algorithms described in the Addendum in order to to eliminate artefacts.
Figure 3.
Raw (top) and denoised (bottom) heart rate signals of the marathon runner M3. The raw signal contains some singularities and measurement artifacts, which have been removed in the denoised version using the algorithms described in the Addendum in order to to eliminate artefacts.
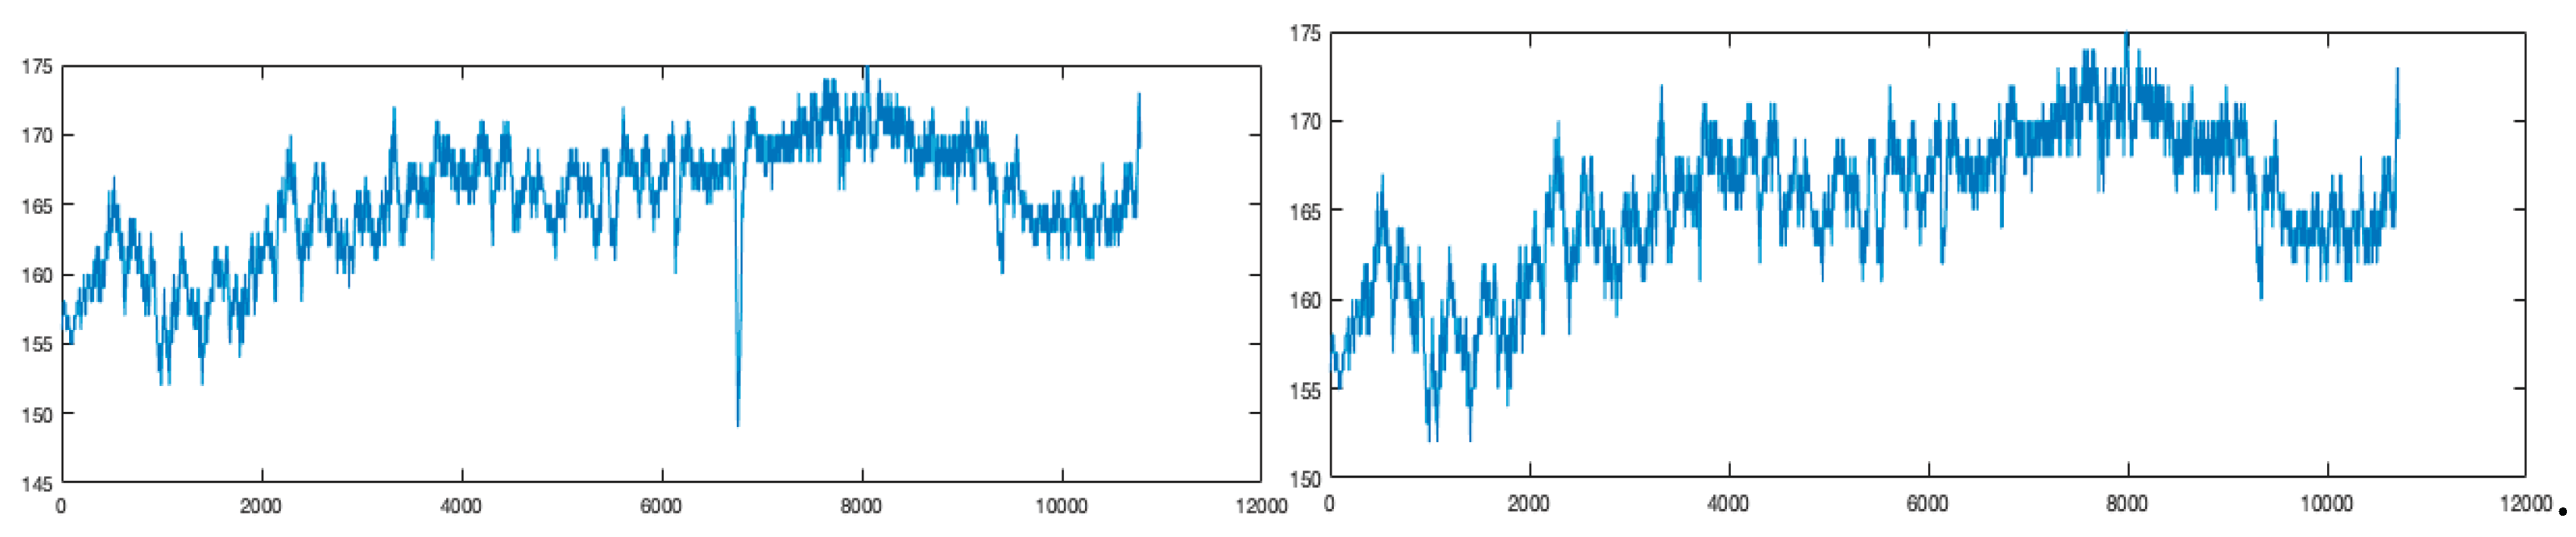
Figure 4.
Representation of H_min (on the left) and C_1 (on the right) as a function of each marathoner’s percentage record. Runners in blue participated in the Paris Marathon, while those in black participated in other marathons. The percentage record is calculated as the ratio of the marathoner’s race time to the reference record of their respective category, based on gender and age. A lower percentage indicates a better performance, as it reflects a time closer to (or better than) the reference record, while a higher percentage corresponds to a slower performance relative to the category standard.
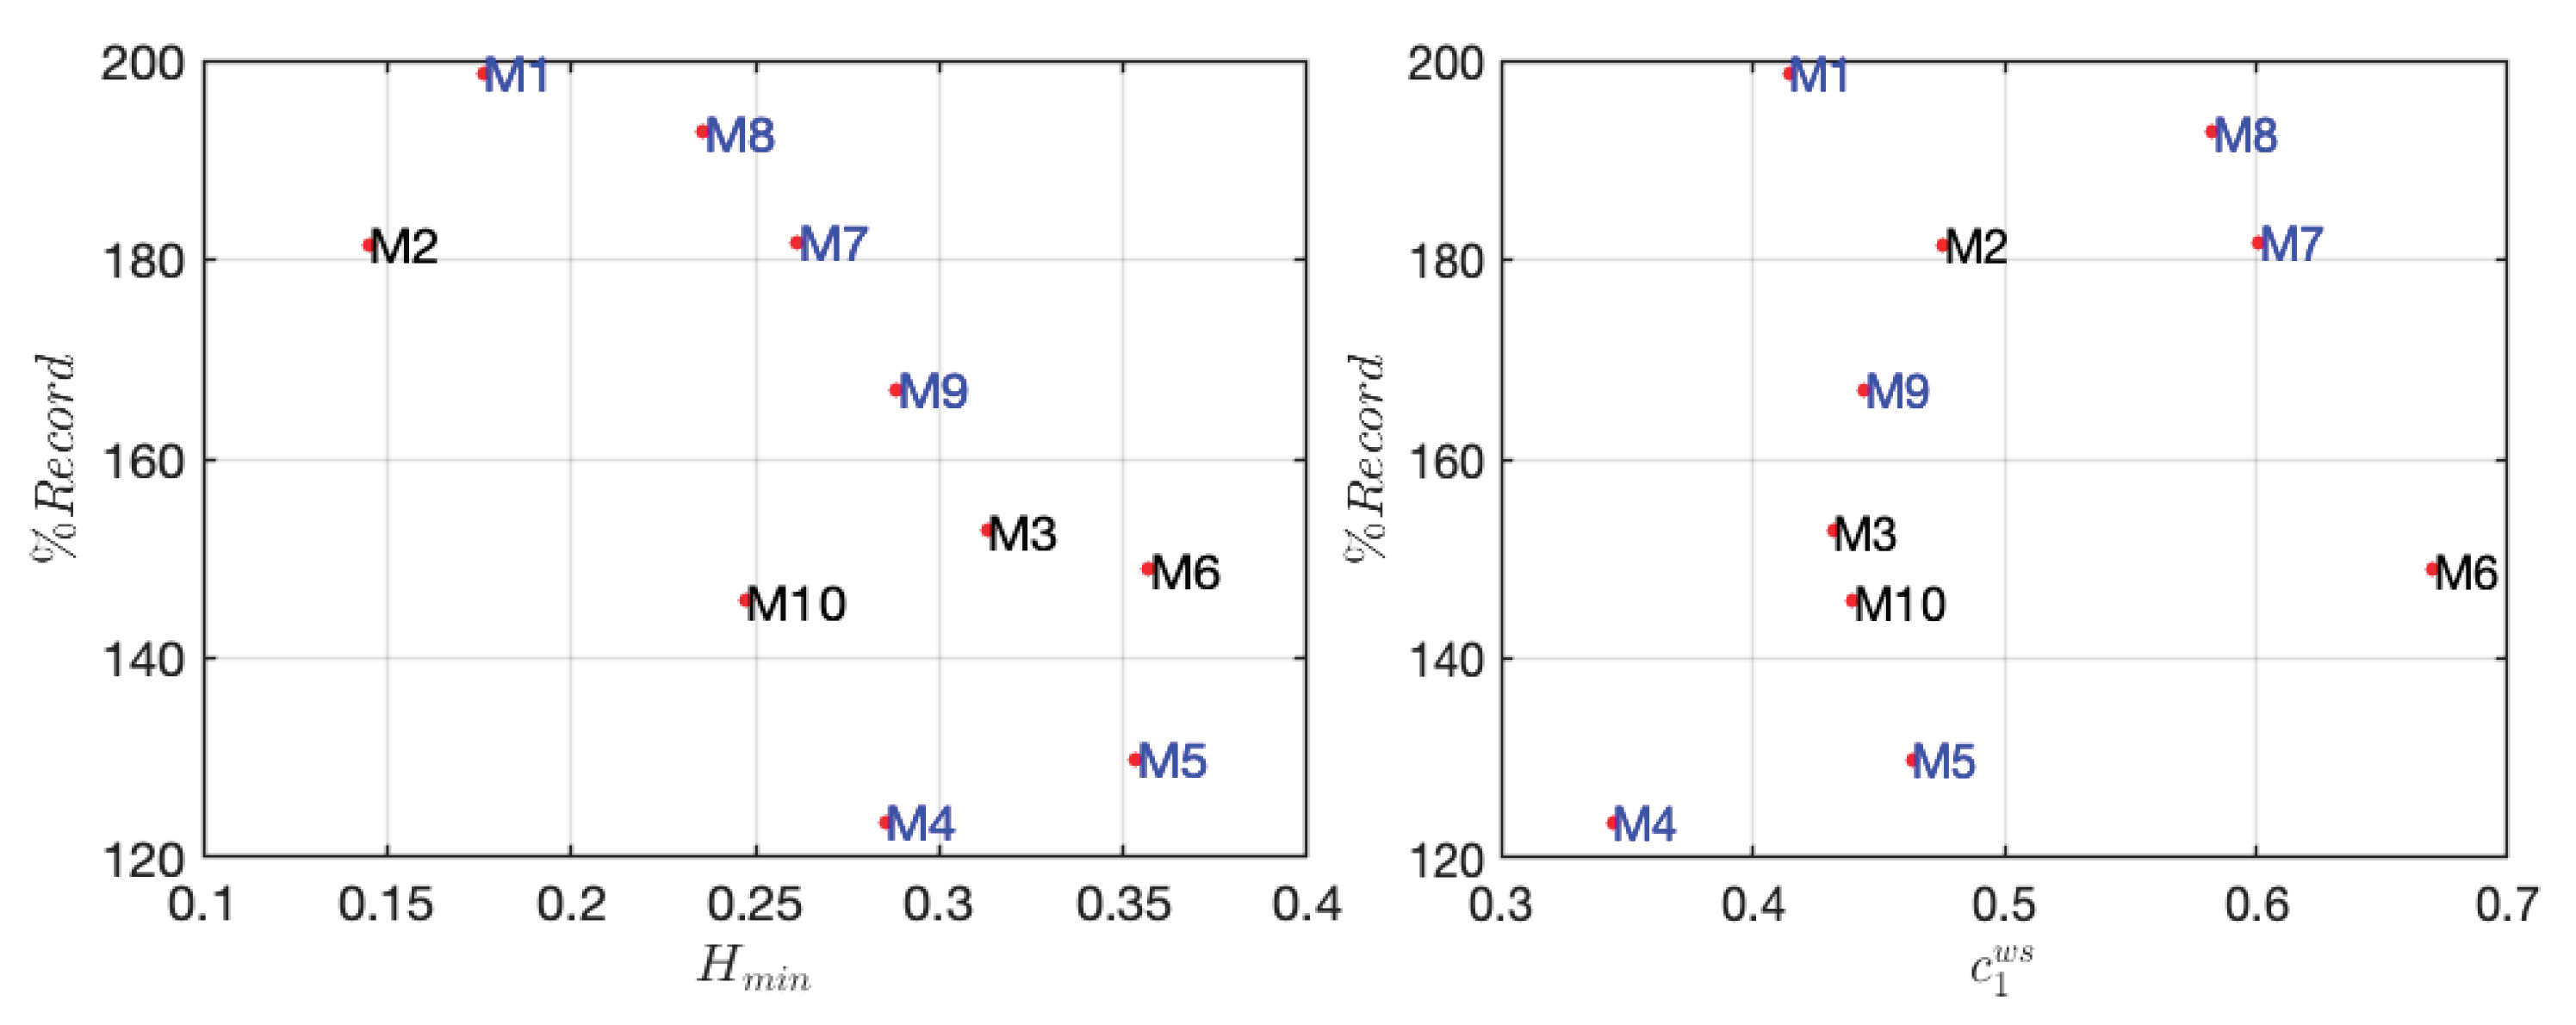
Figure 5.
A representation of a realization of a Multifractal Random Walk (MRW) with an exponent H=0.6 and λ=0.03.
Figure 5.
A representation of a realization of a Multifractal Random Walk (MRW) with an exponent H=0.6 and λ=0.03.
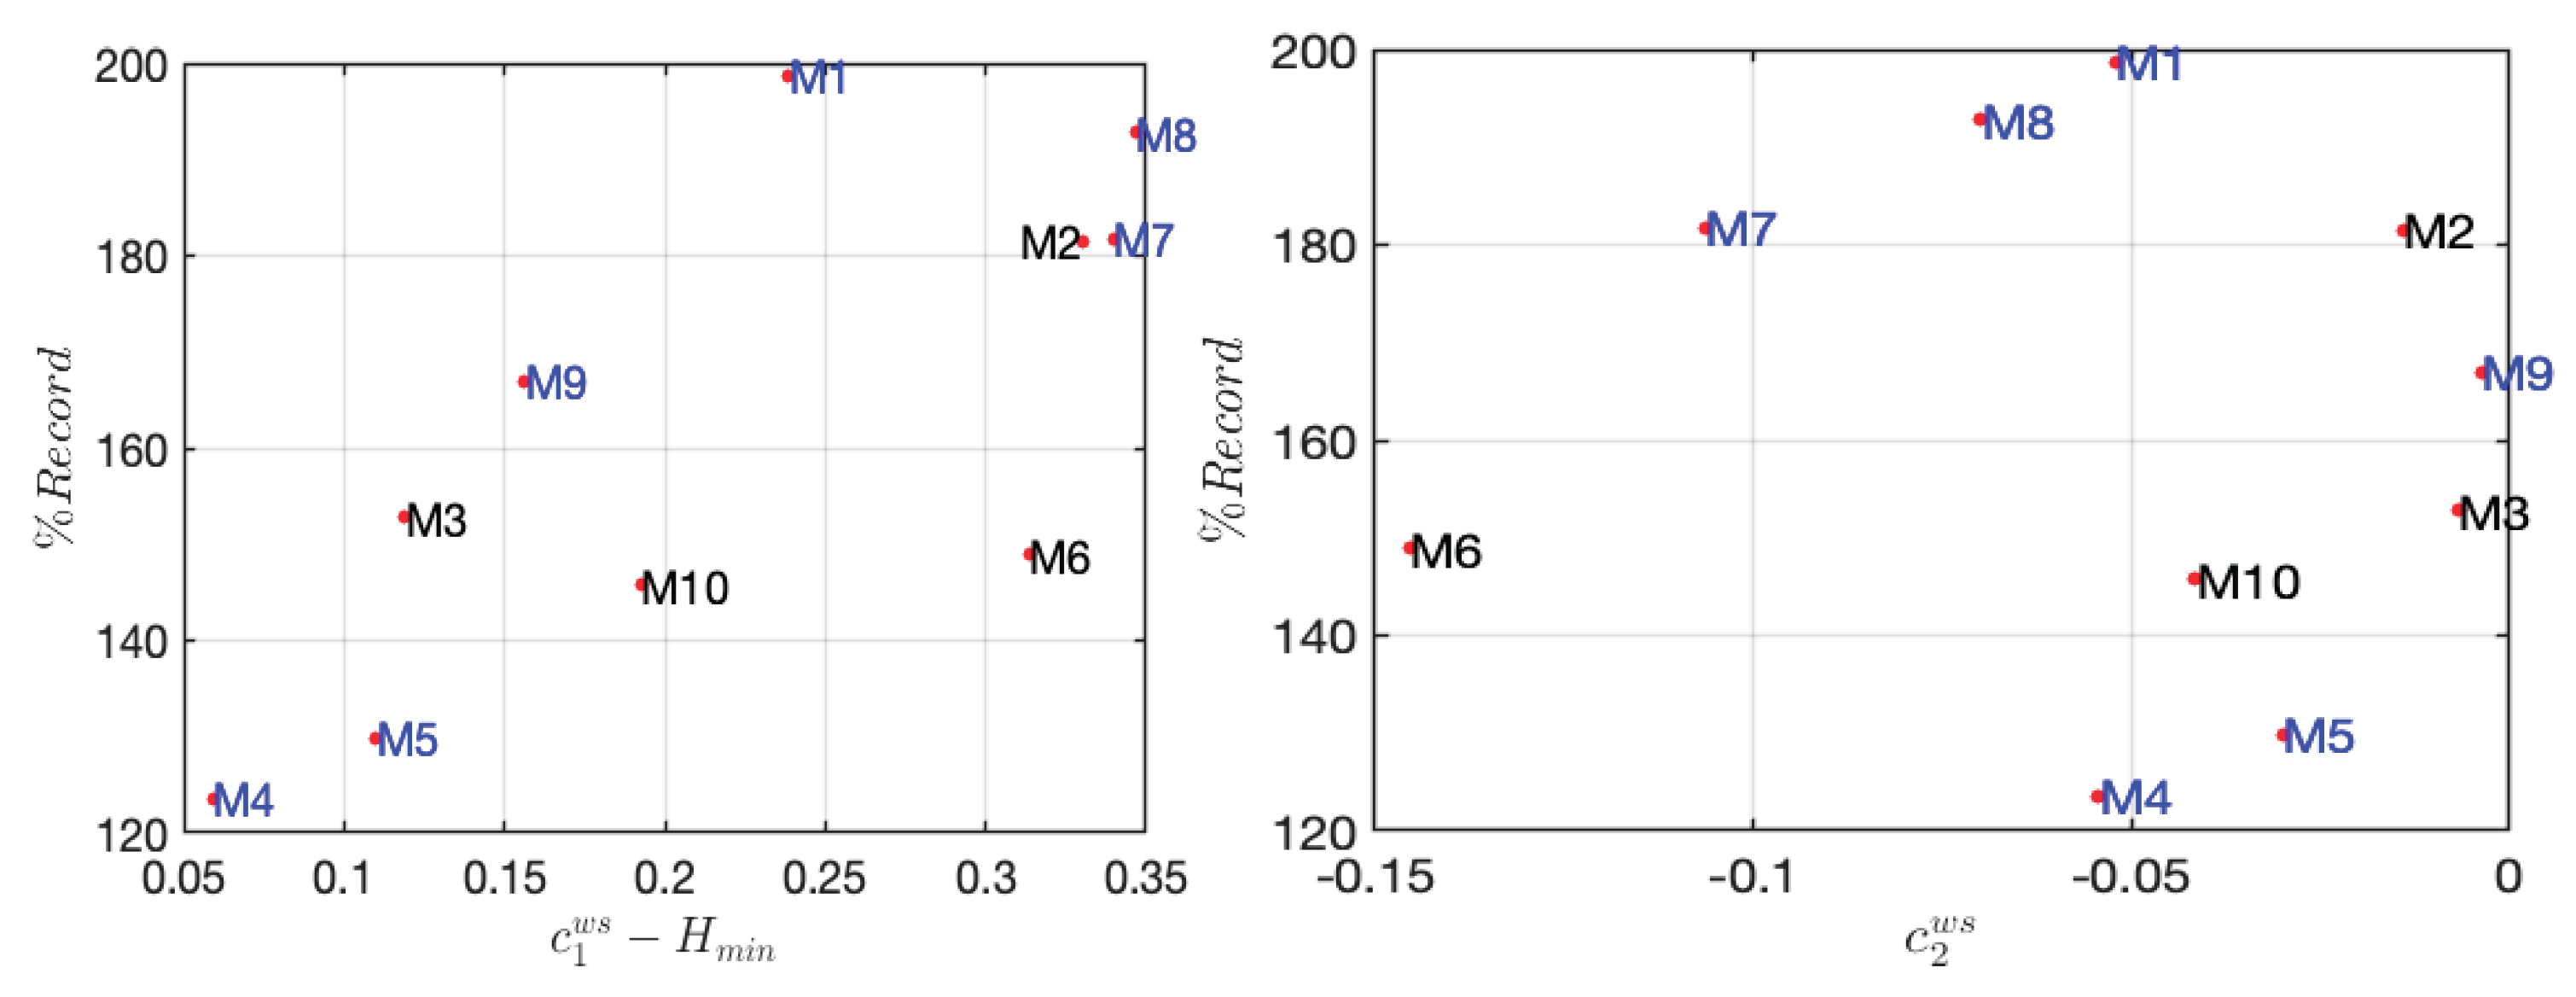
Figure 7.
Representation of the rate of change of Hmin, C1 and C2 as a function of each marathoner’s record. Runners in blue participated in the Paris Marathon, while those in black participated in other marathons.
Figure 7.
Representation of the rate of change of Hmin, C1 and C2 as a function of each marathoner’s record. Runners in blue participated in the Paris Marathon, while those in black participated in other marathons.
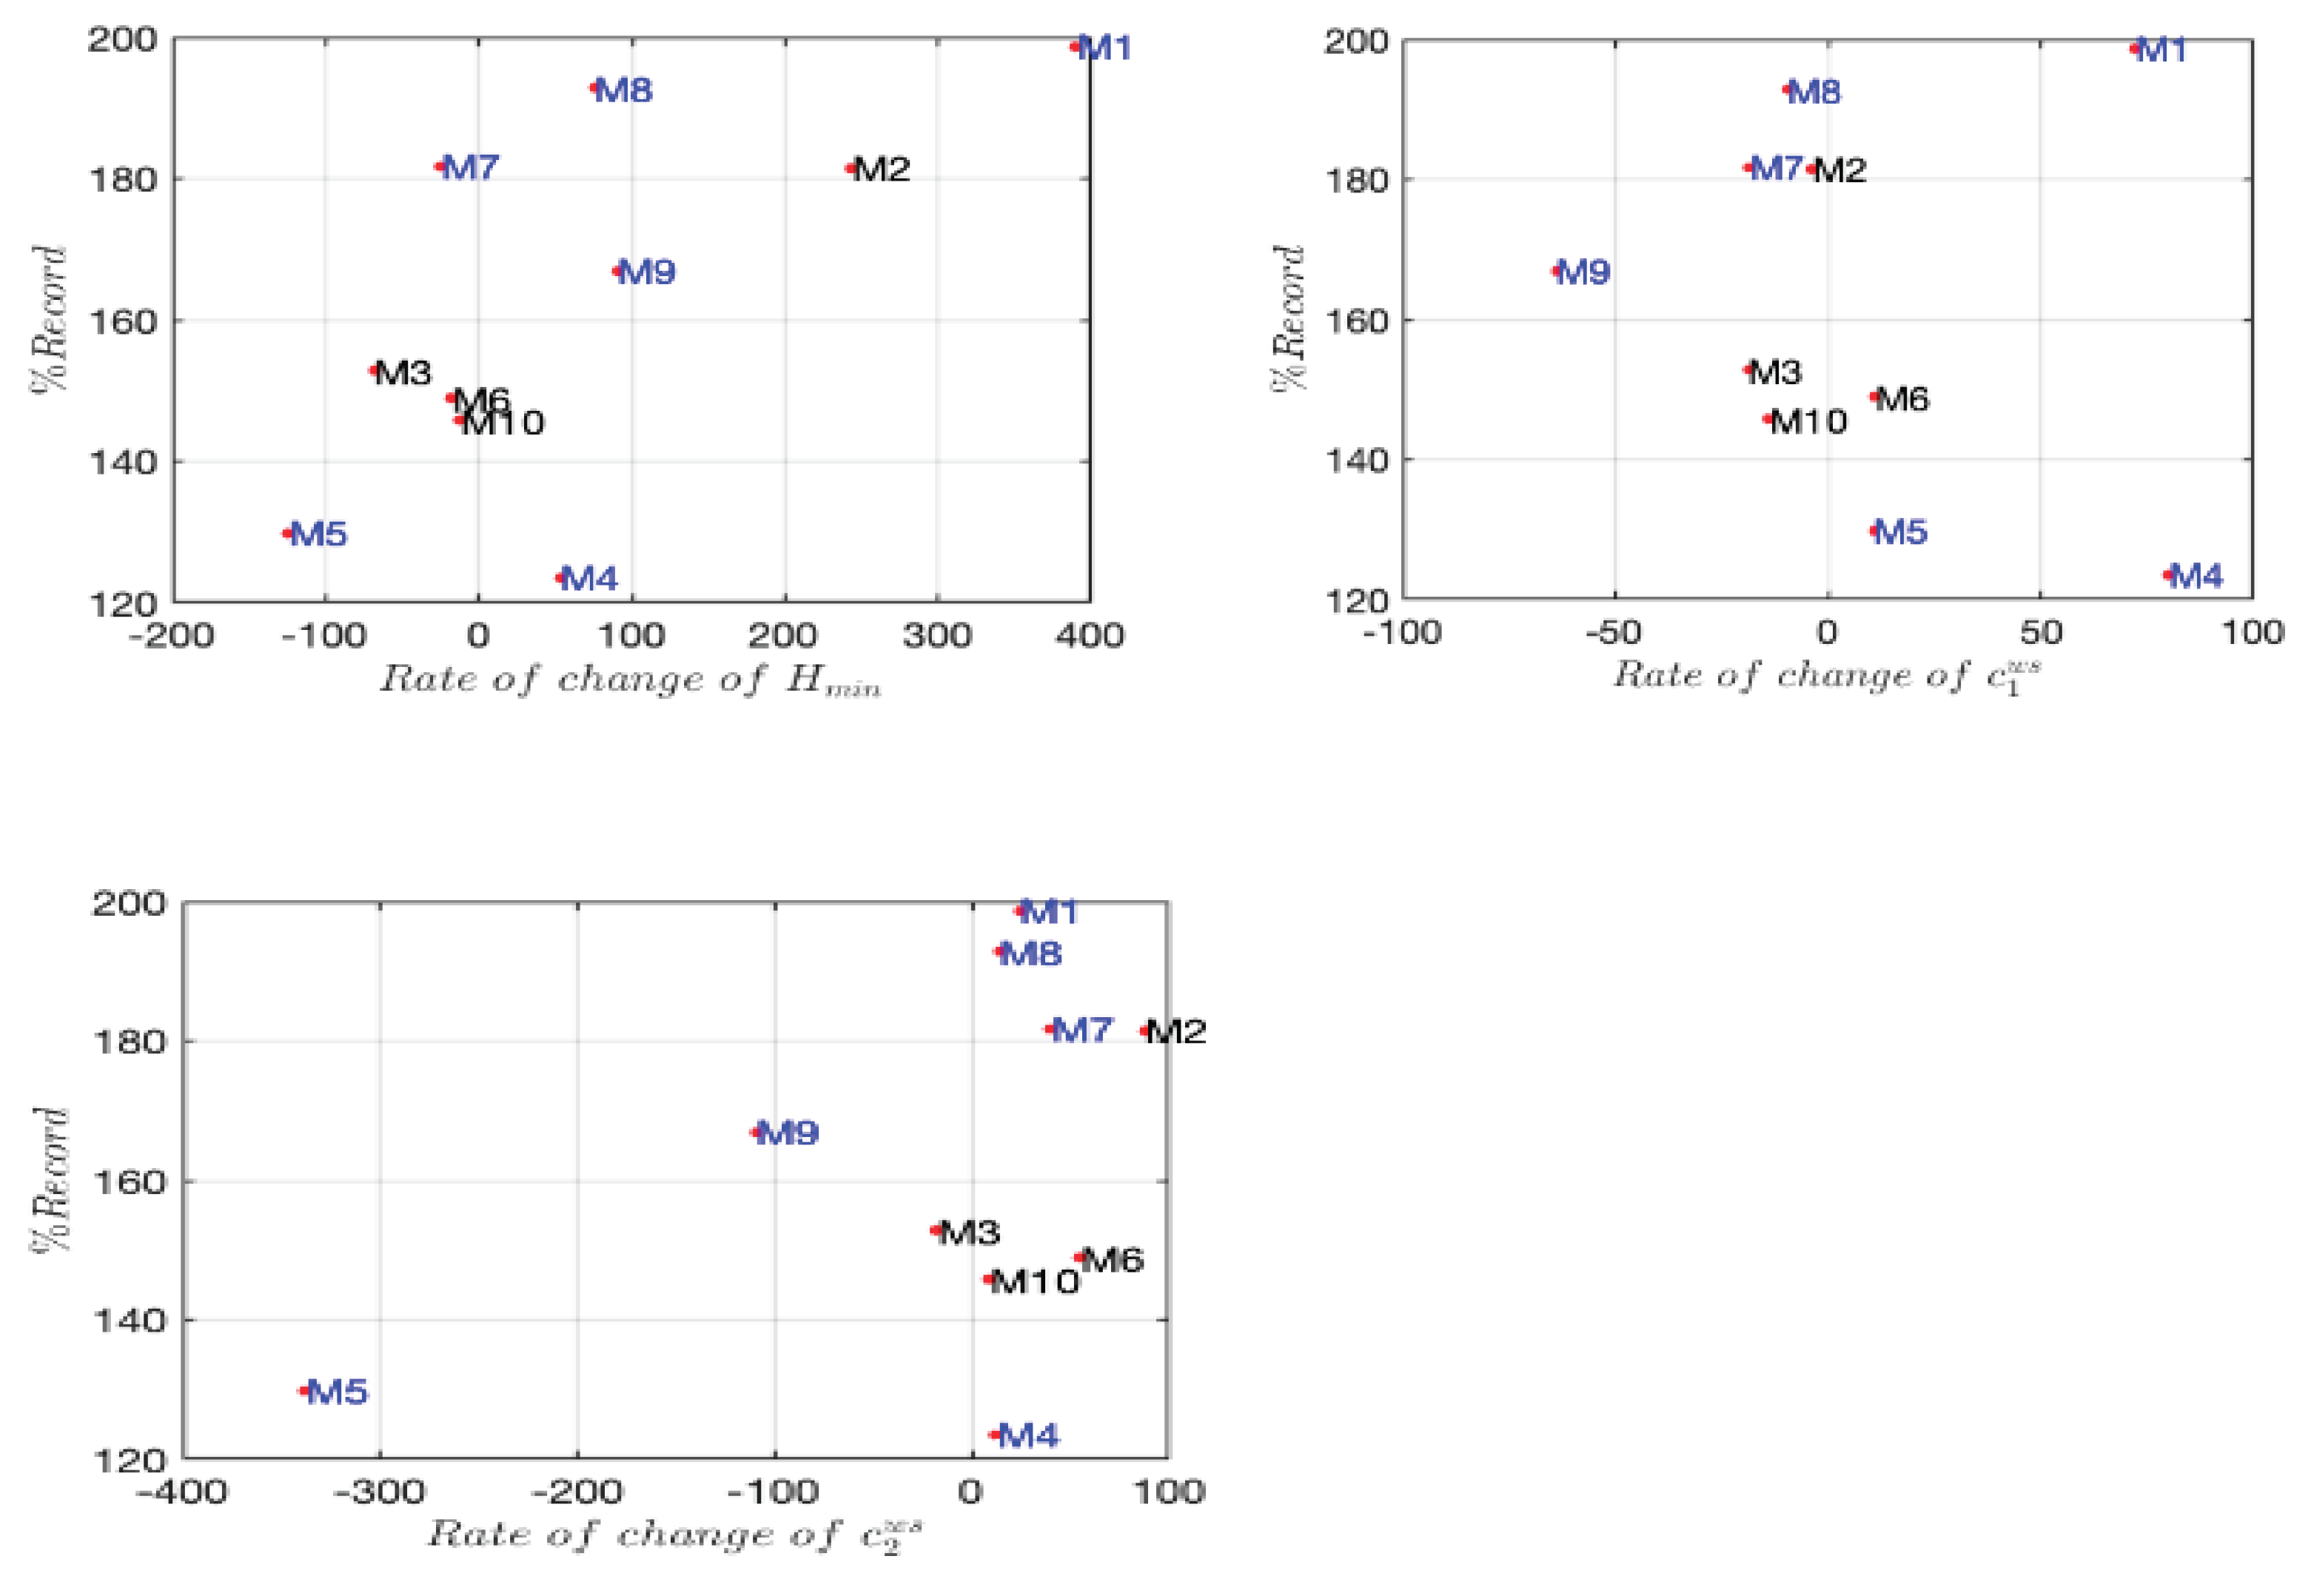

Table 1.
Key parameters in p-leader multifractal analysis.
| Parameter | Physiological meaning (illustrative) | Interpretation |
| (minimum Hölder exponent) | Minimum regularity present in the signal; identifies the strongest singularities (e.g., abrupt changes or bursts). | may reflect sudden surges or reductions in heart rate, speed or cadence. |
| (first log-cumulant) | Equivalent to the average Hölder exponent and analogous to the Hurst exponent. | [24]. |
| (second log-cumulant) | Measures the width of the multifractal spectrum and thus the degree of multifractality (intermittency). | is always negative; values close to zero indicate monofractality (little variability), whereas larger negative values denote a broader spectrum and richer dynamics [24]. |
| (exponent) | (equivalent to classical wavelet leaders). | can reveal different aspects of the signal. |
| -leader | and the multifractal spectrum | Provides a robust framework applicable to non-stationary signals and allows negative regularities [20]. |
Table 2.
Characteristics and performance metrics of marathon runners, including time performance, marathon name, age, weight, and height. Runner M6 is the only female participant, and runners M4 and M5 represent the same individual with two different performances. Rankings are based on the percentage of time relative to the record for each gender and age category. Runners highlighted in blue are those who participated in the Paris Marathon.
| M1 | M2 | M3 | M4 | M5 | |
| Time | 4:07:06 | 3:45:37 | 3:05:07 | 2:52:42 | 2:47:50 |
| Marathon | Paris | Tokyo | Montpellier | Paris | Paris |
| Rank | 10 | 7 | 5 | 1 | 2 |
| Age | 44 | 41 | 37 | 50 | 48 |
| Weight (kg) | 79 | 72 | 79 | 65 | 67 |
| Height (cm) | 180 | 173 | 185 | 174 | 174 |
| M6 Women | M7 | M8 | M9 | M10 | |
| Time | 4:06:19 | 4:13:35 | 4:09:04 | 3:22:19 | 4:39:09 |
| Marathon | Sully sur Loire | Paris | Paris | Paris | La Rochelle |
| Rank | 4 | 8 | 9 | 6 | 3 |
| Age | 55 | 53 | 48 | 32 | 52 |
| Weight (kg) | 53 | 89 | 78 | 80 | 75 |
| Height (cm) | 170 | 178 | 171 | 181 | 180 |
Table 3.
Representation of different multifractal parameters (H_min,C_1,C_2) of the Heart rate of each marathon runner.
Table 3.
Representation of different multifractal parameters (H_min,C_1,C_2) of the Heart rate of each marathon runner.
| M1 | M2 | M3 | M4 | M5 | |
| 0.18 | 0.14 | 0.31 | 0.29 | 0.35 | |
| 0.41 | 0.47 | 0.43 | 0.34 | 0.45 | |
| -0.05 | -0.01 | -0.007 | -0.05 | -0.03 | |
| M6 Women | M7 | M8 | M9 | M10 | |
| 0.36 | 0.26 | 0.24 | 0.29 | 0.25 | |
| 0.67 | 0.60 | 0.59 | 0.44 | 0.44 | |
| -0.14 | -0.11 | -0.07 | -0.004 |
Disclaimer/Publisher’s Note: The statements, opinions and data contained in all publications are solely those of the individual author(s) and contributor(s) and not of MDPI and/or the editor(s). MDPI and/or the editor(s) disclaim responsibility for any injury to people or property resulting from any ideas, methods, instructions or products referred to in the content. |
© 2025 by the authors. Licensee MDPI, Basel, Switzerland. This article is an open access article distributed under the terms and conditions of the Creative Commons Attribution (CC BY) license (http://creativecommons.org/licenses/by/4.0/).
Copyright: This open access article is published under a Creative Commons CC BY 4.0 license, which permit the free download, distribution, and reuse, provided that the author and preprint are cited in any reuse.


