Submitted:
13 December 2025
Posted:
15 December 2025
You are already at the latest version
Abstract
Here we perform a detailed information-theoretic (IT) analysis of atomic electron densities in the Periodic Table, from hydrogen (Z = 1) to lawrencium (Z = 103). By use of the Shannon entropy, the Fisher information and the disequilibrium functional in both position and momentum spaces as fundamental descriptors of the atomic densities, the Periodic Table can be represented in our three-dimensional information space as a continuous, highly ordered manifold. The analysis shows that chemical periodicity naturally reveals a geometrical spiral at the coordinates of theoretic-information space (Shannon, Fisher, Disequilibrium), with each period forming one segment within the continuous global trajectory. We find information-theoretic signatures of shell structure, subshell filling, and electron-configuration anomalies, such as the familiar irregularities seen in chromium and copper. Through the uncertainty principle of complementary analysis in momentum space, more insights are gained by exposing maximal information-theoretic differentiation for lighter atoms and compression among heavy elements. We demonstrate, by considering triadic relationships and complexity properties in relation to the López-Mancini-Ruiz (LMC) and Fisher-Shannon (FS) functionals, that atomic complexity increases monotonically along with nuclear charge and we provide a quantitative measure of how organized atomic electron densities are distributed throughout the periodic system. Based on our IT analyses, the fundamental character of periodicity could be addressed by employing spiral representations that continue the characteristic of hydrogen, but also preserving the autonomy of the blocks of elements.
Keywords:
periodic table
; information theory
; Shannon entropy
; Fisher information
; complexity measures
; periodic spiral representation
; elements classification
1. Introduction
The periodic table of chemical elements stands as one of the most profound achievements in the history of science, representing not merely a classification scheme but a fundamental expression of natural law [1,2]. Since Dmitri Mendeleev’s groundbreaking work in 1869, the periodic system has evolved from a tool for organizing known elements into a predictive framework that continues to guide chemical research and understanding [3,4]. However, despite nearly 150 years of development and refinement, fundamental questions regarding the optimal representation and classification of elements—particularly hydrogen and helium—remain subjects of active debate [5,6].
1.1. Historical Development and Persistent Challenges
Mendeleev’s original periodic table of 1869 presented hydrogen in a position disconnected from other elements, reflecting even at that early stage an awareness of its unique chemical behavior [1]. In his revised table of 1871, hydrogen was placed at the head of the alkali metals in Group I, a position that has remained popular in many contemporary representations [2,5]. This placement was justified by hydrogen’s single valence electron and its ability to form unipositive ions, characteristics shared with the alkali metals. However, this classification has never been entirely satisfactory, as hydrogen also exhibits properties that align it with the halogens—including the formation of diatomic molecules and stable hydride anions [7,8,9].
The case of helium presents analogous difficulties. While universally placed among the noble gases in standard periodic tables due to its chemical inertness and complete valence shell, helium’s electronic configuration () is identical to that of the alkaline earth metals’ valence shells [10,11]. This similarity has led some researchers to propose alternative placements, most notably in Charles Janet’s left-step periodic table, where helium heads the alkaline earth metals [12,13,14].
The difficulty in definitively placing these elements reflects a deeper epistemological question: what constitutes the most fundamental criterion for element classification? The evolution of the periodic system has seen various approaches, from Mendeleev’s initial reliance on atomic mass and chemical properties to modern quantum mechanical descriptions based on electronic configurations [15,16]. Each approach offers insights, yet none has succeeded in resolving all anomalies and ambiguities within the system [4,5].
1.2. Criteria for Element Classification
Contemporary approaches to organizing the periodic table typically invoke several distinct criteria, each with its own strengths and limitations. The quantum mechanical approach, based on electronic configurations and the number of valence electrons, has become dominant in modern chemistry education [11,17]. This framework successfully explains much of chemical periodicity and provides a theoretical foundation grounded in fundamental physics. However, as Scerri has emphasized, the possession of a particular number of outer-shell electrons is "neither a necessary nor a sufficient condition for an element’s being in any particular group" [4]. Notable exceptions include transition metal triads such as nickel-palladium-platinum, which do not share identical valence configurations yet clearly belong to the same group based on chemical behavior [16,18].
Electronegativity has been proposed as an alternative classificatory principle, with proponents arguing that this property better captures chemical similarities and reactivity patterns [19,20,21]. Sanderson’s rational periodic table placed hydrogen at an intermediate position between boron and carbon based on electronegativity values, while others have used this criterion to position hydrogen between alkali metals and halogens [19,22]. However, the existence of multiple electronegativity scales and ongoing debates about the fundamental nature of this concept complicate its use as a primary organizational principle [21].
A third approach, recently revived by Scerri, employs the concept of triads—sets of three elements whose atomic numbers form arithmetic progressions [23,24]. This criterion, originally proposed by Döbereiner in terms of atomic weights, becomes exact when reformulated using atomic numbers. According to this perspective, hydrogen should be placed among the halogens, forming the triad H(1)-F(9)-Cl(17), while helium correctly heads the noble gases in the triad He(2)-Ne(10)-Ar(18) [23]. This approach has the appeal of mathematical precision but has been questioned regarding its physical basis and explanatory power [18,25].
1.3. Anomalies and Alternative Representations
Beyond the hydrogen-helium placement problem, the periodic system contains other well-known anomalies that challenge simplistic organizational schemes. Three pairs of elements exhibit inversions in the atomic mass sequence relative to atomic number: argon-potassium, cobalt-nickel, and tellurium-iodine [26]. These anomalies have straightforward explanations rooted in isotopic abundance and nuclear stability. The argon-potassium inversion resulted from Earth’s early loss of primordial argon-36 and subsequent accumulation of argon-40 from radioactive decay of potassium-40 [26]. The cobalt-nickel and tellurium-iodine inversions reflect the greater nuclear stability of even atomic number elements compared to odd atomic number elements [26].
The question of optimal representation extends beyond element placement to the fundamental format of the periodic system itself. While Mendeleev conceived of the system as fundamentally continuous, noting that "the series of elements is uninterrupted, and corresponds, to a certain degree, to a spiral function" [27], he and most successors adopted tabular formats for practical reasons [28]. However, tables inevitably impose artificial breaks in the sequence and can obscure continuity [12,28]. Various spiral and helical representations have been proposed throughout the history of the periodic system, from de Chancourtois’s cylindrical helix (1862) to modern designs [3,28]. These alternative formats offer certain advantages, including the natural representation of periodicity as true circularity and the avoidance of arbitrary row divisions [13,28].
1.4. Central Positioning and Spiral Representations
A particularly innovative approach to the hydrogen placement problem was proposed by Kaesz and Atkins, who suggested placing hydrogen at the center and head of the periodic table, neither in Group 1 nor Group 17, but in a unique position acknowledging its distinctive character [29]. This placement recognizes that hydrogen differs significantly from both alkali metals and halogens: it forms H− anions (unlike alkali metals), exists as diatomic H2 molecules (like halogens), yet lacks many typical metallic or halogenic properties. The authors argue that positioning hydrogen centrally, with arrows indicating relationships to both alkali metals and halogens, better represents its dual chemical nature without forcing it into either group [29].
This central positioning concept has been further developed in spiral representations of the periodic system. Rodríguez Peña and García Guerra recently proposed an innovative square spiral arrangement with hydrogen at the center, which naturally transitions outward in a counter-clockwise direction [30]. In this representation, hydrogen sits above lithium but passes over fluorine to connect with helium, effectively depicting its dual alkali-halogen nature while maintaining the continuity of the periodic sequence. This spiral format eliminates artificial breaks between noble gases and alkali metals, following the natural reading direction and clearly identifying orbital blocks without protrusions [30].
The concept of spiral representations as fundamental to understanding periodicity has been extensively developed by Imyanitov, who argues that the spiral form represents the most appropriate description of transitions from simple to complex atomic structure [31]. The spiral can be obtained simply from the linear sequence of elements arranged by nuclear charge, and can be transformed through compression, bending, and cutting into various other representations including traditional tables. Imyanitov emphasizes that the spiral representation reveals the autonomy of element blocks—s, p, d, and f—each with distinct characteristics in electron shell variation, width and height, and the number of included elements [31].
Historical precedents for spiral representations date back to Chancourtois’s telluric screw (1862) and include various models documented by Scherer, who catalogued different spiral periodic charts and their advantages in representing chemical relationships [32]. These early spiral models recognized that periodicity is fundamentally circular rather than linear, and that forcing elements into rectangular tables creates artificial discontinuities that obscure natural relationships [32].
Among historical figures who have contributed to the development of the periodic system, Charles Janet deserves special recognition for insights that were far ahead of his time [33]. Working in the 1920s and 1930s, this French engineer and polymath developed the left-step periodic table, which places elements according to the order of orbital filling and assigns helium to the alkaline earth metals [12,13,34]. While this placement of helium remains controversial among chemists, the left-step table has gained renewed attention for its mathematical elegance and consistency with the rule (Madelung rule) for orbital filling [14,25,35].
More remarkably, Janet anticipated several major scientific discoveries through his theoretical work on atomic structure. Despite working before the discovery of the neutron, he correctly proposed the existence of deuterium (heavy hydrogen), helium-3, and what we now call neutronium (element zero, consisting of dineutrons) [33,34]. His suggestion that neutronium might serve as a bridge between matter and antimatter was particularly prescient, predating Dirac’s theoretical work on antimatter [33,34]. Janet also anticipated the discovery of transuranium elements and implicitly recognized the rule six years before Madelung’s formulation [33,34].
An equally remarkable but largely unknown contribution to periodic system development came from Viatscheslaw Romanoff, a Russian physicist whose 1934 paper introduced revolutionary concepts that anticipated modern understanding by decades [36]. Romanoff’s periodic table essentially merged Werner’s and Janet’s approaches, creating what can be described as a spiral periodic system on a plane. Most significantly, Romanoff was the first to introduce the concept of the actinide series—a full decade before Glenn T. Seaborg’s renowned formulation of the actinide concept in 1944 [36].
1.5. Contemporary Perspectives
Recent work has emphasized that the difficulties in placing hydrogen and helium reflect genuine complexity rather than mere historical accident or incomplete knowledge. Petruševski and Cvetković’s comprehensive analysis notes that "depending on the arguments offered, various choices may appear to seemingly lead to the ’best possible choice,’ and people are usually biased/predetermined to one of the possible choices" [37]. Their detailed examination of five different placement options for hydrogen—in group 1, group 17, group 14, above both lithium and fluorine, or as a stand-alone element—concludes that each has merit depending on the criteria emphasized [37].
The authors particularly highlight hydrogen’s unique characteristics that distinguish it from all other elements: its ability to form both H+ and H− ions, its participation in hydrogen bonding (a phenomenon unique to hydrogen where bond strengths can vary continuously from van der Waals interactions to covalent bonds), and its stretching frequencies that span an unprecedented range from 3700 to 500 cm−1 [37]. These unique properties support Kaesz and Atkins’s proposal for a stand-alone, central position, which acknowledges that hydrogen "lies at the head of the entire table and as such can be expected to be strikingly different from all the elements" [29,37].
The concept of block autonomy provides another perspective on element classification challenges. Imyanitov’s analysis demonstrates that the s, p, d, and f blocks exhibit fundamentally different behaviors in property variations, with regularities pronounced in some blocks but absent in others [31]. This autonomy is evident in block widths (2, 6, 10, 14 elements), the position of differentiating electrons (outer vs. inner shells), and the distinct patterns of property variation within each block. The recognition of block autonomy suggests that attempts to force uniform classificatory criteria across all elements may be fundamentally misguided [31].
One response to this situation has been to propose that hydrogen (and potentially helium) should be duplicated in the periodic table, appearing in multiple positions simultaneously [38,39]. An alternative approach, advocated by Atkins and Kaesz, places hydrogen in a floating position above the main table, acknowledging its unique character without forcing it into any particular group [29]. However, both approaches have been criticized for violating the fundamental principle of "one element, one place" that has guided periodic table design since Mendeleev [40].
A more integrative approach has been proposed by Labarca and Srivaths, who argue that the three main classificatory criteria—electronic configuration, electronegativity, and atomic number triads—should be given equal epistemological status rather than privileging any single criterion [6]. Their periodic table places hydrogen between alkali metals and halogens, and helium between noble gases and alkaline earth metals, visually representing this "democratic" relationship among criteria [6]. This approach acknowledges the complexity of the situation while preserving the connectivity and continuity of the periodic system.
The spiral representations discussed earlier offer yet another resolution. By placing hydrogen at the center of a spiral that expands outward through the elements, these formats acknowledge hydrogen’s unique status while maintaining the continuity of atomic number progression [30,31]. The spiral format naturally accommodates the varying period lengths (2, 8, 8, 18, 18, 32, 32 elements) without artificial breaks, and visually represents the transition from simple to complex electronic structures as advancement or evolution [30,31].
1.6. Scope and Objectives
This paper examines the persistent challenges in the representation and classification of elements within the periodic system, with particular emphasis on the hydrogen and helium placement problem. We review the historical development of various approaches, analyze the strengths and limitations of different classificatory criteria, and evaluate alternative representations including tabular and spiral formats. Our analysis draws on both chemical and philosophical perspectives, recognizing that the periodic system serves not only as a practical tool but also as an expression of fundamental natural patterns that transcend any single theoretical framework.
Special attention is given to spiral representations as potentially fundamental forms of the periodic system, following arguments by Imyanitov that the spiral most naturally represents the evolution from simple to complex atomic structures [31]. We examine historical spiral proposals from Chancourtois to modern designs, including the remarkable work of Viatscheslaw Romanoff, whose prescient predictions of transuranium elements emerged from his spiral-based understanding of periodicity [36]. The central positioning of hydrogen, as proposed by Kaesz and Atkins [29] and developed in recent spiral representations [30], is evaluated as a potential resolution to the hydrogen placement dilemma.
Information-theoretic descriptors such as Shannon entropy, Fisher information, and disequilibrium offer powerful tools for characterizing probability distributions without reference to specific physical parameters. Shannon entropy quantifies the global spread or delocalization of a distribution, Fisher information measures the sharpness of local gradients, and disequilibrium captures the departure from uniformity. Together, these three quantities provide a complete characterization of the structural complexity of atomic electron densities.
In this work, we present a unified information-theoretic analysis of the periodic table, examining all elements from hydrogen to lawrencium (Z = 1–103) in both position and momentum spaces. Our analysis reveals that chemical periodicity emerges naturally as a geometrical structure—specifically, a spiral or helical trajectory—when atomic electron densities are mapped into the three-dimensional space defined by Shannon entropy, Fisher information, and disequilibrium. This representation not only reproduces the known features of periodicity but also provides quantitative insights into shell structure, subshell filling, and the subtle electronic signatures of chemical anomalies.
Furthermore, to assess whether the 3D space formed by the I, S, and D triads (in both position and momentum space) correlates with common element classifications, two statistical analyses were performed. Elements were categorized based on period, group number, and chemical families (e.g., alkali, halogens, noble gases). These analyses were conducted for each classification using the triads in both position and momentum space. Additionally, to mitigate the impact of varying scales among the IT-measures, Min-Max normalization was applied to the data. This process involved subtracting the minimum value and dividing by the range (the difference between the maximum and minimum values).
The structure of this paper is as follows:
1.7. Information Theory
Parallel to these atomistic model developments, information theory has emerged as a complementary framework for quantifying molecular structure, bonding, and reactivity. Within this perspective, concepts such as Shannon entropy, Fisher information, disequilibrium, and statistical complexity indices provide rigorous measures of order, dispersion, and internal coupling that are derived directly from electronic probability distributions and remain independent of the basis set. These information-theoretic descriptors have proven particularly useful for identifying patterns of electron delocalization, detecting signatures of correlation and localization, and establishing quantitative links between electronic structure and chemical observables.
The application of information-theoretic measures to chemical systems has revealed fundamental relationships between electronic structure and molecular properties. Plotting entropy against disequilibrium in "information planes" distinguishes molecular shapes, bonding motifs, and polarity, while complexity indices trace the stepwise enrichment of structure from simple diatomics to essential amino acids [41,42]. Extensions to momentum space and three-dimensional information densities fingerprint equilibrium conformations and monitor bond breaking and formation along reaction coordinates [43]. Fisher-information profiles and entropy-type indicators locate the localization-delocalization crossover that defines transition states, offering a phenomenological view that parallels—but remains independent of—potential-energy barriers [44]. Recent applications to proton-transfer equilibria in citric acid illustrate the framework’s capacity to rationalize both kinetic and thermodynamic facets of chemical reactivity [45].
The power of information-theoretic analysis extends to molecular classification schemes. The Predominant Information-Quality Scheme (PIQS) ranks six global descriptors—position- and momentum-space entropies, Fisher informations, and Onicescu disequilibria—within each molecule; the descriptor with the highest normalized value becomes the molecule’s one-letter label, cleanly separating aliphatic, aromatic, polar, and charged amino-acid families [46]. At the trajectory level, mutual-information maps extracted from MD ensembles now pinpoint allosteric communication pathways in proteins with residue-level resolution [47], while transfer-entropy calculations reveal the direction of signal propagation, predicting dynamic hotspots in biomolecular networks [48].
Recent developments have further expanded the scope of information-theoretic applications. Single-trajectory entropy estimators close the thermodynamic loop for phase-change simulations, yielding force-field-agnostic entropy profiles for liquids and solids [49]. Coarse-graining schemes that maximize mutual information between atomistic and reduced representations generate transferable mesoscopic force fields while preserving key dynamical correlations [50], and information-content metrics provide objective criteria for trajectory completeness and uncertainty assessment [51].
1.8. Objectives and Scope
The periodic table of elements represents one of the most fundamental organizing principles in chemistry and physics, encoding the systematic variation of atomic properties with nuclear charge. While traditional approaches to understanding periodicity rely on quantum mechanical descriptions of electron configurations and orbital filling, information theory provides an alternative and complementary perspective that captures the essential structural features of atomic electron densities through universal, dimensionless measures.
The manuscript is organized as follows: Section 2 describes the computational methodology employed to obtain atomic electron densities using Hartree-Fock wave functions. Section 3 presents the theoretical framework for the information-theoretic measures used in this study, including Shannon entropy, Fisher information, disequilibrium, and the LMC and Fisher-Shannon complexity functionals. Section 4 outlines the statistical methods employed for validation, including the Shapiro-Wilk normality test and Welch’s t-test. Section 5 presents te information-theoretical analyses across the periodic table (Z = 1–103), Section 6 provides statistical validation of the observed correlations using Wilks’ Lambda and Random Forest analyses. Finally, Section 7 summarizes the main conclusions and discusses the implications of the information-theoretic spiral representation for understanding chemical periodicity.
2. Computational Methodology
The electronic calculations performed in this work have been done as follows. For neutral atoms Hartree– Fock wave functions were employed [52] to compute the atomic densities and the associated information measures and complexities. The one particle density in position space as well as the total wavefunction is expressed in terms of Slater-type orbitals, from which the Fourier transform provides the corresponding quantities in momentum space, including the one particle density . For atomic systems in the absence of external fields (as is the case of this work) it is sufficient to deal with the spherically averaged densities and .
3. Information-Theoretic Measures
Under the independent-particle framework, molecular systems may be described using their electronic density profiles in both position (r-space) and momentum (p-space) representations. These complementary representations provide distinct but related perspectives on electronic structure, each offering unique insights into molecular properties and behaviors.
3.1. Electronic Density Representations
The position-space total electron density is constructed from molecular position-space orbitals , while the momentum-space density is built from molecular momentals (momentum-space orbitals) . The momentals are derived through three-dimensional Fourier transformation of their position-space counterparts:
Atomic units are utilized throughout this work. Established methodologies for Fourier transforming position-space orbitals produced by ab-initio calculations have been documented [53]. Since ab-initio orbitals are expressed as linear combinations of atomic basis functions, and analytical Fourier transforms of these basis functions are available [54], the conversion of complete molecular electronic wavefunctions from position to momentum space is computationally accessible [55].
3.2. Shannon Entropy
The Shannon entropy S for a probability density quantifies the overall electronic dispersion within the molecular configuration space, serving as an indicator of electron density delocalization. For a unit-normalized probability density in position space, it is expressed through the logarithmic functional [56]:
This parameter reaches its maximum value when information about is minimal and the distribution becomes delocalized. In water clusters, higher Shannon entropy indicates greater electronic delocalization, reflecting enhanced charge mobility that facilitates hydrogen bonding and polarization effects. The expected behavior shows entropy increasing with cluster size as electronic distributions become more diffuse through hydrogen bonding network formation.
3.3. Fisher Information
Unlike the global Shannon entropy, Fisher information I exhibits local characteristics due to its high sensitivity to rapid distribution changes within confined regions. This quantity is defined by the gradient-density functional [57,58]:
Fisher information evaluates the gradient characteristics of the electron distribution, assessing the spatial point-wise concentration of the electronic probability cloud. In water systems, it reflects the balance between covalent bonding (high localization) and hydrogen bonding (delocalization effects). Higher values indicate sharper, more localized electronic features with steep gradients. The expected trend shows Fisher information generally decreasing with cluster size as hydrogen bonding creates more diffuse electronic environments.
3.4. Disequilibrium
The disequilibrium D, also known as self-similarity [59] or information energy [60], measures the deviation from uniformity in the probability density. For position space, it is expressed as:
This measure captures the anisotropy inherent in hydrogen-bonded systems, reflecting the directional nature of hydrogen bonding and molecular orientation effects. Higher disequilibrium indicates greater non-uniformity in charge distribution. The evolution with cluster size shows complex behavior, initially increasing with cluster formation as hydrogen bonding creates charge asymmetries, then potentially stabilizing as bulk-like patterns emerge.
3.5. Complexity Measures
Beyond individual entropic measures, quantifying physical system complexity provides additional insights into structural organization. We employ two complementary complexity measures that combine different information-theoretic quantities.
The López-Ruiz-Mancini-Calbet (LMC) complexity measure [61,62] combines disequilibrium with Shannon exponential entropy:
This measure captures the balance between organization (disequilibrium) and disorder (entropy), reflecting the sophisticated structural arrangements characteristic of hydrogen-bonded water networks. The parameter satisfies the constraint for any three-dimensional probability density.
The Fisher-Shannon (FS) complexity measure [63,64] combines local and global characteristics:
where represents the Shannon power entropy. This parameter quantifies the coexistence of localized (covalent) and delocalized (hydrogen bonding) electronic features, capturing the dual nature of water’s electronic structure. It satisfies the lower bound for any three-dimensional probability density.
These complexity measures are dimensionless, invariant under replication, translation and scaling transformations [65], and exhibit minimum values for extreme probability distributions (perfect order and maximum disorder). In water clusters, complexity should increase with size as more sophisticated hydrogen bonding patterns develop, reaching maximum values for optimal structural organization.
All measures presented above can be directly extended to momentum space using the corresponding momentum density , providing complementary information about kinetic energy distributions and nuclear motion effects.
All calculated values for the information-theoretic (IT) measures are available in the accompanying .csv files from the supplementary material. Each file is labeled according to the following order: number of water molecules, integration space (position or momentum), and force field name. The files include values for each sampled time step.
4. Statistical Method: Student’s t-test
To rigorously assess whether the mean values of information-theoretic measures differ significantly between force fields, we employ comprehensive statistical analysis combining normality testing and mean comparison procedures.
4.1. Shapiro-Wilk Test for Normality
Before applying parametric tests, we verify that our data follows a normal distribution using the Shapiro-Wilk test [66], which is particularly suitable for small samples (). The test statistic is given by:
where is the ith value in the sample, is the ith smallest value, is the sample mean, and are coefficients obtained from a standard normal distribution. The null hypothesis is that the sample is drawn from a normal distribution. If the p-value exceeds 0.05, we fail to reject the null hypothesis, indicating that the data distribution may be normal.
4.2. Probability Plots
To further confirm normality, we compare our data against standard normal distributions through probability plots. Theoretical quantiles for the normal distribution are computed from the probability estimates proposed by Filliben [67]:
where n is the number of values in the dataset. When the coefficient of determination () exceeds 0.9 and the Shapiro-Wilk p-value is greater than 0.05, we consider these as strong statistical evidence supporting the normality of the data distribution.
4.3. Welch’s t-test
Once normality is confirmed, we compare force fields pairwise using Welch’s t-test [68], which does not assume equal variances between samples. The test statistic is:
where is the mean, is the standard error, is the standard deviation, and is the size of the ith sample. The degrees of freedom are approximated using the Welch-Satterthwaite equation [69]. For the t-test, the null hypothesis is that the means of the distributions are equal. If the calculated p-value is lower than 0.05, we reject the null hypothesis, meaning that the means of the samples are significantly different.
All statistical tests were performed using the SciPy Python library [70].
5. Results and Discussion
6. Shannon Entropy Across the Periodic Table
The Shannon entropy decreases systematically with increasing atomic number, revealing a global trend of progressive electronic localization as nuclear charge grows (Figure 1). Each period forms a distinct colored trajectory, and the step-like patterns reflect the periodic filling of electron shells. High Shannon values in the light elements (Z < 10) arise from diffuse, hydrogen-like orbitals with broad probability distributions. As Z increases, the stronger Coulomb attraction compresses the electron density, leading to lower Shannon entropy.
Local modulations appear at the beginning and end of each period: entropy increases at the start of a new shell (e.g., Li, Na, K), then decreases smoothly across the period as the shell fills. Transition-metal regions show flatter behavior, consistent with d-orbital contraction and increased electron-density localization. Beyond Z ≈ 60, the entropy values stabilize around approximately 1.0, indicating a regime of highly compact electron distributions dominated by strong relativistic and screening effects. Overall, the plot illustrates the information-theoretic imprint of periodicity, encoding shell structure, subshell filling, and the progressive confinement of atomic electron densities across the periodic table.
7. Fisher Information Across the Periodic Table
The Fisher information exhibits a nearly monotonic and strongly increasing trend with atomic number, reflecting the growing localization and sharpness of the electronic probability density as nuclear charge increases (Figure 2). Unlike Shannon entropy—which decreases and displays pronounced periodic modulations—Fisher information is highly sensitive to local gradients in the electron density. As Z increases, the stronger Coulomb attraction compresses the electronic cloud toward the nucleus, producing steeper density gradients and therefore larger Fisher values.
The period-colored points follow a smooth, almost piecewise-linear trajectory, indicating that Fisher information is dominated by global nuclear charge effects rather than shell structure. Minor inflection points at the beginning of each period reflect the onset of a new principal quantum number, but these deviations are small compared to the overall rise. The transition, lanthanide, and actinide regions continue this smooth ascent, showing that the addition of d and f electrons enhances density gradients without disrupting the global trend. Overall, the plot demonstrates that, from an information-theoretic perspective, Fisher information acts as a sensitive measure of electron-density localization, capturing the radial tightening of atomic distributions across the periodic table and complementing the behavior seen in the Shannon entropy.
8. Disequilibrium Across the Periodic Table
The disequilibrium measure increases smoothly with atomic number, reflecting the progressive departure of atomic electron densities from a uniform or maximally delocalized distribution (Figure 3). As nuclear charge grows, the electron cloud becomes more compact and structured around the nucleus, which elevates the probability concentration near specific regions of space and therefore increases disequilibrium. The plot shows an almost continuous, convex upward trend with only minor perturbations at the start of each period, indicating that disequilibrium is dominated by global confinement effects imposed by increasing Z rather than by shell or subshell structure.
While Shannon entropy decreases and Fisher information rises sharply with Z, disequilibrium evolves more moderately, capturing the increasing spatial order and concentration associated with heavier atoms. The colored points show that all periods follow a common trajectory, with successive periods merging seamlessly into the same curve, further emphasizing that disequilibrium behaves primarily as a measure of global electron-density non-uniformity. Overall, the figure highlights the monotonic organization of atomic structure in information-theoretic terms: higher-Z atoms display progressively greater departure from uniformity, consistent with stronger Coulomb binding and higher electronic localization.
9. Relationships Between Information-Theoretic Measures
9.1. Shannon Entropy versus Disequilibrium
The relationship between Shannon entropy and disequilibrium reveals a clear inverse correlation across the periodic table (Figure 4): elements with more delocalized electron densities (high Shannon) exhibit minimal disequilibrium, whereas increasing structural concentration (higher disequilibrium) corresponds to lower Shannon values. This reflects the general compression of the electronic cloud as atomic number increases. Early-period elements (H–Ne) occupy the upper-left region, characterized by high entropy and low disequilibrium due to their diffuse, weakly bound electron distributions. As Z increases, points move smoothly toward the lower-right region, revealing the progressive localization and ordering induced by stronger nuclear attraction.
The colored trajectories corresponding to different periods align along a common descending curve, showing that the Shannon-disequilibrium relationship is largely universal and shell-independent, even though slight modulations appear at the onset of each new period. These features reflect subtle shell and subshell reorganizations but do not disrupt the overall monotonic trend. In information-theoretic terms, the diagram illustrates a fundamental complementarity: Shannon entropy captures global spread, while disequilibrium captures local concentration; together they encode the systematic evolution of atomic electron densities across the periodic table.
9.2. Fisher Information versus Disequilibrium
The Fisher-disequilibrium plot reveals a strong, smooth, and nearly monotonic correlation between the two measures, reflecting their shared sensitivity to localization and structural concentration of the atomic electron density (Figure 5). As disequilibrium increases—indicating greater departure from a uniform distribution—Fisher information rises steadily, capturing the increasingly sharp spatial gradients generated by stronger nuclear attraction at higher atomic numbers. The curve displays a slightly convex character, consistent with the superlinear growth of electron-density gradients as atoms become more compact across the periodic table.
Different periods follow the same global trajectory with only minor color-coded deviations, showing that the Fisher-disequilibrium relationship is essentially universal and shell-independent. Shell onsets introduce small discontinuities, but these do not alter the overall trend: both metrics grow systematically as nuclear charge increases. In information-theoretic terms, the plot highlights that Fisher information (a gradient-based measure) and disequilibrium (a global concentration measure) respond in a coordinated manner to the progressive localization of the atomic electron cloud, providing complementary quantifications of spatial order across the periodic table.
9.3. Fisher Information versus Shannon Entropy
The Fisher-Shannon diagram exhibits a clear inverse relationship between global delocalization (Shannon entropy) and local gradient content (Fisher information) across the periodic table (Figure 6). Elements with highly diffuse electron densities, such as H and He, appear in the high-Shannon/low-Fisher region, reflecting broad probability distributions with minimal spatial structure. As atomic number increases, points migrate smoothly toward the low-Shannon/high-Fisher region, indicating the progressive compression and sharpening of the electronic cloud induced by increasing nuclear charge.
The colored sequences reveal distinct but continuous trajectories for each period, with small discontinuities corresponding to the onset of new shells. Nevertheless, all periods align along a common descending trend, demonstrating that the Fisher-Shannon relationship is fundamentally universal and independent of specific shell or subshell identities. The behavior reflects the complementarity of the two measures: Shannon entropy quantifies the overall spatial extent, while Fisher information captures localization intensity and gradients. Their combined pattern underscores a consistent information-theoretic signature of atomic structure: as Z increases, atoms become simultaneously more ordered, more compact, and more gradient-rich, yielding a systematic movement along a shared Fisher-Shannon curve.
10. Three-Dimensional Information-Theoretic Landscape
10.1. Periodic Representation
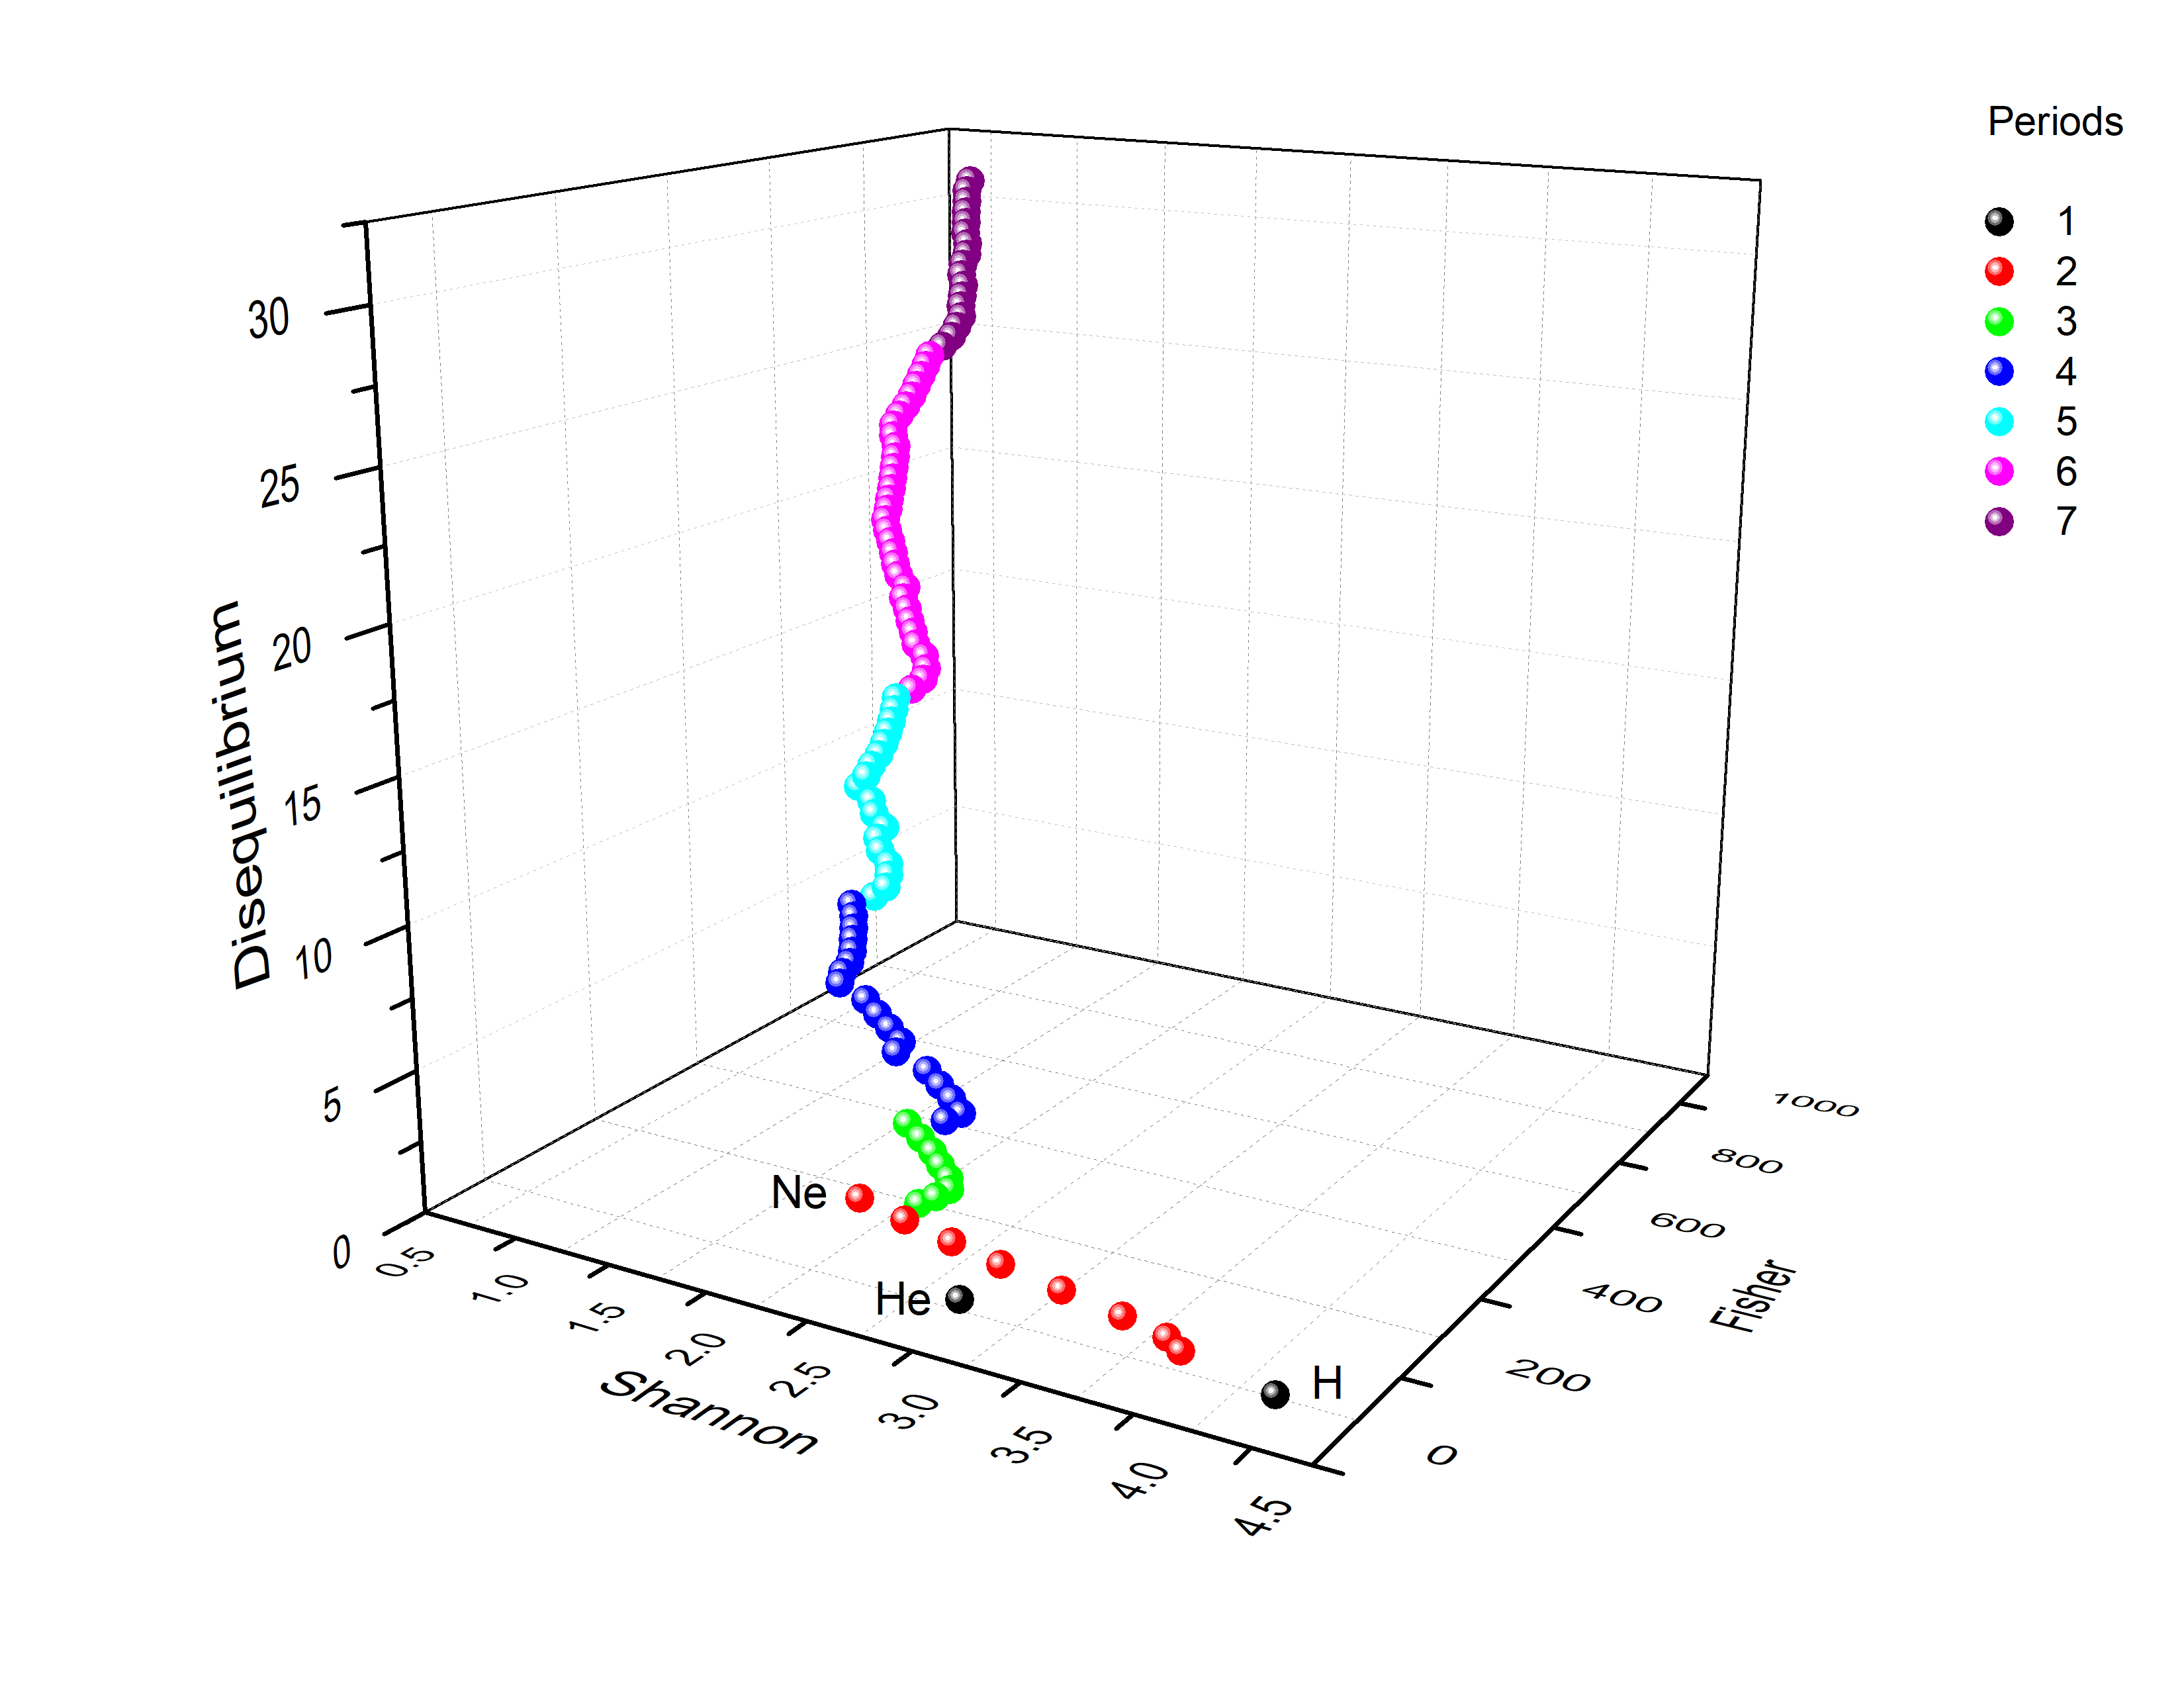
The 3D plot combining Shannon entropy, Fisher information, and disequilibrium reveals a highly ordered and continuous information-theoretic manifold that the chemical elements follow across the periodic table (Figure 7). Rather than forming scattered or irregular clusters, the points trace a single, smoothly evolving trajectory that ascends primarily along the Fisher and disequilibrium axes while descending along the Shannon axis. This reflects a fundamental structural transformation of atomic electron densities: as nuclear charge increases, electron clouds become more localized, gradient-rich, and concentrated, yielding higher Fisher and disequilibrium values, while their global spread (Shannon) decreases.
Each period (color-coded) occupies a well-defined segment of this 3D curve, and although small deviations appear at the onset of each shell—visible as gentle bends or kinks—the overall structure forms an information-theoretic spiral or helix-like path. Along the Shannon axis, successive periods shift progressively toward lower entropy; along the Fisher axis, they climb upward through sharper density gradients; and along the disequilibrium axis, they move outward as density concentration increases. These combined movements generate a helical progression in information space, consistent with long-discussed models where the periodic table exhibits spiral or cylindrical topology rather than a flat, tabular form.
The present information-theoretic representation gives quantitative support to such ideas by showing that atomic structure evolves smoothly and monotonically along a quasi-spiral curve in (Shannon, Fisher, Disequilibrium) space, with noble gases acting as local turning points: He and Ne show distinctive inflection features marking shell closures. Notably, the 3D trajectory is continuous and single-valued, reinforcing the view that information-theoretic measures capture the essence of periodicity as a coherent, ordered evolution rather than a collection of discrete blocks. This provides a unifying framework in which the periodic table can be interpreted as a geometrical spiral curve in information space, encoding the balance between global delocalization, local structure, and probability concentration that defines each element’s electronic architecture.
In the 3D Fisher-Shannon-Disequilibrium representation, the elements from Periods 1 through 7 trace a single continuous information-theoretic pathway, but each period occupies a distinct, identifiable segment of the global trajectory. Period 1 (H–He) anchors the lower-disequilibrium, lower-Fisher, high-Shannon end of the curve: hydrogen and helium exhibit the most diffuse electron densities, forming the broad base of the information spiral. Period 2 (Li–Ne) marks the first major descent in Shannon entropy and the first clear rise in both Fisher information and disequilibrium, reflecting the completion of the 2p subshell; this period introduces the characteristic bend that initiates the spiral-like progression. Period 3 (Na–Ar) shifts the curve further downward in Shannon and upward in Fisher/disequilibrium, following a nearly parallel but displaced path, demonstrating that the information-theoretic structure of the periodic table repeats in a vertically elevated fashion as new shells are filled.
Periods 4 and 5, which include the 3d and 4d transition metals, generate the most visible smooth mid-section of the spiral, where increases in Fisher information and disequilibrium become more pronounced due to the growing localization and gradient intensification of d-electrons. Their trajectories remain tightly aligned with the global curve, emphasizing that—even with more complex subshell structures—electron-density localization increases monotonically with nuclear charge. Period 6, containing lanthanides, introduces a denser clustering in Fisher and disequilibrium, creating a steeper ascent in the 3D space; this reflects the contraction and localization associated with f-electron filling. Finally, Period 7 continues this upward motion, extending the spiral to its highest Fisher and disequilibrium values and lowest Shannon values, representing the most compact and structured electron densities among the known elements.
Taken together, the seven periods form a stacked, ascending sequence of information-theoretic loops, each shifted relative to the previous one along all three axes. This produces a helical or spiral-like geometry that quantitatively mirrors long-standing qualitative depictions of a spiral periodic table. Each period’s path is similar in shape—reflecting the recurring shell structure—but displaced upward and inward in information space by the stronger nuclear attraction of heavier atoms. This provides clear evidence that the well-known periodicity of the elements manifests naturally as a geometrical spiral embedded in the three-dimensional space of (Shannon, Fisher, Disequilibrium).
10.2. Block Representation
The 3D plot of Shannon entropy, Fisher information, and disequilibrium reveals a highly structured organization of the periodic table when viewed through its orbital-block classification (Figure 8). Each block (s, p, d, f) occupies a distinct, contiguous segment of the global information-theoretic trajectory, illustrating how the underlying orbital symmetries manifest as well-defined regions in information space.
The s-block (black points) lies at the high-Shannon, low-Fisher, low-disequilibrium edge of the curve, anchored by hydrogen and helium. These elements possess the most diffuse and least structured electron densities, reflected in their low gradient content (Fisher) and minimal disequilibrium. As s-block atoms grow heavier (alkali and alkaline-earth metals), they extend modestly upward in Fisher and disequilibrium while maintaining relatively high Shannon values, consistent with their single- or double-electron valence configurations and spherical symmetry.
The p-block (red points) forms a clearly identifiable middle band in the 3D trajectory. As electrons fill directional p-orbitals, the electron density becomes more anisotropic and more sharply structured, which shifts the p-block toward higher Fisher information and disequilibrium while reducing Shannon entropy. The p-block path shows smoother curvature than the s-block, reflecting the more systematic rise in localization as p-electrons accumulate across periods.
The d-block (green points) introduces a pronounced upward movement along the Fisher and disequilibrium axes. The presence of d-electrons—more localized and strongly influenced by the increasing nuclear charge—results in much steeper density gradients and greater spatial concentration. Consequently, the d-block occupies a vertically elevated zone of the information manifold, separating cleanly from the s- and p-blocks. The progression through the transition metals forms one of the most coherent segments of the 3D trajectory, highlighting the strong information-theoretic imprint of d-orbital filling.
The f-block (blue points) reaches the highest Fisher and disequilibrium values and the lowest Shannon entropies among all blocks. The f-electrons are tightly bound, heavily contracted, and highly sensitive to increasing Z, producing extreme localization and large density gradients. As a result, the f-block forms the uppermost segment of the 3D spiral-curve, producing an extended vertical ascent in the Fisher-disequilibrium dimensions. This reflects well-known characteristics of lanthanides and actinides, where f-orbital contraction and relativistic effects dominate electronic structure.
Taken together, the four blocks trace a layered, ascending sequence in information space, with representing a progressive increase in localization and structural complexity of the electron density. The 3D representation makes this progression visually explicit: each block maps onto a distinct region of the Fisher-Shannon-Disequilibrium manifold, providing a quantitative information-theoretic fingerprint of orbital symmetry and electronic organization across the periodic table.
11. Chemical Anomalies in Periods 2–4
The Shannon-Disequilibrium plots for Periods 2, 3, and 4 expose subtle yet chemically meaningful anomalies in the evolution of atomic electron densities across the periodic table (Figure 9). For each period, the general trend displays a monotonic decrease in Shannon entropy—reflecting the progressive localization of electron density—and a corresponding increase in disequilibrium, which quantifies the growing departure from uniformity as Z increases. Despite this overall order, certain elements deviate from strict monotonicity, and these deviations coincide with well-known chemical irregularities related to orbital filling and electron-shell structure.
In Period 2 (Li–Ne), the smooth descent from Li to Ne is perturbed at the onset of the p-block (B, C), where the combination of increased angular structure and partial p-electron occupancy produces points that lie slightly off the idealized curve. The particularly compact density of Ne, highlighted by the smallest marker size (low Fisher), signals the extraordinary stability of the closed 2p6 shell—an information-theoretic fingerprint of noble-gas closure.
In Period 3 (Na–Ar), Si stands out as a clear anomaly: its Shannon-Disequilibrium position deviates slightly upward from the smooth descending trend. This reflects the exceptional bonding versatility and intermediate localization of the 3p2 configuration, which is also expressed chemically in Si’s ability to form extended covalent networks (silicates, polysilanes). This information-theoretic deviation parallels its well-known position as a chemically central element in the p-block.
The most striking anomalies appear in Period 4 (K–Kr), where transition-metal irregularities produce clear information-theoretic signals. Chromium, with its half-filled 3d54s1 configuration, shows a deflection toward higher Shannon and lower disequilibrium relative to neighboring atoms. This reflects its unusually delocalized and symmetric electron distribution, consistent with the stability of half-filled d subshells. Copper, with its anomalous 3d104s1 configuration, lies farther down the Shannon axis than expected for its position, indicating enhanced delocalization arising from its filled d shell. This information-theoretic dip mirrors Cu’s distinctive chemical behavior, including its high ionization energy and unique +1/+2 oxidation-state flexibility. Calcium, although not anomalous in the orbital-filling sense, occupies a position that highlights the contrast between s-block delocalization and the rapidly increasing localization of the early 3d elements. Its relatively high Shannon and low disequilibrium make it an important anchoring point for the period.
Together, the anomalies for Cr, Cu, Si, and Ne demonstrate that information-theoretic measures—Shannon entropy and disequilibrium—provide a sensitive and quantitative way to detect irregularities in atomic structure linked to subshell filling, shell closure, and electron-configuration exceptions. The information-theoretic Shannon-Disequilibrium analysis across Periods 2–4 reveals a coherent global trend punctuated by localized anomalies that correspond directly to chemically significant electron-configuration features. This provides compelling evidence that information-theoretic descriptors encode not only periodicity but also the subtle electronic signatures of chemical anomalies, offering an alternative route to rationalizing the structure of the periodic table.
The apparent anomalies among elements deserve particular attention. Potassium and calcium exhibit distinct chemical behavior due to their differing valence configurations: K is an alkali metal with a single 4s1 electron, leading exclusively to the +1 oxidation state and highly soluble, strongly ionic compounds, whereas Ca, with its 4s2 configuration, forms stable +2 species and less soluble salts such as carbonates and sulfates. Potassium reacts more vigorously as a stronger reducing agent, while calcium shows more moderated reactivity and engages in divalent bonding and lattice-forming chemistry characteristic of alkaline-earth metals.
The transition from aluminum to silicon represents one of the most dramatic property changes between adjacent elements in the periodic table: a metal to non-metal transition. In chemical bonding, Al forms primarily ionic bonds (as Al3+) and metallic bonds, while Si forms primarily covalent bonds similar to carbon. Aluminum is more reactive, especially with acids and bases, whereas Si is less reactive under normal conditions. The higher electronegativity of Si reflects its more non-metallic character. This Al→Si transition represents crossing the metal-metalloid boundary in the periodic table.
The chemical changes from vanadium to chromium, while more subtle than the Al→Si transition, remain significant. The key difference lies in the electron configuration: chromium exhibits the critical exception to the expected electron filling pattern, where Cr “steals” one electron from its 4s orbital to achieve a half-filled d subshell (3d5), which provides extra stability. This is the first element in the periodic table to show this anomalous behavior. The V→Cr transition represents reaching the half-filled d5 configuration, which creates enhanced stability for the half-filled d subshell, electron-electron repulsion effects that destabilize intermediate oxidation states, and different orbital energies affecting chemical bonding.
Nickel and copper differ chemically because nickel has a partially filled 3d shell (3d8) while copper often attains a stable 3d10 configuration, making copper less reactive and more noble. As a result, Cu(I) is stable and diamagnetic, whereas Ni(I) is rare. Copper(II) complexes show strong Jahn-Teller distortion, while Ni(II) complexes generally do not and display greater geometric variability. Copper does not react with non-oxidizing acids, but nickel does. Overall, nickel is more reactive and versatile in coordination chemistry, while copper is more redox-stable and forms stronger complexes with nitrogen-donor ligands.
12. Momentum Space Analysis
The 3D Fisher-Shannon-Disequilibrium diagram in momentum space reveals a markedly different but equally structured information-theoretic fingerprint of the periodic table compared to position space (Figure 10). Whereas position-space measures highlight the progressive localization of electron densities with increasing Z, momentum-space measures reflect the complementary trend of momentum delocalization (i.e., momentum broadening) that arises from the uncertainty principle. This duality produces a distinctive layered organization of the seven periods across the 3D manifold.
Hydrogen and helium (Period 1) occupy the far ends of the diagram, with high Shannon momentum entropy and moderate Fisher momentum. Their very diffuse momentum distributions reflect tightly bound real-space densities. Helium in particular shows a pronounced drop in Fisher momentum but remains high in Shannon, reflecting its highly symmetric, compact 1s2 configuration.
Period 2 (Li–Ne) forms the uppermost vertical structure of the diagram and contains the strongest outliers in momentum-space Fisher information. Lithium exhibits the largest Fisher momentum value, reflecting its particularly narrow and sharply peaked momentum distribution, itself a consequence of its diffuse 2s electron in real space. As we move from Be→B→C→N→O→F→Ne, the points descend smoothly in Fisher and shift leftward in Shannon, showing a systematic tightening of momentum-space distributions as nuclear charge increases and real-space densities become more contracted.
Period 3 (Na–Ar) atoms occupy a lower, more compressed region of the 3D plot, representing narrower variability in momentum-space information-theoretic quantities. Their Fisher and Shannon values are significantly lower than those of Period 2, indicating more uniform momentum distributions. This reflects the stabilized 3s and 3p shells, where real-space contraction reduces momentum-space structure. Neon and argon define a nearly linear trend between Fisher and Shannon momentum, marking noble-gas closure.
Period 4 (K–Kr) produces a dense, vertically short cluster, with decreasing Fisher and increasing Shannon relative to Periods 2 and 3. The 3d elements show minimal momentum-space Fisher variation, indicating that d-orbital contributions—despite adding complexity in real space—produce smoother, less sharply peaked momentum distributions. This is consistent with the delocalized angular components of d-orbitals.
Periods 5–7 lie in the lowest region of the 3D manifold. They form a flattened, highly overlapped cluster at low Fisher (approximately 0–5) and moderate disequilibrium, with Shannon momentum increasing slowly across successive periods. This striking collapse of information-theoretic structure in momentum space reflects strong real-space contraction (large Z), significant relativistic effects in heavy elements, and momentum distributions becoming smoother and broader, reducing Fisher information. Importantly, the final element (Lr) closes the trajectory at large Shannon momentum, indicating broad momentum distributions from highly relativistic, compact real-space densities.
Across the seven periods, momentum-space information-theoretic components show a layered, stratified architecture: Period 2 stands out with the largest Fisher momentum values and widest dispersion; Periods 3 and 4 compress, forming increasingly compact structures; Periods 5–7 collapse dynamically into a narrow band, showing that heavy atoms share remarkably similar momentum-space information-theoretic signatures; and noble gases (He, Ne, Ar, Kr, Xe, Rn) form the smoothest period-to-period alignments, consistent with closed-shell symmetry. This organization forms a vertical hierarchy of periods, where the height (Fisher momentum) steadily decreases from Period 2 to Period 7.
The 3D Fisher-Shannon-Disequilibrium representation in momentum space provides a powerful complementary view of periodicity. While position space emphasizes increasing localization with Z, momentum space reveals maximum information-theoretic differentiation for lighter atoms (Periods 1–3), compression and similarity among heavy atoms (Periods 5–7), and clear momentum-space fingerprints of shell closure and period boundaries. This yields a coherent, information-theoretic map of periodicity that reflects both quantum-mechanical complementarity and classical chemical periodic trends.
13. Triadic Analysis Around Halogens
The 3D representation combining Shannon entropy, Fisher information, and Disequilibrium provides a powerful geometric lens through which the triadic organization of chemically related elements can be examined (Figure 11). When focusing on the triads surrounding the halogens (Group 17)—specifically, (Group 1, Group 17, Group 18) blocks across different periods—three important insights emerge: hydrogen’s ambiguous placement, the remarkable coherence within halogen-alkali-noble gas triads, and the distinctive triangular cluster formed by the (H–He–Li) triad.
In the 3D Fisher-Shannon-Disequilibrium plot, hydrogen does not collapse into the cluster expected for a simple alkali metal (Group 1), nor does it align entirely with the halogens (Group 17). Instead, it forms a bridge point, lying intermediate between the two groups along all three information-theoretic dimensions. Regarding Shannon entropy, H shows large global delocalization (high Shannon), closer to halogens than to heavier alkali metals. For Fisher information, H exhibits moderate Fisher values reflecting a steep, compact density—more similar to F−-like halogen behavior than to Li, Na, or K. Concerning disequilibrium, the value of H sits between the extremes of Group 1 and Group 17, indicating a density neither as concentrated as halogens nor as spread as alkali metals.
Information-theoretically, hydrogen sits on the continuum between Groups 1 and 17, quantitatively supporting the long-standing chemical argument that H shares affinities with both families: alkali-like behavior (H+ formation, ns1 electronic structure), and halogen-like behavior (gains an electron to form H−, diatomic radical H2, similar ionization trends). This triadic representation gives the clearest geometric evidence of hydrogen’s bifunctional identity within the periodic table.
For each triad (e.g., Li–F–Ne, Na–Cl–Ar, K–Br–Kr), the 3D information-theoretic coordinates form tight, nearly equilateral triangular clusters. Group 17 (halogens) shows the highest Fisher (sharp gradients) and highest disequilibrium (high localization), with electron densities that are compact, highly directional, and chemically reactive. Group 1 (alkali metals) displays the lowest Fisher and lowest disequilibrium (very delocalized densities), with diffuse ns1 valence electrons creating broad probability distributions. Group 18 (noble gases) exhibits intermediate Fisher, intermediate Shannon, and moderate disequilibrium, matching the closed-shell, symmetric behavior of noble gases. Across all periods (2–6), these triads remain structurally consistent in information-theoretic space, revealing the universality of the periodic law under an information-theoretic description.
The H–He–Li triad stands out as a unique structure in the 3D plot, forming a small but strongly asymmetric cluster. Hydrogen exhibits extremely high Shannon (delocalized), moderate Fisher, and low disequilibrium. Helium shows lower Shannon, minimal Fisher, and the highest disequilibrium among the three—reflecting its exceptionally compact closed-shell density. Lithium displays moderate Shannon, moderate disequilibrium, but very high Fisher, coming from the sharply peaked momentum of the 2s electron. This triad forms a sharp three-point arc (not a triangle) in information-theoretic space, indicating that Period 1 elements do not behave as a regular triad like those in higher periods. Instead, H and He are informational outliers, defining the extremes of delocalization and localization in the entire periodic table, while Li marks the transition point from the unique electronic simplicity of Period 1 to the more regular shell-based structure seen in the remaining elements. Thus, the H–He–Li triad graphically emphasizes the special, non-periodic nature of Period 1, long discussed in theoretical chemistry and now quantitatively highlighted by information theory.
The 3D Fisher-Shannon-Disequilibrium analysis of triads centered on halogens reveals that hydrogen’s information-theoretic fingerprint overlaps both Group 1 and Group 17, quantitatively supporting its dual chemical character; that halogen-alkali-noble-gas triads show coherent, repeating structure across periods; and that the (H–He–Li) triad is structurally unique, marking the boundary between the atypical Period 1 and the regular periodicity of higher periods. This demonstrates that information theory not only reproduces the periodic law but also resolves long-standing classification debates, particularly the placement of hydrogen.
14. Complexity Measures
14.1. López-Mancini-Ruiz (LMC) Complexity
The 3D curve in (Shannon, Fisher, Disequilibrium) space shows again the ordered information-theoretic evolution of the atoms, but when the LMC complexity is added as a fourth dimension represented through color coding (Figure 12), new insights emerge. Low-Z elements (H, He and the light atoms of Period 2) appear at the high-Shannon/low-Fisher/low-disequilibrium end of the curve and are colored in reddish tones, indicating low structural complexity: their electron densities are either too diffuse (high entropy, small disequilibrium) or too simple to sustain rich internal structure. As Z increases, the points move along the arch toward larger Fisher and disequilibrium and smaller Shannon, and the color gradually shifts through orange-yellow-green into cyan and blue, signaling a steady increase of LMC complexity.
Mid- and high-Z atoms (transition metals, lanthanides, and actinides) lie in the region of simultaneously large localization (high Fisher, high disequilibrium) and non-negligible Shannon entropy, which is precisely where the LMC functional attains its highest values. In this sense, heavy atoms are not just more ordered (more localized) than light ones; they are also more structurally complex, exhibiting a richer internal organization of the electron density. The color gradient along the single information-theoretic spine of the periodic table therefore visualizes a monotonic build-up of atomic complexity from H to Lr, with simple, weakly structured densities at the beginning and highly organized, strongly correlated densities at the end, providing an appealing global measure of how complex atomic structure becomes across the periodic table.
14.2. Fisher-Shannon (FS) Complexity
The 3D curve formed by the atoms from H to Lr in (Shannon, Fisher, Disequilibrium) space traces the information-theoretic backbone of the periodic table. When this trajectory is colored by Fisher-Shannon (FS) complexity—a dyadic functional combining global delocalization (Shannon entropy) and local sharpened structure (Fisher information)—a clear, monotonic pattern emerges: complexity increases steadily across the periodic table (Figure 13).
At the high-Shannon/low-Fisher/low-disequilibrium end of the curve, elements such as H, He, Li, Be, and B appear in warm red-orange tones (low-complexity regime). These atoms have relatively simple electron densities—either too diffuse (high entropy) or too symmetric to generate strong local gradients. In these cases, the FS functional remains small, indicating minimal structural richness in the information-theoretic sense.
As Z increases across the second, third, and fourth periods, the trajectory bends upward in Fisher and outward in disequilibrium while moving downward in Shannon. The colors transition from yellow to green (intermediate-complexity regime), reflecting the emergence of more structured electron densities, especially with the filling of p- and early d-orbitals. These atoms exhibit both moderate global delocalization and increasingly sharp probability gradients, causing the FS measure to rise.
Beyond Z ≈ 40, and especially through Periods 6 and 7, the Fisher and disequilibrium values grow substantially due to strong electron localization, while Shannon entropy remains sufficiently large to maintain nontrivial global spread. These atoms show maximal FS complexity, reflected in the deep cyan-blue region of the color map (high-complexity regime). In particular, late transition metals (e.g., Ru, Rh, Pd, Pt), lanthanides with f-electron contraction, and actinides subject to relativistic effects all cluster in the upper, blue-shaded region, indicating that they possess the richest and most elaborate internal structure of the electron density among all atoms.
Because FS complexity depends multiplicatively on Fisher and Shannon terms, its color progression aligns perfectly with the curvature of the 3D Fisher-Shannon-Disequilibrium path. The result is a smooth informational spiral from red to blue as Z increases, making the periodic table appear as a progressive build-up of structural complexity: simple systems (H–Ne) appear red-orange, moderately structured systems (Na–Zn, Ga–Kr) appear yellow-green, and highly complex systems (Zr–Lr) appear cyan-blue. This representation reveals a fundamental information-theoretic law of the periodic system: atomic complexity grows monotonically with nuclear charge, driven by the joint increase of internal organization (Fisher) and nontrivial spread (Shannon) of the electron density.
15. Statistical Correlation Validation
15.1. Methodology
To assess whether the 3D space formed by the I, S, and D triads (in both position and momentum space) correlates with common element classifications, two statistical analyses were performed. Elements were categorized based on period, group number, and chemical families (e.g., alkali, halogens, noble gases). These analyses were conducted for each classification using the triads in both position and momentum space. Additionally, to mitigate the impact of varying scales among the IT-measures, Min-Max normalization was applied to the data. This process involved subtracting the minimum value and dividing by the range (the difference between the maximum and minimum values).
First, the Wilks’ Lambda statistic ()[71] was employed to assess element separability within the IT-space. This statistic measures the ratio of within-group variance (unexplained variance) to total variance. In essence, it quantifies the degree of group overlap in the multidimensional space defined by the three IT-measures; a value close to zero indicates that the variables effectively separate the classified groups.
Complementarily, the Random Forest algorithm[72] was used to determine how accurately the element classifications could be recovered from the IT-measures. This method predicts categorical classifications based on hierarchical decision trees derived from the data features. High predictive accuracy implies a strong correlation between the IT-features and the chemical classification.
To evaluate the Random Forest model, we employed a 5-fold cross-validation technique. This involved partitioning the data into five subsets (folds). Five independent models were trained, each using four subsets for training and the remaining one for testing, rotating the test set in each iteration. Accuracy was calculated as the ratio of correctly predicted elements to the total number of elements. The mean accuracy across the five folds was used as an indicator of the correlation between the IT-triad and the classifications.
15.2. Wilks’ statistics analysis
The Wilks’ Lambda analysis revealed that the , and D IT-measures provide a natural representation of the periodicity of the elements. As illustrated in the previous 3D-plots, each period is clearly distinguishable within the space for both position and momentum representations. This observation is corroborated by values lower than 0.1 in both spaces (see Tab. Table 1), indicating a statistically significant separation between elements grouped by period. Conversely, classifications based on group numbers and chemical families yielded values close to one, indicating high group overlap.
Notably, periodicity is particularly well-represented in momentum space. The lower value obtained in this space is consistent with the visual evidence from the 3D plots, where periods appeared clearly separated.
15.2.1. Random forest analysis
The Random Forest results corroborate both the Wilks’ statistical analysis and the visual evidence from the 3D plots. The highest predictive accuracy was achieved when predicting the elements’ periods using IT-triads in both position and momentum spaces, indicating a strong correlation between the IT-measures and periodicity. Conversely, accuracies for the other two classifications hovered around 33% (the expected baseline for random guessing), suggesting that the IT-triads do not effectively encode these particular chemical classifications.

Table 2.
Cross-validated accuracies of Random Forest models trained using the S, I, and D triads in position (r) and momentum (p) spaces to predict common element classifications.
Table 2.
Cross-validated accuracies of Random Forest models trained using the S, I, and D triads in position (r) and momentum (p) spaces to predict common element classifications.
| Classification | Accuracy (%,r) | Accuracy (%,p) |
|---|---|---|
| Periods | 78.7 | 69.0 |
| Numeric Groups | 24.2 | 28.0 |
| Chemical Families | 49.4 | 49.6 |
In summary, both statistical analyses confirm the visual trends. These results validate the distinct separation of periods observed in the S, I, D space for both position and momentum representations. Collectively, this constitutes formal evidence that these properties are intrinsically linked to the periodic nature of the elements, supporting the hypothesis that the spiral shape is a natural representation of the periodic table.
16. Conclusions
This comprehensive information-theoretic analysis of atomic electron densities across the periodic table demonstrates that Shannon entropy, Fisher information, and disequilibrium provide a unified and powerful framework for understanding chemical periodicity. The three-dimensional representation in (Shannon, Fisher, Disequilibrium) space reveals that the periodic table can be interpreted as a continuous, geometrical spiral embedded in information space, with each period forming a distinct segment of this global trajectory.
The analysis reveals several key findings. First, Shannon entropy decreases systematically with atomic number, reflecting progressive electronic localization, while Fisher information and disequilibrium increase, capturing the growing gradient content and concentration of electron densities. Second, the relationships between pairs of information-theoretic measures are universal and largely shell-independent, with all periods following common trajectories with only minor deviations at shell onsets. Third, chemical anomalies such as the exceptional configurations of Cr and Cu produce clear information-theoretic signatures, demonstrating the sensitivity of these measures to subtle electronic structure effects. Fourth, the complementary analysis in momentum space reveals maximum differentiation for lighter atoms and compression among heavy elements, reflecting the uncertainty principle. Fifth, triadic analysis around halogens provides geometric evidence for hydrogen’s dual chemical character and the unique nature of Period 1 elements. Finally, complexity measures such as LMC and FS show monotonic increase with atomic number, establishing that atomic structural complexity grows systematically across the periodic table.
These results establish information theory as a quantitative and insightful approach to understanding atomic structure and chemical periodicity, providing an alternative perspective that complements traditional quantum mechanical descriptions while offering new insights into the fundamental organization of the elements.
Funding
This research received no external funding.
Data Availability Statement
All the data presented in this study is available in the supplementary material.
Acknowledgments
Authors thank the Laboratorio de Supercómputo y Visualización at UAM for allocation of supercomputing time. H.V-H. thanks financial support from the Secretaría de Ciencia, Humanidades, Tecnología e Innovación (Secihti, México) for a M.Sc. scholarship (CVU: 993929).
Conflicts of Interest
The authors declare no conflict of interest.
Author Contributions
Conceptualization, methodology, formal analysis, investigation, writing—original draft preparation, writing—review and editing, visualization.
Funding
This research received no external funding.
Data Availability Statement
Data are available upon request from the authors.
Conflicts of Interest
The authors declare no conflicts of interest.
References
- Mendeleev, D.I. Sootnoshenie svoistv s atomnym vesom elementov. Zhurnal Russkogo Fiziko-Khimicheskogo Obshchestva 1869, 1, 60–79. [Google Scholar]
- Mendeleev, D.I. Estestvennaya sistema elementov i primenieee k ukazaniyu svoistv neotkrytykh elementov. Zhurnal Russkogo Fiziko-Khimicheskogo Obshchestva 1871, 3, 25–56. [Google Scholar]
- Van Spronsen, J.W. The Periodic System of Chemical Elements: A History of the First Hundred Years; Elsevier: Amsterdam, 1969. [Google Scholar]
- Scerri, E.R. The Periodic Table: Its Story and Its Significance; Oxford University Press: Oxford, 2007. [Google Scholar]
- Petruševski, V.M.; Cvetković, J. On the ’True Position’ of Hydrogen in the Periodic Table. Contributions, Section of Natural, Mathematical and Biotechnical Sciences, MASA 2017, 38, 83–90. [Google Scholar] [CrossRef]
- Labarca, M.; Srivaths, A. On the Placement of Hydrogen and Helium in the Periodic System: A New Approach. Chemistry: Bulgarian Journal of Science Education 2016, 25, 514–530. [Google Scholar]
- Dash, H.H. Constant Energy Differences in Atomic Structure. Nature 1963, 198, 25–26. [Google Scholar] [CrossRef]
- Dash, H.H. Position of Hydrogen in the Periodic System of Elements. Nature 1964, 202, 1001–1003. [Google Scholar] [CrossRef]
- Sacks, L.J. Concerning the Position of Hydrogen in the Periodic Table. Foundations of Chemistry 2006, 8, 31–35. [Google Scholar] [CrossRef]
- Langmuir, I. The Arrangements of Electrons in Atoms and Molecules. Journal of the American Chemical Society 1919, 41, 868–934. [Google Scholar] [CrossRef]
- Luder, W.F. Electron Configuration as the Basis of the Periodic Table. Journal of Chemical Education 1943, 20, 21–26. [Google Scholar] [CrossRef]
- Janet, C. La classification hélicoïdale des éléments chimiques. 1928. [Google Scholar]
- Janet, C. The Helicoidal Classification of the Elements. Chemical News 1929, 138, 372–374, 388–393. [Google Scholar]
- Katz, G. The Periodic Table: An Eight-Period Table for the 21st Century. Chemical Educator 2001, 6, 324–332. [Google Scholar] [CrossRef]
- Bohr, N. The Theory of Spectra and Atomic Constitution. 1922. [Google Scholar]
- Scerri, E.R. Chemistry, Spectroscopy, and the Question of Reduction. Journal of Chemical Education 1991, 68, 122–126. [Google Scholar] [CrossRef]
- Simmons, L.M. A Modification of the Periodic Table. Journal of Chemical Education 1947, 24, 588–591. [Google Scholar] [CrossRef]
- Schwarz, W.H.E. The Full Story of Electron Configurations. Journal of Chemical Education 2010, 87, 444–448. [Google Scholar] [CrossRef]
- Sanderson, R.T. A Rational Periodic Table. Journal of Chemical Education 1964, 41, 187–189. [Google Scholar] [CrossRef]
- Allen, L.C. Electronegativity is the Average One-Electron Energy of the Valence-Shell Electrons in Ground-State Free Atoms. Journal of the American Chemical Society 1989, 111, 9003–9014. [Google Scholar] [CrossRef]
- Leach, M.R. Concerning Electronegativity as a Basic Elemental Property and Why the Periodic Table is Usually Represented in Its Medium Form. Foundations of Chemistry 2013, 15, 13–29. [Google Scholar] [CrossRef]
- Rayner-Canham, G.; Overton, T. Descriptive Inorganic Chemistry. 2010. [Google Scholar] [CrossRef]
- Scerri, E.R. The Role of Triads in the Evolution of the Periodic Table: Past and Present. Journal of Chemical Education 2008, 85, 585–589. [Google Scholar] [CrossRef]
- Scerri, E.R. Explaining the Periodic Table, and the Role of Chemical Triads. Foundations of Chemistry 2010, 12, 69–83. [Google Scholar] [CrossRef]
- Bent, H.A. New Ideas in Chemistry from Fresh Energy for the Periodic Law. 2006. [Google Scholar]
- Firsching, F.H. Anomalies in the Periodic Table. Journal of Chemical Education 1981, 58, 478–479. [Google Scholar] [CrossRef]
- Mendeleev, D.I. Die periodische Gesetzmässigkeit der chemischen Elemente. Annalen der Chemie und Pharmacie 1870, Supplementband 8, 133–229. [Google Scholar]
- Stewart, P.J. A Century on from Dmitrii Mendeleev: Tables and Spirals, Noble Gases and Nobel Prizes. Foundations of Chemistry 2007, 9, 235–245. [Google Scholar] [CrossRef]
- Kaesz, H.; Atkins, P.W. A Central Position for Hydrogen in the Periodic Table. Chemistry International 2003, 25, 14. [Google Scholar] [CrossRef]
- Rodríguez Peña, M.; García Guerra, J.A. The Periodic Spiral of Elements. Foundations of Chemistry 2024, 26, 315–321. [Google Scholar] [CrossRef]
- Imyanitov, N.S. Spiral as the Fundamental Graphic Representation of the Periodic Law. Blocks of Elements as the Autonomic Parts of the Periodic System. Foundations of Chemistry 2016, 18, 153–173. [Google Scholar] [CrossRef]
- Scherer, J.A. Models of a Spiral Periodic Chart. Journal of Chemical Education 1949, 26, 113–117. [Google Scholar] [CrossRef]
- Stewart, P.J. Charles Janet: Unrecognized Genius of the Periodic System. Foundations of Chemistry 2010, 12, 5–15. [Google Scholar] [CrossRef]
- Janet, C. Concordance de l’arrangement quantique de base des électrons planétaires des atomes avec la classification scalariforme, hélicoïdale des elements chimiques. 1930. [Google Scholar]
- Tsimmerman, V. ADOMAH Periodic Table. 2013. [Google Scholar]
- Kurushkin, M. Viatscheslaw Romanoff: Unknown Genius of the Periodic System. Pure and Applied Chemistry 2019, 91, 1921–1928. [Google Scholar] [CrossRef]
- Petruševski, V.M.; Cvetković, J. On the ’True Position’ of Hydrogen in the Periodic Table. Foundations of Chemistry 2018, 20, 251–260. [Google Scholar] [CrossRef]
- Laing, M. Where to Put Hydrogen in a Periodic Table? Foundations of Chemistry 2007, 9, 127–137. [Google Scholar] [CrossRef]
- Rich, R.L. Are Some Elements More Equal Than Others? Journal of Chemical Education 2005, 82, 1761–1763. [Google Scholar] [CrossRef]
- Scerri, E.R. Mendeleev’s Periodic Table is Finally Completed and What to Do About Group 3. Chemistry International 2012, 34, 28–31. [Google Scholar] [CrossRef]
- Esquivel, R.O.; Angulo, J.C.; Antolín, J.; Dehesa, J.S.; López-Rosa, S.; Flores-Gallegos, N. Analysis of complexity measures and information planes of selected molecules in position and momentum spaces. Physical Chemistry Chemical Physics 2010, 12, 7108. [Google Scholar] [CrossRef] [PubMed]
- Esquivel, R.O.; López-Rosa, S.; Molina-Espíritu, M.; Angulo, J.C.; Dehesa, J.S. Information-theoretic space from simple atomic and molecular systems to biological and pharmacological molecules. Theoretical Chemistry Accounts 2016, 135, 253. [Google Scholar] [CrossRef]
- Esquivel, R.O.; Flores-Gallegos, N.; Iuga, C.; Carrera, E.M.; Angulo, J.C.; Antolín, J. Phenomenological description of the transition state, and the bond breaking and bond forming processes of selected elementary chemical reactions: an information-theoretic study. Theoretical Chemistry Accounts 2009, 124, 445–460. [Google Scholar] [CrossRef]
- López-Rosa, S.; Esquivel, R.O.; Angulo, J.C.; Antolín, J.; Dehesa, J.S.; Flores-Gallegos, N. Fisher Information Study in Position and Momentum Spaces for Elementary Chemical Reactions. Journal of Chemical Theory and Computation 2010, 6, 145–154. [Google Scholar] [CrossRef]
- Vázquez-Hernández, H.; Esquivel, R.O. Phenomenological description of the acidity of the citric acid and its deprotonated species: informational-theoretical study. Journal of Molecular Modeling 2023, 29, 253. [Google Scholar] [CrossRef] [PubMed]
- Esquivel, R.O.; Molina-Espíritu, M.; López-Rosa, S.; Soriano-Correa, C.; Barrientos-Salcedo, C.; Kohout, M.; Dehesa, J.S. Predominant Information Quality Scheme for the Essential Amino Acids: An Information-Theoretical Analysis. ChemPhysChem 2015, 16, 2571–2581. [Google Scholar] [CrossRef]
- Demirtaş, K.; Erman, B.; Haliloğlu, T. Dynamic correlations: exact and approximate methods for mutual information. Bioinformatics 2024, 40, btae076. [Google Scholar] [CrossRef] [PubMed]
- Han, Z.; Wang, X.; Wu, Z.; Li, C. Study of the Allosteric Mechanism of Human Mitochondrial Phenylalanyl-tRNA Synthetase by Transfer Entropy via an Improved Gaussian Network Model and Co-evolution Analyses. The Journal of Physical Chemistry Letters 2023, 14, 3452–3460. [Google Scholar] [CrossRef] [PubMed]
- Hong, Q.J.; Liu, Z.K. Generalized approach for rapid entropy calculation of liquids and solids. Physical Review Research 2025, 7, L012030. [Google Scholar] [CrossRef]
- Giulini, M.; Menichetti, R.; Shell, M.S.; Potestio, R. An Information-Theory-Based Approach for Optimal Model Reduction of Biomolecules. Journal of Chemical Theory and Computation 2020, 16, 6795–6813. [Google Scholar] [CrossRef]
- Schwalbe-Koda, D.; Hamel, S.; Sadigh, B.; Zhou, F.; Lordi, V. Model-free estimation of completeness, uncertainties, and outliers in atomistic machine learning using information theory. Nature Communications 2025, 16, 4014. [Google Scholar] [CrossRef]
- Angulo, J.C.; Antolín, J.; Esquivel, R.O. Atomic and molecular complexities: Their physical and chemical interpretations. In Statistical Complexities: Applications in electronic structures; Sen, K.D., Ed.; Springer: Berlin, 2010. [Google Scholar]
- Rawlings, D.C.; Davidson, E.R. Molecular electron density distributions in position and momentum space. The Journal of Physical Chemistry 1985, 89, 969–974. [Google Scholar] [CrossRef]
- Kaijser, P.; Smith, V.H. Evaluation of Momentum Distributions and Compton Profiles for Atomic and Molecular Systems. In Advances in Quantum Chemistry; Elsevier, 1977; Vol. 10, pp. 37–76. [Google Scholar] [CrossRef]
- Baerends, E.J.; Aguirre, N.F.; Austin, N.D.; Autschbach, J.; Bickelhaupt, F.M.; Bulo, R.; Cappelli, C.; Van Duin, A.C.T.; Egidi, F.; Fonseca Guerra, C.; et al. The Amsterdam Modeling Suite. The Journal of Chemical Physics 2025, 162, 162501. [Google Scholar] [CrossRef]
- Shannon, C.E. A Mathematical Theory of Communication. Bell System Technical Journal 1948, 27, 379–423. [Google Scholar] [CrossRef]
- Fisher, R.A. Theory of Statistical Estimation. Mathematical Proceedings of the Cambridge Philosophical Society 1925, 22, 700–725. [Google Scholar] [CrossRef]
- Frieden, B.R. Science from Fisher information: a unification; Cambridge University Press: Cambridge, 2004. [Google Scholar]
- Carbo, R.; Leyda, L.; Arnau, M. How similar is a molecule to another? An electron density measure of similarity between two molecular structures. International Journal of Quantum Chemistry 1980, 17, 1185–1189. [Google Scholar] [CrossRef]
- Onicescu, O. Théorie de l’information. In Énergie informationnelle. C. R. Acad. Sci., Paris, Sér. A; 1966; Volume 263, pp. 841–842. [Google Scholar]
- López-Ruiz, R.; Mancini, H.; Calbet, X. A statistical measure of complexity. Physics Letters A 1995, 209, 321–326. [Google Scholar] [CrossRef]
- Anteneodo, C.; Plastino, A. Some features of the López-Ruiz-Mancini-Calbet (LMC) statistical measure of complexity. Physics Letters A 1996, 223, 348–354. [Google Scholar] [CrossRef]
- Romera, E.; Dehesa, J.S. The Fisher–Shannon information plane, an electron correlation tool. The Journal of Chemical Physics 2004, 120, 8906–8912. [Google Scholar] [CrossRef] [PubMed]
- Statistical Complexity: Applications in Electronic Structure; Sen, K., Ed.; Springer Netherlands: Dordrecht, 2011. [Google Scholar] [CrossRef]
- Yamano, T. A statistical complexity measure with nonextensive entropy and quasi-multiplicativity. Journal of Mathematical Physics 2004, 45, 1974–1987. [Google Scholar] [CrossRef]
- Shapiro, S.S.; Wilk, M.B. An Analysis of Variance Test for Normality (Complete Samples). Biometrika 1965, 52, 591. [Google Scholar] [CrossRef]
- Filliben, J.J. The Probability Plot Correlation Coefficient Test for Normality. Technometrics 1975, 17, 111–117. [Google Scholar] [CrossRef]
- Welch, B.L. The Generalization of `Student’s’ Problem when Several Different Population Variances are Involved. Biometrika 1947, 34, 28. [Google Scholar] [CrossRef]
- Satterthwaite, F.E. An Approximate Distribution of Estimates of Variance Components. Biometrics Bulletin 1946, 2, 110. [Google Scholar] [CrossRef] [PubMed]
- Virtanen, P.; Gommers, R.; Oliphant, T.E.; Haberland, M.; Reddy, T.; Cournapeau, D.; Burovski, E.; Peterson, P.; Weckesser, W.; Bright, J.; et al. SciPy 1.0: fundamental algorithms for scientific computing in Python. Nature Methods 2020, 17, 261–272. [Google Scholar] [CrossRef] [PubMed]
- Wilks, S.S. Certain generalizations in the analysis of variance. Biometrika 1932, 24, 471–494. [Google Scholar] [CrossRef]
- Breiman, L. Random forests. Machine learning 2001, 45, 5–32. [Google Scholar] [CrossRef]
- Seabold, S.; Perktold, J. statsmodels: Econometric and statistical modeling with python. In Proceedings of the 9th Python in Science Conference, 2010. [Google Scholar]
- Pedregosa, F.; Varoquaux, G.; Gramfort, A.; Michel, V.; Thirion, B.; Grisel, O.; Blondel, M.; Prettenhofer, P.; Weiss, R.; Dubourg, V.; et al. Scikit-learn: Machine Learning in Python. Journal of Machine Learning Research 2011, 12, 2825–2830. [Google Scholar]
Figure 1.
Shannon entropy in position space versus the atomic number of atomic elements from 1 to 103. Each period is represented by a distinct color, revealing the systematic decrease in entropy with increasing nuclear charge.
Figure 1.
Shannon entropy in position space versus the atomic number of atomic elements from 1 to 103. Each period is represented by a distinct color, revealing the systematic decrease in entropy with increasing nuclear charge.
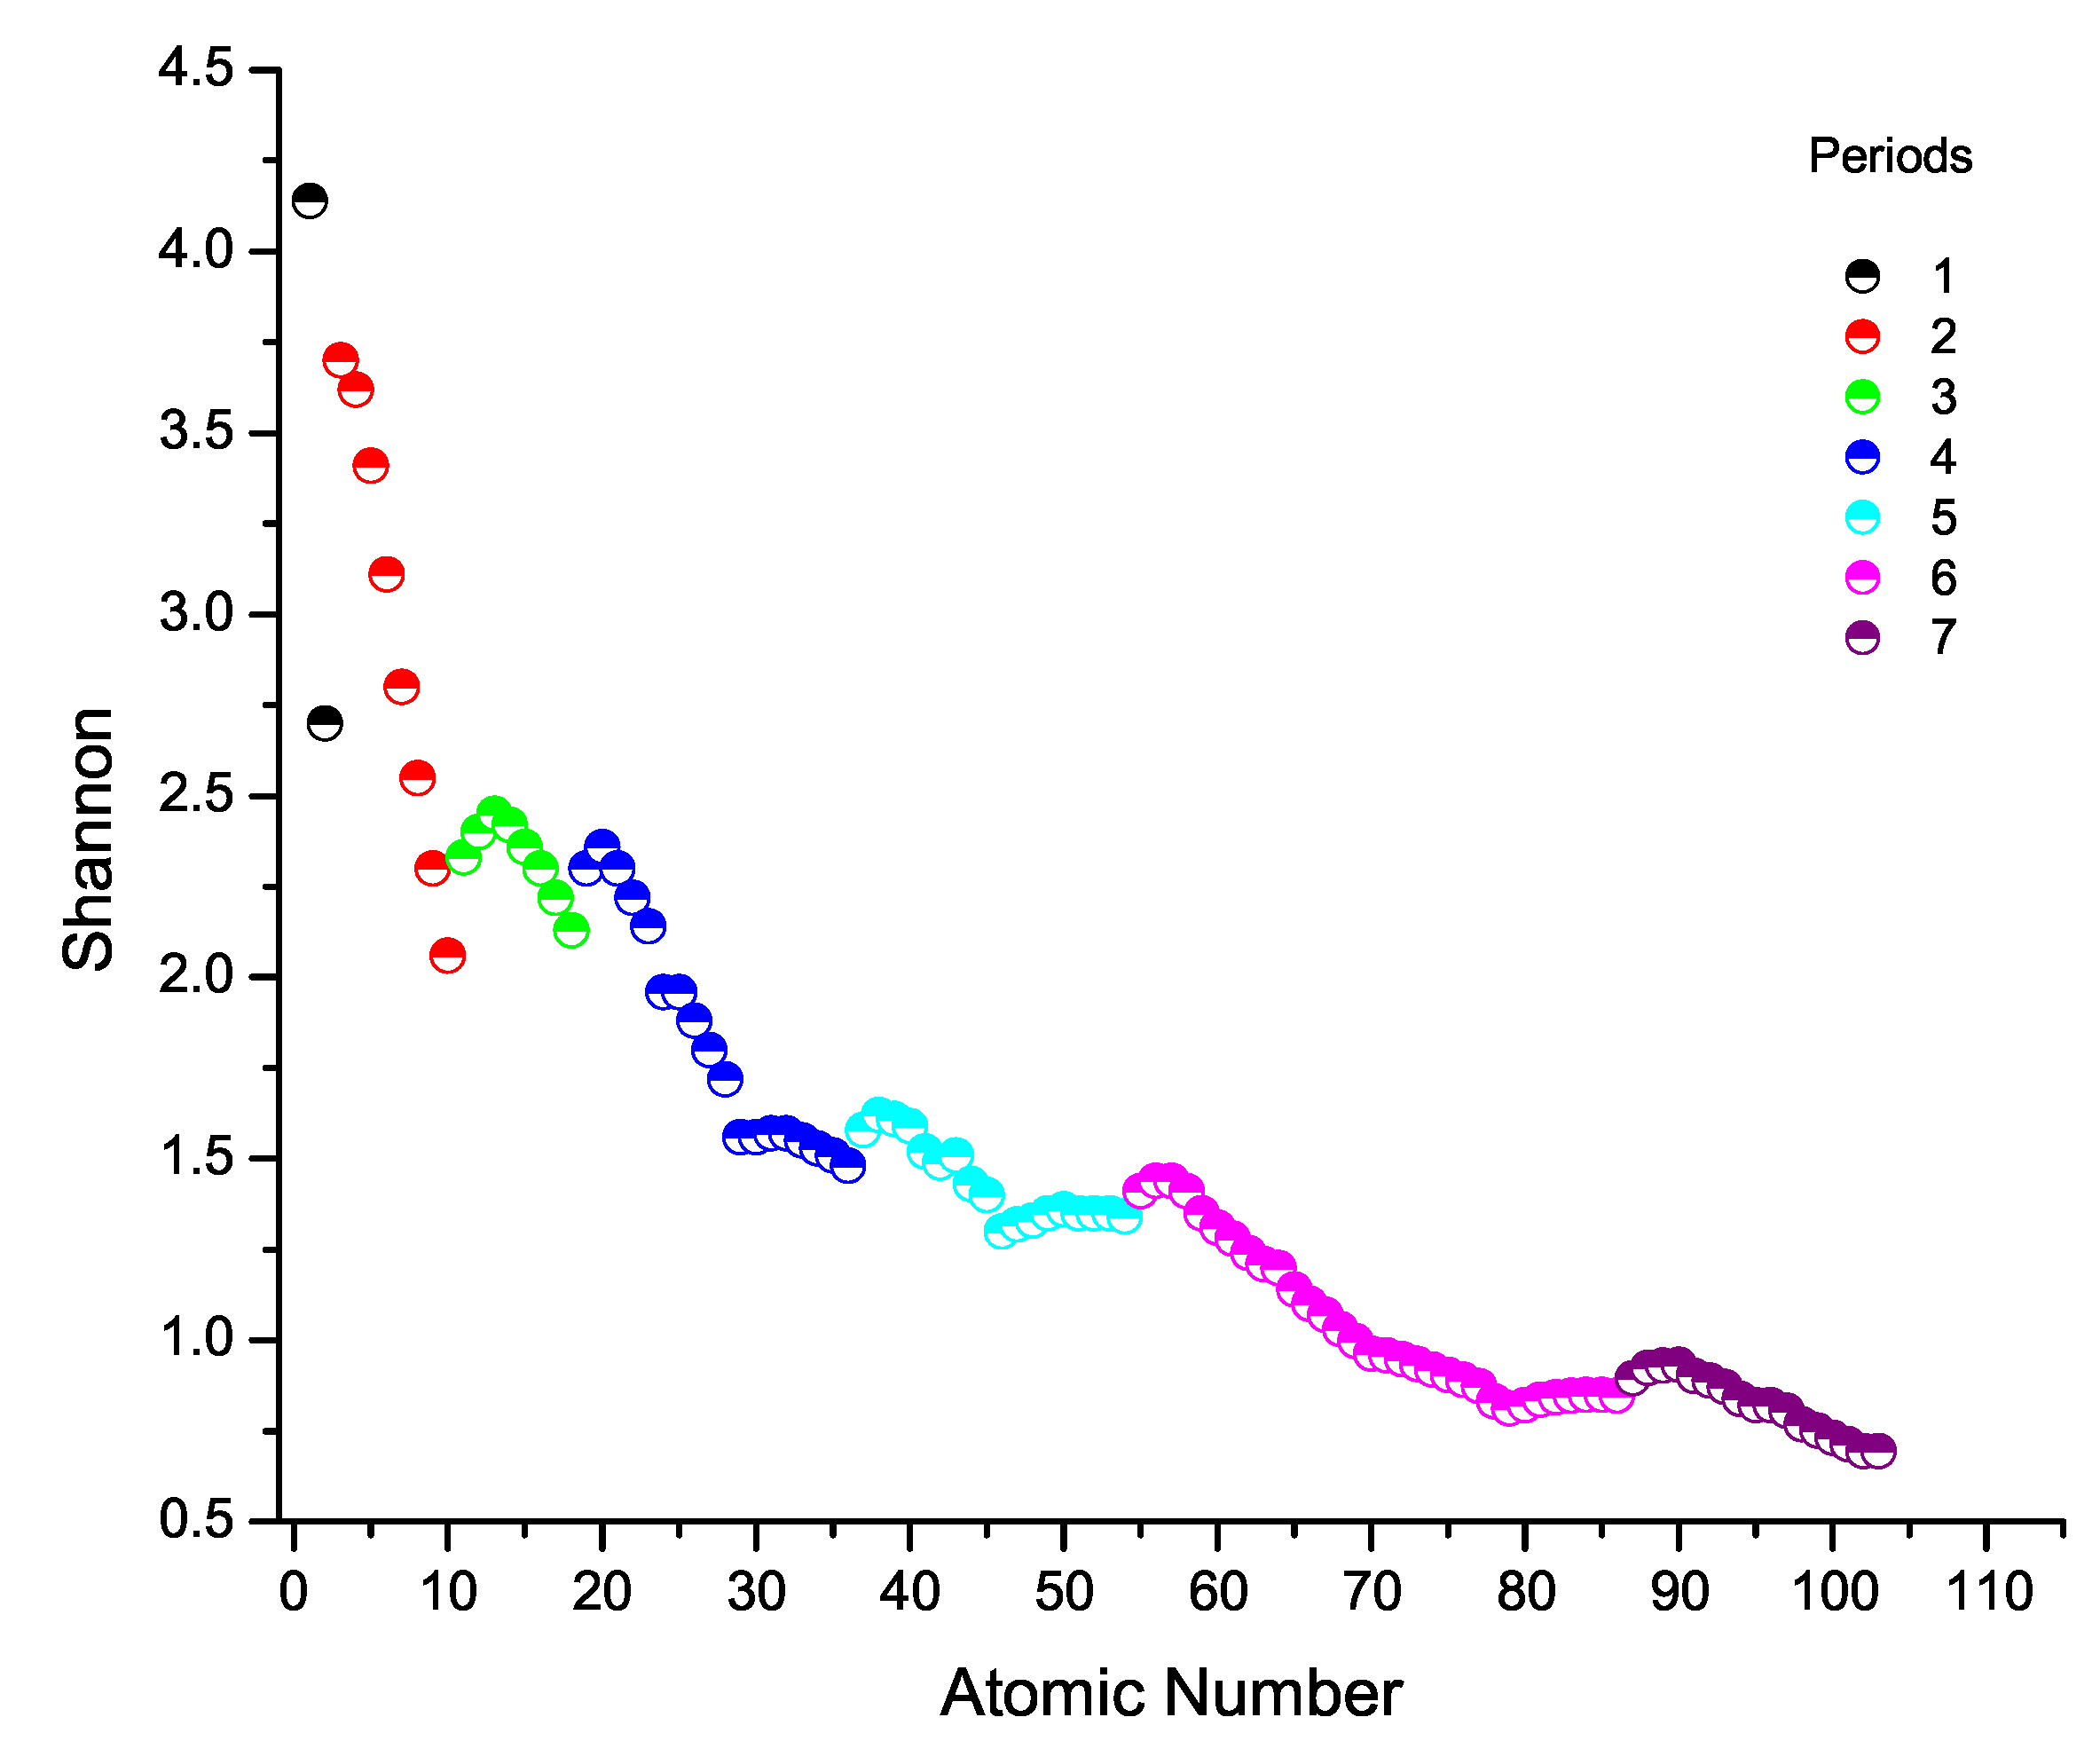
Figure 2.
Fisher information measure in position space versus the atomic number of atomic elements from 1 to 103.
Figure 2.
Fisher information measure in position space versus the atomic number of atomic elements from 1 to 103.
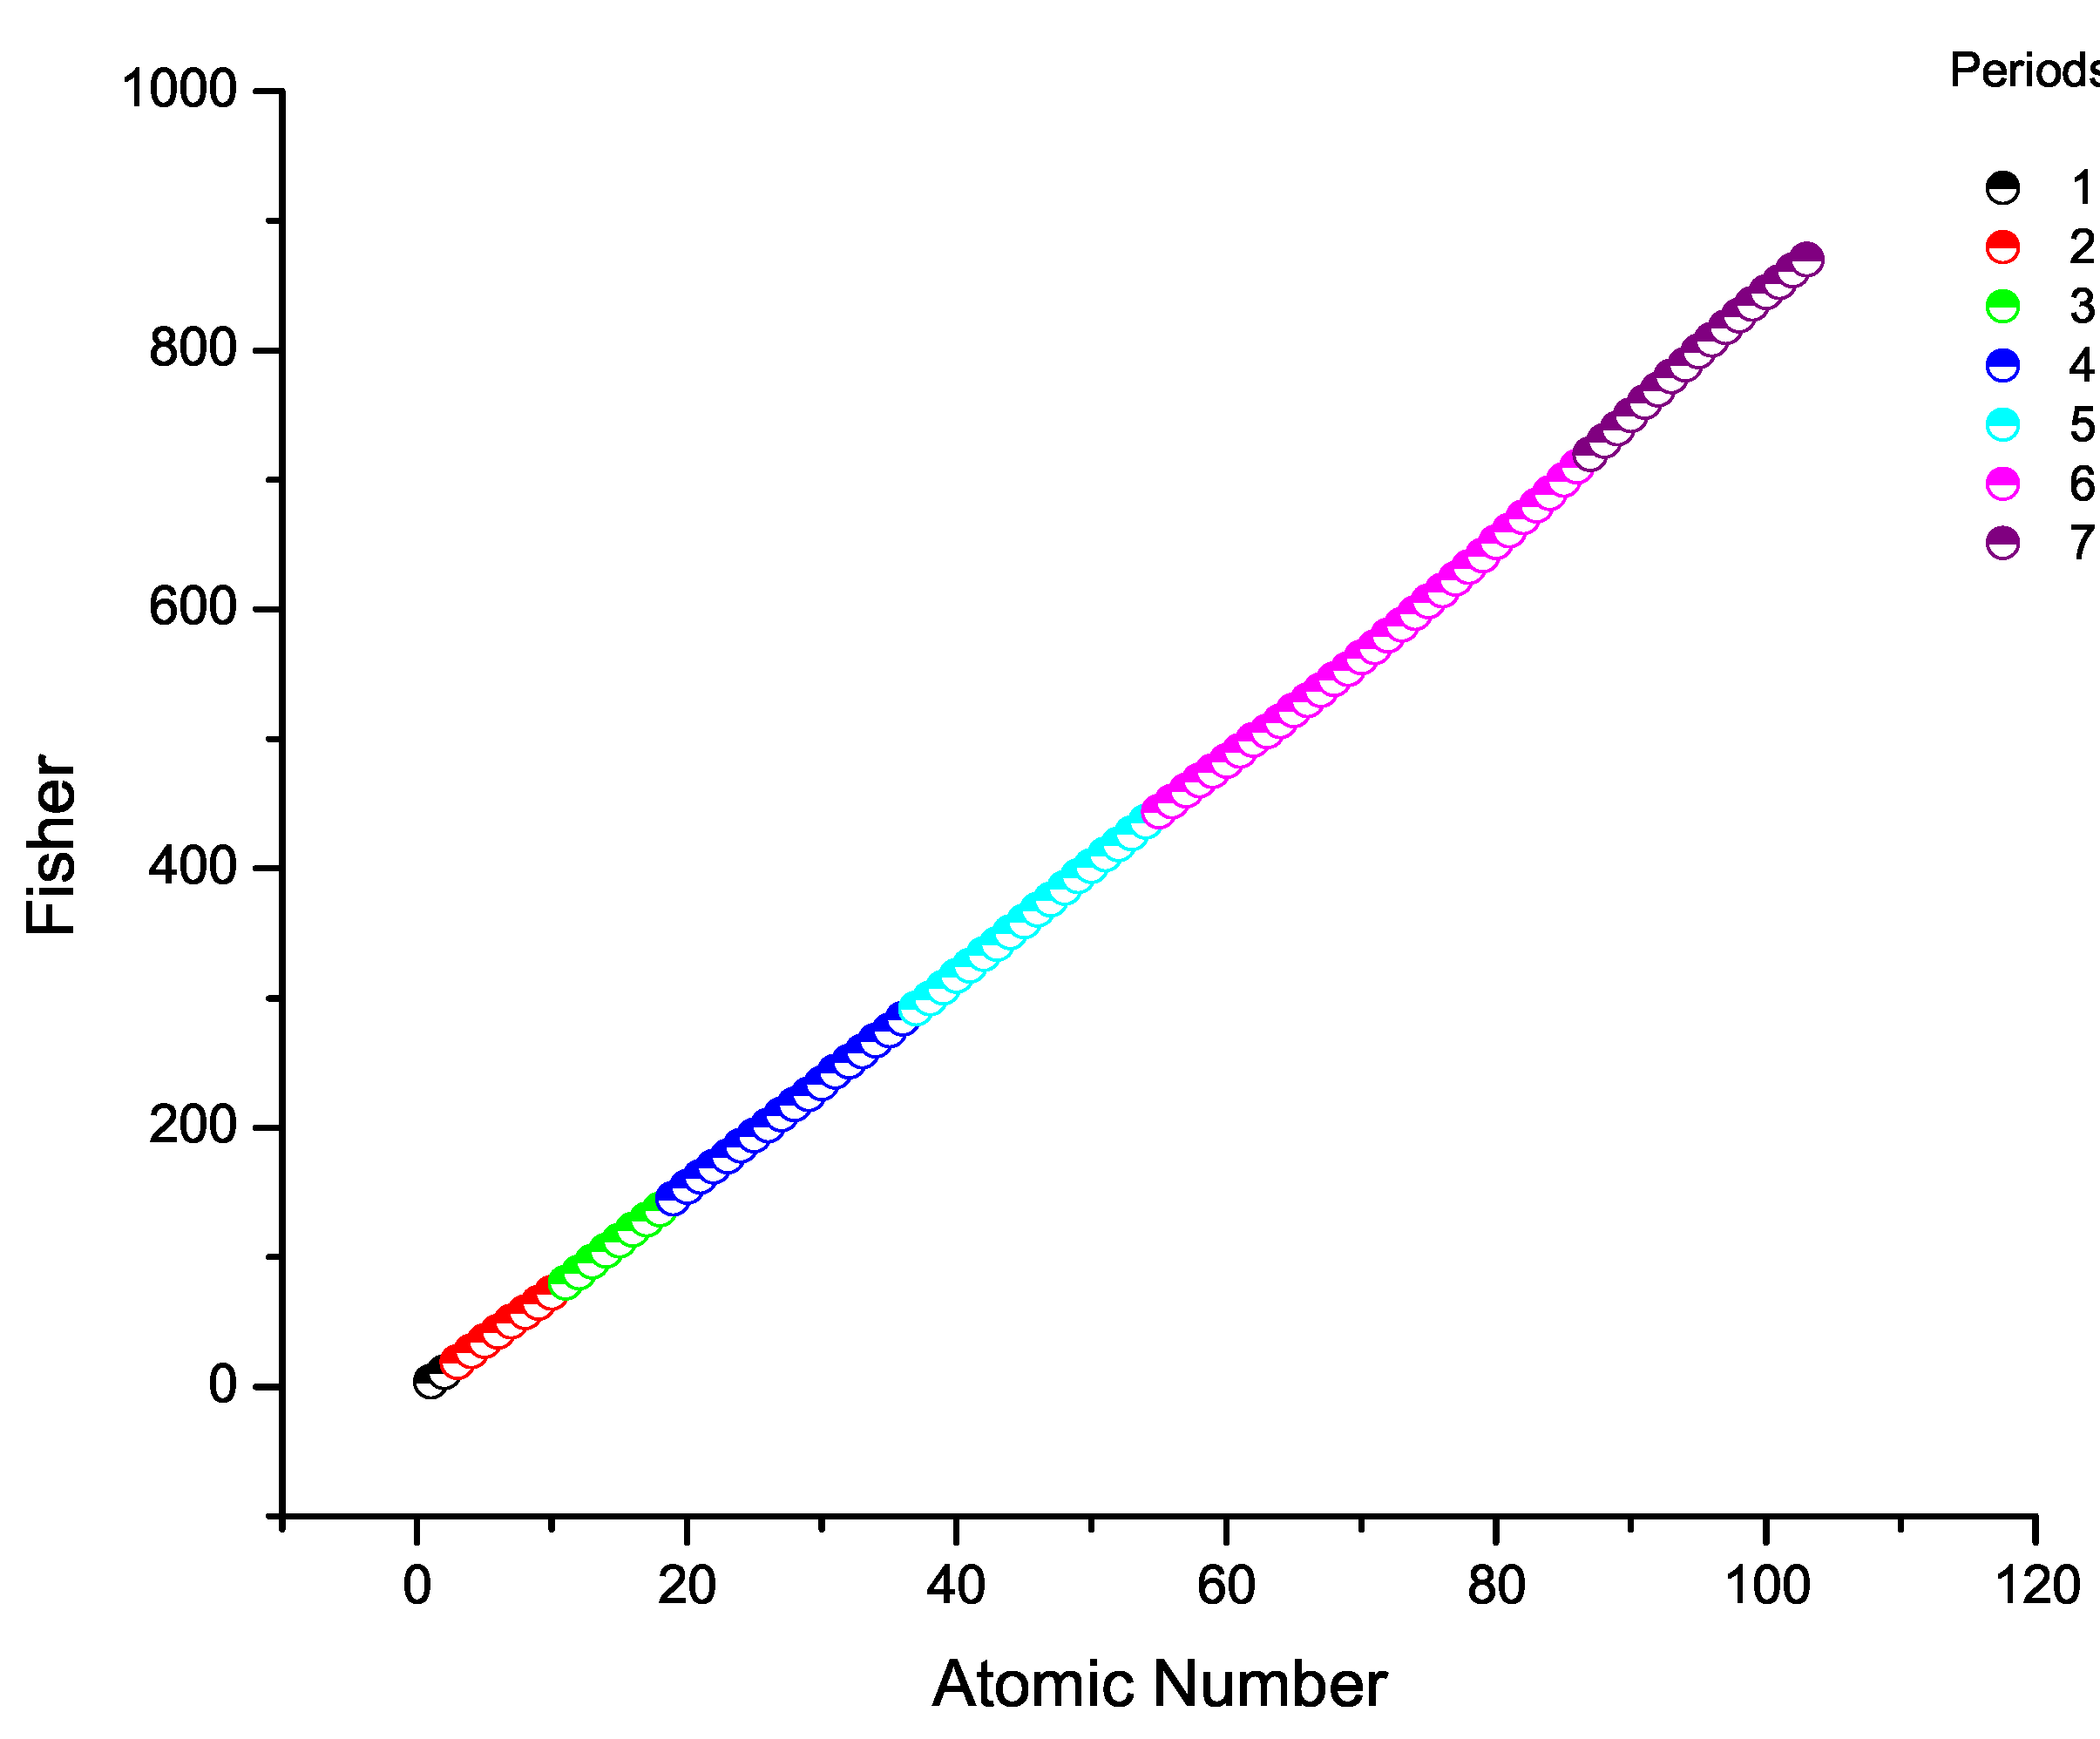
Figure 3.
Disequilibrium measure in position space versus the atomic number of atomic elements from 1 to 103.
Figure 3.
Disequilibrium measure in position space versus the atomic number of atomic elements from 1 to 103.
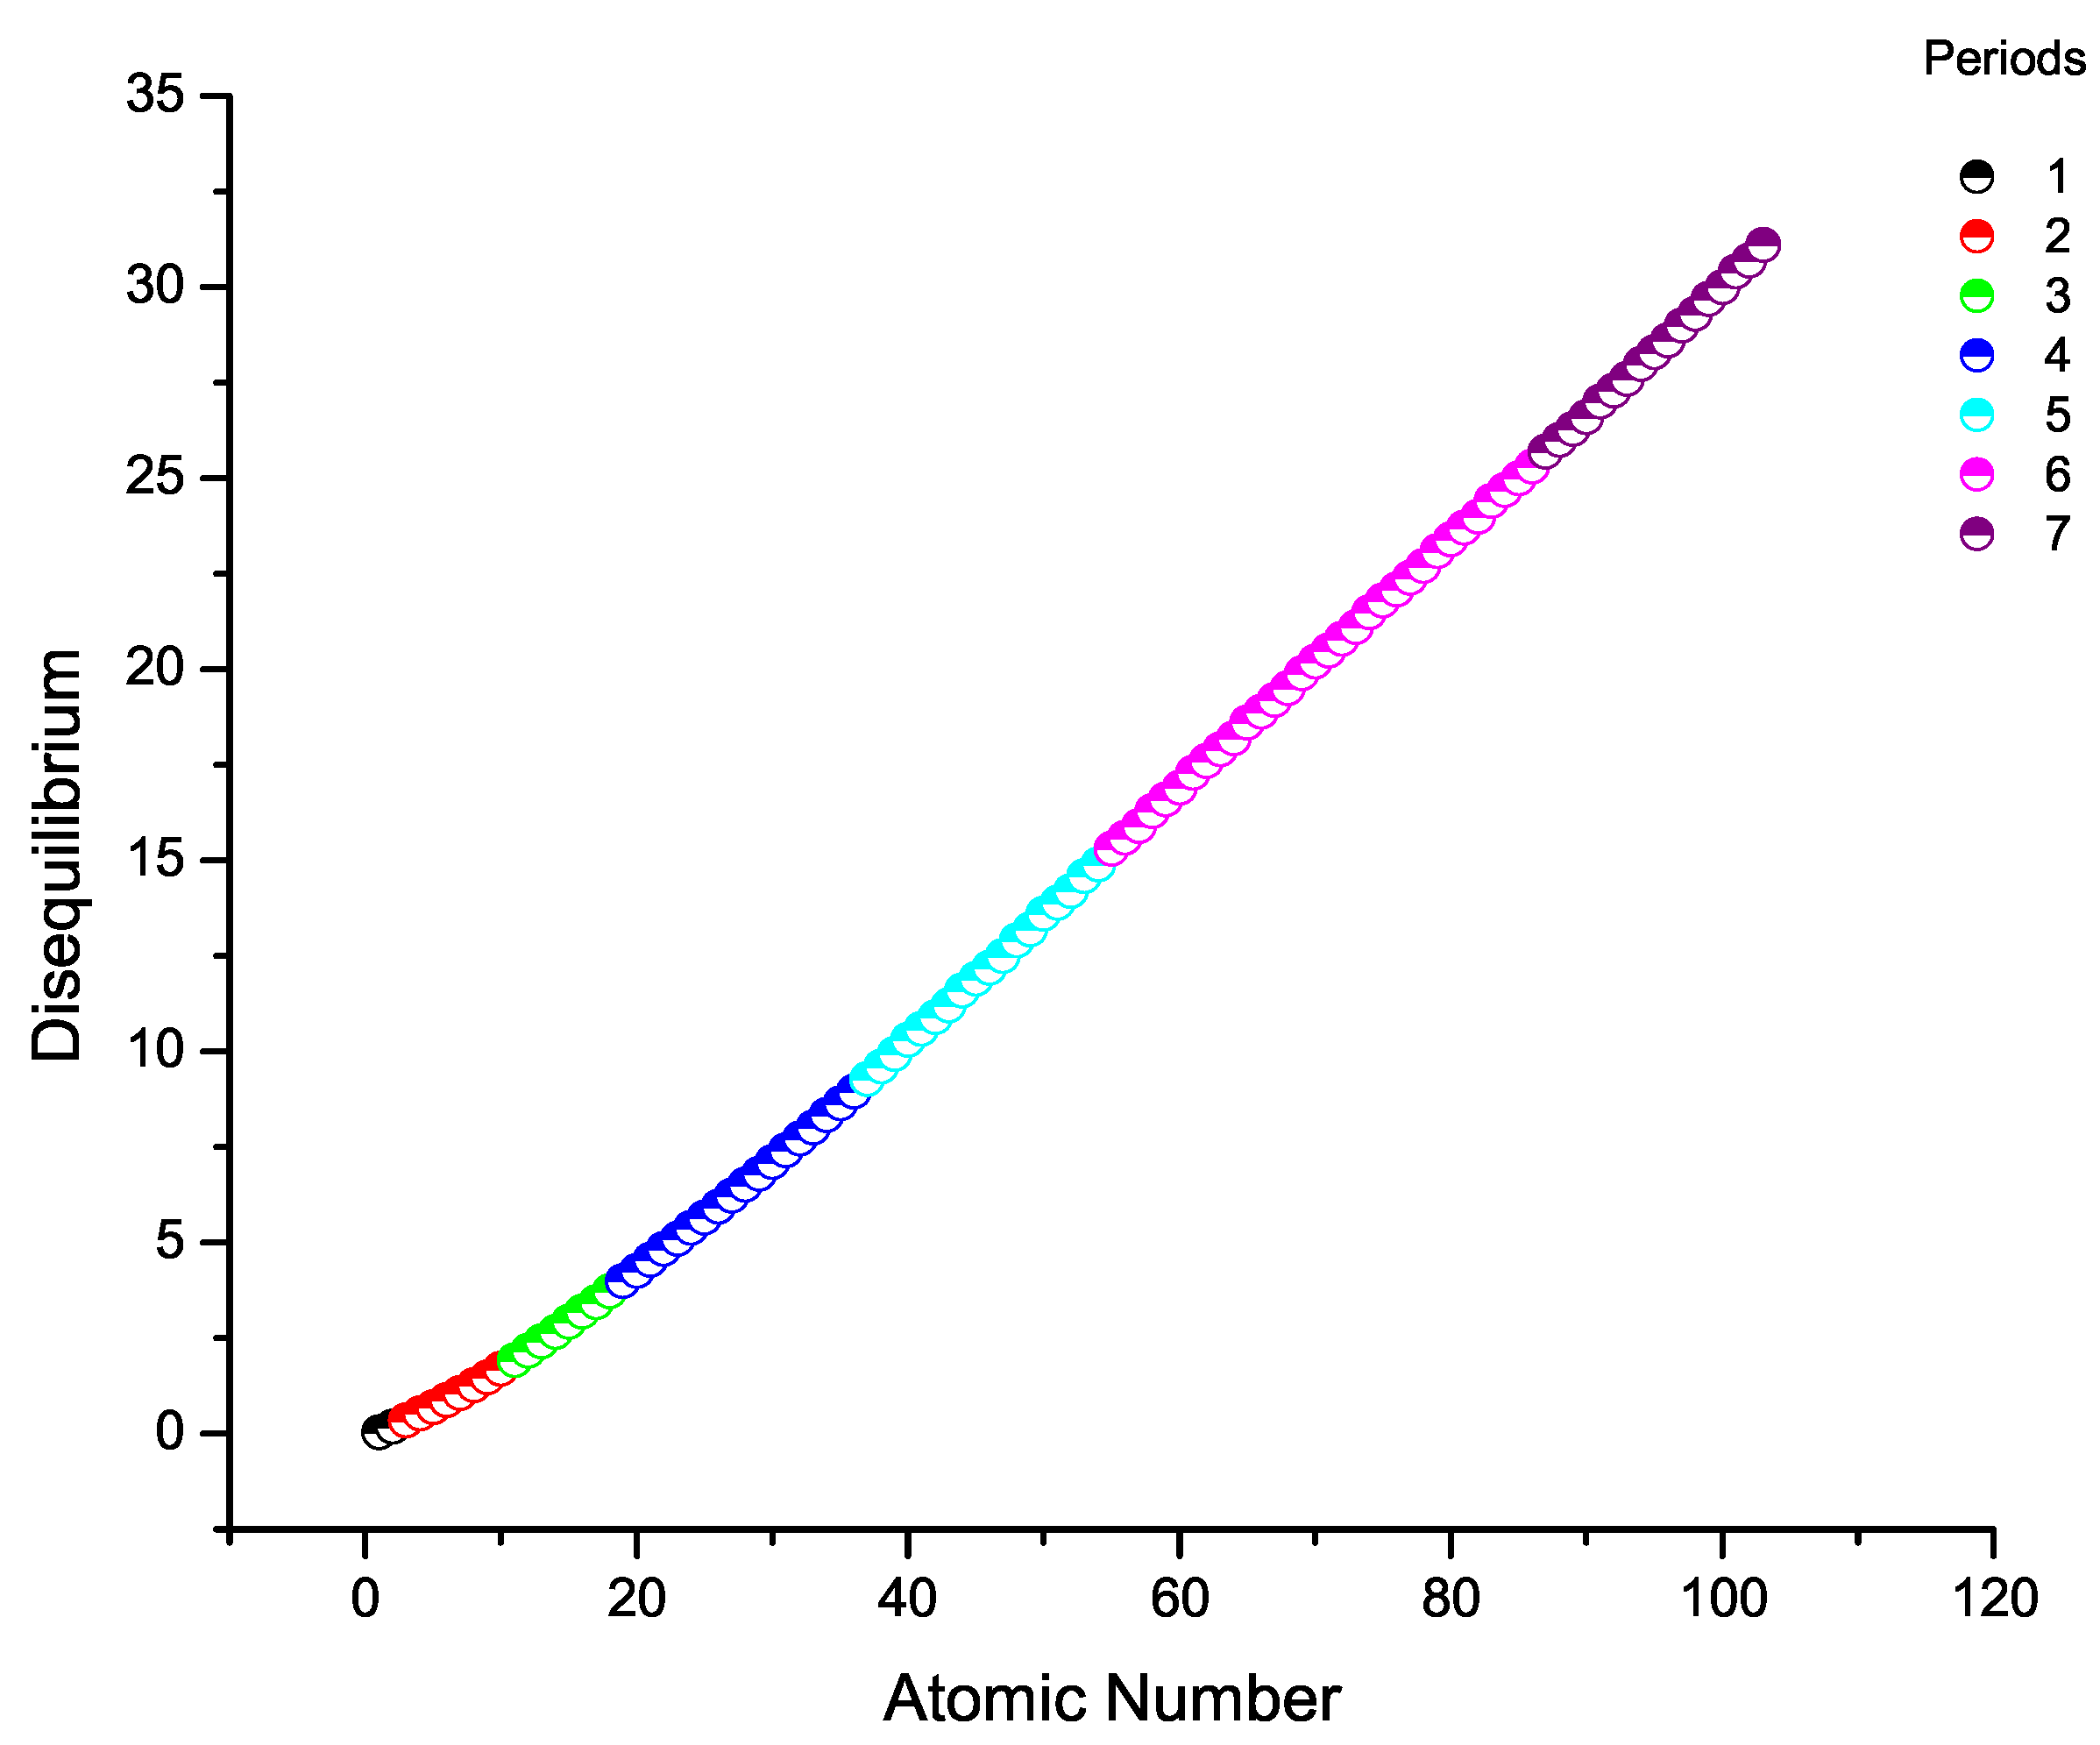
Figure 4.
Shannon entropy versus disequilibrium measure in position space for the atomic elements from 1 to 103.
Figure 4.
Shannon entropy versus disequilibrium measure in position space for the atomic elements from 1 to 103.
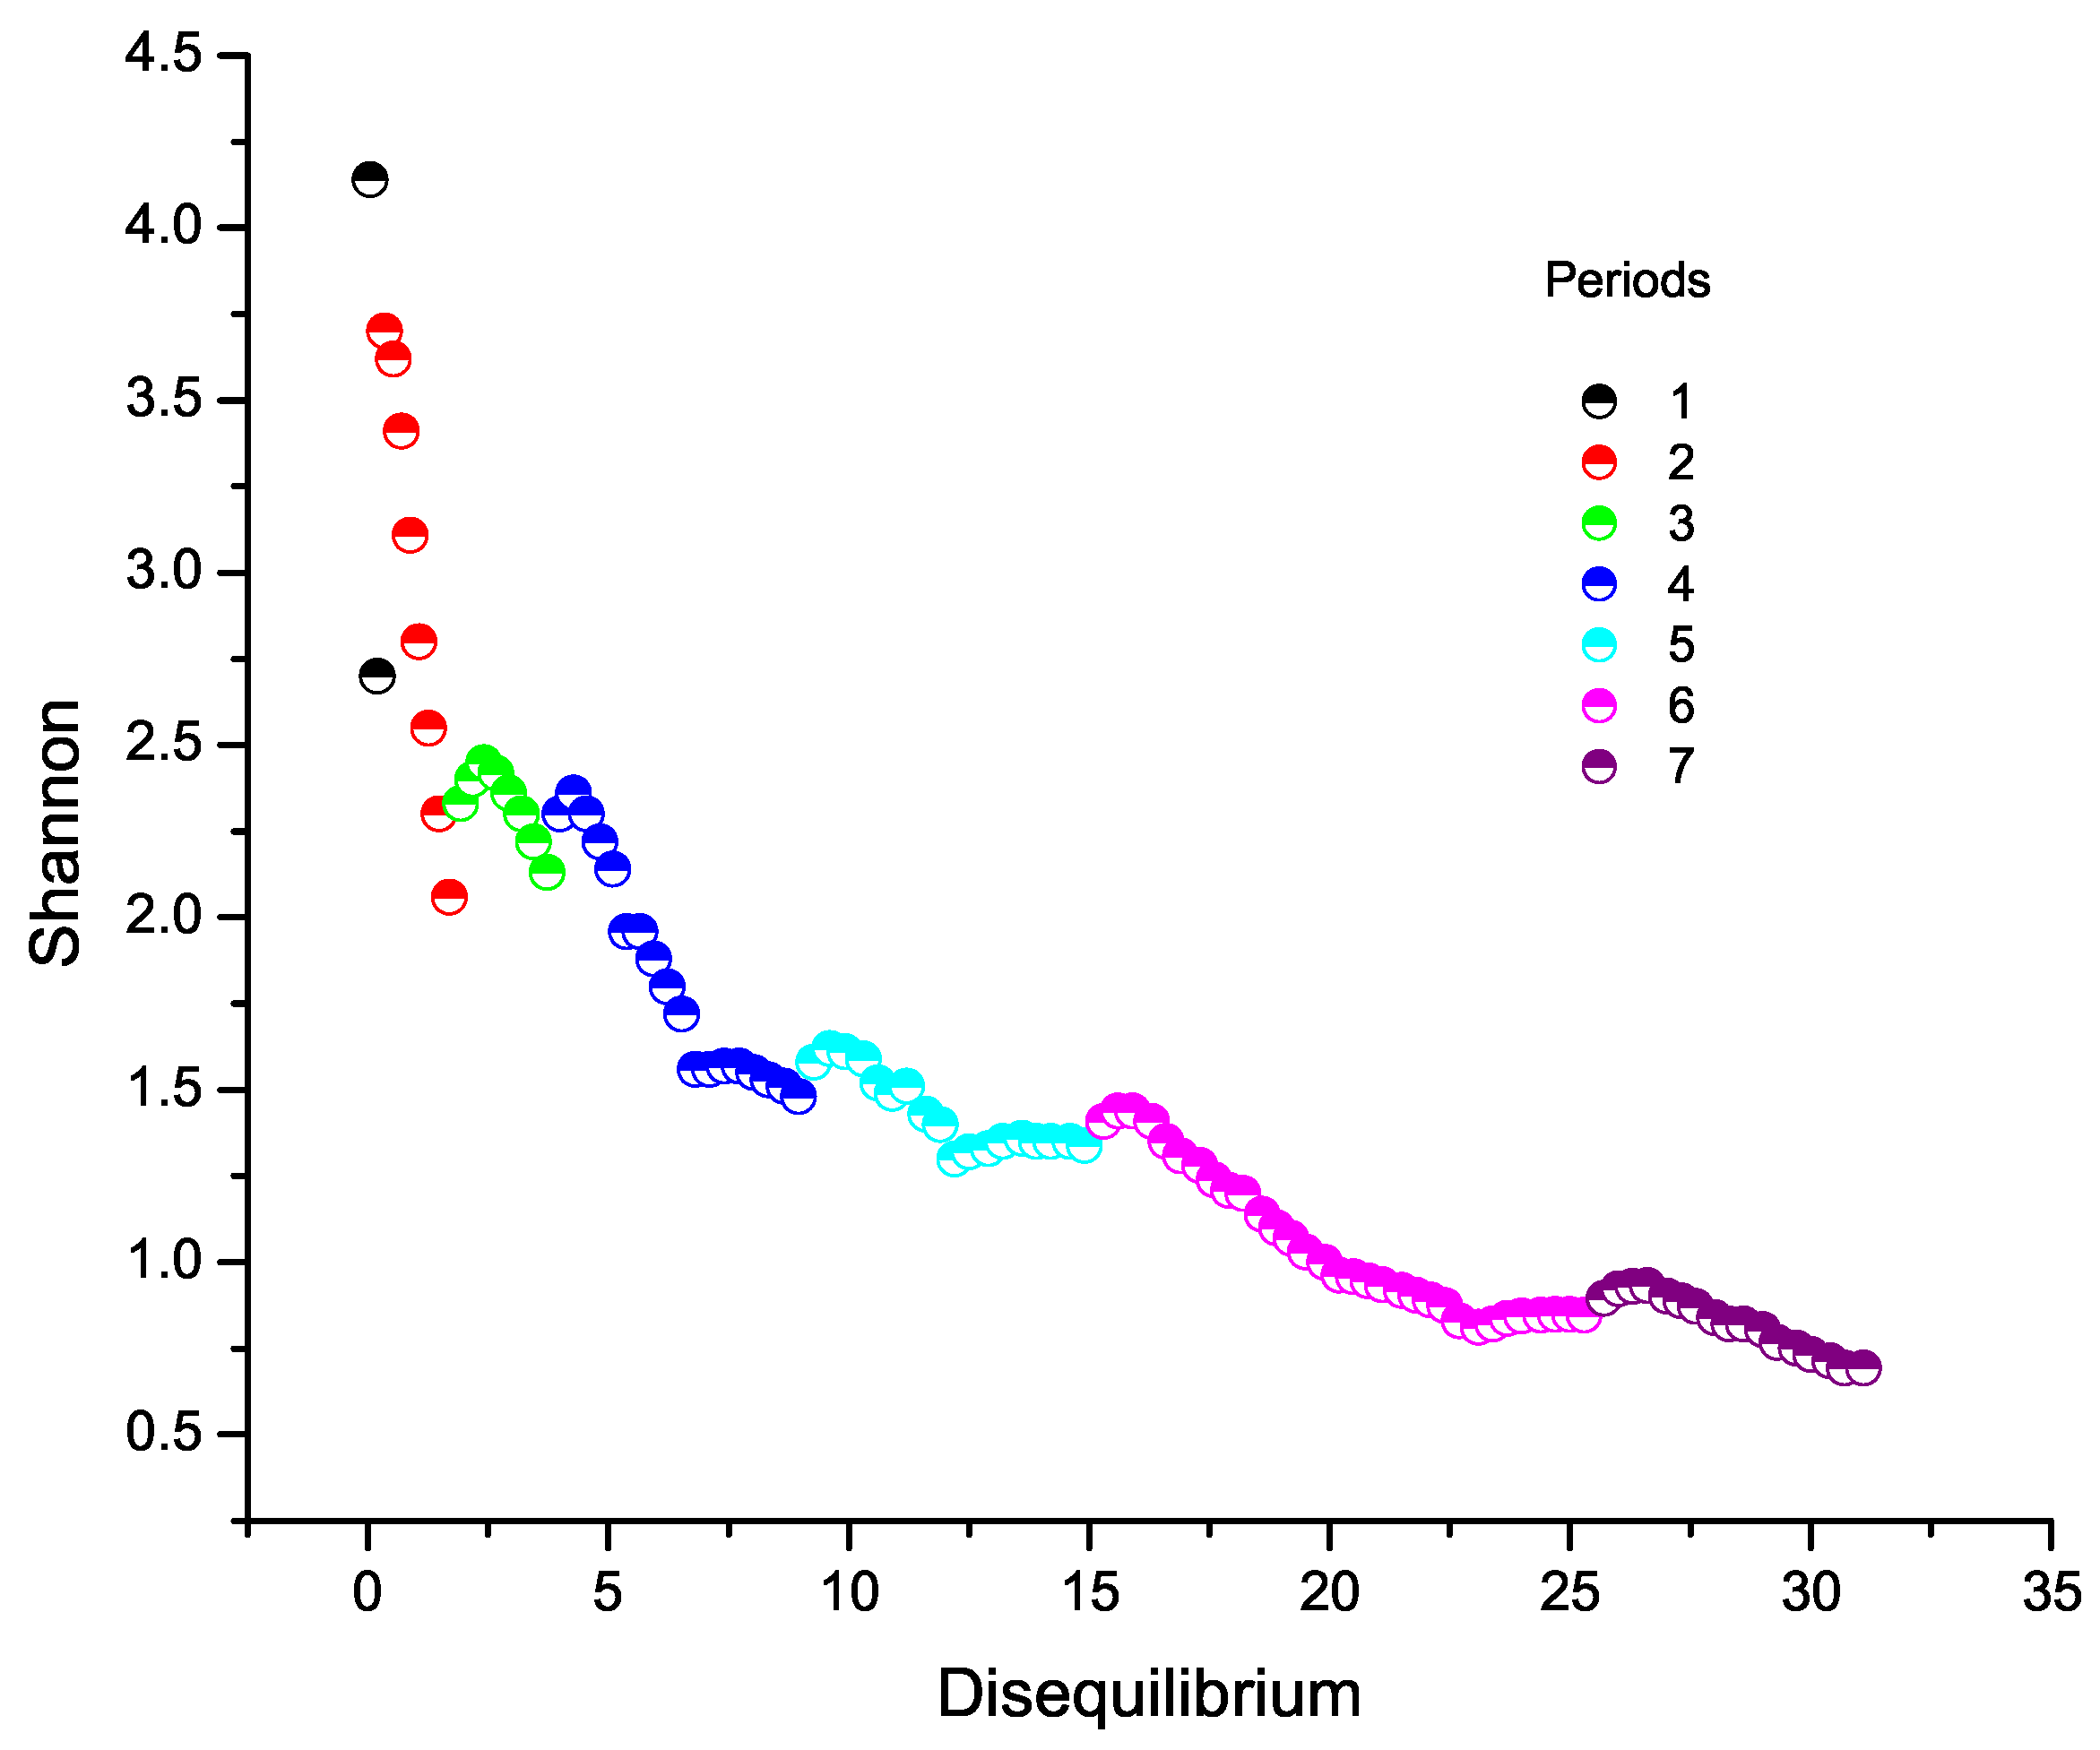
Figure 5.
Fisher versus disequilibrium measure in position space for the atomic elements from 1 to 103.
Figure 5.
Fisher versus disequilibrium measure in position space for the atomic elements from 1 to 103.
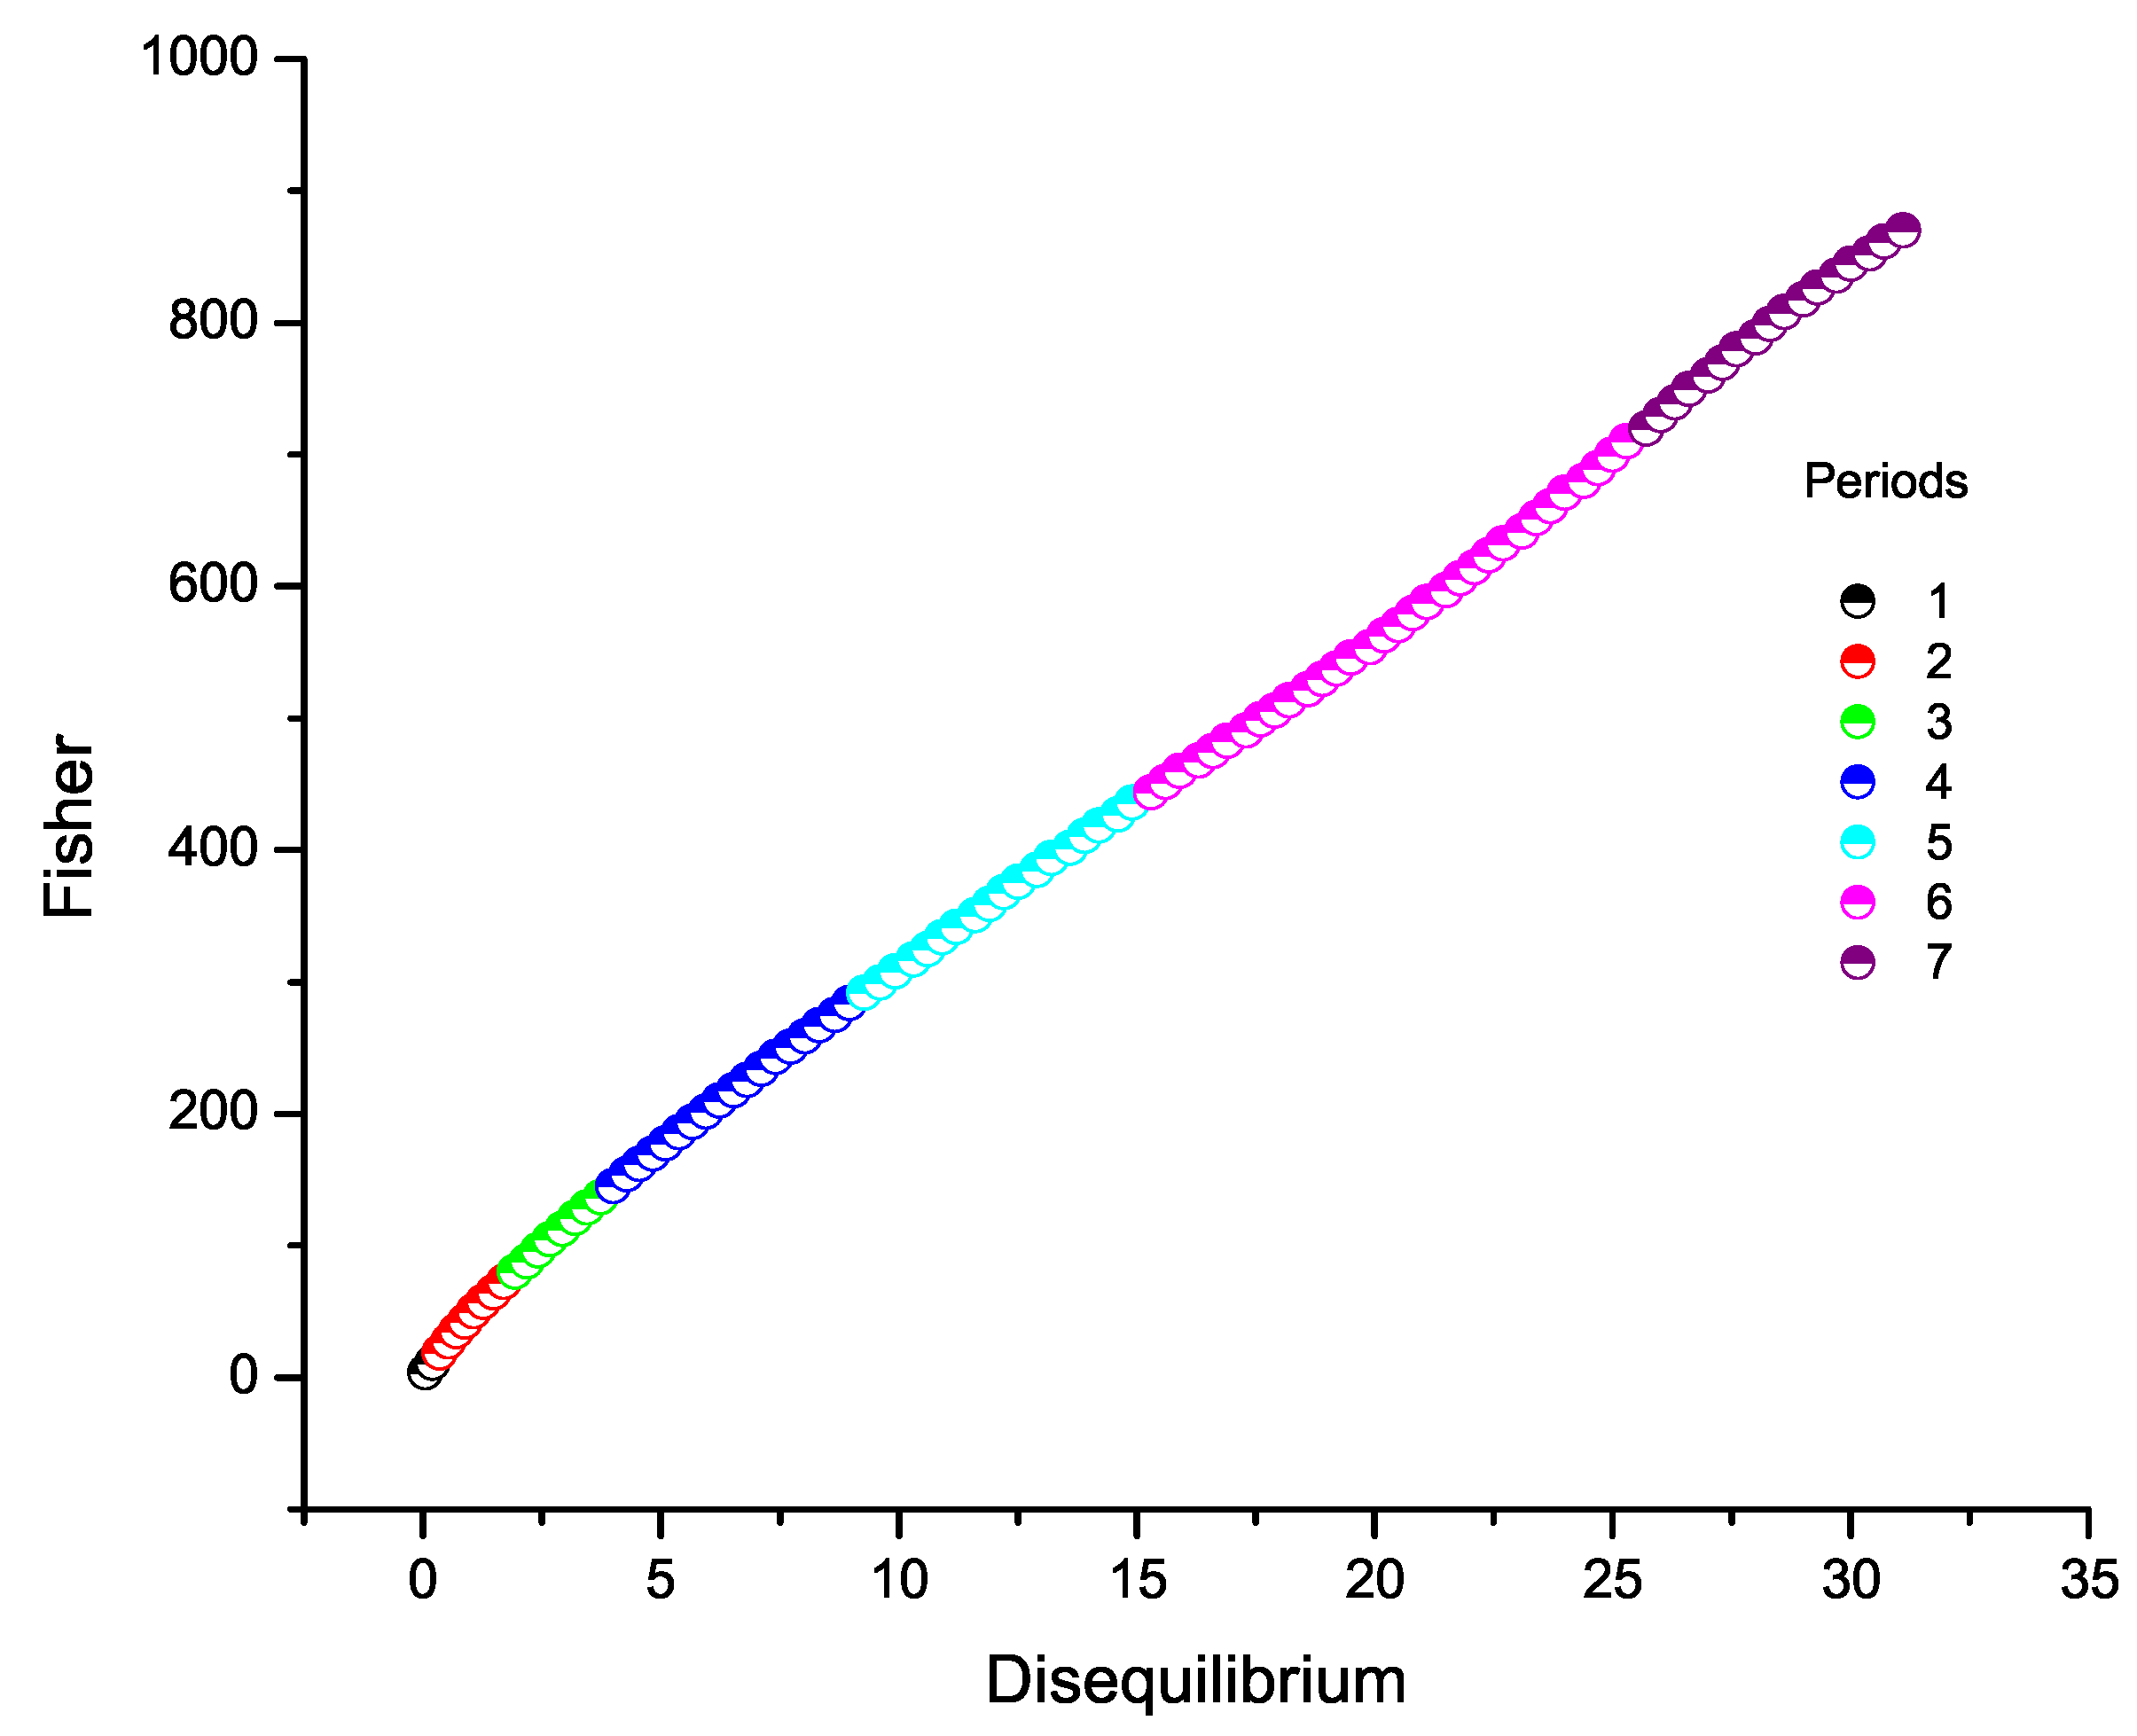
Figure 6.
Fisher versus Shannon in position space for the atomic elements from 1 to 103.
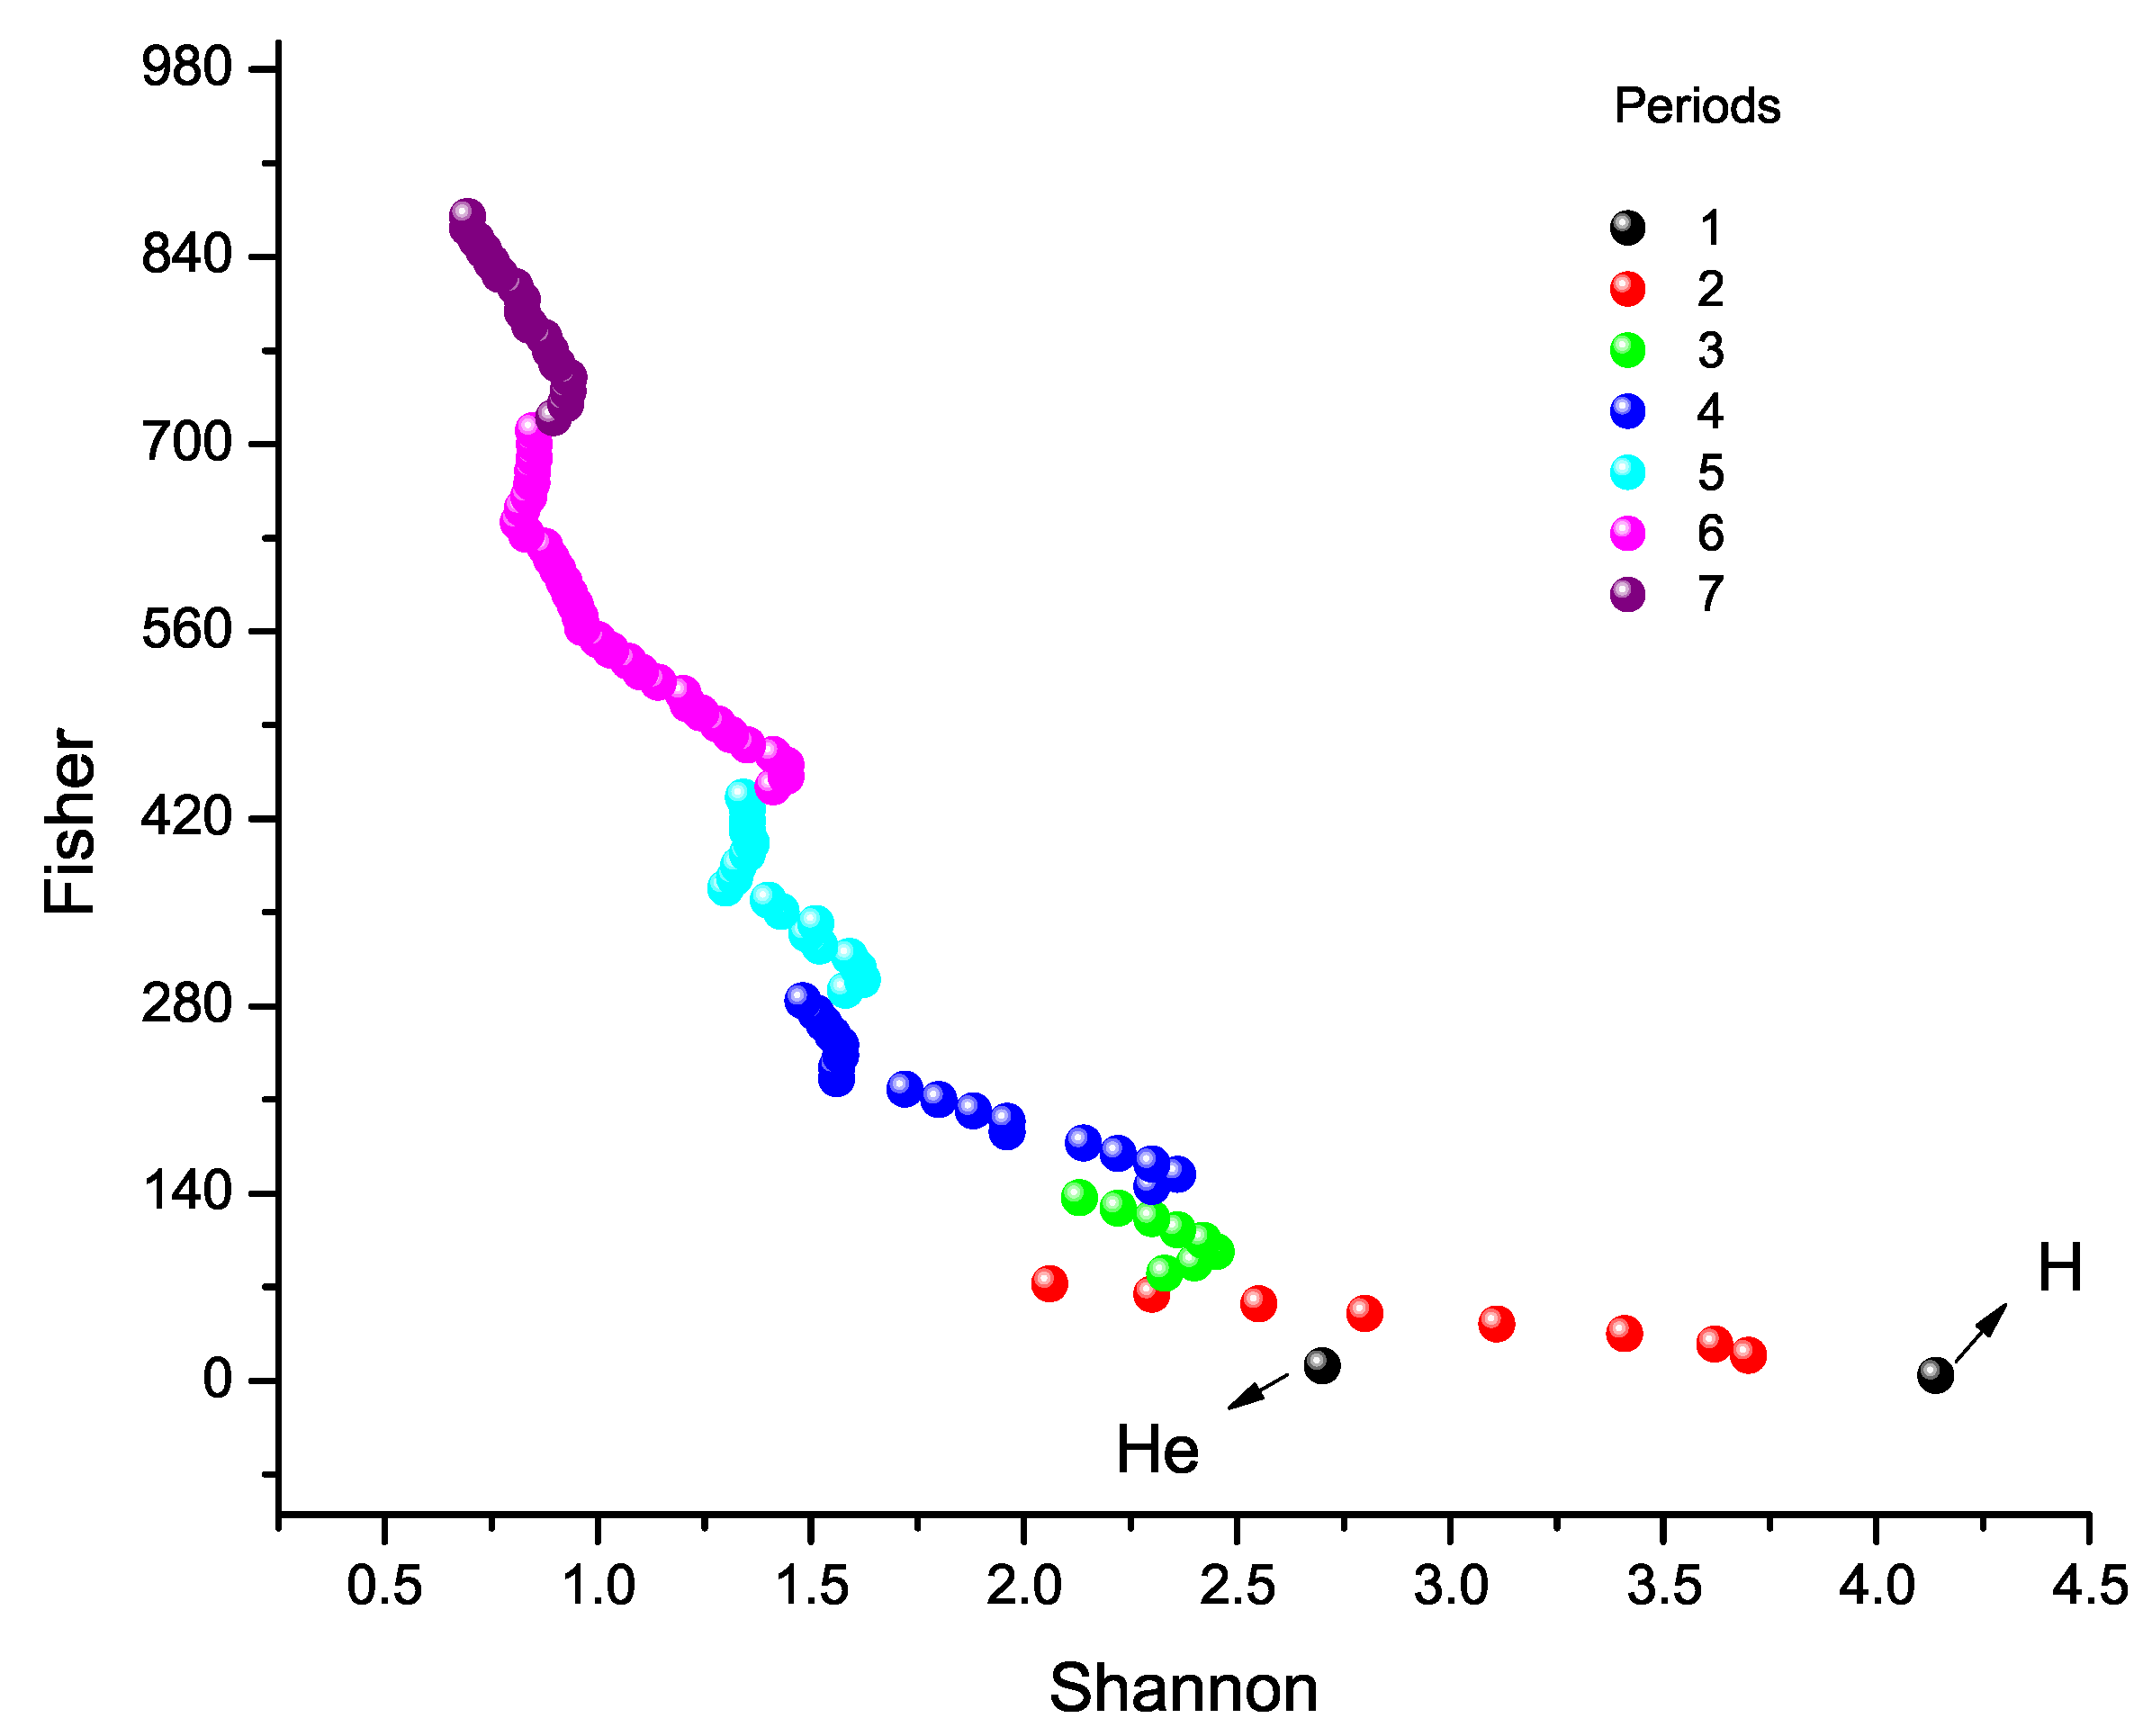
Figure 7.
3D graphical analysis of Disequilibrium-Fisher-Shannon information-theoretic components in position space for the atomic elements from 1 to 103, focusing on the periodic representation of the periodic table.
Figure 7.
3D graphical analysis of Disequilibrium-Fisher-Shannon information-theoretic components in position space for the atomic elements from 1 to 103, focusing on the periodic representation of the periodic table.
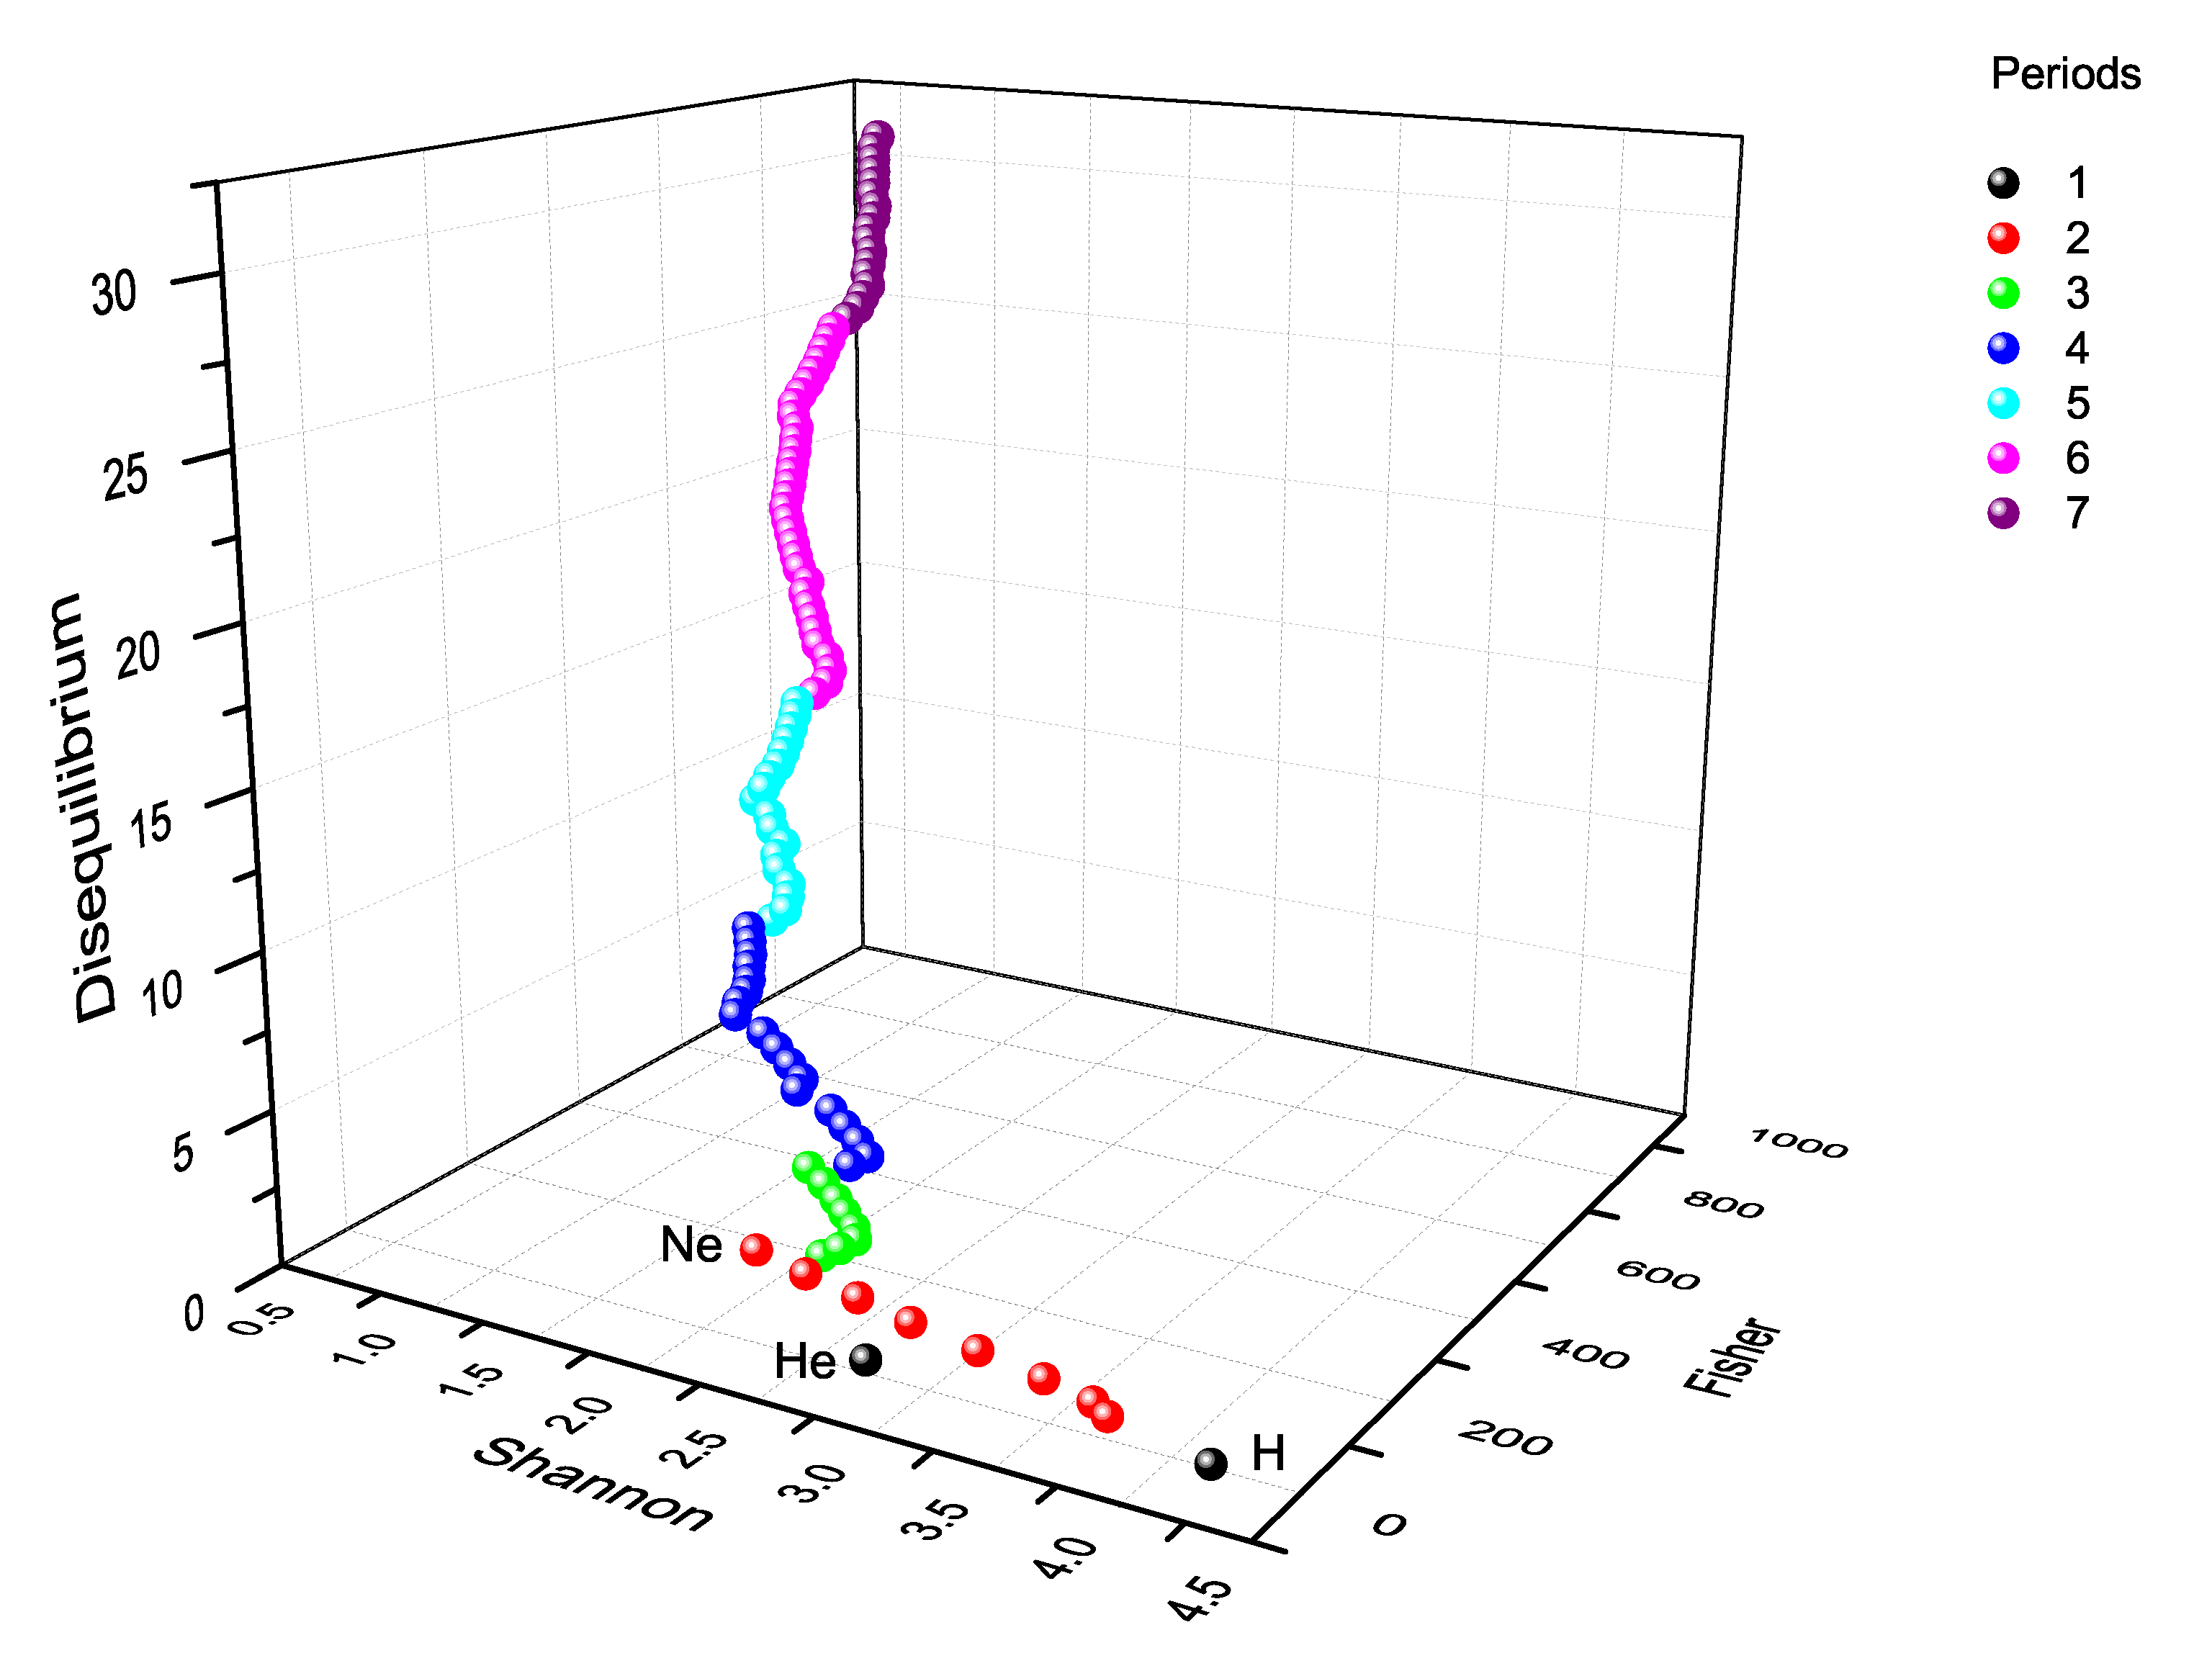
Figure 8.
3D graphical analysis of Disequilibrium-Fisher-Shannon information-theoretic components in position space for the atomic elements from 1 to 103, focusing on the block representation of the periodic table.
Figure 8.
3D graphical analysis of Disequilibrium-Fisher-Shannon information-theoretic components in position space for the atomic elements from 1 to 103, focusing on the block representation of the periodic table.
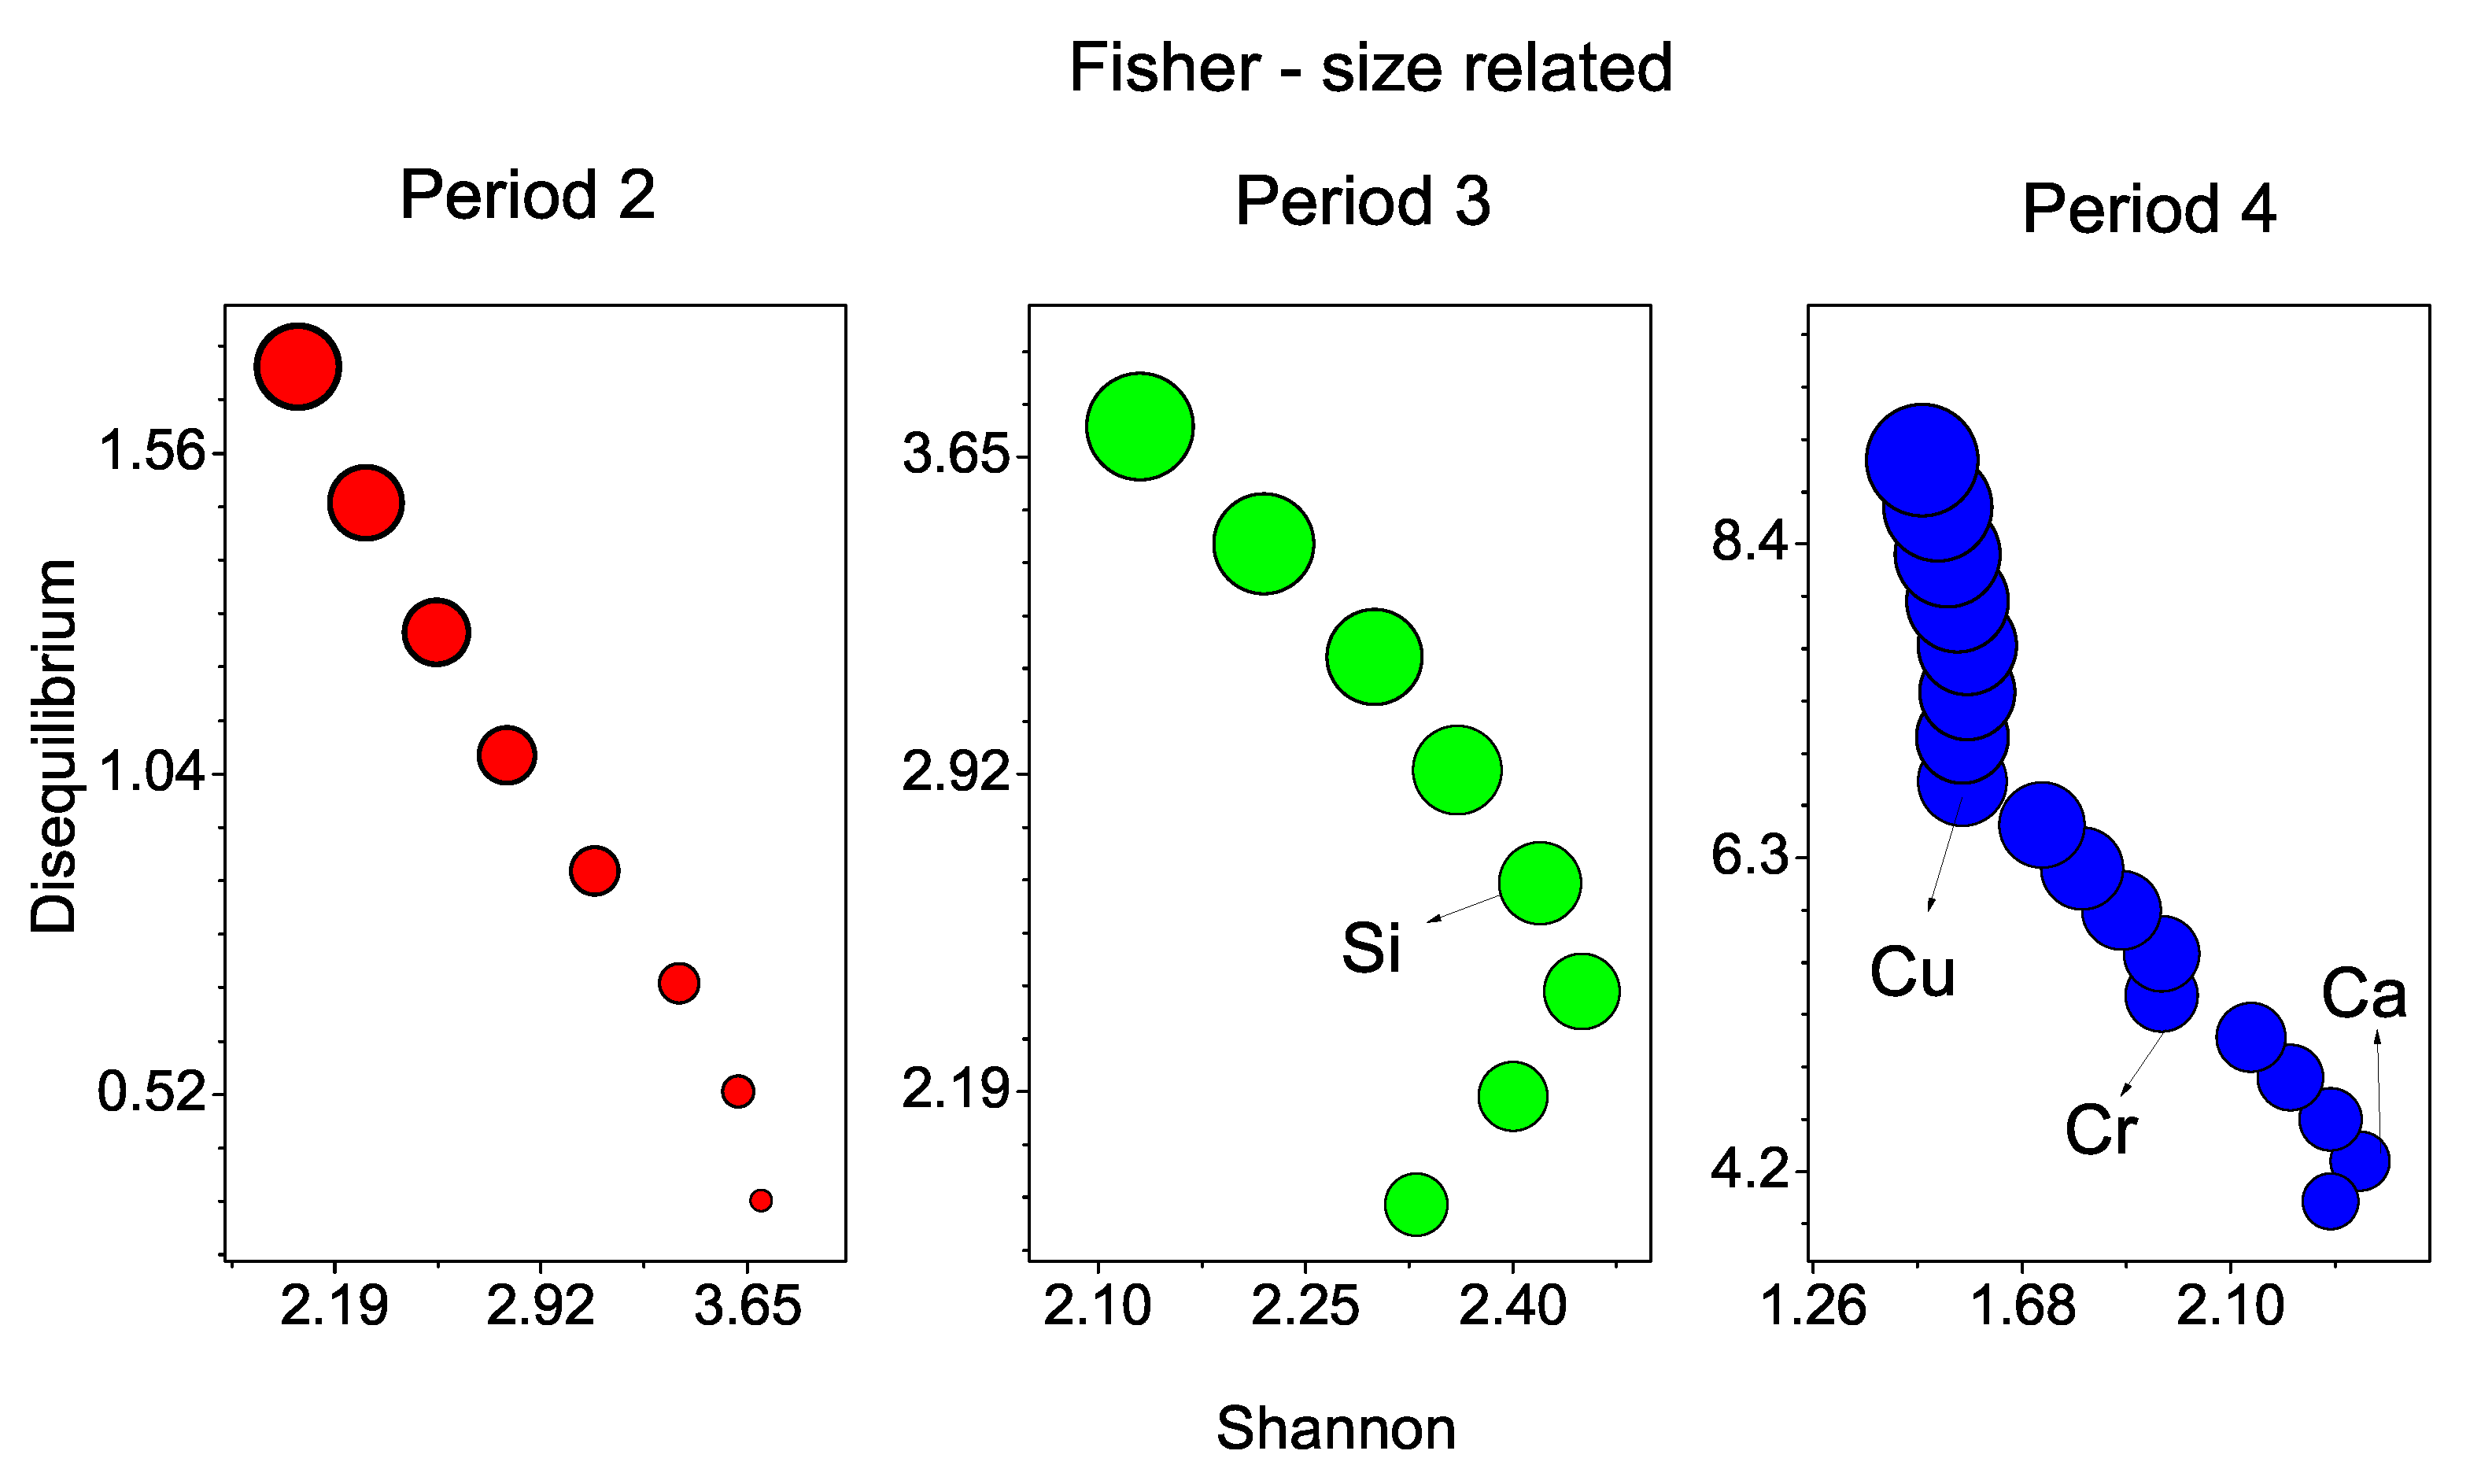
Figure 9.
Graphical analysis of the Disequilibrium-Shannon representation in position space for Periods 2, 3, and 4, emphasizing the chemical anomalies arising from the information-theoretic analysis for atomic elements.
Figure 9.
Graphical analysis of the Disequilibrium-Shannon representation in position space for Periods 2, 3, and 4, emphasizing the chemical anomalies arising from the information-theoretic analysis for atomic elements.
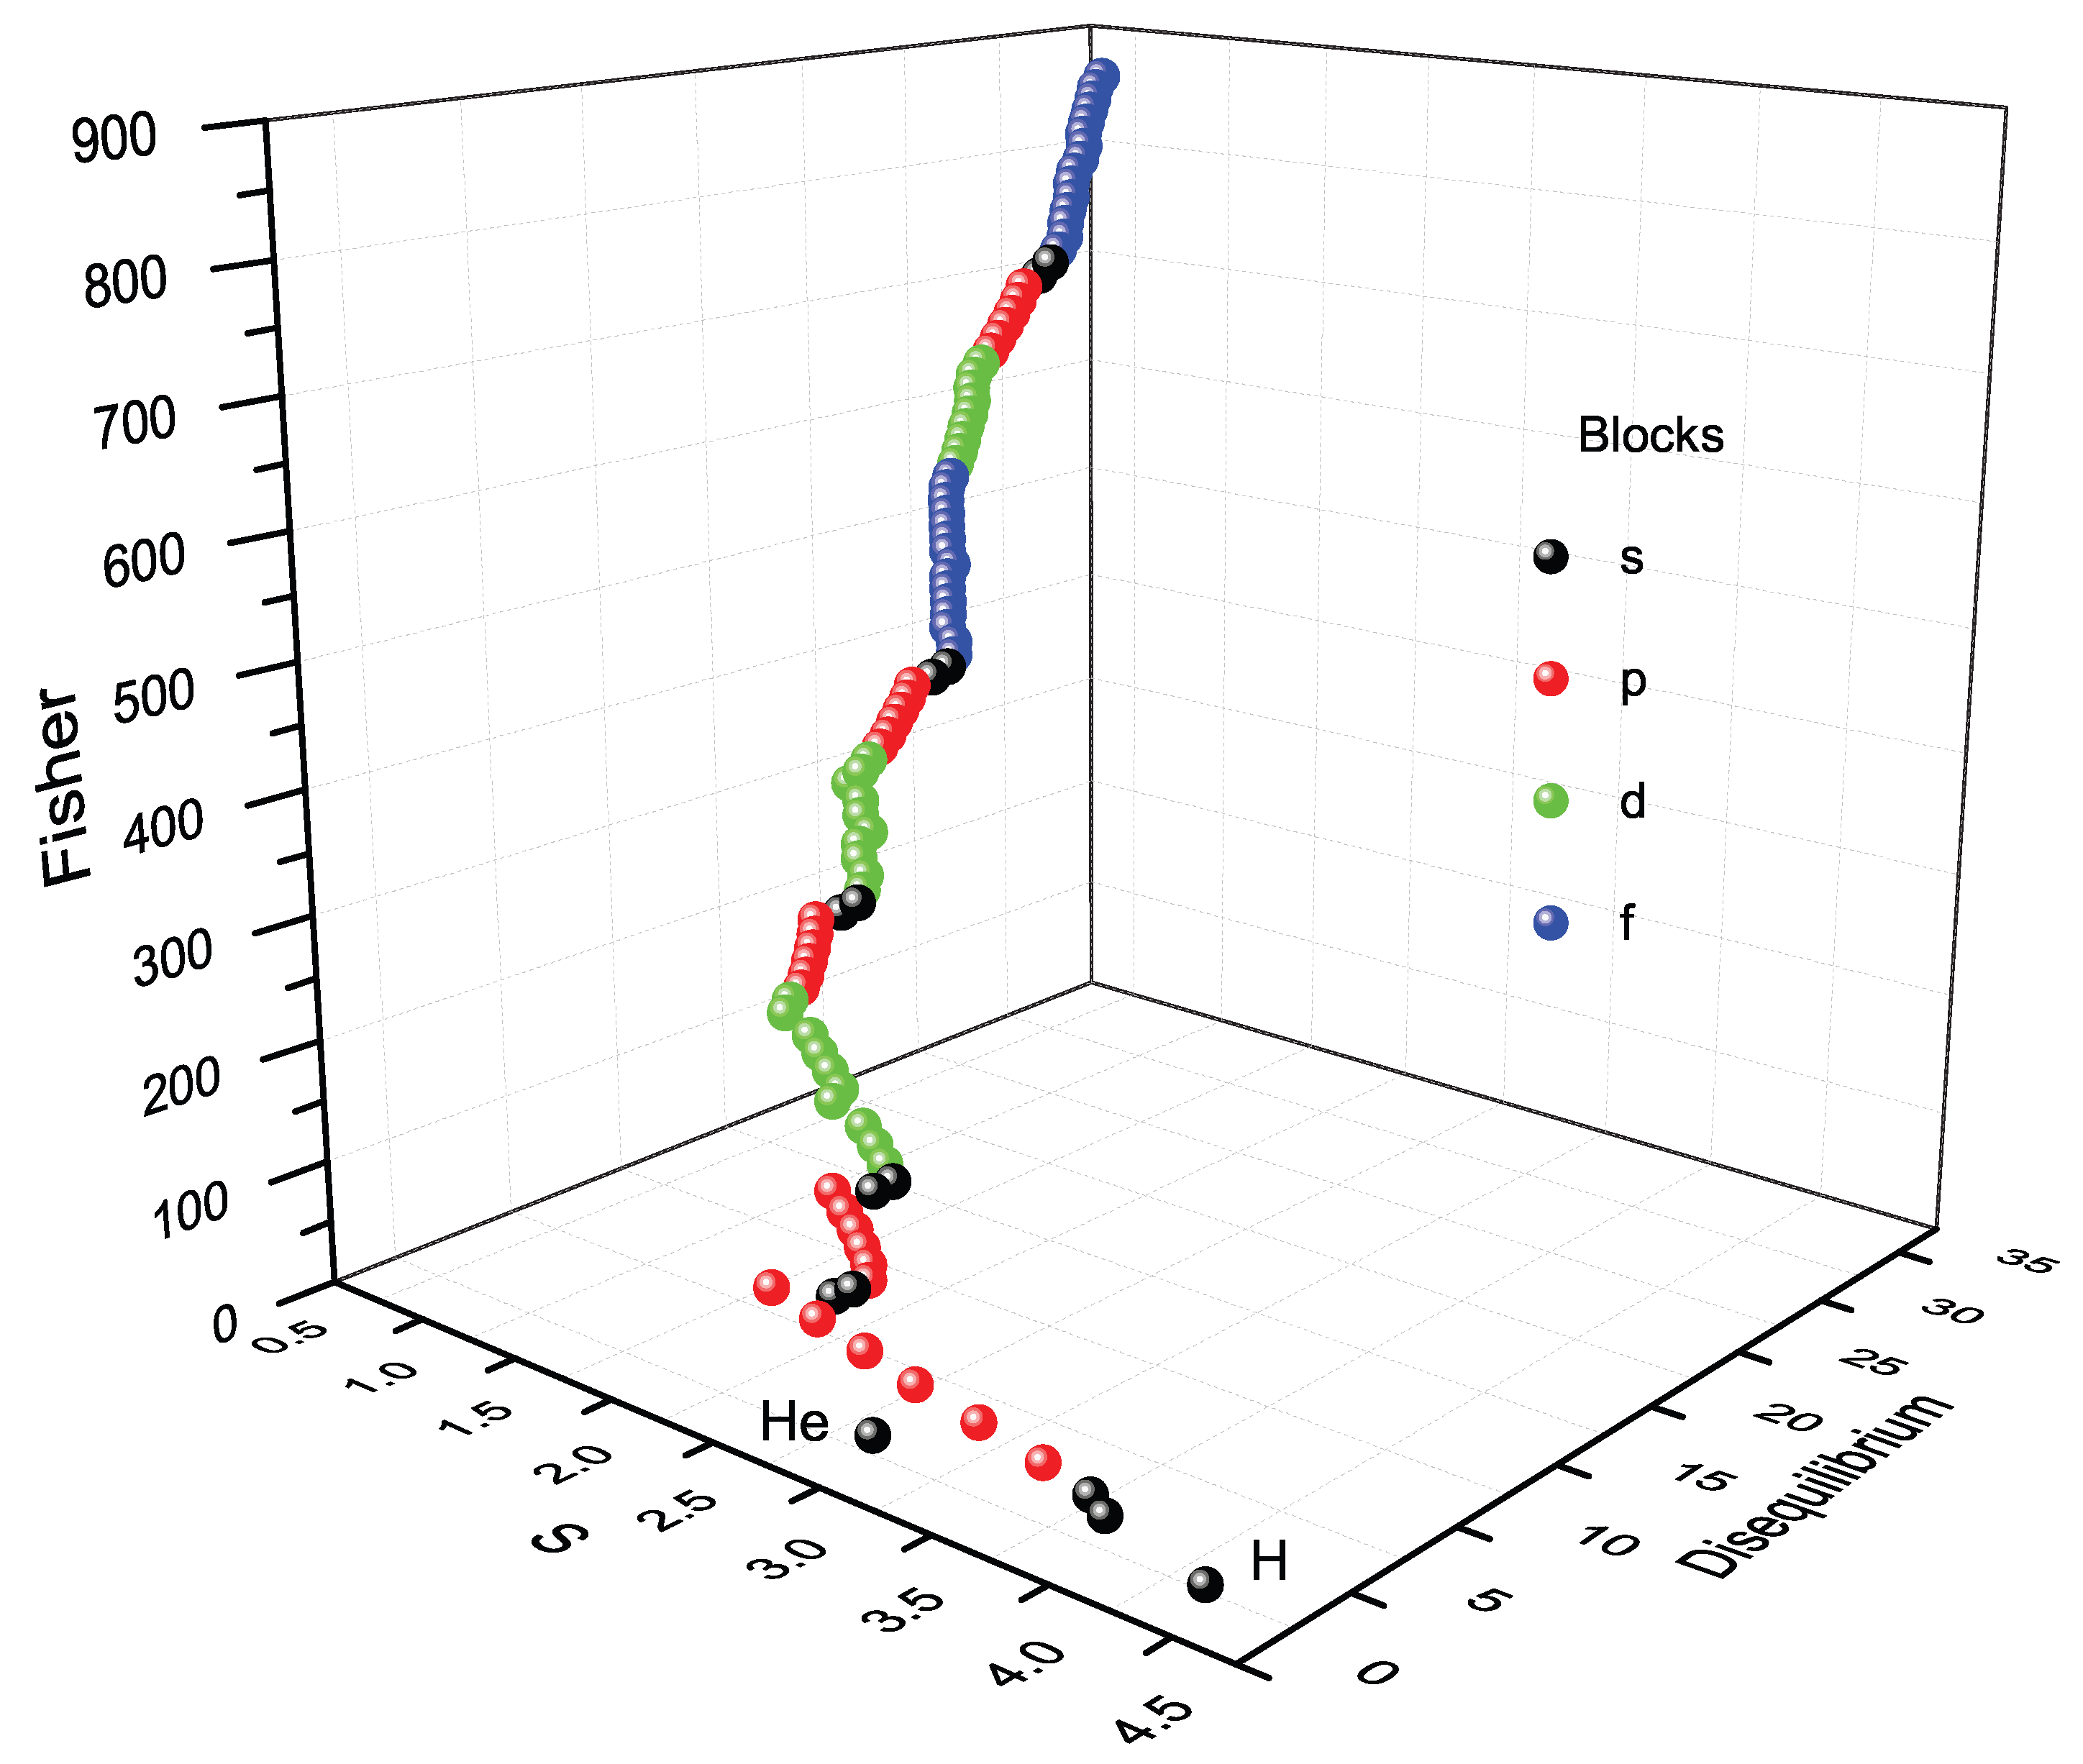
Figure 10.
3D graphical analysis of Disequilibrium-Fisher-Shannon information-theoretic components in momentum space for the atomic elements from 1 to 103, focusing on the periodic representation (1 to 7) of the periodic table.
Figure 10.
3D graphical analysis of Disequilibrium-Fisher-Shannon information-theoretic components in momentum space for the atomic elements from 1 to 103, focusing on the periodic representation (1 to 7) of the periodic table.
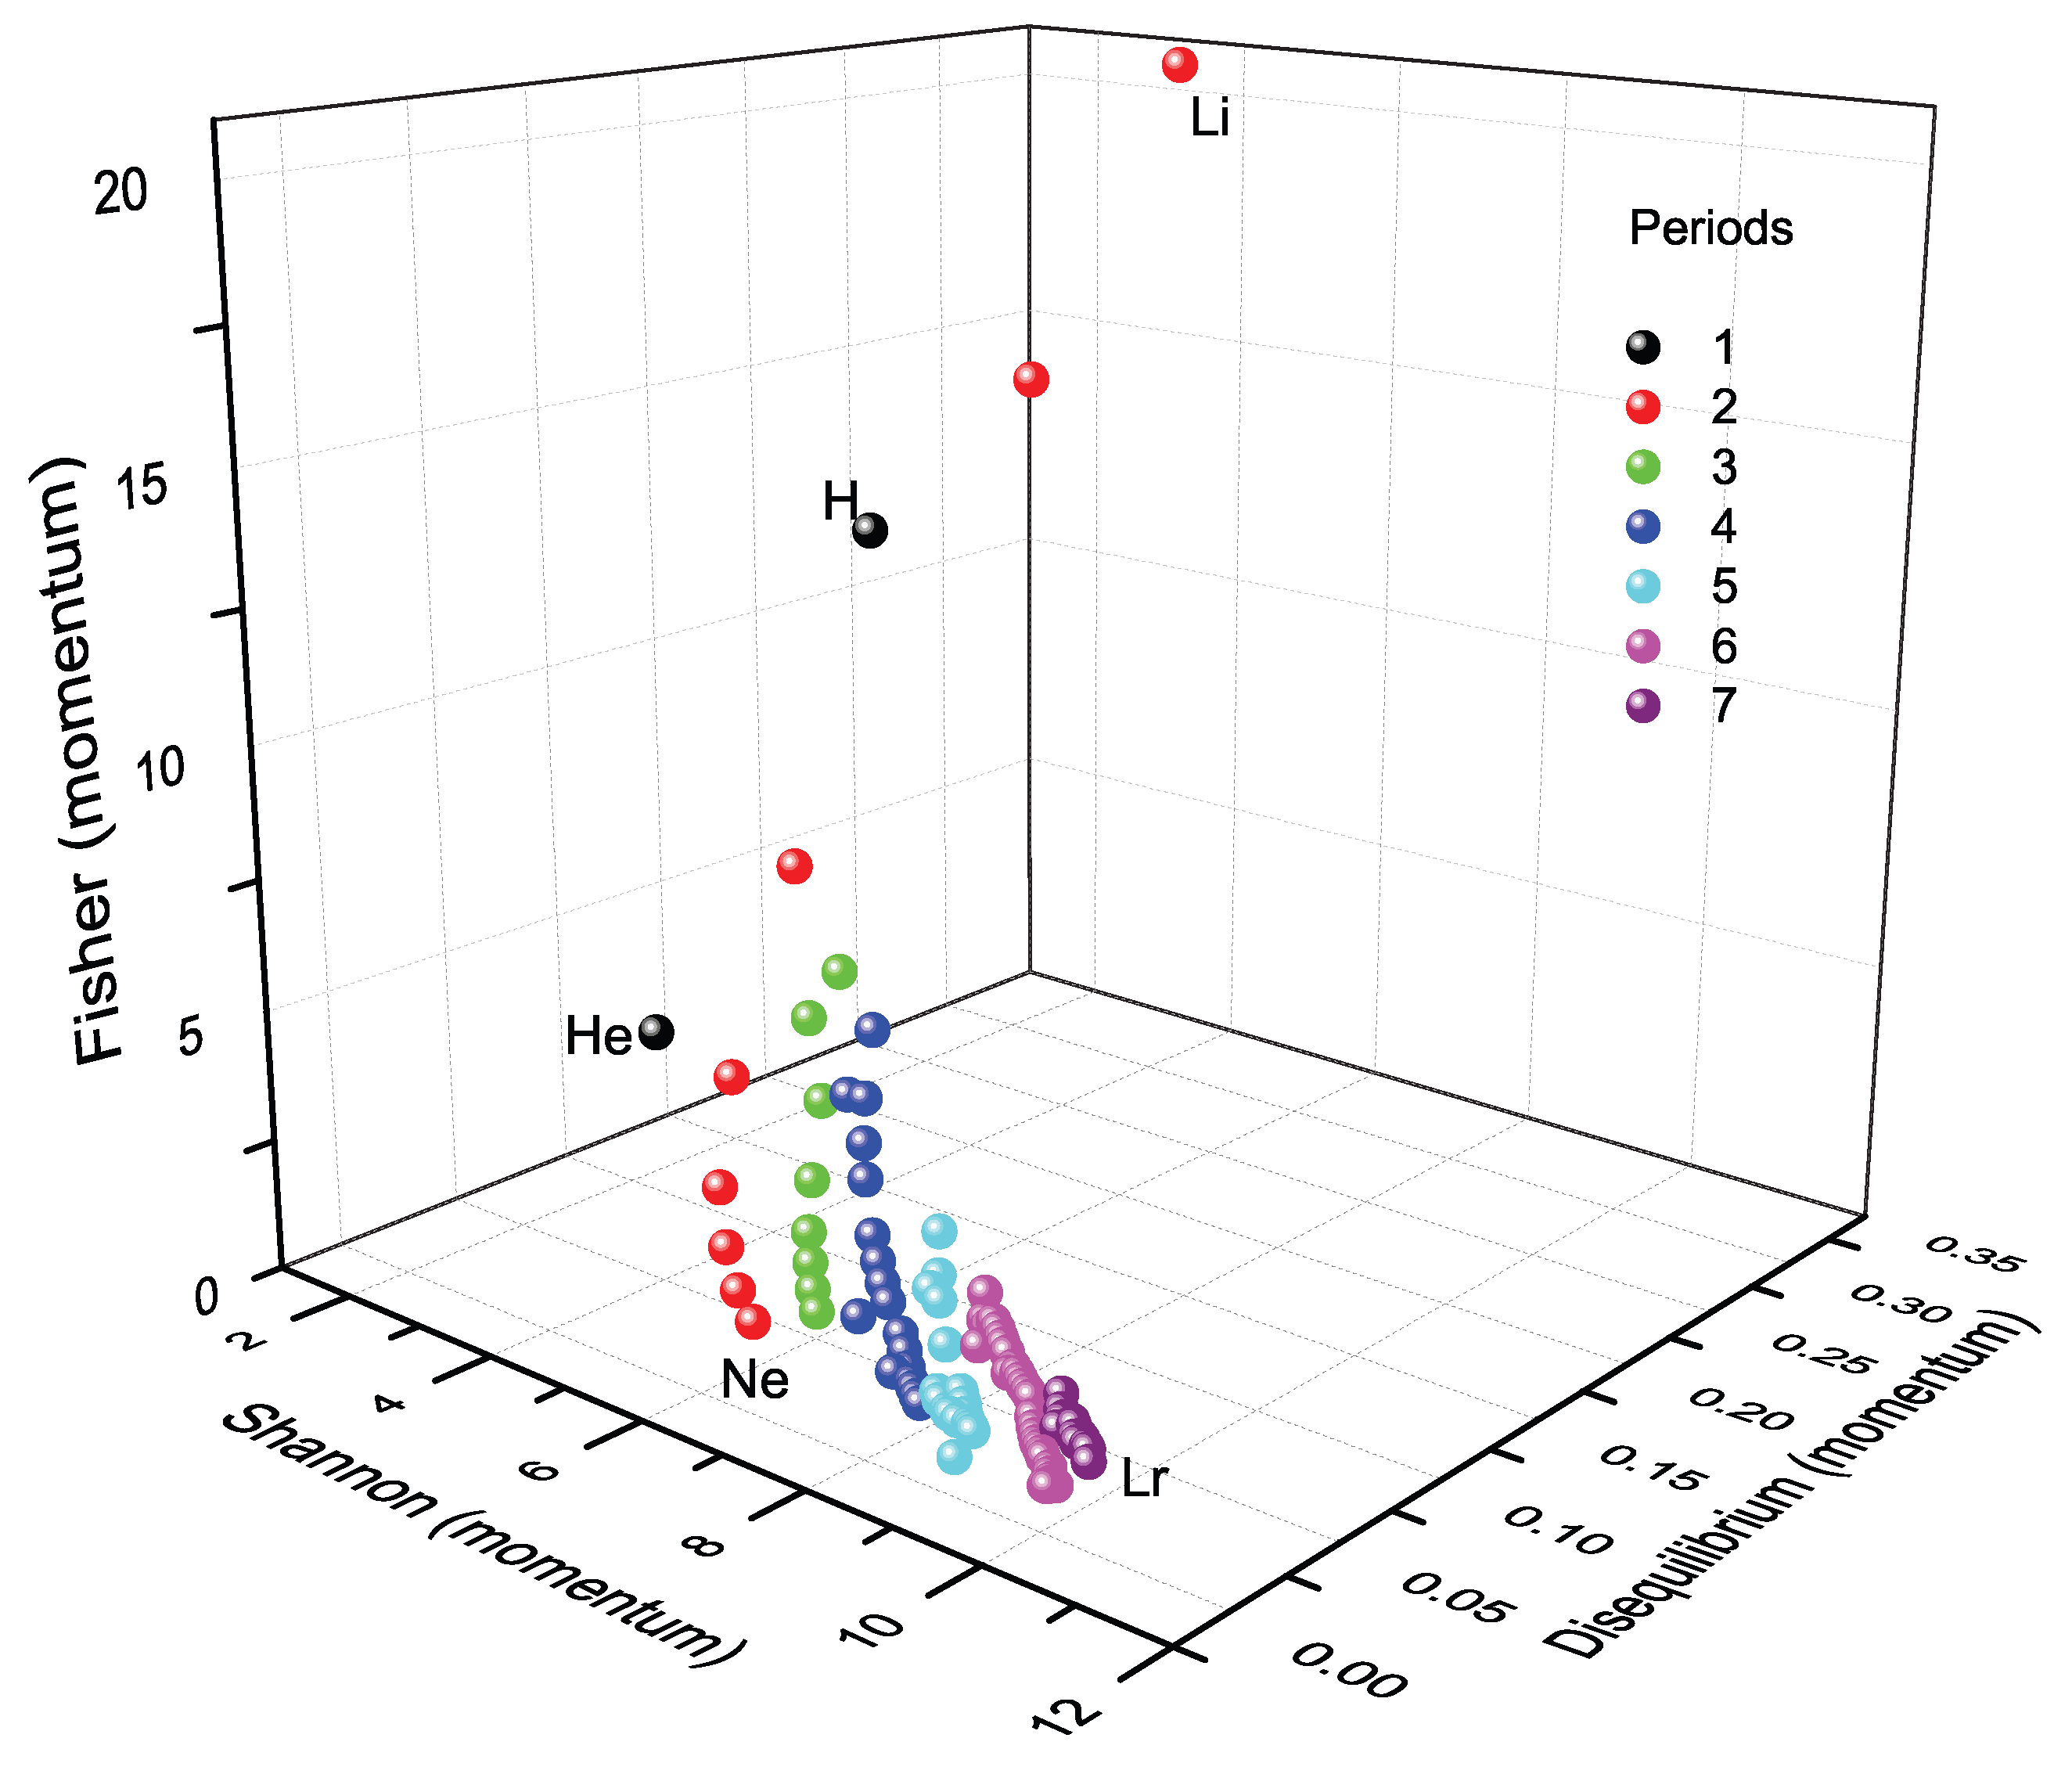
Figure 11.
3D graphical analysis of Disequilibrium-Fisher-Shannon information-theoretic components in position space for the triadic elements around the halogenic elements, revealing the similarities of hydrogen to be considered in group one or group 17 and the peculiar behavior of the triad H-He-Li.
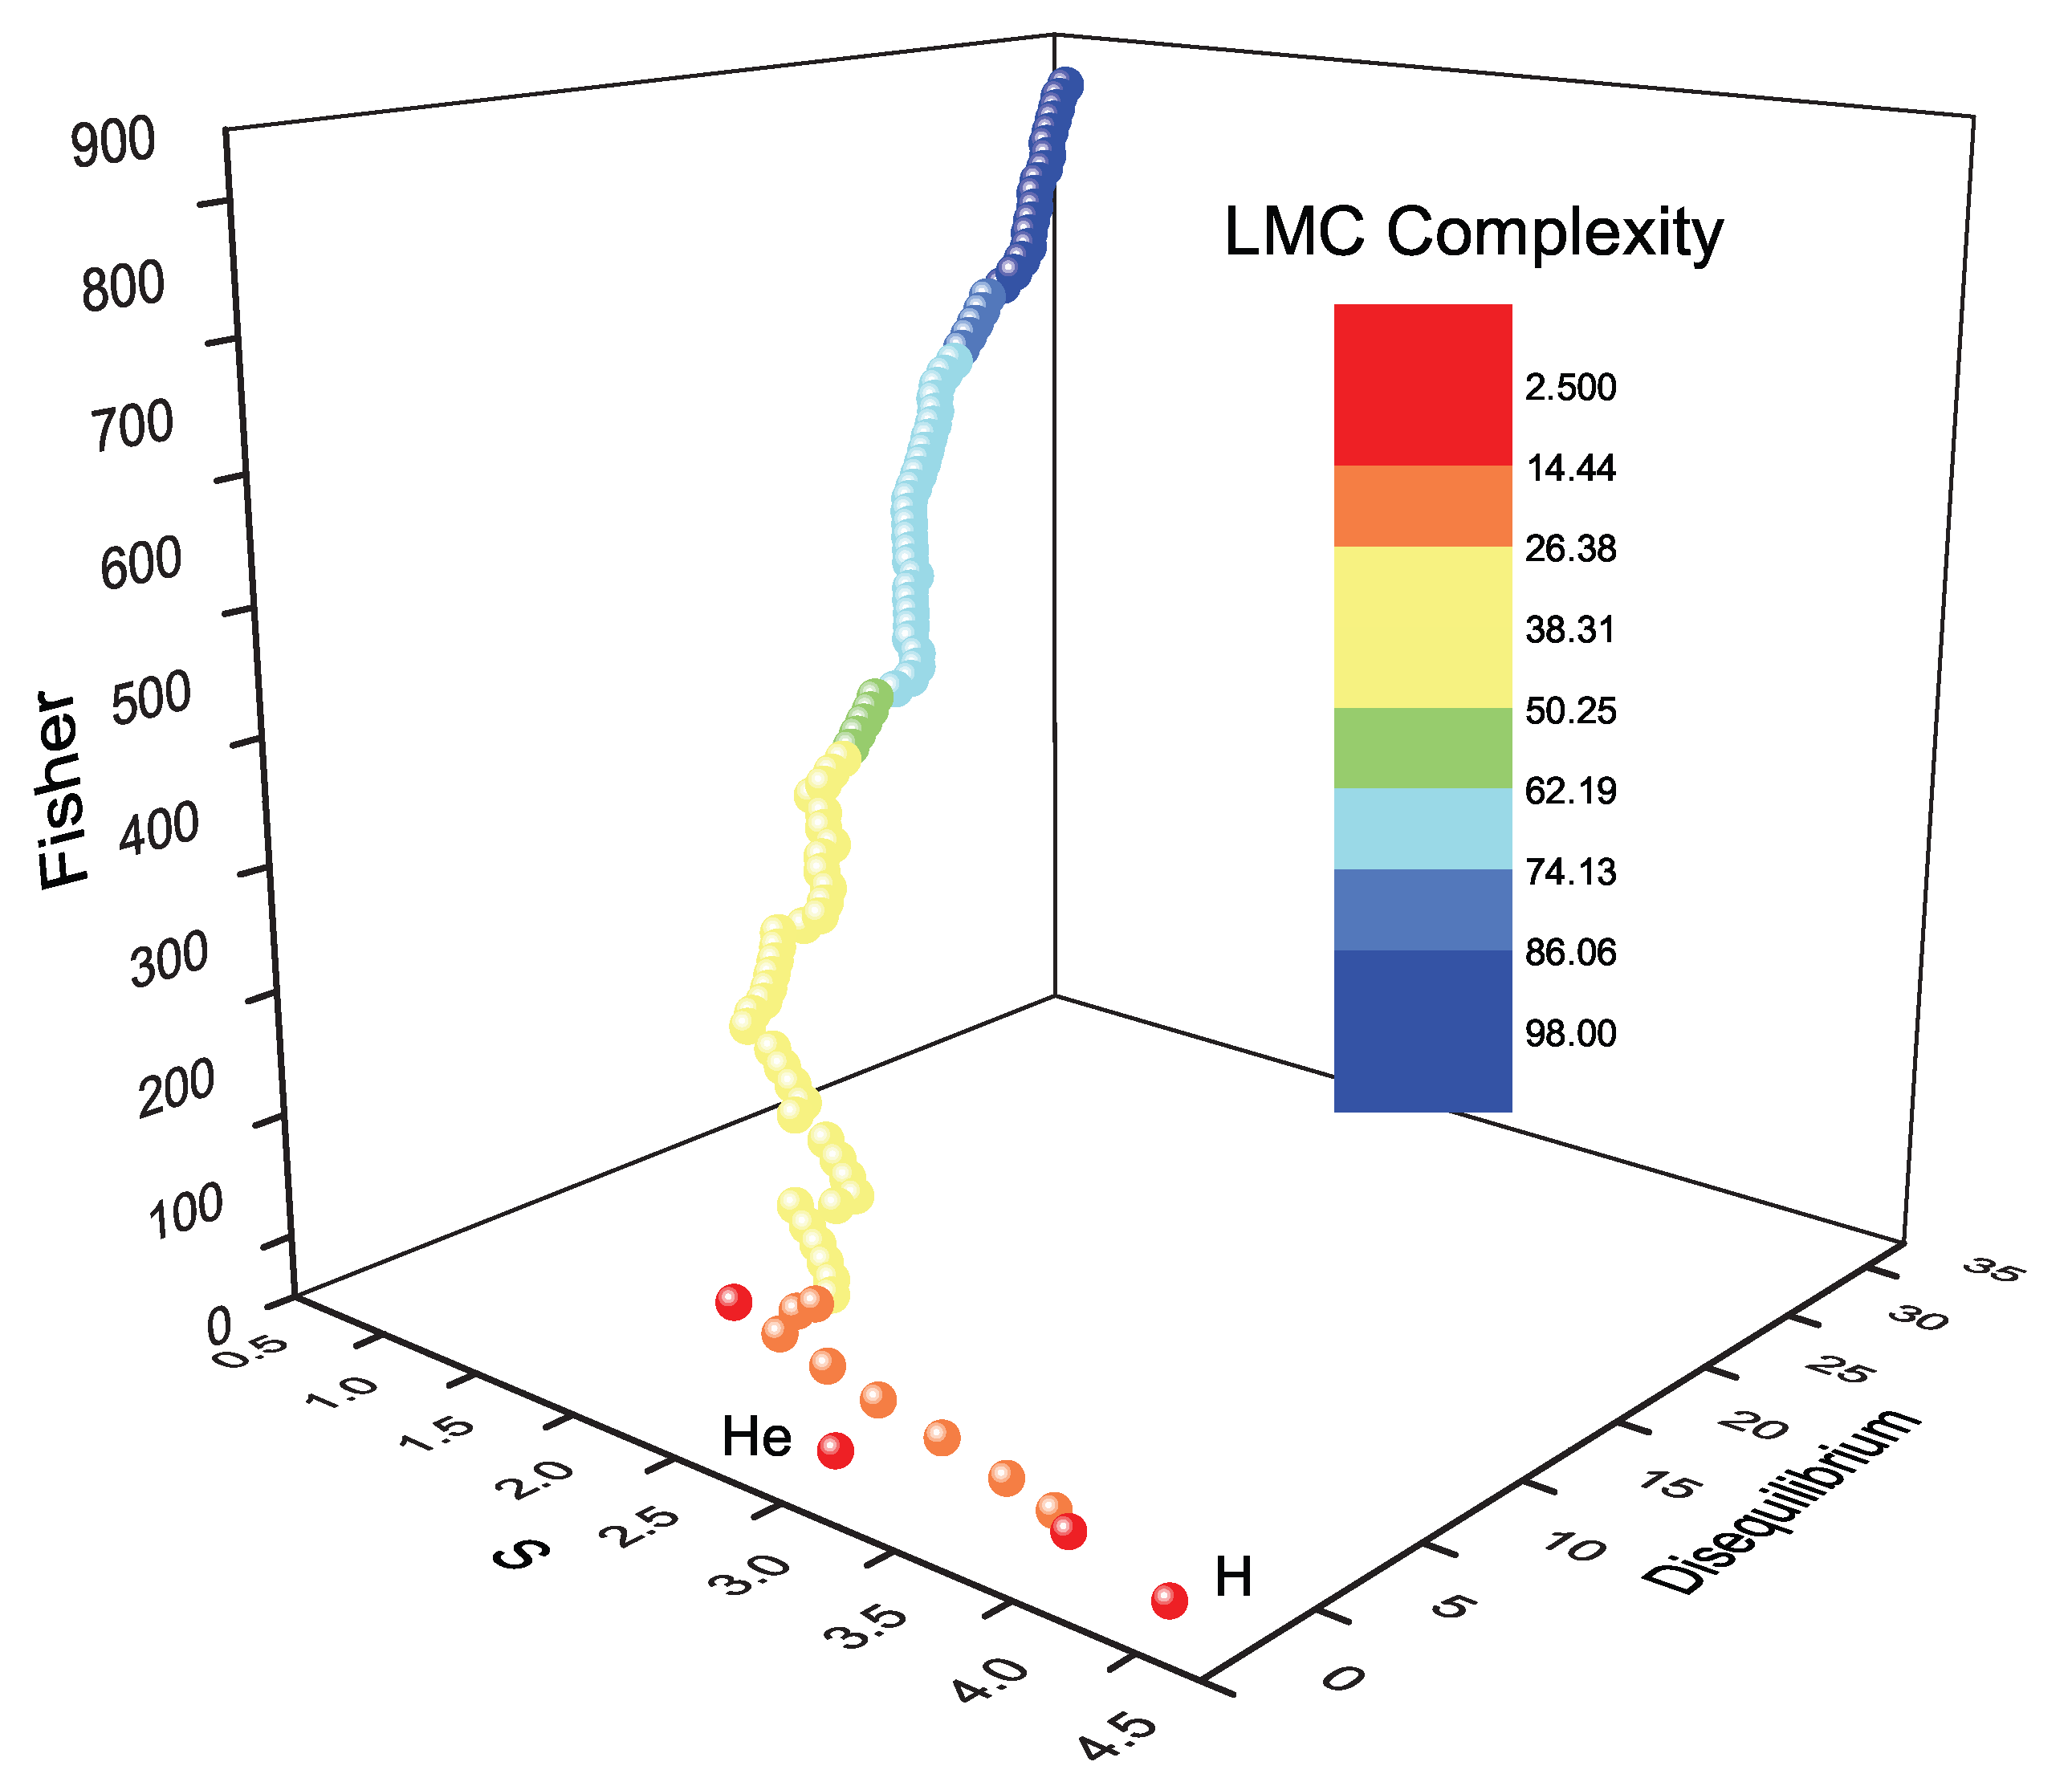
Figure 12.
3D graphical analysis of Disequilibrium-Fisher-Shannon information-theoretic components in position space for elements 1–103 with the López-Mancini-Ruiz (LMC) complexity represented in color code from lower values (reddish) to higher values (bluish).
Figure 12.
3D graphical analysis of Disequilibrium-Fisher-Shannon information-theoretic components in position space for elements 1–103 with the López-Mancini-Ruiz (LMC) complexity represented in color code from lower values (reddish) to higher values (bluish).
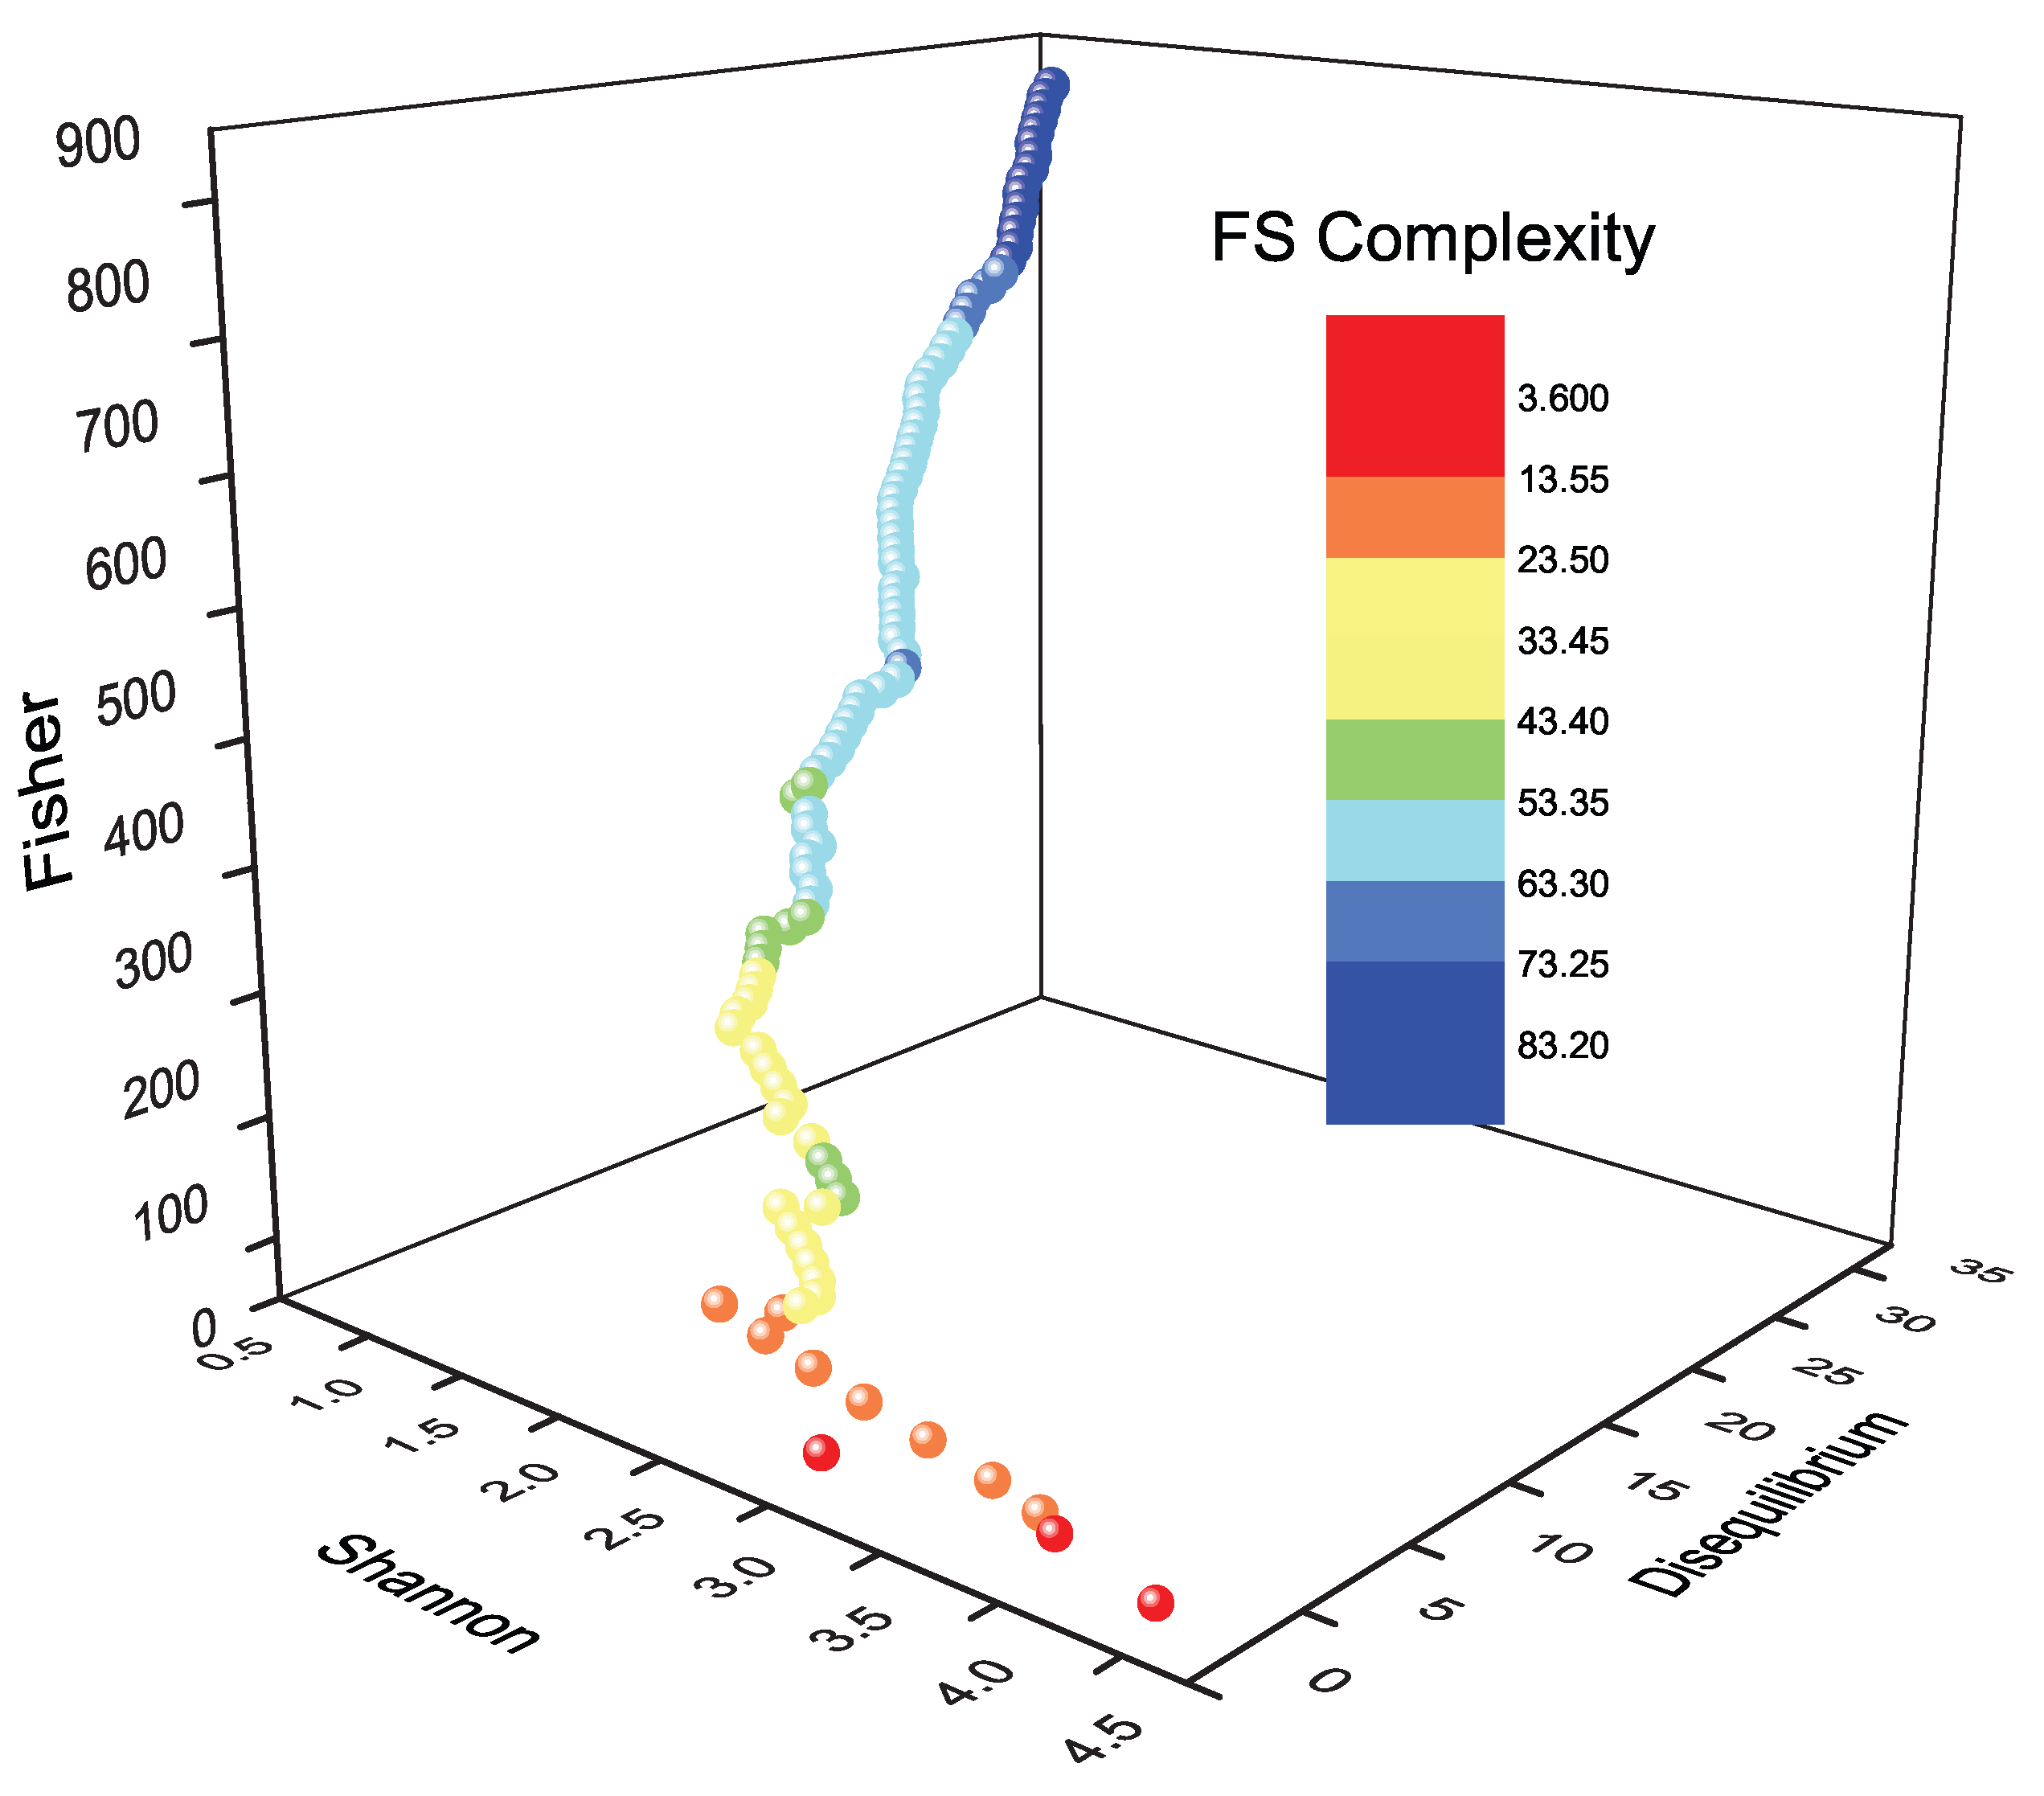
Figure 13.
3D graphical analysis of Disequilibrium-Fisher-Shannon information-theoretic components in position space for elements 1–103 with the Fisher-Shannon (FS) complexity represented in color code from lower values (reddish) to higher values (bluish).
Figure 13.
3D graphical analysis of Disequilibrium-Fisher-Shannon information-theoretic components in position space for elements 1–103 with the Fisher-Shannon (FS) complexity represented in color code from lower values (reddish) to higher values (bluish).
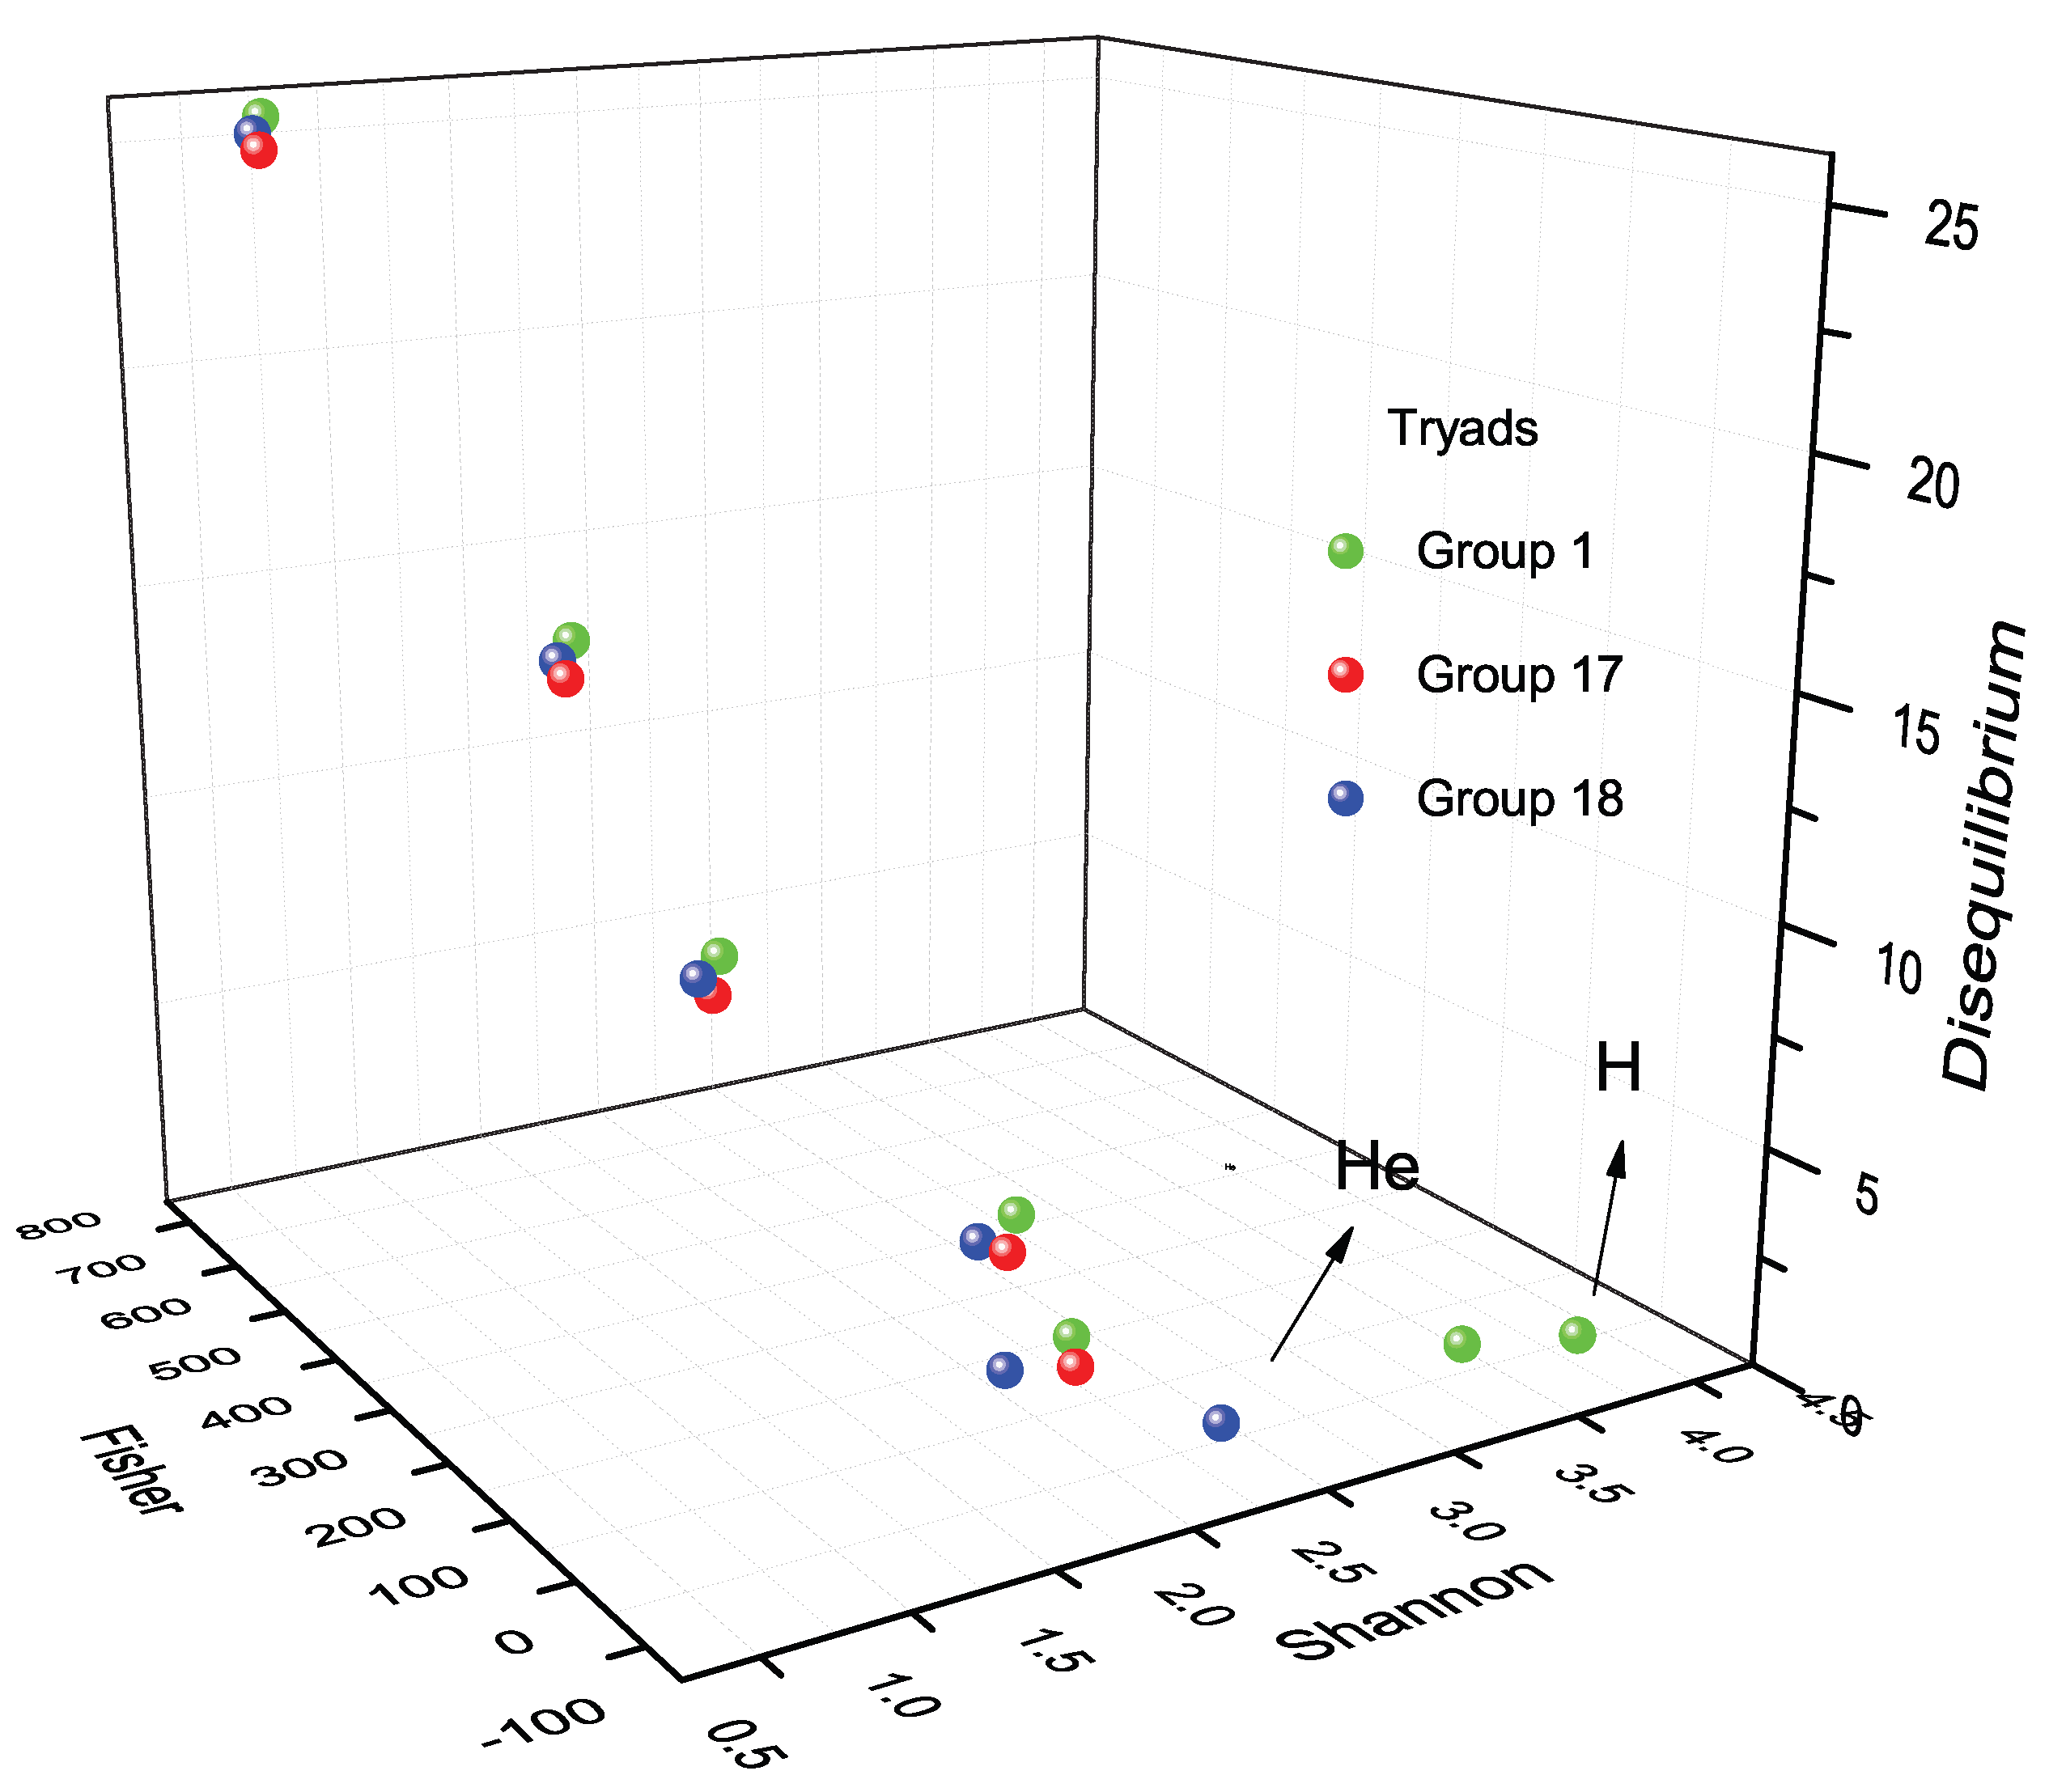
Table 1.
values for the S, I, and D triads in position (r) and momentum (p) spaces for each of the common element classifications.
Table 1.
values for the S, I, and D triads in position (r) and momentum (p) spaces for each of the common element classifications.
| Classification | ||
|---|---|---|
| Periods | 0.0732 | 0.0452 |
| Numeric Groups | 0.844 | 0.795 |
| Chemical Families | 0.953 | 0.639 |
Disclaimer/Publisher’s Note: The statements, opinions and data contained in all publications are solely those of the individual author(s) and contributor(s) and not of MDPI and/or the editor(s). MDPI and/or the editor(s) disclaim responsibility for any injury to people or property resulting from any ideas, methods, instructions or products referred to in the content. |
© 2025 by the authors. Licensee MDPI, Basel, Switzerland. This article is an open access article distributed under the terms and conditions of the Creative Commons Attribution (CC BY) license (http://creativecommons.org/licenses/by/4.0/).
Copyright: This open access article is published under a Creative Commons CC BY 4.0 license, which permit the free download, distribution, and reuse, provided that the author and preprint are cited in any reuse.


