
Submitted:
14 December 2025
Posted:
15 December 2025
You are already at the latest version
Preprints on COVID-19 and SARS-CoV-2
Abstract
Normal-appearing white (WM) and grey (GM) matter outside focal demyelinating lesions (WMH) has been found impaired in many diseases and normal aging. The present study aimed to compare global GM and WM alterations in patients with multiple sclerosis (MS), Parkinson's disease, long COVID (LC) and normal aging. The study population comprised 196 participants including patients with MS (n=42), PD (n = 16), LC (n = 75), and age- and gender-matched controls selected from healthy volunteers (n = 63). All participants underwent MR scanning using the fast macromolecular fraction (MPF) mapping protocol and routine clinical sequences. MPF in global normal-appearing WM, GM, and mixed WM-GM was measured after exclusion of segmented focal lesions. Significant WMH volume increase and MPF decrease in global WM, WM-GM, and GM were found both in normal aging and MS, PD, and LC patients (except for WM in PD patients). The greatest MPF decrease was observed in MS patients. Both MS, PD, LC patients and the oldest (75-85 years) controls had significant demyelination in global GM. Among LC patients, the greatest global MPF reduction was found in patients with depression and insomnia as COVID-19 complications. In healthy controls, the peak age of myelination was estimated as 42.2 years for WM, 46.5 years for WM-GM, and 45.4 years for GM. MPF mapping showed high sensitivity to age-related and disease-related changes in brain myelination, particularly in GM. Our results confirm the feasibility of using MPF mapping in large-scale clinical studies.
Keywords:
myelin
; quantitative MRI
; neuroimaging
; macromolecular fraction mapping
; MPF
; white matter
; FLAIR hyperintensities
; demyelination
; multiple sclerosis
; Parkinson’s disease
; long COVID
; depression
; normal aging
1. Introduction
Brain demyelination plays a key role in the pathology of primary demyelinating diseases, the most common of which is multiple sclerosis (MS). However, demyelination is often secondary, when the underlying cause of the disease leads to inflammation, ischemia, metabolic disturbances, and oxidative stress, with subsequent damage to neurons, oligodendrocytes, and myelin loss [1,2,3]. This encompasses a wide range of neurological, psychiatric, and infectious conditions, including cerebral ischemia and stroke, postinfectious encephalitis, acute disseminated encephalomyelitis, Alzheimer’s disease, Parkinson’s disease (PD), schizophrenia, depression, and many others [4,5,6,7]. Post-mortem histopathology has also demonstrated a primary role of inflammation in the development of demyelination, in particular, in MS [8,9]. Similar processes of inflammation, ischemia, and metabolic dysfunction may contribute into microstructural white matter (WM) damage associated with normal aging [10,11] and post-COVID neurological and psychiatric complications [12,13,14].
The most remarkable and widely used diagnostic feature of demyelination is focal lesions, detected as areas of WM hyperintensity (WMH) on T2-weighted MR images [15,16,17]. Quantitative MRI methods are also capable of detecting microscopic myelin loss in normal-appearing WM (NAWM) and GM outside of focal lesions, which are invisible on traditional MR images. Longitudinal study by de Groot et al. [18] found that NAWM changes precede aging-related WMH on T2-weighted fluid attenuated inversion recovery (T2/FLAIR) images. Decline in NAWM myelination has been found in MS [17,19,20,21,22], PD [5,7,23,24], schizophrenia [25], depression [26], and normal aging [27,28,29,30,31]. Furthermore, several studies provided evidence of diffuse gray matter (GM) demyelination in MS [20,22,32], schizophrenia [25], depression [26], and normal aging [30,31].
Among the known quantitative MRI methods, only a few have demonstrated specificity to myelin changes in GM [20,22,25,26,30,31,32]. One approach that has shown high sensitivity to myelin GM is macromolecular proton fraction (MPF) mapping [33], which is used in the present study. MPF mapping method is based on the magnetization transfer (MT) effect between water and macromolecules in tissues [33,34]. Unlike semi-quantitative index MT ratio (MTR), MPF parameter showed independence on longitudinal relaxation [22] and paramagnetic effects caused by iron deposition [32]. Unlike widely used diffusion tensor imaging (DTI), MPF is independent on the direction of myelin fibers and can be correctly measured in regions containing multidirectional fibers [35]. Numerous studies in animal models, including cuprizone-induced demyelination and remyelination [36,37], ischemic stroke [38,39], neonatal development [40], and normal animal brain [41], showed strong correlations between MPF and myelin histology. MPF mapping have demonstrated high reproducibility [42], independence on magnetic field strength [41], short data acquisition time due to the fast mapping method [43], and easy implementation based on routine MRI equipment and original manufacturers’ pulse sequences [25,44]. Human studies have shown high sensitivity of MPF to myelin alterations in WM and GM in multiple sclerosis [22,32], mild traumatic brain injury [45], schizophrenia [25], post-COVID depression [26], normal aging [30,31], and brain development in fetuses [44], children [46], and adolescents [47].
Collectively, the above studies [22,25,26,30,31,32,44,45,46,47] suggest that MPF provides a uniform highly-reproducible quantitative myelin scale across a variety of neuropathological conditions and normal physiological states. Leveraging on our large database including MPF maps from almost 200 participants obtained using the same MRI scanner and MPF protocol, this study sought to outline a broad landscape of myelin changes in several neurological diseases and normal aging. More specifically, the primary goal of this study was to evaluate disease-related global myelin changes in normal-appearing WM and GM in patients with MS, PD, and long COVID (LC) and compare them to age- and gender-matched control groups. Additionally, we aimed to assess age-related myelin changes in a larger sample of healthy controls to refine the dependences observed in our previous studies [30,31].
2. Materials and Methods
2.1. Participants
The study involved 196 participants in total. Patients with MS (n = 42), PD (n = 16), post-COVID complications (n = 75), and healthy volunteers (n = 63) were recruited from the Siberian State Medical University (Tomsk, Russia), the Mental Health Research Institute (Tomsk, Russia), the Medica Diagnostic and Treatment Center (Tomsk, Russia), and Tomsk State University. The common for patients and controls inclusion criterion was age from 18 years. The common for patients and controls exclusion criteria: the history of traumatic brain injury, acute infection or somatic diseases at the time of study, pregnancy, contraindications to MRI, inability to tolerate the MRI procedure, and self-withdrawal from the study. For the control group, an additional criterion was the absence of any diagnosed neurologic or psychiatric condition. For MS and PD patients, additional inclusion criteria were diagnosed MS and PD, respectively. For LC patients, additional inclusion criteria were: previously positive to COVID-19 PCR test, persistence of post-COVID complications at the time of the study, and absence of neurological or psychiatric diagnoses prior to COVID-19. Written informed consent was obtained from all participants.
The demographic characteristics of participants are shown in Table 1.
All patients and healthy participants who met the inclusion and exclusion criteria signed an informed consent form. The study design was approved by the Bioethics Committee of the Cancer Research Institute (protocol №3 dated May 26, 2017), the Ethical Committee of Siberian State Medical University (protocol №5652 dated November 27, 2017), the Ethical Committee of the Mental Health Research Institute (protocol №15 dated August 25,2022) and Bioethics Committee of Tomsk State University (№12 dated June 6,2022) following the guidelines of the Declaration of Helsinki.
Since the patient groups differed significantly from each other in gender and age, a control group, similar in gender and age, was selected for each group of patients. The results of the control group selection are presented in Table 2. There were no significant differences between the patient groups (MS, PD, LC) and control groups (MS control, PD control, LC control) in terms of gender, age of the total control samples, or age of men and women.
To study the dependence of MPF and WMHs on age, all healthy study participants were divided into age groups: 18-24 (n = 14), 25-34 (n = 12), 35-44 (n = 10), 45-54 (n = 11), 55-64 (n = 6), 65-74 (n = 6), and 75-85 (n = 4) years old.
2.2. MRI Data Acquisition
All participants, both patients and healthy controls, underwent MR imaging using 1.5T clinical scanner Magnetom Essenza (Siemens, Erlangen, Germany) with 8-channel head coil. The standard MRI protocol included:
- 3D T2-FLAIR: TR = 5000 ms, TE = 390 ms, TI = 1800 ms;
- 3D T1-weighted: TR = 16 ms, TE = 4.76 ms;
- 3D T2-weighted: TR=3000 ms, TE=335 ms;
The fast MPF mapping protocol [25] included three 3D spoiled gradient-echo pulse sequences with following parameters:
- MT-weighted: TR = 20 ms, echo time (TE) = 4.76 ms, flip angle (FA) = 8°, scan time 5 min 40 s;
- T1-weighted: TR =16 ms, TE = 4.76 ms, FA =18°, scan time 4 min 32 s;
- Proton-density-weighted: TR= 16 ms, TE = 4.76 ms, FA= 3°, scan time 4 min 32 s.
All scans were acquired in the sagittal plane with a voxel size of 1.25 × 1.25 × 1.25 mm3 (matrix 192 × 192 × 160, field of view 240 × 240 × 200 mm3), single signal averaging.
The total scanning time was about 35 minutes.
2.3. Image Processing
MPF maps were reconstructed from T1w, MTw, and PDw images using a single-point algorithm with a synthetic reference image [43], which implements by the previously developed software in the C++ language (available at https://www.macromolecularmri.org/).
Image processing included several stages (Figure 1):
- 1)
- Skull stripping was performed using a mask, which was obtained by applying the BET algorithm to the PD-weighted images in the MRIcro application [48]. The mask was converted to a binary image and applied to the MPF maps to remove extracerebral tissue.
- 2)
- WMH were outlined manually by one operator blinded to the subject information on T2/FLAIR images with the guidance of T2-weighted and T1-weighted images.
- 3)
- T2/FLAIR images were registered to MPF maps using ITK-snap software to measure WMH volumes and mean MPF values in the outlined areas.
- 4)
- 5)
- To obtain MPF measurements of normal-appearing white and grey matter outside of focal lesions, WMH masks were subtracted from global compartment masks. The resulting masks were used to measure average MPF values for global compartments. The measurements were carried out using ITK-SNAP application [50].
2.4. Statistical Analysis
Statistical analysis was performed using Statistica 10.0 software. Differences between groups in MPF, WMH volumes, and age were analyzed using the one-way analysis of variance (ANOVA) followed by post-hoc Fisher LSD tests. For analyses with degrees of freedom > 2, p-values were adjusted using the Benjamini–Hochberg false discovery rate (FDR) correction. The relationship between age and MPF in global compartments was investigated for the total sample and separately for men and women by fitting quadratic function. The significance of the quadratic function was accepted if all three coefficients of quadratic equation were significant. The peak age of myelination was calculated from the coefficients of quadratic equations for the total sample of each group and for men and women separately. Statistical significance for all analyses was considered as less than 0.05.
3. Results
3.1. Age-Related Global Changes in the Brain Myelination
Figure 2 (a) shows examples of MPF maps and T2/FLAIR images of healthy study participants across different age ranges. In participants aged 18 and 32 years, no visible WMHs were detected on T2/FLAIR images. Participants aged 51 and 74 years showed typical age-related small WMHs, located predominantly periventricularly. In the 85-year-old participant, the WMH area in the cross-section on T2/FLAIR image occupies a larger area compared to the 51- and 74-year-old participants. Quantitative assessment showed a significant increase in WMH volumes only for the 75–85-year age range compared to all other age ranges (Figure 2, c).
No visible differences were observed between MPF maps of 18-, 32-, 51-, and 74-year-old participants. The MPF map of the 85-year-old participant had a prominent decrease in contrast between WM and GM, as well as a reduction in compartment volumes. Quantitative assessment of age-related changes (Figure 2, b) showed the highest MPF values in participants in the age range of 35-44 years, the lowest MPF values in participants aged 75-85 years, for all compartments. MPF values in participants aged 75-85 years were significantly lower than those in participants aged 18-64 years in the WM compartment, lower than those in participants aged 25-74 years in the WM-GM compartment, and lower than those in participants aged 25-65 years in the GM compartment. Significantly lower MPF values relative to the average age range were also found for the youngest participants. Participants aged 18–24 years showed significantly lower MPF than those in participants aged 25–64 years in the GM and WM-GM compartments. In WM, MPF in participants aged 18–24 years was significantly lower than those in participants aged 35–44 years but higher than those in participants aged 75–85 years.
Figure 2 (d-f) demonstrates the results of the best-fitting quadratic curves of the dependence of MPF on age, for the total sample of healthy controls and for men and women separately. For all quadratic models, all three coefficients of the regression equation were significant (p < 0.001). Quadratic curves for women had a flatter shape than for men, which corresponds to lower MPF peak in women in comparison with men. The peak age calculated from the regression equations for the total sample is 42.2 years, 46.6 years, and 45.4 years for the GM, WM-GM, and WM compartments correspondingly. In men, the vertex of the quadratic curve is shifted relative to the total sample towards younger ages for WM (41.7 years) and WM-GM (46.3 years), and towards older ages for GM (45.7 years). In women, the peak age of myelination is higher for WM (43.1 years) and WM-GM (46.6 years), and lower for GM (45.1 years) compared to men.
3.2. Diffuse and Focal Demyelination in MS Patients
Figure 3 shows differences in brain myelination between MS patients and age- and gender matched healthy controls (MS control group). Patients with MS showed a typical pattern of multiple focal lesions (WMH) on T2/FLAIR images, more prominent in SPMS patients (Figure 3, a). These WMHs are clearly visible as hypointensities on the MPF maps (Figure 3, a). SPMS patients also exhibited decreased WM volume, ventricular enlargement, and lower WM/GM contrast on MPF maps. WMH volume was significantly higher in both RRMS and SPMS patients compared to the MS control group, and in SPMS patients compared to RRMS patients (Figure 3, c). In GM and WM-GM compartments, MPF values were significantly lower in both RRMS and SPMS patients compared to the MS control group, and in SPMS patients compared to RRMS patients (Figure 3, b). In normal-appearing WM, MPF values were significantly lower in both RRMS and SPMS patients compared to the MS control group, but no significant difference was found between RRMS and SPMS patients.
3.3. Diffuse and Focal Demyelination in PD Patients
Differences of brain myelination in patients with PD compared to age- and gender-matched healthy controls (PD control group) are shown on Figure 3. The area of periventricular and nearby WMH on T2/FLAIR images is larger in PD patients in comparison with PD controls (Figure 4, a). A PD patient showed visible brain atrophy and lower GM/WM contrast on the MPF maps (Figure 4, a). The average WMH volume in PD patients was significantly higher compared to the PD control group (Figure 4, c). MPF values in all compartments were lower in PD patients compared to controls but these differences were significant only for GM and WM-GM (Figure 4, b).
3.4. Demyelination in LC Patients
Changes in brain demyelination in LC patients (Figure 5) relative age- and gender-matched controls (LC control group) were analyzed both for the total sample of LC patients and the LC patients with specific symptoms clinically diagnosed by neurologists or psychiatrists. The number of these LC patients with specific symptoms (depression, chronic headache, hyposmia/anosmia, asthenia, mild cognitive impairment, insomnia) is shown in Figure 5 (b). Small WMHs are visible on T2/FLAIR image of LC patient with mild cognitive impairment after COVID-19 (Figure 5, a). No visible changes on MPF map in LC patient with depression is observed (Figure 5, a). WMH volume was significantly increased relative controls only in the LC patients with mild cognitive impairments (Figure 5, c). More pronounced changes were observed in MPF for all compartments (Figure 5, d-f). In the GM and WM-GM (Figure 5, e,f), significant MPF decrease was found for the total sample of LC patients and for all subsamples corresponding to specific LC complications (except for hyposmia for GM). MPF in WM showed a significant decrease for the total sample of LC patients and, specifically, in the LC patients with depression, insomnia, and cognitive impairments. In all compartments, the lowest MPF relative to controls in LC patients with depression was found.
3.5. Comparison of Global Demyelinationand WMH Volume in MS, PD, LC Patients, and Normal Aging
Percentage changes in global and focal brain myelination in MS, PD, LC patients relative to matched controls, as well as age-related changes are summarized in Figure 6. The most prominent demyelination including highest MPF decrease in GM (-22.0±1.7%) and WM-GM (-13.3±1.0%) and WMH volume increase (1799.3±270.8%) was observed in MS patients compared to controls. Lower but significant MPF decrease in GM (-5.0±1.5%) and WM-GM (-3.6+1.4%) and an increase in WMH volume (427.6±162.3%) were found for PD patients compared to aged controls. In LC patients, small but significant MPF decrease relative to controls was found for all global compartments: GM (-2.5±0.5%), WM-GM (-3.4%±0.6%), and WM (-1.5±0.6%). Age-related demyelination in 75-85-year controls were second largest after those in MS: a significant MPF decrease in GM (-10.8±2.9%), WM-GM (-9.8±1.4%), WM (-8.5±2.0%) compartments and an increase in WMH volume (727.3±514%). MPF in GM (-6.5±2.0%) and WM-GM (-6.7±2.0%) compartments of the youngest participants also was significantly lower than in participants aged 35-44 years.
4. Discussion
This study for the first time has evaluated disease-dependent alterations in global WM and GM myelination in patients with MS, PD, and LC measured by quantitative MPF mapping. By selecting matched control groups for each patient group, it can be argued that these changes in global myelination are due specifically to the type of disease and are not related to gender and age. In addition, an important result of the study is the refining of our previously obtained data [30,31] on age-related changes in myelination.
As expected, the most prominent global demyelination was found in MS patients. In these patients, a significant decrease in MPF was observed in all global compartments both in RRMS and SPMS patients. The most percentage decrease in MPF was found in global GM and mixed WM-GM, and in these compartments SPMS patients showed significantly higher MPF decline compared to RRMS patients. In addition, WMH volume was significantly higher in both RRM and SPMS patients compared to controls, and in SPMS patients compared to RRMS patients.
The majority of quantitative MRI studies showed a significant demyelination in NAWM [19,20,21,22,32] but only MWF and MPF techniques were able to detect a decrease in global GM myelination [20,22,32] in MS patients. Our findings are in accordance with previous studies [22,32], which investigated demyelination in MS patients using MPF mapping. First study [22] showed a greater MPF decrease and its stronger correlation with clinical scores in GM compared to WM. The second study [32] showed a significant MPF decrease in deep GM structures and its correlation with clinical scores in MS patients. Rahmanzadeh et al [20] found a decreased MWF both in WM and GM compared with healthy controls, and in SPMS patients compared to RRMS patients. Histopathological studies found that the normal-appearing GM of MS patients is characterized by myelin disturbances with the loss of particular neuronal populations, synaptic demise, and microglial alterations compared with the GM of non-neurological controls [21]. Our results confirmed the important role of GM demyelination in MS pathology.
In PD patients, a smaller (compared to MS patients) but significant reduction in MPF was found in GM and WM-GM compartments compared to aged controls. WMH volume in PD patients was significantly higher in comparison with age-matched controls. A number of studies investigated changes in WMH volume and normal appearing WM and GM in PD [5,7,15,23,24,51,52,53]. Most studies found an increased WMH volume in PD patients compared to age-matched controls [15,16,51]. In DTI studies, alterations both in WM and GM were found compared to age-matched controls [24,52,53] but one study did not show differences [51]. Given iron deposition in the subcortical nuclei in older age and its impact on DTI [54], such measurements in GM should be considered with some caution. For MPF mapping method, independence on iron deposition in the deep GM was demonstrated in the previous study [32].
LC patients showed the least MPF reduction among all groups of patients, but these changes were significant in all three compartments. Among all subsamples of patients with specific post-COVID complications, the greatest MPF reduction was found in LC patients with depression and insomnia. However, significant MPF reductions (primarily in WM-GM) were also found for chronic headache, asthenia, cognitive impairment, and hyposmia as complications of COVID-19. A significant increase in WMH volume was found only for LC patients with cognitive impairment. Our results are consistent with our previous studies [26,55] that found significant demyelination of GM and WM brain structures in patients with post-COVID depression and cognitive impairments.
Changes in WM as a consequence of COVID-19 was found in many DTI studies [56,57,58,59,60,61,62,63] but few studies considered WM changes in relation with the specific symptoms of LC patients. We found several studies (including our [26]) in LC patients that examined WM changes in relation to depression and insomnia [58,64,65]. Cui et al [58] found decreased FA in WM tracts in the patients with severe depression compared to the patients with mild or moderate depression after one COVID-19. Insomnia- and depression-related psychological scores were negatively correlated with the FA in these WM tracts. The study by Benedetti et al. [64] showed negative associations between AD in several WM tracts and self-rated depression. Qin et al. [65] found lower FA and higher RD and AD in acute COVID-19 patients with sleep disorders compared to healthy controls. These WM abnormalities correlated with insomnia scores. In three months after recovery, insomnia-related scores slightly improved, depression- and anxiety-related scores remained unchanged, and DTI measures changed significantly only in two brain structures. Unfortunately, healthy participants were not included in two [58,64] of three of above studies, therefore, the lack of control groups does not allow us to compare these studies with our results.
The present study refined the patterns of age-related changes in myelination obtained in previous studies [30,31] on a larger sample of healthy volunteers. Overall, the previously made estimates of the peak age of myelination in WM-GM and WM were similar: in the previously conducted study these estimates were 46.9 and 43.1 years, in the present study 46.5 and 42.2 years, respectively. In both studies, a later peak age for WM-GM and WM compartments was observed in females, but the present study found that these differences are smaller (1.4 and 0.3 years) than those obtained previously (4.6 and 2.1 years). The present study also determined the peak age of myelination for GM as 45.7 years in men and 45.1 years in women. Compared with the group with maximal myelination (35-44 years), we found significantly lower MPF values in all compartments for participants in both the oldest (75-85 years) and youngest (18-24 years) age groups. The percentage reduction in MPF associated with normal aging was even greater than those in PD patients compared with age-matched controls. Only the olderst age group showed a significant increase in WMH volume relative to all younger participants.
Despite on numerous studies investigated age-related changes in myelination [30,47,66,67,68,69,70,71,72,73], they are often limited to a linear model [66,70,71] but more appropriate quadratic (inverted-U) model was also used for wider age ranges [73,74,75,76]. Within a linear model, positive correlations were found in childhood and adolescence [47] while negative correlations were found at ages over 60 years [68,70]. Arshad et al. [75] studied age-related changes in myelination using DTI and WMF data within liner and quadratic models. It was found that DTI parameters, FA and RD, correlates with age only within linear model, while more myelin-specific MWF correlates with age within quadratic model. Westley et al. [74] within a quadratic model estimated WM peak age of myelination at 29.1 years based on FA, 35.7 years based on MD, and 31.1 years based on RD. Based on DTI indices, peak age of WM myelination was estimated by Kochunov et al [76] as 23- 39 years, and by Lebel et al. [72] as 21-44 years old. Our peak age estimates for the global WM (42.2 years) are close to the upper bound of the ages obtained in these studies. We did not find any studies in the literature assessing the peak age of myelination in GM.
Our results highlight the capability of fast MPF mapping to detect very subtle GM changes in brain myelination. Since many studies consider myelin loss as the basis of cognitive decline [77,78,79,80,81,82], it would be of great interest to investigate associations of demyelination with performance on cognitive tests. Future studies will define the contribution of demyelination of specific brain structures to age- and disease-related decline of cognitive abilities.
5. Conclusions
This is the first study that compared disease-dependent changes in global WM and GM myelination in patients with MS, PD, LC, and in normal aging using quantitative MPF mapping. The selection of matched control groups for each patient group allowed to separate the contributions of specific diseases to demyelination from the contributions of gender and age.
Significant WMH volume increase and MPF decrease in global WM, WM-GM, and GM were found in both normal aging and MS, PD, and LC patients. The exception was the group of PD patients, for whom the MPF decrease in WM was not significant. The greatest MPF decrease was observed in MS patients. Significant demyelination was found in all global compartments both in RRMS and SPMS patients. The differences between RRMS and SPMS patients were significant for GM and WM-GM.
The study also for the first time showed significant global changes in LC patients. Among LC patients, the greatest MPF reduction was found in patients with depression and insomnia as COVID-19 complications.
The present study refined the patterns of age-related changes in myelination obtained in previous studies [30,31] on a larger sample of healthy controls. The peak age of myelination was estimated as 42.2 years for WM, 46.5 years for WM-GM, and 45.4 years for GM.
Both MS, PD, LC patients and the oldest (75-85 years) controls revealed the greatest demyelination in global GM. These results highlight the important role of GM demyelination in disease pathology and normal aging. MPF mapping showed high sensitivity to age-related and disease-related changes in brain myelination providing the feasibility of this method in clinics.
6. Study Limitations
The study was carried out on relatively small samples of patients. The study did not include independent control samples of similar age at both time points to carry out cross-sectional comparisons. We did not take into account brain atrophy in MS patients, PD patients, and older controls, which could have influenced the results of automatic FSL segmentation. All LC patients were diagnosed with neurological and psychiatric conditions for the first time after COVID-19. However, we cannot fully guarantee that the occurrence of these conditions was not influenced by sociodemographic factors associated with the pandemic.
Author Contributions
Conceptualization, writing—original draft preparation, M.Kh.; data curation, project administration, software M. S.; writing—review and editing, software, V.Y.; investigation, D.K.; data acquisition, A.U.; formal analysis, T.A.; formal analysis, I.V.; formal analysis, figure preparation, M.S.; formal analysis, V.P.; formal analysis, M.M.; investigation, V.O.; investigation, N.K.; investigation, A.L.; investigation, data curation, V.A.; investigation, M.T.; investigation, I.Z.; resources, Y.T. All authors reviewed and approved the final version of the manuscript.
Funding
The study was funded by the Russian Science Foundation (project No. 22-15-00481-П). Software for MPF map reconstruction was distributed under support of the NIH High-Impact Neuroscience Research Resource grant R24NS104098.
Institutional Review Board Statement
The study design was approved by the Bioethics Committee of the Cancer Research Institute (protocol №3 dated May 26, 2017), the Ethical Committee of Siberian State Medical University (protocol №5652 dated November 27, 2017), the Ethical Committee of the Mental Health Research Institute (protocol №15 dated August 25,2022) and Bioethics Committee of Tomsk State University (№12 dated June 6,2022) following the guidelines of the Declaration of Helsinki.
Informed Consent Statement
Informed consent was obtained from all subjects involved in the study.
Data Availability Statement
Data is unavailable due to privacy or ethical restrictions.
Acknowledgments
We thank the administration of Cancer Research Institute and the administration of the Institute of Mental Health for their assistance.
Conflicts of Interest
The authors declare no conflict of interest.
References
- Pivneva, T.A. Mechanisms Underlying the Process of Demyelination in Multiple Sclerosis. Neurophysiology 2009, 41, 365–373. [Google Scholar] [CrossRef]
- Bradl, M.; Lassmann, H. Oligodendrocytes: Biology and Pathology. Acta Neuropathol. 2010, 119, 37–53. [Google Scholar] [CrossRef] [PubMed]
- Lassmann, H. Multiple Sclerosis Pathology. Cold Spring Harb. Perspect. Med. 2018, 8, 1–15. [Google Scholar] [CrossRef]
- Bakirtzis, C.; Lima, M.; De Lorenzo, S.S.; Artemiadis, A.; Theotokis, P.; Kesidou, E.; Konstantinidou, N.; Sintila, S.A.; Boziki, M.K.; Parissis, D.; et al. Secondary Central Nervous System Demyelinating Disorders in the Elderly: A Narrative Review. Healthc. 2023, 11, 1–19. [Google Scholar] [CrossRef]
- Yang, K.; Wu, Z.; Long, J.; Li, W.; Wang, X.; Hu, N.; Zhao, X.; Sun, T. White Matter Changes in Parkinson’s Disease. npj Park. Dis. 2023, 9, 1–10. [Google Scholar] [CrossRef]
- Faulkner, M.E.; Gong, Z.; Guo, A.; Laporte, J.P.; Bae, J.; Bouhrara, M. Harnessing Myelin Water Fraction as an Imaging Biomarker of Human Cerebral Aging, Neurodegenerative Diseases, and Risk Factors Influencing Myelination: A Review. J. Neurochem. 2024, 168, 2243–2263. [Google Scholar] [CrossRef]
- Bergamino, M.; Keeling, E.G.; Mishra, V.R.; Stokes, A.M.; Walsh, R.R. Assessing White Matter Pathology in Early-Stage Parkinson Disease Using Diffusion Mri: A Systematic Review. Front. Neurol. 2020, 11, 1–21. [Google Scholar] [CrossRef]
- Zeis, T.; Graumann, U.; Reynolds, R.; Schaeren-Wiemers, N. Normal-Appearing White Matter in Multiple Sclerosis Is in a Subtle Balance between Inflammation and Neuroprotection. Brain 2008, 131, 288–303. [Google Scholar] [CrossRef]
- Gallego-Delgado, P.; James, R.; Browne, E.; Meng, J.; Umashankar, S.; Tan, L.; Picon, C.; Mazarakis, N.D.; Faisal, A.A.; Howell, O.W.; et al. Neuroinflammation in the Normal-Appearing White Matter (NAWM) of the Multiple Sclerosis Brain Causes Abnormalities at the Nodes of Ranvier; 2020; Vol. 18, ISBN 1111111111. [Google Scholar]
- Groh, J.; Simons, M. White Matter Aging and Its Impact on Brain Function. Neuron 2025, 113, 127–139. [Google Scholar] [CrossRef]
- Chapman, T.W.; Hill, R.A. Myelin Plasticity in Adulthood and Aging. Neurosci. Lett. 2020, 715, 134645. [Google Scholar] [CrossRef]
- Braga, J.; Lepra, M.; Kish, S.J.; Rusjan, P.M.; Nasser, Z.; Verhoeff, N.; Vasdev, N.; Bagby, M.; Boileau, I.; Husain, M.I.; et al. Neuroinflammation after COVID-19 with Persistent Depressive and Cognitive Symptoms. JAMA Psychiatry 2023, 80, 787–795. [Google Scholar] [CrossRef]
- Sriwastava, S.; Tandon, M.; Podury, S.; Prasad, A.; Wen, S.; Guthrie, G.; Kakara, M.; Jaiswal, S.; Subedi, R.; Elkhooly, M.; et al. COVID-19 and Neuroinflammation: A Literature Review of Relevant Neuroimaging and CSF Markers in Central Nervous System Inflammatory Disorders from SARS-COV2. J. Neurol. 2021, 268, 4448–4478. [Google Scholar] [CrossRef]
- Khodanovich, M.Y.; Kamaeva, D.A.; Naumova, A.V. Role of Demyelination in the Persistence of Neurological and Mental Impairments after COVID-19. Int. J. Mol. Sci. 2022, 23. [Google Scholar] [CrossRef]
- Linortner, P.; McDaniel, C.; Shahid, M.; Levine, T.F.; Tian, L.; Cholerton, B.; Poston, K.L. White Matter Hyperintensities Related to Parkinson’s Disease Executive Function. Mov. Disord. Clin. Pract. 2020, 7, 629–638. [Google Scholar] [CrossRef]
- Fang, E.; Fartaria, M.J.; Ann, C.N.; Maréchal, B.; Kober, T.; Lim, J.X.; Ooi, L.Q.R.; Chen, C.; Lim, S.L.; Tan, E.K.; et al. Clinical Correlates of White Matter Lesions in Parkinson’s Disease Using Automated Multi-Modal Segmentation Measures. J. Neurol. Sci. 2021, 427. [Google Scholar] [CrossRef]
- Rovaris, M.; Bozzali, M.; Iannucci, G.; Ghezzi, A.; Caputo, D.; Montanari, E.; Bertolotto, A.; Bergamaschi, R.; Capra, R.; Mancardi, G.L.; et al. Assessment of Normal-Appearing White and Gray Matter in Patients with Primary Progressive Multiple Sclerosis: A Diffusion-Tensor Magnetic Resonance Imaging Study. Arch. Neurol. 2002, 59, 1406–1412. [Google Scholar] [CrossRef]
- De Groot, M.; Verhaaren, B.F.J.; De Boer, R.; Klein, S.; Hofman, A.; Van Der Lugt, A.; Ikram, M.A.; Niessen, W.J.; Vernooij, M.W. Changes in Normal-Appearing White Matter Precede Development of White Matter Lesions. Stroke 2013, 44, 1037–1042. [Google Scholar] [CrossRef]
- Vavasour, I.M.; Huijskens, S.C.; Li, D.K.; Traboulsee, A.L.; Mädler, B.; Kolind, S.H.; Rauscher, A.; Moore, G.W.; MacKay, A.L.; Laule, C. Global Loss of Myelin Water over 5 Years in Multiple Sclerosis Normal-Appearing White Matter. Mult. Scler. J. 2017, 24, 1557–1568. [Google Scholar] [CrossRef]
- Rahmanzadeh, R.; Lu, P.J.; Barakovic, M.; Weigel, M.; Maggi, P.; Nguyen, T.D.; Schiavi, S.; Daducci, A.; La Rosa, F.; Schaedelin, S.; et al. Myelin and Axon Pathology in Multiple Sclerosis Assessed by Myelin Water and Multi-Shell Diffusion Imaging. Brain 2021, 144, 1684–1696. [Google Scholar] [CrossRef]
- Muñoz González, G.; ’t Hart, B.A.; Bugiani, M.; Plemel, J.R.; Schenk, G.J.; Kooij, G.; Luchicchi, A. A Focus on the Normal-Appearing White and Gray Matter within the Multiple Sclerosis Brain: A Link to Smoldering Progression. Acta Neuropathol. 2025, 150, 1–27. [Google Scholar] [CrossRef] [PubMed]
- Yarnykh, V.L.L.; Bowen, J.D.D.; Henson, L.K.J.J.; Samsonov, A.; Repovic, P.; Mayadev, A.; Qian, P.; Gangadharan, B.; Keogh, B.P.P.; Maravilla, K.R.R.; et al. Fast Whole-Brain Three-Dimensional Macromolecular Proton Fraction Mapping in Multiple Sclerosis. Radiology 2014, 274, 210–220. [Google Scholar] [CrossRef] [PubMed]
- Wei, X.; Luo, C.; Li, Q.; Hu, N.; Xiao, Y.; Liu, N.; Lui, S.; Gong, Q. White Matter Abnormalities in Patients With Parkinson’s Disease: A Meta-Analysis of Diffusion Tensor Imaging Using Tract-Based Spatial Statistics. Front. Aging Neurosci. 2021, 12, 1–12. [Google Scholar] [CrossRef] [PubMed]
- Gattellaro, G.; Minati, L.; Grisoli, M.; Mariani, C.; Carella, F.; Osio, M.; Ciceri, E.; Albanese, A.; Bruzzone, M.G. White Matter Involvement in Idiopathic Parkinson Disease: A Diffusion Tensor Imaging Study. Am. J. Neuroradiol. 2009, 30, 1222–1226. [Google Scholar] [CrossRef]
- Smirnova, L.P.; Yarnykh, V.L.; Parshukova, D.A.; Kornetova, E.G.; Semke, A.V.; Usova, A.V.; Pishchelko, A.O.; Khodanovich, M.Y.; Ivanova, S.A. Global Hypomyelination of the Brain White and Gray Matter in Schizophrenia: Quantitative Imaging Using Macromolecular Proton Fraction. Transl. Psychiatry 2021, 11, 365. [Google Scholar] [CrossRef]
- Khodanovich, M.; Svetlik, M.; Kamaeva, D.; Usova, A.; Kudabaeva, M.; Anan’ina, T.; Vasserlauf, I.; Pashkevich, V.; Moshkina, M.; Obukhovskaya, V.; et al. Demyelination in Patients with POST-COVID Depression. Biomedicines 2024, 13, 1–23. [Google Scholar] [CrossRef]
- Faizy, T.D.; Thaler, C.; Broocks, G.; Flottmann, F.; Leischner, H.; Kniep, H.; Nawabi, J.; Schön, G.; Stellmann, J.-P.; Kemmling, A.; et al. The Myelin Water Fraction Serves as a Marker for Age-Related Myelin Alterations in the Cerebral White Matter – A Multiparametric MRI Aging Study. Front. Neurosci. 2020, 14, 1–14. [Google Scholar] [CrossRef]
- Faizy, T.D.; Kumar, D.; Broocks, G.; Thaler, C.; Flottmann, F.; Leischner, H.; Kutzner, D.; Hewera, S.; Dotzauer, D.; Reddy, R.; et al. Age-Related Measurements of the Myelin Water Fraction Derived from 3D Multi-Echo GRASE Reflect Myelin Content of the Cerebral White Matter. Sci. Rep. 2018, 1–8. [Google Scholar] [CrossRef]
- James, S.N.; Manning, E.N.; Storey, M.; Nicholas, J.M.; Coath, W.; Keuss, S.E.; Cash, D.M.; Lane, C.A.; Parker, T.; Keshavan, A.; et al. Neuroimaging, Clinical and Life Course Correlates of Normal-Appearing White Matter Integrity in 70-Year-Olds. Brain Commun. 2023, 5, 1–14. [Google Scholar] [CrossRef]
- Khodanovich, M.; Svetlik, M.; Naumova, A.; Kamaeva, D.; Usova, A.; Kudabaeva, M.; Anan’ina, T.; Wasserlauf, I.; Pashkevich, V.; Moshkina, M.; et al. Age-Related Decline in Brain Myelination: Quantitative Macromolecular Proton Fraction Mapping, T2-FLAIR Hyperintensity Volume, and Anti-Myelin Antibodies Seven Years Apart. Biomedicines 2024, 12. [Google Scholar] [CrossRef]
- Khodanovich, M.Y.; Svetlik, M.V.; Naumova, A.V.; Usova, A.V.; Pashkevich, V.Y.; Moshkina, M.V.; Shadrina, M.M.; Kamaeva, D.A.; Obukhovskaya, V.B.; Kataeva, N.G.; et al. Global and Regional Sex-Related Di Ff Erences, Asymmetry, and Peak Age of Brain Myelination in Healthy Adults. J. Clin. Med. 2024, 13, 1–21. [Google Scholar] [CrossRef] [PubMed]
- Yarnykh, V.L.; Krutenkova, E.P.; Aitmagambetova, G.; Henson, L.K.J.; Piedmont, H.; Repovic, P.; Mayadev, A.; Qian, P.; Gangadharan, B. Iron-Insensitive Quantitative Assessment of Subcortical Gray Matter Demyelination in Multiple Sclerosis Using Macromolecular Proton Fraction. Am. J. Neuroradiol. 2018, 39, 618–625. [Google Scholar] [CrossRef] [PubMed]
- Kisel, A.A.; Naumova, A.V.; Yarnykh, V.L. Macromolecular Proton Fraction as a Myelin Biomarker: Principles, Validation, and Applications. Front. Neurosci. 2022, 16, 1–10. [Google Scholar] [CrossRef] [PubMed]
- Seiler, S.; Ropele, S.; Schmidt, R. Magnetization Transfer Imaging for in Vivo Detection of Microstructural Tissue Changes in Aging and Dementia: A Short Literature Review. J. Alzheimer’s Dis. 2014, 42, 229–237. [Google Scholar] [CrossRef]
- Underhill, H.R.; Yuan, C.; Yarnykh, V.L. Direct Quantitative Comparison between Cross-Relaxation Imaging and Diffusion Tensor Imaging of the Human Brain at 3.0 T. Neuroimage 2009, 47, 1568–1578. [Google Scholar] [CrossRef]
- Khodanovich, M.Y.Y.; Sorokina, I.V.V.; Glazacheva, V.Y.Y.; Akulov, A.E.E.; Nemirovich-Danchenko, N.M.M.; Romashchenko, A.V. V.; Tolstikova, T.G.G.; Mustafina, L.R.R.; Yarnykh, V.L.L. Histological Validation of Fast Macromolecular Proton Fraction Mapping as a Quantitative Myelin Imaging Method in the Cuprizone Demyelination Model. Sci. Rep. 2017, 7, 1–12. [Google Scholar] [CrossRef]
- Khodanovich, M.Y.; Pishchelko, A.O.; Glazacheva, V.Y.; Pan, E.S.; Akulov, A.E.; Svetlik, M.V.; Tyumentseva, Y.A.; Anan’ina, T.V.; Yarnykh, V.L. Quantitative Imaging of White and Gray Matter Remyelination in the Cuprizone Demyelination Model Using the Macromolecular Proton Fraction. Cells 2019, 8, 1204. [Google Scholar] [CrossRef]
- Khodanovich, M.Y.; Kisel, A.A.; Akulov, A.E.; Atochin, D.N.; Kudabaeva, M.S.; Glazacheva, V.Y.; Svetlik, M.V.; Medvednikova, Y.A.; Mustafina, L.R.; Yarnykh, V.L. Quantitative Assessment of Demyelination in Ischemic Stroke in Vivo Using Macromolecular Proton Fraction Mapping. J. Cereb. Blood Flow Metab. 2018, 38, 919–931. [Google Scholar] [CrossRef]
- Khodanovich, M.Y.; Gubskiy, I.L.; Kudabaeva, M.S.; Namestnikova, D.D.; Kisel, A.A.; Anan’ina, T.V.; Tumentceva, Y.A.; Mustafina, L.R.; Yarnykh, V.L. Long-Term Monitoring of Chronic Demyelination and Remyelination in a Rat Ischemic Stroke Model Using Macromolecular Proton Fraction Mapping. J. Cereb. Blood Flow Metab. 2021, 41, 2856–2869. [Google Scholar] [CrossRef]
- Drobyshevsky, A.; Synowiec, S.; Goussakov, I.; Lu, J.; Gascoigne, D.; Aksenov, D.P.; Yarnykh, V. NeuroImage Temporal Trajectories of Normal Myelination and Axonal Development Assessed by Quantitative Macromolecular and Diffusion MRI: Ultrastructural and Immunochemical Validation in a Rabbit Model. Neuroimage 2023, 270, 119974. [Google Scholar] [CrossRef]
- Naumova, A.V.; Akulov, A.E.; Khodanovich, M.Y.; Yarnykh, V.L. High-Resolution Three-Dimensional Macromolecular Proton Fraction Mapping for Quantitative Neuroanatomical Imaging of the Rodent Brain in Ultra-High Magnetic Fields. Neuroimage 2017, 147, 985–993. [Google Scholar] [CrossRef]
- Yarnykh, V.L.; Kisel, A.A.; Khodanovich, M.Y. Scan–Rescan Repeatability and Impact of B0 and B1 Field Nonuniformity Corrections in Single-Point Whole-Brain Macromolecular Proton Fraction Mapping. J. Magn. Reson. Imaging 2020, 51, 1789–1798. [Google Scholar] [CrossRef] [PubMed]
- Yarnykh, V.L. Time-Efficient, High-Resolution, Whole Brain Three-Dimensional Macromolecular Proton Fraction Mapping. Magn. Reson. Med. 2016, 75, 2100–2106. [Google Scholar] [CrossRef] [PubMed]
- Yarnykh, V.L.L.; Prihod’ko, I.Y.Y.; Savelov, A.A.A.; Korostyshevskaya, A.M.M. Quantitative Assessment of Normal Fetal Brain Myelination Using Fast Macromolecular Proton Fraction Mapping. Am. J. Neuroradiol. 2018, 39, 1341–1348. [Google Scholar] [CrossRef] [PubMed]
- Petrie, E.C.; Cross, D.J.; Yarnykh, V.L.; Richards, T.; Martin, N.M.; Pagulayan, K.; Hoff, D.; Hart, K.; Mayer, C.; Tarabochia, M.; et al. Neuroimaging, Behavioral, and Psychological Sequelae of Repetitive Combined Blast/Impact Mild Traumatic Brain Injury in Iraq and Afghanistan War Veterans. J. Neurotrauma 2014, 31, 425–436. [Google Scholar] [CrossRef]
- Huber, E.; Corrigan, N.M.; Yarnykh, V.L.; Ramírez, N.F.; Kuhl, P.K. Language Experience during Infancy Predicts White Matter Myelination at Age 2 Years. J. Neurosci. 2023, 43, 1590–1599. [Google Scholar] [CrossRef]
- Corrigan, N.M.; Yarnykh, V.L.; Hippe, D.S.; Owen, J.P.; Huber, E.; Zhao, T.C.; Kuhl, P.K. Myelin Development in Cerebral Gray and White Matter during Adolescence and Late Childhood. Neuroimage 2021, 227, 117678. [Google Scholar] [CrossRef]
- Rorden, C.; Brett, M. Stereotaxic Display of Brain Lesions. Behav. Neurol. 2000, 12, 191–200. [Google Scholar] [CrossRef]
- Jenkinson, M.; Beckmann, C.F.; Behrens, T.E.J.; Woolrich, M.W.; Smith, S.M. FSL. Neuroimage 2012, 62, 782–790. [Google Scholar] [CrossRef]
- Yushkevich, P.A.; Piven, J.; Hazlett, C.; Smith, G.; Ho, S.; Gee, J.C.; Gerig, G. User-Guided 3D Active Contour Segmentation of Anatomical Structures: Significantly Improved Efficiency and Reliability. Neuroimage 2006, 31, 1116–1128. [Google Scholar] [CrossRef]
- de Schipper, L.J.; Hafkemeijer, A.; Bouts, M.J.R.J.; van der Grond, J.; Marinus, J.; Henselmans, J.M.L.; van Hilten, J.J. Age- and Disease-Related Cerebral White Matter Changes in Patients with Parkinson’s Disease. Neurobiol. Aging 2019, 80, 203–209. [Google Scholar] [CrossRef]
- Rektor, I.; Svátková, A.; Vojtíšek, L.; Zikmundová, I.; Vaníček, J.; Király, A.; Szabó, N. White Matter Alterations in Parkinson’s Disease with Normal Cognition Precede Grey Matter Atrophy. PLoS One 2018, 13, 1–15. [Google Scholar] [CrossRef]
- Mohsen, M.; Mohamed, N.A.E.; Bedir, A.E.T.M.; Razek, A.A.K.A.; Saied, A.E.A.M. Advanced MRI-Based Evaluation of Gray and White Matter Changes in Parkinson’s Disease. Egypt. J. Radiol. Nucl. Med. 2024, 55. [Google Scholar] [CrossRef]
- Zhang, J.; Tao, R.; Liu, C.; Wu, W.; Zhang, Y.; Cui, J.; Wang, J. Possible Effects of Iron Deposition on the Measurement of DTI Metrics in Deep Gray Matter Nuclei: An in Vitro and in Vivo Study. Neurosci. Lett. 2013, 551, 47–52. [Google Scholar] [CrossRef] [PubMed]
- Khodanovich, M.; Naumova, A.; Kamaeva, D.; Obukhovskaya, V.; Vasilieva, S.; Schastnyy, E.; Kataeva, N.; Levina, A.; Kudabaeva, M.; Pashkevich, V.; et al. Neurocognitive Changes in Patients with Post-COVID Depression. J. Clin. Med. 2024, 13, 1–20. [Google Scholar] [CrossRef] [PubMed]
- Nelson, B.K.; Farah, L.N.; Saint, S.A.; Song, C.; Field, T.S.; Sossi, V.; Stoessl, A.J.; Wellington, C.; Honer, W.G.; Lang, D.; et al. Diffusion Tensor Imaging after COVID-19 Infection: A Systematic Review. Neuroimage 2025, 310, 121150. [Google Scholar] [CrossRef]
- Yuan, M.; Lu, R.; Liu, Y.; Zhu, H.; Wang, H.; Wang, J.; Song, Y.; Yang, L.; Xiao, M. White Matter Changes in Recovered COVID-19 Patients: Insights from DTI, DKI, and NODDI Metrics. Front. Neurol. 2025, 16, 1–11. [Google Scholar] [CrossRef]
- Cui, Y.; Wang, Y.; Lu, L.; Zhang, Y.; Yu, Q.; Dong, S.; Wang, Y.; Liu, Y.; Dong, G.; Dai, J.; et al. Long-Term White Matter Changes in Patients Who Develop Severe Depression after Multiple COVID-19 Infections: A 3–6-Month Study. Quant. Imaging Med. Surg. 2025, 15, 4364–4374. [Google Scholar] [CrossRef]
- Huang, S.; Zhou, X.; Zhao, W.; Du, Y.; Yang, D.; Huang, Y.; Chen, Y.; Zhang, H.; Yang, G.; Liu, J.; et al. Dynamic White Matter Changes in Recovered COVID-19 Patients: A Two-Year Follow-up Study. Theranostics 2023, 13, 724–735. [Google Scholar] [CrossRef]
- Huang, S.; Zhou, Z.; Yang, D.; Zhao, W.; Zeng, M.; Xie, X.; Du, Y.; Jiang, Y.; Zhou, X.; Yang, W.; et al. Persistent White Matter Changes in Recovered COVID-19 Patients at the 1-Year Follow-Up. Brain 2022, 145, 1830–1838. [Google Scholar] [CrossRef]
- Qin, Y.; Wu, J.; Chen, T.; Li, J.; Zhang, G.; Wu, D.; Zhou, Y.; Zheng, N.; Cai, A.; Ning, Q.; et al. Long-Term Microstructure and Cerebral Blood Flow Changes in Patients Recovered from COVID-19 without Neurological Manifestations. J. Clin. Invest. 2021, 131. [Google Scholar] [CrossRef]
- Bispo, D.D. de C.; Brandão, P.R. de P.; Pereira, D.A.; Maluf, F.B.; Dias, B.A.; Paranhos, H.R.; von Glehn, F.; de Oliveira, A.C.P.; Regattieri, N.A.T.; Silva, L.S.; et al. Brain Microstructural Changes and Fatigue after COVID-19. Front. Neurol. 2022, 13. [Google Scholar] [CrossRef] [PubMed]
- Nelson, B.K.; Farah, L.N.; Grier, A.; Su, W.; Chen, J.; Sossi, V.; Sekhon, M.S.; Stoessl, A.J.; Wellington, C.; Honer, W.G.; et al. Differences in Brain Structure and Cognitive Performance between Patients with Long-COVID and Those with Normal Recovery. Neuroimage 2024, 300, 120859. [Google Scholar] [CrossRef] [PubMed]
- Benedetti, F.; Palladini, M.; Paolini, M.; Melloni, E.; Vai, B.; De Lorenzo, R.; Furlan, R.; Rovere-Querini, P.; Falini, A.; Mazza, M.G. Brain Correlates of Depression, Post-Traumatic Distress, and Inflammatory Biomarkers in COVID-19 Survivors: A Multimodal Magnetic Resonance Imaging Study. Brain, Behav. Immun. - Heal. 2021, 18, 100387. [Google Scholar] [CrossRef]
- Qin, H.; Duan, G.; Zhou, K.; Qin, L.; Lai, Y.; Liu, Y.; Lu, Y.; Peng, B.; Zhang, Y.; Zhou, X.; et al. Alteration of White Matter Microstructure in Patients with Sleep Disorders after COVID-19 Infection. Sleep Med. 2024, 114, 109–118. [Google Scholar] [CrossRef] [PubMed]
- Hsu, J.L.; Leemans, A.; Bai, C.H.; Lee, C.H.; Tsai, Y.F.; Chiu, H.C.; Chen, W.H. Gender Differences and Age-Related White Matter Changes of the Human Brain: A Diffusion Tensor Imaging Study. Neuroimage 2008, 39, 566–577. [Google Scholar] [CrossRef]
- Cercignani, M.; Giulietti, G.; Dowell, N.G.; Gabel, M.; Broad, R.; Leigh, P.N.; Harrison, N.A.; Bozzali, M. Characterizing Axonal Myelination within the Healthy Population: A Tract-by-Tract Mapping of Effects of Age and Gender on the Fiber g-Ratio. Neurobiol. Aging 2017, 49, 109–118. [Google Scholar] [CrossRef]
- Kitamura, S.; Morikawa, M.; Kiuchi, K.; Taoka, T.; Fukusumi, M.; Kichikawa, K.; Kishimoto, T. Asymmetry, Sex Differences and Age-Related Changes in the White Matter in the Healthy Elderly: A Tract-Based Study. BMC Res. Notes 2011, 4. [Google Scholar] [CrossRef]
- Salat, D.H.; Tuch, D.S.; Greve, D.N.; Kouwe, A.J.W.; Van Der; Hevelone, N.D.; Zaleta, A.K.; Rosen, B.R.; Fischl, B.; Corkin, S.; Rosas, H.D.; et al. Age-Related Alterations in White Matter Microstructure Measured by Diffusion Tensor Imaging. Neurobiol. Aging 2005, 26, 1215–1227. [Google Scholar] [CrossRef]
- Brenner, E.K.; Bangen, K.J.; Clark, A.L.; Delano-Wood, L.; Evangelista, N.D.; Edwards, L.; Sorg, S.F.; Jak, A.J.; Bondi, M.W.; Deoni, S.C.L.; et al. Sex Moderates the Association between Age and Myelin Water Fraction in the Cingulum and Fornix among Older Adults without Dementia. Front. Aging Neurosci. 2023, 15, 1–7. [Google Scholar] [CrossRef]
- Inano, S.; Takao, H.; Hayashi, N.; Abe, O.; Ohtomo, K. Effects of Age and Gender on White Matter Integrity. Am. J. Neuroradiol. 2011, 32, 2103–2109. [Google Scholar] [CrossRef]
- Lebel, C.; Caverhill-Godkewitsch, S.; Beaulieu, C. Age-Related Regional Variations of the Corpus Callosum Identified by Diffusion Tensor Tractography. Neuroimage 2010, 52, 20–31. [Google Scholar] [CrossRef] [PubMed]
- Lebel, C.; Treit, S.; Beaulieu, C. A Review of Diffusion MRI of Typical White Matter Development from Early Childhood to Young Adulthood. NMR Biomed. 2019, 32. [Google Scholar] [CrossRef] [PubMed]
- Westlye, L.T.; Walhovd, K.B.; Dale, A.M.; Bjørnerud, A.; Due-tønnessen, P.; Engvig, A.; Tamnes, C.K.; Østby, Y. Life-Span Changes of the Human Brain White Matter: Diffusion Tensor Imaging ( DTI ) and Volumetry. Cereb. Cortex 2010, 20, 2055–2068. [Google Scholar] [CrossRef] [PubMed]
- Arshad, M.; Stanley, J.A.; Raz, N. Adult Age Differences in Subcortical Myelin Content Are Consistent with Protracted Myelination and Unrelated to Diffusion Tensor Imaging Indices. Neuroimage 2016, 143, 26–39. [Google Scholar] [CrossRef]
- Kochunov, P.; Williamson, D.E.; Lancaster, J.; Fox, P.; Cornell, J.; Blangero, J.; Glahn, D.C. Fractional Anisotropy of Water Diffusion in Cerebral White Matter across the Lifespan. Neurobiol. Aging 2012, 33, 9–20. [Google Scholar] [CrossRef]
- O’Sullivan, M.; Jones, D.K.; Summers, P.E.; Morris, R.G.; Williams, S.C.R.; Markus, H.S. Evidence for Cortical “Disconnection” as a Mechanism of Age-Related Cognitive Decline. Neurology 2001, 57, 632–638. [Google Scholar] [CrossRef]
- Bartzokis, G.; Lu, P.H.; Tingus, K.; Mendez, M.F.; Richard, A.; Peters, D.G.; Oluwadara, B.; Barrall, K.A.; Finn, J.P.; Villablanca, P.; et al. Lifespan Trajectory of Myelin Integrity and Maximum Motor Speed. Neurobiol. Aging 2010, 31, 1554–1562. [Google Scholar] [CrossRef]
- Kohama, S.G.; Rosene, D.L.; Sherman, L.S. Age-Related Changes in Human and Non-Human Primate White Matter: From Myelination Disturbances to Cognitive Decline. Age (Omaha). 2012, 34, 1093–1110. [Google Scholar] [CrossRef]
- Armstrong, C.L.; Traipe, E.; Hunter, J.V.; Haselgrove, J.C.; Ledakis, G.E.; Tallent, E.M.; van Buchem, M.; Shera, D. Age-Related, Regional, Hemispheric, and Medial-Lateral Differences in Myelin Integrity in Vivo in the Normal Adult Brain. Am. J. Neuroradiol. 2021, 25, 977–984. [Google Scholar] [CrossRef]
- Garnier-Crussard, A.; Bougacha, S.; Wirth, M.; André, C.; Delarue, M.; Landeau, B.; Mézenge, F.; Kuhn, E.; Gonneaud, J.; Chocat, A.; et al. White Matter Hyperintensities across the Adult Lifespan: Relation to Age, Aβ Load, and Cognition. Alzheimer’s Res. Ther. 2020, 12, 1–11. [Google Scholar] [CrossRef]
- Bartzokis, G. Age-Related Myelin Breakdown: A Developmental Model of Cognitive Decline and Alzheimer’s Disease. Neurobiol. Aging 2004, 25, 5–18. [Google Scholar] [CrossRef]
Figure 1.
Scheme of the image processing pipeline (in the figure: patient with MS, female, 35 years old). Skull stripped source T2/FLAIR image was registered to MPF map reconstructed from T1w, MTw, and PDw images, used for manual lesion segmentation, obtaining lesion mask, and measuring WMH volume. Automatic FSL segmentation was performed using MPF maps and obtaining WM, WM-GM, and GM global masks. A lesion mask was subtracted from the WM, WM-GM, and GM global masks and the subtraction result was used to measure MPF in global compartments.
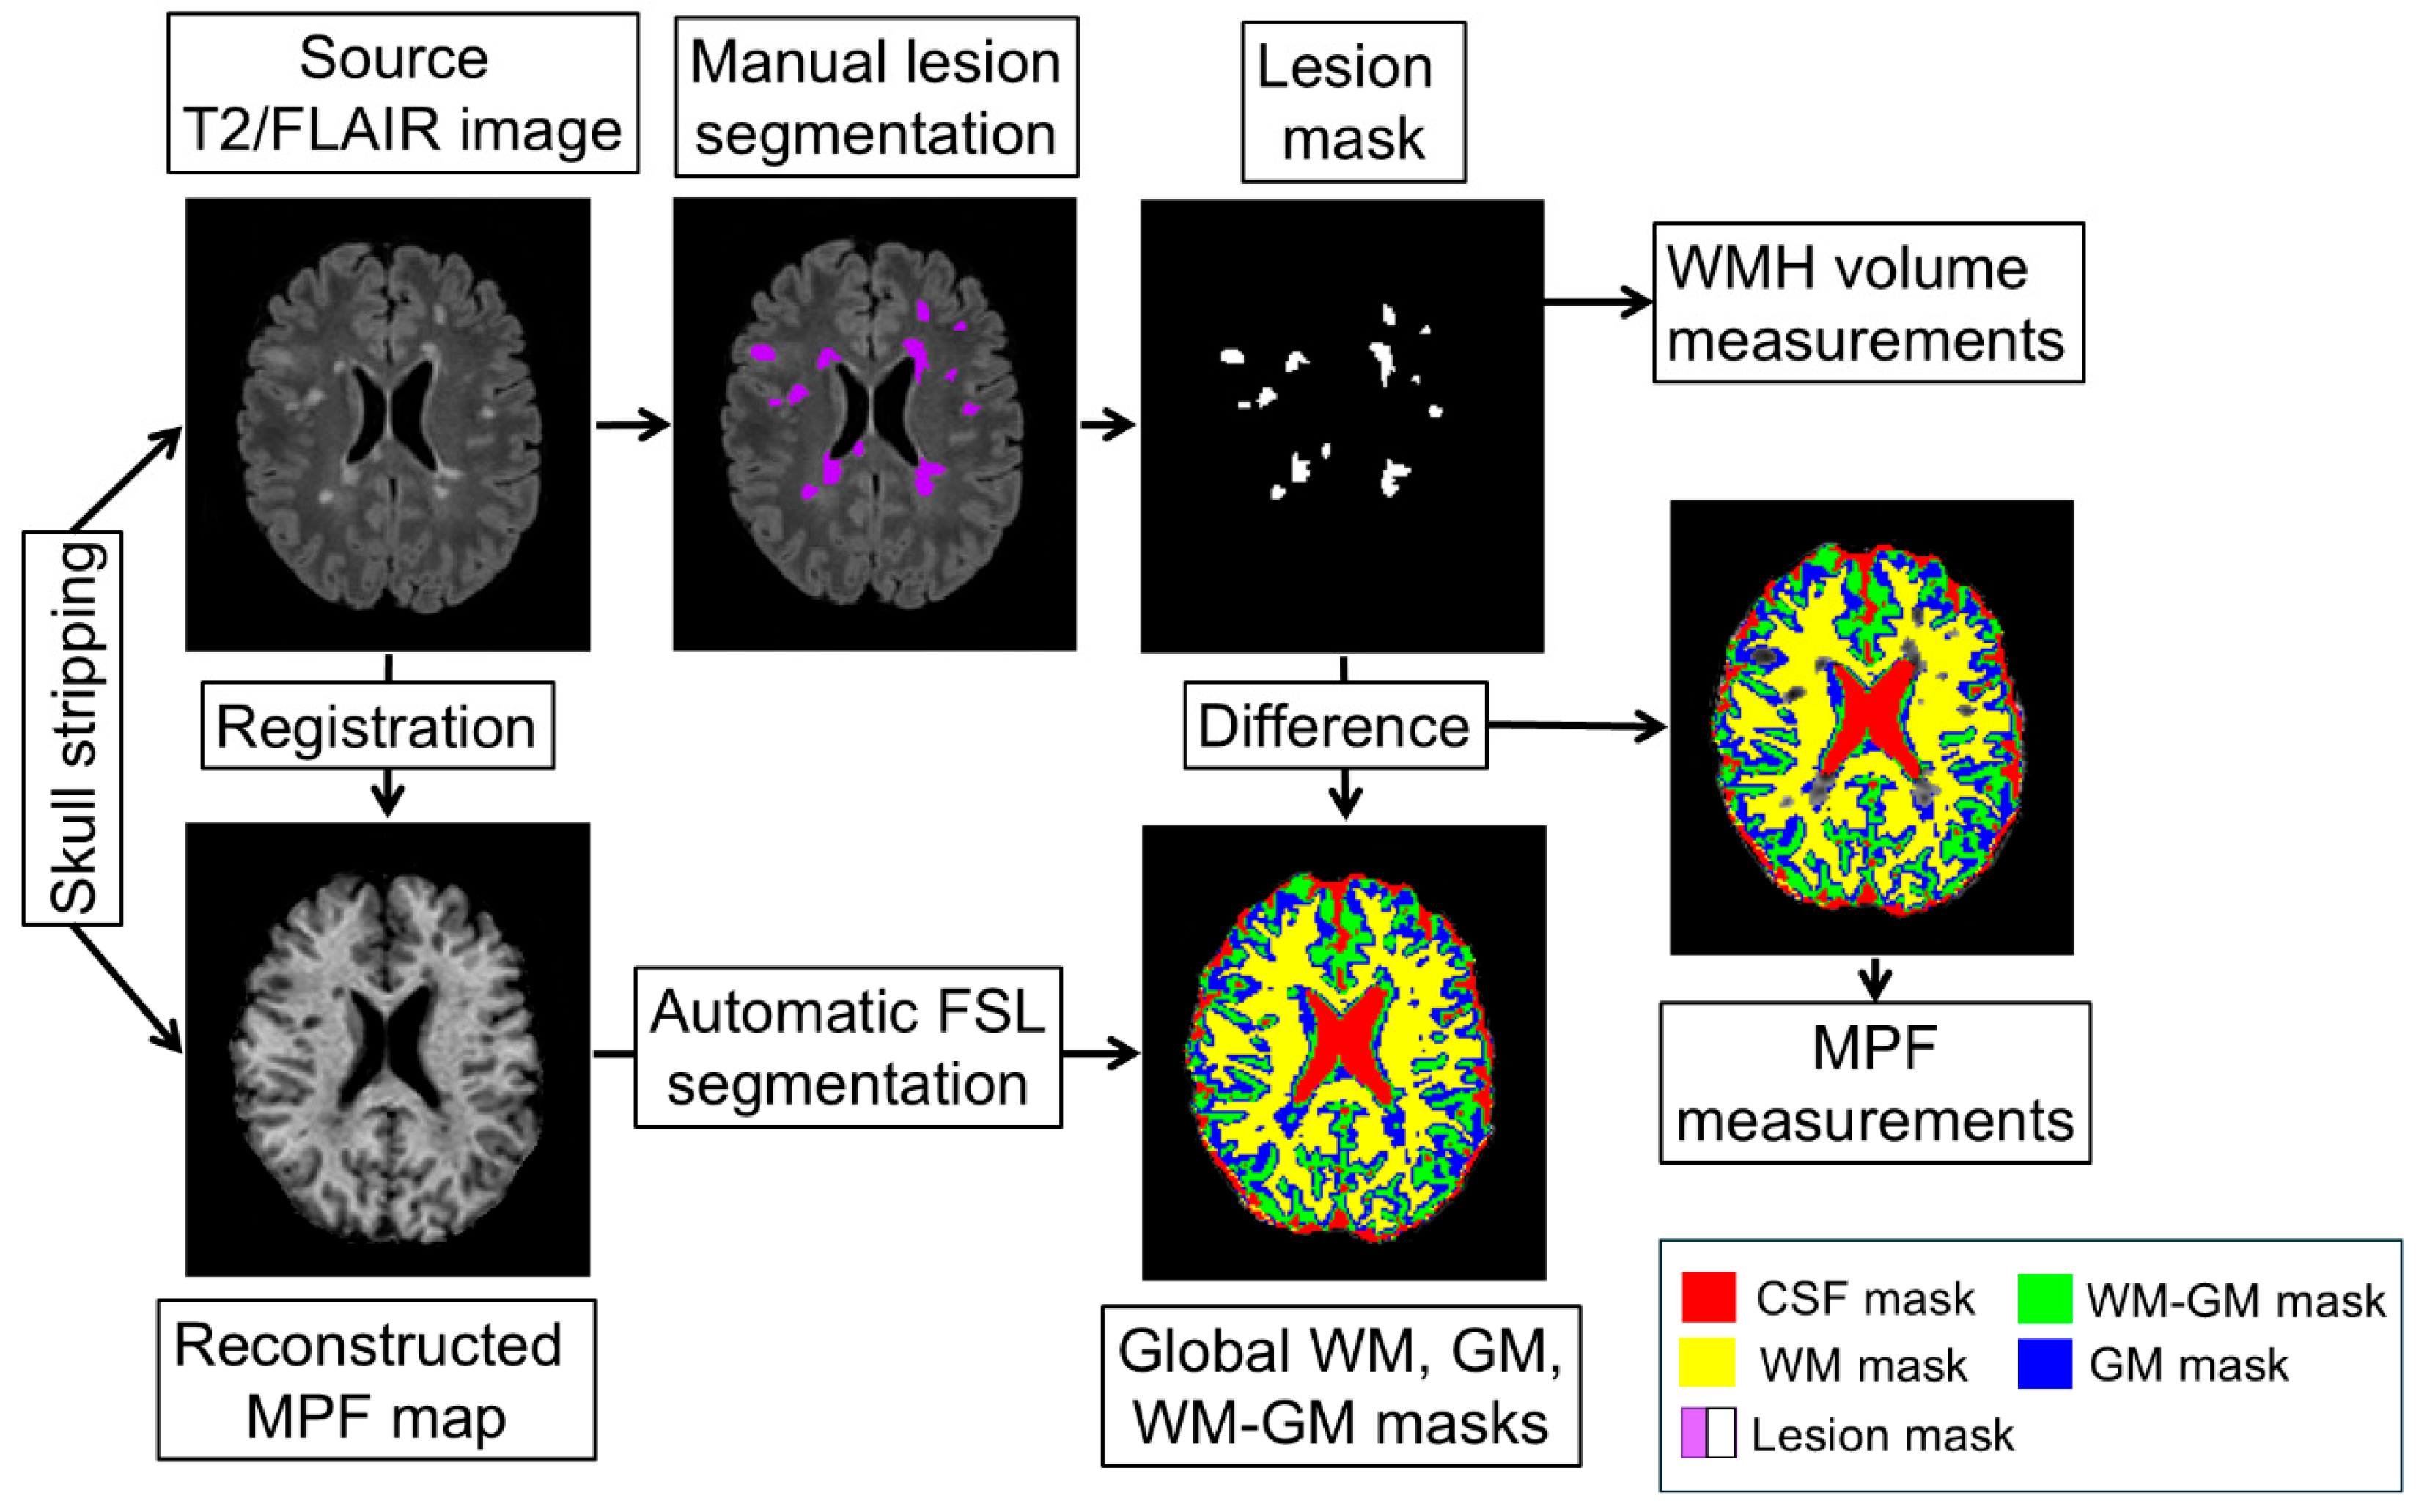
Figure 2.
Age-related global changes in brain myelination. (a) Example MPF maps and T2/FLAIR images of healthy participants of different age groups: 18 years (female), 32 years (female), 51 years (female), 74 years (female). (b) Age-related MPF changes in GM, WM, and WM-GM global compartments. (c) Age-related changes in WMH volumes. (d)-(f) Quadratic model of MPF as a function of age for WM (d), WM-GM (e), and GM (f) obtained for men (blue line), women (red line), and the total sample (purple line). Error bars denote standard deviation. Significant differences relative to the youngest (18-24 y.) participants: * - p<0.05, ** - p<0.01, *** - p<0.001. Significant differences relative to the oldest (75-85 y.) participants: # - p<0.05, ## - p<0.01, ## - p<0.001.
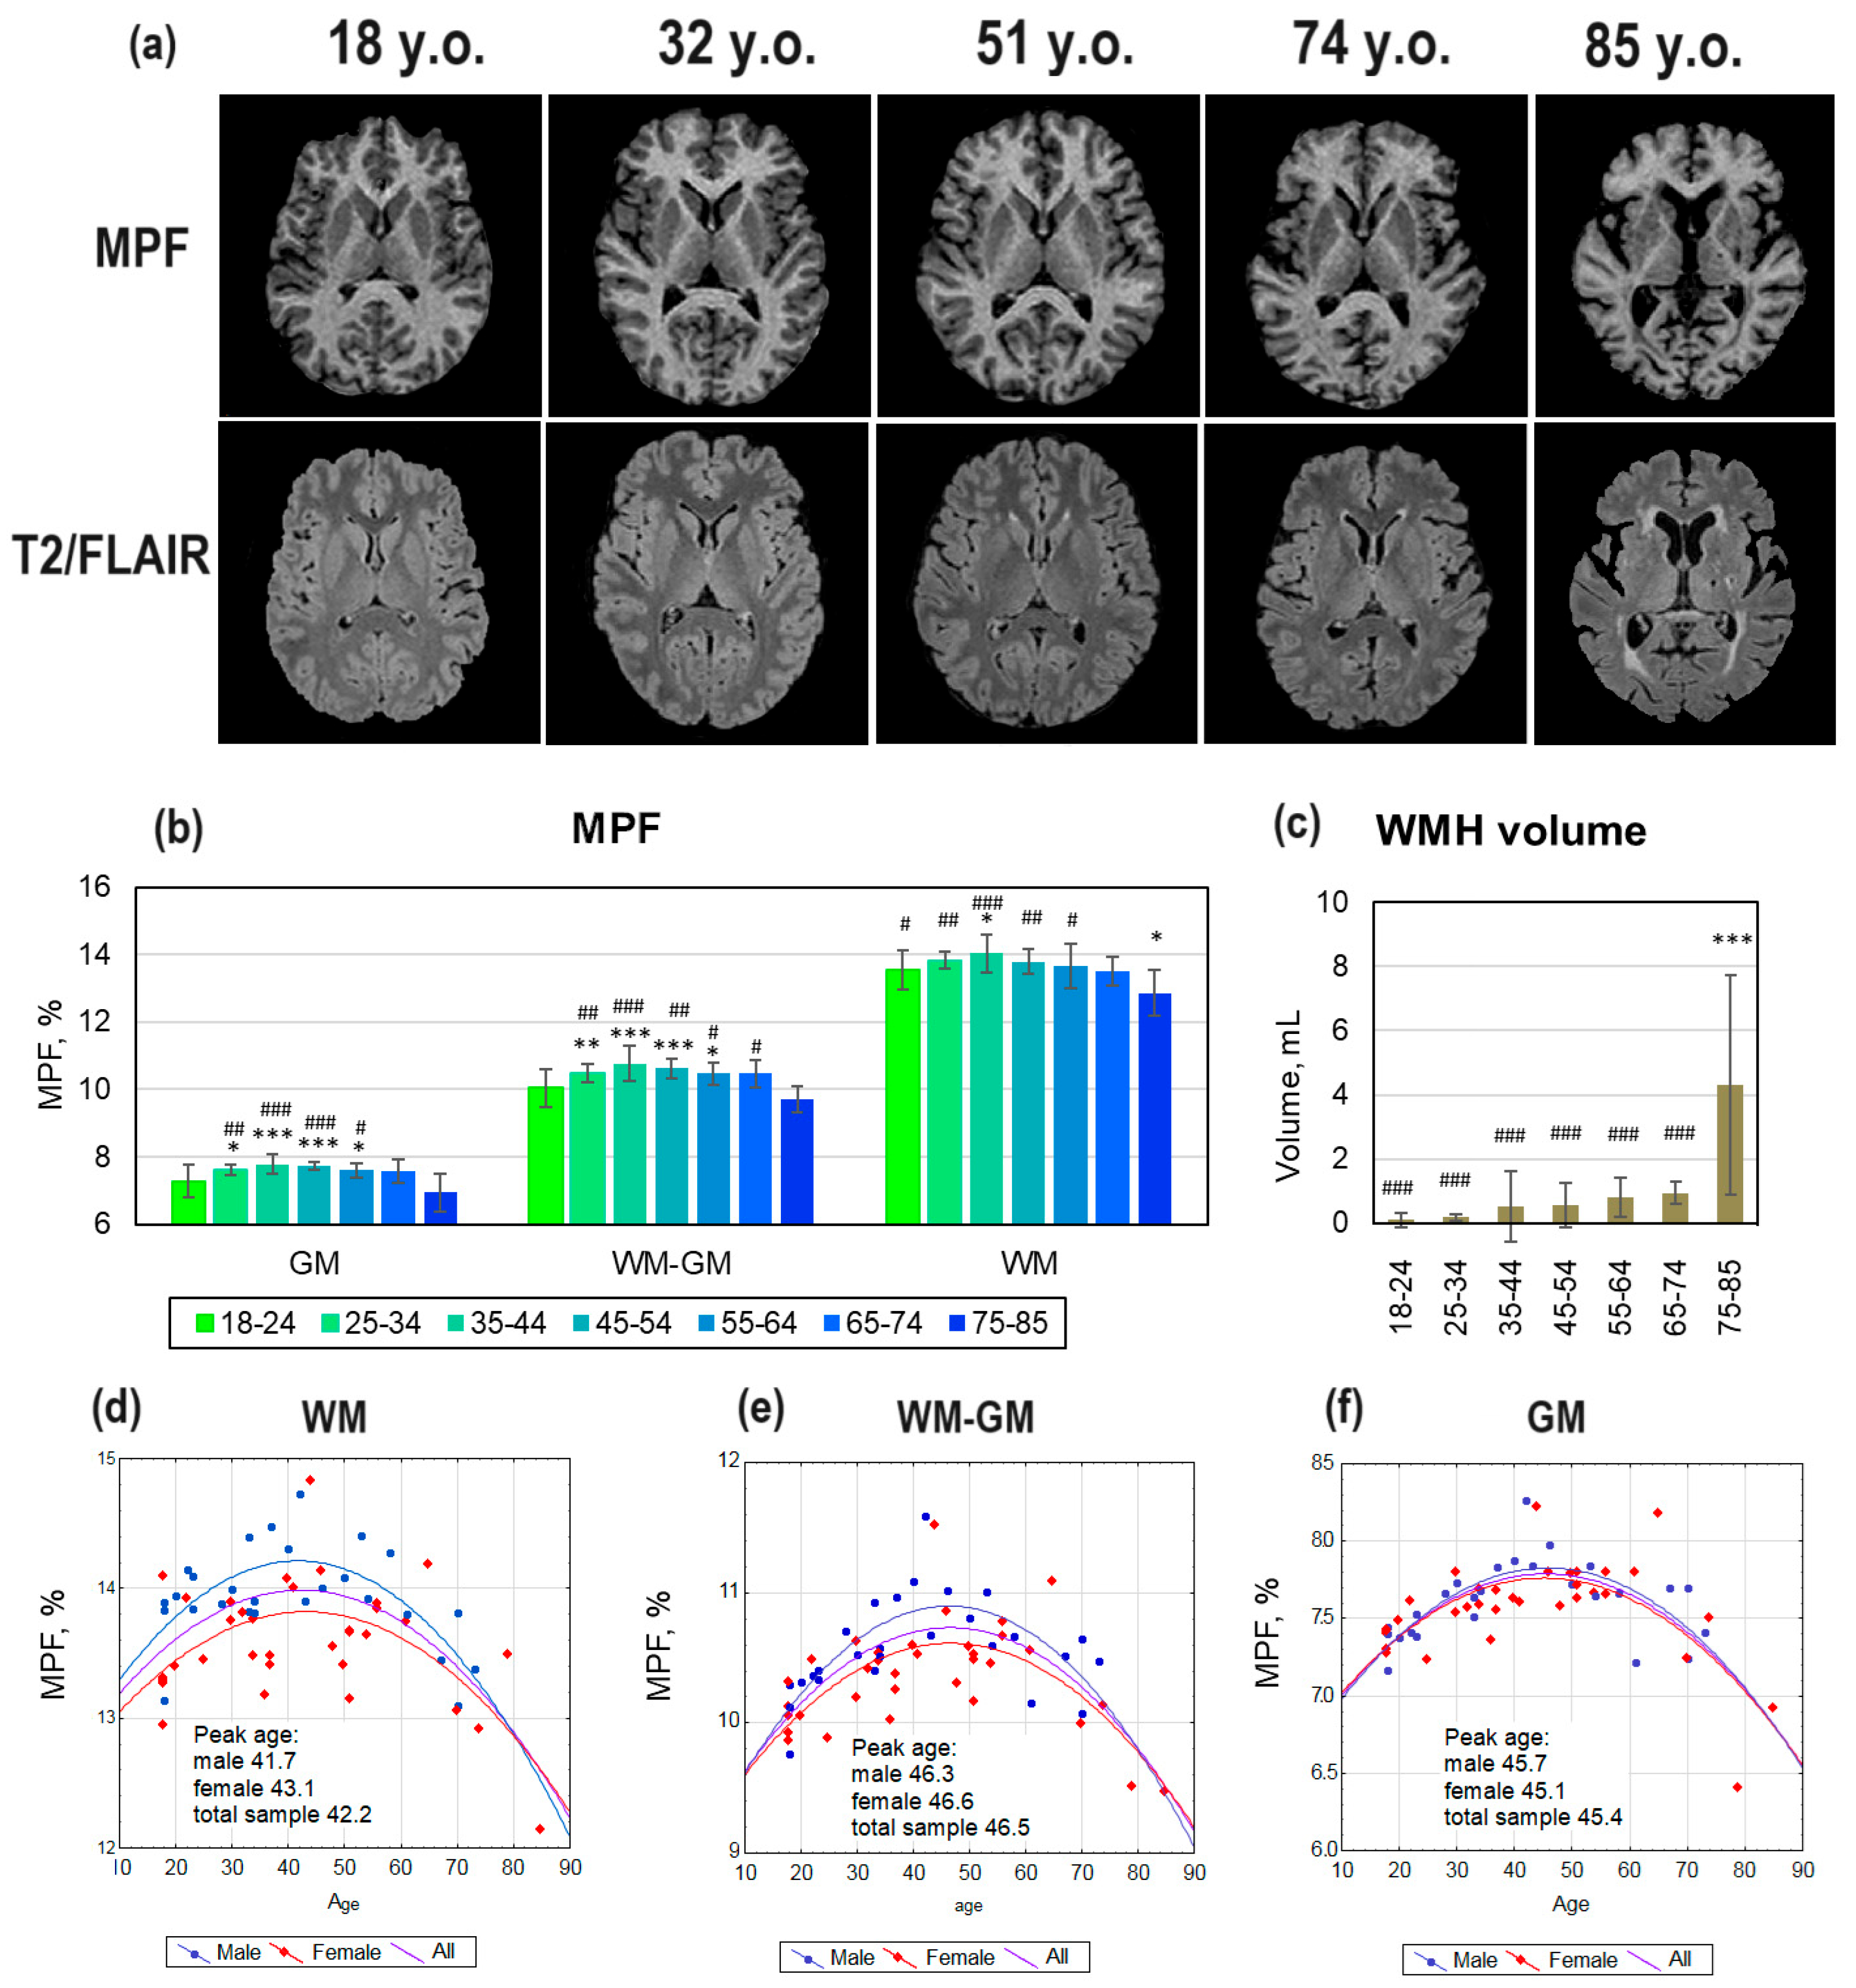
Figure 3.
Global and focal changes of brain myelination in MS patients. (a) Example MPF maps of healthy participant (MS control, female, 32 years), RRMS (female, 32 years), and SPMS (female, 32 years) patients. (b) MPF decrease in global GM, WM, and WM-GM compartments in RRMS and SPMS patients relative to healthy participants (MS control). (c) WMH volume changes in RRMS and SPMS patients relative to controls. Error bars denote standard deviation. Significant differences relative to the MS control group: * - p<0.05, ** - p<0.01, *** - p<0.001. Significant differences between RRMS and SPMS patients: ## - p<0.01, ### - p<0.001.
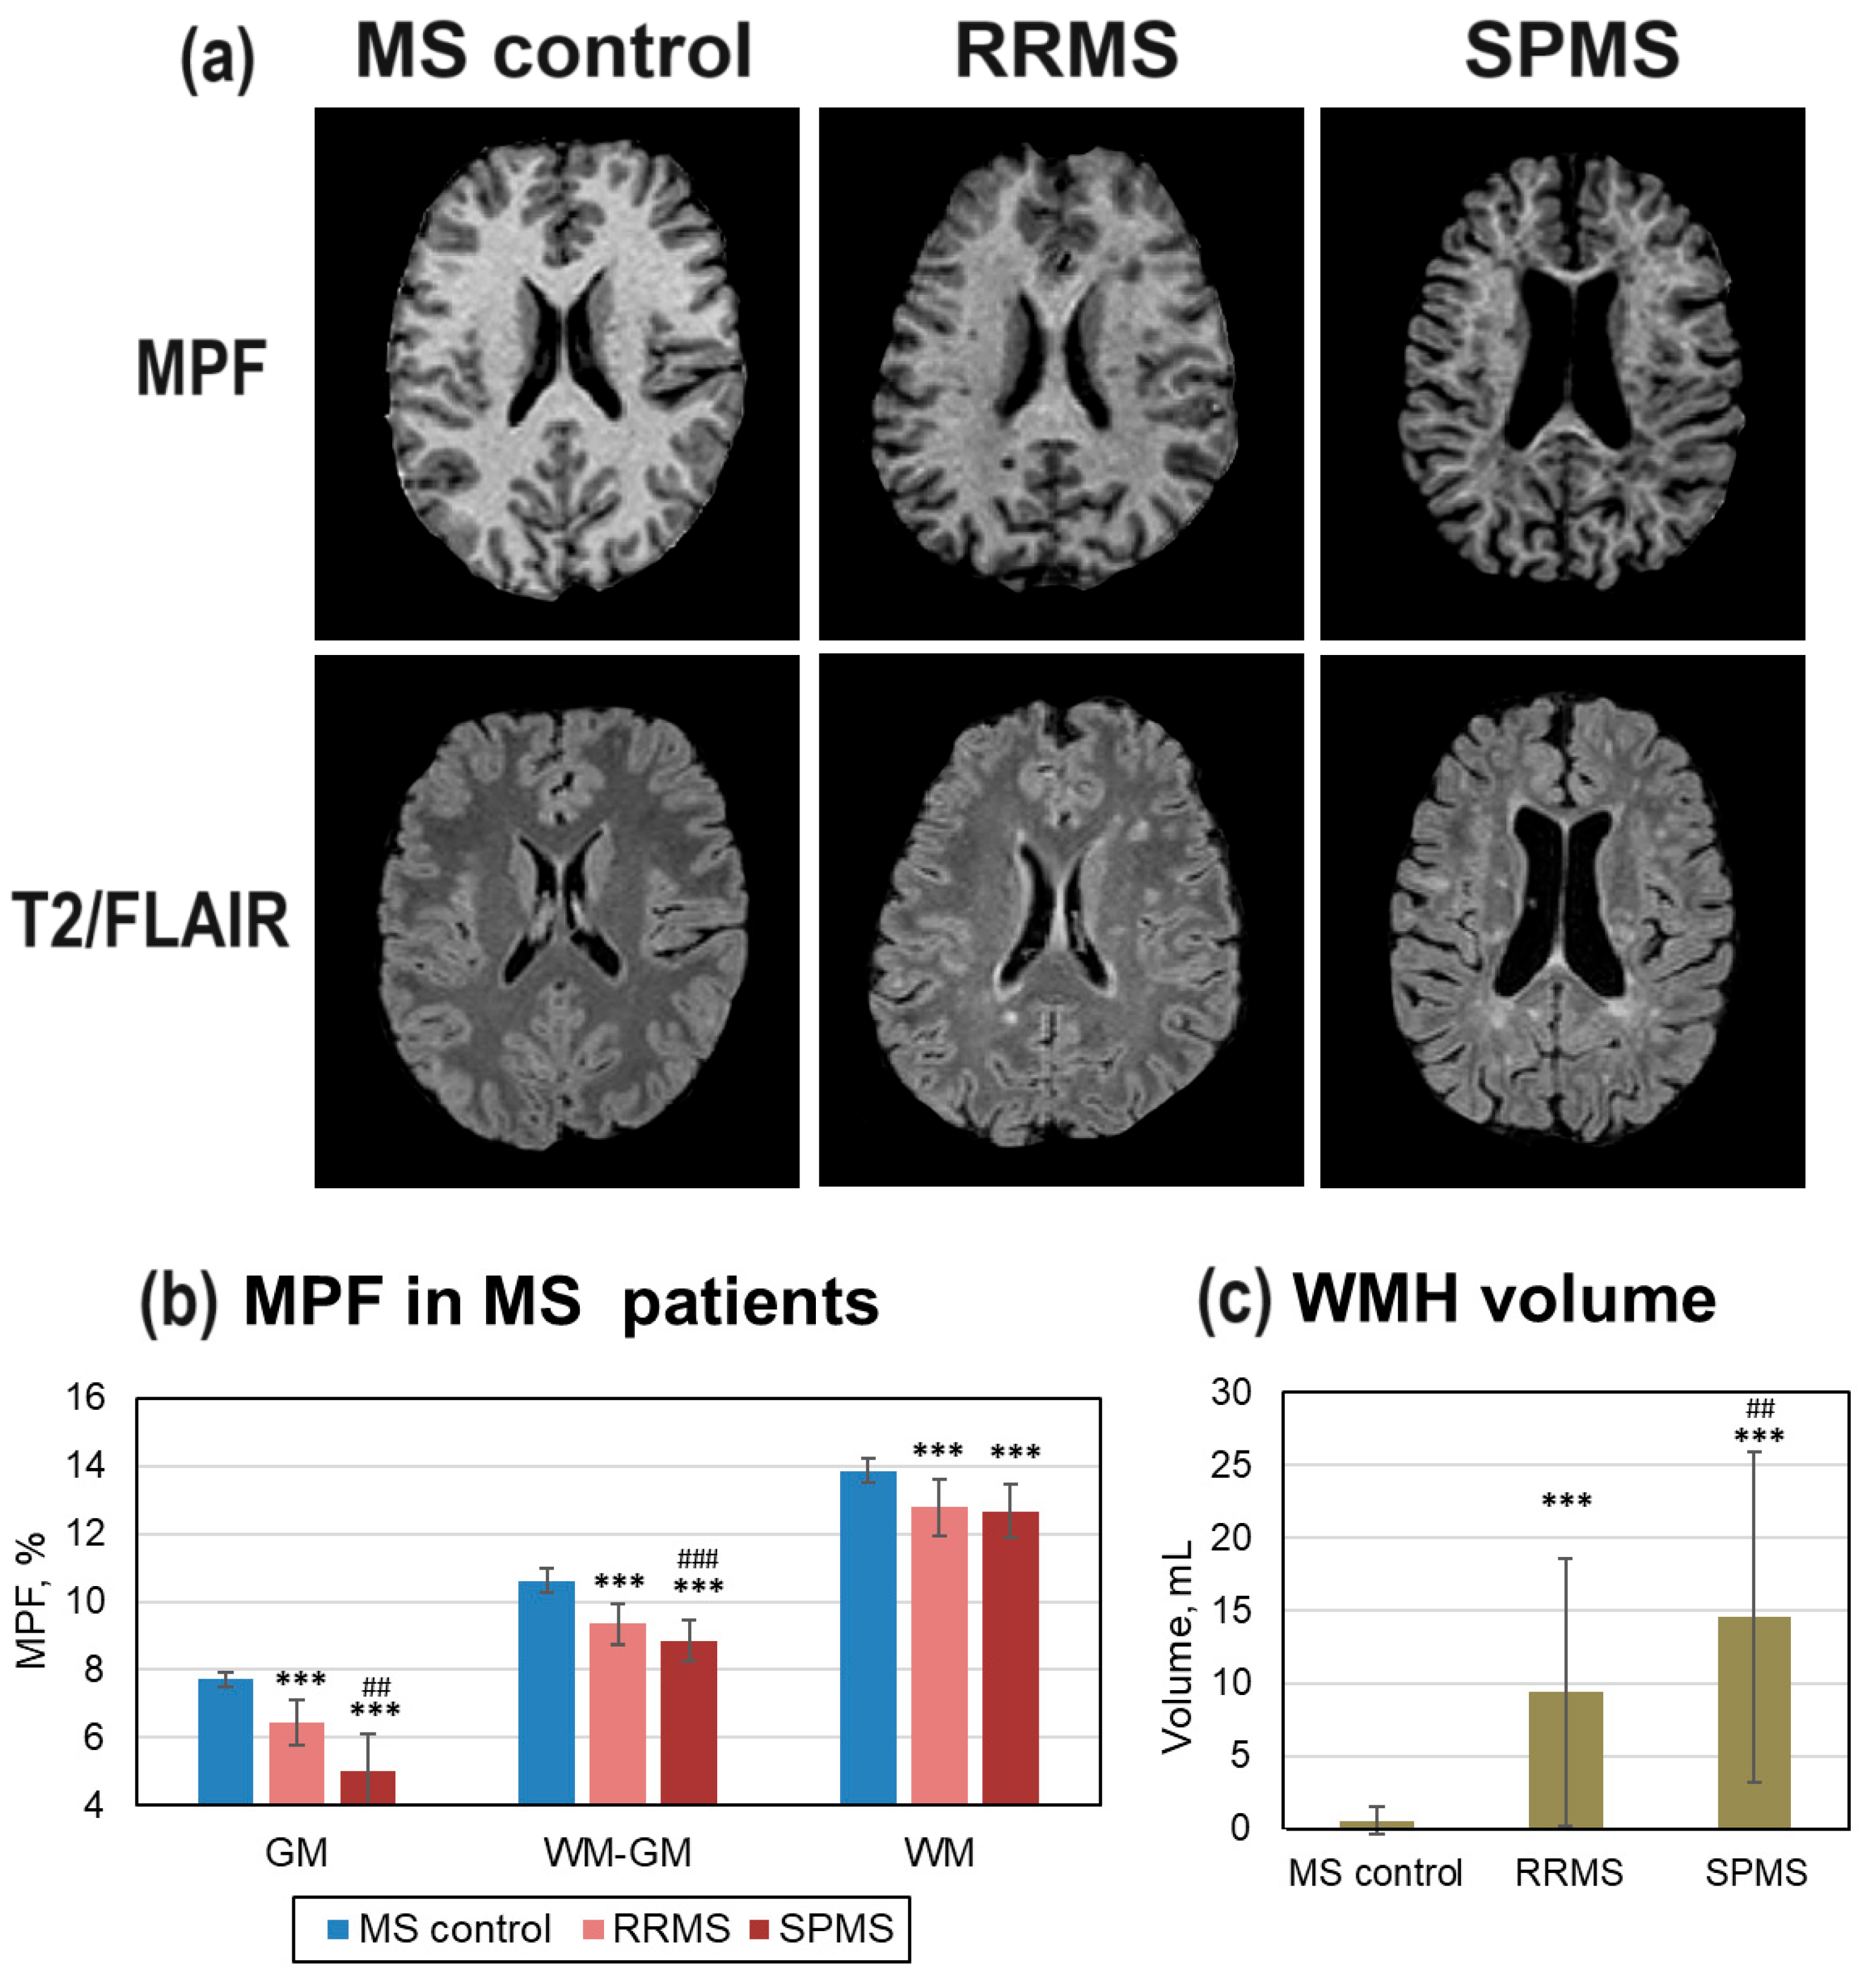
Figure 4.
Changes of brain myelination in PD patients: (a) Example MPF maps of healthy participant (PD control, male, 73 years) and PD patient (male, 70 years). (b) MPF decrease in global GM, WM, and WM-GM compartments in PD patients relative to healthy participants (PD control). (c) WMH volume changes in PD patients relative to controls. Error bars denote standard deviation. Significant relative to the PD control group: * - p < 0.05, ** - p < 0.01.
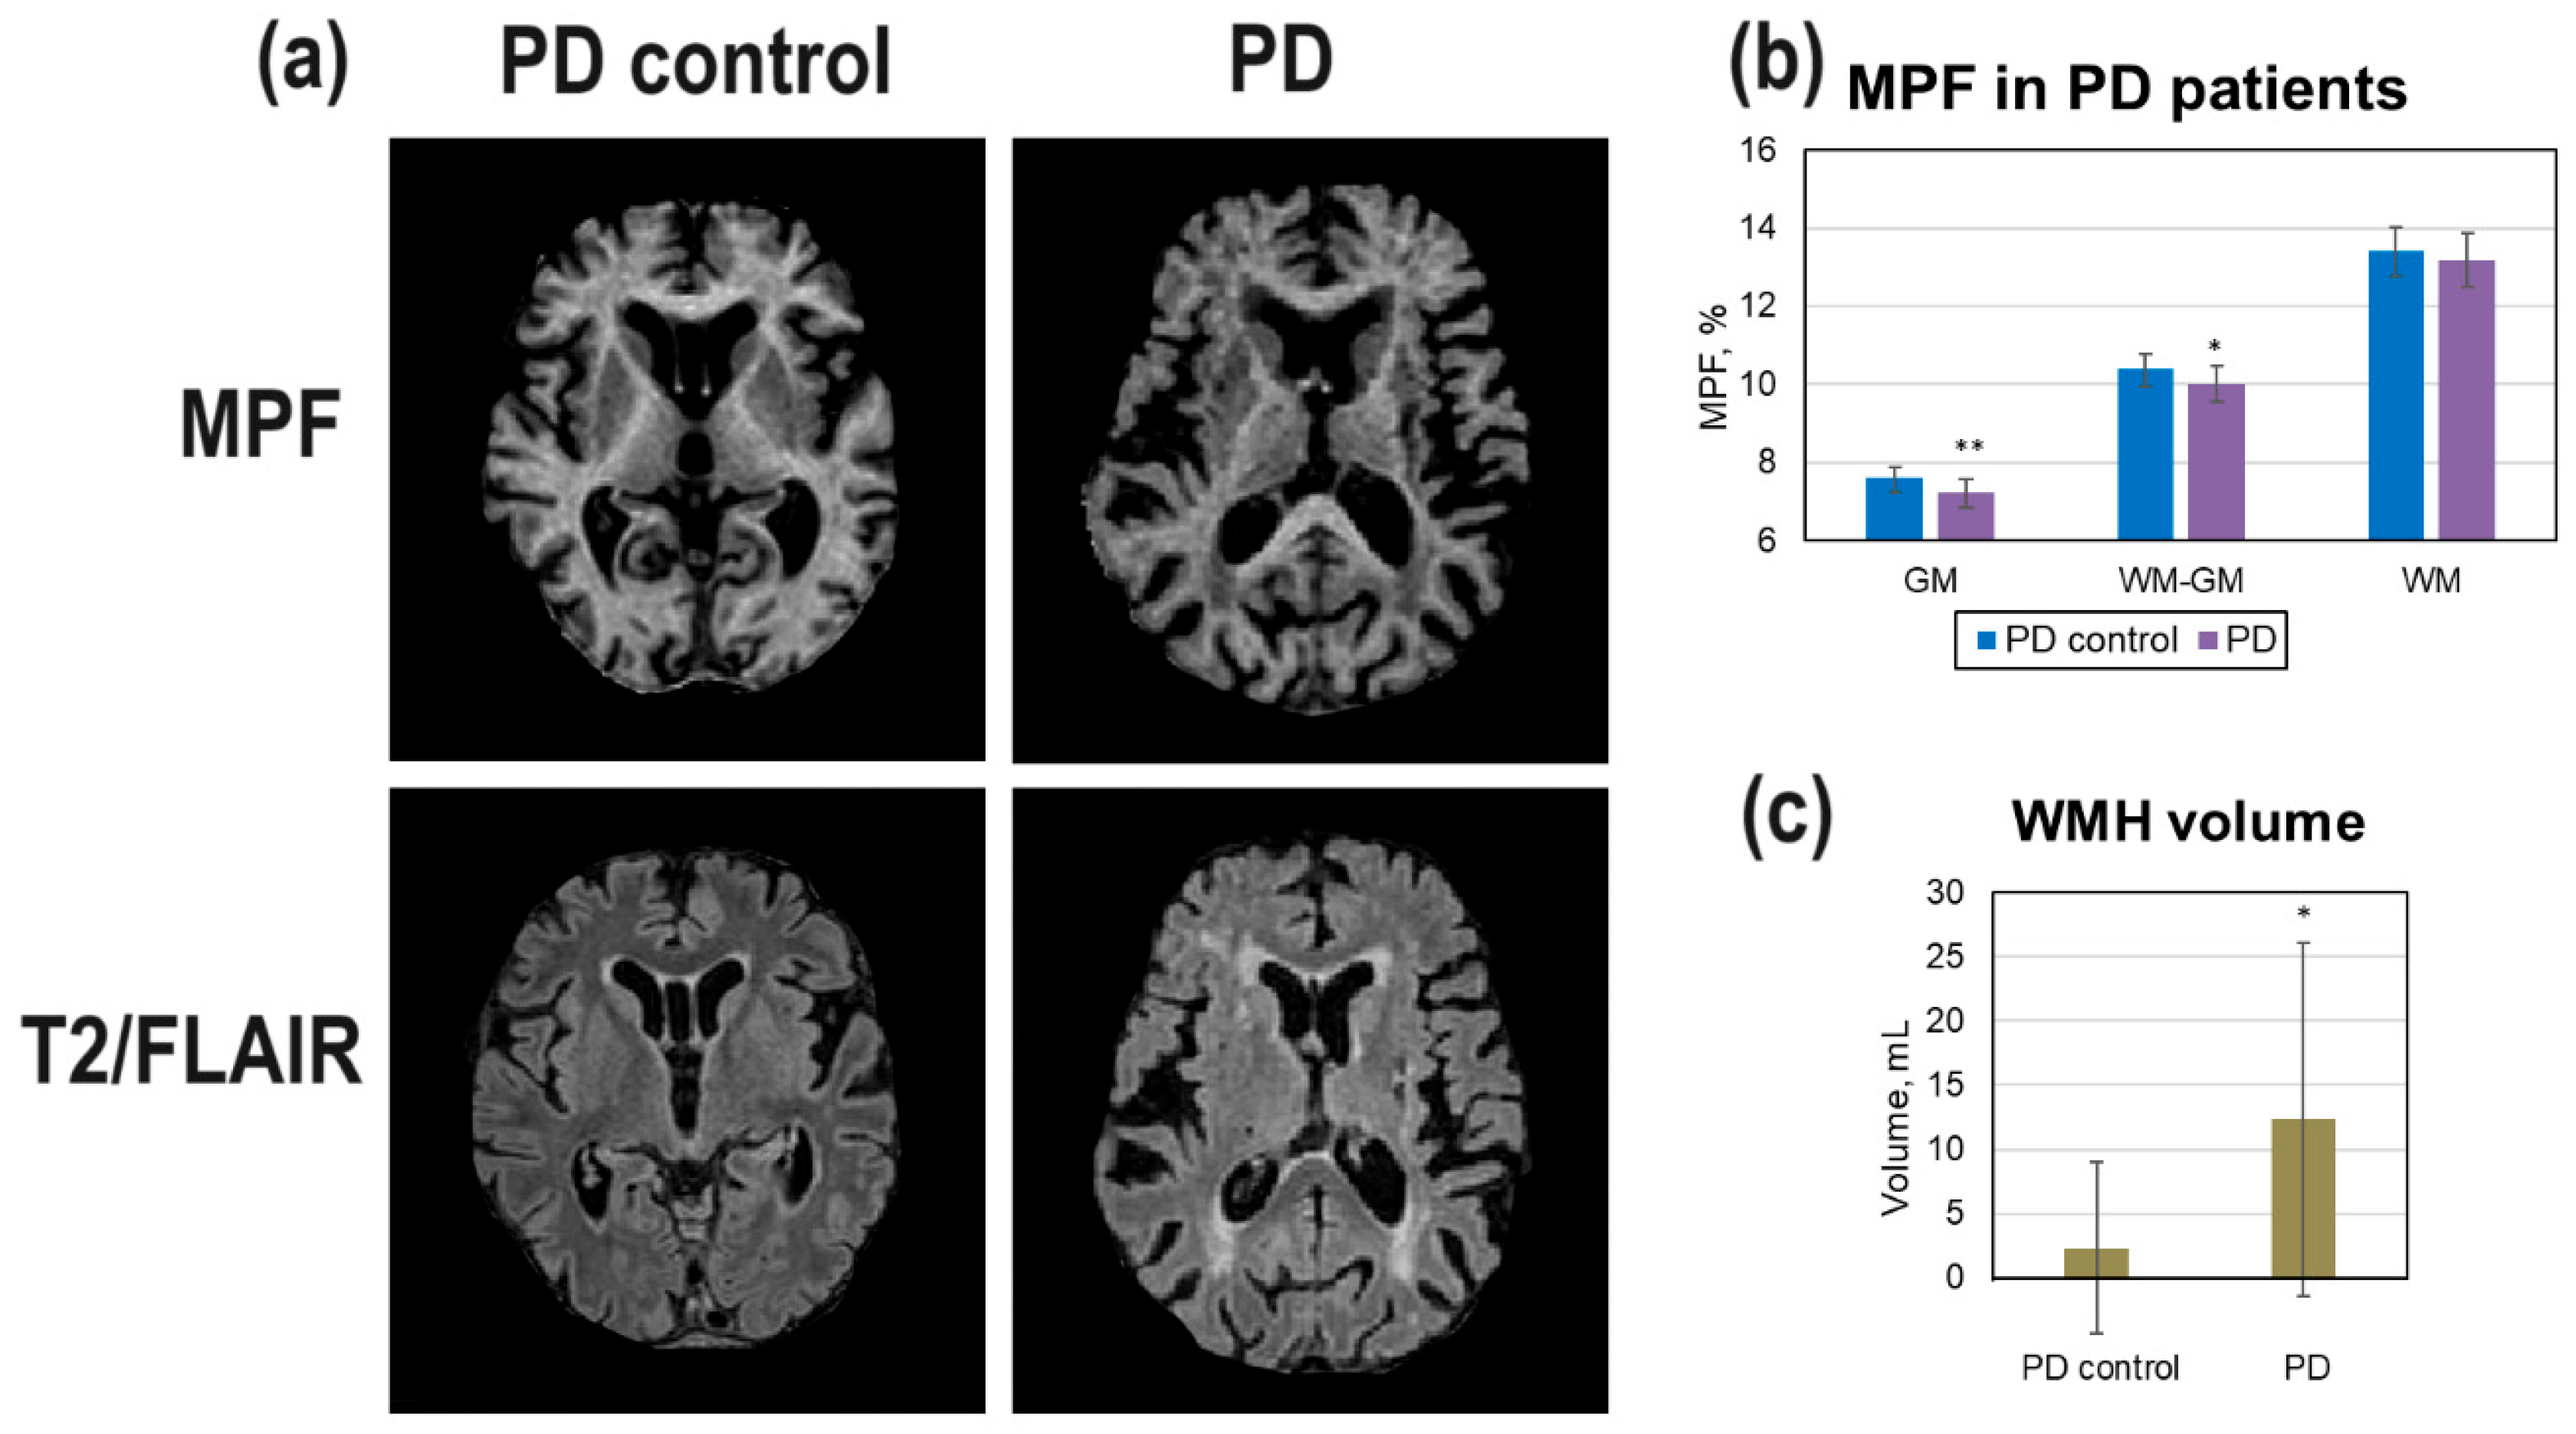
Figure 5.
Global changes of brain myelination in LC patients: (a) Example MPF maps of healthy participant (LC control, male, 46 years), LC patient with cognitive impairment (male, 48 years), and LC patient with depression (male, 46 years). (b) Number of examined LC patients with clinically diagnosed specific LC symptoms of depression, chronic headache, hyposmia/anosmia, mild cognitive impairment, and insomnia. (c) WMH volume in LC patients with specific symptoms. (d-f) MPF changes in global GM, WM, and WM-GM compartments in LC patients with specific symptoms relative to healthy participants (LC control). Error bars denote standard deviation. Significant differences relative to the LC control group: * - p < 0.05, ** - p < 0.01, *** - p < 0.001.
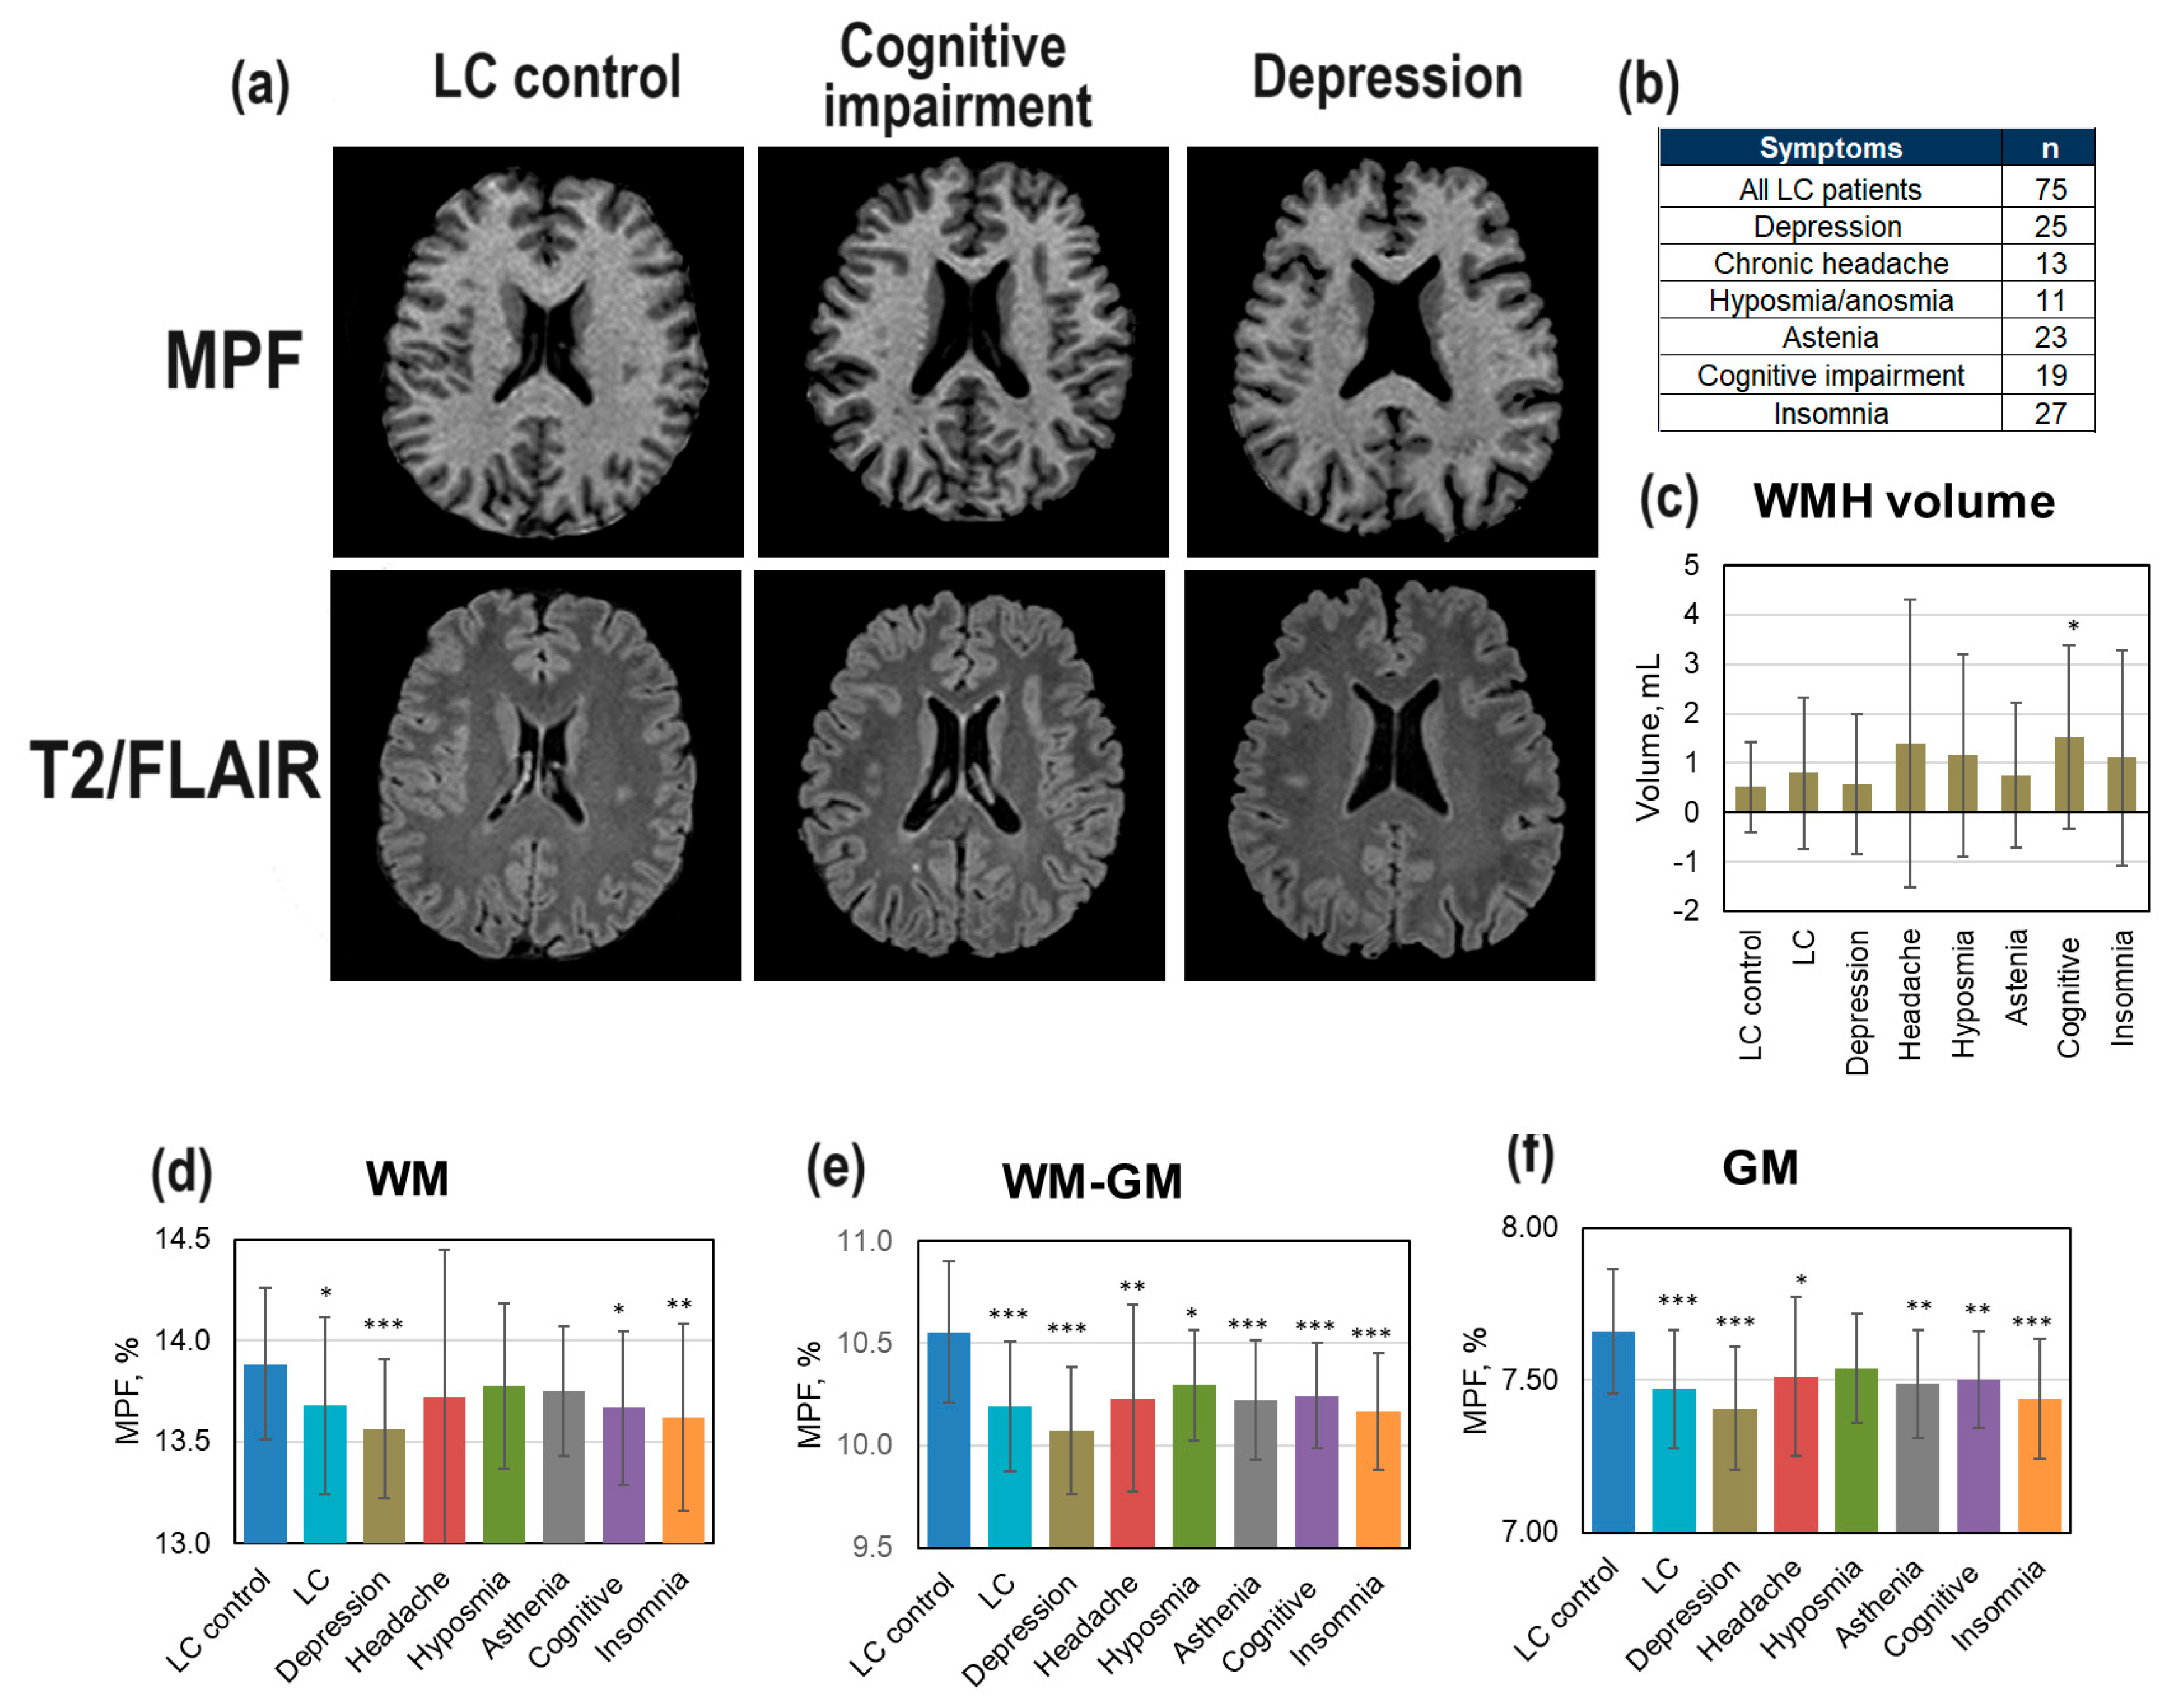
Figure 6.
Age- and disease-related percentage changes in brain myelination relative to matched controls for MS, PD, LC patients and relative to participants aged 35-44 years for the youngest (18-24 years) and oldest (75-85 years) participants. (a) – Percentage changes in MPF. (b) – Percentage changes in WMH volumes. Significant differences relative to controls: * - p < 0.05, ** - p < 0.01, *** - p < 0.001. Error bars correspond to SD.
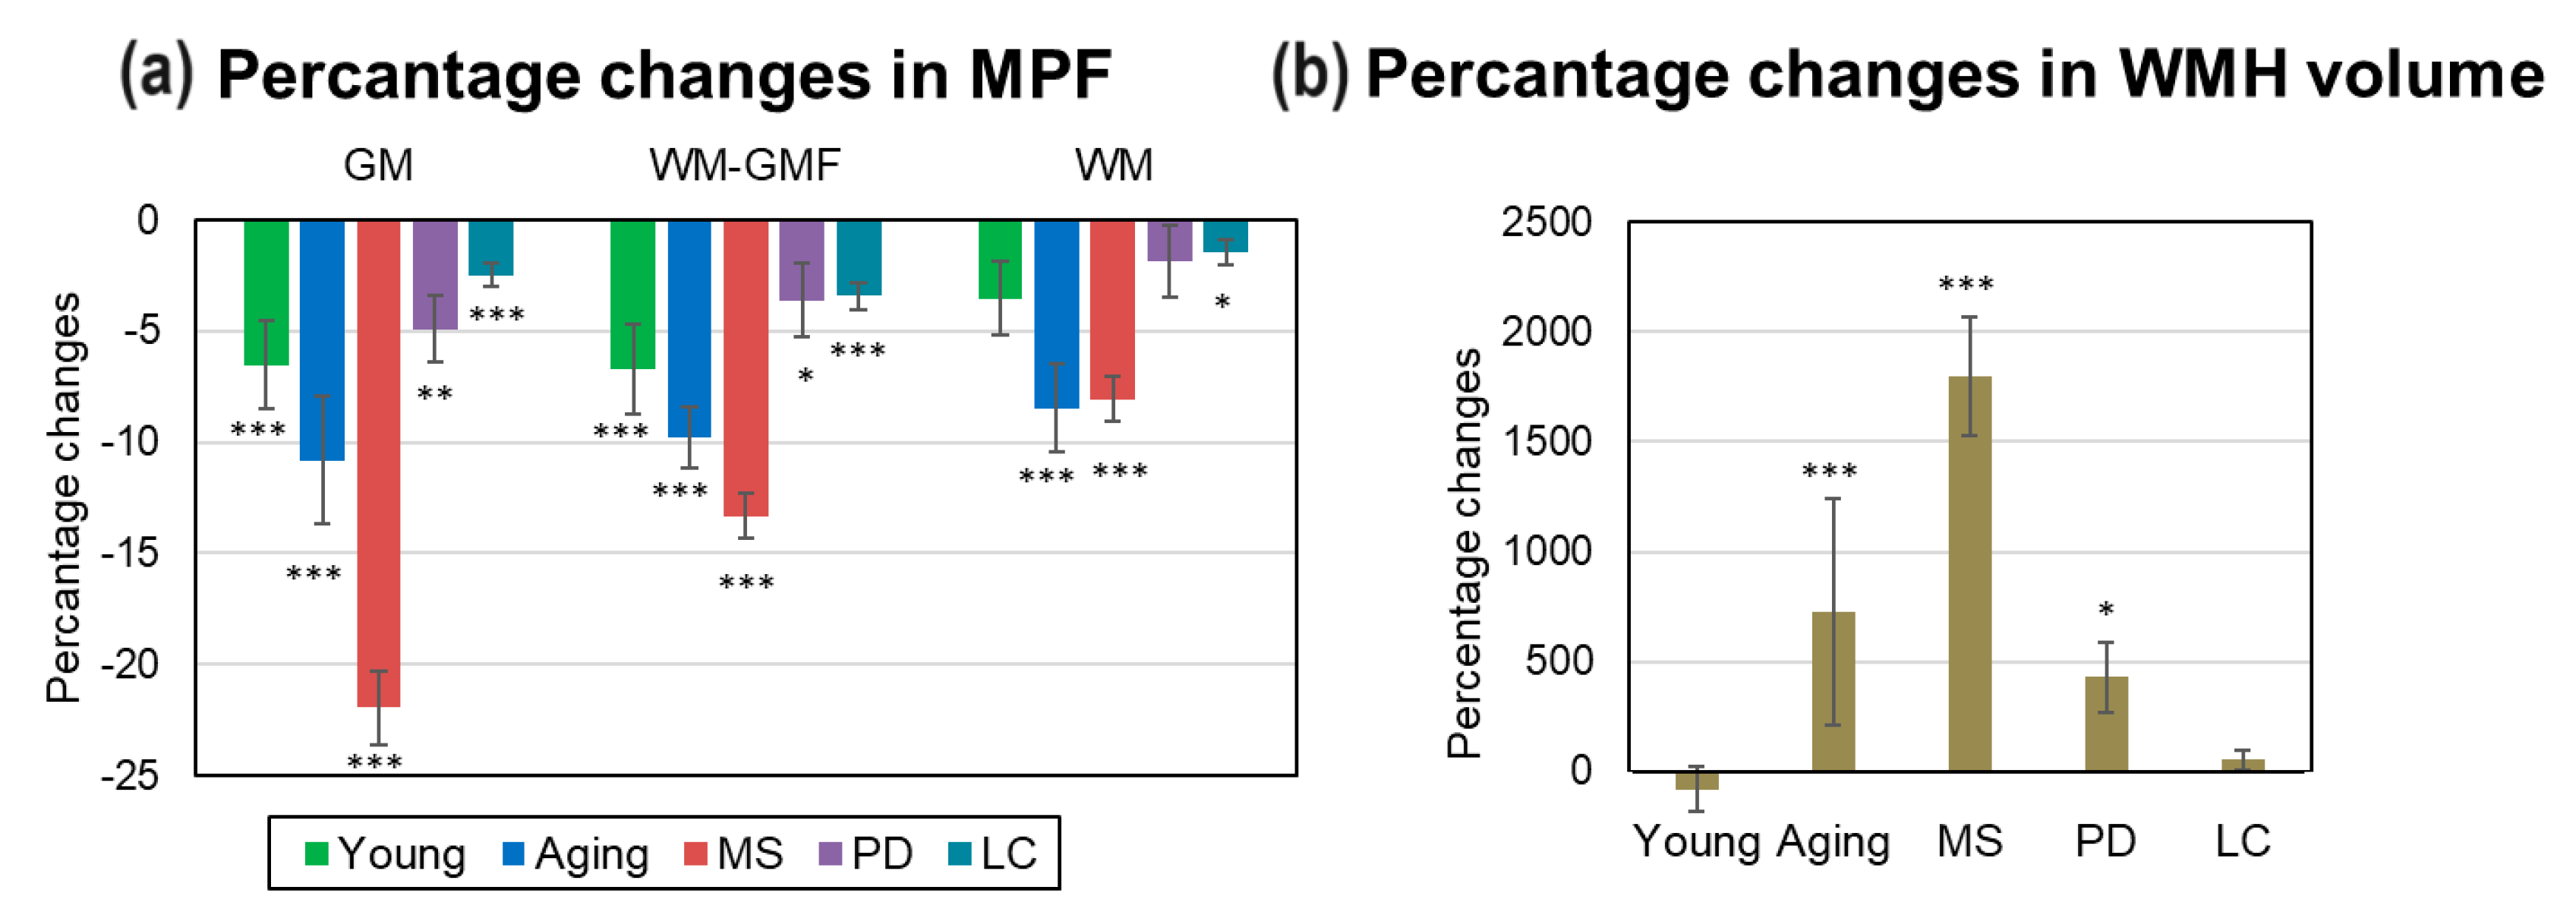

Table 1.
The demographic and clinical characteristics of the patients and controls.
| Parameter | MS | PD | LC | Control |
|---|---|---|---|---|
| Sample size | 42 | 16 | 75 | 63 |
| Male (%)/Female (%) | 9(21)/33(79) | 5(31)/11(69) | 25(17)/50(83) | 27(43)/36(57) |
| Age, years±SD | 39.0±9.5 | 69.7±9.1 | 40.9±9.9 | 41.7±18.9 |
| Age, median (min-max) | 39(25-67) | 70(51-85) | 42(19-61) | 40(18-85) |
| Disease duration, years±SD | 9.0±5.7 | 9.8±3.9 | 1.8±0.82 | - |
| Disease severity, parameters (%) |
RR/SP (71/29) |
stage1 1/2/3/4 (6/19/50/25) | mild/moderate/severe/critical3 (75/11/11/3) |
- |
Data are presented as mean±SD. Significant differences relative the Control group: * - p<0.05 (Chi-square criteria). 1 – stage of PD according to the Hoehn and Yahr scale; 2 – time after recovery from the first COVID-19 episode; 3 – severity of COVID-19 caused LC.
Table 2.
Selection of age- and gender-matched control groups for patients.
| Disease | Sample | n | Male, n (%) | Female, n (%) | Age, years±SD | Age, median (min-max) |
| MS | patients | 42 | 9 (21) | 33(79) | 39.0±9.5 | 39 (25 - 67) |
| control | 36 | 12 (33) | 24 (67) | 41.1±10.4 | 40 (22 – 67) | |
| PD | patients | 16 | 5(31) | 11(69) | 69.7±9.1 | 70 (51 – 85) |
| control | 17 | 6 (35) | 11 (65) | 65.3±9.7 | 67 (51 – 85) | |
| LC | patients | 75 | 25 (33) | 50 (67) | 40.9±9.9 | 42 (19 – 61) |
| control | 42 | 17 (40) | 25 (60) | 39.9±12.0 | 40 (18 – 61) |
Disclaimer/Publisher’s Note: The statements, opinions and data contained in all publications are solely those of the individual author(s) and contributor(s) and not of MDPI and/or the editor(s). MDPI and/or the editor(s) disclaim responsibility for any injury to people or property resulting from any ideas, methods, instructions or products referred to in the content. |
© 2025 by the authors. Licensee MDPI, Basel, Switzerland. This article is an open access article distributed under the terms and conditions of the Creative Commons Attribution (CC BY) license (http://creativecommons.org/licenses/by/4.0/).
Copyright: This open access article is published under a Creative Commons CC BY 4.0 license, which permit the free download, distribution, and reuse, provided that the author and preprint are cited in any reuse.


