Submitted:
12 December 2025
Posted:
15 December 2025
You are already at the latest version
Abstract
Water is essential for human life, and access to clean water is considered a basic human right by the United Nations. Around the world, a high proportion of the population still does not have access to safe fresh water, with a high impact on health. This situation perpetuates a cycle of poverty, hindering economic development and exacerbating inequality. The water is considered unsafe to drink if it is contaminated. The contamination can be categorized into three types: physical, chemical, and biological. Biological contamination arises from the presence of living organisms in water, such as bacteria, viruses, algae, fungi, and parasites. Recently, the scientific community has raised the alarm on contamination caused by a large group of bacteria known as Cyanobacteria, which can release harmful toxins in water, including mycotoxins like Microcystin-LR (MC-LR). In this context, we present the application of fluorescence correlation spectroscopy (FCS) to develop a competitive assay for detecting the presence of traces of the MC-LR toxin in fresh water.
Keywords:
Cyanobacteria bloom
; fluorescence correlation spectroscopy (FCS)
; immunoassay
; microcystin
1. Introduction
Water is a finite resource essential to human life, agriculture and industry. Access to safe and uncontaminated water is essential for human life. However, in different parts of the world, many communities still have problems of lacking water, or they have access only to contaminated water with serious health risks, environmental impacts, and economic consequences [1].
The water contamination can arise from various sources, such as industrial and agricultural waste, sewage, and natural events like hurricanes and floods. The contamination is generally classified based on its origins: physical, chemical, and biological. All these types of contaminations produce unsafe drinking water. Biological contamination is originated by the presence of living organisms in water, like bacteria, viruses, algae, fungi, and parasites. These contaminants can lead to severe health issues, including gastrointestinal illnesses, skin infections, and respiratory diseases. Recently, the scientific community has raised alarms about contamination caused by a group of bacteria known as Cyanobacteria [2]. The Cyanobacteria are photosynthetic prokaryotic microorganisms that live in diverse range of environments, from freshwater to marine ecosystems. The uncontrolled growth of this bacterium due to anthropogenic factors (nutrient over-enrichment of water ecosystem degradation, increase in water temperature, and increase in the CO2 level in the atmosphere) led to the Cyanobacteria bloom phenomenon [2]. Cyanobacteria belonging to the genera Microcystis, Anabaena, Planktothrix, and Nostoc can produce and release in water harmful toxin molecules named Microcystins (MCs).
Belonging the MCs family, the most toxic molecule is the microcystin-LR (MC-LR). Due to its high toxicity the World Health Organization (WHO) has identified the provisional value of the maximum amount of MC-LR assumption. It has been set for drinking water at 1.0 μg/L and a daily intake value (TDI) of 0.04 μg/kg MC-LR/body weight [2].
The most common methods used to detect MC-LR include chromatographic methods (HPLC, LC/MS, GC/MS), immunological methods (ELISA), and protein phosphatase inhibition assays (PPIA) [3]. Recently, a competitive Förster resonance energy transfer (FRET) to detect the presence of MCs in solution has been developed [4].
Several studies have shown the effectiveness of Fluorescence correlation spectroscopy (FCS) to address fundamental questions in biology [5,6,7,8,9,10,11,12]. Furthermore, some studies have used this technique to identify the presence of specific molecules, such as allergens, toxins and antibiotics, in various matrices [13,14].
In this work, we present a competitive FCS assay to detect the presence of MC-LR traces in fresh water.
2. Materials and Methods
2.1. Materials
MC-LR mouse monoclonal antibody (clone MC10E7; ref. #ALX-804-320-C200) and t Microcystin-LR (ref. # ALX-350-012-M001) were purchased from Enzo Life Sciences (Enzo Life Sciences Inc., Farmingdale, NY, USA). Bovine serum albumin microcystin-LR (MC-LR BSA) conjugate (ref. # DAGHY010) was purchased from Creative Diagnostics (Creative Diagnostics, Shirley, NY, USA), while CF488 fluorescent dye was purchased from Biotium (Biotium Inc., Fremont, CA, USA). The microplates (96-well), C8 lock-well maxisorp Nunc (ref. cod. 446469), were purchased from Thermo Fisher Scientific Inc. (Waltham, MA, USA). Goat polyclonal IgG-HRP secondary antibody used in the ELISA experiments was purchased from Abcam (Abcam plc., Oregon, OR, USA). Polyclonal antibody anti-Ovalbumin, used as a control in the experiments, was purchased from Covalab (Bron, France). Sephadex G25 chromatographic resin was purchased from Sigma-Aldrich (Sigma-Aldrich S.r.l., Milan, Italy). All other chemicals were commercial samples of the purest quality.
2.2. Preparation of the MC-LR BSA Labeling with CF488 Dye
MC-LR BSA was labeled with the fluorescent probe CF488 following the method described by Capo [4]. In brief, the conjugate was dissolved in 0.10 mL of 20 M sodium phosphate buffer, pH 7.4, at a concentration of 2.0 mg/mL and mixed with CF488 (molar dye-antibody ratio: 12:1) dissolved in dimethyl sulfoxide (DMSO). The obtained mixture was adjusted to pH 8.3, and the reaction was stirred in the dark at room temperature for 1 hour. After the incubation period, the labeled conjugate, MC-LR BSA 488, was purified from any unreacted CF488 dye using a Sephadex™ G25 column. The chromatography was performed with a solution of 20 mM sodium phosphate and 150 mM NaCl at pH 7.4. Fractions of 50 µL each were collected and analyzed using a Jasco V-550 spectrophotometer (wavelength range: 220 nm-500 nm). The fractions containing a peak corresponding to the CF488 dye were pooled, filtered, and concentrated using a Vivaspin® 500 (Sartorius AG, Göttingen, Germany).
2.3. Indirect ELISA Test
To evaluate the effect of the labeling process on the anti-MC-LR antibody, their binding capability was investigated by indirect ELISA test. The test was preformed according to El Kojok H et al [15]. In brief, 50 μL of the MC-LR BSA 488 solution, diluted in the coating buffer at pH 9.6, was added to each well and incubated overnight at 4 °C. After overnight incubation and washed step (three times with a solution of 200 μL TBS at pH 7.4 for 10 min), the plate was incubated with a 100 μL blocking solution (TBS, 5% skim milk) for 1 h at 37 °C. After this incubation, the wells were washed three times with a solution of 200 μL TBS-0.05% Tween 20. A solution of anti-MC-LR at 1.0 μg/mL (50 μL) was added to each well followed by incubation at 37 °C for 1 h. The wells were washed three-times with a solution of 200 μL TBS-0.05% Tween 20 at pH 7.4 for 10 min, then a solution of 50 μL of diluted anti-mouse secondary antibody, at a concentration of 1 μg/mL, was added to each well and incubated at 37 °C for 1 h. A solution of 100 μL of the 3,3′, 5,5′-tetramethylbenzidine (TMB) per individual well was added and incubated at room temperature for 10 min. Finally, a 100 μL stop solution was added to the wells (2.5 M HCl), and the absorbance at 450 nm was measured by Tecan Infinite 200 PRO plate reader (Tecan Group Ltd., Männedorf, Switzerland).
2.4. Fluorescence Steady-State Measurements
Fluorescence steady-state experiments were performed using the ISS K2 fluorometer (ISS Inc., Champaign, Illinois, USA) equipped with a temperature-controlled sample holder. The stock solution of MC-LR BSA 488 was diluted to a final optical density of 0.07 O.D. at 488nm to prevent the inner filter effect [16]. Excitation was fixed at 488 nm, and emission spectra were recorded from 500 nm to 600 nm in 1.0 nm intervals at a scan speed of 100 nm/min, using a 1.0 cm light path fluorescence quartz cuvette. Both the excitation and emission slit widths were set at 2 nm. The MC-LR BSA 488 emission spectra were carried out at 25 °C, in PBS buffer at pH 7.4, with a final volume of 750 μL.
2.5. Fluorescence Correlation Spectroscopy (FCS) Experiments
The FCS measurements were performed on Alba V, the dual-channel fluorescence correlation instrument from ISS (ISS Inc., Champaign, Illinois, USA). The instrument combines a confocal scanning microscope with FCS, and it uses avalanche photodiodes as detectors. It is equipped with a Nikon inverted microscope and with a laser launcher with two lasers (488 nm and 640 nm); the output of each laser is aligned to a single-mode fiber to produce a Gaussian profile laser beam to be delivered to the instrument. Nikon high-numerical-aperture (NA) water objective (60×; NA 1.2) and focused on the solution sample. The resulting fluorescence was collected through the same objective and separated from the laser light by a dichroic mirror (Croma). A 50-μm pinhole was used in the confocal detection channel. All pinhole adjustments, shutters, optics, filter wheels, XYZ-fine positioning of the stage, and positioning of the objective are computer-controlled through the Vista Analysis Software program (ISS Inc., Champaign, Illinois, USA). The alignment of the instrument and the characteristics of the confocal beam were validated using rhodamine 110, which has a known diffusion coefficient of 430 μm²/s [17,18]. All measurements were performed at room temperature, and the obtained data were analyzed with the Vista Analysis Software program (ISS Inc., Champaign, Illinois, USA).
2.5.1. FCS Binding Analysis
The antibody binding measurements were performed by diluting MC-LR BSA 488 in PBS buffer at pH 7.4 to a final volume of 100 µL, then incubating with increasing concentrations of anti-MC-LR (0.0-125 nM). For each concentration, before performing the FCS measurements, the samples were incubated in the dark condition and at room temperature for 30 minutes.
2.5.2. FCS Competitive Assay
The monoclonal antibody anti-MC-LR (125 nM) was incubated for 30 minutes with increasing concentration of unlabeled MC-LR (from 0.1 to 20 nM). At the end of this incubation step, BSA-MC-LR 488 was added, incubated for 30 minutes at room temperature, and then FCS measurements were performed.
2.5.3. Specify of FCS Assay
To evaluate the specificity of the assay, the measurement was performed using a different antibody. For this purpose, the polyclonal antibody anti-ovalbumin (125 nM) was incubated for 30 minutes with 20 nM of MC-LR. At the end of this incubation step, MC-LR BSA 488 was added, incubated for 30 minutes in dark conditions at room temperature, and then the FCS measurements were performed.
2.5.4. FCS Data Analysis
All collected data were analyzed using the Vinci Analysis Software program (ISS Inc., Champaign, Illinois, USA). Specifically, a fitting model based on a three-dimensional Gaussian and two species observation volume was employed (Equation 1).
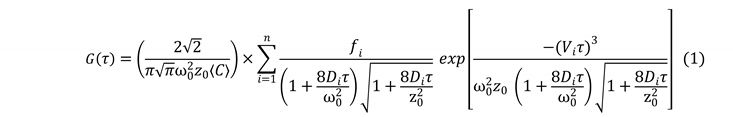
In this equation, G(τ) represents the autocorrelation function, C is the concentration of the fluorescence molecule, w0 is the beam waist, z0 is the beam height, D is the diffusion coefficient, V is the excitation volume, Π is Archimedes ‘constant, and τ is the time diffusion.
2.6. Statistical Analysis
Fluorescence measurements and ELISA experiments were performed in triplicate; then, means and standard deviation (SD) were calculated. For the assay performance was determined according to Shrivastava (LoD = 3.3 S/b) [19]. The graphs were realized by Excel 2016 Microsoft® and/or by Origin Pro® 8.0 software.
3. Results and Discussion
MCs are cyclic heptapeptides released in water from Cyanobacteria MC-LR is extremely toxic to human health. The chemical structure of MCs consists of a constant region made up of five amino acid residues and a variable region containing two amino acid residues [2]. In the case of MC-LR, the variable region contains arginine and leucine residues. We used a specific monoclonal antibody anti-MC-LR, which can recognize all the variants of the four-Arg microcystins. We focused our attention on the MC-LR due to its high prevalence in freshwater and its significant toxicity on health.
Figure 1 shows the FCS optical setup. It includes the confocal volume size (Figure 1A) and two analysis methods: autocorrelation analysis (AC) and photon counting histogram analysis (PCH) (Figure 1B and 1C).
MC-LR was conjugated to BSA and the MC-LR BSA complex was labeled with the fluorescence dye (CF488). The degree of labeling (DoL) of MC-LR BSA 488 was calculated from the absorption spectrum (data not shown) according to Varriale [12]. It was possible to estimate a labeling of three molecules of CF488 for one molecule of MC-LR BSA.
To evaluate the effect of the labeling process on the binding capacity of the anti-MC-LR to the MC-LR BSA 488, an indirect ELISA test was performed (Figure 2B). The results show that the anti-MC-LR bind the labeled conjugate MC-LR BSA 488 from 0.31 µg/mL to 10.0 µg/mL.
3.1. FCS Measurements: Binding Characterization
The interaction between MC-LR BSA 488 and anti-MC-LR antibodies was carried out in different steps. We investigated the diffusion of the MC-LR BSA 488 alone (Figure 3A black dots) and analyzed the obtained fluctuation data using the equation reported in the section 2 (3D Gaussian-2 species). We estimated a diffusion coefficient (D) value of 73.02 mm2/s. This value is consistent with the molecular weight of the BSA molecule as reported in literature and slightly different from the theoretical value considering the presence of MC-LR molecules [20].
Furthermore, we evaluated the formation of the complex anti-MC-LR/MC-LR BSA 488. For this purpose, the MC-LR BSA 488 was incubated with a higher concentration of mAb anti-MC-LR. Figure 3B shows the normalized autocorrelation curves obtained of the MC-LR BSA 488 in the absence and in the presence of anti-MC-LR (125 nM). The diffusion coefficient values, determined with the autocorrelation function, show a reduction of the diffusion coefficient value. Specifically, the diffusion coefficient values change from 73.02 μm²/s to 49.52 μm²/s when the antibody concentration reaches 125 nM. This change is consistent with the formation of a molecular complex similar in size to the anti-MC-LR/MC-LR BSA 488 complex (Table 1).
3.2. FCS Measurements: Competitive Assay
Figure 5A shows the plot of the change of the diffusion coefficient value versus MC-LR concentration. The increase of MC-LR concentration results in an increase of the value of the diffusion coefficient that becomes close to the value calculated in the absence of the MC-LR (Table 2).
In particular, the diffusion value changes from 48.82 µm2/s to 77.56 µm2/s. This behavior suggests the complete dissociation of the anti-MCL-LR/MC-LR BSA 488 complex in the presence of the MC-LR.
A linear correlation was observed over the range of 0.0 to 0.5 nM, whereas at higher concentrations (0.5 to 20 nM), no linear trend was observed. Therefore, the calibration curve was calculated in the linear range to determine the limit of detection (LoD). The LoD, calculated by 3.3 S/b, where S is the standard deviation of the y-intercept of the linear regression and b is the slope of the linear range [19], was estimated to be 0.18 nM (0.18 µg/L) (Figure 5B). These results suggest that the use of high-avidity monoclonal antibodies with the innovative fluorescence immunoassay allows for the detection of the presence of traces of MC-LR in fresh water.
4. Conclusions
In this work, we explored the application of FCS to determine the presence of traces of MC-LR in fresh water. The developed assay showed a LoD value of 0.18 nM (0.18 µg/L). This value is lower than the provisional limit value (1.0 μg/L) established by WHO.
Author Contributions
For research articles with several authors, a short paragraph specifying their individual contributions must be provided. The following statements should be used “Conceptualization, S.D. and A.V..; methodology, G.F..; software, A.V..; validation, G.F.., A.V.; formal analysis, A.V..; investigation, A.V..; resources, S.D..; data curation, A.V..; writing—original draft preparation, A.V..; writing—review and editing, S.D..; project administration, A.V..; funding acquisition, S.D. All authors have read and agreed to the published version of the manuscript.
Funding
Partial fundings were received from IBISBA 1.0 – Trans National Access (TNA) - CYANOFCS, “Cyanotoxins Study using Fluorescence Correlation Spectroscopy”.
Acknowledgments
The authors wish to thank Dr. Alessandro Capo for the ELISA test measurements.
Conflicts of Interest
The authors declare no conflicts of interest.
Abbreviations
The following abbreviations are used in this manuscript:
| FCS | Fluorescence Correlation Spectroscopy |
| MC-LR | Microcystin-LR |
| BSA | Bovine Serum Albumin |
| WHO | World Health Organization |
| AC | Autocorrelation analysis |
| PCH | Photon Counting Histogram Analysis |
| OVA | Ovalbumin |
| ELISA | Enzyme-Linked Immunosorbent Assay |
References
- Ali, G.; Bashir, M.K.; Abbas, S.; Murtaza, M. Drinking-water efficiency, cost of illness, and peri-urban society: An economic household analysis. PLoS One 2021, 29, e0257509. [Google Scholar] [CrossRef] [PubMed]
- Merel, S; Walker, D; Chicana, R; Snyder, S; Baurès, E; Thomas, O. State of knowledge and concerns on cyanobacterial blooms and cyanotoxins. Environ Int. 2013, 59, 303–27. [Google Scholar] [CrossRef] [PubMed]
- Sangolkar, L.N.; Maske, S.S.; Chakrabarti, T. Methods for determining microcystins (peptide hepatotoxins) and microcystin-producing cyanobacteria. Water Res. 2006, 40, 3485–3496. [Google Scholar] [CrossRef] [PubMed]
- Capo, A.; Pennacchio, A.; Montagnese, C.; Hadjiantonis, A.; Demosthenous, P.; Giusti, A.; Staiano, M.; D’Auria, S.; Varriale, A. A Förster Resonance Energy Transfer (FRET)-Based Immune Assay for the Detection of Microcystin-LR in Drinking Water. Sensors 2024, 24, 3204–3214. [Google Scholar] [CrossRef] [PubMed]
- Magde, D.; Elson, E.; Webb, WW. Thermodynamic Fluctuations in a Reacting System - Measurement by Fluorescence Correlation Spectroscopy. Physical Review Letters 1972, 29, 705–708. [Google Scholar] [CrossRef]
- Berland, KM. Fluorescence correlation spectroscopy: new methods for detecting molecular associations. Biophys J. 1997, 72, 1487–1488. [Google Scholar] [CrossRef] [PubMed]
- Ries, J.; Schwille, P. Fluorescence correlation spectroscopy. Bioessays. 2012, 34, 361–368. [Google Scholar] [CrossRef] [PubMed]
- Frieden, C.; Chattopadhyay, K.; Elson, E.L. What fluorescence correlation spectroscopy can tell us about unfolded proteins. Adv Protein Chem. 2002, 62, 91–109. [Google Scholar] [PubMed]
- Ghosh, A.; Enderlein, J. Advanced fluorescence correlation spectroscopy for studying biomolecular conformation. Curr Opin Struct Biol. 2021, 70, 123–131. [Google Scholar] [CrossRef] [PubMed]
- Smith, AW. Recent applications of fluorescence correlation spectroscopy in live cells. Curr Opin Chem Biol. 2024, 81, 102480–102500. [Google Scholar] [CrossRef] [PubMed]
- Porciani, D.; Alampi, M.M.; Abbruzzetti, S.; Viappiani, C.; Delcanale, P. Fluorescence Correlation Spectroscopy as a Versatile Method to Define Aptamer-Protein Interactions with Single-Molecule Sensitivity. Anal Chem. 2024, 9, 137–144. [Google Scholar] [CrossRef] [PubMed]
- Varriale, A.; Marabotti, A.; Mei, G.; Staiano, M.; D’Auria, S. Correlation spectroscopy and molecular dynamics simulations to study the structural features of proteins. PLoS One 2013, 4, 64840. [Google Scholar]
- Varriale, A.; Rossi, M.; Staiano, M.; Terpetschnig, E.; Barbieri, B.; Rossi, M.; D’Auria, S. Fluorescence correlation spectroscopy assay for gliadin in food. Anal Chem. 2007, 15, 4687–4689. [Google Scholar] [CrossRef] [PubMed]
- Varriale, A.; Staiano, M.; Iozzino, L.; Severino, L.; Anastasio, A.; Cortesi, M.L.; D’Auria, S. FCS-based sensing for the detection of ochratoxin and neomycin in food. Protein Pept Lett. 2009, 16, 1425–1428. [Google Scholar] [CrossRef] [PubMed]
- El Kojok, H.; El Darra, N.; Khalil, M.; Capo, A.; Pennacchio, A.; Staiano, M.; Camarca, A.; D’Auria, S.; Varriale, A. Fluorescence polarization assay to detect the presence of traces of ciprofloxacin. Sci Rep. 2020, 12, 4550–4556. [Google Scholar] [CrossRef] [PubMed]
- Lakowicz, J.R. Principles of Fluorescence Spectroscopy, 3rd ed.; Springer: New York, NY, USA, 2006; pp. 27–472. [Google Scholar]
- Zhang, X.; Poniewierski, A.; Jelińska, A.; Zagożdżon, A.; Wisniewska, A.; Hou, S.; Hołyst, R. Determination of equilibrium and rate constants for complex formation by fluorescence correlation spectroscopy supplemented by dynamic light scattering and Taylor dispersion analysis. Soft matter 2016, 12, 8186–8194. [Google Scholar] [CrossRef] [PubMed]
- Gendron, P. O.; Avaltroni, F.; Wilkinson, K. J. Diffusion coefficients of several rhodamine derivatives as determined by pulsed field gradient-nuclear magnetic resonance and fluorescence correlation spectroscopy. Journal of fluorescence 2008, 18, 1093–1101. [Google Scholar] [CrossRef] [PubMed]
- Shrivastava, A. Methods for the determination of limit of detection and limit of quantitation of the analytical methods. Chron. Young Sci. 2011, 2, 21–25. [Google Scholar]
- Pabbathi, A.; Patra, S.; Samanta, A. Structural transformation of bovine serum albumin induced by dimethyl sulfoxide and probed by fluorescence correlation spectroscopy and additional methods. Chemphyschem 2013, 14, 2441–2449. [Google Scholar] [CrossRef] [PubMed]
Figure 1.
Fluorescence correlation spectroscopy (FCS) setup. In the general FCS optical setup, a laser is focused to a diffraction-limited spot using a high-numerical-aperture objective lens. Emitted light is collected through a confocal pinhole, defining a small observation volume of approximately 0.2 femtoliters (A). Fluctuations analysis using autocorrelation (AC) analysis (B) and photon counting histogram (PCH) analysis (C).
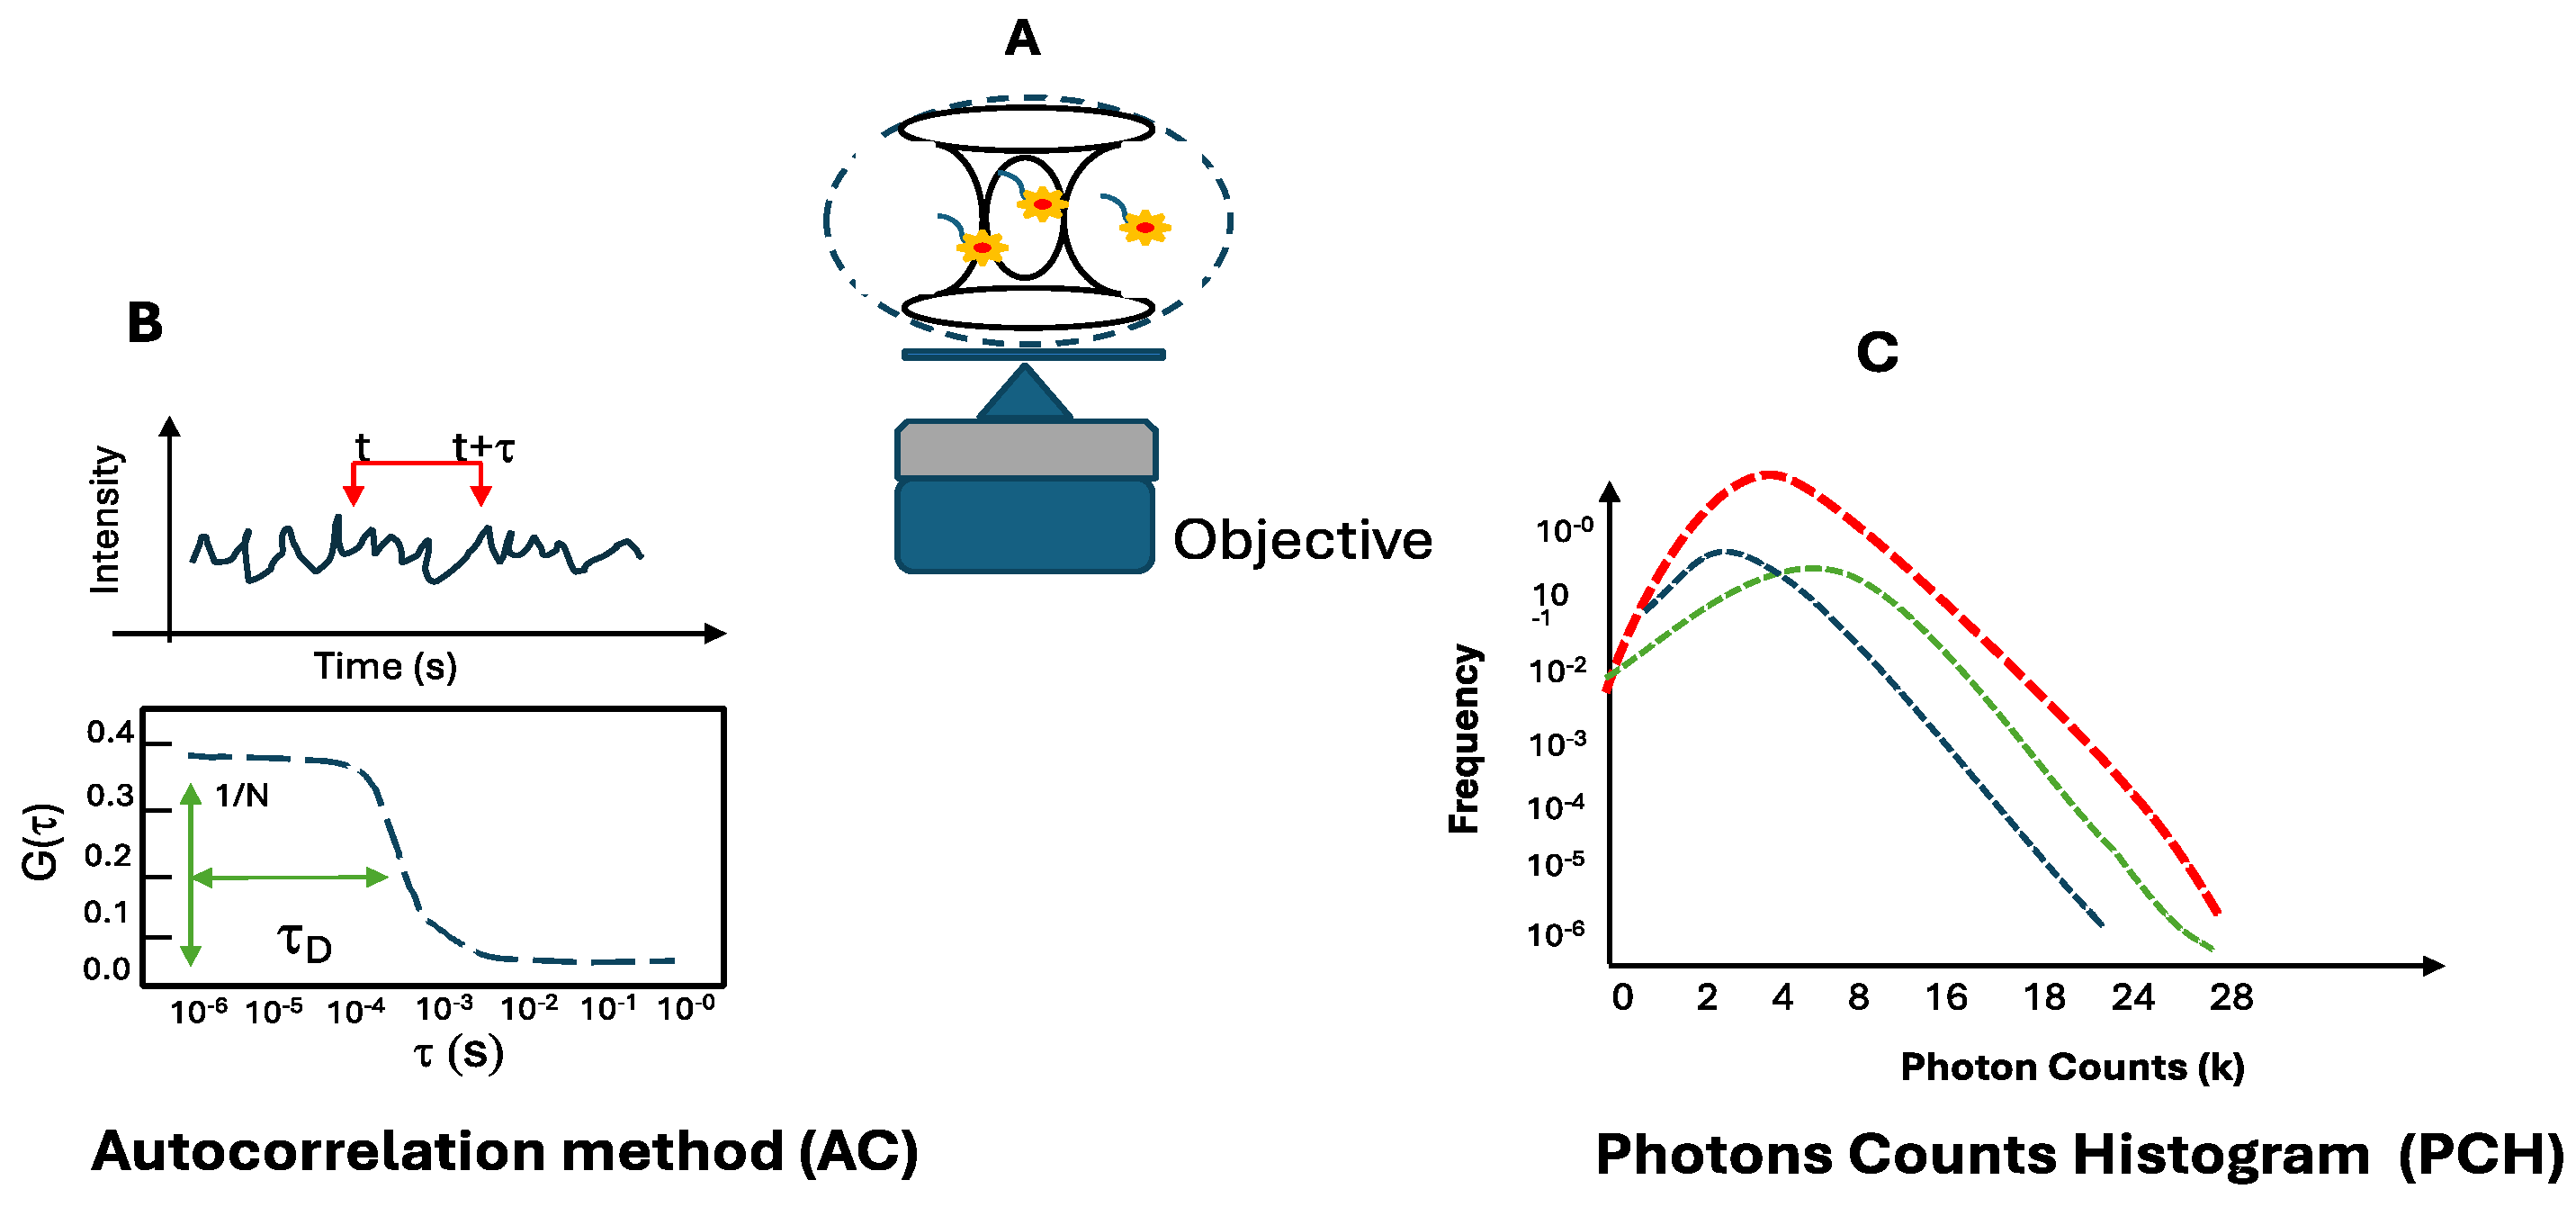
Figure 2.
Emission spectrum of the MC-LR BSA 488 (a). The fluorescence emission spectrum was acquired upon excitation at 488 nm, at 25 °C in PBS buffer pH 7.4. Indirect ELISA test monoclonal anti-MC-LR vs MC-LR BSA 488 (b). The experiments were performed in triplicate at 25 °C. A BSA solution and a no-coating (NC) well were used as a negative control.
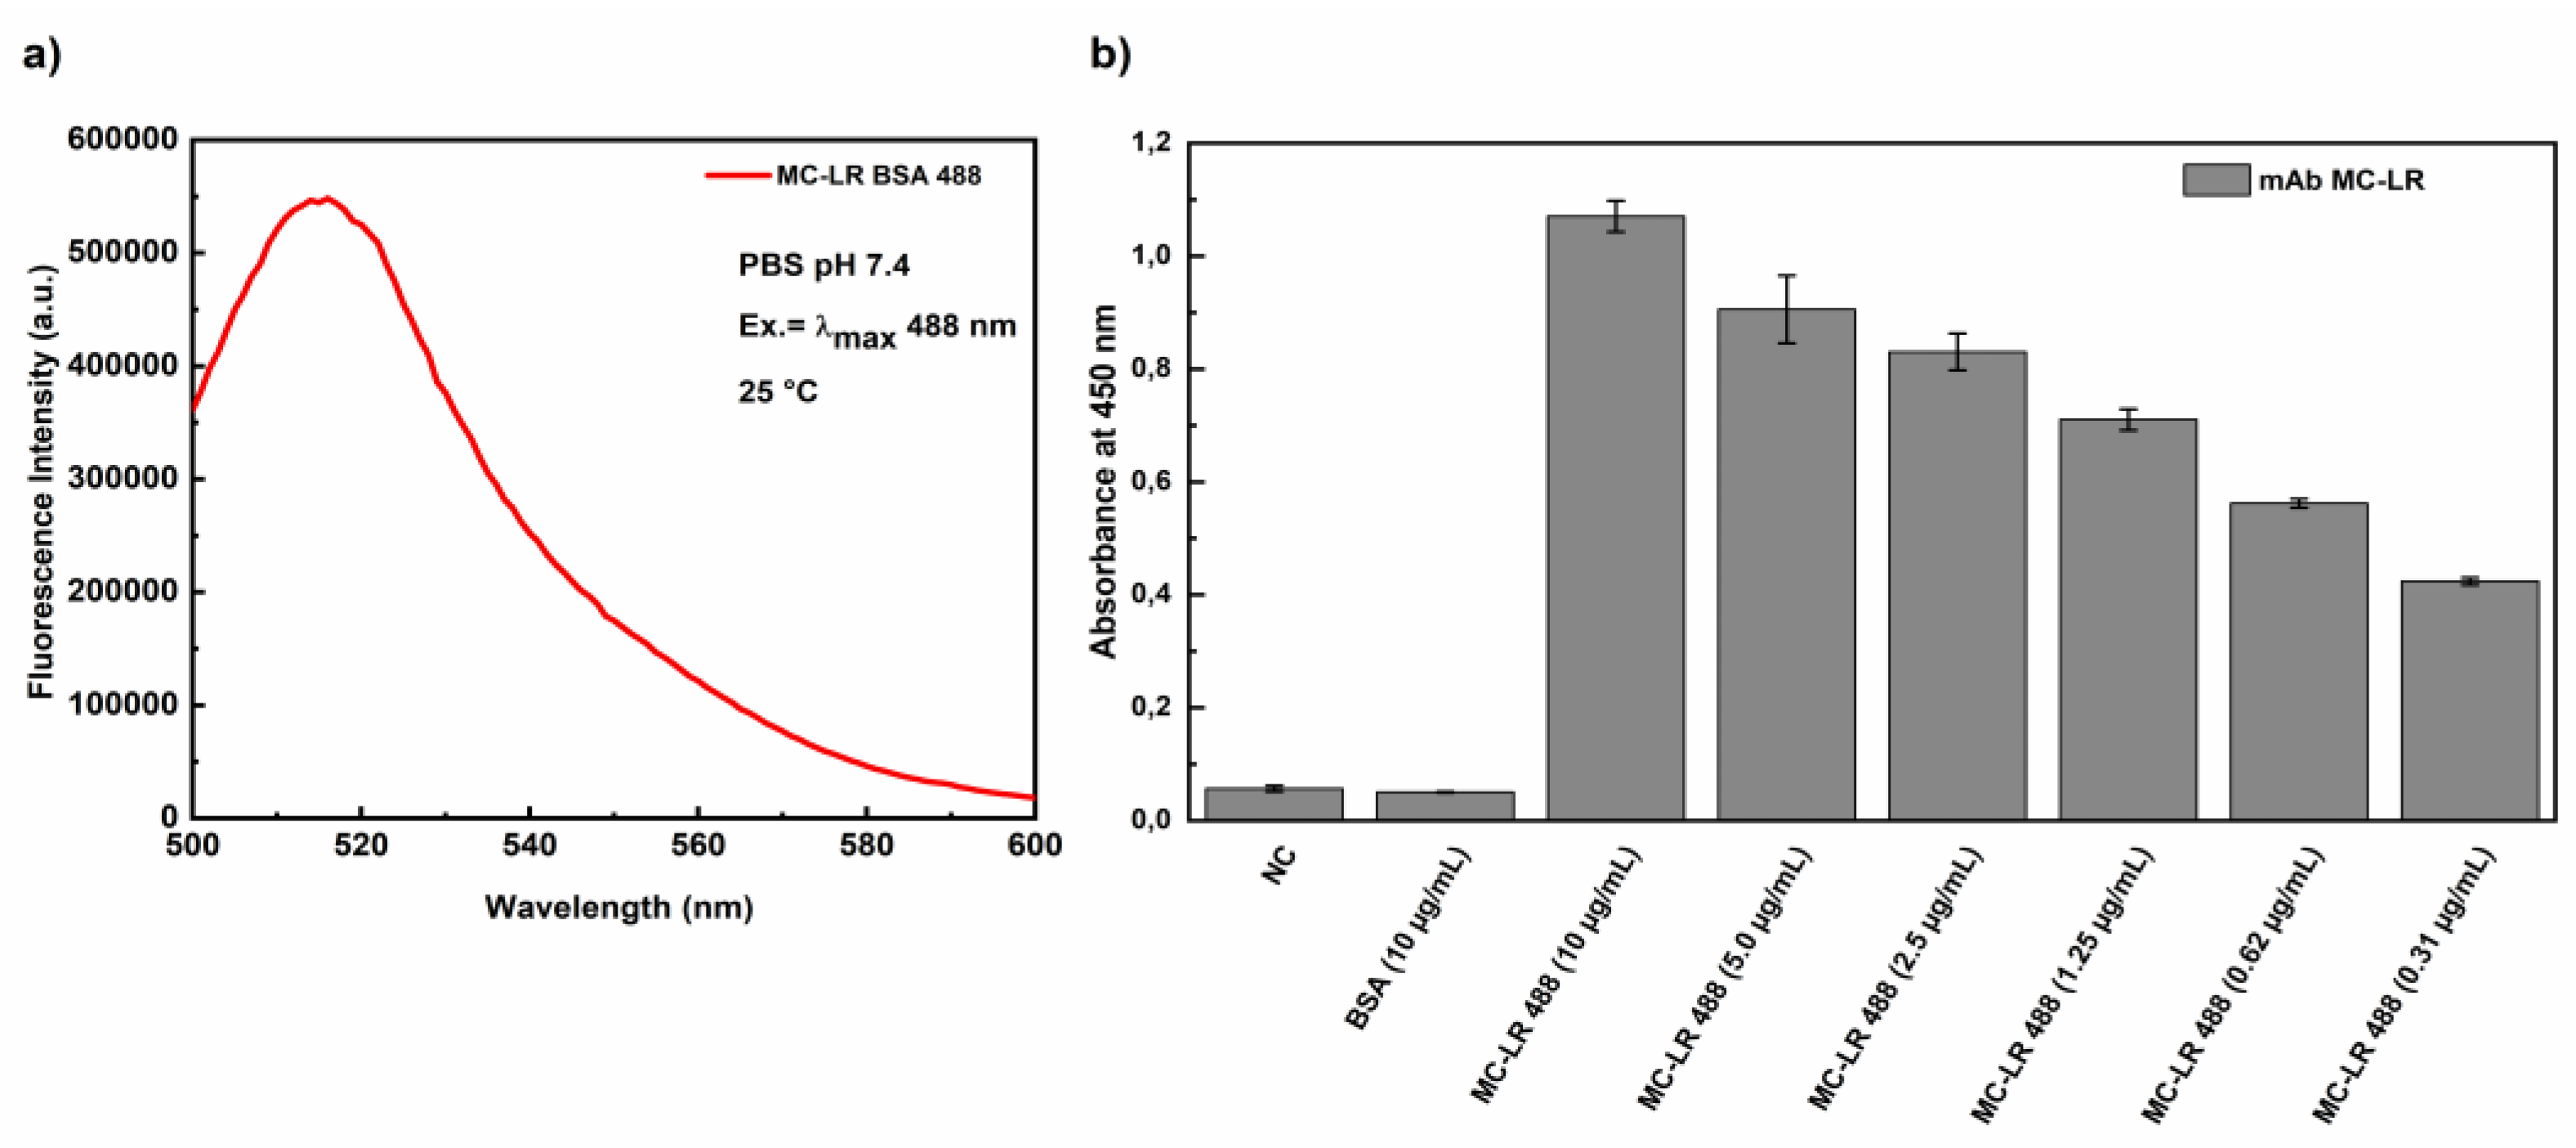
Figure 3.
Fluorescence correlation spectroscopy measurements of MC-LR BSA 488 in the absence and in the presence of anti-MC-LR. Normalized autocorrelation curve of MC-LR BSA 488 (black dots) in PBS pH 7.4 compared with the autocorrelation spectrum of Rhodamine 110 (orange dots) (a). Normalized autocorrelation MC-LR BSA 488 in the absence (black dots) and in the presence of 125 nM of mAb anti-MC-LR (red dots), compared with the autocorrelation spectrum of Rhodamine 110 (orange dots) (b). The measurements were performed in PBS buffer at pH 7.4 and at 25 °C.
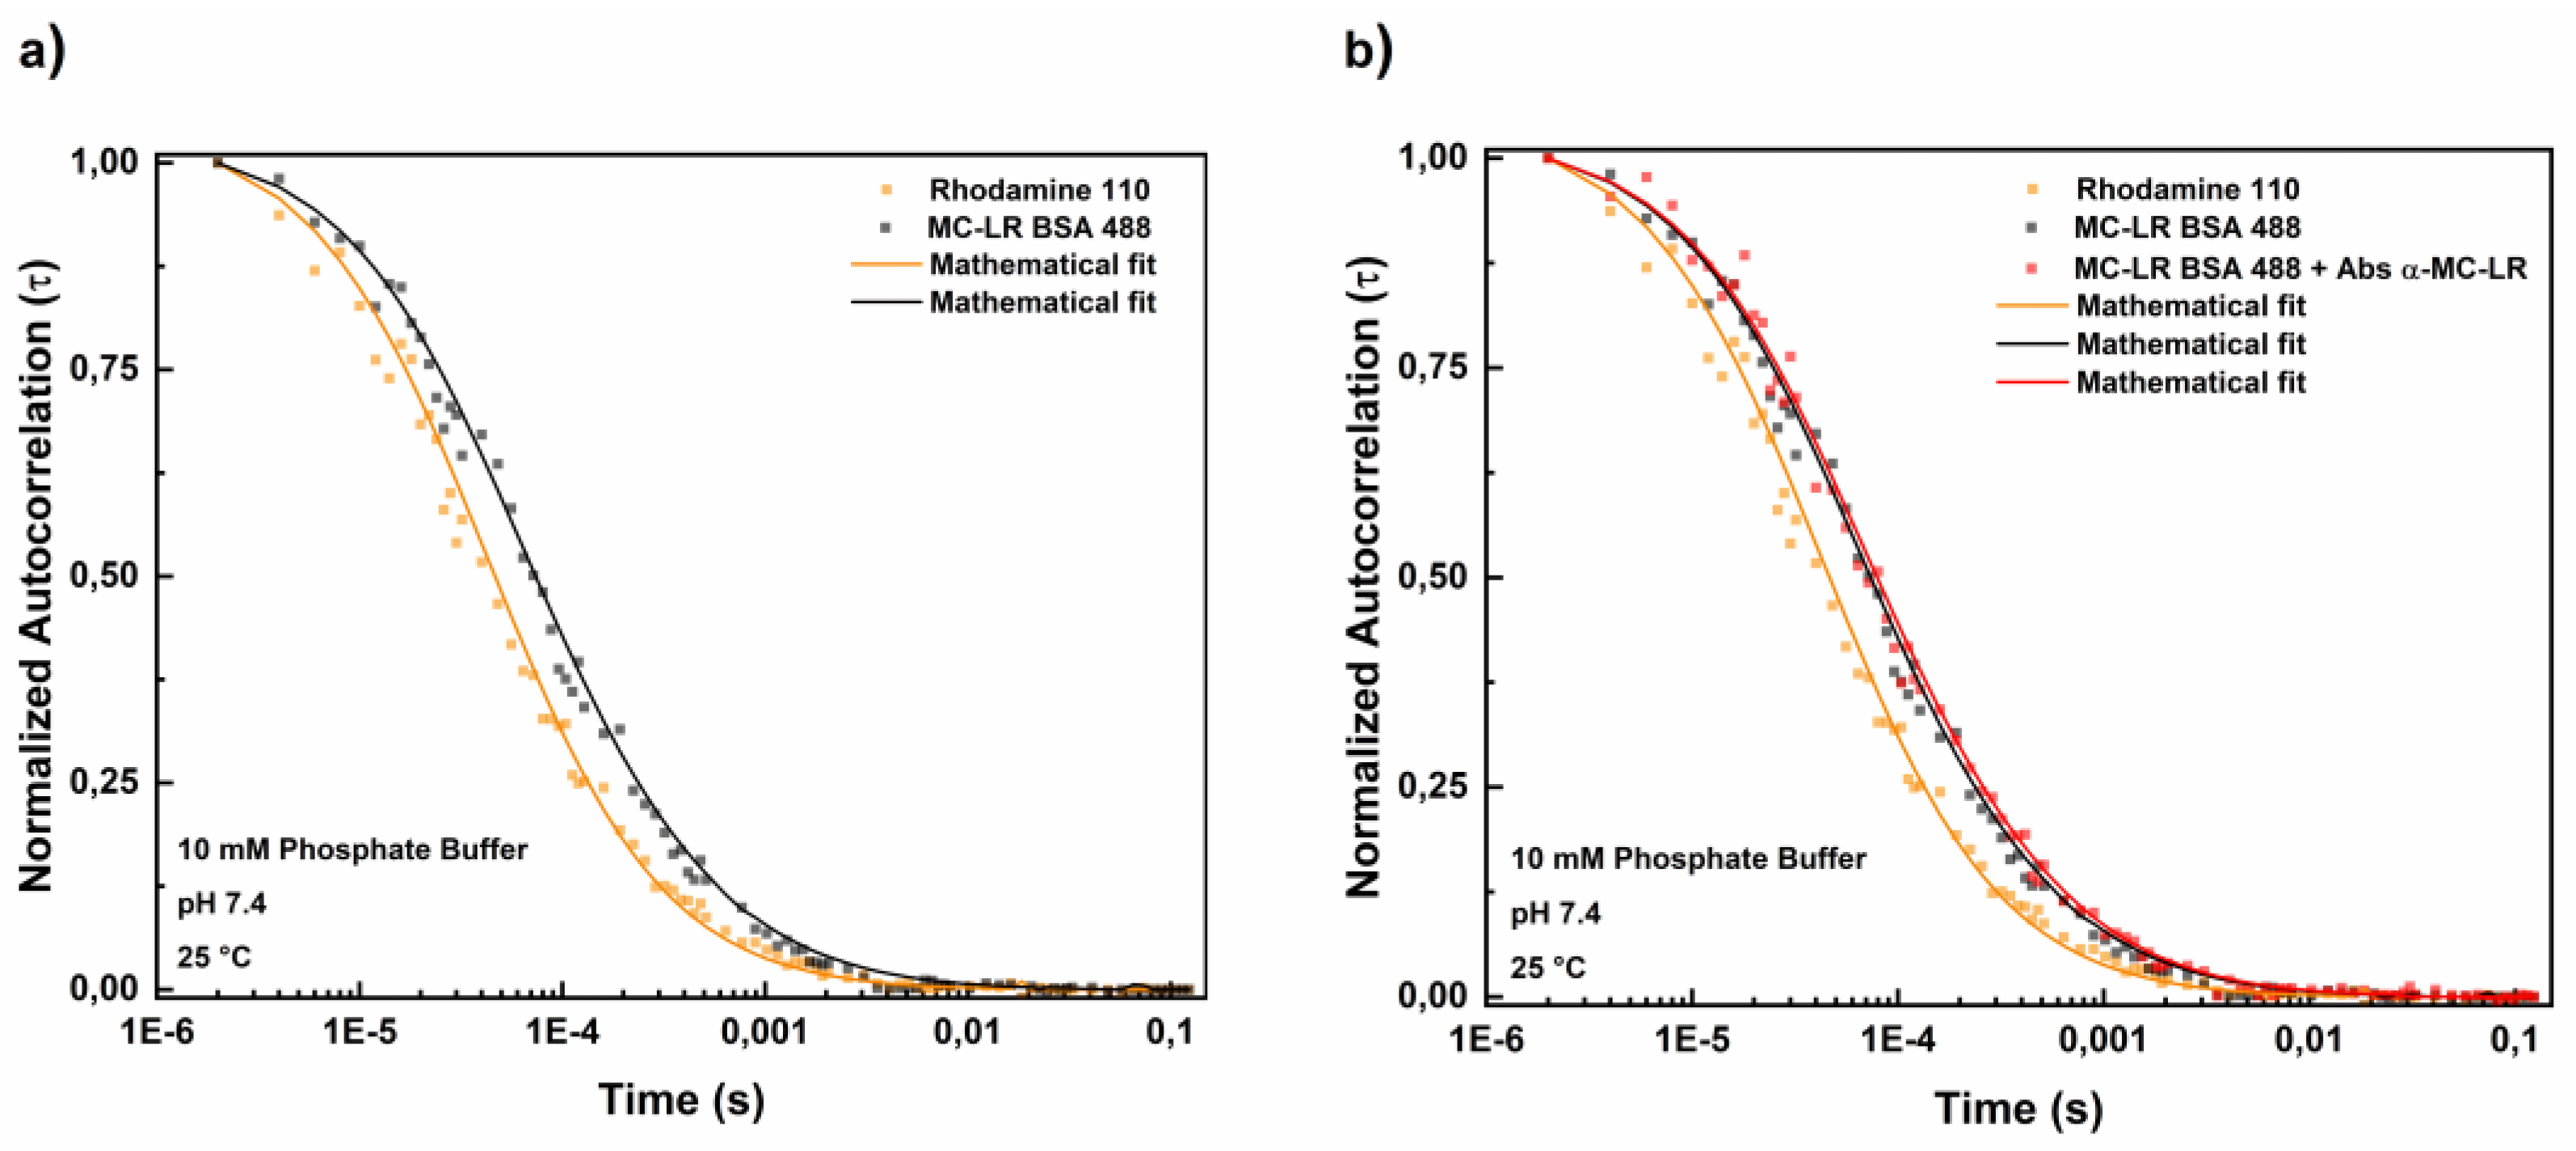
Figure 4.
Binding of anti-MC-LR to MC-LR BSA 488. Variation of the diffusion coefficient values of the MC-LR BSA 488 in the absence and in the presence of increased concentration of anti-MC-LR (0.0 - 120 nM). The measurements were performed in PBS buffer at pH 7.4, 25 °C.
Figure 4.
Binding of anti-MC-LR to MC-LR BSA 488. Variation of the diffusion coefficient values of the MC-LR BSA 488 in the absence and in the presence of increased concentration of anti-MC-LR (0.0 - 120 nM). The measurements were performed in PBS buffer at pH 7.4, 25 °C.
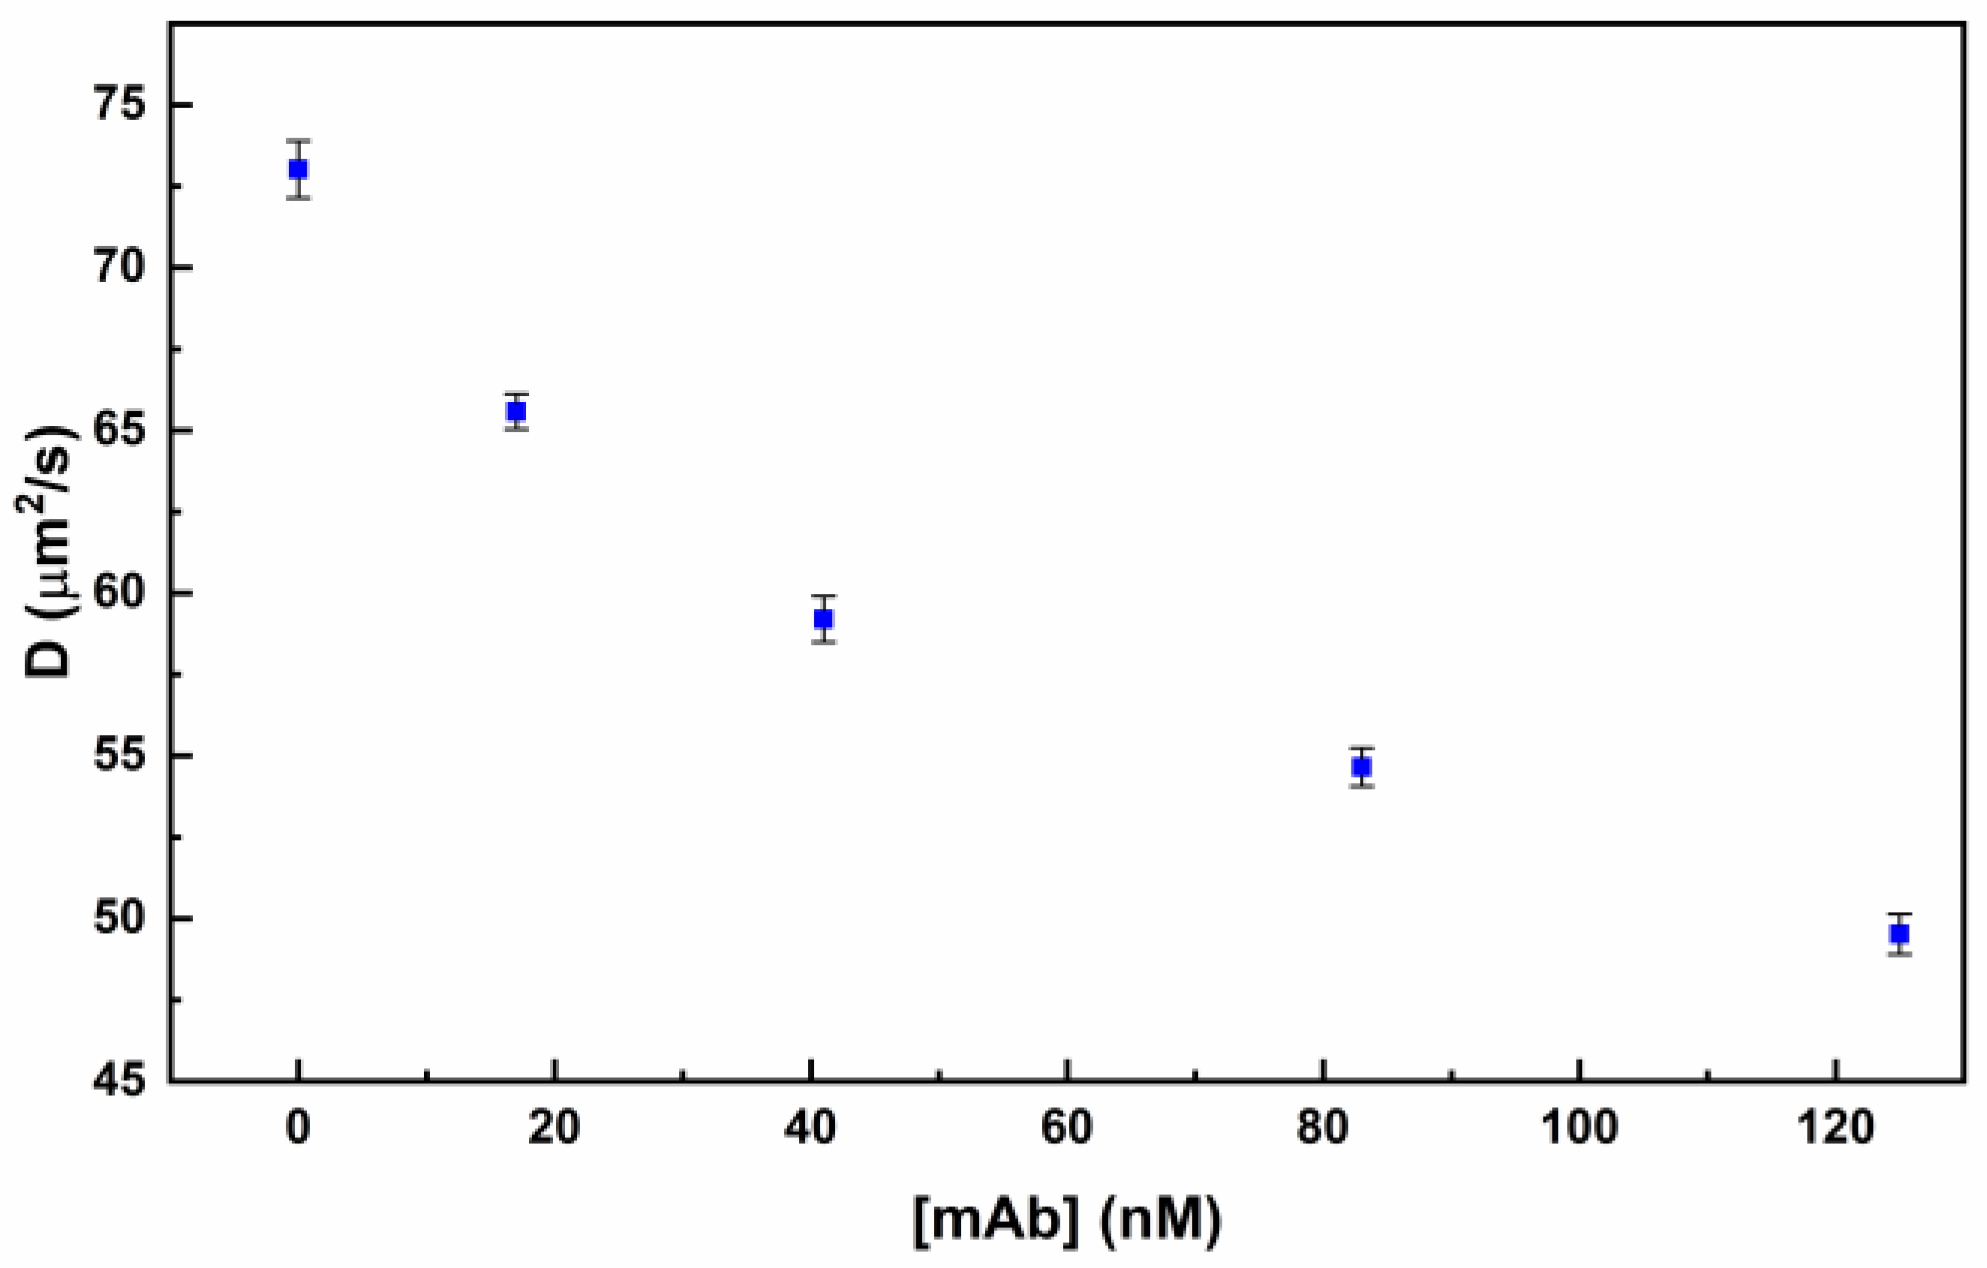
Figure 5.
Fluorescence correlation spectroscopy competitive assay. Variation of the diffusion coefficient value in the presence of increasing concentration of MC-LR (a). The calibration curves were obtained through a linear fitting function in the range 0.0 to 0.5 nM of MC-LR (b).
Figure 5.
Fluorescence correlation spectroscopy competitive assay. Variation of the diffusion coefficient value in the presence of increasing concentration of MC-LR (a). The calibration curves were obtained through a linear fitting function in the range 0.0 to 0.5 nM of MC-LR (b).
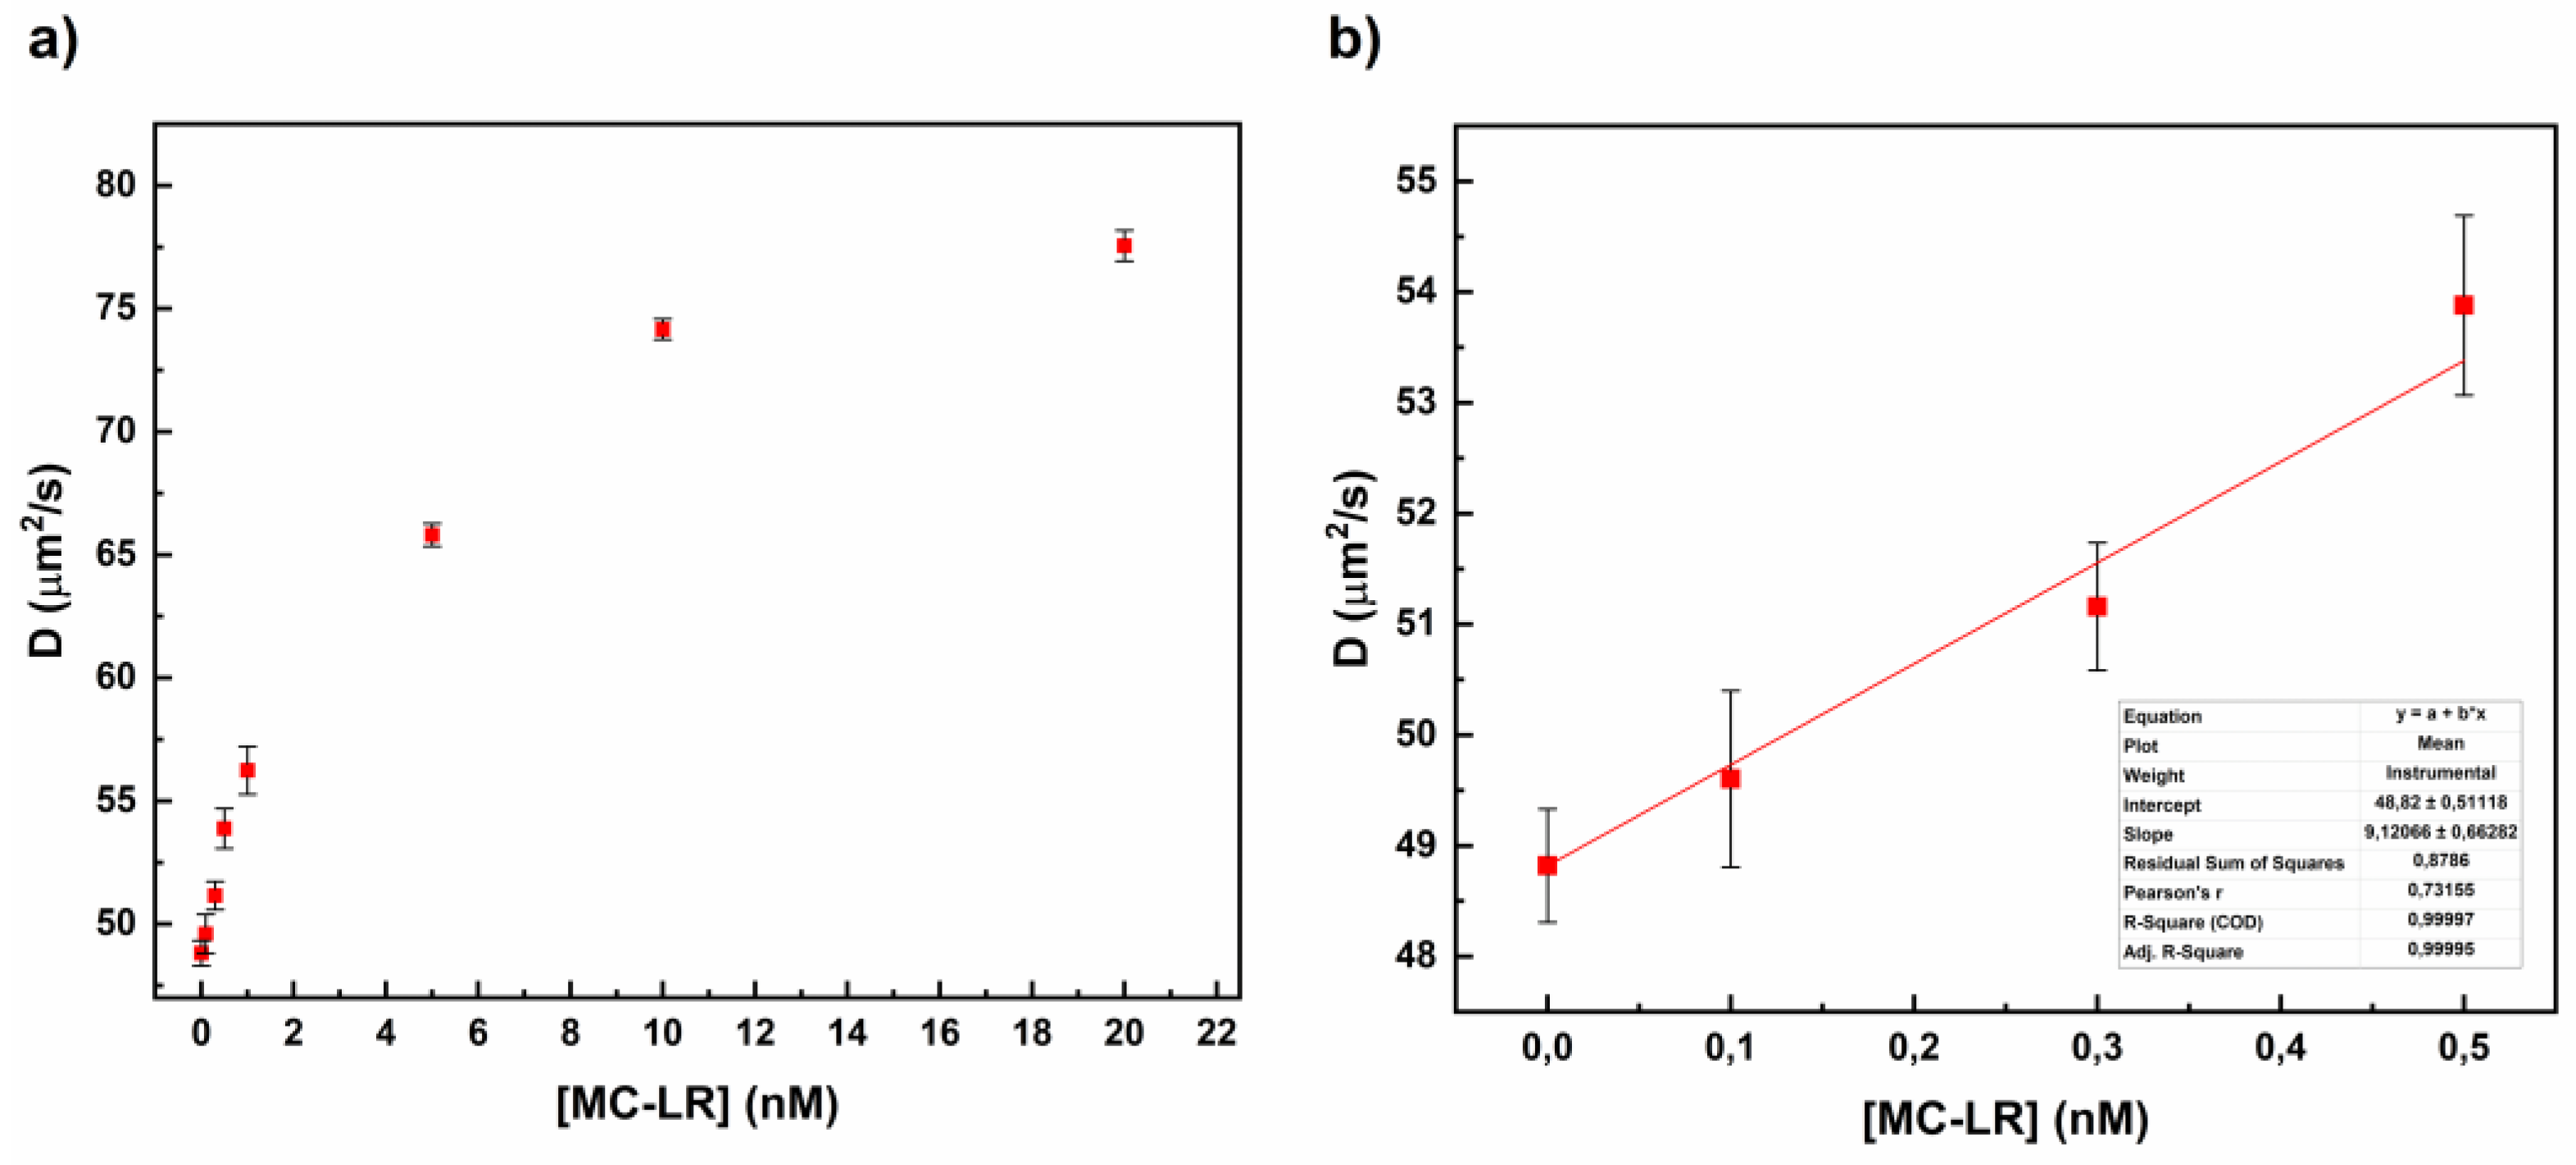

Table 1.
Diffusion coefficient in the absence and in the presence of an increased concentration of monoclonal anti-MC-LR.
Table 1.
Diffusion coefficient in the absence and in the presence of an increased concentration of monoclonal anti-MC-LR.
| [anti-MC-LR] nM |
Diffusion coefficient µm2/s |
Standard Deviation +/- |
Chi-square |
| 0.00 | 73.02 | 0.87 | 0.83 |
| 17.0 | 65.58 | 0.53 | 1.15 |
| 41.0 | 59.20 | 0.70 | 0.75 |
| 125.0 | 49.52 | 0.62 | 0.77 |
Table 2.
Diffusion coefficient values of anti-MC-LR/MC-LR BSA 488 in the absence and in the presence of increasing concentration of MC-LR.
Table 2.
Diffusion coefficient values of anti-MC-LR/MC-LR BSA 488 in the absence and in the presence of increasing concentration of MC-LR.
| [anti-MC-LR] | [MC-LR] nM |
Diffusion coefficient µm2/s |
Standard Deviation +/- |
Chi-square |
| 125 nM | 0.0 | 48.82 | 0.51 | 0.75 |
| 0.1 | 49.60 | 0.79 | 0.94 | |
| 0.3 | 51.16 | 0.57 | 0.74 | |
| 0.5 | 53.88 | 0.81 | 1.02 | |
| 1.0 | 56.24 | 0.97 | 0.85 | |
| 5.0 | 65.81 | 0.46 | 0.92 | |
| 10.0 | 74.16 | 0.41 | 1.12 | |
| 20.0 | 77.56 | 0.62 | 1.09 |
Disclaimer/Publisher’s Note: The statements, opinions and data contained in all publications are solely those of the individual author(s) and contributor(s) and not of MDPI and/or the editor(s). MDPI and/or the editor(s) disclaim responsibility for any injury to people or property resulting from any ideas, methods, instructions or products referred to in the content. |
© 2025 by the authors. Licensee MDPI, Basel, Switzerland. This article is an open access article distributed under the terms and conditions of the Creative Commons Attribution (CC BY) license (http://creativecommons.org/licenses/by/4.0/).
Copyright: This open access article is published under a Creative Commons CC BY 4.0 license, which permit the free download, distribution, and reuse, provided that the author and preprint are cited in any reuse.


