2. Gear Manufacturing Deviations and NVH Performance
Gear Geometry Tolerances: Real-world gears inevitably deviate from ideal geometry within specified
tolerances—including pitch (spacing) error, runout (eccentricity), profile form error, lead (flank line) error, and surface finish waviness. These deviations directly increase both static and dynamic transmission error, thereby elevating noise at the gear meshing frequency orders and even introducing additional sideband frequencies (ghost tones) [
1,
3]. In essence, any imperfection that alters how teeth pair-wise engage will modulate the mesh stiffness or contact timing and generate vibration. For example, even micrometer-scale pitch errors have been shown to
enlarge peak-to-peak TE and excite low-frequency “ghost” shaft-order tones in helical gears [
1]. Profile form errors or waviness on the tooth surface similarly create tiny ripples in mesh force that become audible whine or tonal “ripples” in the noise spectrum [
3]. Notably,
surface waviness (periodic undulations on the tooth flanks from grinding or honing) can be a major ghost noise contributor. Experimental studies demonstrate that waviness in the profile direction increases peak-to-peak TE by up to ~21% in a medium-quality gear (ISO Q6) [
4]. Waviness in the lead (flank line) direction tends to have a smaller effect on TE (on the order of 0.2% for Q6)[
4], but waviness oriented
normal to the grinding direction (as from milling patterns) can raise TE by as much as 25%[
4]. These deviations are especially detrimental for EV gears, which are held to tighter tolerances (particularly profile and lead) in order to meet the nearly “silent” noise targets[
2]. In fact,
gears for electric drives must be designed and produced with much tighter profile and lead tolerances because higher torques and speeds, combined with lack of masking noise, mean even small errors produce audible whine[
2].
Ghost Orders and “Ripple” Noise: Ghost order noise refers to tonal vibrations at frequencies not corresponding to the gear mesh fundamental or its integer harmonics—essentially sidebands or unexpected orders caused by manufacturing-induced modulation. Such ghost orders are a well-known result of slight periodic errors on every tooth[
2,
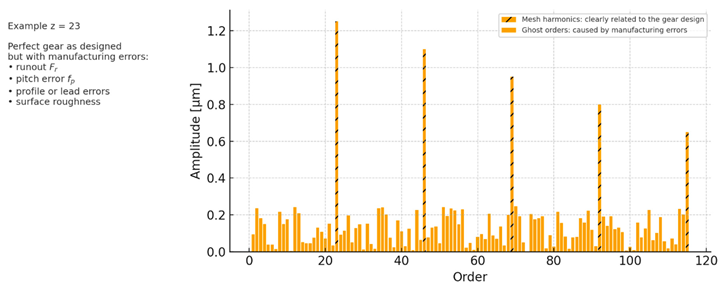
5]. For instance, a small runout (eccentricity) in a gear will act like a once-per-rev modulation, typically generating sidebands around the mesh frequency (appearing as ±1 order sidebands in spectrum). Similarly, a regular tooth profile ripple or pitch error might produce higher-order sidebands. Figure 1 illustrates an example order spectrum for a spur gear (23 teeth) with manufacturing errors
The red bars mark the expected mesh harmonics (23rd order and multiples), while the numerous blue bars between them are ghost orders attributable purely to errors (e.g., a prominent 59th order that is not an integer multiple of 23)[
3]. In practice, ghost orders manifest as annoying “whining” tones or beats that standard smooth-gear models would not predict. They have become
strongly audible in EV transmissions, where even a 10 dB lower gear noise can be heard by passengers[
6]. Ghost order issues have driven gear manufacturers to improve inspection techniques: as one industrial NVH expert puts it, a gear perfectly within conventional tolerances may
still produce unacceptable ghost-tone noise (the so-called “ripple phenomenon”)[
2]. These ghost tones originate from micro-geometry errors in the profile or lead of gear flanks[
2]. Advanced gear quality audits now include single-flank roll tests and
waviness analysis to catch these defects. In essence,
gear tolerances and flank waviness systematically increase TE and can trigger ghost orders, making otherwise well-designed gears noisy—a problem highlighted by both experimental tests and a comprehensive 2025 literature review[
1,
3].
3. Statistical and Robust Analysis of Tolerances
Because manufacturing variations are inherently statistical, deterministic “worst-case” analysis alone is insufficient to guarantee low NVH in production. Instead, researchers increasingly apply
stochastic methods (Monte Carlo simulations, reliability analyses) to quantify how tolerances and process variations influence gear NVH metrics like TE or sound pressure. A recent review underscores that these
tolerances and uncertainties are key factors in gear NVH, and that robust gear design must explicitly account for them[
1].
One common approach is to assume each error source (e.g., pitch error, misalignment, etc.) follows a distribution (often normal) and then perform Monte Carlo sampling to see the spread in outcomes. For example, Chung et al. (2023) conducted a
Monte Carlo robustness analysis for gear macro-geometry errors[
1]. They treated tooth thickness, tip diameter, and center distance errors as independent random variables and simulated 100s of gear sets. Their results showed that even
micrometer-level shifts in macro-geometry can significantly degrade performance. In particular, peak-to-peak static TE could
increase by over 30% across the operating range when realistic tolerance spreads for tip diameter and center distance were considered[
1]. In some Monte Carlo trials, a gear pair that had a safety factor >1 in a nominal design dropped to <1 when the stack-up of tolerances was applied[
7]—meaning a slight loosening of tolerances could even jeopardize fatigue life. These studies quantify the sensitivity:
pitch (indexing) errors were often found to excite worse TE and vibrations than comparable profile errors, for example[
1]. Broadly, the conclusion is that
manufacturing deviations act as potent excitations, and robust NVH predictions require treating key tolerances as random variables, not fixed values[
1].
Another insight from statistical analysis is the interaction between different errors. Monte Carlo simulations have revealed
non-linear coupling between error sources—e.g., a certain small pitch error combined with a particular profile deviation might amplify TE more together than each would alone. In one recent study, including both measured pitch errors
and measured flank form error doubled the peak-to-peak TE, whereas each alone had a smaller effect[
1]. This suggests a complex interaction that deterministic analysis might miss. Modern
Loaded Tooth Contact Analysis (LTCA) tools can incorporate measured topography of teeth: a 2025 study by Im et al. showed that by importing actual measured tooth profile errors into the gear contact model, the static TE prediction matched bench tests to sub-micron accuracy[
1]. This is an encouraging development—it validates that
including real manufacturing data (like profile error maps) greatly improves NVH prediction fidelity[
1]. However, it also highlights how important it is to gather such data and perform
numerical experimentation (DOE or Monte Carlo) on it to understand variability effects.
Finally, robust design methodologies have been proposed to handle manufacturing scatter. Instead of optimizing a gear purely for best-case performance,
robust optimization involves minimizing the sensitivity to variations. For example, tolerancing strategies can allocate looser tolerances to less sensitive parameters and tighter ones to critical ones, balancing cost and NVH. Six Sigma tools like
process capability indices (Cp, Cpk) come into play here: a process with Cp/Cpk > 1.33 or 1.67 might be required for critical tolerances to ensure the majority of parts meet the NVH targets. If the process can’t hold that capability, the design must be adjusted (either modify geometry to be less sensitive, or change spec). In practice,
gear manufacturers combine tolerance design with inline metrology and statistical process control to achieve consistent quiet gears[
2]. The use of 100% end-of-line NVH testing on gears (especially for EVs) is increasingly common to catch any outliers[
2]. All of these efforts tie into a simple principle:
a robust NVH design must incorporate manufacturing variations up front, rather than treat them as an afterthought[
1].
4. Gear Housing Variations and Radiated Noise
While gear imperfections drive the source excitation, the gearbox housing determines how that excitation turns into audible noise. The housing, usually a cast aluminum or magnesium enclosure, can have its own manufacturing variations—wall thickness deviations, rib positioning differences, material property scatter, etc. These affect the housing’s dynamic stiffness and modal frequencies, thus influencing the radiated noise.
Housing Wall Modes: It is well established that the dominant mechanism for gear radiation is through the housing wall vibrations[
8]. The gear mesh forces transmit via shafts and bearings into the casing, causing it to flex and
act like a speaker. In most cases,
flexural (bending) vibrations of the housing walls are the primary noise radiators[
8]. Thin, flat sections of the gearbox wall can behave like vibrating plates, especially at their resonance frequencies, pumping sound into the surroundings. Consequently,
increasing the stiffness and mass of the housing tends to reduce noise, by pushing resonances to higher frequencies (where excitation is weaker) and by lowering vibration amplitudes[
9]. For example, a heavier or thicker casing generally vibrates less for a given excitation, and added mass lowers overall radiation efficiency at low frequencies. Empirically, simply using a
more robust housing (thicker walls, reinforcements) often yields a quieter gearbox—a known trade-off between NVH and weight.
However, housing dynamics are complex. A notable finding by NASA researchers is that making a wall thicker doesn’t uniformly help at all frequencies. They observed that the
acoustic radiation efficiency of a mode can increase at higher frequency[
9]. In one case,
thickening a transmission housing shifted a wall mode to a higher frequency where its radiation efficiency was greater, resulting in potentially
more noise if the vibration reduction was not sufficient[
9]. By contrast, some higher-frequency modes have nearly constant radiation efficiency, so altering thickness might simply reduce vibration and thus noise[
9]. The takeaway is that one must consider
both vibration amplitude and radiation efficiency. Generally, adding ribs or thickness lowers vibration, and usually that outweighs any efficiency gain (so noise drops), but engineers need to verify this with vibro-acoustic analysis rather than assume thicker is always quieter.
Impact of Wall Thickness and Ribbing Variability: Manufacturing tolerances in casting the housing can lead to slight wall thickness deviations or pattern differences in ribs (stiffening ribs inside the housing). Studies have shown even
minor changes (on the order of millimeters) in wall thickness or rib count can measurably alter the housing’s vibrational behavior[
10]. In a lightweight EV gearbox, Albers et al. (2023) numerically evaluated several housing variants: adding ribs in certain locations, removing material in others[
10]. They found that adding ribs generally
increased local stiffness and reduced vibrations, whereas thinning walls or removing material to save weight invariably
increased vibration levels[
10]. Even the
arrangement of ribs was critical—two designs with the same number of ribs could perform differently if the rib layout changed, due to different mode shapes being excited[
10]. In short,
the housing’s rib topology and wall thickness distribution are key NVH tuning parameters, and small manufacturing-driven variations in these can move the needle on noise. One study noted that just reducing a rib’s height by a few percent in one area made a particular wall mode more compliant, raising its vibration amplitude and noise[
11]. On the other hand, increasing a rib’s thickness at a strategic spot could split a loud resonance into two higher-frequency, lower-amplitude resonances, reducing overall noise.
From a practical perspective,
casting process variations (like slightly uneven wall sections or core shift leading to one side being thinner) may lead to unit-to-unit variability in NVH. Quality control of castings to ensure minimum wall thickness and correct rib placement is therefore important for NVH consistency. It has been observed that lightweight designs can suffer “inferior NVH behaviour” if manufacturing variances push the housing out of its intended spec[
10]. This motivates simulation of not just an “average” housing, but also worst-case or statistical variations—akin to gears. Some manufacturers now apply
modal testing on housings in production audits to ensure the main natural frequencies haven’t shifted undesirably due to a casting issue.
Radiated Noise Optimization: On the positive side, several publications have demonstrated that
optimizing housing geometry can yield substantial noise reductions in practice. A recent example applied
topology optimization to an EV gearbox housing: starting with a baseline design, material was strategically added or removed (within packaging constraints) to minimize radiated sound power[
6]. The optimized housing introduced rib reinforcements in areas of high strain energy and increased some wall thicknesses. Tests on the prototype showed a
noise reduction of about 2.4 dB(A) in the target frequency range[
6]—a meaningful improvement[
6]. Similarly, Kim et al. (2024) report successfully shifting and reducing certain casing mode responses through shape optimization, confirmed by both simulation and physical tests within 0.2 dB[
6]. These studies underscore that
modifying housing wall shapes and rib layouts (via FEA-based optimization) can directly lower radiated noise by a few decibels[
6]. Notably, such optimization has already been applied in an agricultural EV gearbox and is equally applicable to automotive transmissions. The key is a coupled
structural-acoustic analysis: first simulate how vibrations change with design tweaks, then predict resulting sound via boundary element or similar acoustic models[
6].
In all cases, a stiffer/heavier housing tends to push resonances out of the most sensitive range and reduce amplitudes, so the general guideline holds:
more robust housings yield lower noise (albeit at odds with weight reduction goals)[
10]. Automotive engineers therefore often face a multi-objective problem—meet NVH targets while minimizing weight. The solution might involve strategically placed ribs or contour changes rather than blanket thickening. For instance, one approach is adding
localized ribs near high-strain regions (like around bearing seats or broad wall panels) to break up large vibrating areas. This can increase the damping and split resonant modes. Conversely, overly symmetric rib patterns can cause modes to cluster at single frequencies; introducing slight asymmetry sometimes spreads out the modal density and reduces peak noise. Thus, robust housing design considers
manufacturing variability (to ensure every produced housing meets a minimum stiffness) and includes
NVH optimization features that are tolerance-insensitive.
5. Integrated Gear-Bearing-Housing Modeling
To truly predict gearbox NVH, one must model the entire chain: gear excitation → transfer through bearings → housing vibration → radiated sound.
Integrated CAE models that link gear microgeometry to system-level noise are increasingly reported. In such a model, the computed transmission error or mesh force (possibly from LTCA or a multi-body dynamics simulation) is applied to a finite element model of the gearbox structure, and then an acoustic solver predicts radiated noise. For example, Roldán (2018) used MSC Adams to take a gear’s TE excitation and compute housing vibrations, then used a boundary element model to get far-field noise[
1]. Tanaka et al. and Guo et al. developed similar workflows by feeding gear and bearing forces into an
FEA of the housing and a BEM (Boundary Element Method) acoustic model, achieving reasonable correlation with measured sound[
6]. These integrated approaches have become the virtual test bench for NVH, allowing engineers to evaluate how a given microgeometry modification or a tolerance scenario might affect the final sound pressure at the driver’s ear.
Such models also highlight the importance of
boundary conditions and assembly aspects. For instance, including the compliance of
bearings and shafts is crucial—a rigidly mounted gear might show less TE amplification than one that’s allowed to misalign slightly in its bearings. Petrone et al. (2020s) noted that housing elasticity can feed back and alter gear meshing behavior slightly (e.g., additional misalignment under load), thus a fully coupled model might iterate between gear contact and structural deflection. The consensus in recent literature is that
a high-fidelity NVH prediction must encompass gear, bearing, and housing dynamics together[
6]. This ensures that, say, a certain housing mode at 1200 Hz that aligns with a gear mesh harmonic is accounted for. Indeed, one NVH simulation case study found a particular housing lid mode was amplifying noise at a gear order; once identified, a minor design change to that lid eliminated the issue[
3].
Validation of these chains is key. Many researchers perform
vibration modal testing and sound measurements on prototype gearboxes to validate that the model’s predicted natural frequencies, vibration amplitudes, and sound levels match the real world[
6]. As mentioned, Im et al. showed excellent match in TE by including measured flank data[
1]. Kim et al. achieved <0.2 dB error between simulation and test for housing noise[
6]. Such validation builds confidence that the models can be used in design iteration to foresee NVH problems. Going forward, integrating
measured manufacturing profiles into these models (“digital twins” of the as-built gears) is a promising approach to predict ghost orders and unit-to-unit variation. The goal would be a simulation that, given the measured deviations of a gear set, can predict if that specific pair will be noisy—thereby enabling a feedback loop to manufacturing.
7. Open Research Questions
Despite progress, several NVH challenges related to manufacturing variability remain open for research:
Predictive “Ghost Noise” Modeling: While we can simulate ghost orders by inputting measured errors, doing so predictively (without measurements) is tricky. A full multi-physics model that captures gear manufacturing process signatures (e.g., grinder chatter patterns) and translates them into noise predictions is not yet standard. Researchers are working on linking machine tool errors to gear spectral error content. Moreover, replicating ghost order effects requires high frequency resolution and accounting for tooth-to-tooth variability—pushing the limits of current modeling. Improved techniques (or higher computational power) to include, for example, stochastic surface error representations in dynamic simulations would help here. Boundary conditions also matter: real gear pairs have varying support stiffness and backlash which influence ghost tones; modelling the range of these in operation (cold vs. hot, different mounting) is an ongoing area.
Direct Integration of Measured Topography: Although one can now map measured 3D tooth surface data into simulations (as shown in research[
1]), it’s not yet a routine part of design due to time and data size constraints. Future tools might integrate CMM measurements of gears directly into FE or MBD models in an automated way. This would allow
digital twins of actual production units, enabling correlation of specific surface features with noise. One vision is that every gear gets a “fingerprint” and its expected noise can be forecast by simulating the measured geometry—then pairing of gears or targeted lapping could be done to mitigate any issues. Advancements in scanning speed and data handling, as well as model reduction (to condense a surface map into key error harmonics), will facilitate this.
AI and Explainable Diagnostics: With the plethora of inspection data (profile plots, FFTs of TE, etc.), there is interest in applying machine learning to identify patterns that correlate with noisy gears. For example, an ML model could be trained on many gear measurements and their noise test results to predict NVH outcomes from measurements alone. Some initial work in this direction exists, but a challenge is making these models
explainable—i.e., providing insight like “high amplitude of 5th-order waviness in profile is causing a ghost order”. Bridging AI with physical causation (XAI for metrology) would greatly help quality engineers introduce controlled amounts of “behavioral” modifications. Interestingly, as noted in a Marposs report, sometimes a
perfectly smooth gear can be noisier than one with slight imperfections, because a touch of random “disorder” can damp certain resonances[
2]. Understanding such counter-intuitive effects and guiding the manufacturing process (perhaps to intentionally introduce benign micro-variations) is a frontier. AI might detect when a gear’s spectrum is “too perfect” and likely to ring at a single frequency, vs. one with a mild broadband roughness that spreads energy.
NVH of New Manufacturing Methods: As production evolves (e.g., additive manufacturing for gears, new heat treatments, composite housings), the nature of manufacturing variability changes. For instance, 3D-printed gears may have different error signature (layer-induced waviness). How these affect NVH and how to control them will need study. Similarly, lightweight composite or plastic housings will have different variability (material property scatter, joint tolerances) and acoustic radiation characteristics, raising new questions for robust NVH design.
Extending Robust Design to System Level: We often tackle gear and housing separately in analysis, but ultimately the entire powertrain including e-motor, differential, mounts, etc., has manufacturing variances. A holistic robust NVH model that includes motor shaft balance, gear errors, bearing preload variation, and housing modes together would be extremely valuable to predict the overall vehicle NVH variability. This is a complex, multi-disciplinary problem that likely requires new efficient simulation and uncertainty propagation techniques.
Case Study: Stochastic NVH Assessment from a 40k-sample Gear Tolerance Dataset
Dataset and objective
We analyze “Gear Statistical tolerance analysis results (1).xlsx” (N = 39,984 rows. 21 columns) to ground the article’s concepts in data. Each sample represents a combination of tolerance terms (pitch, runout, form on pinion/wheel), a misalignment term, and outcomes: KTE value (kinematic transmission-error proxy) and Assembled conformity (0–1).
Our goals are to (i) examine distributions and basic relationships, (ii) quantify linear and nonlinear effects of manufacturing variability on KTE, and (iii) discuss how the same dataset supports Monte-Carlo/bootstrapped NVH assessments and process-shift “what-if” studies.
Key descriptives. KTE: mean 22.501, SD 4.330, min 15.001, max 30.001 (Figure S1). Assembled conformity: mean 0.412, SD 0.387, range 0–1; its wide spread is consistent with mixed manufacturing capability across scenarios (Figure S2).
Empirical findings from the dataset
(1) Linear relationships are negligible
Pearson correlations between KTE and all tolerance/shift terms are essentially zero (top five |r| ≈ 0.001; see Figure S3 and the correlation table). In other words, no single variable shows a meaningful linear relationship with KTE in isolation. This supports the view that TE/NVH is shaped by weak, nonlinear, and interacting influences rather than by any one tolerance acting alone.
(2) Nonlinear modeling highlights process shifts
A Random Forest regression using all tolerance and process-shift features yields R2 = 0.093 and MAE = 3.611 (KTE units), indicating modest predictive power from these variables alone. Nevertheless, the model consistently ranks process-shift terms highest (Figure S4):
Misalignment process shift — importance 0.094
Crown wheel pitch process shift — 0.087
Crown wheel runout process shift — 0.080
Crown wheel form defect process shift — 0.078
Spur gear form defect process shift — 0.076
This aligns with engineering intuition: assembly/alignment and mean-shift effects perturb load sharing and contact conditions, thereby influencing TE even when simple linear metrics underreport the effect.
3) Monotone but small quartile trends
Binning the top RF drivers into quartiles (Q1→Q4) shows small, monotone increases in KTE with larger shifts (Figure S5):
Misalignment process shift: 22.493 → 22.510 (Δ ≈ +0.017)
Crown wheel pitch process shift: 22.496 → 22.505 (Δ ≈ +0.009)
Crown wheel runout process shift: 22.496 → 22.511 (Δ ≈ +0.015)
Directionally consistent, these effects are subtle at the dataset’s scale, reinforcing the need for multivariate (interaction-aware) treatment rather than single-tolerance thinking.
Using the dataset as a stochastic demonstrator
Monte Carlo and bootstrapping for yield–NVH trade-offs
The dataset can be resampled (bootstrap/Monte Carlo) to estimate the distribution of Assembled conformity (yield) alongside the distribution of KTE. Plotting these (cf. Figures S1–S2) enables exploration of the capability vs. NVH trade-off: tighter composite capability targets typically push KTE lower but risk lower yield; looser capability relaxes production at the cost of higher and more variable TE. Quantifying this curve directly from the data provides evidence-based targets for manufacturing and design.
Global sensitivity analysis (GSA)
Beyond RF importances, variance-based methods (e.g.,
Sobol,
PAWN) can apportion KTE variance to inputs and their interactions. Literature often ranks
tooth indexing/pitch error and
runout as leading TE drivers, with
misalignment significant through contact pattern effects [
1,
12]. Applying GSA here would complement Figures S3–S5, turning qualitative importance into
variance shares and clarifying interaction terms.
Process-mean shifts and centering
Because the dataset includes
process shift terms, it naturally supports “
what-if” evaluations of centering vs. drift (e.g., shift ≈ 0 vs. 0.8). Centered processes typically raise
conformity (Cp ≈ Cpk), while drift towards limits lowers
Cpk and increases out-of-spec risk—especially under tight tolerance stacks [
2]. Combining shift scenarios with Monte Carlo draws gives practical yield forecasts to guide
feedback control and
process adjustments.
Extending to housing variability
While these data focus on gear errors and misalignment, the same workflow can incorporate
housing variability (e.g., wall-thickness tolerance as a stiffness proxy). A simple extension introduces a “housing amplification factor” as another random input; even with perfect gears, a more flexible housing may radiate more sound. Industry experience and prior studies emphasize that
both gear quality and housing dynamics must be managed jointly for robust NVH in production [
10].
Takeaways and implications
Single-variable linear effects are not the story. With near-zero Pearson r, KTE depends on weak, nonlinear, and interacting contributors.
Process shifts matter. Despite low R2, nonlinear modeling and quartile trends consistently elevate misalignment and crown-wheel pitch/runout shifts as the most actionable levers.
Design for capability. Use the dataset for Monte Carlo/GSA to set evidence-based NVH targets that respect manufacturing capability (yield) and process centering.
System view. Extend the analysis to include housing and other boundary-condition variability for end-to-end NVH robustness.
8. Conclusions
Manufacturing variability plays a pivotal role in geartrain NVH—
it forms the critical bridge (or gap) between theoretical simulation and production reality. Gear tooth errors like pitch, runout, profile and waviness, even when kept within drawing tolerances,
systematically increase transmission error and can generate ghost order noises that are particularly conspicuous in the near-silent backdrop of EV powertrains[
2,
3]. Likewise, variations in the gearbox housing’s stiffness due to wall thickness or ribbing changes can reshape vibrational modes and significantly influence radiated noise—generally,
more rigid (heavier) housings tend to lower noise, whereas lightweight designs must be optimized carefully to avoid loud resonance peaks[
8,
10]. Bridging these insights, modern robust design practices treat manufacturing imperfections not as afterthoughts but as design inputs. By incorporating statistical tolerance analysis, Monte Carlo simulations, and worst-case scenarios into the NVH design phase, engineers can develop gearboxes that are not only quiet in prototype tests but remain quiet across thousands of production units. On the factory floor, ensuring high process capability, employing thorough gear inspections (including advanced NVH tests), and maintaining tight control of process drifts are all essential to achieve the NVH consistency targets.
In closing, the quest for “uniformly quiet” transmissions at mass-production scale is an interdisciplinary challenge: it demands gear design optimization, materials and process engineering, precise metrology, and even data science for pattern recognition. The benefits, however, are clear—meeting stringent NVH requirements reliably, reducing scrap and rework costs, and delivering a refined customer experience. As one comprehensive review summarized,
manufacturing tolerances and uncertainties are indeed crucial factors for gear NVH performance, and explicitly accounting for them is key to robust gear design optimization[
1]. The continued convergence of simulation and production (through digital twin models, real-time quality data feedback, and intelligent process control) will further narrow the “simulation-reality” gap. Future research and development, as outlined, will focus on predictive models for ghost noise, integration of measured data into simulations, and AI-driven diagnostics—all aiming to ensure that the NVH of a transmission can be dialed in, maintained, and guaranteed
before the first part rolls off the assembly line. Such advancements will form the next step change in delivering quiet, efficient, and reliable powertrains for the modern age.
Key Takeaways:
- Gear manufacturing errors (pitch, runout, profile, waviness) directly raise transmission error and
cause tonal excitations (mesh harmonics and ghost orders); in EV gearboxes, these small variations can produce clearly audible noise and must be tightly controlled[
2,
3]. -
Housing stiffness variability (wall thickness and ribbing differences) alters the vibration modes—a stiffer or more massive housing generally emits less noise by reducing wall flexing[
8]. Even minor design or tolerance changes in ribs and walls can change NVH behavior, so robust designs often add ribs or thickness strategically to ensure consistency[
10].
- Achieving robust NVH performance requires
incorporating manufacturing variability into the design process and ensuring high process capability. By designing with tolerances in mind, using Monte Carlo analyses, and implementing thorough quality control (inline metrology, end-of-line NVH testing), manufacturers can produce quiet gearboxes consistently[
1,
2].


