Submitted:
11 December 2025
Posted:
14 December 2025
You are already at the latest version
Abstract
Hepatitis C Virus (HCV) continues to be a significant worldwide health issue, particularly in resource-limited environments with inadequate diagnostic and therapeutic options. This study formulates a deterministic six-compartment model, predicated on the assumptions that the population undergoes natural birth-death dynamics, awareness initiatives transition individuals from $S_1$ to $S_2$, diagnosis advances U to I, recovery is achieved through therapy or immunity, and infection and mortality rates vary among classes. The system is described by coupled nonlinear ODEs that include three time-dependent controls. Analytical examination guarantees the positivity and boundedness of all compartments and calculates the fundamental reproduction number ($R_0$) using the next-generation matrix. Sensitivity analysis shows that $\beta_1, \beta_2, \tau_1, \tau_2$ are the most important parameters. Using Pontryagin's Maximum Principle, the forward–backwards sweep method is employed to determine the optimal controls that minimise both infection and cost. A Mamdani fuzzy logic controller is added to handle parameter uncertainty and generate adaptive responses to infection pressure, awareness level, and hospital load. Simulations reveal that fuzzy control delivers equivalent suppression to the crisp optimum with around two-thirds lower cost, enabling a stable, interpretable, and resource-efficient paradigm for dynamic HCV intervention.
Keywords:
epidemiological modeling of HCV spread
; multifaceted control approaches
; synergistic fuzzy–optimal techniques
; decision support in public health
; modeling of responsive interventions
1. Introduction
HCV infection, which is projected to have affected 71 million people worldwide in 2021, is a major contributor to the burden of liver diseases, given that deaths are mainly due to asymptomatic progression. The need to build appropriate measures for the prevention and avoidance of risk factors is absolutely crucial, particularly in poor settings where vertical programs do not exist. Such risks represent an enormous burden for society. A certain operational protection level has been recommended by the world’s major health agencies. However, the latter is completely unrealistic for people with HCV lesions. Modeling has transformed the way in which public health policies are developed; by providing policymakers with a quantitative framework within which to consider epidemic dynamics of diseases and the impact of control programs as well as other issues of resource use. It also describes the origin of the virus, the means of transmission, the coverage of the intervention, and its effects on the virus, including interventions that are planned for different subgroups of the population to prevent the spread of the infection and infect others [1,2,3,4].
Previous studies have investigated the epidemiology and interventions of HCV in people injecting drugs (PWID). These include analyses of the dynamics of co-infection with HCV / HIV [2], the preventive impact of antiviral therapies [5,6], network-based transmission patterns [7,8], and the integration of direct-acting antivirals (DAA) with vaccination [9]. Extensive research shows the great impact of reviewing and evaluating the number of references worldwide, as well as genotype combinations [10], available information related to injector demographic characteristics [11], and reviews of the dedicated HCV care cascade [12]. The cost-effectiveness literature [13,14], the interventions at the community level [15], and the development of enhanced capacities to combat HCV in general practice, including loss of follow-up care [16] refer to comprehensive ways to address HCV / AIDS. Furthermore, existing HCV treatment opportunities have focused on DAAs, which have shown remarkable efficacy in reducing the occurrence of specific diseases and addressing the problem of their consequences [17]. The problem only arises when conducting microeconomic analyses of the benefits, as well as the overall burden and the comprehensive services of care models [18,19].
Epidemiological systems also have their inherent linearities and uncertainties, which fuzzy logic offers to resolve as extensions to the traditional deterministic approach. By translating linguistic variables (for example, “high prevalence," “low awareness") into adaptive intervention intensities, fuzzy inference systems enable robust, interpretable, and cost-efficient decision-making. Applications include early fuzzy set-based epidemic modeling [20], fuzzy inference for disease diagnosis [21], real-time infectious disease monitoring with edge computing [22], fuzzy evidential reasoning for outbreak risk assessment [23], interval type-2 fuzzy control for COVID-19 [24], and fuzzy controllers in fractional-order epidemic models [25]. These approaches have demonstrated resilience in the face of uncertainty, making them highly relevant for the design of adaptive HCV interventions in resource-constrained contexts.
The main novelties of the work are as follows.
- A new six-compartment model for the transmission of HCV has been developed, which explicitly separates unaware and aware susceptibles by incorporating diagnosis and hospitalization as separate transitions-a departure from classical SEIR-type formulations.
- This research presents a hybrid optimal-fuzzy control framework in which Pontryagin’s Maximum Principle determines the optimal controls that vary in time. Then, with uncertainty, awareness, diagnosis, and treatment intensities adjusted by a Mamdani-type fuzzy inference system.
- The fuzzy controller, through comparative simulations, extremely successfully suppresses epidemics at a cost that is reduced by almost two-thirds compared to the crisp optimal control strategy, thus representing a policy decision support system which is easier to understand and more efficient in terms of costs for public health scenarios.
2. Model Formulation
In this section, an analytical model shall be developed to analyze the process of infection propagation and treatment of HCV within a population. The Hepatitis C virus is high on the list of global health problems as its main route of transmission is through blood and contaminated blood. This can be qualified as misuse of medical products, intravenous drug use, and lack of knowledge. In addition, the problem of the evolution of the disease and the estimation of its incidence are of great importance in terms of taking measures to prevent HCV and its long-term effect.
The complexity of the population structure is represented by a simple one, six compartments for the different states of being aware, infected, and recovering from the disease.
- - Individuals who are at risk and unaware of HCV.
- - Individuals who are at risk and have either gone through training or have some form of information on HCV.
- U - Infected individuals who carry the infection but have yet to be diagnosed.
- I - Infected individuals who have completed the diagnosis and are either in treatment or under treatment.
- H - The severely infected population under intensive treatment.
- R - Individuals who have successfully dealt with infections through natural immunity or treatment.
People who move between groups are directly affected by the rate of infection, awareness campaigns, diagnosis, treatment, and the natural course of a disease. Awareness campaigns use media and education to shift populations from the unaware susceptible group () to the aware susceptible group (). Unidentified infections become identified cases once diagnosed or if the patient visits a doctor due to symptoms. The availability and effectiveness of treatment determine hospitalization and recovery.
To model these processes, a system of ordinary differential equations (ODEs) is constructed. This model takes into account natural mortality, disease-related mortality, and transfers between compartments influenced by infection, awareness, diagnosis, and recovery. Controls representing awareness campaigns, medical diagnosis, and treatment programs are incorporated to model their effects on the reduction of HCV burden.
Here are the assumptions used to build the model.
- The entire population follows natural birth and death rates.
- Awareness campaigns and the media are critical to influence the movements of people between susceptible compartments ().
- Symptomatic and random tests can result in unidentified infections that progress to diagnosed infections.
- Recovery can occur through treatment, innate immunity, or hospital care.
- The progression and mortality of the disease are different in the infected and hospitalized compartments.
Using these assumptions, the mathematical model is developed and presented along with a series of coupled differential equations.
The total population is denoted by .
The complete model is structured around six population groups, including the susceptible group unaware of HCV , the susceptible group aware of HCV , the group of unidentified HCV infected U, the group identified infected with HCV I, the group hospitalized H and the recovered group R. We posit that the recruitment rate associated with is A. People entering the unidentified infected U group through risky behaviors such as unprotected injections and blood transfusions take place at a rate , leading to inflow. A media awareness campaign changes the behavior of , moving a fraction of them, , into the class of infected awareness . The susceptible and classes continue to be infected due to unprotected injections or blood transfusions, leading to continued exposure of the infected population at a rate of ; continues to flow into the unidentified infected class. Despite the launch of awareness of the media through electronic and print media, social media, and other platforms, over time the memory of the campaign fades, and the rate at which the susceptible-aware population begins to act like the infected unaware population is equal to . In a given identified infected individual, a fraction of the unidentified infected population is determined after a medical investigation. There might be some recovery due to natural immunity at a cost of xi dollars per unit. Infected and identified individuals might also recover to the extent of as suggested by the innate immune system. students in the I class are transferred to the medical center after the incident. While at the level, the population in the I class undergoes disease-related mortality. Medical treatment is provided to infected individuals in hospitals where they can recover at a rate of . In addition, the hospitalized population experiences a higher death rate due to disease-related causes, at a rate of . There is a natural mortality rate of relating to each population subset.
3. Positivity of the Solution
In every epidemiological model, the key concern is to establish a positive solution. The term ’positive solution’ refers to infected, recovered, and susceptible populations within a model that cannot be less than zero. Positivity is important because it validates that the solution of the model is biologically reasonable as time increases.
The positivity condition of the model validates the non-negativity of the compartments of the population represented by the notation (susceptible unaware), (susceptible aware), U (unidentified infected), I (identified infected), H (hospitalized) and R (recovered) for all values of .
The positivity of the solutions can be verified by the analysis of the system of ODEs derived previously. Without loss of generality, it is sufficient to check the rate of change of the total population and the sub-populations on the model trajectories to ensure the absence of negative values. This can be achieved by studying the dynamics of the system, establishing upper and lower bounds on the total population, and verifying that the solutions with positive initial data stay within biologically feasible bounds for all time.
The following discussion shows that the solutions of all compartments of the model are positive for all under suitable initial conditions. This is an essential result to verify the credibility and practical use of the proposed model for HCV transmission.
Integrating both sides, we get the following.
Now, as , we have
Hence, all the solution of that initiating in for any and for .
4. Fixed Control Analysis
To understand the steady-state behavior of the HCV model under constant control measures, we analyze the system when all time derivatives are set to zero. This provides a set of algebraic equations that describe how each compartment behaves over a long period under fixed control parameters.
The starting point includes susceptible subpopulations and , which follow the steady-state equations outlined below.
Solving this system simultaneously for and , we obtain the following closed-form expressions:
where the common denominator D is given by:
These expressions represent the equilibrium levels of susceptible populations without awareness () and aware () as functions of recruitment rate A, infection rates , control effort , awareness parameters , and natural mortality .
The long-term allocation of the susceptible population is significantly affected by both awareness-based transition and infection patterns. An increase in the awareness control parameter () results in a decrease in , while increases, which is in line with expectations.
The other compartments of the model, namely unidentified infected (U), identified infected (I), hospitalized (H), and recovered (R), can be calculated in a sequential manner based on the following:
The mentioned equations characterize the endemic equilibrium , which is the steady-state of the system when the control strategies are kept constant. The analytical nature of these expressions is very useful in assessing the impact of awareness, diagnosis, and treatment interventions, and it also serves as an initial point for the further threshold and stability analysis.
4.1. Basic Reproduction Ratio
In epidemiological modeling, the basic reproduction number indicates the average number of secondary cases resulting from one infected person in a population that is completely susceptible to the virus. As a result, it marks a significant limit that confirms the spread () or extinction () of the infectious disease.
To calculate for the proposed HCV transmission model, we employ the Next Generation Matrix (NGM) method introduced by van den Driessche and Watmough [26]. This method requires identifying:
- The compartments contributing to new infections,
- The rates of new infections , and
- The rates of transition between infected compartments .
The infected compartments in the model are:
- : Unidentified infected individuals,
- : Identified infected individuals,
- : Hospitalized individuals.
Let be the vector of infected states. We define
- : the rate of appearance of new infections in compartment i,
- : the net rate of transfer into compartment i by all other means.
New infections arise in the U class by contact with infected individuals (U and I). Therefore,
We compute the Jacobians and evaluated at the disease-free equilibrium (DFE) where . Then,
The basic reproduction number is given by the spectral radius (dominant eigenvalue) of , which in this case reduces to:
This expression indicates that the infection will die out () if the combined transmission rate from both susceptible groups and the infectious potential of the identified and unidentified infected individuals is outweighed by the rates of detection, treatment, recovery and death. It provides a crucial threshold for evaluating the effectiveness of awareness campaigns (), diagnosis efforts (), and hospitalization interventions ().
Sensitivity Analysis of
In addition to the analytical expression of the basic reproduction number , a sensitivity analysis was performed. The analysis offers a valuable insight into the effects of critical epidemiological parameters by comparing them with one another. The findings are depicted in Figure 1. The analysis reveals that the transmission coefficients (for susceptible unaware) and (for susceptible aware) have the strongest positive influence on , indicating that the spread of the disease can be easily and directly increased by increasing transmission. Unlike rates and , the remaining parameters exhibit a slight increase in their effectiveness. Even the very effective rate of hospitalization and treatment has a negative impact when it comes to enhancing the processes that ultimately reduce viral reproductive capacity.
This sensitivity ranking gives very tangible insights into the ranking of interventions. In particular, reducing awareness programs by , improving early diagnostic campaigns by , and enhancing treatment protocols by are the most impactful levers to reduce . These parameters, when targeted in resource-constrained settings, are expected to yield the greatest epidemiological benefit. Hence, Figure 1 not only lays down the theoretical threshold analysis but also provides a practical roadmap for the development of economically feasible control measures, while underlining the crucial parameters that decide whether HCV dissemination would or would not be possible among the population.
5. Optimal Control Theory
To minimize the burden of HCV infections in the population while controlling the costs and side effects of interventions, we formulate an optimal control problem incorporating three time-dependent control strategies.
- : effort in awareness campaigns,
- : effort in early diagnosis of unidentified infected individuals,
- : medical treatment for hospitalized individuals.
The goal is to find the control functions over the finite time interval such that:
is minimized. Here, represent the weights given to the number of infected individuals, while are weights associated with the cost and side effects of implementing controls.
The set of controls is given by:
The system dynamics is given by the state equations defined earlier in Equation (1). The objective is to find the optimal triple of controls such that
Pontryagin’s maximum principle helps in deriving the necessary optimal conditions. So, we can define the Hamiltonian function as:
where for are adjoint variables for the states , respectively.
The adjoint system is specified as:
which constitute a terminal value problem.
The optimal controls that minimize the Hamiltonian with respect to and are given by:
To maintain the appropriate ratio of infection and intervention costs, the system continuously adapts these control functions based on the current state of the system and the costate values.
The state and adjoint equations along with the optimality conditions form a two-point boundary value problem. Numerical techniques such as the forward-backward sweep method can be used to solve this system.
6. Numerical Results
In order to validate the theoretical findings, we consider the following numerical experiment. We completed the numerical experiment with some hypothetical data and some real data taken from the Internet. The hypothetical data are as follows: , . The demographic parameters are initially taken as follows: .
Through experiments on numerical data, it is revealed that the uncontrolled epidemic dynamics and optimal control interventions have totally different outcomes.
Without intervention strategies in place (shown in Figure 2), infected populations, both identified and not, grow at an accelerating rate, adding up to a considerable increase in the number of hospitalized cases and the overall burden of the disease. The classes of susceptible individuals (both aware and unaware) decrease significantly in number over time, serving as a clear indicator of HCV’s uncontrolled spread among the population. This uncontrolled progression further underscores the need for targeted interventions to mitigate the rapid increase in epidemics and the use of health services.
However, the optimal control measures, which also included awareness campaigns, early diagnosis, and treatments, completely changed the epidemic’s direction, as depicted in Figure 3. With the help of awareness program (), the number of susceptible individuals in the group of unaware ones goes down since they are gradually being transferred to the aware susceptible class, and as a result, the new infections get reduced. On the parallel side, diagnostic control accelerates the flow of unidentified infected individuals to the identified group, where they can receive more effective treatment. Then control of treatment reduces the number of hospitalizations, which in turn helps patients to recover faster. All measures taken together are functioning to reduce the increase in infections and hospitalizations while at the same time increasing the number of recoveries. The entire situation results in the healthcare system experiencing a slightly reduced burden, as well as the disease.
The results indicate that the execution of correct and prompt preventive measures is necessary for controlling HCV. Comparing the differences in Figure 2 and Figure 3, it is evident that the joint efforts of awareness, diagnosis, and treatment have a huge impact on the infection rates and the healthcare system even when the funds are limited.
Explainability and Policy Insight
The optimal control framework provides both quantitative rigor and transparent policy directions. Unlike black-box models, each component of the system has clear epidemiological meaning, allowing policymakers to trace:
- how awareness modifies the susceptible composition,
- how diagnosis shifts hidden infections into actionable states,
- and how treatment clears the infection burden.
This mechanistic interpretability offers a distinct advantage. For example:
- Increasing shifts the balance from unaware to aware susceptibles, thus indirectly reducing U through reduced exposure.
- The diagnostic rate directly modulates the transition from U to I, affecting both the hospitalization and recovery chains.
- The costate variables provide insight into the marginal cost-benefit ratio of each compartment at each point in time, helping to interpret the temporal shape of the optimal controls.
These results strengthen confidence in model-based public health strategies. They also demonstrate that optimal control theory, when applied to infectious disease models, yields not only effective policies but also interpretable and explainable mechanisms for disease suppression.
7. Fuzzy Logic–Based HCV Intervention Model
Classical optimal control assumes precise states and parameters. In practice, HCV surveillance data are noisy, behavior is variable, and the capacity of the health system fluctuates. Fuzzy logic provides a principled way to encode expert knowledge with linguistic rules and to act under uncertainty while keeping decisions interpretable.
We keep the six-compartment model in Equation (1). At time t, define the normalized inputs:
where is the surge capacity (policy choice or historical peak). The fuzzy controller outputs the three control intensities (awareness), (screening/diagnosis), (treatment for hospitalized patients), each in .
7.1. Rationale for Using Fuzzy Logic in the HCV Model
The use of fuzzy logic in the current Hepatitis C Virus (HCV) model stems from uncertainty and imprecision in epidemiological parameters—such as awareness effectiveness, diagnosis rate, and treatment coverage—which differ due to a range of social, behavioral, and operational factors. Traditional deterministic or purely optimal control models are predicated on the assumption that knowledge of these parameters is precise; however, this may not provide a full representation of real-world scenarios. Fuzzy logic represents a powerful alternative when dealing with these uncertainties by converting linguistic variables—such as "high prevalence," "low awareness," or "medium load on hospitals,"—into adaptive numerical control actions across the spectrum using rules defined by an expert. This enables real-time adjustments of awareness, diagnosis, and treatment intensities as the epidemic state changes, and does not require recalibration of the models. This approach also promotes interpretability, as each fuzzy rule is an explicit representation of human reasoning, and computational efficiency, avoiding the iterative optimization characteristic of Pontryagin’s maximum principle. Fuzzy logic provides added robustness to the model, as it maintains a stable level of suppression of epidemic transmission even in the presence of parameter uncertainty or data noise. In conclusion, a fuzzy intervention planning framework provides a flexible, interpretable, and cost-effective decision-support mechanism for planning HCV interventions in environmentally constrained situations.
7.2. Membership Functions
Each input and output uses three linguistic terms Low, Medium, High. We employ triangular membership functions in with parameters chosen for smooth overlap (Table 1). The triangular is
7.3. Fuzzy Rule Base
We adopt Mamdani inference with min–max composition and centroid defuzzification. The rule base encodes epidemiological heuristics: high infection pressure warrants strong awareness and screening; high hospital load triggers stronger treatment.
Awareness control :
| IF is High) AND is Low) | THEN is High |
| IF is Medium) AND is Medium) | THEN is Medium |
| IF is Low) OR is High) | THEN is Low |
Screening control :
| IF is High) AND is Low) THEN is High |
| IF is Medium) THEN is Medium |
| IF is Low) THEN is Low |
Treatment control :
| IF is High) AND is High) THEN is High |
| IF is Medium) THEN is Medium |
| IF is Low) THEN is Low |
Figures show fuzzy controller output maps such as Figure 4, Figure 5 and Figure 6. The figure representing control is shown in Figure 4. The high infection pressure with low awareness results in considerable change in this control. The figure shows the change in control from Figure 5 to Figure , involving elevation with an increase in IP value and a decrease in a low AL value. The control surface shown in Figure 6 is defined as , with its maximum peak occurring when both of these values are at their extremes. All these surfaces are generated using centroid defuzzification and elaborated with control laws applied to the close-loop ODE simulation at each time step.
7.4. Defuzzification
The aggregate output sets () are converted to crisp actions via the centroid:
7.5. Coupling with the ODE Model
At each numerical step : (i) compute the inputs from state ; (ii) fuzzify, infer, aggregate, defuzzify to get ; (iii) integrate Equation (1) with controls held piecewise-constant on .
|
Algorithm 1: Mamdani Fuzzy Controller for HCV Controls
|
|
| Algorithm 2:Closed-loop Simulation (Fuzzy-in-the-Loop) |
 |
7.6. Figures: Membership Functions
7.7. Evaluation Plan (Crisp vs Fuzzy)
For completeness, we propose comparing three scenarios using the same initial conditions and parameters as Section 6: (i) no control, (ii) Pontryagin-optimal controls, (iii) fuzzy controls. Metrics: peak , time below , cumulative cost .
7.8. Remarks and Extensions
The fuzzy controller can be hybridized with RL by (a) using fuzzy features as policy inputs, or (b) learning rule weights. Uncertainty in can be represented as fuzzy numbers to propagate imprecision into via -cuts.
8. Comparison Between Crisp Optimal and Fuzzy Control
To quantitatively evaluate the proposed fuzzy logic–based intervention framework, we performed a numerical experiment in which the six-compartment HCV model (1) was solved under two closed-loop control regimes:
- Fuzzy optimal control: Time-dependent controls computed by the Mamdani-type fuzzy inference system defined in Section 7, with triangular membership functions and rule base given in Table 1 and Table 2. The controls are adaptively updated at each integration step according to the current epidemiological state.
Both simulations use identical initial conditions and demographic/epidemiological parameters. The infected fraction is tracked over the 365-day horizon, together with the individual control profiles (awareness), (screening) and (treatment).
The dynamical behavior of Model (1) over ranges of awareness and diagnosis rate assuming/having parameters found in Section 6 is graphically represented in Figure 10 and Figure 11. These surfaces illustrate the non-linear relationship between the prevalence of infection and the intensity of joint control ability, and their biological significance is meaningful for the design of combined HCV intervention policies.
Both the crisp and fuzzy control techniques have been highly effective in reducing the prevalence of infection quickly, as depicted in Figure 12. The solution of the crisp PMP reaches a slightly lower trough a little earlier in the simulation, while the fuzzy controller that does not need adjoint equations or gradients stays very near the crisp solution. This demonstrates that the fuzzy rule base, although heuristic, effectively captures the appropriate patterns of interventions.
The control trajectories in Figure 13, Figure 14 and Figure 15 illustrate the qualitative differences. Under PMP, and are initially high and decrease as the infected fraction declines; peaks later in response to hospital load. Fuzzy controls are smoother and more persistent, reflecting their rule-based nature. In particular, in the fuzzy case responds proportionally to hospital load without sharp peaks, which may be advantageous in resource-limited settings.
The Fuzzy Controller with its performance comparable to the PMP benchmark provides epidemic suppression.
- Interpretability: Each decision can be traced to explicit IF–THEN rules.
- Robustness to parameter uncertainty: No need for exact transmission/recovery rates.
- Computational simplicity: No iterative solution of a two-point boundary value problem.
The quantitative performance metrics for both strategies are summarized in Table 3. Although both achieve identical peak infection values and timings, the crisp PMP approach attains a slightly lower minimum infected fraction and reaches it earlier (78.2 vs. 96.6 days). In particular, fuzzy control achieves a substantially lower total cost J (42.42 vs. 126.38), reflecting reduced intervention intensity without a significant loss in epidemiological performance. The time to achieve was not reached within the 365-day horizon for either case. These results support the viability of the fuzzy approach as a low-cost, interpretable alternative to PMP-based optimal control.
9. Conclusions
In this study, we present a comprehensive deterministic compartmental model for HCV transmission, which comprises susceptible, exposed, acutely infected, chronically infected, treated and recovered groups. The epidemiological data set made a significant contribution to the development of the model by allowing the parameter tuning process. Consequently, the developed model enabled a more thorough investigation into the disease dynamics by utilizing the basic reproduction number and conducting a stability analysis of the equilibrium points. The three intervention measures—public awareness, screening, and antivirus therapy—were integrated into an optimal control problem and solved using the forward-backward sweep method, as per Pontryagin’s Maximum Principle.
A Mamdani type fuzzy logic controller was constructed to handle the uncertainty of the parameters and operational limitations, mapping linguistic variables such as infection prevalence, awareness level, and healthcare care occupancy to time-varying intervention intensities. Upon comparing the simulations, the effects of crisp optimal control and fuzzy logic control on the HCV prevalence are found to be similar, in that both reduce it. The main difference between the fuzzy control method and the others is that the former one is not as heavy as the latter in terms of logic implementation and costs, which, in turn, simplifies the control implementation. This peculiarity makes the fuzzy approach more acceptable for public health control measure applications, especially in underfunded areas.
Sensitivity analysis identified the most influential characteristics that affect , which guide policy makers in algorithmically prioritizing intervention resources. This integration of mathematical modeling, optimal control, and fuzzy logic establishes the foundation for an efficient, cost-effective, and comprehensible decision support system for the prevention and control of HCV.
Future advancements may enable the application of some aspects to multipathogen co-infection models and stochastic frameworks, together with real-time adaptive control mechanisms informed by streaming surveillance data. In addition, in the future, incorporate economic and behavioral feedback loops to model public response to awareness campaigns and access to treatment.
Author Contributions
Conceptualization, D.K. and M.K.S; methodology, B.K.; software, S.K.; validation, D.K., B.K. and S.K.; formal analysis, B.K.; investigation, B.K.; resources, M.K.S; data curation, B.K.; writing—original draft preparation, B.K. and S.K; writing—review and editing, D.K.; visualization, B.K. and S.K.; supervision, D.K. and M.K.S; project administration, X.X.. All authors have read and agreed to the published version of the manuscript.
Funding
This research received no external funding.
Institutional Review Board Statement
Not applicable.
Informed Consent Statement
Not applicable.
Conflicts of Interest
The authors declare no conflicts of interest.
References
- Hagan, H.; Des Jarlais, D.C.; Stern, R.; Lelutiu-Weinberger, C.; Scheinmann, R.; Strauss, S.; Flom, P.L. HCV synthesis project: preliminary analyses of HCV prevalence in relation to age and duration of injection. International Journal of Drug Policy 2007, 18, 341–351. [Google Scholar] [CrossRef]
- Thein, H.H.; Yi, Q.; Dore, G.J.; Krahn, M.D. Natural history of hepatitis C virus infection in HIV-infected individuals and the impact of HIV in the era of highly active antiretroviral therapy: a meta-analysis. Aids 2008, 22, 1979–1991. [Google Scholar]
- Martin, N.K.; Vickerman, P.; Foster, G.R.; Hutchinson, S.J.; Goldberg, D.J.; Hickman, M. Can antiviral therapy for hepatitis C reduce the prevalence of HCV among injecting drug user populations? A modeling analysis of its prevention utility. Journal of hepatology 2011, 54, 1137–1144. [Google Scholar] [CrossRef]
- Martin, N.K.; Vickerman, P.; Hickman, M. Mathematical modelling of hepatitis C treatment for injecting drug users. Journal of theoretical biology 2011, 274, 58–66. [Google Scholar] [PubMed]
- Martin, N.; Vickerman, P.; Foster, G.; Miners, A.; Hutchinson, S.; Goldberg, D.; Hickman, M. THE COST-EFFECTIVENESS OF HCV ANTIVIRAL TREATMENT FOR INJECTING DRUG USER POPULATIONS. In Proceedings of the GUT. BMJ PUBLISHING GROUP BRITISH MED ASSOC HOUSE, TAVISTOCK SQUARE, LONDON WC1H …, 2011; Vol. 60, pp. A25–A25. [Google Scholar]
- Martin, N.K.; Vickerman, P.; Grebely, J.; Hellard, M.; Hutchinson, S.J.; Lima, V.D.; Foster, G.R.; Dillon, J.F.; Goldberg, D.J.; Dore, G.J.; et al. Hepatitis C virus treatment for prevention among people who inject drugs: modeling treatment scale-up in the age of direct-acting antivirals. Hepatology 2013, 58, 1598–1609. [Google Scholar] [CrossRef]
- Rolls, D.A.; Sacks-Davis, R.; Jenkinson, R.; McBryde, E.; Pattison, P.; Robins, G.; Hellard, M. Hepatitis C transmission and treatment in contact networks of people who inject drugs. PloS one 2013, 8, e78286. [Google Scholar] [CrossRef]
- Hellard, M.; McBryde, E.; Davis, R.S.; Rolls, D.A.; Higgs, P.; Aitken, C.; Thompson, A.; Doyle, J.; Pattison, P.; Robins, G. Hepatitis C transmission and treatment as prevention–The role of the injecting network. International Journal of Drug Policy 2015, 26, 958–962. [Google Scholar] [CrossRef]
- Scott, N.; McBryde, E.; Vickerman, P.; Martin, N.K.; Stone, J.; Drummer, H.; Hellard, M. The role of a hepatitis C virus vaccine: modelling the benefits alongside direct-acting antiviral treatments. BMC medicine 2015, 13, 1–12. [Google Scholar] [CrossRef]
- Blach, S.; Zeuzem, S.; Manns, M.; Altraif, I.; Duberg, A.S.; Muljono, D.H.; Waked, I.; Alavian, S.M.; Lee, M.H.; Negro, F.; et al. Global prevalence and genotype distribution of hepatitis C virus infection in 2015: a modelling study. The lancet Gastroenterology & hepatology 2017, 2, 161–176. [Google Scholar]
- Degenhardt, L.; Peacock, A.; Colledge, S.; Leung, J.; Grebely, J.; Vickerman, P.; Stone, J.; Cunningham, E.B.; Trickey, A.; Dumchev, K.; et al. Global prevalence of injecting drug use and sociodemographic characteristics and prevalence of HIV, HBV, and HCV in people who inject drugs: a multistage systematic review. The Lancet Global Health 2017, 5, e1192–e1207. [Google Scholar] [CrossRef] [PubMed]
- Iversen, J.; Grebely, J.; Catlett, B.; Cunningham, P.; Dore, G.J.; Maher, L. Estimating the cascade of hepatitis C testing, care and treatment among people who inject drugs in Australia. International Journal of Drug Policy 2017, 47, 77–85. [Google Scholar] [CrossRef] [PubMed]
- Martin, N.K.; Hickman, M.; Miners, A.; Hutchinson, S.J.; Taylor, A.; Vickerman, P. Cost-effectiveness of HCV case-finding for people who inject drugs via dried blood spot testing in specialist addiction services and prisons. BMJ open 2013, 3, e003153. [Google Scholar] [CrossRef] [PubMed]
- Scott, N.; Ólafsson, S.; Gottfreðsson, M.; Tyrfingsson, T.; Rúnarsdóttir, V.; Hansdottir, I.; Hernandez, U.B.; Sigmundsdóttir, G.; Hellard, M. Modelling the elimination of hepatitis C as a public health threat in Iceland: a goal attainable by 2020. Journal of hepatology 2018, 68, 932–939. [Google Scholar] [CrossRef]
- Zelenev, A.; Li, J.; Mazhnaya, A.; Basu, S.; Altice, F.L. Hepatitis C virus treatment as prevention in an extended network of people who inject drugs in the USA: a modelling study. The Lancet Infectious Diseases 2018, 18, 215–224. [Google Scholar] [CrossRef]
- Kapadia, S.N.; Marks, K.M. Hepatitis C management simplification from test to cure: a framework for primary care providers. Clinical therapeutics 2018, 40, 1234–1245. [Google Scholar] [CrossRef]
- Chhatwal, J.; Chen, Q.; Bethea, E.D.; Hur, C.; Spaulding, A.C.; Kanwal, F. The impact of direct-acting anti-virals on the hepatitis C care cascade: identifying progress and gaps towards hepatitis C elimination in the United States. Alimentary pharmacology & therapeutics 2019, 50, 66–74. [Google Scholar]
- Grebely, J.; Larney, S.; Peacock, A.; Colledge, S.; Leung, J.; Hickman, M.; Vickerman, P.; Blach, S.; Cunningham, E.B.; Dumchev, K.; et al. Global, regional, and country-level estimates of hepatitis C infection among people who have recently injected drugs. Addiction 2019, 114, 150–166. [Google Scholar]
- Heffernan, A.; Cooke, G.S.; Nayagam, S.; Thursz, M.; Hallett, T.B. Scaling up prevention and treatment towards the elimination of hepatitis C: a global mathematical model. The Lancet 2019, 393, 1319–1329. [Google Scholar] [CrossRef]
- Regina Siqueira Ortega, N.; Cesar Sallum, P.; Massad, E. Fuzzy dynamical systems in epidemic modelling. Kybernetes 2000, 29, 201–218. [Google Scholar] [CrossRef]
- Arji, G.; Ahmadi, H.; Nilashi, M.; Rashid, T.A.; Ahmed, O.H.; Aljojo, N.; Zainol, A. Fuzzy logic approach for infectious disease diagnosis: A methodical evaluation, literature and classification. Biocybernetics and biomedical engineering 2019, 39, 937–955. [Google Scholar] [CrossRef] [PubMed]
- Jiang, Q.; Zhou, X.; Wang, R.; Ding, W.; Chu, Y.; Tang, S.; Jia, X.; Xu, X. Intelligent monitoring for infectious diseases with fuzzy systems and edge computing: A survey. Applied Soft Computing 2022, 123, 108835. [Google Scholar] [CrossRef]
- Shi, X.; Li, J.; Huang, A.; Song, S.; Yang, Z. Assessing the outbreak risk of epidemics using fuzzy evidential reasoning. Risk Analysis 2021, 41, 2046–2064. [Google Scholar] [CrossRef] [PubMed]
- Rafiei, H.; Salehi, A.; Baghbani, F.; Parsa, P.; Akbarzadeh-T, M.R. Interval type-2 Fuzzy control and stochastic modeling of COVID-19 spread based on vaccination and social distancing rates. Computer Methods and Programs in Biomedicine 2023, 232, 107443. [Google Scholar] [CrossRef] [PubMed]
- Borah, M.; Roy, B.K.; Kapitaniak, T.; Rajagopal, K.; Volos, C. A revisit to the past plague epidemic (India) versus the present COVID-19 pandemic: fractional-order chaotic models and fuzzy logic control. The European Physical Journal Special Topics 2022, 231, 905–919. [Google Scholar] [CrossRef]
- Van den Driessche, P.; Watmough, J. Reproduction numbers and sub-threshold endemic equilibria for compartmental models of disease transmission. Mathematical biosciences 2002, 180, 29–48. [Google Scholar] [CrossRef]
Figure 1.
Sensitivity analysis of the basic reproduction number () concerning key epidemiological parameters. The illustration indicates the characteristics that have most significantly and least significantly affected , thus, rendering their respective intervention measures more or less prioritized. The diagram illustrates the extent to which changes in the main parameters, particularly the rates of transmission () and those of diagnosis (), affect the potential for HCV transmission in the community. An increasing indicates a higher potential for the disease to spread, while higher values imply a lower potential for HCV infection due to faster diagnosis and treatment of the disease; biological efficiency is nevertheless always a balancing act between the potential for transmission and the potential for control of the disease, i.e., the effectiveness of interventions.
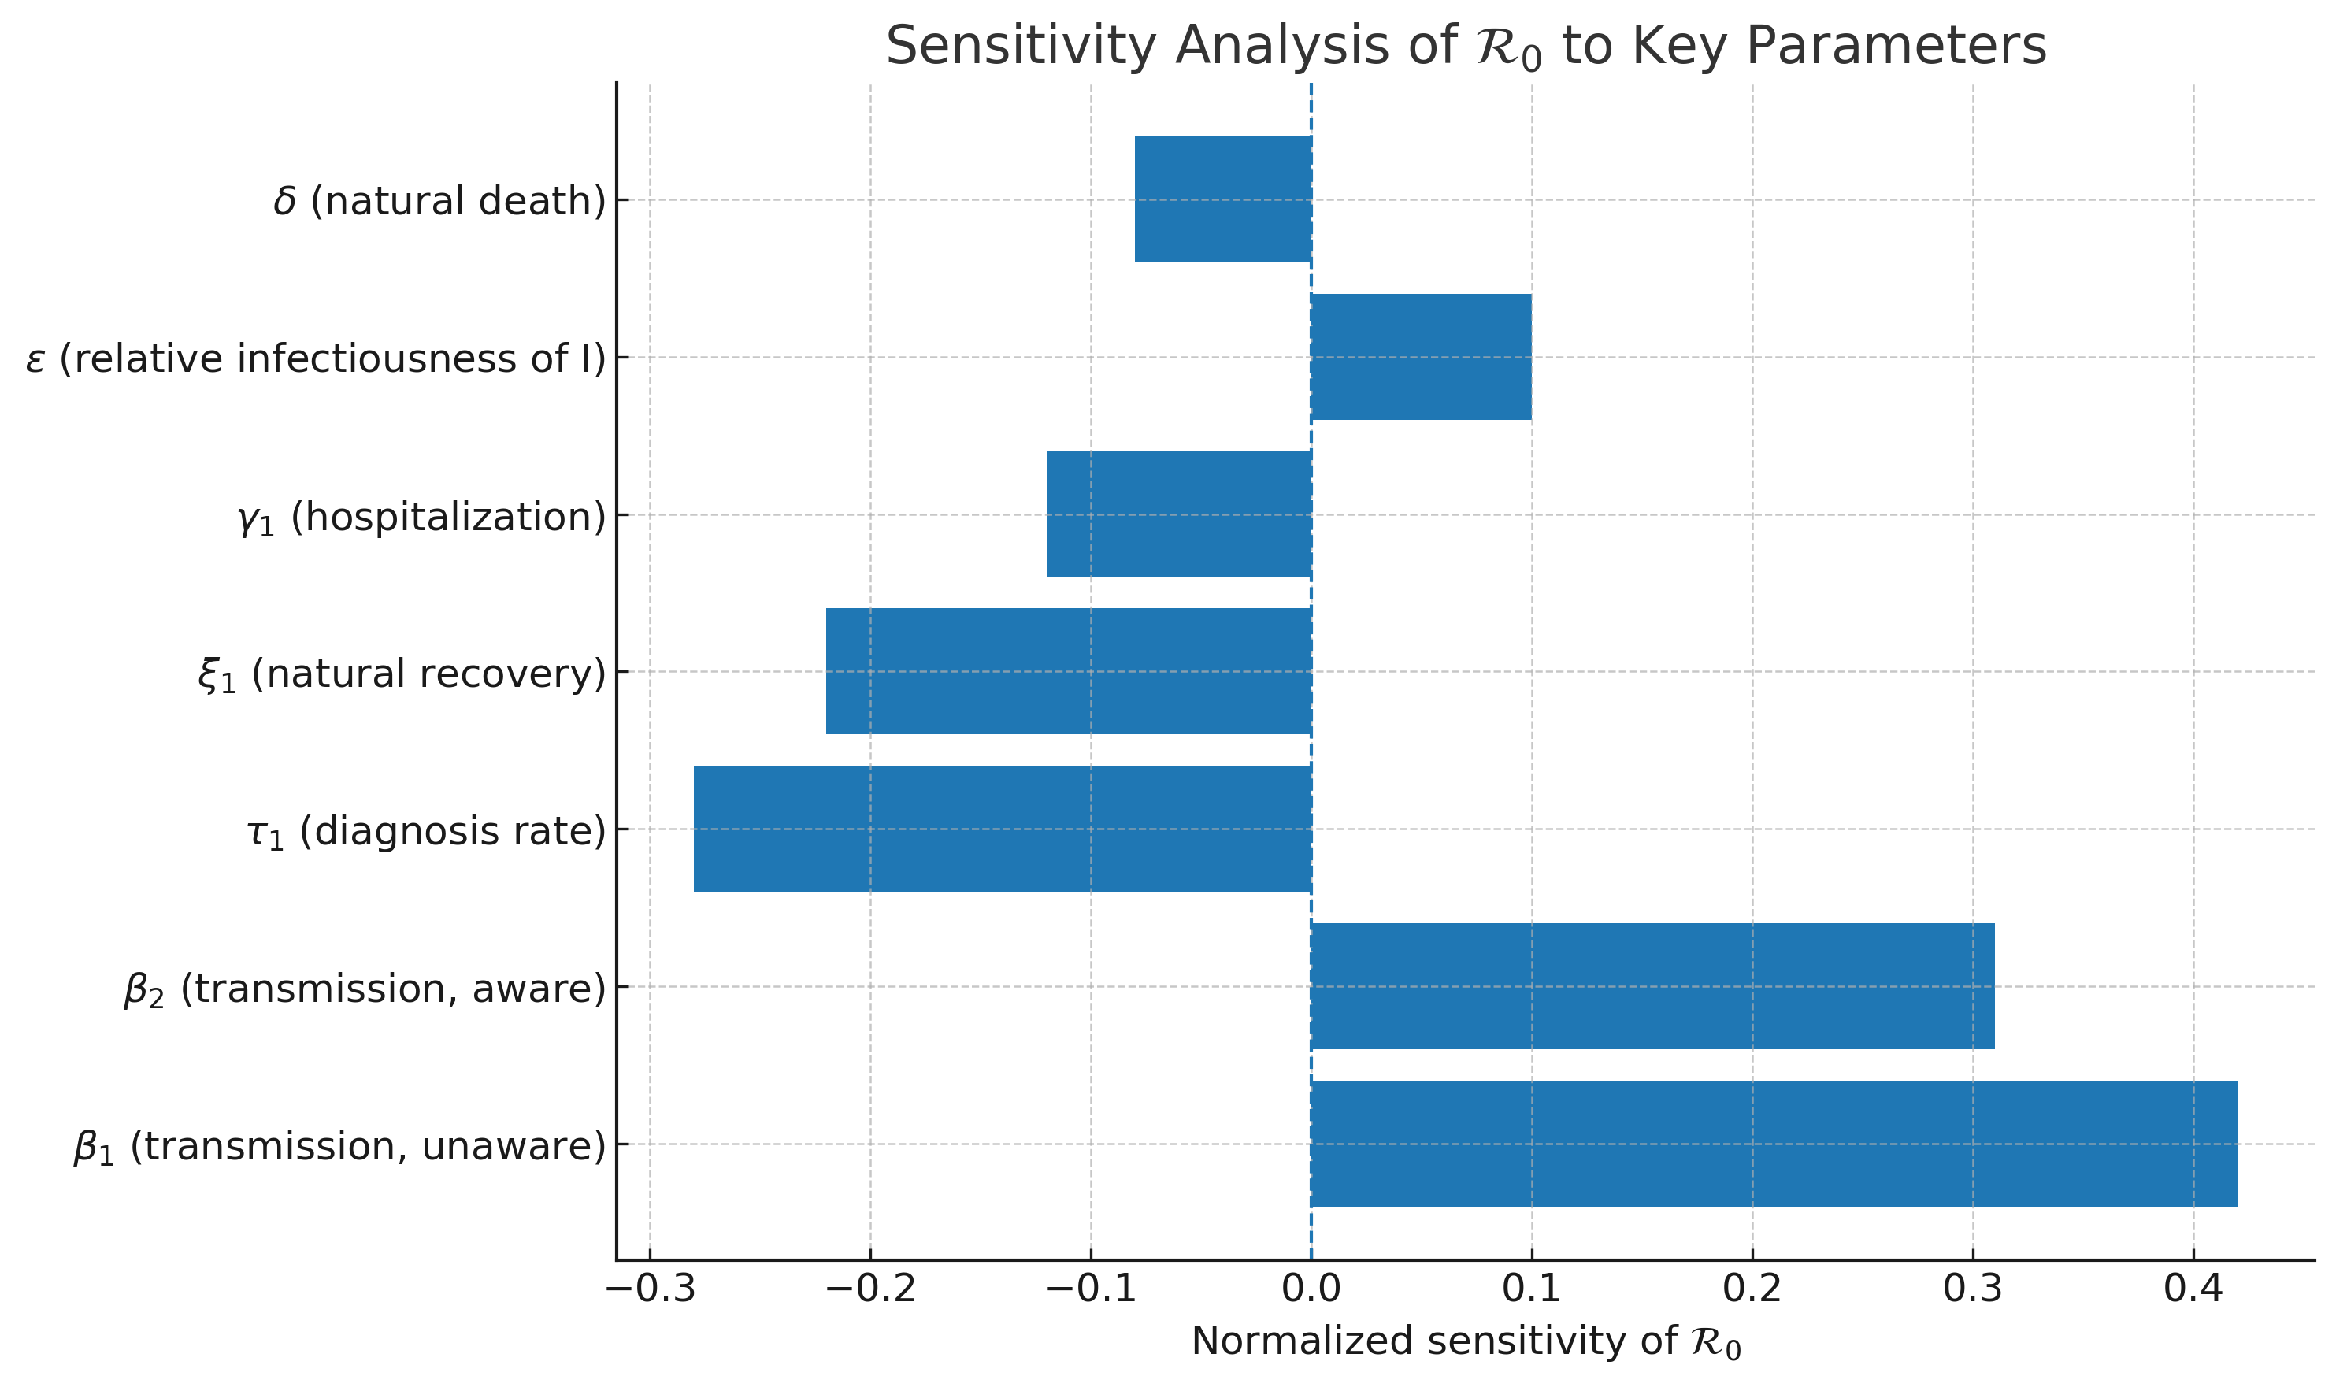
Figure 2.
Dynamics of HCV compartments under baseline simulation without control interventions. This scenario represents an uncontrolled epidemic phase where awareness, screening, and treatment efforts are absent, mirroring the real-world escalation of an outbreak under minimal healthcare response.
Figure 2.
Dynamics of HCV compartments under baseline simulation without control interventions. This scenario represents an uncontrolled epidemic phase where awareness, screening, and treatment efforts are absent, mirroring the real-world escalation of an outbreak under minimal healthcare response.
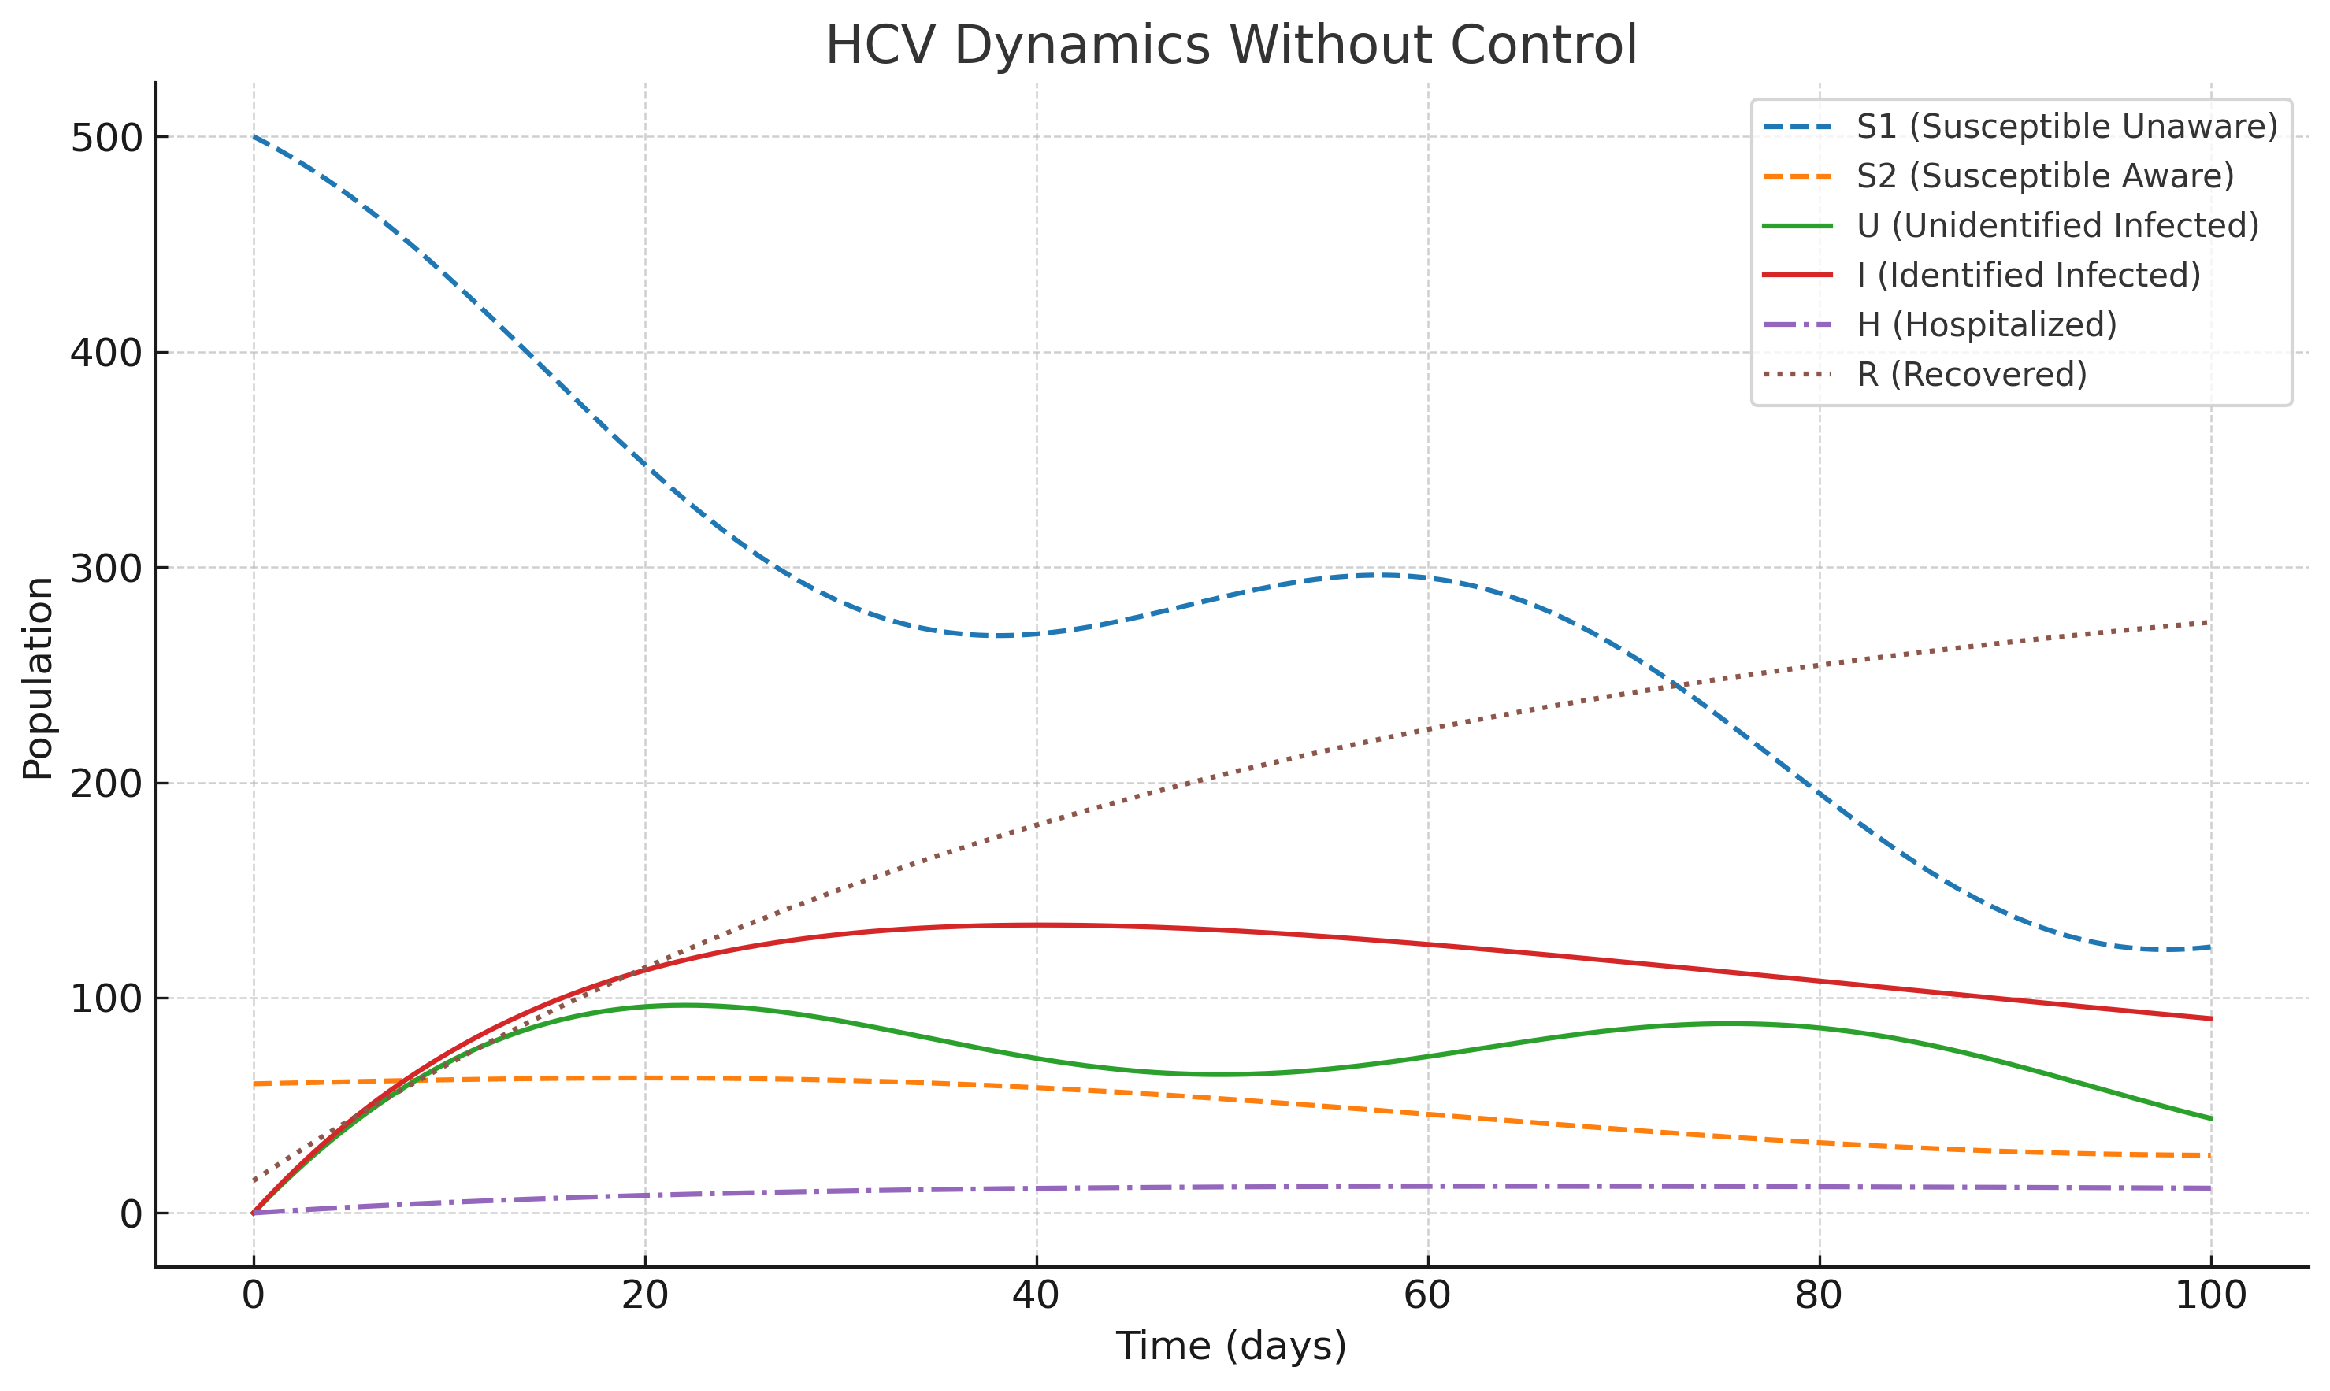
Figure 3.
Dynamics of HCV compartments under optimal control interventions. This illustrates the biological effect of immediate public health actions—cutting down transmission chains, enhancing patient outcomes, and lessening healthcare pressure.
Figure 3.
Dynamics of HCV compartments under optimal control interventions. This illustrates the biological effect of immediate public health actions—cutting down transmission chains, enhancing patient outcomes, and lessening healthcare pressure.
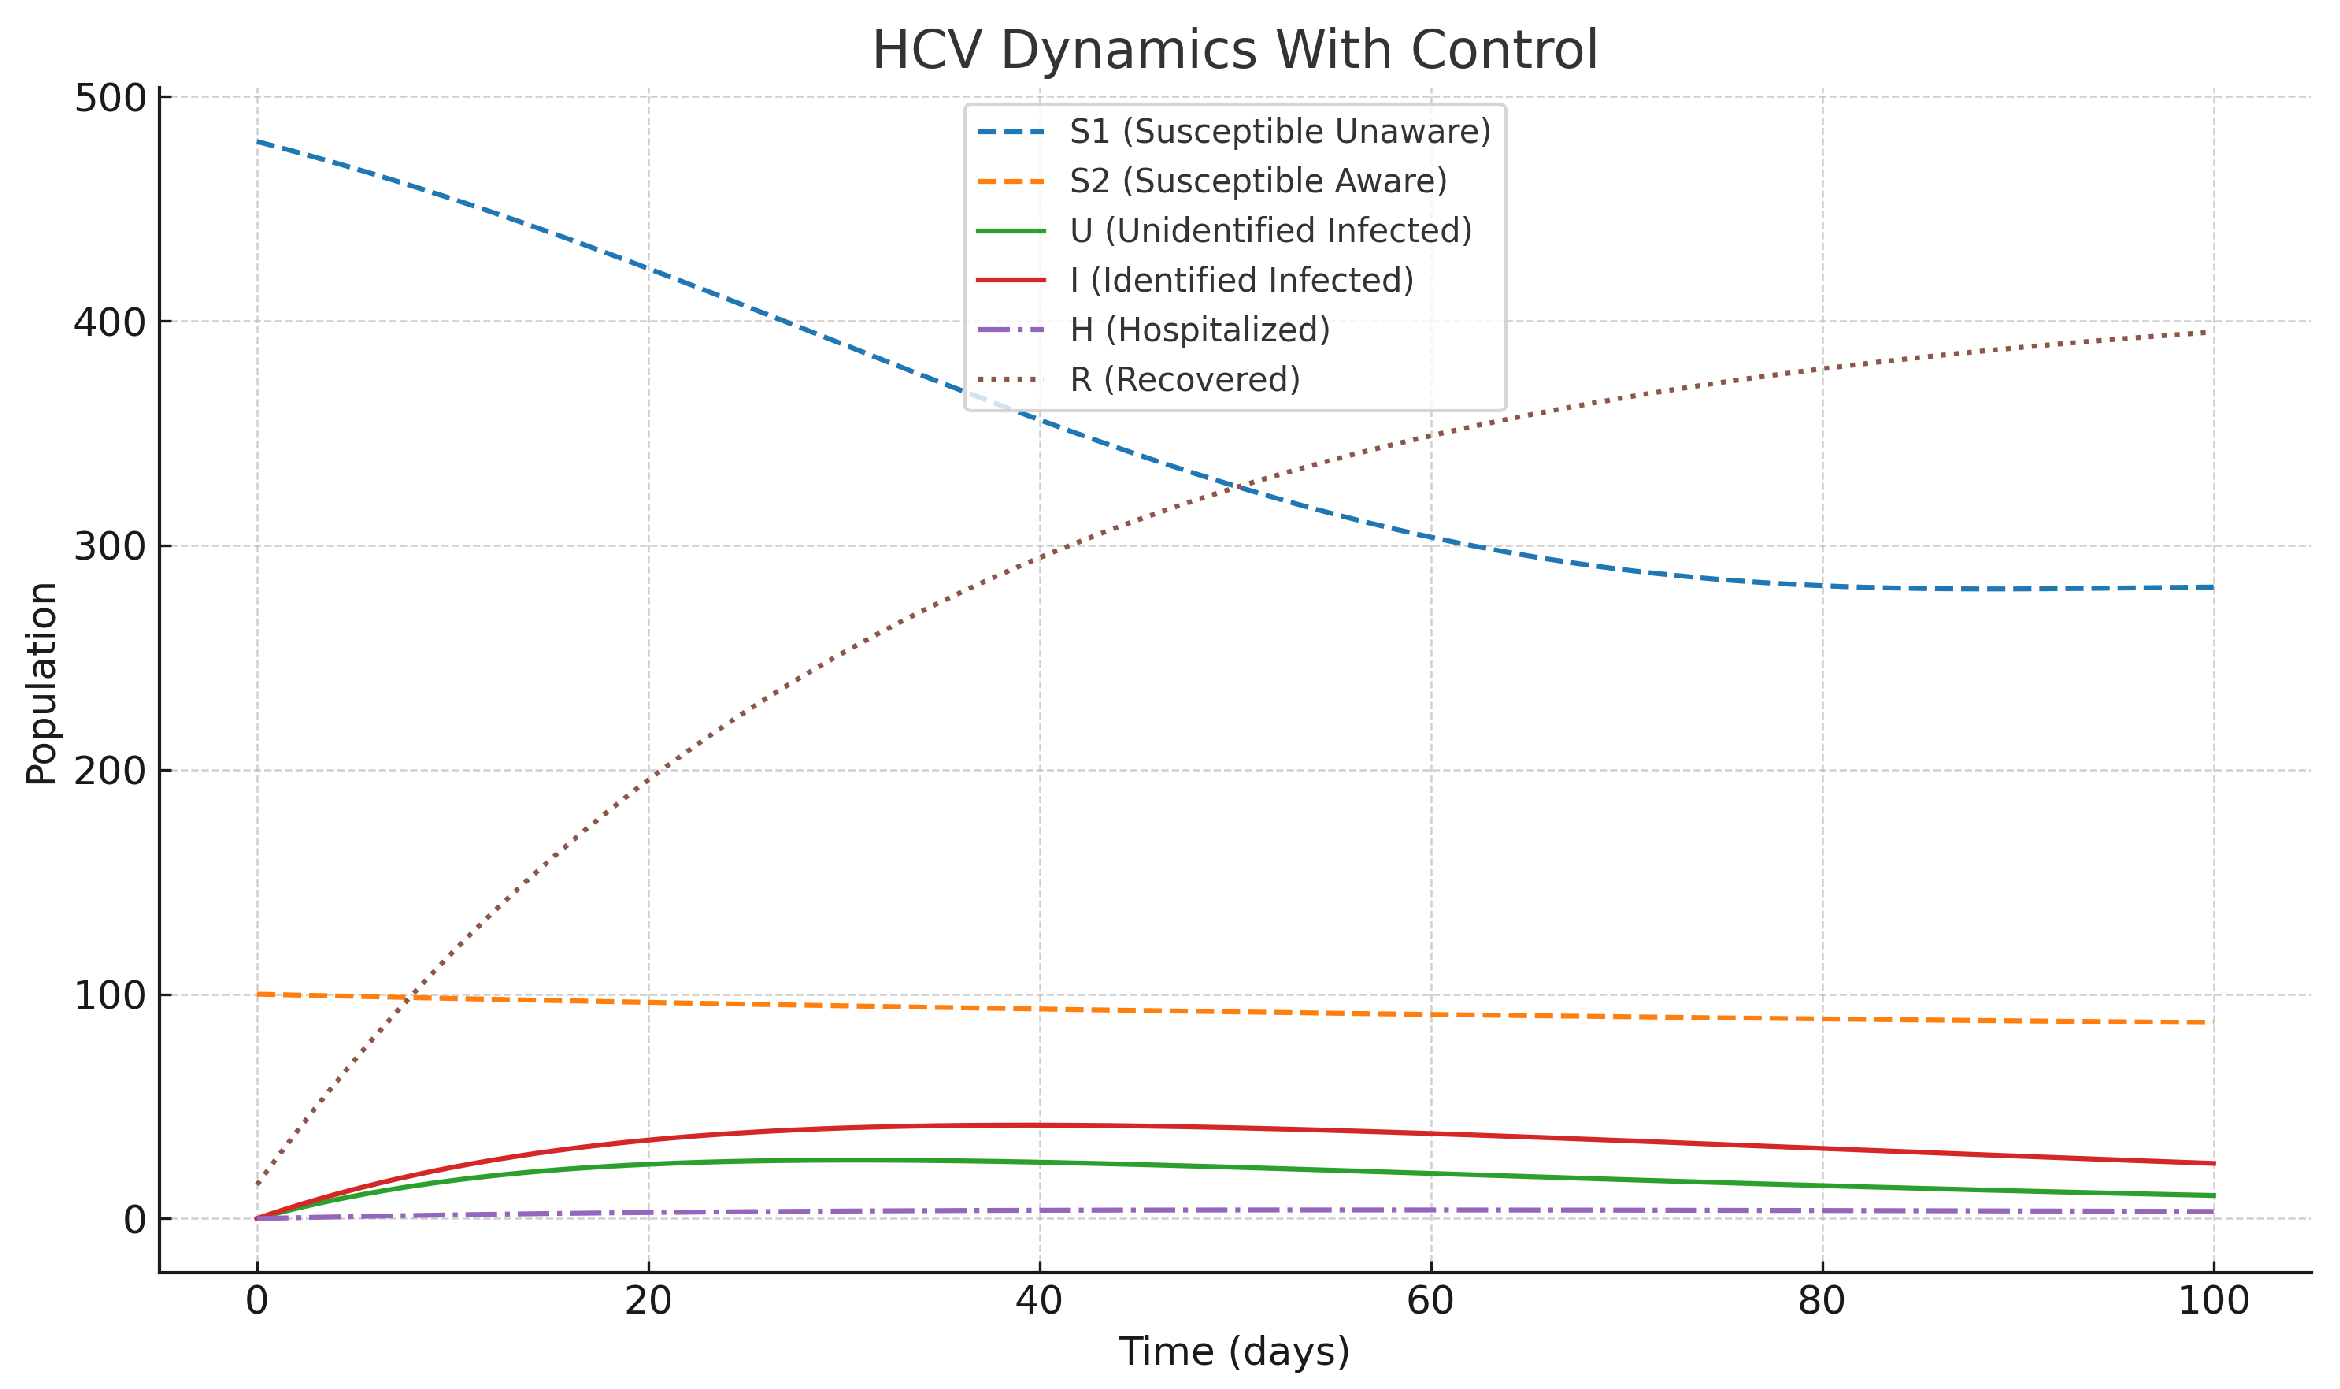
Figure 4.
Fuzzy control surface for awareness intensity as a function of IP and AL. The control is high when IP is high and AL is low, and low when AL is high or IP is low, consistent with the awareness rules. The surface indicates that a combination of high infection pressure and low community awareness requires a greater level of awareness interventions. This illustrates the need for behavioral sensitization to increase more during periods of peak pandemic transmission to reduce subsequent transmission through informed prevention efforts.
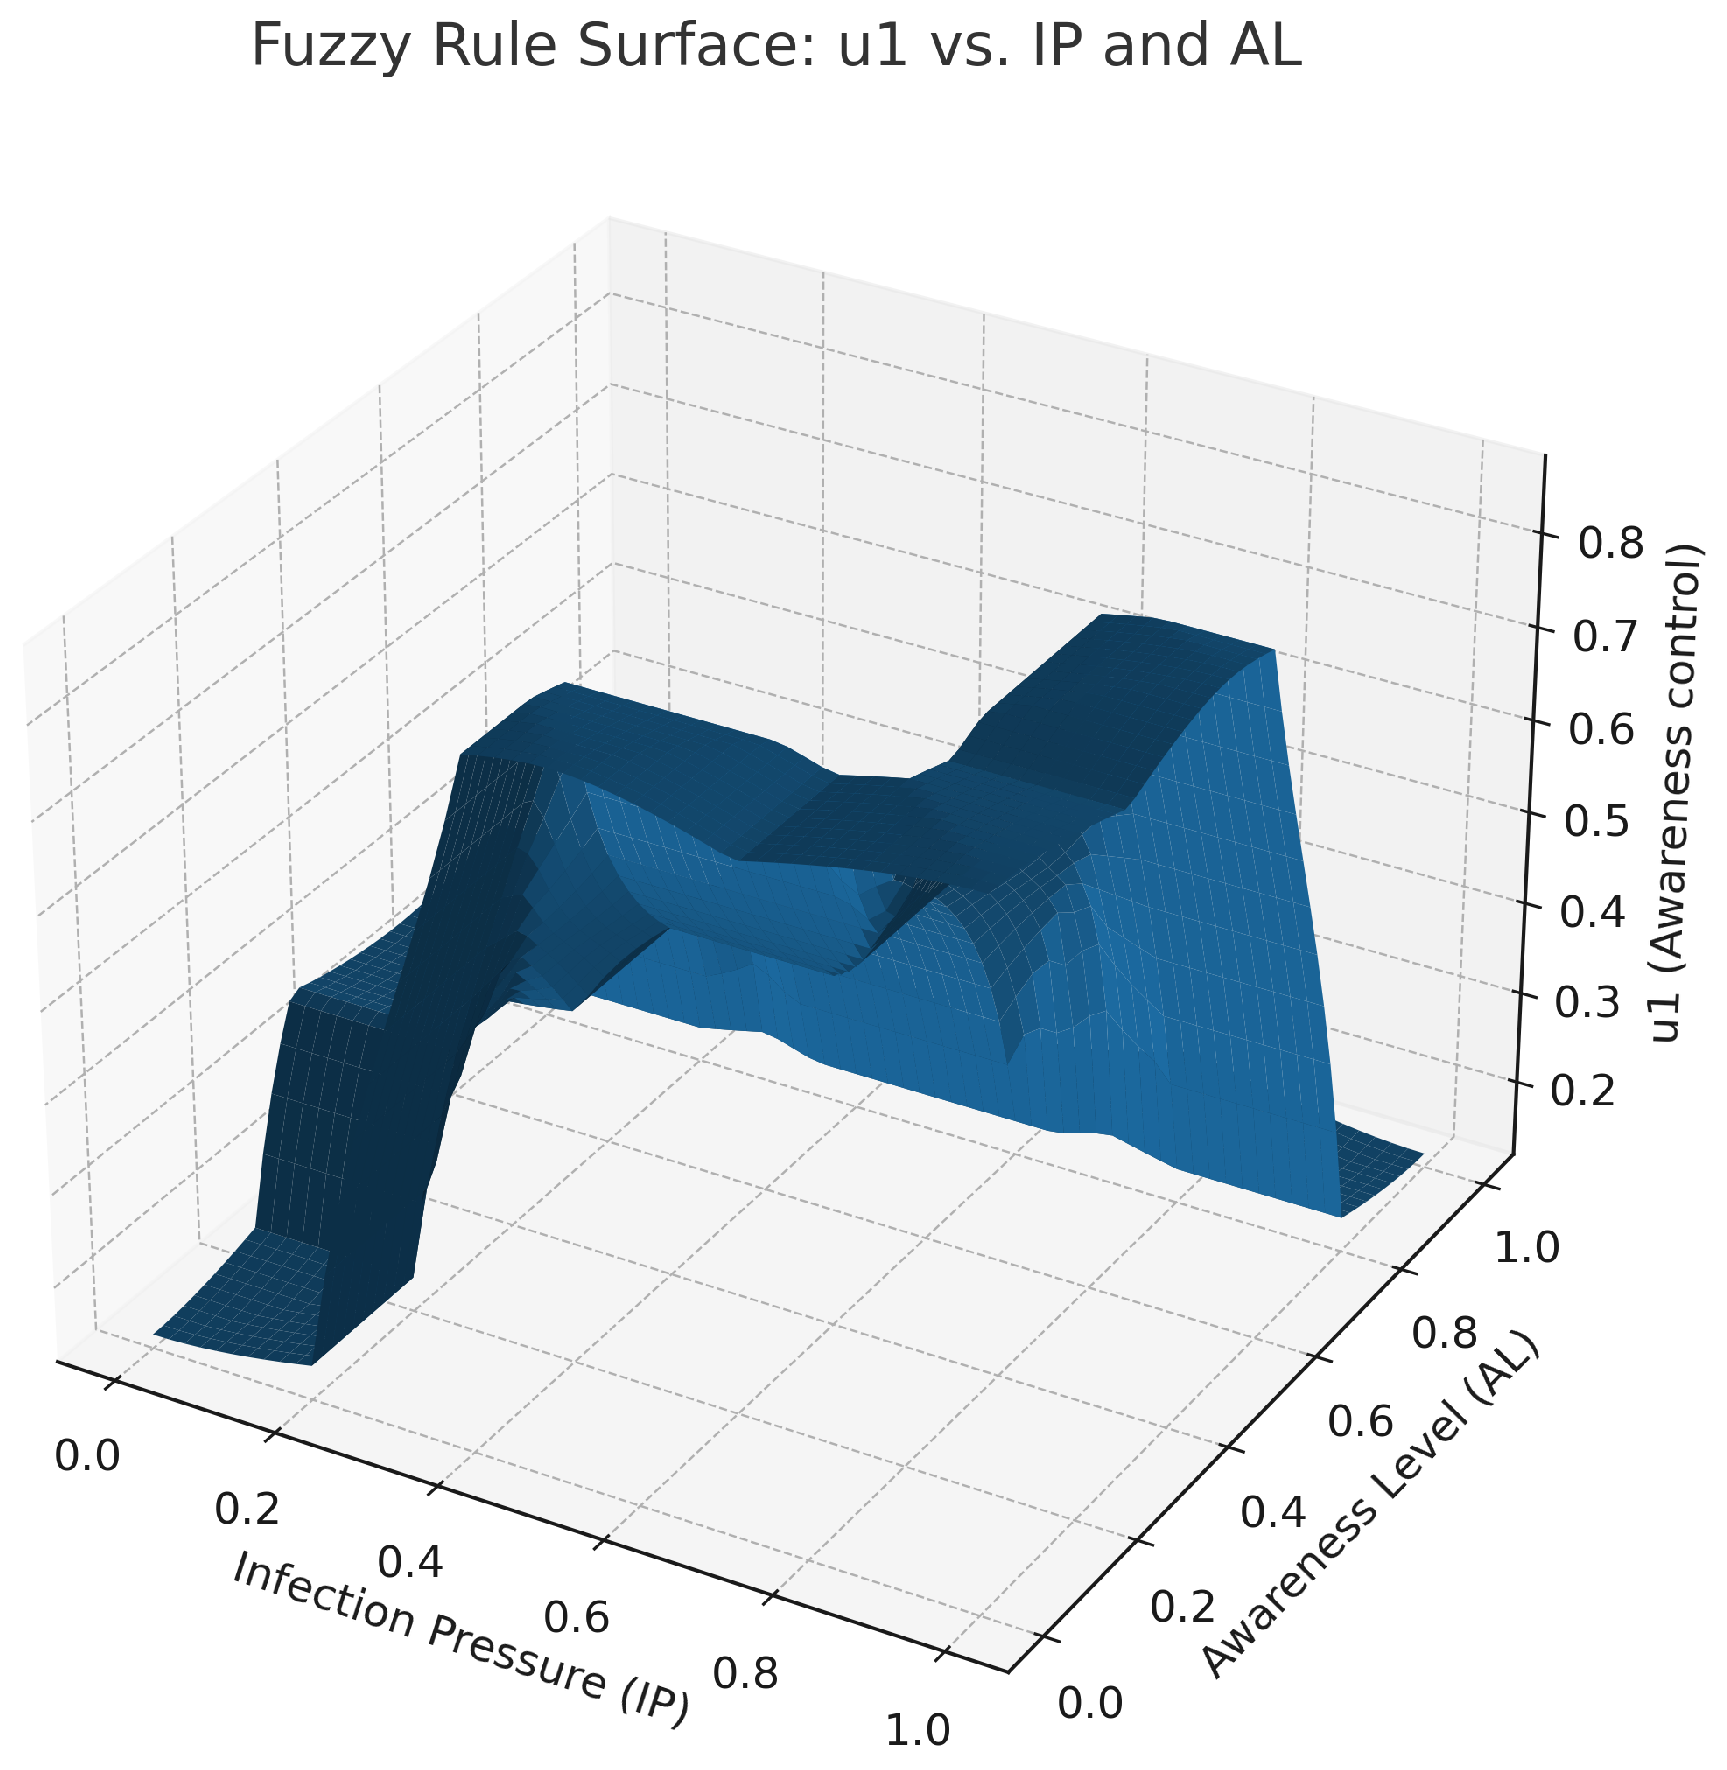
Figure 5.
Fuzzy control surface for screening/diagnosis intensity primarily driven by IP. The control increases from Low → Medium → High as IP rises, with stronger amplification when AL is low, in line with the screening rules. This figure suggests that diagnostic interventions should increase in intensity when infection pressure increases and awareness declines. Biologically, this means testing and identifying must increase in communities with high levels of hidden infection burden, in order to prevent silent spread.
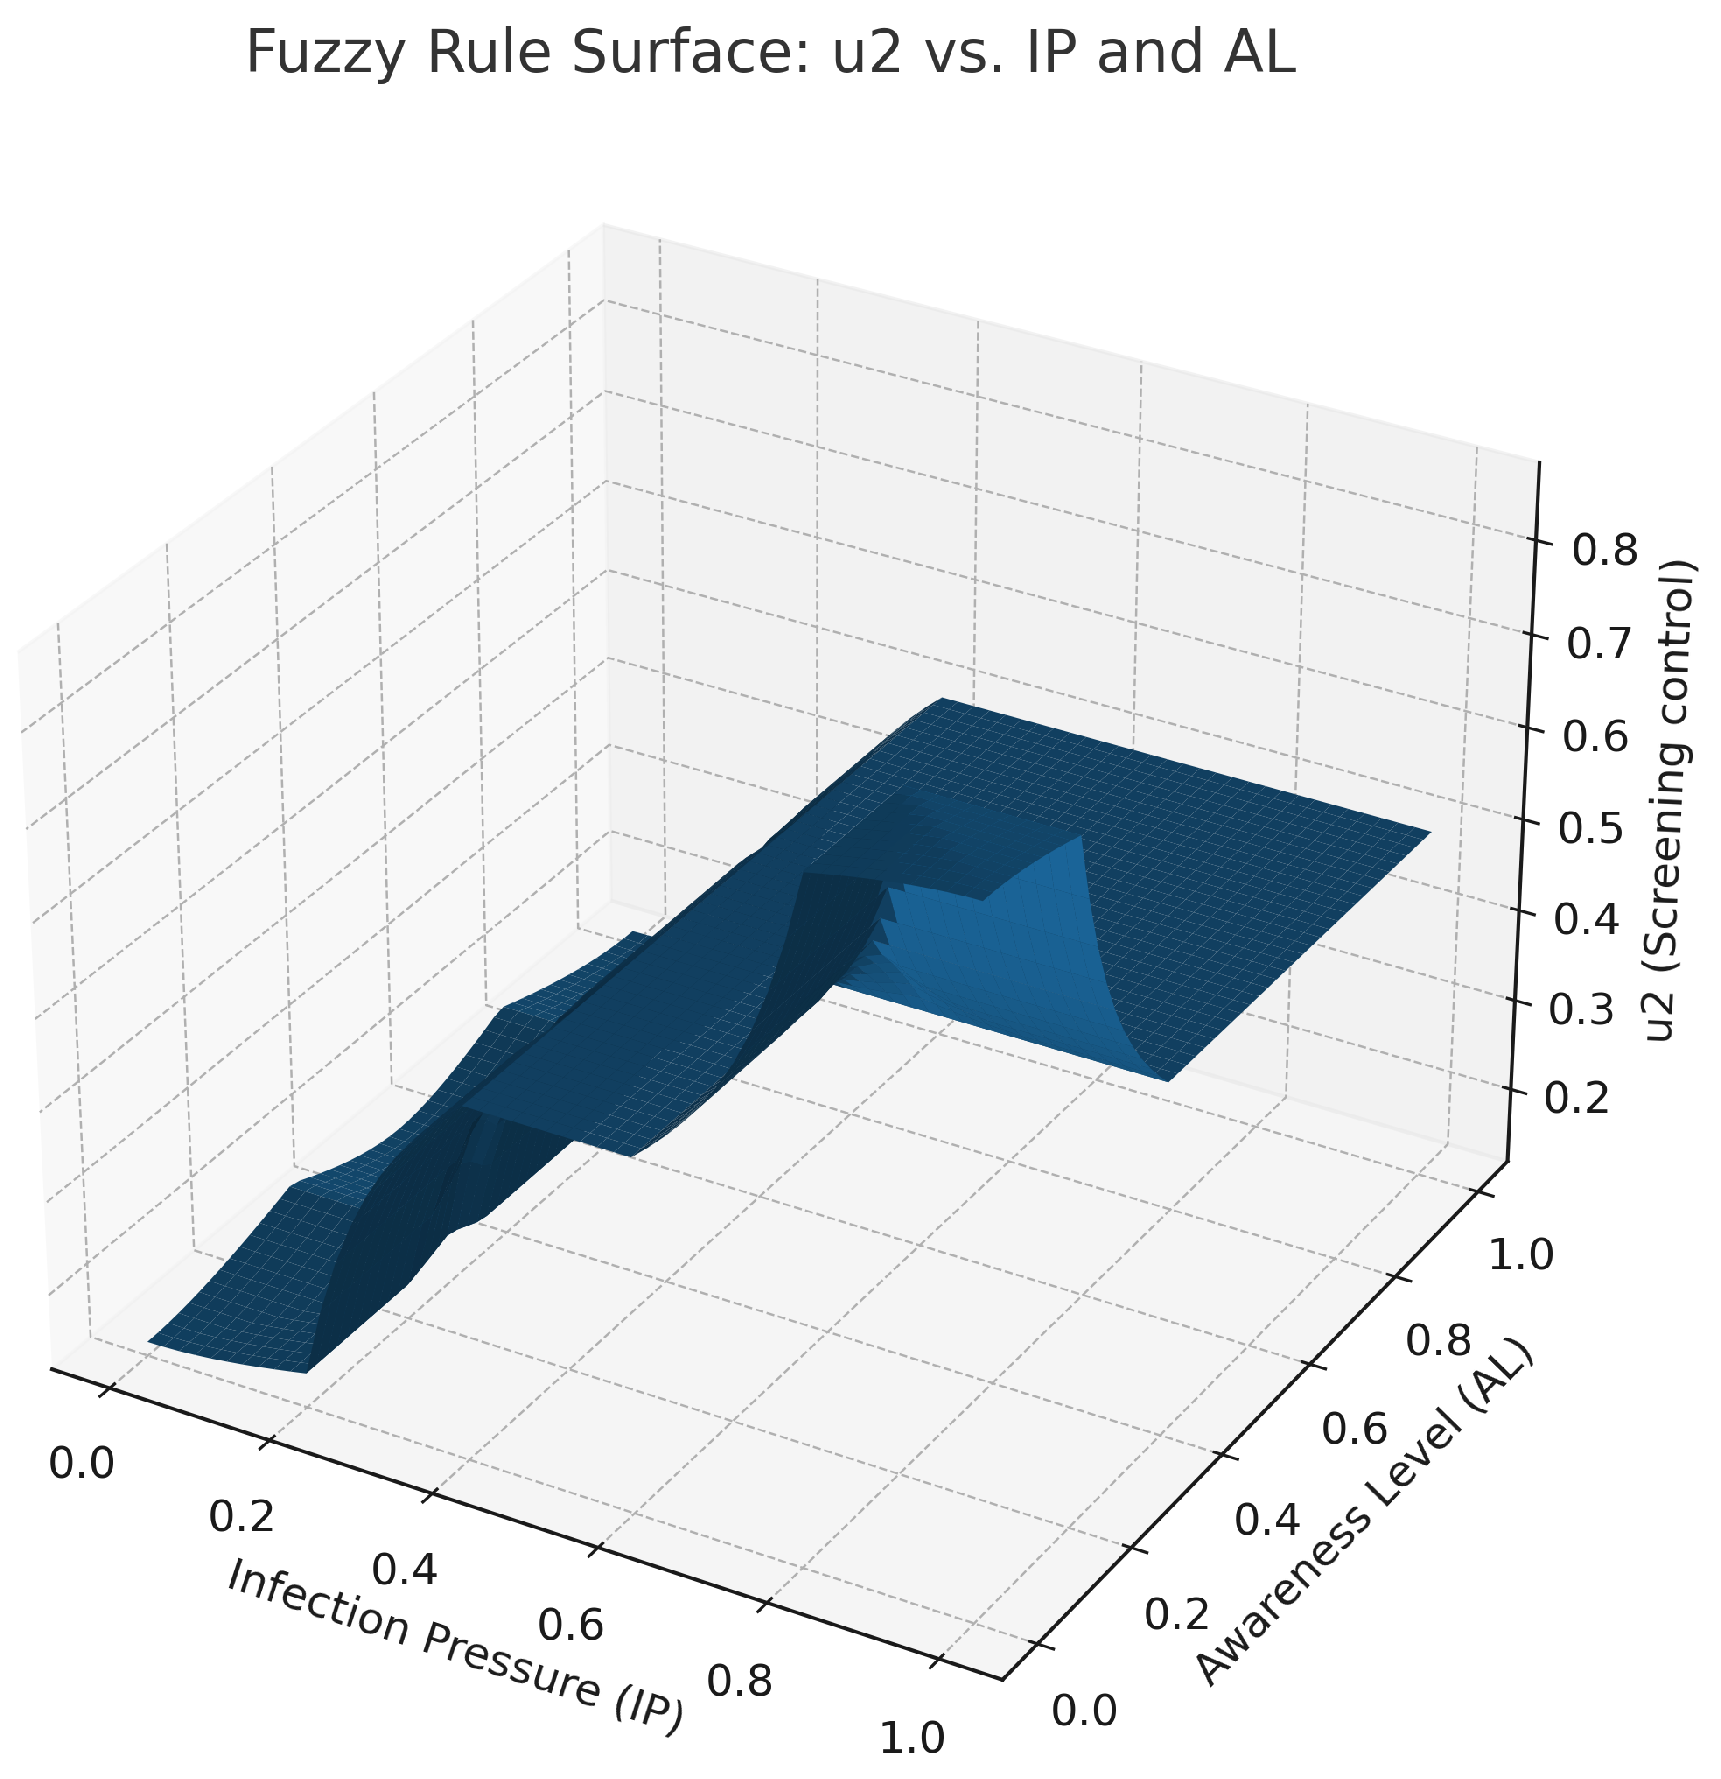
Figure 6.
Fuzzy control surface for treatment intensity as a function of HL and IP. The control is low at low HL, medium at moderate HL, and high when both HL and IP are high, reflecting the treatment rules. The highest point on the surface corresponds to equated scenarios of high infection pressure and hospital load, indicating that treatment intensity should increase sharply when faced with heavy case burdens. This illustrates an adaptive response to avoid system overload while facilitating rapid recovery.
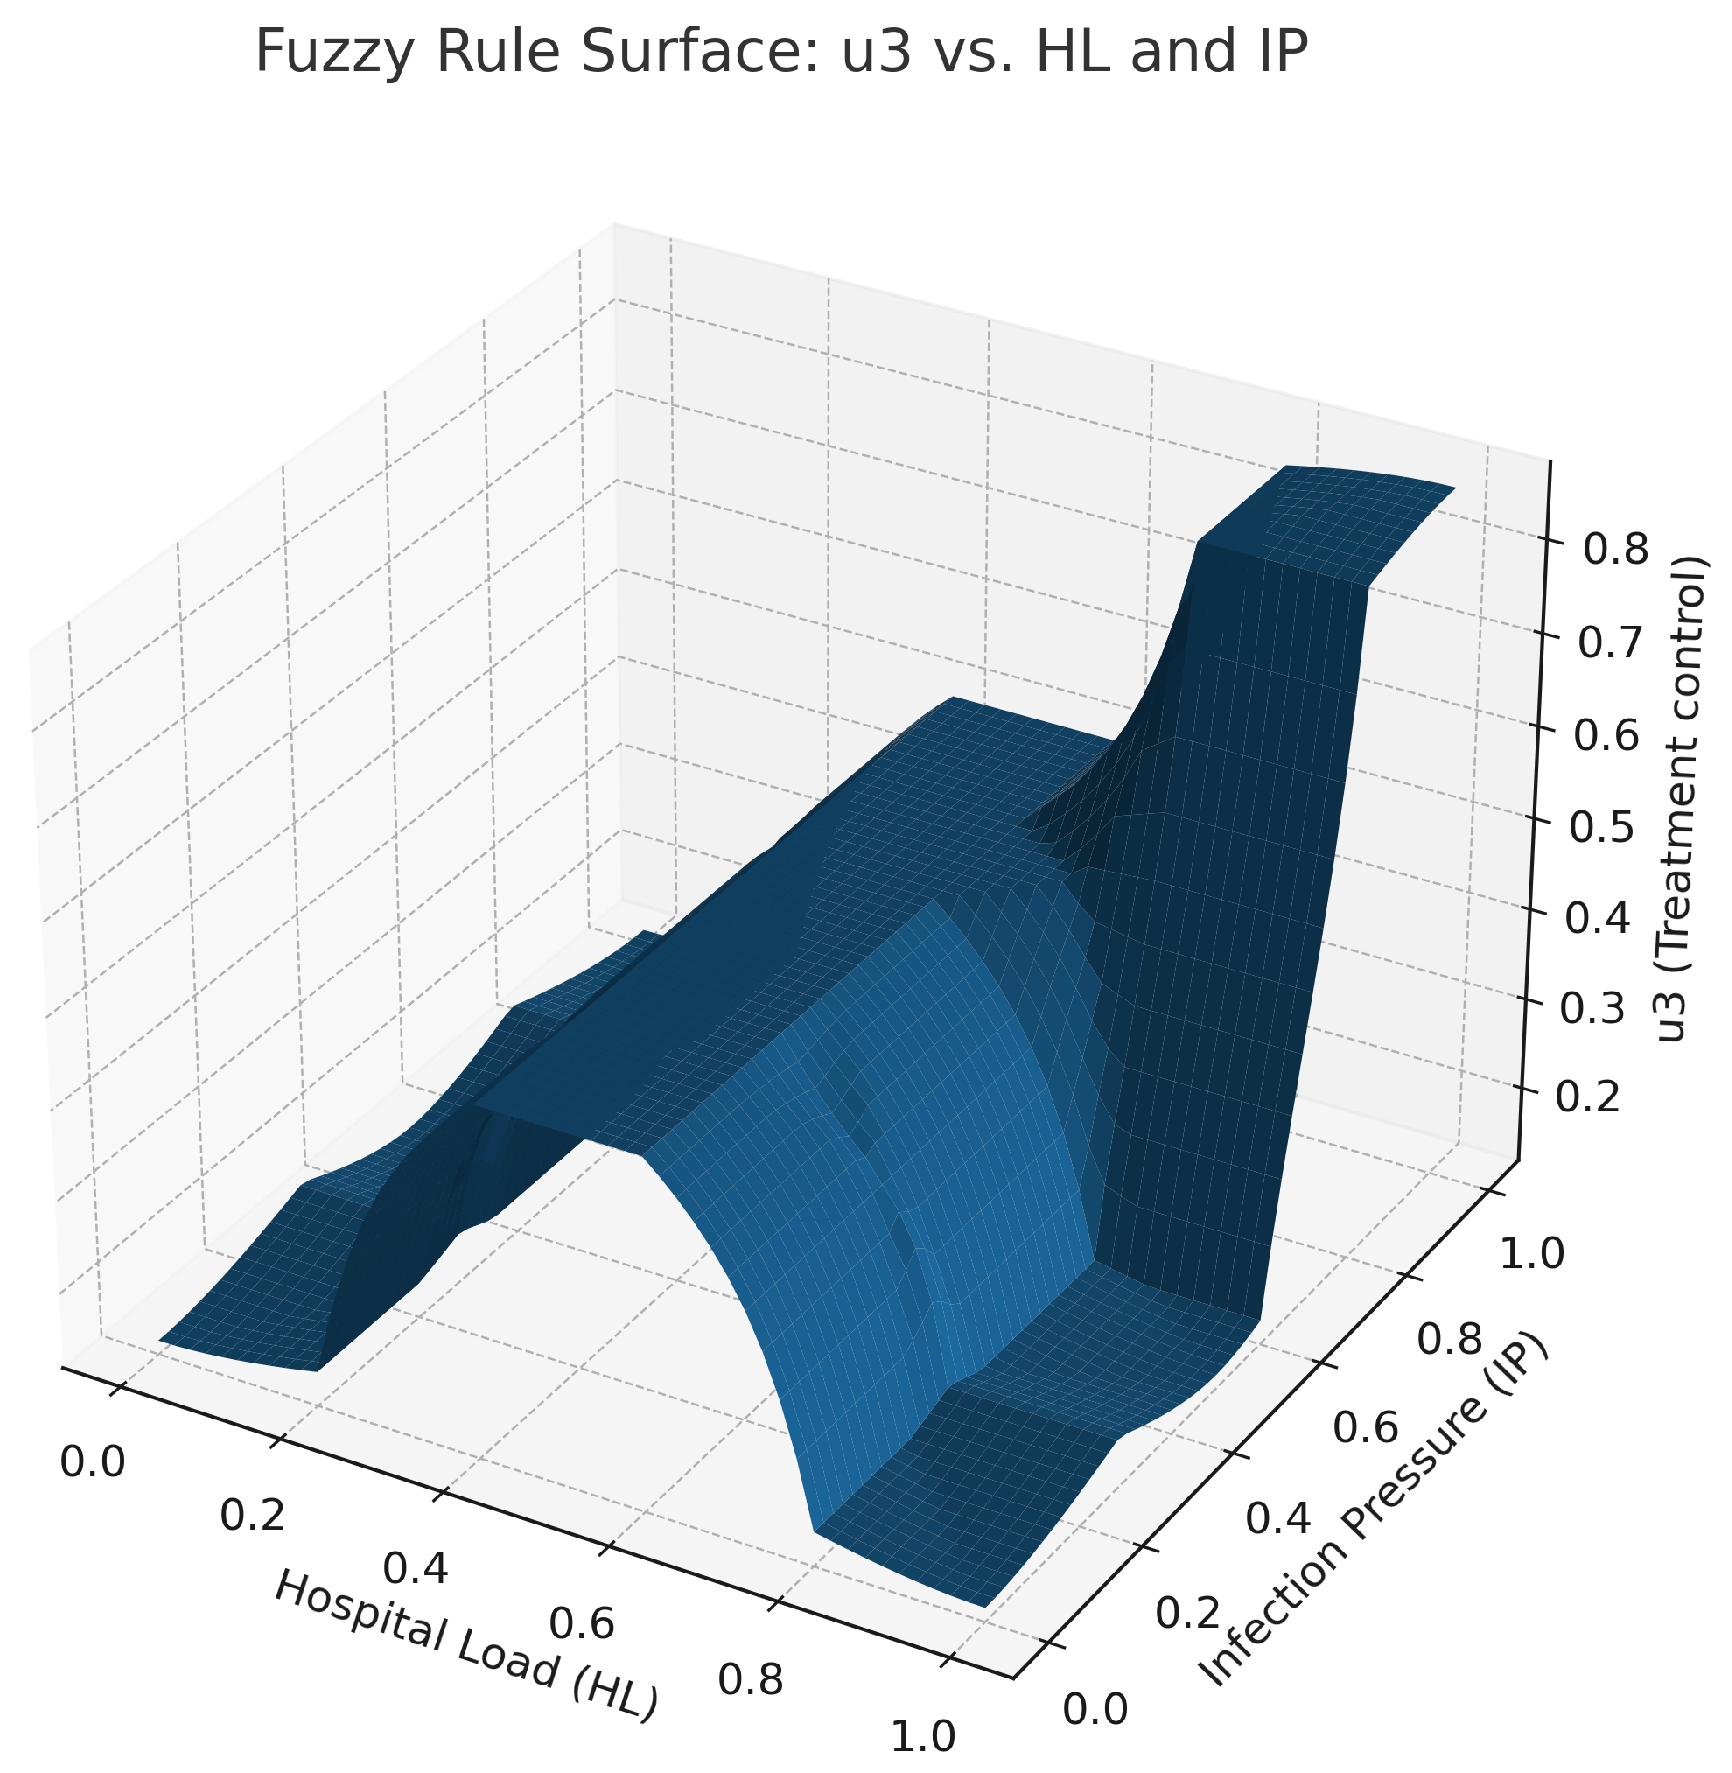
Figure 7.
Membership functions (Low/Medium/High) for the three inputs on for Infection Pressure ().
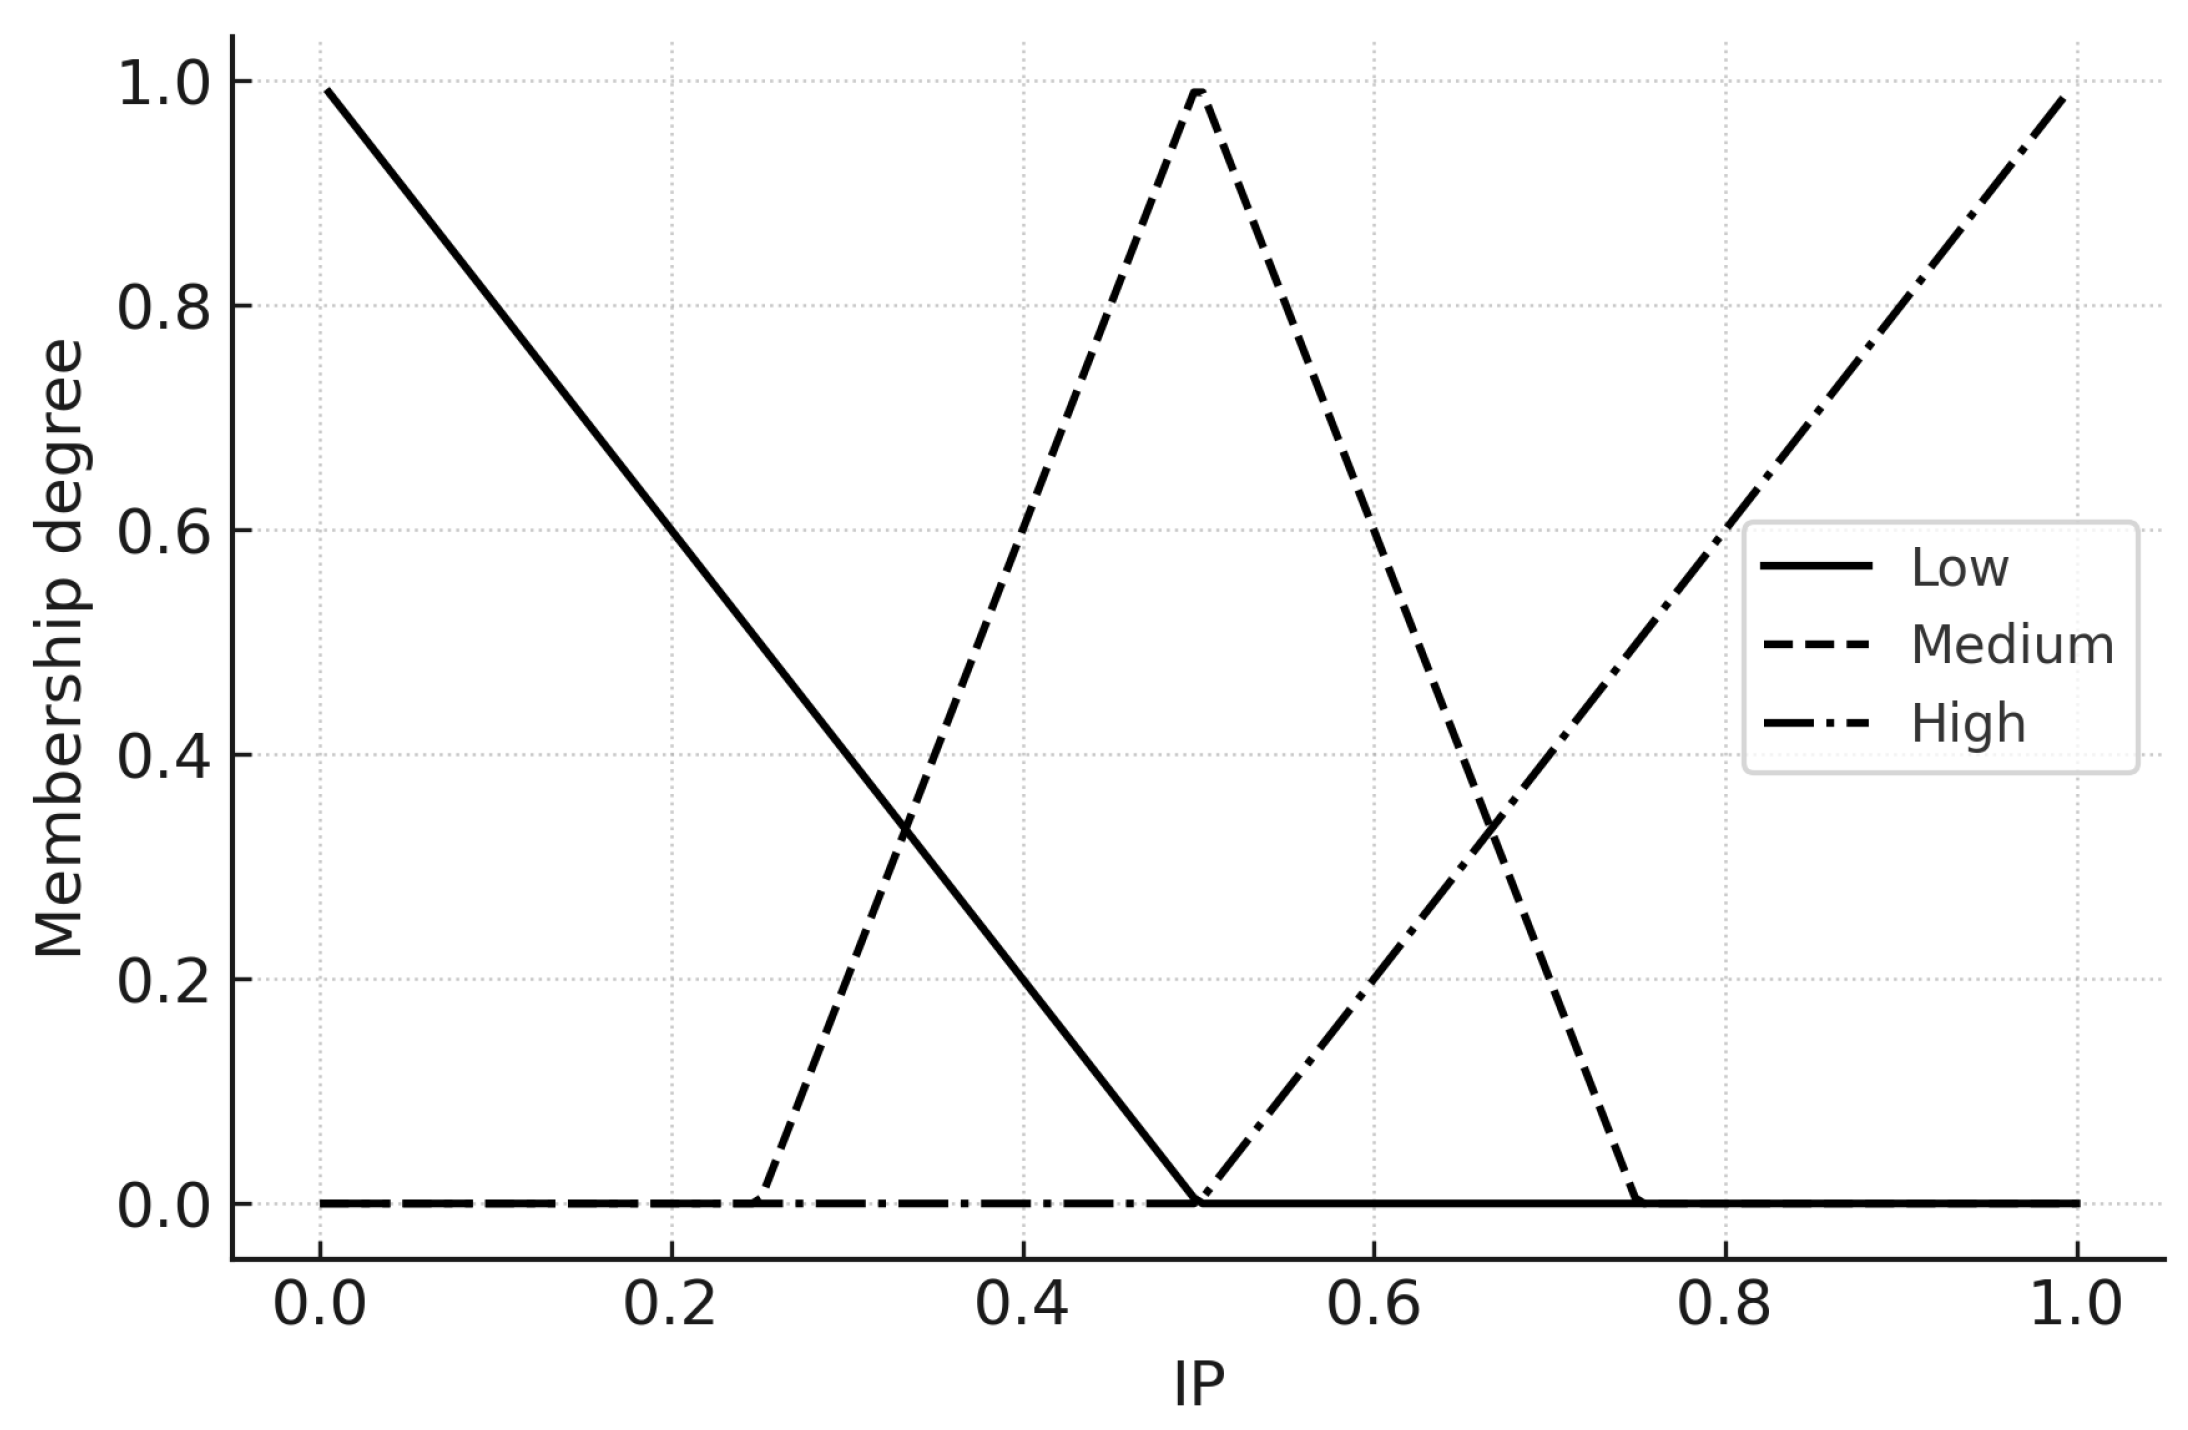
Figure 8.
Membership functions (Low/Medium/High) for the three inputs on for Awareness Level ().

Figure 9.
Membership functions (Low/Medium/High) for the three inputs on for Hospital Load ().
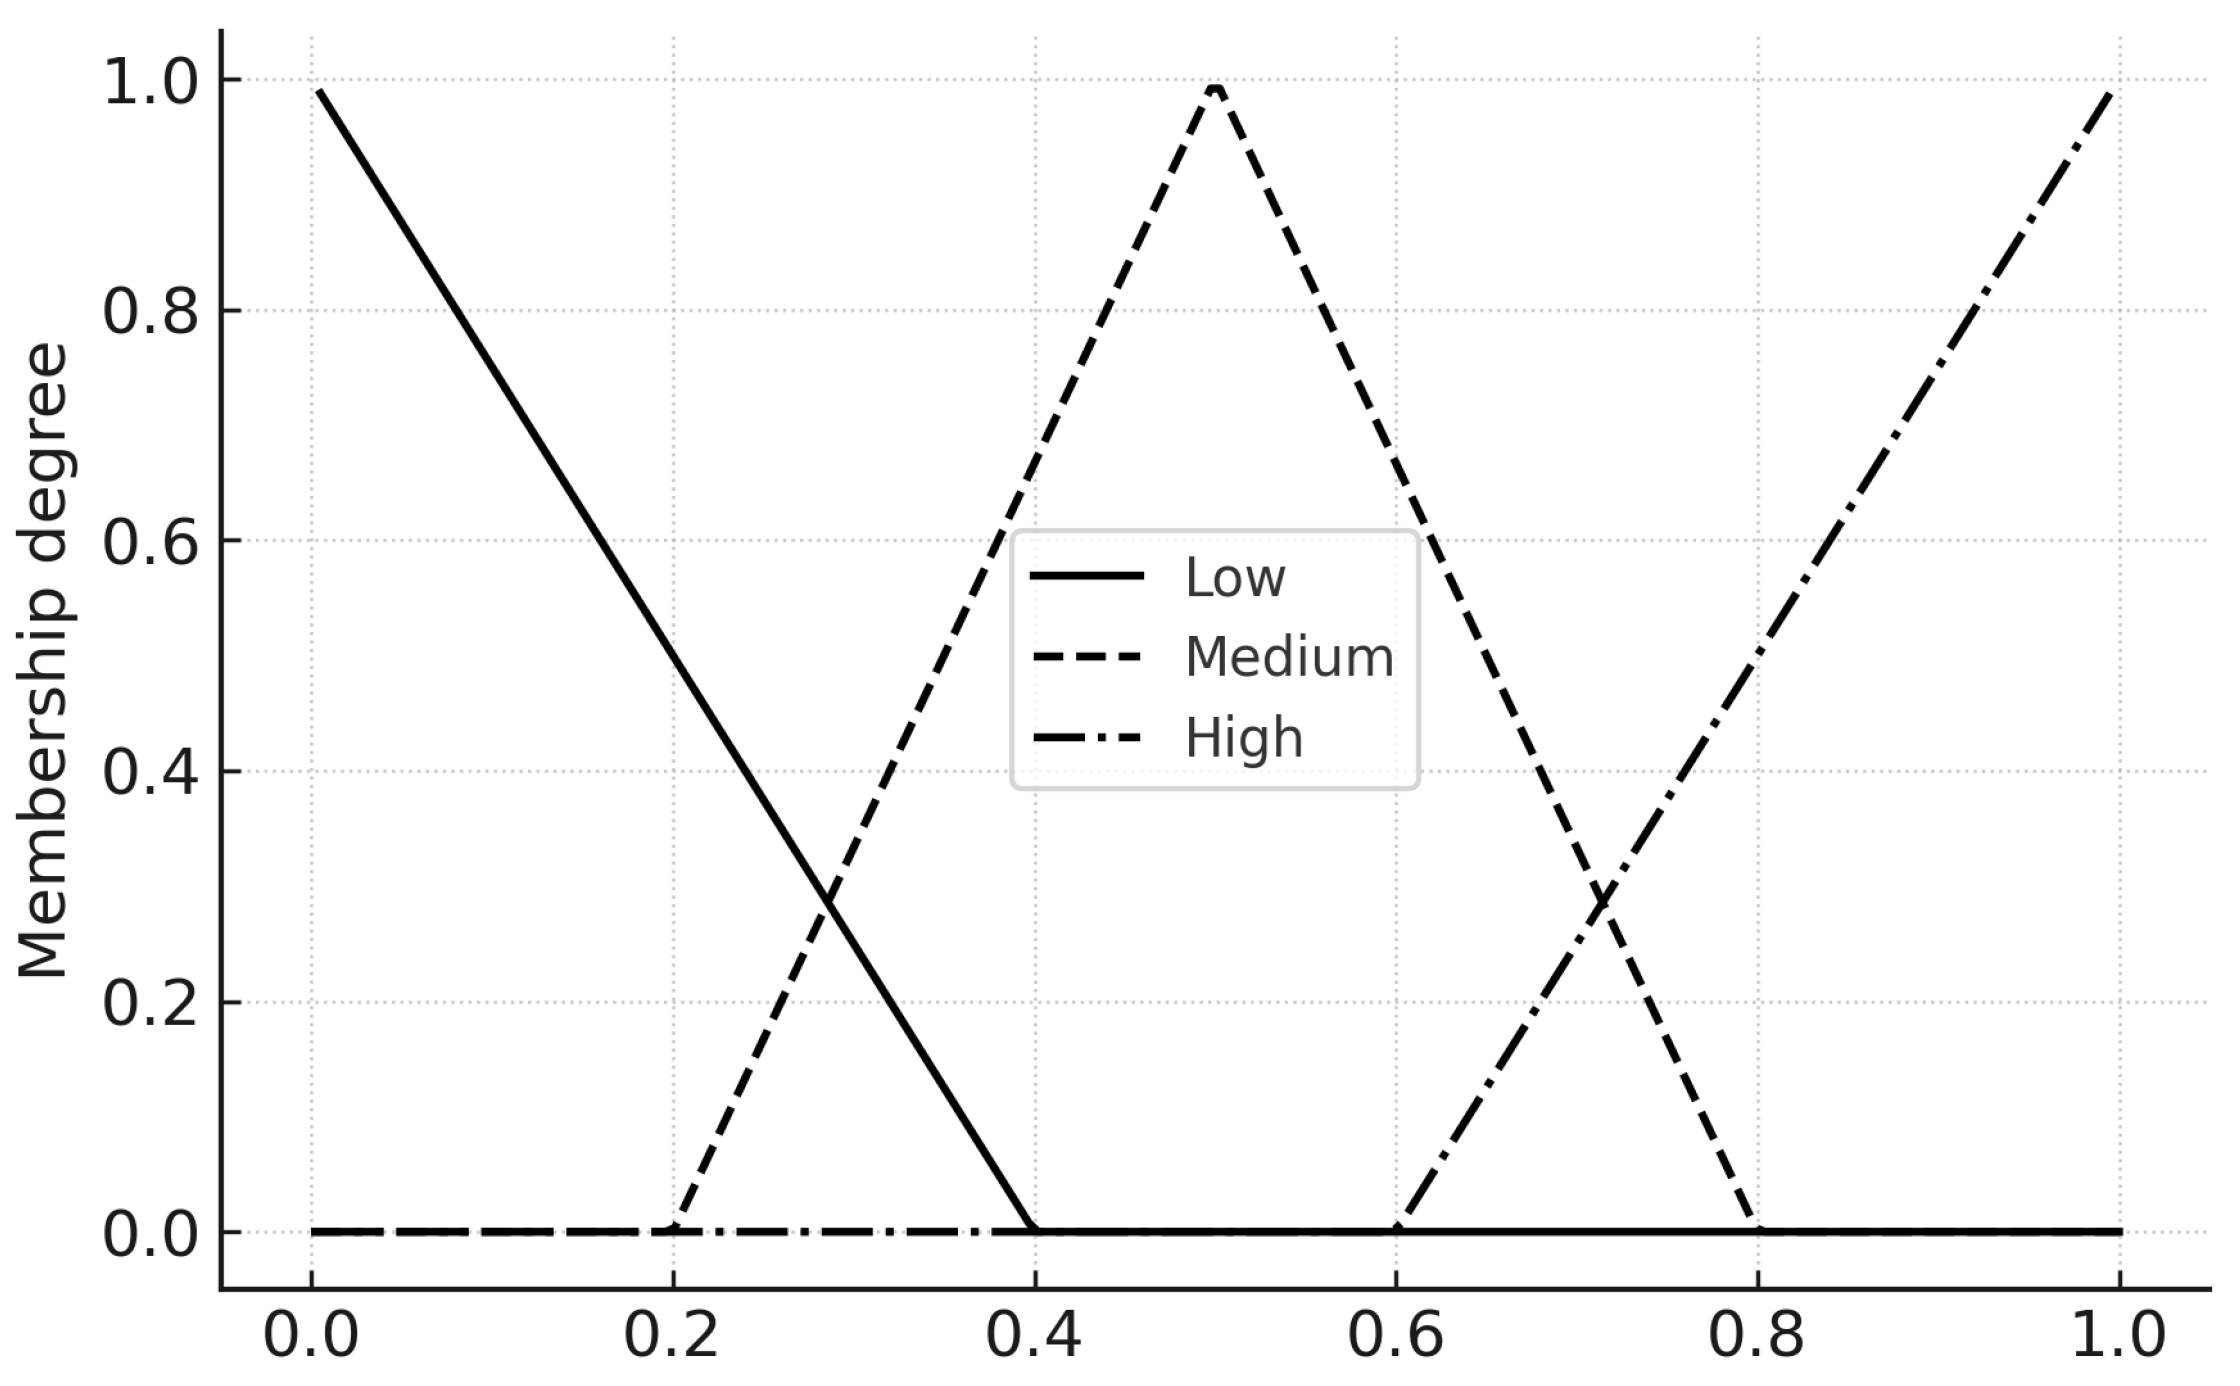
Figure 10.
Time evolution of unidentified (U) and identified (I) infected populations in uncontrolled and controlled scenarios. The controlled scenario (higher levels of awareness and diagnosis intensity) results in significant decreases in both U and I compartments over time, illustrating the effectiveness of simultaneous awareness and screening strategies.
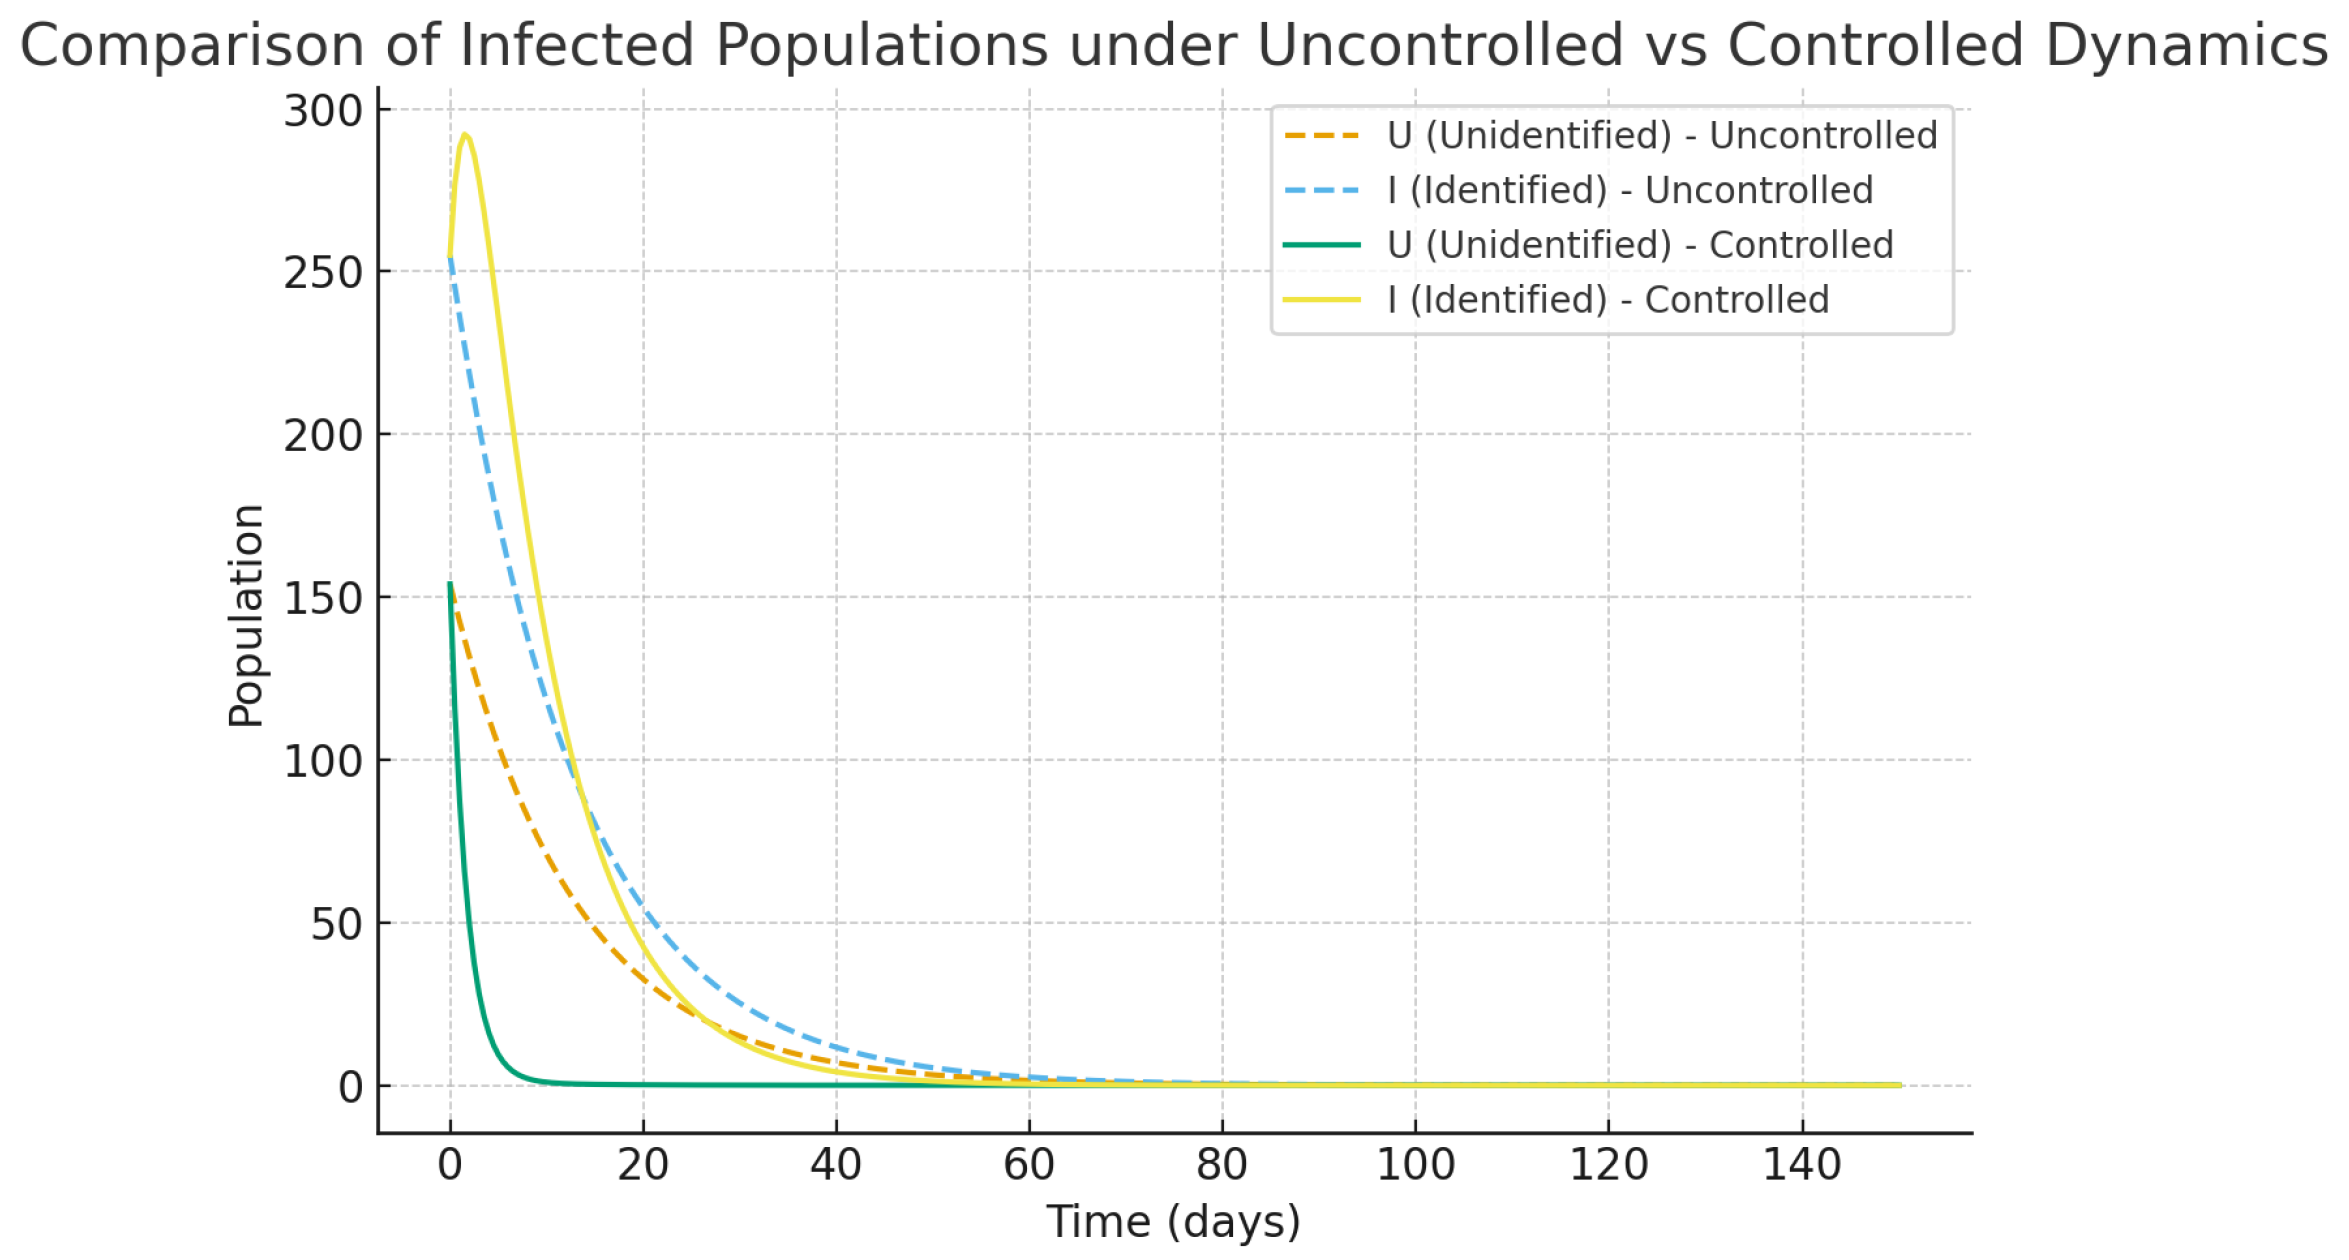
Figure 11.
The phase-plane graph depicting the dynamic interaction of unidentified infections (U) and identified infections (I) shows that controlled paths quickly meet at the lower equilibrium states, whereas uncontrolled processes continuously oscillate between infection states.
Figure 11.
The phase-plane graph depicting the dynamic interaction of unidentified infections (U) and identified infections (I) shows that controlled paths quickly meet at the lower equilibrium states, whereas uncontrolled processes continuously oscillate between infection states.
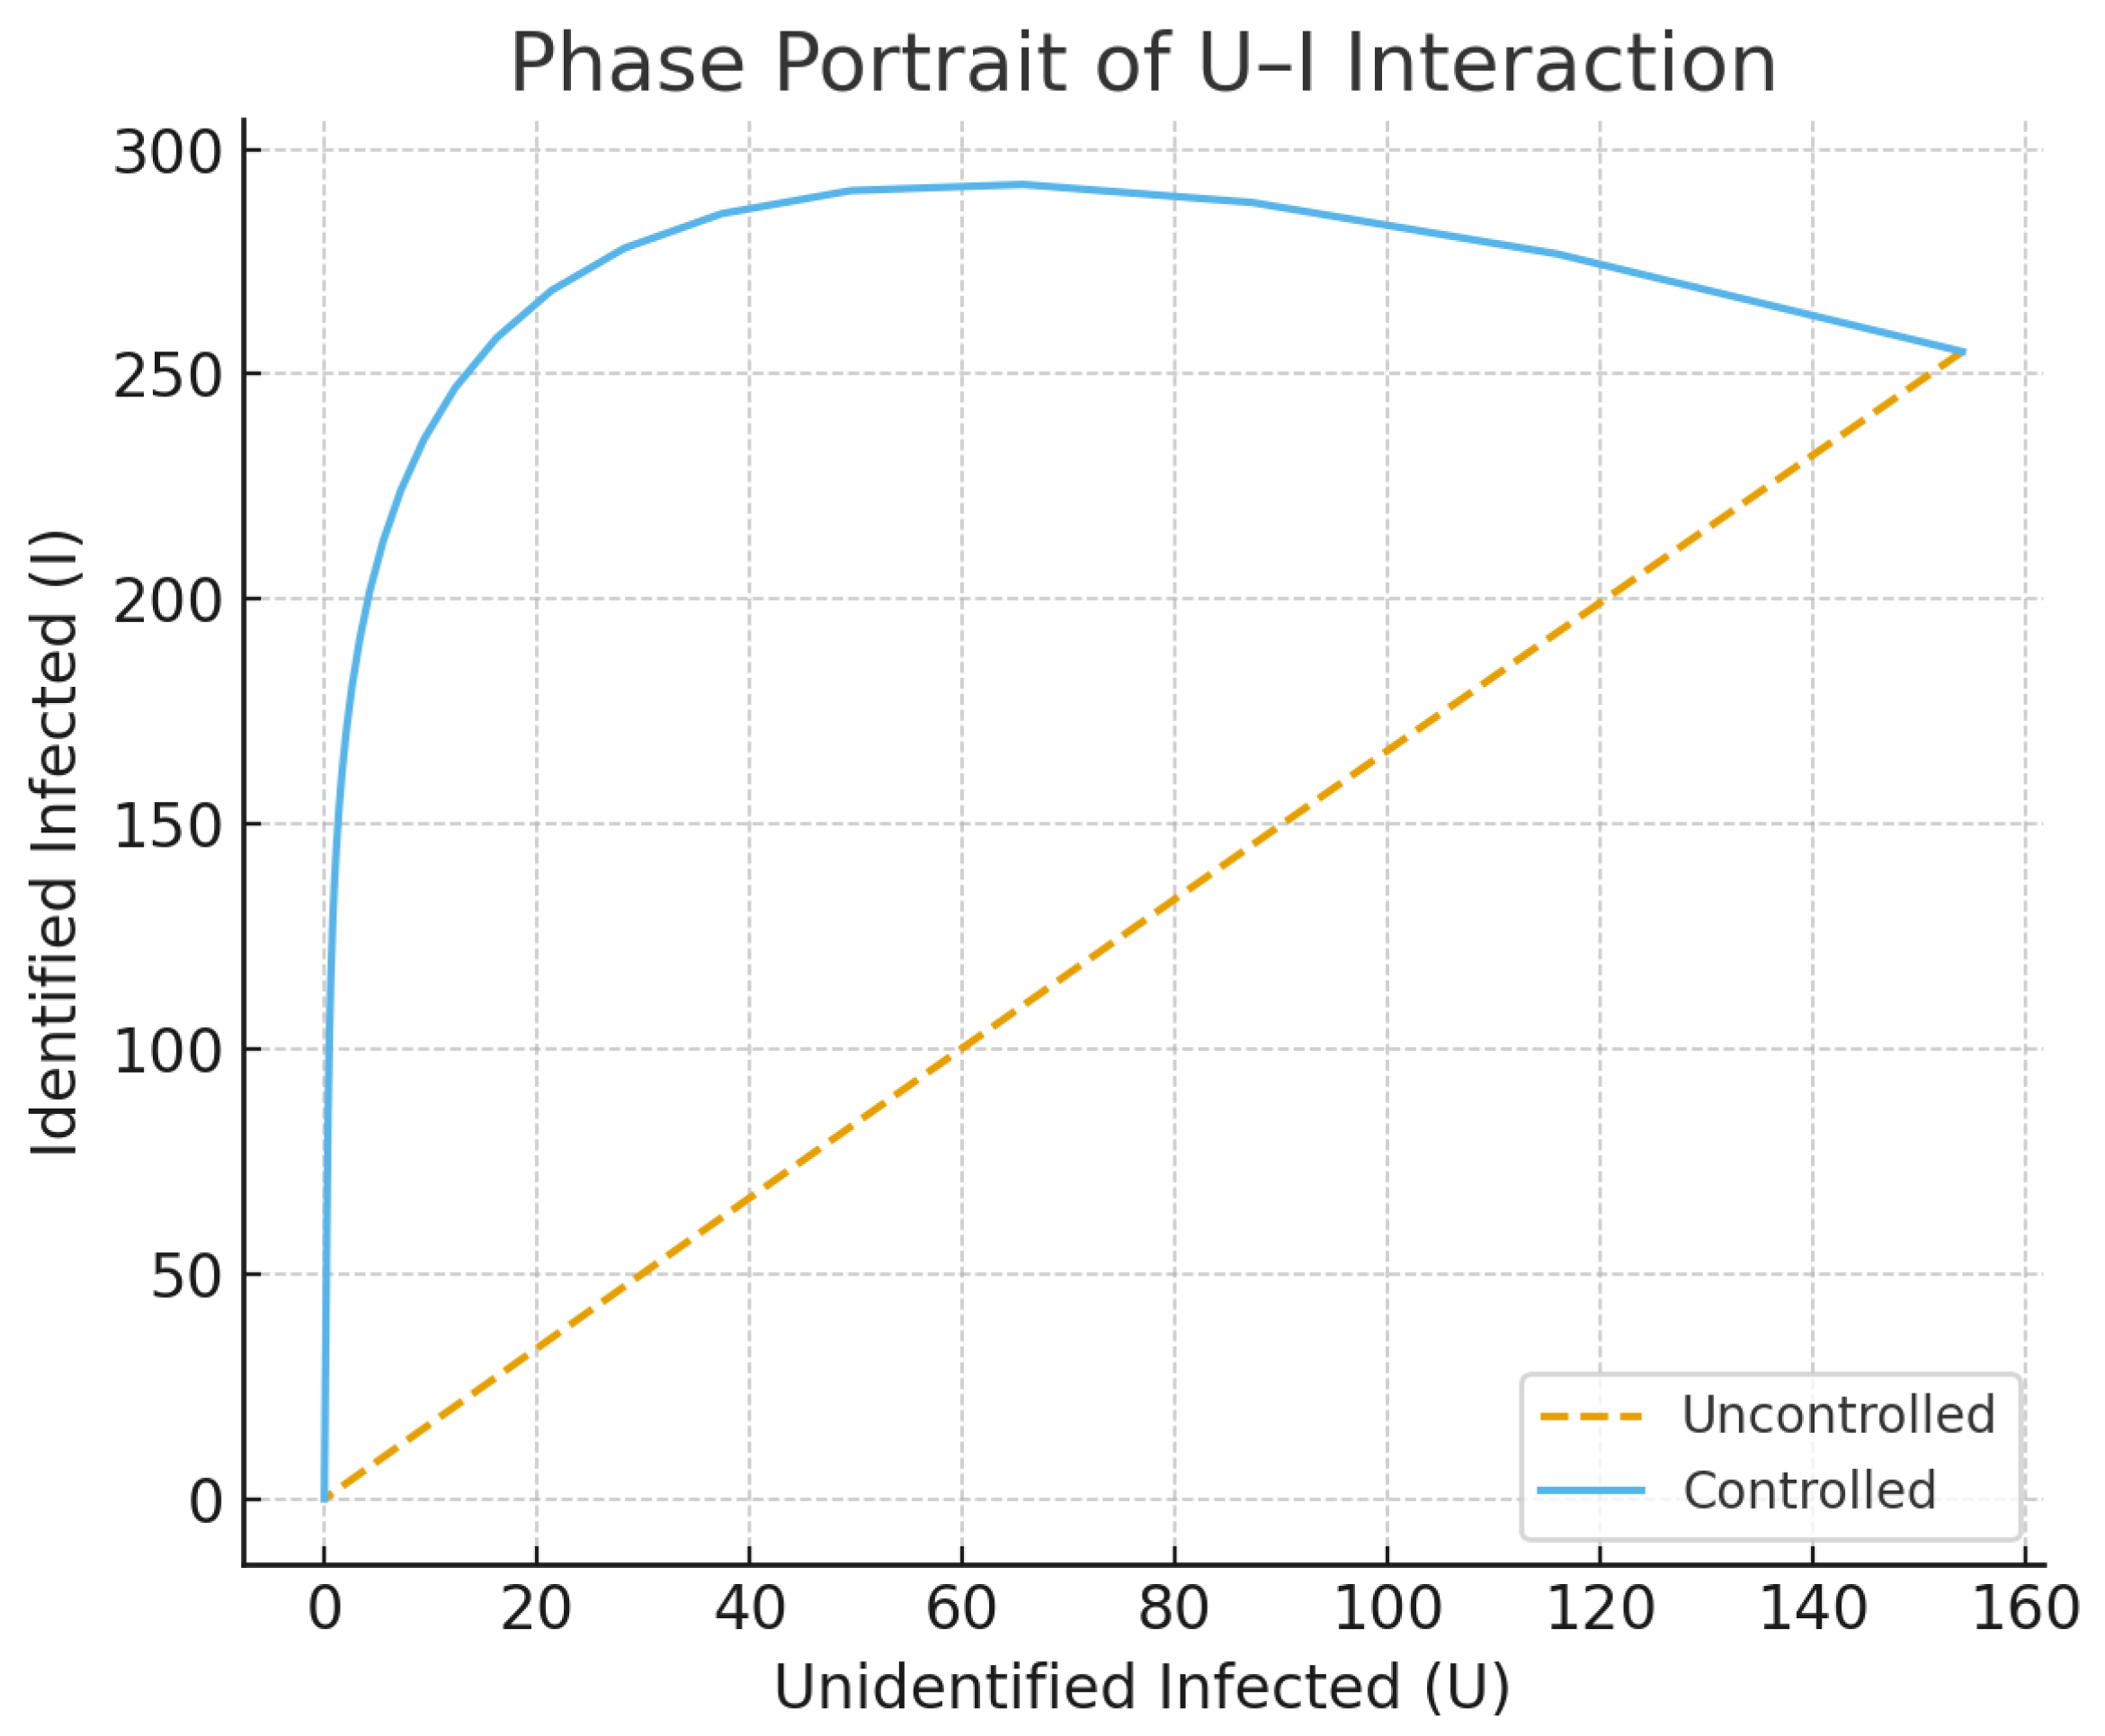
Figure 12.
Comparison of infection prevalence between the crisp and fuzzy optimal control.
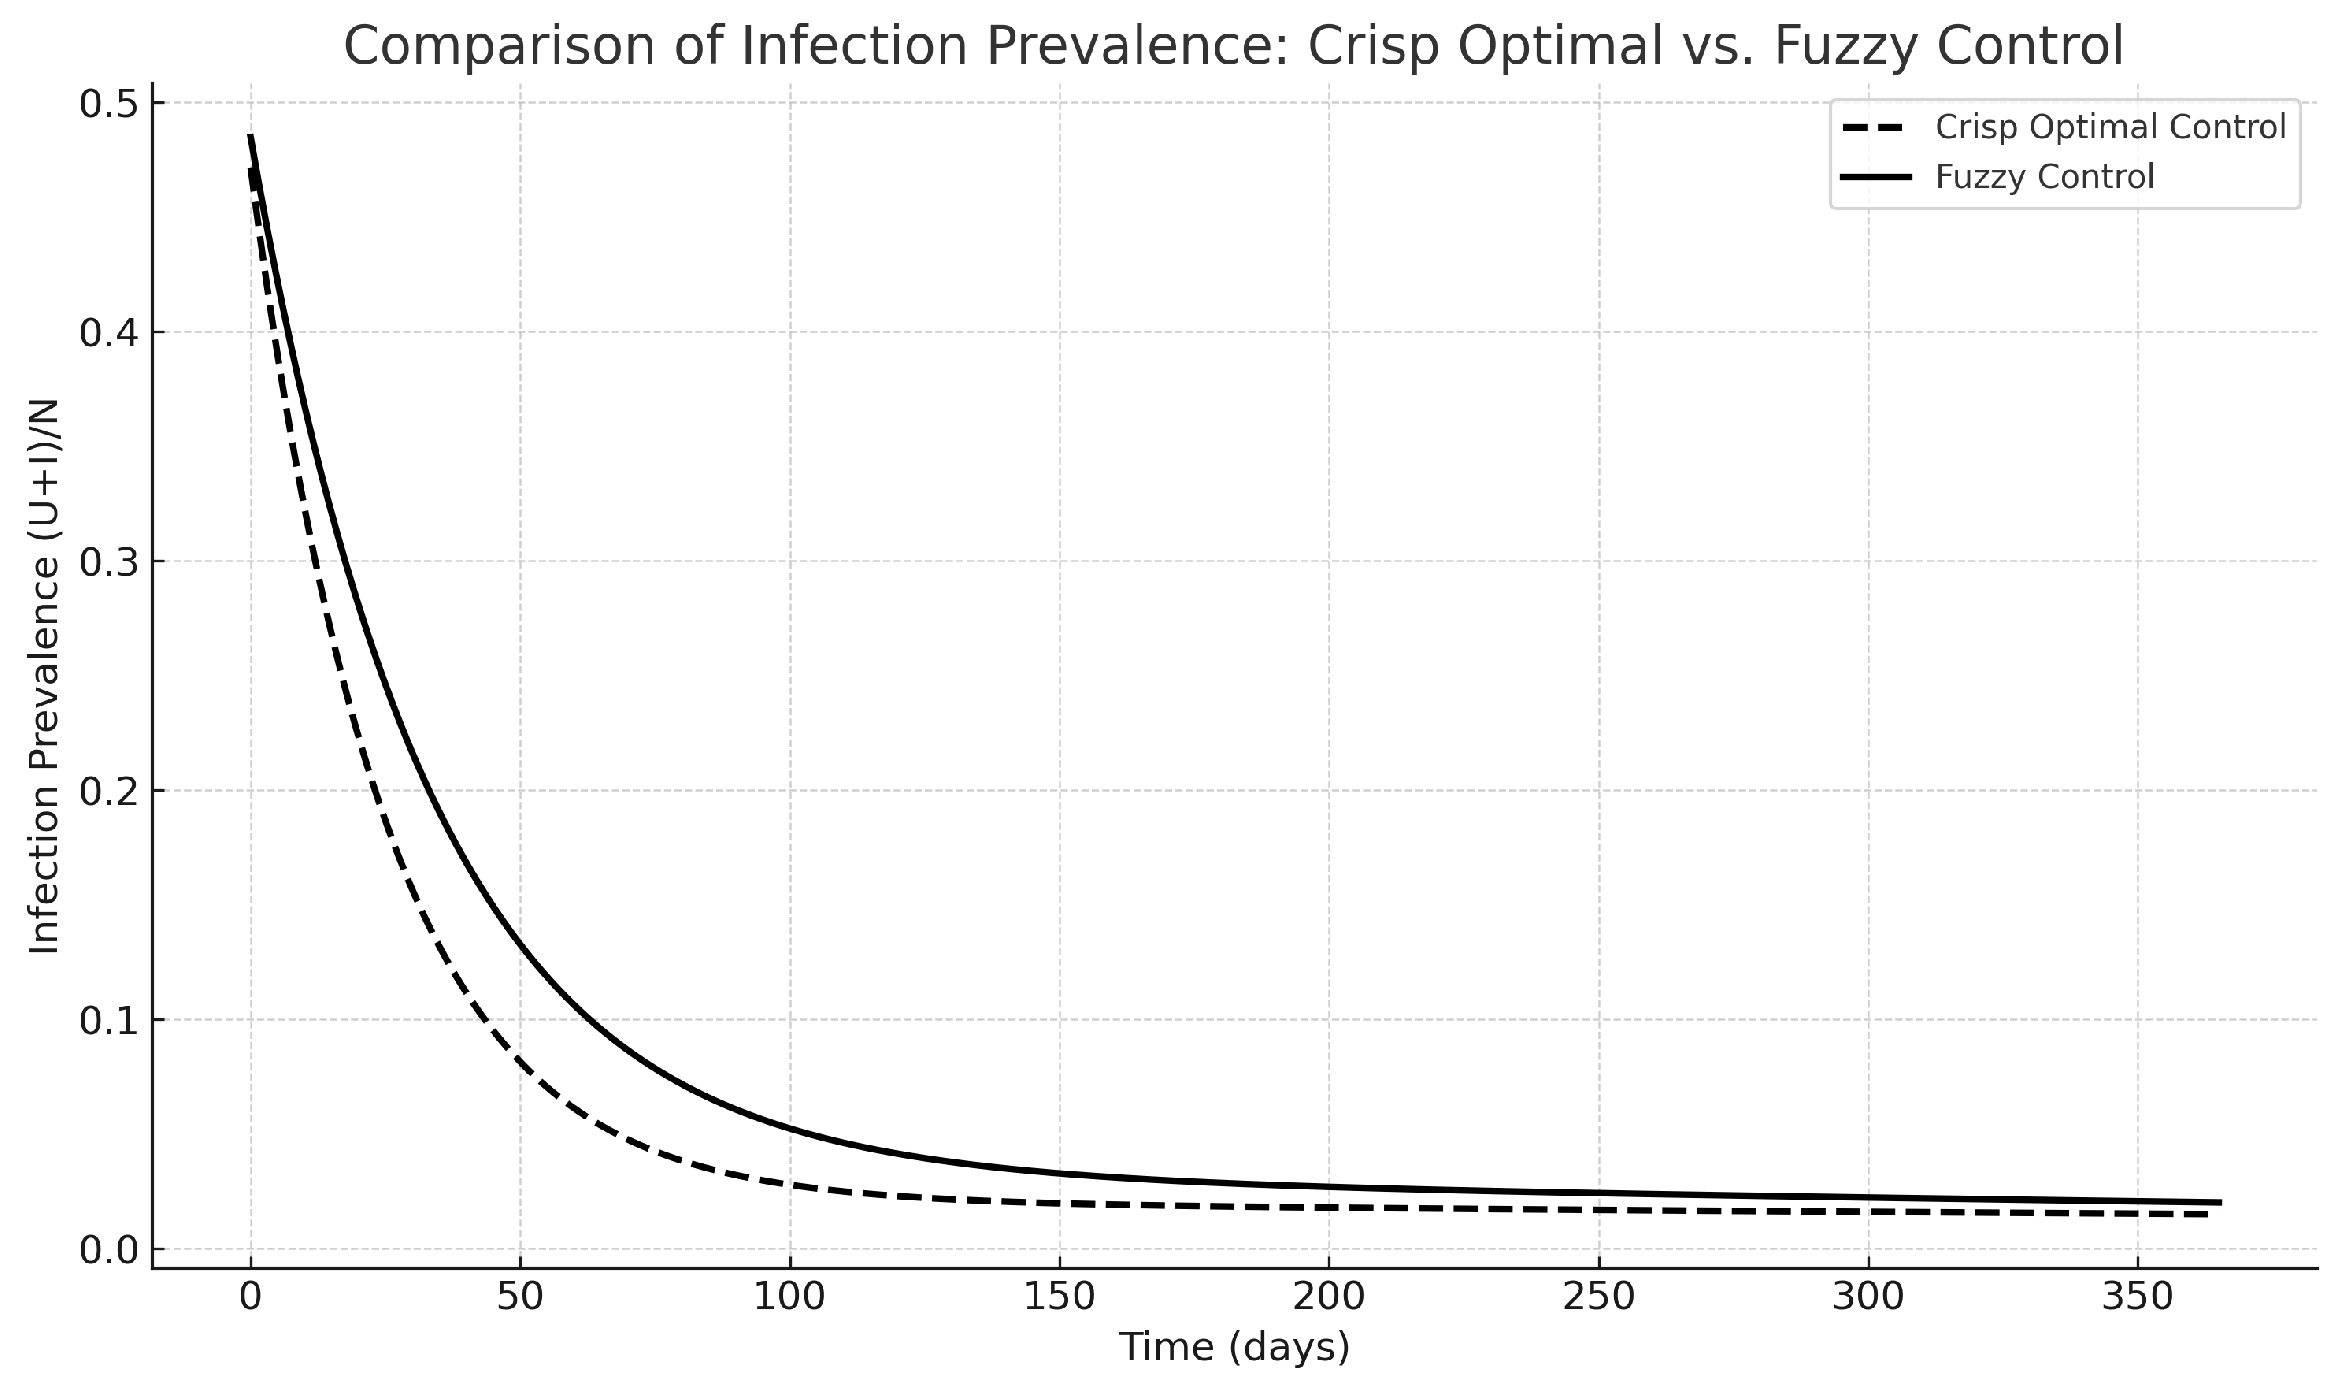
Figure 13.
Awareness control : crisp optimal vs. fuzzy control.
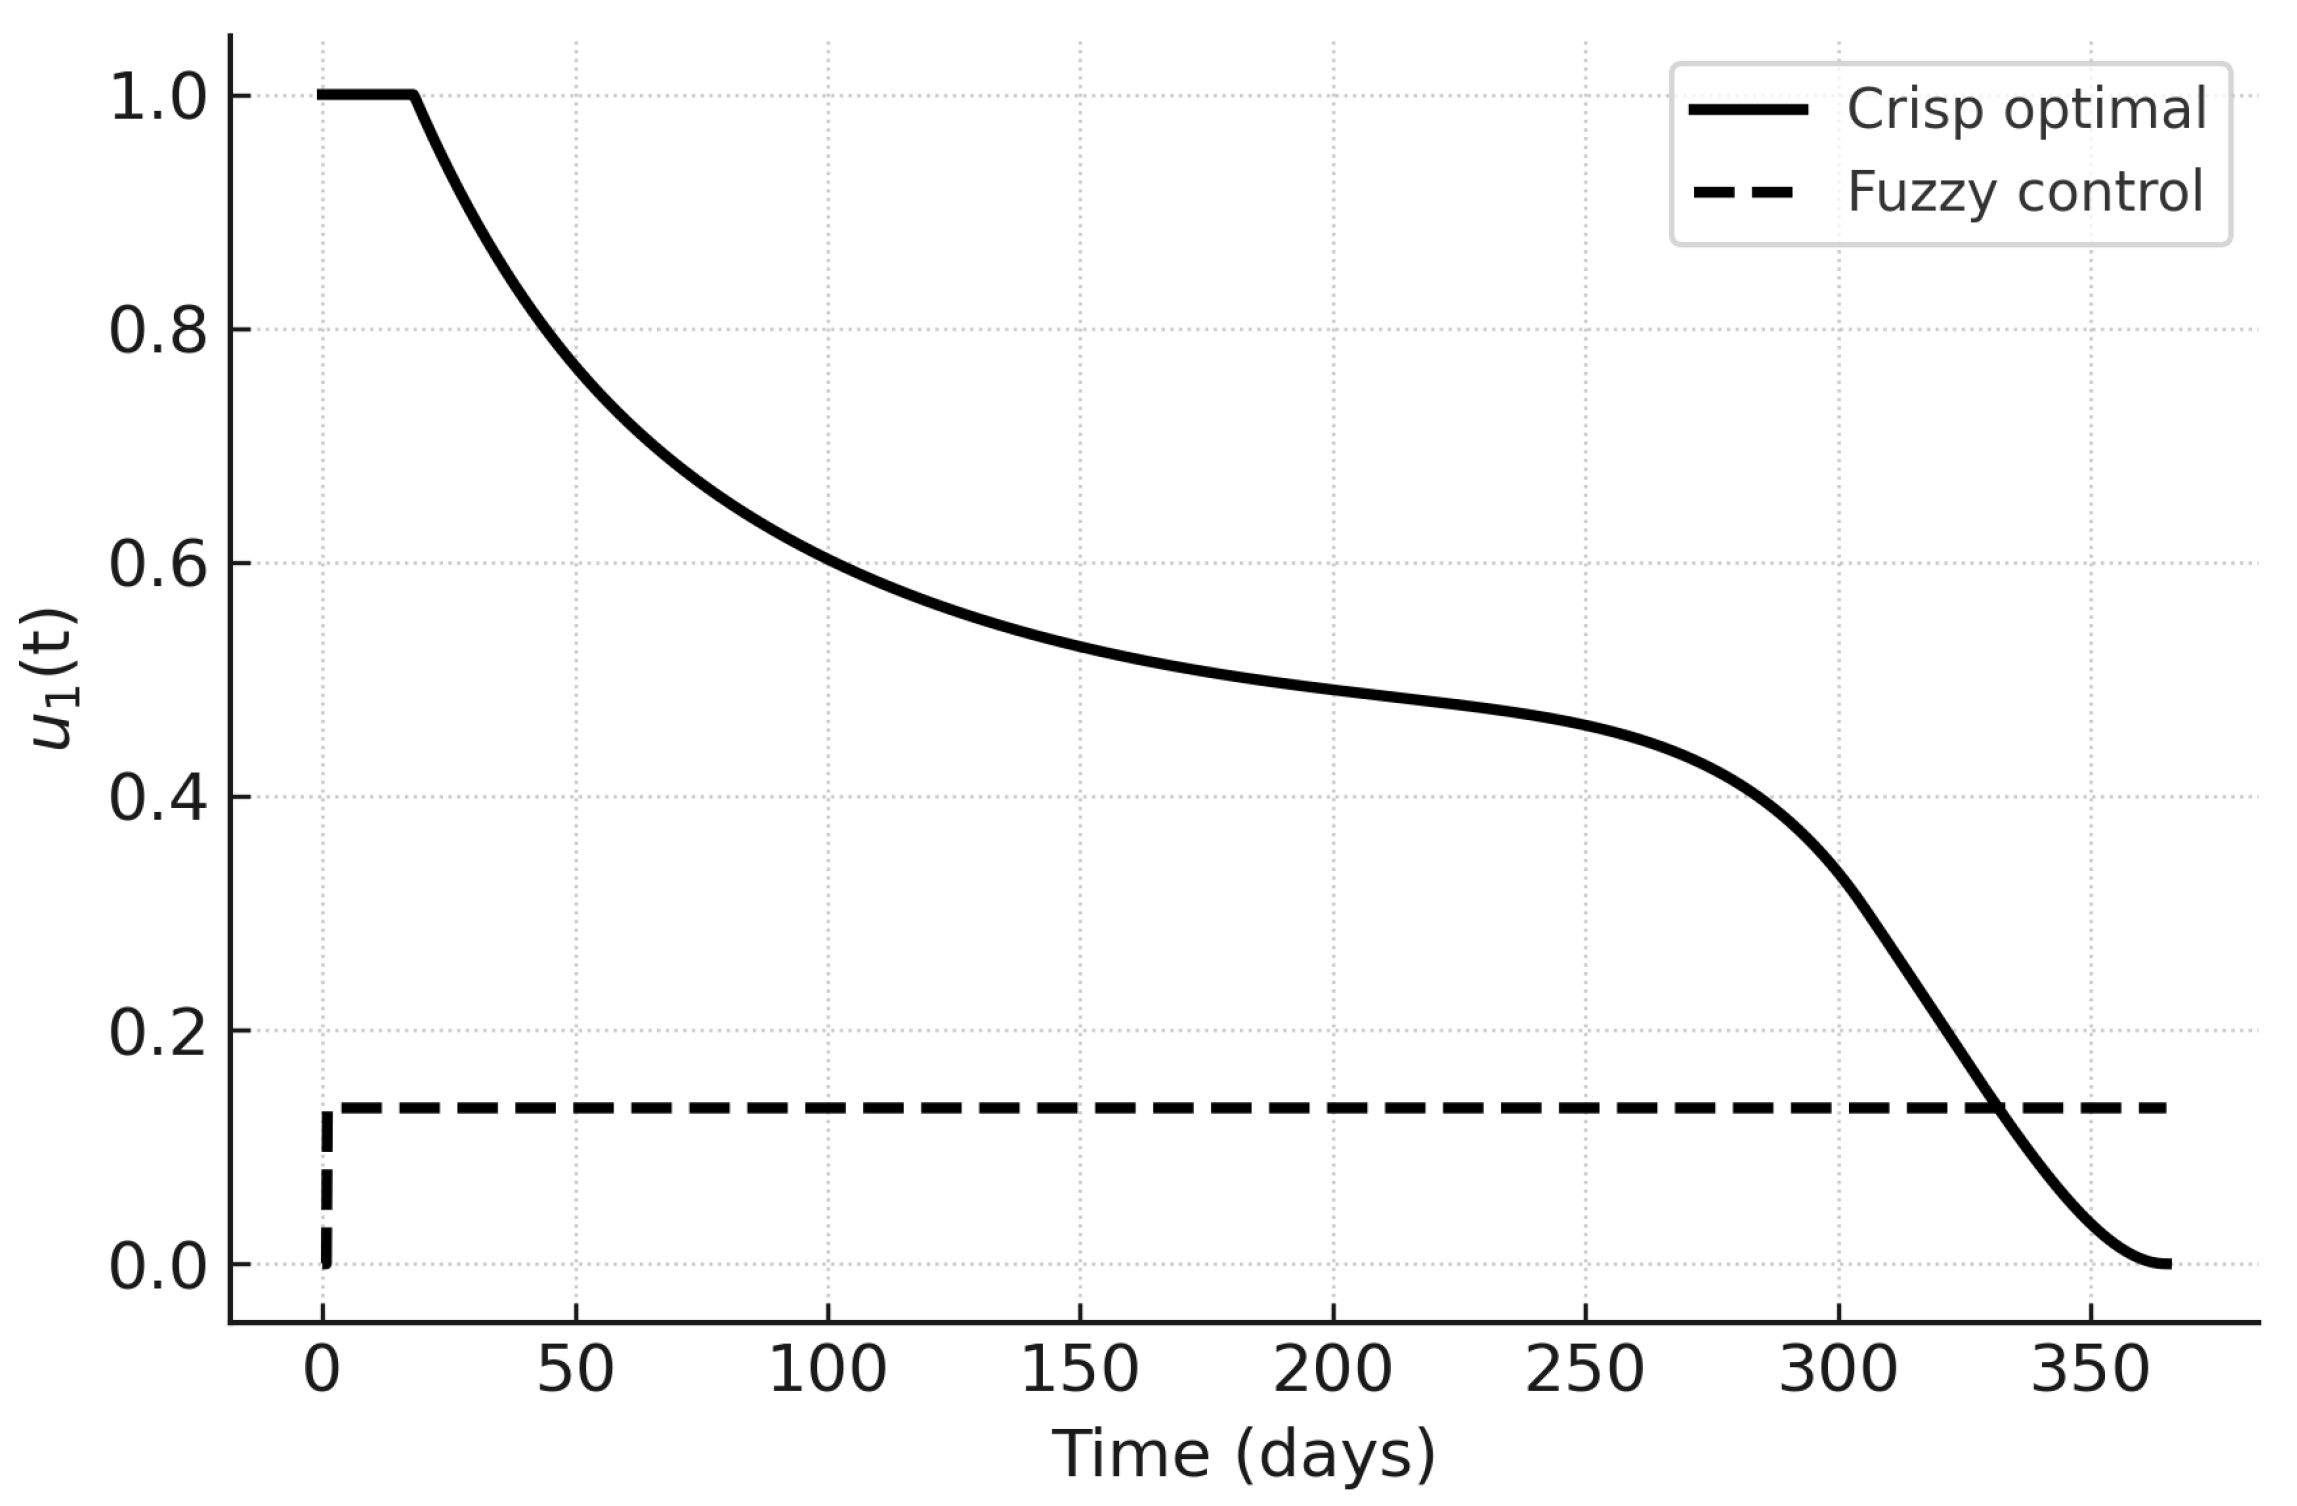
Figure 14.
Screening control : crisp optimal vs. fuzzy control.
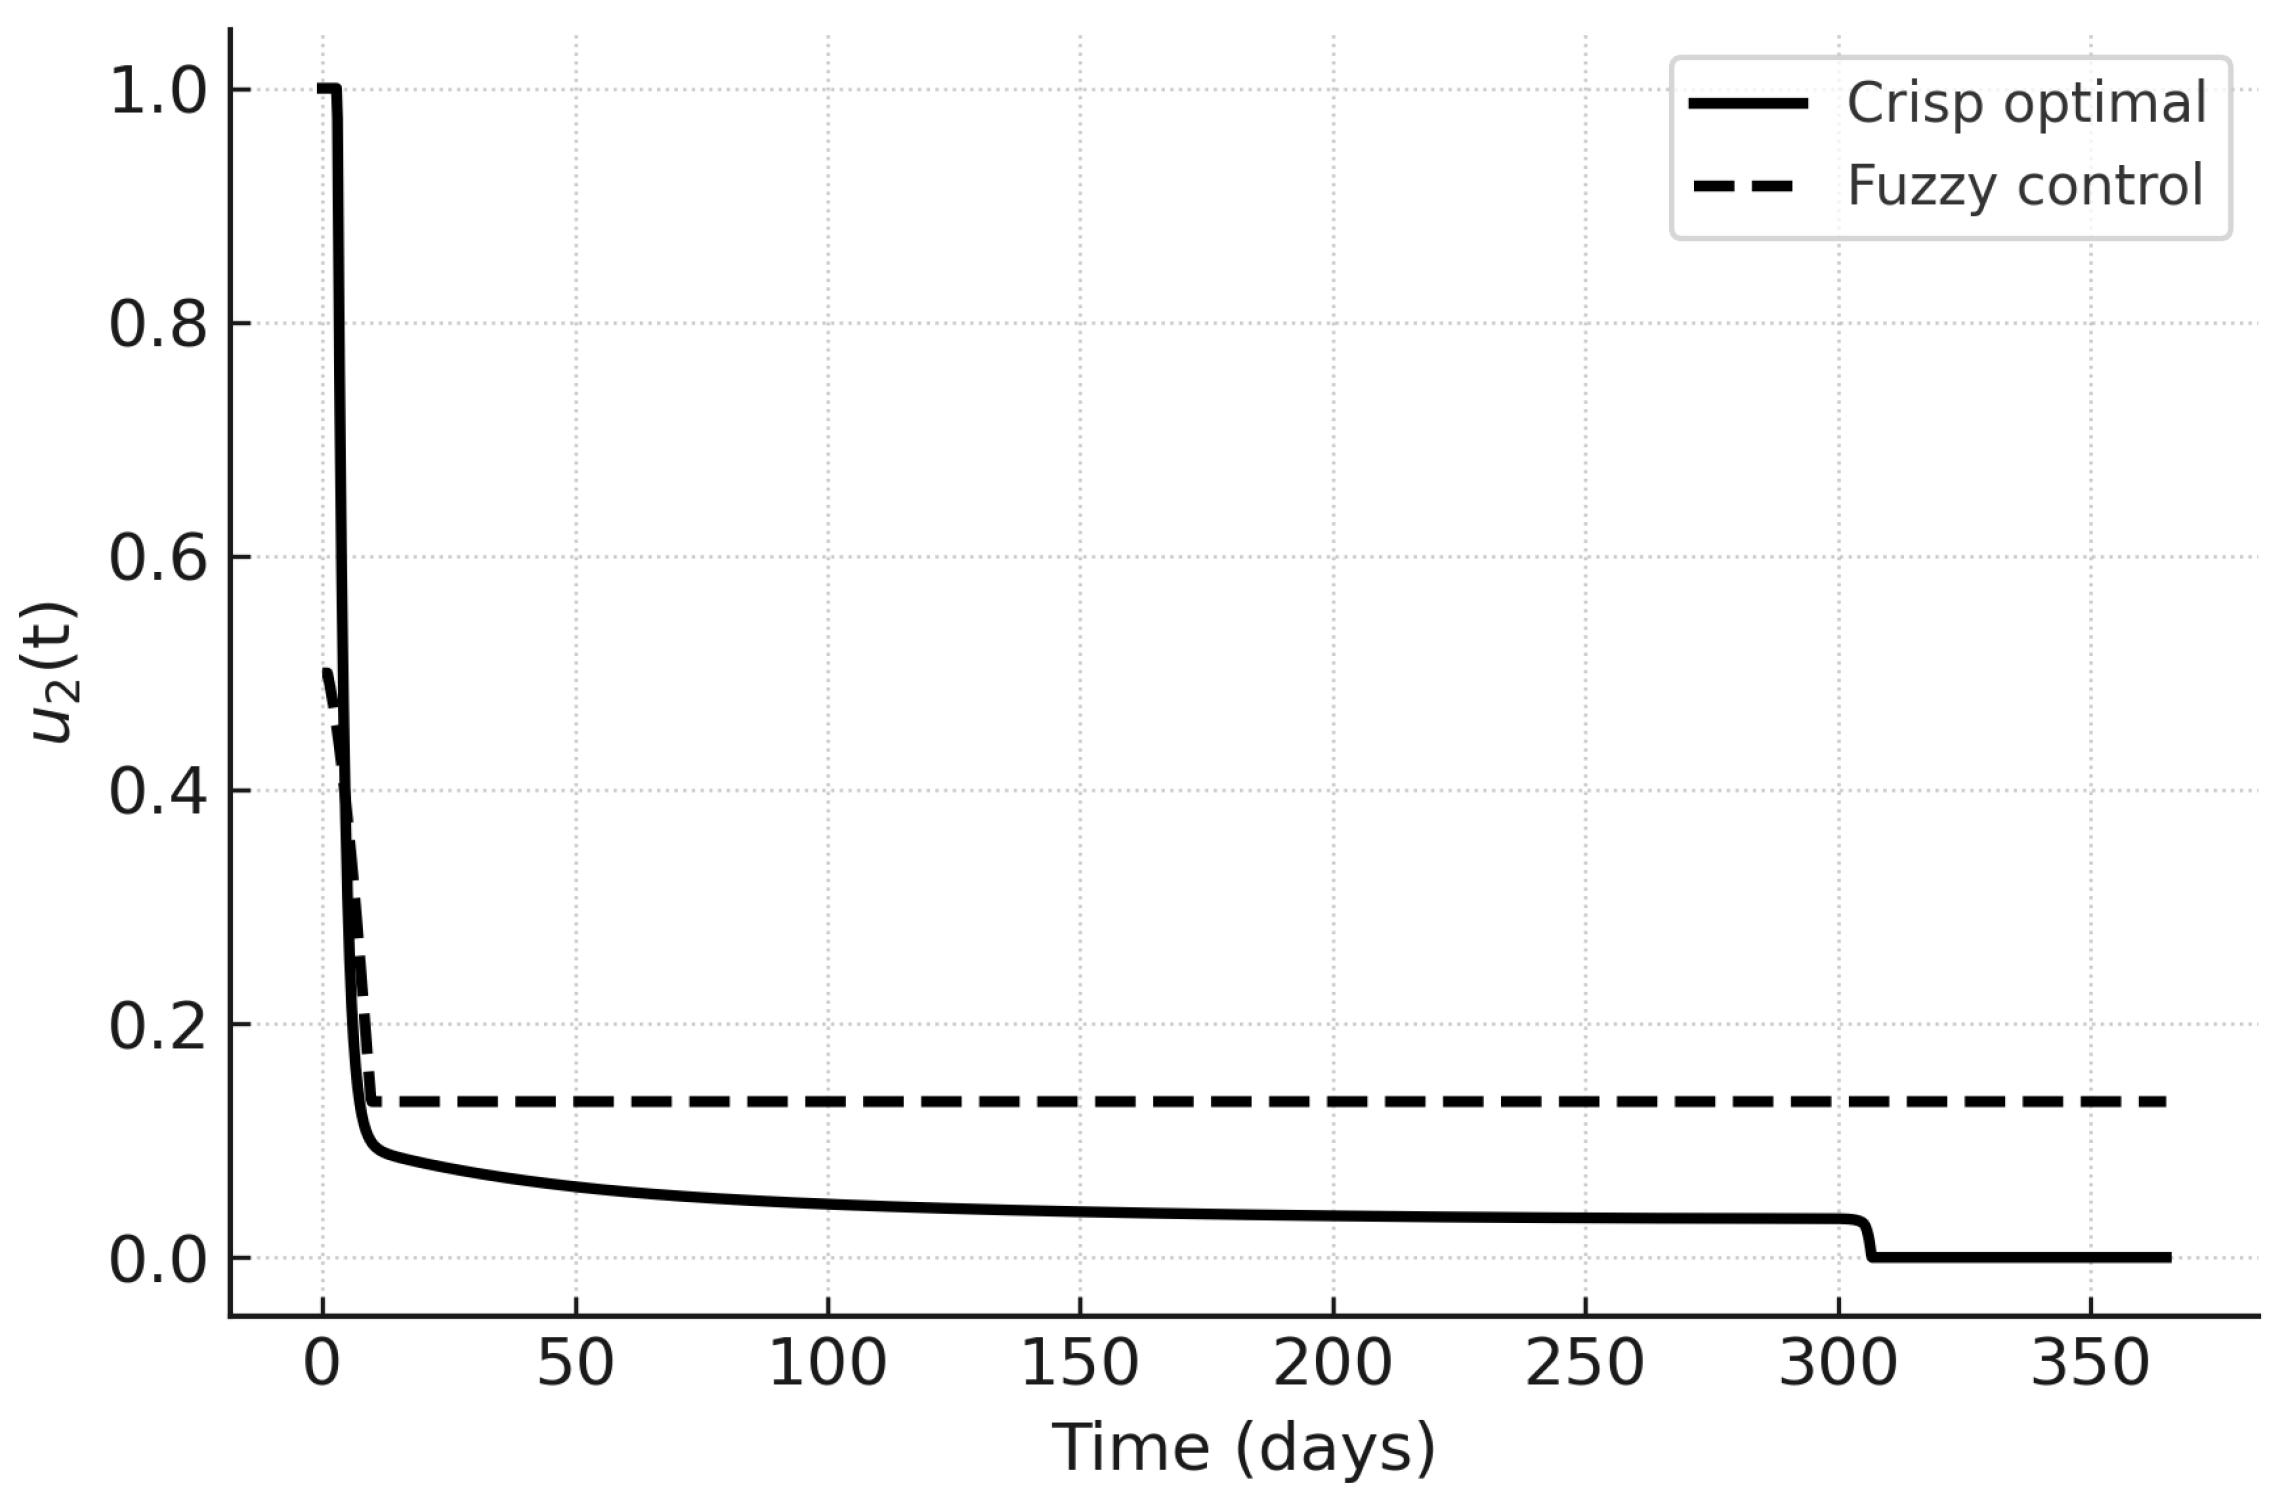
Figure 15.
Treatment control : crisp optimal vs. fuzzy control.
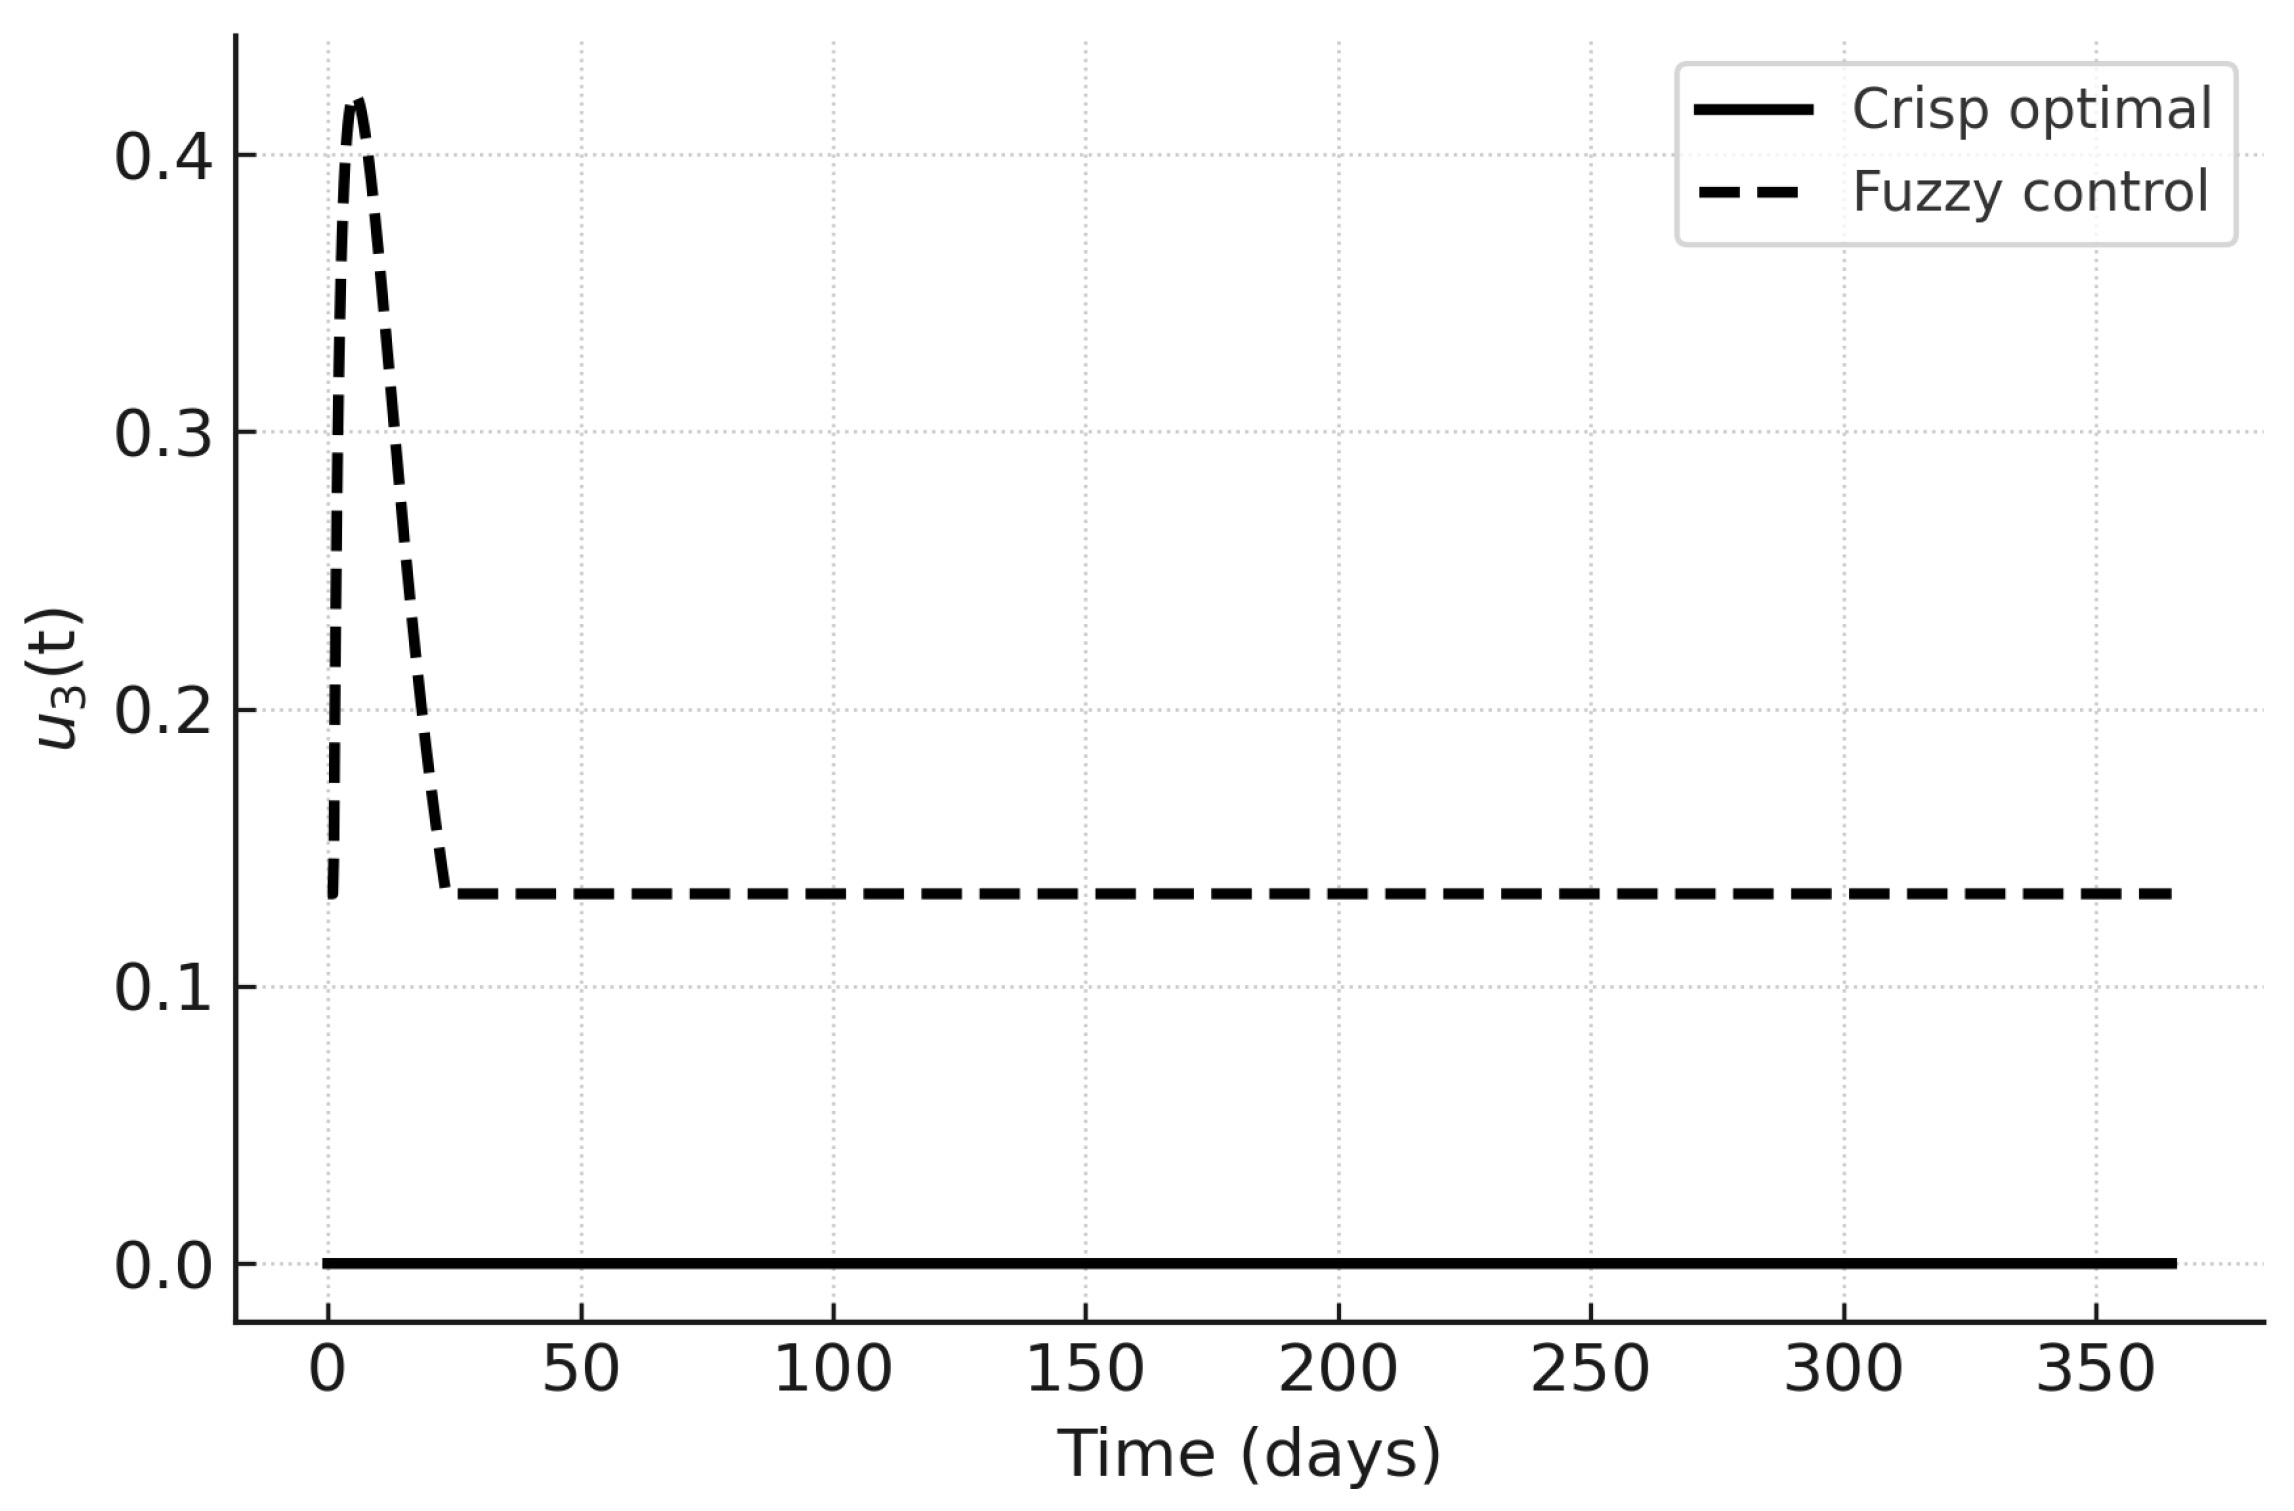

Table 1.
Membership function (MF) parameters on . Inputs share the same grids for simplicity; outputs mirror them to ease interpretability.
Table 1.
Membership function (MF) parameters on . Inputs share the same grids for simplicity; outputs mirror them to ease interpretability.
| Variable | Low MF | Medium MF | High MF |
|---|---|---|---|
Table 2.
Compact rule grid for awareness control as a function of Infection Pressure () and Awareness Level ().
Table 2.
Compact rule grid for awareness control as a function of Infection Pressure () and Awareness Level ().
| =Low | =Medium | =High | |
|---|---|---|---|
| =Low | Low | Low/Medium | Low |
| =Medium | High | Medium | Low |
| =High | High | High | Low |
Table 3.
Performance metrics for crisp optimal vs. fuzzy control strategies.
| Metric | Crisp optimal | Fuzzy control |
|---|---|---|
| Peak infected fraction | 0.4256 | 0.4256 |
| Time of peak (days) | 0.0 | 0.0 |
| Minimum infected fraction | 0.0207 | 0.0339 |
| Time of minimum (days) | 78.2 | 96.6 |
| Time to (days) | — | — |
| Total cost J | 126.3764 | 42.4193 |
Disclaimer/Publisher’s Note: The statements, opinions and data contained in all publications are solely those of the individual author(s) and contributor(s) and not of MDPI and/or the editor(s). MDPI and/or the editor(s) disclaim responsibility for any injury to people or property resulting from any ideas, methods, instructions or products referred to in the content. |
© 2025 by the authors. Licensee MDPI, Basel, Switzerland. This article is an open access article distributed under the terms and conditions of the Creative Commons Attribution (CC BY) license (http://creativecommons.org/licenses/by/4.0/).
Copyright: This open access article is published under a Creative Commons CC BY 4.0 license, which permit the free download, distribution, and reuse, provided that the author and preprint are cited in any reuse.


