
Submitted:
11 December 2025
Posted:
12 December 2025
You are already at the latest version
Abstract
Background/Objectives: The delayed effects of subchronic and chronic organophosphate poisoning may manifest years after exposure, often masked by age-related diseases. The aim of this retrospective cohort study was to identify the biochemical "trace" that could remain in the patients decades after the poisoning. To achieve this goal, we determined a wide range of biochemical parameters, along with the spectrum of esterified and non-esterified fatty acids (EFA and NEFA, respectively), in the blood plasma of a cohort of elderly patients diagnosed with occupational pathology (OP) due to subacute or (sub)chronic exposure to organophosphates in the 1980s. Methods: Elderly patients with and without a history of exposure to organophosphates were retrospectively divided into two groups: controls (n=59, aged 73±4, men 29% and women 71%) and having the OP (n=84, aged 74±4, men 29% and women 71%). The period of neurological examination and blood sampling for subsequent analysis was approximately one and a half years - from mid-2022 to the end of 2023. Determination of the content of biomarkers of metabolic syndrome, NEFA and EFA in blood plasma was performed by HPLC-MS/MS and GC-MS. Results: The medical history of the examined elderly individuals with OP and the aged control group includes common age-related diseases. However, patients with OP more often have hepatitis (33 vs 7%, p<0.001) and other gastrointestinal diseases (54 vs 32%, p<0.05), total with diagnosis of polyneuropathy (87 vs 66%, p<0.01) and polyneuropathy of the upper and lower extremities (29 vs 12%, p<0.05), impaired distal sensitivity (83 vs 56%, p<0.001), increased body mass index (30.0±4.6 vs 28.4±4.1, p<0.05), and also they have an increased drug load (5 vs 4, p<0.001). Patients with OP more often have balance problems (84 vs 69%, p<0.05) and difficulties in performing daily activities (75 vs 49%, p<0.01). No differences were found between the groups when assessing cognitive function using the MMSE (mini mental state examination), SAGE (self-administered gerocognitive exam), and “Clock” tests. Of the 34 basic biochemical parameters determined on the biochemical analyzer, statistically significant changes were found for only 11, with their median values not going beyond the reference range (clinical norm), and the differences being due to significant individual deviations. Analysis of some metabolic biomarkers with HPLC-MS/MS revealed in the OP group a 1.4-fold decrease in the concentration of 3-hydroxybutyrate (p<0.05, AUC=0.62) and 1.6-fold decrease in the concentration of 2-hydroxybutyrate (p<0.0001, AUC=0.72). In the OP group, a 26% decrease in acetyl-L-carnitine concentration was found (p<0.001, AUC=0.69). An additional study of the esterase profile of patients revealed a decrease in the activity of butyrylcholinesterase (BChE) by 14% (p<0.05, AUC=0.62) though increase in the esterase activity of albumin by 29% (p<0.05, AUC=0.62) in the OP group. Correlation analysis revealed the most significant relationships between albumin esterase activity and arachidonic acid concentration in the OP group (0.64, p<0.0001). A study of a wide range of fatty acids in patients with OP revealed reciprocal relationships between EFA and NEFA. A decrease in concentration was shown for esters of margaric (p<0.01, AUC=0.65), stearic (p<0.01, AUC=0.65), eicosadienoic (p<0.01, AUC=0.63), eicosatrienoic (p<0.01, AUC=0.66), arachidonic (p<0.001, AUC=0.67), eicosapentaenoic (p<0.05, AUC=0.60), and docosahexaenoic (p<0.0001, AUC=0.74) fatty acids. An increase in the concentration was shown for free (non-esterified) fatty acids: heptadecenoic (p<0.0001, AUC=0.72), eicosapentaenoic (p<0.05, AUC=0.62), eicosatrienoic (p<0.001, AUC=0.68), docosahexaenoic (p<0.01, AUC=0.66), γ-linolenic (p<0.01, AUC=0.66), myristic (p<0.0001, AUC=0.71), eicosenoic (p<0.01, AUC=0.65), arachidonic (p<0.01, AUC=0.66), eicosadienoic (p<0.001, AUC=0.67), oleic (p<0.01, AUC=0.66), linoleic (p<0.01, AUC=0.65), palmitic (p<0.001, AUC=0.68), linoelaidic (p<0.01, AUC=0.65), stearic (p<0.01, AUC=0.64), palmitoleic (p<0.05, AUC=0.61), pentadecanoic (p<0.05, AUC=0.61), and margaric (p<0.01, AUC=0.64). Decrease in the ratios of omega-3 to other unsaturated fatty acids were observed only for the esterified forms: by 29% for n3/n6 (p<0.0001, AUC=0.70), by 33% for n3/(n6+n9) (p<0.0001, AUC=0.72), and by 26% for n3/(all fatty acids) (p<0.0001, AUC=0.72). Finally, we have found out how the most reliable indicators correlate with each other. The esterified docosahexaenoic acid – lactate dehydrogenase (LDH) (0.67, p <0.0001) and LDH – total antioxidant status (TAS) (-0.61, p <0.0001) correlations are stronger in the OP group compared to the correlation in the overall sample and lose their strength and statistical significance in the control group. In the OP group, esterified docosahexaenoic fatty acid, LDH activity, and TAS concentration have a moderate correlation with calcium concentration (-0.66, p <0.0001; -0.67, p <0.0001; 0.63, p <0.0001, respectively). In the control group, this correlation is significantly weakened. Esterified docosahexaenoic acid in the OP group also demonstrated strong positive correlations with a row of other esterified fatty acids, though these correlations were not significantly weakened in the control group. Conclusions: The data obtained allow us to consider an increased level of NEFA as one of the main cytotoxic factors for the vascular endothelium, which can determine the specificity of age-related diseases. Modification of albumin properties by arachidonic acid decreased bioavailability of docosahexaenoic acid could be molecular links that cause specific manifestations of OP-induced pathology at late stages after exposure. Epigenetic changes, the contribution of dietary patterns and intestinal microbiota to the spectrum of EFA and NEFA require additional research.
Keywords:
age‐related diseases
; organophosphates
; occupational pathology
; esterified and nonesterified fatty acids
; omega‐3 fatty acids
; biomarker
1. Introduction
Organophosphates are among the most common xenobiotics, the neurotoxic effects of which have been thoroughly investigated [1, 2]. Every year, millions of people worldwide become victims of accidental poisoning by pesticides, organophosphate-containing flame retardants and environmental pollutants [3,4,5,6]. A significant proportion of them are workers in industrial and agricultural enterprises, whose poisoning often occurs as a result of non-compliance with safety regulations. Four conditions caused by the neurotoxic effect of organophosphates are usually identified: cholinergic crisis, intermediate syndrome, organophosphate-induced delayed polyneuropathy, and chronic organophosphate exposure disorder [7]. This list can be supplemented by the Gulf War syndrome [8]. According to numerous studies, organophosphate exposure in humans can lead to: aberrations in embryonic development; defects in neurocognitive functions in early life; and a significant contribution to the development of neurodegenerative diseases in adults [9,10,11,12,13]. At least two of the above-mentioned conditions of organophosphate-induced pathology depend on the severity of acute poisoning and manifest themselves in the short term.
The clinical symptoms and diagnostic criteria of cholinergic syndrome are described in many articles on toxicology [7]. They are associated primarily with the suppression of synaptic acetylcholinesterase activity, the subsequent accumulation of acetylcholine and, as a result, hyperactivation of nicotinic and muscarinic receptors. The early phase of convulsive activity (the cholinergic phase of the toxicogenic stage of poisoning, up to 5 minutes after the onset of the attack) initially acquires mixed cholinergic and non-cholinergic modulation (5-40 minutes), and then transforms into the non-cholinergic phase of the toxicogenic stage of poisoning [14]. Intermediate syndrome occurs with a frequency of 7.7% to 84% within 1-4 days after acute poisoning with certain organophosphates, when the symptoms of cholinergic syndrome no longer appear. This condition results from damage to the neuromuscular junctions of the diaphragm, intercostal muscles, neck flexors, shoulder abductors, and hip flexors. At the molecular and ultrastructural level, the development of intermediate syndrome and associated myopathy is associated with prolonged inhibition of acetylcholinesterase, desensitization and decreased expression of nicotinic receptors, oxidative stress, and muscle fiber necrosis [15]. The severity of the syndrome may be aggravated by endothelial damage as a result of measures taken in intensive care units [16]. Delayed polyneuropathy may appear 10-20 days after a single acute poisoning with pronounced cholinergic syndrome, but tens of thousands of cases of delayed polyneuropathy in the USA, Morocco, Romania, Sri Lanka, China and the former Yugoslavia are associated with repeated poisoning with triorthocresyl phosphate as part of surrogate alcohol or food products without obvious signs of cholinergic syndrome [7]. The occurrence of delayed consequences of (sub)chronic intoxication with organophosphates is usually not associated with the suppression of acetylcholinesterase activity, and among the consequences may be neurodegenerative diseases such as Parkinson's disease, Alzheimer's disease, multiple sclerosis [17]. The development of Gulf War illness is associated with the combined effects of pyridostigmine bromide and permethrin, which were regularly taken by coalition combatants as a preventative measure against actual poisoning with highly toxic organophosphates and scabies/pediculosis, respectively [8]. Taking into account prophylactic vaccination and subsequent therapeutic intervention, several molecular mechanisms for the pathogenesis of Gulf War illness have been proposed, including chronic inflammation, oxidative stress, lipid and intestinal microbiota imbalance, and epigenetic modifications [18].
The remaining consequences of subchronic and chronic poisonings usually manifest themselves years after exposure. In such cases, the complexity of diagnosis is aggravated by the aging of the body and comorbid age-related diseases, the differential diagnosis of which is an independent problem regardless of the toxic factor [19]. Damage to the endothelium of blood vessels is one of the main pathogenetic factors of age-related diseases, including neurodegenerative diseases [20,21], and the pathogenesis of the organophosphate-induced delayed peripheral polyneuropathy is associated with damage to endoneurial capillaries [22]. However, the question of cause-and-effect relationships and secondary mediators of the remaining pathology, arising as a result of the impact or manifestation of factors of genetic, epigenetic and socio-demographic nature, remains open. Such factors include lifestyle and diet, manifested in biochemical parameters of the blood, among which non-esterified fatty acids (NEFA) and their acylated derivatives (esterified fatty acids, EFA) play a special but poorly studied role. Thus, although hyperglycemia is the main risk factor for polyneuropathy in type 1 diabetes, it is known that metabolic syndrome and concomitant dyslipidemia underlie the occurrence and progression of polyneuropathy in type 2 diabetes and its prediabetic state [23,24].
There are studies indicating an important role for polyunsaturated fatty acids (PUFA) in all-cause mortality, in the development of cardiovascular diseases, and in dementia [25,26]. Fatty acids are present in tissues and the bloodstream as part of complex lipids such as triglycerides and phospholipids, while NEFA circulate in an unbound form. Hydrolysis of dietary lipids to NEFA occurs before their absorption and subsequent involvement in lipid biosynthesis [27]. Thus, nutritional factors largely determine the fatty acid content in the blood. However, serum/plasma fatty acid profiles not only correlate with such indicators as body mass index (BMI) and muscle strength [28], but also show great indicative potential in the diagnosis of a number of diseases [29].
The aim of the research reported on here was to identify the biochemical "trace" that could remain in the patients decades after the poisoning. For its implementation we determined a wide range of biochemical parameters, along with the spectrum of fatty acids and their acylated derivatives in the blood plasma of a unique cohort of elderly patients - former employees of a chemical enterprise (Novocheboksarsk, Russia) diagnosed with occupational pathology caused by subacute or (sub)chronic exposure to organophosphates in the 1980s. We proceeded from the assumption that intoxication of the body with organophosphates followed by drug load causes systemic damage to vascular endothelial cells, liver, enterocytes and an imbalance of the intestinal microbiota, which serves as a trigger for metabolic diseases and is manifested in a persistent change in the lipid profile.
2. Materials and Methods
2.1. Study Design and Setting
Elderly patients (68 to 84 years old) with and without a history of exposure to organophosphates, which worked in the 1980-1990s at chemical industry enterprises, currently residing in the city of Novocheboksarsk and registered with the Medical Unit 29 of the Federal Medical and Biological Agency, were retrospectively divided into two groups: control group (n=59) and having the occupational pathology group (n=84). The period of forming patient groups, their neurological examination and blood sampling for subsequent analysis was approximately one and a half years - from mid-2022 to the end of 2023. The study was approved by the Ethics Committee of the Research Institute of Hygiene, Occupational Pathology and Human Ecology of the Federal Medical Biological Agency (Approval No. 3, registration date 2 June 2022).
2.2. Eligibility Criteria
For both control and OP groups, inclusion criteria included data on the place and duration of employment, annual medical examination data, and registered cases of medical treatment for subacute or subchronic organophosphate poisoning during work in chemical industry enterprises. Exclusion criteria included data on progressive cancer and recent infectious diseases.
2.3. Outcomes and Measures
Structured interviews were conducted to obtain socio-demographic data. For elderly patients, medical history and neurological examination data were collected. After blood collection from representatives of all three groups, initial sample preparation and general biochemical analysis were performed, followed by determination of a group of biomarkers for metabolic syndrome and fatigue, as well as esterified and non-esterified fatty acids in the blood plasma.
2.3.1. Reagents and Standards
Acetonitrile, formic acid, ammonium formate, aqueous ammonia (25-27%), sulfuric acid, potassium dichromate, sodium hydroxide, gaseous nitrogen, o-phosphoric acid - purchased from Lenreaktiv, St. Petersburg, Russia; meldonium dihydrate (pharmacopeial standard in the form of a powder substance) - purchased from SPC KEM, St. Petersburg, Russia; n-hexane, special purity grade - purchased from Kriokhrom, St. Petersburg, Russia; phosphate saline buffer tablets pH 7.2-7.6 - purchased from Eco-Service LLC, St. Petersburg, Russia; methanol for gradient HPLC - purchased from Avantor™ Performance Materials; methanol 99.9% - purchased from CARLO ERBA Reagents srl, Italy; uric acid (≥99%), creatinine (≥99%), creatine (analytical grade), sodium 2-hydroxybutyrate (≥97%), 3-hydroxybutyrate (95%), acetylcarnitine hydrochloride, threonine (≥98%), inosine (≥99%), adenosine (≥99%), lactic acid (≥98%), tryptamine (≥98%), 3-methylhistidine, 2-hydroxymethylbutyrate (99%), 3-hydroxymethylbutyrate (≥95%), hypoxanthine (≥99%), uridine (≥99%), sodium methylate (>97%), tetrabutylammonium hydroxide 1 M solution in methanol, methyl iodide (≥99%), deuterated palmitic acid D31 –purchased from Sigma-Aldrich, St. Louis, USA; deuterated methyl ester of palmitic acid D31, CDN Isotopes, Cat. No. D-1360; a mixture of methyl esters with a certified content of 37 fatty acids F.A.M.E. C4-C24 was purchased from Supelco, Merck KGaA, Darmstadt, Germany; methylene chloride (99.9%) was purchased from LiChrosolv, Merck KGaA, Darmstadt, Germany.
2.3.2. Blood Collection and Plasma Preparation
Blood samples were collected, processed and stored in accordance with international guidelines [30]. Blood was collected from the subjects on an empty stomach from the cubital vein into BD Vacutainer vacuum tubes with anticoagulants (K2EDTA, heparin). The plasma was stored at −70°C until needed.
2.3.3. Determination of a Group of Biomarkers of Metabolic Syndrome and Fatigue in Blood Plasma
Determination of the content of biomarkers of metabolic syndrome and fatigue (3-methylhistidine, threonine, creatine, acetyl-L-carnitine, creatinine, uridine, lactic acid, uric acid, 3-hydroxybutyrate, 2-hydroxybutyrate) in blood plasma was performed by HPLC-MS/MS (LCMS-8050 chromatograph mass spectrometer with atmospheric pressure electrospray ionization in combination with a Nexera XR liquid chromatograph) after desalting the samples with acetonitrile. Separation of sample components is performed on a Zorbax SB-C8 150 mm × 4.6 mm × 1.8 μm chromatographic column (Agilent Technologies, Santa Clara, CA, USA), followed by registration of selected ion transitions with a tandem mass spectrometric detector. Due to the high levels of the biomarkers in biofluids, additional concentration was not required. Biomarkers were identified by retention times and mass spectrometric characteristics. Software for data management and processing "LCMS Solution".
Table 1S presents the metrological characteristics of the procedure for determining a group of biomarkers of metabolic syndrome and fatigue in blood plasma using the HPLC-MS/MS method.
2.3.4. Selective Determination of Non-Esterified Fatty Acids and Esterified Fatty Acids in Blood Plasma
The analysis was performed using gas chromatography-mass spectrometry (GC-MS). Extractive methylation was used to prepare samples for analysis. Mild conditions for sample preparation for GC-MS analysis excluded uncertainty associated with losses or mutual transformations of fatty acids. In this case, selective determination of NEFA and EFA was carried out in one aliquot of the sample. The method for determining the content of NEFA and EFA in blood by GC-MS using extractive methylation was proposed in 2015 by Orlova et al. [31] and was then used in a number of studies, including influence of an occupational pathology on the fatty acid profile of blood [32].
The content of methyl esters of EFA and NEFA in blood plasma was measured using a two-stage method for determining methyl esters of fatty acids given in the article [31] with partial modification.
Chromatographic separation of the analytes was carried out in a temperature program from 80°С (1 min), heating to 210°С (1 min), then heating to 230°С (18 min). The carrier gas flow rate through the column was 1 mL/min, the injection mode was splitless - 1 min. The temperatures of the ion source and interface are 230°С and 240°С, respectively. The delay for the solvent outlet was 9 min. GC-MS analysis was performed in the mode of selected ions characteristic of fatty acid methyl esters. Three ions were scanned for each methyl ester: one main and two confirmatory ions, which were subsequently used to identify the detected compounds (Table 2S).
The essence of the two-stage method for determining fatty acids was the trans-esterification of acids into the corresponding methyl esters at the first stage (at pH=11), and the use of the extractive methylation procedure of free acids at the second (at pH=8). In this case, both procedures were performed with a single 0.1 ml aliquot of the blood plasma sample, sufficient to obtain reliable results while avoiding overloading the chromatography column with sample components.
Preparation of Extracts. A 0.1 ml plasma sample was placed in a 15 ml centrifuge tube. 20 μl of each internal standard solution with a concentration of 100 μg/μl were added: palmitic acid D31 (for determining esterified fatty acids) and palmitate methyl ester D31 (for determining free acids).
Stage 1. 0.5 ml of 0.8 M sodium methylate was added to the resulting plasma solution, the solution was vortexed for 10 min, then 2 ml of extractant (hexane) was added, the mixture was vortexed again for 10 min, and then centrifuged for 10 min at 1300 rpm. The supernatant, containing esterified fatty acids, was collected in a chromatographic vial, evaporated to dryness under a stream of nitrogen, redissolved in 200 µl of methylene chloride, and analyzed by GC-MS under the conditions described above.
Stage 2. To the remaining lower layer of the sample containing free fatty acids, 3 ml of phosphate-buffered saline, 60 μl of a 2 mg/ml o-phosphoric acid solution to achieve pH=8, 200 μl of tetrabutylammonium hydroxide, 100 μl of methyl iodide (CH3I), and 3 ml of methylene chloride were added. The resulting mixture was vortexed for 10 min, then centrifuged at 1300 rpm for 10 min. The upper aqueous layer was discarded, the lower organic layer was transferred to a chromatographic vial, evaporated to dryness under a stream of nitrogen, the dry residue was redissolved in 200 μl of methylene chloride and subjected to GC-MS analysis under the conditions described above.
To determine the fatty acid content in blood plasma samples, two ranges of calibration dependences were established: from 0.002 to 200 μg/ml for acids with a minor content and separately for 200 to 2500 μg/ml for acids with a high content (palmitic, stearic, oleic, linoleic, arachidonic and docosahexaenoic). The calibration dependencies were established using the internal standard method, which was deuterated methyl ester of palmitic acid. The correlation coefficients of the calibration characteristics corresponded to values of at least 0.9998. The root-mean-square deviation (RMSD) of the peak areas in each range did not exceed 20%. During the validation of the method, the stability of blood plasma samples was confirmed when stored in a freezer at minus 70°C for a year and in 2 freeze-thaw cycles. During the validation tests of the method, the characteristics obtained were not inferior to those established by the developers of the method [33]. In the entire measurement range, the analysis error did not exceed 20%. The standard deviation of the repeatability of the analytical results, σr, was determined from a series of parallel acid measurements in the same plasma sample (5 series, n=3). The values did not exceed 15%, while the relative error of the analytical results did not exceed 25%.
2.3.5. Biochemical Analysis
Biochemical parameters were determined on a Sapphire 400 analyzer using commercial RANDOX kits. Methods for determining concentration of malondialdehyde and activity of esterases are described in [34,35,36]. The activity of each sample was measured in triplicate, the coefficient of variation was 1.8%.
2.4. Statistical Data Processing
Our study was largely exploratory in nature and was limited to a small cohort of patients with occupational pathology residing in Novocheboksarsk and registered with the Medical and Sanitary Unit No. 29. For these and a number of less significant reasons, we were unable to predict the effect of parameters such as free and esterified fatty acid concentrations, butyrylcholinesterase and albumin esterase activity. For baseline biochemical parameters, the desired sample power was 200 individuals (Effect size 0.4, Significance level 0.05, Power 0.8). A total of 202 former employees were invited for the examination. It was assumed that approximately 50% would be in the OP group, and the rest in the control group. After collecting their medical history, 49 individuals were excluded from the study because they had occupational diseases not associated with organophosphate exposure or contact with other chemical compounds, which prevented their inclusion in the control group. Thus, the acceptance rate was 76%. Another 10 people did not attend the test due to personal circumstances, and blood samples were not collected from them.
Statistical data processing was carried out using the GraphPad Prism 8.4.3 program. For descriptive statistics, medians with ranges from minimum to maximum and interquartile ranges were used. Testing for normality of distribution was carried out in several ways: D’Agostino-Pearson omnibus normality test, Shapiro–Wilk normality test, and Kolmogorov–Smirnov normality test. To compare two groups of unrelated data, the Mann–Whitney test was used and Fisher’s exact test was used to compare the qualitative (nominal) characteristics in two independent samples. Spearman's rank correlation coefficient was used to measure the relationship between two variables. ROC-analysis was used to calculate the area under the curve. Online resource https://www.ai-therapy.com/psychology-statistics/power-calculator was used to calculate Post-hoc power.
3. Results
3.1. Socio-Demographic Data, Concomitant Diseases
The characteristics of the groups of elderly patients are presented in Table 1. The formed groups do not differ in average age and gender composition. The BMI was calculated using the formula I = m / h2, where m is body weight in kg, h is height in m. According to WHO recommendations, depending on the BMI value, a distinction is made between underweight, normal body weight, overweight or pre-obesity, obesity of 1, 2 or 3 degrees. To compare the BMI of people in the control group and the group of OP patients, the Mann-Whitney test was used. Statistically significant differences were found between the groups, but these differences have no clinical significance; the average values in both groups are in the overweight range. The proportion of people with normal, overweight and obesity in each group are presented in Table 1 for reference. For correct statistical processing, obesity of the 2nd and 3rd degree was combined into one category. Smokers included all those who had ever smoked, regardless of the intensity and duration of smoking. In the OP group, the proportion of smokers is 4 times higher (p<0.05). In the structure of both groups, employees with secondary specialized education predominate.
The medications frequently or constantly taken by the respondents were also recorded. To quantify this influencing factor, a general term "drug load" was introduced, which was characterized by the number of named medications regardless of their group (Figure 1a). Half of the patients in the control group take 3-5 medications daily, and patients with occupational diseases take 3-8, i.e. their drug load is higher (p<0.001). The following diagnoses were noted from the medical history of the subjects: Ischemic heart disease; hypertension; gastrointestinal diseases, including hepatitis (of toxic or other genesis); diabetes mellitus; musculoskeletal system diseases; episodes of acute cerebrovascular accident or chronic cerebrovascular disease. Diseases of all listed groups, with the exception of gastrointestinal diseases, occur in the subjects of the control group and OP patients with comparable frequency. However, gastrointestinal diseases (especially hepatitis) are significantly more common in the OP group (Figure 1b, c). Polyneuropathy was diagnosed during the examination. In the control group, 39 people were diagnosed with this diagnosis, which is 66% of the total number of patients in the group. In the OP group, polyneuropathy was diagnosed in 87% of the patients (p<0.01). It should be noted that approximately 20% of patients in each group may have polyneuropathy of diabetic origin. Polyneuropathy of the lower extremities was diagnosed more often, but only 12% of the control group had polyneuropathy of the upper and lower extremities, while in the OP group there were 29% of such patients (p<0.05). Figure 1d shows the polyneuropathy distribution diagram: in the OP group, polyneuropathy in a more severe form (of the upper and lower extremities) is more common.
To assess cognitive impairment, the subjects were asked to take three tests and also to independently assess their well-being according to several parameters. Self-assessment was of: problems with balance and difficulty performing everyday activities (answer options: yes/no); problems with memory and anxiety (answer options: yes/no/sometimes); and personality changes (answer options: yes, no, difficult to answer).
Subsequently, for statistical assessment of problems with memory and thinking, patients were regrouped into two categories - negative answers and positive ones (yes or sometimes). Answers about anxiety were also combined into two similar categories. During further processing, only strictly negative or positive answers were left in the answers about personality changes (therefore, the number of respondents decreased). The results of self-assessment of well-being before and after grouping are presented in Table 2.
When analyzing the questionnaire for assessing patients' well-being, problems with memory and thinking were noted by the majority of respondents from the control and OP groups (87% and 95%, respectively). In the control group, 69% of respondents had difficulty maintaining balance, while in the OP group the figure was 84% (p<0.001). At least sometimes, 87% of respondents experience anxiety, melancholy, and depression, regardless of the group. More than half of the respondents in both groups noted changes in their personality. Difficulties in performing everyday activities due to memory problems were experienced by 48% of respondents in the control group, and a quarter more (76%) in the OP group (p<0.0001). No differences were found between the groups when assessing cognitive function using the MMSE (mini mental state examination), SAGE (self-administered gerocognitive exam), and “Clock” tests; the results are presented in Table 3.
When assessing the neurological status, subjective and objective symptoms were assessed. Subjective symptoms included complaints of increased blood pressure, headache, dizziness, back and joint pain, weakness and fatigue, paresthesia or numbness of the extremities, vasomotor reactions, and psychoemotional disorders (mainly associated with sleep disturbances). One point was added for each of the listed symptoms, thus subjective symptoms were assessed on a 10-point scale (0-9 points). The results are presented in Table 4. In the OP group, respondents noted at least three subjective symptoms from the list, and in the control group at least one symptom. Although the medians in both groups are equal, one can speak of more pronounced symptoms in the OP group (p<0.05). Among the objective symptoms, the presence of pathological foot and hand reflexes was taken into account. In both groups, the presence of pathological foot reflexes was noted in 7% of patients. The presence of pathological wrist reflexes was detected in 12% of the examined patients in the OP group and only in one person (2%) in the control group (p<0.05).
Coordination disorders (intention, ataxia, missed aim) and craniocerebral changes (nystagmoid, nystagmus, asymmetry of the nasolabial fold, weakness of convergence, deviation of the tongue, symptoms of oral automatism) were assessed using a scoring system (one point for each of the detected symptoms).
In both groups, on average, two signs of coordination disorders and the same number of signs of craniocerebral changes were noted, however, due to differences in maximum values and the third quartile, craniocerebral changes were more common in the OP group (p<0.001).
Vibration sensitivity disorders were detected in 94% of patients in the OP group, which is higher than in the control, where such disorders were found in 80% of the examined patients. Impaired distal sensitivity was detected in 56% of those examined in the control group. In the OP group, such impairments were found in 83% of those examined (p<0.001). Also, during the examination, inhibition (up to complete absence) of abdominal, Achilles and plantar reflexes was noted (Table 4). Hypothermia of the extremities in both groups occurred in 6-7% of those examined, and hyperhidrosis - in 38-44%.
3.2. Biochemical Parameters
Depending on the volume/quality of the samples obtained (in some elderly people it is extremely difficult to take an adequate amount of blood), the maximum possible number of parameters was measured. For each parameter, the number of measurements is indicated in the bottom row (Table 3S). Of the 34 basic biochemical parameters determined on the biochemical analyzer, statistically significant changes were found for only 11, with their median values not going beyond the reference range (clinical norm), and the differences being due to significant individual deviations.
Of the 11 parameters with statistically significant differences, three may be associated with disorders of the endothelial cell condition: aspartate aminotransferase (AST), gamma-glutamyltransferase (GGT), and alkaline phosphatase (ALP) (the last two indicate the condition of the blood-brain barrier endothelial cells) [22]. The average values of AST and GGT activity in the OP group are slightly higher than in the control, while the statistical significance of these changes is achieved mainly due to high values in individual patients (Fig. 2a, b). ALP and lactate dehydrogenase (LDH) activity in the OP group is even lower than in the control. Despite the significance of these changes (p < 0.05 and p < 0.0001, respectively; Fig. 2c, d), it rather makes sense to pay attention to the individual high values, which are present in both groups. Calcium concentration in the OP group was 6% higher than in the control group (p < 0.01, Fig. 2e). However, the values in both groups are within the normal range, so this difference in itself does not have clinical significance. The median high density lipoproteins (HDL) concentration values in the OP group were significantly higher (Fig. 2f), but the clinical significance is the decrease in HDL to less than 1 mmol/L, which was observed in individual patients in both groups. Amylase activity in the OP group was also 18% higher than in the control, but lies within the normal range (Fig. 2g).
Due to significant differences in reference intervals between patients of different genders, ferritin concentration was analyzed separately in women and men. The observed increase in its concentration in the OP group was due to an increase in concentration mainly in women (Fig. 2h,i).
The median values of the total antioxidant status (TAS) in the OP group are 20% higher than in the control, while the significance of the differences is achieved due to high values in individual patients (Fig. 2j). Lipase activity in the OP group is only 5% higher, but in this group the significance of the differences between the groups is due to individual patients with activity 2-4 times higher than normal. To assess these changes, Figure 2k shows individual values, medians, and a normal range rather than box plots.
An additional study of the esterase profile of patients was performed in the “manual” mode on a plate reader (Table 4S). We found a decrease in the activity of butyrylcholinesterase (BChE) by acetylthiocholine (ATCh) as a substrate in the OP group compared to the control (Figure 3a), but the most unexpected was an increase in the esterase activity of albumin in the OP group by 29% (Figure 3b).
Given that palmitate inhibits albumin esterase activity [36,37], the effect of other major fatty acids on this activity is of great interest. We conducted a correlation analysis to search for a possible relationship between this activity and the level of the following major free (non-esterified) fatty acids: palmitic, stearic, oleic, linoleic, arachidonic, docosahexaenoic (Table 5).
High correlation levels (0.7 and higher) were not revealed. However, statistically significant relationships were found for the selected NEFA. When considering the array separately, which included only the subjects from the OP group, the strength and significance of the relationships revealed increases. The most significant and close relationships were found between albumin esterase activity and arachidonic acid concentration. When considering the subjects from the control group, statistically significant correlations were not revealed. Correlation analysis of all six fatty acids, as well as the sum of arachidonic and docosahexaenoic acids, did not reveal an increase compared to arachidonic acid alone.
Additional metabolic biomarkers (Table 5S, Figure 4a, b, c) were determined using chromatograph mass spectrometry equipment. In the OP group, a 1.4-fold decrease in the concentration of 3-hydroxybutyrate was found compared to the control. The decrease in the concentration of 2-hydroxybutyrate is more pronounced – 1.6-fold (p<0.0001). 3-Hydroxybutyrate is a ketone body, and its increased concentration in the blood causes ketosis. As an intermediate product of fatty acid oxidation, it accumulates in the body of patients with diabetes, being, in turn, a precursor of acetoacetate. At the same time, 3-hydroxybutyrate can be used as an energy source for the brain when there is a low level of glucose in the blood. 2-Hydroxybutyrate may be useful as an early indicator of insulin resistance in non-diabetic individuals [38]. In the OP group, a 26% (p<0.001) decrease in acetyl-L-carnitine concentration was found.
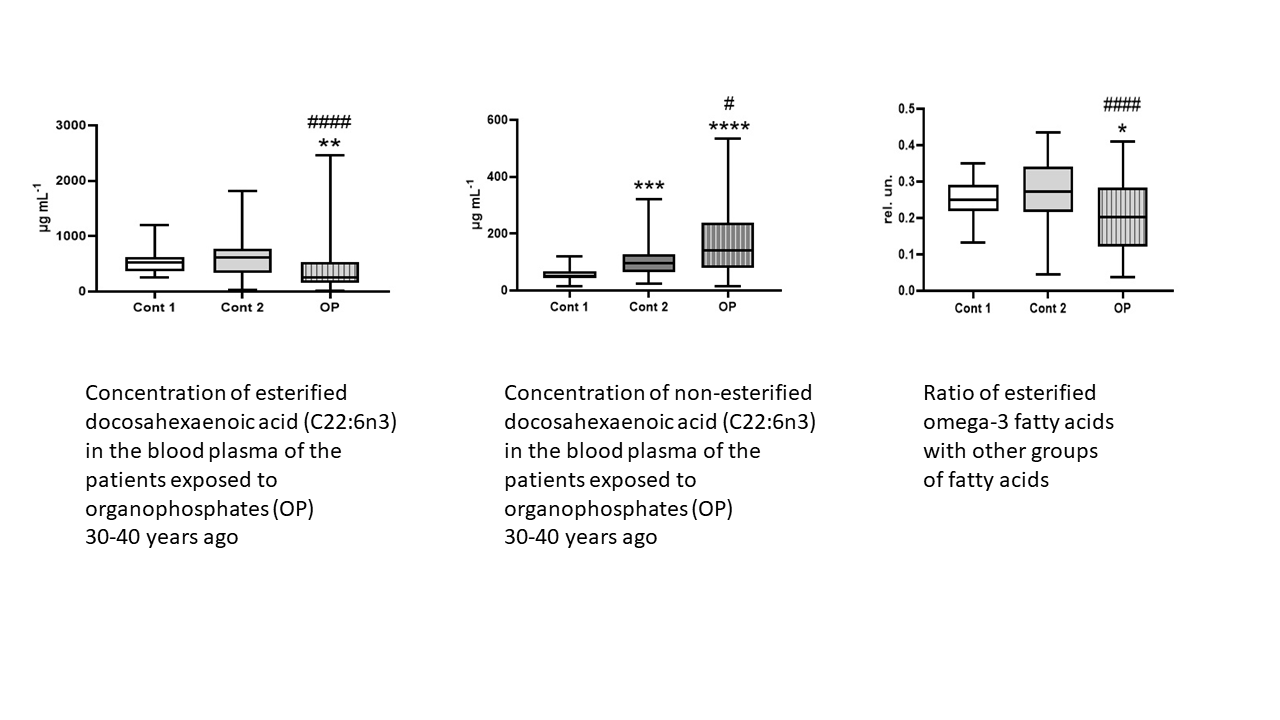
In connection with the detected changes in 2-hydroxybutyrate, 3-hydroxybutyrate and especially acetyl-L-carnitine, the study of the profile of EFA and NEFA in the blood plasma is of particular interest. Table 6S lists the names of the studied EFA and NEFA by the presence, quantity and position of double bonds; Table 7S – by chain length and concentration in the blood plasma; Table 8S presents the concentrations (μg/mL) of EFA in the blood plasma of the subjects; Table 9S – the concentrations of NEFA.
Note the statistically significant changes in the concentration of EFA in the OP group relative to the control. An increase in the concentration of myristic and myristoleic acid esters was revealed by 1.6- and 1.7-fold, respectively (Figure 5a, b), erucic acid – by 11% (Figure 5c). A decrease in concentration was shown for esters of margaric, stearic and eicosadienoic acids by 1.5, 1.3 and 1.25-fold, respectively (Fig. 5d, e, f), eicosatrienoic acid - by 1.5-fold (Fig. 5g), arachidonic acid - by 1.4-fold (Fig. 5h), eicosapentaenoic acid - by 1.9-fold (Fig. 5i), docosahexaenoic acid - by 2.5-fold (Fig. 5j).
Importantly to note statistically significant changes in the concentration of NEFA in the OP group. An increase in the concentration of heptadecenoic acid (+70%), eicosapentaenoic (+56%), eicosatrienoic (+55%), docosahexaenoic (+50%), γ-linolenic (+49%), myristic (+38%), eicosenoic (+37%), arachidonic (+30%), eicosadienoic (+28%), oleic (+27%), linoleic (+25%), palmitic (+24%), linoelaydic (+22%), stearic (+20%), palmitoleic (+20%), pentadecanoic (+10%), margaric (+10%) was revealed (Figure 6).
For a more detailed analysis of the obtained data, we grouped EFA and NEFA as follows: major, submajor, minor, long-chain (C13-C21), ultra-long-chain (C22 and longer), saturated, unsaturated, unsaturated ratio n3/n6, n3/(n6+n9), n3/(all fatty acids) (Table 10S). In the OP group, a decrease in the amount of esterified major fatty acids by 23% was observed with a simultaneous increase in the amount of free major fatty acids by 30% (Figure 7a, b). A similar picture was observed for the amount of submajor fatty acids - a decrease in esterified by 32% and an increase in non-esterified by 44% (Fig. 7c, d). The amount of esterified ultra-long-chain fatty acids in the OP group was reduced by 1.5 times compared to the control, while the amount of free ultra-long-chain fatty acids demonstrated the opposite changes (Fig. 7e, f). Similar changes were observed when calculating the amount of unsaturated fatty acids: esterified fatty acids was reduced by 28%, while the amount of non-esterified fatty acids was increased by an average of 44% (Fig. 7g, h). In addition, in the OP group, the amount of non-esterified minor, long-chain and saturated fatty acids was increased - by 58%, 23% and 17%, respectively (Fig. 7i, j, k).
Changes in the ratios of omega-3 to other unsaturated fatty acids were observed only for the esterified forms. All three calculated indices indicate a significant (p<0.0001) decrease in the concentration of esterified omega-3 fatty acids in the OP group compared to the control. At the same time, the balance of free fatty acids did not change (Figure 8a-f).
Table 6 includes only statistically significant differences between the OP group and the control. It is noteworthy that there was a marked increase in the concentration of esterified myristoleic acid and myristic acid (both esterified and free forms). Chronic myristic acid supplementation has been shown to worsen obesity-associated insulin resistance, and this effect is partly mediated by increased adipose tissue inflammation and increased resistin secretion [39]. At the same time, it should be noted that high myristate levels may be necessary to meet the urgent energy needs of the newborn [40].
The most pronounced relative increase compared to the control was observed for heptadecenoic and eicosapentaenoic acids, by 1.7- and 1.5-fold, respectively. Consistent changes in concentration were observed for the sum of major, submajor, ultra-long-chain and unsaturated fatty acids – the concentration of esterified fatty acids was reduced, while non-esterified fatty acids were increased. At the same time, the sums of free minor (probably due to the concentration of heptadecenoic, γ-linolenic and eicosenoic), long-chain and saturated fatty acids were increased.
At the next stage, we found out how the most reliable indicators correlate with each other (Figure 9) and all statistically significant ones with the most important ones from the first correlation matrix (Figure 10).
If we exclude from consideration the obvious correlation links (the belonging of myristic and heptadecenoic free fatty acids to the total amount of minor free fatty acids, as well as esterified docosahexaenoic to esterified ultra-long chain acids, and to the indices n3/(n6+n9) and n3/all FA), then five correlation dependencies presented in Table 11S remain for further consideration. The esterified docosahexaenoic acid - LDH and LDH - TAS correlations are stronger in the OP group compared to the correlation in the overall sample and lose their strength and statistical significance in the control group. The non-esterified heptadecenoic - TAS pair demonstrates a weak but statistically significant correlation in all three samples, with minimal interaction observed in the control group. The non-esterified myristic - heptadecenoic and esterified docosahexaenoic - TAS pairs demonstrate a weakening of the correlation in the OP group without loss of statistical significance (likely due to the reduced number of samples). We will exclude non-esterified myristic and heptadecenoic fatty acids from further consideration as minor components and examine the correlations between esterified docosahexaenoic fatty acid, LDH activity, and TAS concentration with other statistically significant parameters.
All three parameters examined in the OP group have a moderate correlation with calcium concentration (negative for esterified docosahexaenoic acid and LDH, and positive for TAS). However, in the control group, this correlation is significantly weakened or even absent (with LDH). The LDH-calcium correlation pair is also interesting in that the confidence intervals calculated for the correlation coefficients do not overlap, indicating the reliability of the obtained pattern—a moderate negative correlation in one group and a complete absence in the other. A similar pattern is seen for the LDH-ALP pair: in the OP group, there is a moderate positive correlation between the parameters, while in the control group, it is negligible.
Esterified docosahexaenoic acid in the OP group also demonstrated strong positive correlations with other esterified fatty acids—margaric, eicosadienoic, cis-8,11,14-eicosatrienoic, arachidonic, and eicosapentaenoic. However, these correlations were not significantly weakened in the control group. The next step in data analysis was to search for possible relationships between other statistically significant parameters. The results are presented in Figure 10 as a correlation matrix. We also examined correlations separately in the control group and the OP group (results are presented in Table 13S).
In the overall dataset, as well as in the control and OP groups separately, NEFA correlated with NEFA, and EFA correlated with EFA. Among EFA, a correlation was found between the minor fatty acids myristic and myristoleic, as well as a strong positive correlation between arachidonic acid and docosahexaenic and cis-8,11,14-eicosatrienoic acids. These correlations were comparable in strength across all groups. Among NEFA, 23 correlation pairs with strong relationships were found, with the majority of the components in these pairs belonging to major fatty acids. Based on the change in correlation strength across the datasets, two correlation pairs of free fatty acids are of interest: linoleic-palmitic and eicosenoic-eicosadienoic. The first pair had the highest correlation coefficient (0.95) in the control group, while in the OP group it decreased to 0.84; the confidence intervals for these coefficients did not overlap. For the second pair, we see the maximum correlation coefficient (0.82) in the OP group, while in the control group it decreases to 0.45. The reliability of this pattern is confirmed by non-overlapping confidence intervals.
4. Discussion
In one of our recent studies, we proposed that OP-induced pathology loses its specificity over time and essentially acts as a trigger for aging and age-related diseases [10]. In addition to the effect on cholinesterases, organophosphates and some products of their destruction have an inhibitory effect on carboxylesterases of intestinal enterocytes, hepatocytes and endothelial cells, which significantly affects homeostasis and determines the pathogenesis of cardiovascular and neurodegenerative diseases, accelerating the aging of the body [21,22]. Primary changes cause secondary changes, for example, at the level of epigenetic modifications, changes in the balance of intestinal microbiota, etc., forming a vicious circle. Identifying a toxic trace in the spectrum of age-related diseases is an extremely complex. However, with the advancement of modern technological platforms and methodological research algorithms, this task is far from hopeless. We have made an attempt to get closer to a solution to this problem. This paper presents the results of a diagnostic examination of a unique cohort of patients who were involved in the production of toxic OP during the 1980s. The medical history of the examined individuals in both groups (OP and control) included common age-related diseases: ischemic heart disease, hypertension, gastrointestinal diseases, diabetes mellitus, musculoskeletal system diseases, cerebrovascular disease and signs of metabolic syndrome. Notably, the OP group exhibited a significantly higher prevalence of: hepatitis; polyneuropathy affecting the upper and lower extremities; pathological hand reflexes; and disturbances of vibration and distal sensitivity.
Among the biochemical parameters, the decrease in BChE activity with ATCh as a substrate observed in the OP group seems important, as it may indicate disrupted synthesis and/or post-translational modification of the enzyme in the liver. This phenomenon is observed during chemotherapy and various diseases, neurodegenerative, cardiovascular, infectious, and oncological conditions [41,42,43,44,45,46,47].
An intriguing finding was the increase in albumin esterase activity in the OP group, despite similar albumin concentrations in both groups. We emphasize that we refer to the genuine esterase activity of albumin, primarily involving the Sudlow I binding site [36,37]. The literature indicates that several different factors influence albumin’s ligand-binding capacity in relation to fatty acids, notably these are divalent metal ions such as Cu2+, Zn2+, and Co2+ [48,49,50].
One possible pathway of thrombogenesis mediated by NEFA is their ability to disrupt the interaction of Zn2+ ions with albumin: long-chain NEFA such as palmitate and stearate alter the conformation of albumin and reduce its ability to bind Zn2+, thereby increasing the availability of the ion for binding and activation of coagulation proteins [49]. Another mechanism of thrombogenesis may be related to the positive correlation we found between arachidonic acid levels and albumin esterase activity. Platelets incubated with modified albumin were shown to produce significantly more arachidonic acid metabolites, and aggregate approximately twice as much as platelets incubated with albumin from healthy subjects [51]. This is explained by the fact that diabetic albumin, as a result of glycoxidation, has an increased amount of free arachidonate available for the formation of active metabolites in platelets. In addition, the binding of NEFA to albumin or its glycation can affect the reactivity of thiol groups, thereby affecting its antioxidant activity [52].
The observed changes in 3-hydroxybutyrate and 2-hydroxybutyrate in the blood plasma of occupational patients, along with the absence of deviations in glucose levels, suggest that this group of patients does not have pronounced signs of diabetes, which means that signs of peripheral neuropathy are caused by occupational pathology. A decrease in the acetyl-L-carnitine concentration in the OP group was shown for the first time for delayed occupational pathology, but is a characteristic feature of many other diseases, so acetyl-L-carnitine was even tested as a potential therapeutic agent [53]. Acetyl-L-carnitine treatment has also been shown to normalize short-chain fatty acid levels in the gut microbiota, promote intestinal barrier restoration, and reduce proinflammatory cytokine levels (TNF-α, IL-1β) in the brain parenchyma [54].
Our study of a wide range of fatty acids in patients with OP-related pathology and a control group of elderly people revealed a surprisingly consistent pattern of reciprocal relationships between esterified and non-esterified forms of fatty acids: a decrease in the concentration of the former is associated with an increase in the concentration of the latter. Importantly, none of the measured NEFA showed a statistically significant decrease. This may indicate increased lipase activity [55] and/or decreased uptake and utilization of NEFA, including by endothelial cells, as observed in obesity [56]. An alternative mechanism for lipolysis of triglycerides and especially phospholipids with subsequent uptake of NEFA is an increase in the expression of endothelial (phospho)lipase [57]. Endothelial lipase is synthesized mainly by endothelial cells, functions on the surface of these cells and exhibits phospholipase A1 activity. Proinflammatory cytokines induce a decrease in plasma HDL-cholesterol concentrations by enhancing endothelial lipase activity, whereas exercise and fish oil, a rich source of docosahexaenoic acid and eicosapentaenoic acids, suppress endothelial lipase activity. Synergistic interaction between endothelial lipase polymorphisms and environmental factors appears to influence coronary heart disease occurrence [58].
Our data provide convincing evidence that NEFA are a major cytotoxic factor for vascular endothelium in patients of the OP group. Multiple studies confirm that NEFA exert direct cytotoxic effects on endothelial cells and endothelial progenitors, largely through TLR4- and PPARγ-mediated oxidative stress and inflammation [59-62]. At the same time, some fatty acids have a cytoprotective effect. Thus, eicosapentaenoic acid protects against palmitate-induced endothelial dysfunction through activation of the AMPK/eNOS pathway [63]. An oxidized derivative of docosahexaenoic acid has a cytoprotective effect when exposed to polychlorinated biphenyls on endothelial cells [64]. The probable mechanism of the cytoprotective effect is the activation of NAD(P)H:quinone oxidoreductase, similar to the action of sulforaphane, an Nrf-2 activator, which is abundant in species of the cabbage family [65]. In addition, short-chain fatty acids, which are formed in particular as a result of microbiota metabolism in the gastrointestinal tract, have not only cytotoxic but also cytoprotective effects through the activation of NEFA receptors type 2 and 3, G protein-coupled receptor 109A, and the inhibition of histone deacetylases [66].
An increased level of polyunsaturated fatty acids along with an increased omega-3 / omega-6 ratio is a criterion for the effectiveness of dietary supplements and health improvement [67]. Most commercially available docosahexaenoic acid esters are in the form of phospholipids or triglycerides, but glycerophospholipids play a crucial role in transporting docosahexaenoic acid to the brain [68]. The esterified form of docosahexaenoic acid as lysophosphatidylcholine (lysoPC-DHA) is better absorbed by the brain compared to the triacylglycerol form of docosahexaenoic acid. Free docosahexaenoic acid is transported across the outer membrane of the blood-brain barrier using APOE4 receptors, while lysoPC-DHA enters the brain by binding to fatty acid binding protein 5, which is present in cerebral vascular endothelial cells, and is also transported across the blood-brain barrier using a specific protein, the major facilitator superfamily domain-containing protein symporter 2A (Mfsd2a), which recognizes various lysophospholipids that have choline in their polar head [69,70,71].
In the OP group, we have found out significant correlations of the esterified docosahexaenoic acid, which were weakened or even absent in the control group: positive with LDH activity (0.67, p <0.0001) and negative with calcium concentration (-0.66, p <0.0001). Importantly, OP group-specific correlations were also found for LDH - TAS (-0.61, p <0.0001), LDH - calcium (-0.67, p <0.0001), and TAS - calcium (0.63, p <0.0001). These data further support the idea that the bioavailability, and hence the potential beneficial effects of esterified docosahexaenoic acid, is significantly dependent on the type of ester in which it is bound [68]. Esterified docosahexaenoic acid in the OP group also demonstrated strong positive correlations with other esterified fatty acids—margaric (0.70, p <0.0001), eicosadienoic (0.70, p <0.0001), cis-8,11,14-eicosatrienoic (0.77, p <0.0001), arachidonic (0.83, p <0.0001), and eicosapentaenoic (0.78, p <0.0001). However, these correlations were not significantly weakened in the control group.
Organophosphates are the most widely used insecticides worldwide due to their microbial biodegradability, though not only in soil but also in the human gut, causing intestinal dysfunction and inflammation, increasing the risk of hyperglycemia and diabetes [3, 4, 72–74]. In addition to pesticides and herbicides, organophosphate flame retardants, plasticizers, and lubricants (resorcinol bis(diphenyl)-phosphate, tris(2-chloroethyl) phosphate, triaryl phosphates) are frequently found in biological and global environmental matrices [5, 6, 75, 76], altering the fatty acid spectrum and even the balance of brain neurotransmitters [6].
The mechanisms that explain long term illness associated with organophosphorus exposure are still under investigation. Both organophosphorus nerve agents and organophosphorus pesticides make covalent adducts by different amino acid residues from a variety of proteins, although choline- and carboxylesterases are their priority targets [77]. Carboxylesterase-1 is expressed not only in the liver, but also in vascular endothelial cells; a decrease in its expression and/or activity causes damage of endothelial cells and endothelium-dependent pathology [78]. Diet strongly modulates these effects: high-fat Western diet enhances organophosphate bioavailability and toxicity, while the Mediterranean diet mitigates them [79]. Some steroid glycosides also modulate the negative effects of organophosphate, reducing macrophage infiltration and proinflammatory cytokine levels, but increasing short-chain fatty acids levels [80]. Given the impact of organophosphate on the microbiota and somatic cells of the body, the spectrum of fatty acids and other diagnostic markers deserves close attention and further research, as does the search for means to neutralize the negative effects of organophosphates.
5. Limitations
The nature of retrospective studies imposes many limitations. The uniqueness of the sample of patients is closely related to the limitations of the experimental design. Its single-center design may limit external validity, as the sample may not capture the heterogeneity of patients with delayed pathologies after exposure to organophosphates. Moreover, thirty to forty years ago, biochemical and instrumental analysis capabilities were insufficient for objective monitoring of patients' condition, the frequency, and extent of organophosphate-related damage. Another significant limitation in our case was the lack of records of previously deceased individuals with occupational diseases, due to the limited time they were stored in the registry. Therefore, we were unable to conduct a Kaplan-Meier or Log-rank analysis to estimate survival, which would have strengthened the article. In addition, the absence of a healthy control group completely matched on age and socio-economic status prevents full isolation of syndrome-specific effects. Many retrospective cohort studies can't prove causality, only suggest associations, and our study is no exception to this rule. Probably the main internal contradiction of our retrospective cohort study is that changes in the quality of data or exposure status over time can occur, but it is the nature of these changes that is the main goal of our research. A cohort study could establish a temporal relationship, which helps in inferring causality, but the overlapping cause-and-effect relationships that lead to age-related diseases also negates the potential. Confounding variables can affect the results, but in theory statistical methods can be used to adjust for them. However, in our case, it is not so simple or even impossible to select the most relevant statistical analysis method from the generally accepted ones. Therefore, one of the main goals of further research is to develop fundamentally new analytical methods using machine learning.
6. Conclusions
The anamnesis of the examined patients with OP most often includes neurological diseases, hepatitis and other gastrointestinal diseases, though no differences were found between the groups when assessing cognitive function using the MMSE, SAGE, and “Clock” tests. Of the 34 basic biochemical parameters determined on the biochemical analyzer, statistically significant changes were found for only 11, with their median values not going beyond the reference range. Analysis of some metabolic biomarkers with HPLC-MS/MS revealed in the OP group a significant decrease in the concentrations of 3-hydroxybutyrate and 2-hydroxybutyrate, which allows us to exclude the diabetic nature of polyneuropathy and indicates a predominantly OP-induced genesis of this pathology. In the OP group, a significant decrease in acetyl-L-carnitine concentration was found, which can become one of the important markers of OP-induced pathology. An additional study of the esterase profile of patients revealed a decrease in the activity of BChE, which may indicate a violation of the protein-synthesizing function of the liver, and increase in the esterase activity of albumin in the OP group. Correlation analysis revealed the most significant relationships between albumin esterase activity and arachidonic acid concentration in the OP group. A study of a wide range of fatty acids in patients with OP revealed reciprocal relationships between EFA and NEFA. Decrease in the ratios of omega-3 to other unsaturated fatty acids were observed only for the esterified forms: by 29% for n3/n6, by 33% for n3/(n6+n9), and by 26% for n3/(all fatty acids).
Significant correlations of the esterified docosahexaenoic acid were found out in the patients of OP group, which were weakened or even absent in the control group: positive with LDH activity and negative with calcium concentration. Importantly, OP group-specific correlations were also found for LDH - TAS, LDH - calcium, and TAS - calcium. These data further support the idea that the bioavailability, and hence the potential beneficial effects of esterified docosahexaenoic acid, is significantly dependent on the type of ester in which it is bound. Esterified docosahexaenoic acid in the OP group also demonstrated strong positive correlations with other esterified fatty acids—margaric, eicosadienoic, cis-8,11,14-eicosatrienoic, arachidonic, and eicosapentaenoic. However, these correlations were not significantly weakened in the control group.
The data obtained allow us to consider an increased level of NEFA as one of the main cytotoxic factors for the vascular endothelium, which can determine the specificity of age-related diseases. Modification of albumin properties by arachidonic acid and decreased bioavailability of docosahexaenoic acid could be molecular links that cause specific manifestations of OP-induced pathology at late stages after exposure. Decreased activity of BChE and acetyl-L-carnitine concentration are additional markers of liver damage specific for delayed effects of OP-induced pathology. Epigenetic changes, the contribution of dietary patterns and intestinal microbiota to the spectrum of EFA and NEFA require additional research.
Supplementary Materials
The following supporting information can be downloaded at: Preprints.org
Author Contributions
Conceptualization, N.V.G. and E.I.S.; methodology, N.V.G., E.I.S., T.A.K.; software, N.G.V., D.A.B. and E.A.K.; validation, N.V.G., E.I.S., T.A.K.; formal analysis, N.G.V., E.I.S., E.A.K. and D.A.B.; investigation, T.A.K., L.K.G., I.A.V., M.V.B.; data curation, N.G.V. and E.I.S.; writing—original draft preparation, N.V.G. and E.I.S.; writing—review and editing, N.V.G., E.I.S., D.A.B. and R.O.J.; supervision, N.V.G. and E.I.S.; project administration, N.V.G. All authors have read and agreed to the published version of the manuscript.
Funding
This research was supported by the Russian Science Foundation, grant number 22-15-00155-П
Institutional Review Board Statement
The study was conducted in accordance with the Declaration of Helsinki and approved by the Ethics Committee of the Research Institute of Hygiene, Occupational Pathology and Human Ecology of the Federal Medical Biological Agency (Approval No. 3, registration date 2 June 2022).
Informed Consent Statement
Written informed consent was obtained from all the participants included in this study, including the publication of any/all clinical data, and other data included in the manuscript.
Data Availability Statement
The datasets generated and/or analyzed during the current study are not publicly available. However, they are available from the corresponding author upon reasonable request.
Conflicts of Interest
The authors declare no conflicts of interest.
Abbreviations
| ALP | alkaline phosphatase |
| ALT | alanine aminotransferase |
| AST | aspartate aminotransferase |
| ATCh | acetylthiocholine |
| BChE | butyrylcholinesterase |
| BMI | body mass index |
| BTCh | butyrylthiocholine |
| EFA | esterified fatty acids |
| GGT | gamma-glutamyltransferase |
| HDL | high density lipoproteins |
| LDH | lactate dehydrogenase |
| MDA | malondialdehyde |
| MMSE | mini mental state examination |
| NEFA | non-esterified fatty acids |
| OP | occupational pathology |
| PON1 | paraoxonase-1 |
| PUFA | polyunsaturated fatty acids |
| RMSD | root-mean-square deviation |
| ROS | reactive oxygen species |
| SAGE | self-administered gerocognitive exam |
| SCFA | short-chain fatty acids |
| SCSFA | short-chain saturated fatty acid |
| SFA | saturated fatty acids |
| TAS | total antioxidant status |
| VLDL | very low density lipoproteins |
References
- Perez-Fernandez, C.; Flores, P.; Sánchez-Santed, F. A Systematic Review on the Influences of Neurotoxicological Xenobiotic Compounds on Inhibitory Control. Front. Behav. Neurosci. 2019, 13, 139. [Google Scholar] [CrossRef] [PubMed]
- Jokanović, M.; Oleksak, P.; Kuca, K. Multiple neurological effects associated with exposure to organophosphorus pesticides in man. Toxicology 2023, 484, 153407. [Google Scholar] [CrossRef] [PubMed]
- Lehman, P.C.; Cady, N.; Ghimire, S.; Shahi, S.K.; Shrode, R.L.; Lehmler, H.J.; Mangalam, A.K. Low-dose glyphosate exposure alters gut microbiota composition and modulates gut homeostasis. Environ. Toxicol. Pharmacol. 2023, 100, 104149. [Google Scholar] [CrossRef] [PubMed]
- Ali, A.; AlHussaini, K.I. Pesticides: Unintended Impact on the Hidden World of Gut Microbiota. Metabolites 2024, 14(3), 155. [Google Scholar] [CrossRef]
- Furlong, C.E.; Richter, R.; Marsillach, J.; Zelter, A.; McDonald, M.; Rettie, A.; Lockridge, O.; Lundeen, R.; Whittington, D. Investigating biomarkers of exposure to jet aircraft oil fumes using mass spectrometry. medRxiv [Preprint] 2025, 2025.04.17.25326021. [Google Scholar] [CrossRef]
- Cao, J.; Wang, X.; Lei, Y.; Jiang, X.; Kannan, K.; Li, M. Health Risks of Low-Dose Dietary Exposure to Triphenyl Phosphate and Diphenyl Phosphate in Mice: Insights from the Gut-Liver Axis. Environ. Sci. Technol. 2025, 59(18), 8960–8971. [Google Scholar] [CrossRef]
- Jokanović, M. Neurotoxic effects of organophosphorus pesticides and possible association with neurodegenerative diseases in man: A review. Toxicology 2018, 410, 125–131. [Google Scholar] [CrossRef]
- Reddy, D.S.; Wu, X.; Singh, T.; Neff, M. Experimental Models of Gulf War Illness, a Chronic Neuropsychiatric Disorder in Veterans. Curr. Protoc. 2023, 3(3), e707. [Google Scholar] [CrossRef]
- Neylon, J.; Fuller, J.N.; van der Poel, C.; Church, J.E.; Dworkin, S. Organophosphate Insecticide Toxicity in Neural Development, Cognition, Behaviour and Degeneration: Insights from Zebrafish. J. Dev. Biol. 2022, 10(4), 49. [Google Scholar] [CrossRef]
- Goncharov, N.V.; Belinskaia, D.A.; Avdonin, P.V. Organophospate-Induced Pathology: Mechanisms of Development, Principles of Therapy and Features of Experimental Studies. J. Evol. Biochem. Physiol. 2023, 59(5), 1756–1796. [Google Scholar] [CrossRef]
- Karimani, A.; Ramezani, N.; Afkhami Goli, A.; Nazem Shirazi, M.H.; Nourani, H.; Jafari, A.M. Subchronic neurotoxicity of diazinon in albino mice: Impact of oxidative stress, AChE activity, and gene expression disturbances in the cerebral cortex and hippocampus on mood, spatial learning, and memory function. Toxicol. Rep. 2021, 8, 1280–1288. [Google Scholar] [CrossRef] [PubMed]
- Zhang, H.Y.; Wang, C.; Li, H.S. Effect of organophosphate pesticides poisoning on cognitive impairment. Zhonghua Lao Dong Wei Sheng Zhi Ye Bing Za Zhi (in Chinese). 2021, 39(4), 313–316. [Google Scholar] [CrossRef] [PubMed]
- Roe, K. An Alternative Explanation for Alzheimer's Disease and Parkinson's Disease Initiation from Specific Antibiotics, Gut Microbiota Dysbiosis and Neurotoxins. Neurochem. Res. 2022, 47(3), 517–530. [Google Scholar] [CrossRef] [PubMed]
- Tattersall, J. Seizure activity post organophosphate exposure. Front. Biosci. (Landmark Ed) 2009, 14(10), 3688–36711. [Google Scholar] [CrossRef]
- Abdollahi, M.; Karami-Mohajeri, S. A comprehensive review on experimental and clinical findings in intermediate syndrome caused by organophosphate poisoning. Toxicol. Appl. Pharmacol. 2012, 258(3), 309–314. [Google Scholar] [CrossRef]
- Myers, G.J.; Wegner, J. Endothelial Glycocalyx and Cardiopulmonary Bypass. J. Extra Corpor. Technol. 2017, 49(3), 174–181. [Google Scholar] [CrossRef]
- Kori, R.K.; Singh, M.K.; Jain, A.K.; Yadav, R.S. Neurochemical and Behavioral Dysfunctions in Pesticide Exposed Farm Workers: A Clinical Outcome. Indian J. Clin. Biochem. 2018, 33(4), 372–381. [Google Scholar] [CrossRef]
- Ribeiro, A.C.R.; Deshpande, L.S. A review of pre-clinical models for Gulf War Illness. Pharmacol. Ther. 2021, 228, 107936. [Google Scholar] [CrossRef]
- Goncharov, N.V.; Popova, P.I.; Kudryavtsev, I.V.; Golovkin, A.S.; Savitskaya, I.V.; Avdonin, P.P.; Korf, E.A.; Voitenko, N.G.; Belinskaia, D.A.; Serebryakova, M.K.; Matveeva, N.V.; Gerlakh, N.O.; Anikievich, N.E.; Gubatenko, M.A.; Dobrylko, I.A.; Trulioff, A.S.; Aquino, A.D.; Jenkins, R.O.; Avdonin, P.V. Immunological Profile and Markers of Endothelial Dysfunction in Elderly Patients with Cognitive Impairments. Int. J. Mol. Sci. 2024, 25(3), 1888. [Google Scholar] [CrossRef]
- Sweeney, M.D.; Kisler, K.; Montagne, A.; Toga, A.W.; Zlokovic, B.V. The role of brain vasculature in neurodegenerative disorders. Nat. Neurosci. 2018, 21(10), 1318–1331. [Google Scholar] [CrossRef]
- Goncharov, N.V.; Popova, P.I.; Nadeev, А.D.; Belinskaia, D.A.; Korf, E.A.; Avdonin, P.V. Endothelium, Aging, and Vascular Diseases. J. Evol. Biochem. Physiol. 2024, 60(6), 2191–2214. [Google Scholar] [CrossRef]
- Goncharov, N.V.; Nadeev, A.D.; Jenkins, R.O.; Avdonin, P.V. Markers and Biomarkers of Endothelium: When Something Is Rotten in the State. Oxid. Med. Cell. Longev. 2017, 2017, 9759735. [Google Scholar] [CrossRef] [PubMed]
- Sun, J.; Wang, Y.; Zhang, X.; Zhu, S.; He, H. Prevalence of peripheral neuropathy in patients with diabetes: A systematic review and meta-analysis. Prim. Care Diabetes 2020, 14, 435–444. [Google Scholar] [CrossRef] [PubMed]
- Rumora, A.E.; Kim, B.; Feldman, E.L. A Role for Fatty Acids in Peripheral Neuropathy Associated with Type 2 Diabetes and Prediabetes. Antioxid. Redox Signal. 2022, 37(7-9), 560–577. [Google Scholar] [CrossRef]
- Harris, W.S.; Westra, J.; Tintle, N.L.; Sala-Vila, A.; Wu, J.H.; Marklund, M. Plasma n6 polyunsaturated fatty acid levels and risk for total and cause-specific mortality: A prospective observational study from the UK Biobank. Am. J. Clin. Nutr. 2024, 120, 936–942. [Google Scholar] [CrossRef]
- Sala-Vila, A.; Tintle, N.; Westra, J.; Harris, W.S. Plasma Omega-3 Fatty Acids and Risk for Incident Dementia in the UK Biobank Study: A Closer Look. Nutrients 2023, 15, 4896. [Google Scholar] [CrossRef]
- Retrato, M.D.C.; Nguyen, A.V.; Ubhayasekera, S.J.K.A.; Bergquist, J. Comprehensive quantification of C4 to C26 free fatty acids using a supercritical fluid chromatography-mass spectrometry method in pharmaceutical-grade egg yolk powders intended for total parenteral nutrition use. Anal. Bioanal. Chem. 2025, 417, 1461–1478. [Google Scholar] [CrossRef]
- Santos, H.O.; Nehme, R.; Limirio, L.S.; Mendonça, M.E.F.; de Branco, F.M.S.; de Oliveira, E.P. Plasma saturated fatty acids are inversely associated with lean mass and strength in adults: NHANES 2011-2012. Prostaglandins Leukot. Essent. Fatty Acids 2025, 204, 102667. [Google Scholar] [CrossRef]
- Buchanan, C.D.C.; Lust, C.A.C.; Burns, J.L.; Hillyer, L.M.; Martin, S.A.; Wittert, G.A.; Ma, D.W.L. Analysis of major fatty acids from matched plasma and serum samples reveals highly comparable absolute and relative levels. Prostaglandins Leukot. Essent. Fatty Acids. 2021, 168, 102268. [Google Scholar] [CrossRef]
- Barnes, P.W.; Mcfadden, S.L.; Machin, S.J.; Simson, E.; International Consensus Group for Hematology. The international consensus group for hematology review: Suggested criteria for action following automated CBC and WBC differential analysis. Lab. Hematol. 2005, 11, 83–90. [Google Scholar] [CrossRef]
- Orlova, T.I.; Ukolov, A.I.; Savel’eva, E.I.; Radilov, A.S. GС-MS quantification of free and esterified fatty acids in blood plasma. Analitika i kontrol’ [Analytics and Control] (in Russian). 2015, 19(2), 183–188. [Google Scholar] [CrossRef]
- Merinov, A.V.; Zhurba, O.M.; Alekseenko, A.N.; Kudaeva, I.V. Levels of fatty acids in blood plasma in workers with vibration disease. Hygiene and Sanitation [Gigiena i Sanitariya] (In Russ.). 2023, 102(9), 928–933. [Google Scholar] [CrossRef]
- Ukolov, A.I.; Orlova, T.I.; Savel’eva, E.I.; Radilov, A.S. Chromatographic–mass spectrometric determination of free fatty acids in blood plasma and urine using extractive alkylation. J. Anal. Chem. 2015, 70, 1123–1130. [Google Scholar] [CrossRef]
- Prokofieva, D.S.; Voitenko, N.G.; Gustyleva, L.K.; Babakov, V.N.; Savelieva, E.I.; Jenkins, R.O.; Goncharov, N.V. Microplate spectroscopic methods for determination of the organophosphate soman. J. Environ. Monit. 2010, 12(6), 1349–1354. [Google Scholar] [CrossRef]
- Prokofieva, D.S.; Jenkins, R.O.; Goncharov, N.V. Microplate biochemical determination of Russian VX: Influence of admixtures and avoidance of false negative results. Anal. Biochem. 2012, 424(2), 108–113. [Google Scholar] [CrossRef]
- Belinskaia, D.A.; Voronina, P.A.; Popova, P.I.; Voitenko, N.G.; Shmurak, V.I.; Vovk, M.A.; Baranova, T.I.; Batalova, A.A.; Korf, E.A.; Avdonin, P.V.; Jenkins, R.O.; Goncharov, N.V. Albumin Is a Component of the Esterase Status of Human Blood Plasma. Int. J. Mol. Sci. 2023, 24, 10383. [Google Scholar] [CrossRef]
- Belinskaia, D.A.; Voronina, P.A.; Shmurak, V.I.; Batalova, A.A.; Goncharov, N.V.; Vovk, M.A.; Jenkins, R.O. Esterase activity of serum albumin studied by 1HNMR spectroscopy and molecular modelling. Int. J. Mol. Sci. 2021, 22, 10593. [Google Scholar] [CrossRef]
- Gall, W.E.; Beebe, K.; Lawton, K.A.; Adam, K.P.; Mitchell, M.W.; Nakhle, P.J.; Ryals, J.A.; Milburn, M.V.; Nannipieri, M.; Camastra, S.; Natali, A.; Ferrannini, E.; RISC Study Group. alpha-hydroxybutyrate is an early biomarker of insulin resistance and glucose intolerance in a nondiabetic population. PLoS One 2010, 5(5), e10883. [Google Scholar] [CrossRef]
- Saraswathi, V.; Kumar, N.; Ai, W.; Gopal, T.; Bhatt, S.; Harris, E.N.; Talmon, G.A.; Desouza, C.V. Myristic Acid Supplementation Aggravates High Fat Diet-Induced Adipose Inflammation and Systemic Insulin Resistance in Mice. Biomolecules 2022, 12(6), 739. [Google Scholar] [CrossRef]
- Hegyi, T.; Weinberger, B.; Memon, N.; Carayannopoulos, M.; Huber, A.H.; Kleinfeld, A.M. Plasma unbound free fatty acid profiles in premature infants before and after intralipid infusion. J. Matern. Fetal. Neonatal Med. 2020, 33(14), 2320–2325. [Google Scholar] [CrossRef] [PubMed]
- Bi, Y.; Zhang, J.; Zeng, D.; Chen, L.; Ye, W.; Yang, Q.; Ling, Y. Cholinesterase is Associated With Prognosis and Response to Chemotherapy in Advanced Gastric Cancer. Pathol. Oncol. Res. 2021, 27, 580800. [Google Scholar] [CrossRef]
- Sridhar, G.R.; Gumpeny, L. Emerging significance of butyrylcholinesterase. World J. Exp. Med. 2024, 14(1), 87202. [Google Scholar] [CrossRef] [PubMed]
- Takaki, S.; Fukuhara, T.; Mori, N.; Tsuji, K. High cholinesterase predicts tolerance to sorafenib treatment and improved prognosis in patients with transarterial chemoembolization refractory intermediate stage hepatocellular carcinoma. Mol. Clin. Oncol. 2020, 12(1), 60–68. [Google Scholar] [CrossRef] [PubMed]
- Klocker, E.V.; Barth, D.A.; Riedl, J.M.; Prinz, F.; Szkandera, J.; Schlick, K.; Kornprat, P.; Lackner, K.; Lindenmann, J.; Stöger, H.; Stotz, M.; Gerger, A.; Pichler, M. Decreased Activity of Circulating Butyrylcholinesterase in Blood Is an Independent Prognostic Marker in Pancreatic Cancer Patients. Cancers (Basel) 2020, 12(5), 1154. [Google Scholar] [CrossRef] [PubMed]
- Szmicseková, K.; Bies Piváčková, L.; Kiliánová, Z.; Slobodová, Ľ.; Křenek, P.; Hrabovská, A. Aortic butyrylcholinesterase is reduced in spontaneously hypertensive rats. Physiol. Res. 2021, 70(5), 809–813. [Google Scholar] [CrossRef]
- Goncharov, N.V.; Avdonin, P.P.; Voitenko, N.G.; Voronina, P.A.; Popova, P.I.; Novozhilov, A.V.; Blinova, M.S.; Popkova, V.S.; Belinskaia, D.A.; Avdonin, P.V. Searching for New Biomarkers to Assess COVID-19 Patients: A Pilot Study. Metabolites 2023, 13(12), 1194. [Google Scholar] [CrossRef]
- Tadokoro, T.; Kobayashi, T.; Honmyo, N.; Kuroda, S.; Ohira, M.; Hashimoto, M.; Oishi, K.; Oshita, A.; Abe, T.; Onoe, T.; Kohashi, T.; Ohdan, H. Albumin-Butyrylcholinesterase as a Novel Prognostic Biomarker for Hepatocellular Carcinoma Post-hepatectomy: A Retrospective Cohort Study with the Hiroshima Surgical Study Group of Clinical Oncology. Ann. Surg. Oncol. 2025, 32(3), 1973–1984. [Google Scholar] [CrossRef]
- Nemashkalova, E.L.; Permyakov, E.A.; Uversky, V.N.; Permyakov, S.E.; Litus, E.A. Effect of Cu2+ and Zn2+ ions on human serum albumin interaction with plasma unsaturated fatty acids. Int. J. Biol. Macromol. 2019, 131, 505–509. [Google Scholar] [CrossRef]
- Hierons, S.J.; Marsh, J.S.; Wu, D.; Blindauer, C.A.; Stewart, A.J. The Interplay between Non-Esterified Fatty Acids and Plasma Zinc and Its Influence on Thrombotic Risk in Obesity and Type 2 Diabetes. Int. J. Mol. Sci. 2021, 22(18), 10140. [Google Scholar] [CrossRef]
- Coverdale, J.P.C.; Katundu, K.G.H.; Sobczak, A.I.S.; Arya, S.; Blindauer, C.A.; Stewart, A.J. Ischemia-modified albumin: Crosstalk between fatty acid and cobalt binding. Prostaglandins Leukot. Essent. Fatty Acids 2018, 135, 147–157. [Google Scholar] [CrossRef]
- Blache, D.; Bourdon, E.; Salloignon, P.; Lucchi, G.; Ducoroy, P.; Petit, J.M.; Verges, B.; Lagrost, L. Glycated albumin with loss of fatty acid binding capacity contributes to enhanced arachidonate oxygenation and platelet hyperactivity: relevance in patients with type 2 diabetes. Diabetes 2015, 64(3), 960–972. [Google Scholar] [CrossRef] [PubMed]
- Uzelac, T.; Smiljanić, K.; Takić, M.; Šarac, I.; Oggiano, G.; Nikolić, M.; Jovanović, V. The Thiol Group Reactivity and the Antioxidant Property of Human Serum Albumin Are Controlled by the Joint Action of Fatty Acids and Glucose Binding. Int. J. Mol. Sci. 2024, 25(4), 2335. [Google Scholar] [CrossRef] [PubMed]
- Sun, R.; Zhang, J.; Wei, H.; Meng, X.; Ding, Q.; Sun, F.; Cao, M.; Yin, L.; Pu, Y. Acetyl-l-carnitine partially prevents benzene-induced hematotoxicity and oxidative stress in C3H/He mice. Environ. Toxicol. Pharmacol. 2017, 51, 108–113. [Google Scholar] [CrossRef] [PubMed]
- Zahedi, E.; Sadr, S.S.; Sanaeierad, A.; Roghani, M. Chronic acetyl-L-carnitine treatment alleviates behavioral deficits and neuroinflammation through enhancing microbiota derived-SCFA in valproate model of autism. Biomed. Pharmacother. 2023, 163, 114848. [Google Scholar] [CrossRef]
- Takahashi, M.; Hiyama, Y.; Yokoyama, M.; Yu, S.; Hu, Y.; Melford, K.; Bensadoun, A.; Goldberg, I.J. In vivo arterial lipoprotein lipase expression augments inflammatory responses and impairs vascular dilatation. Arterioscler. Thromb. Vasc. Biol. 2008, 28(3), 455–462. [Google Scholar] [CrossRef]
- Pirri, D.; Tian, S.; Tardajos-Ayllon, B.; Irving, S.E.; Donati, F.; Allen, S.P.; Mammoto, T.; Vilahur, G.; Kabir, L.; Bennett, J.; Rasool, Y.; Pericleous, C.; Mazzei, G.; McAllan, L.; Scott, W.R.; Koestler, T.; Zingg, U.; Birdsey, G.M.; Miller, C.L.; Schenkel, T.; Chambers, E.V.; Dunning, M.J.; Serbanovic-Canic, J.; Botrè, F.; Mammoto, A.; Xu, S.; Osto, E.; Han, W.; Fragiadaki, M.; Evans, P.C. EPAS1 Attenuates Atherosclerosis Initiation at Disturbed Flow Sites Through Endothelial Fatty Acid Uptake. Circ. Res. 2024, 135(8), 822–837. [Google Scholar] [CrossRef]
- Khetarpal, S.A.; Vitali, C.; Levin, M.G.; Klarin, D.; Park, J.; Pampana, A.; Millar, J.S.; Kuwano, T.; Sugasini, D.; Subbaiah, P.V.; Billheimer, J.T.; Natarajan, P.; Rader, D.J. Endothelial lipase mediates efficient lipolysis of triglyceride-rich lipoproteins. PLoS Genet. 2021, 17(9), e1009802. [Google Scholar] [CrossRef]
- He, C.; Song, X.; He, T.; Tian, Q.; Zhang, Y.; Airikenjiang, H.; Abulaiti, D.; Qiu, H.; Zhu, M.; Yang, J.; Zhang, J.; Gao, Y. Effect of Interactions Between Endothelial Lipase Gene Polymorphisms and Traditional Cardiovascular Risk Factors on Coronary Heart Disease Susceptibility. Rev. Cardiovasc. Med. 2025, 26(7), 37356. [Google Scholar] [CrossRef]
- Trombetta, A.; Togliatto, G.; Rosso, A.; Dentelli, P.; Olgasi, C.; Cotogni, P.; Brizzi, M.F. Increase of palmitic acid concentration impairs endothelial progenitor cell and bone marrow-derived progenitor cell bioavailability: role of the STAT5/Part transcriptional complex. Diabetes 2013, 62(4), 1245–1257. [Google Scholar] [CrossRef]
- Chen, L.; Yu, C.X.; Song, B.; Cai, W.; Liu, C.; Guan, Q.B. Free fatty acids mediates human umbilical vein endothelial cells inflammation through toll-like receptor-4. Eur. Rev. Med. Pharmacol. Sci. 2018, 22(8), 2421–2431. [Google Scholar] [CrossRef]
- Sun, L.; Liu, Y.L.; Ye, F.; Xie, J.W.; Zeng, J.W.; Qin, L.; Xue, J.; Wang, Y.T.; Guo, K.M.; Ma, M.M.; Tang, Y.B.; Li, X.Y.; Gao, M. Free fatty acid-induced H2O2 activates TRPM2 to aggravate endothelial insulin resistance via Ca2+-dependent PERK/ATF4/TRB3 cascade in obese mice. Free Radic. Biol. Med. 2019, 143, 288–299. [Google Scholar] [CrossRef] [PubMed]
- Vergani, L.; Baldini, F.; Khalil, M.; Voci, A.; Putignano, P.; Miraglia, N. New Perspectives of S-Adenosylmethionine (SAMe) Applications to Attenuate Fatty Acid-Induced Steatosis and Oxidative Stress in Hepatic and Endothelial Cells. Molecules 2020, 25(18), 4237. [Google Scholar] [CrossRef] [PubMed]
- Lee, C.H.; Lee, S.D.; Ou, H.C.; Lai, S.C.; Cheng, Y.J. Eicosapentaenoic acid protects against palmitic acid-induced endothelial dysfunction via activation of the AMPK/eNOS pathway. Int. J. Mol. Sci. 2014, 15(6), 10334–10349. [Google Scholar] [CrossRef] [PubMed]
- Majkova, Z.; Layne, J.; Sunkara, M.; Morris, A.J.; Toborek, M.; Hennig, B. Omega-3 fatty acid oxidation products prevent vascular endothelial cell activation by coplanar polychlorinated biphenyls. Toxicol. Appl. Pharmacol. 2011, 251(1), 41–49. [Google Scholar] [CrossRef] [PubMed]
- Wang, G.; Wang, L.; Zhang, X.; Wei, Z.; Wang, K.; Wang, J. Neuroprotective effect of sulforaphane on hyperglycemia-induced cognitive dysfunction through the Nrf2/HO-1 pathway. Int. J. Clin. Exp. Pathol. 2024, 17(12), 469–476. [Google Scholar] [CrossRef]
- Li, M.; van Esch, B.C.A.M.; Wagenaar, G.T.M.; Garssen, J.; Folkerts, G.; Henricks, P.A.J. Pro- and anti-inflammatory effects of short chain fatty acids on immune and endothelial cells. Eur. J. Pharmacol. 2018, 831, 52–59. [Google Scholar] [CrossRef]
- Donnarumma, D.; Di Salle, A.; Micalizzi, G.; Vento, F.; La Tella, R.; Iannotta, P.; Trovato, E.; Melone, M.A.B.; Rigano, F.; Donato, P.; Mondello, L; Peluso, G. Human blood lipid profiles after dietary supplementation of different omega 3 ethyl esters formulations J. Chromatogr. B Analyt. Technol. Biomed. Life Sci. 2023, 1231, 123922. [Google Scholar] [CrossRef]
- Hachem, M.; Nacir, H. Emerging Role of Phospholipids and Lysophospholipids for Improving Brain Docosahexaenoic Acid as Potential Preventive and Therapeutic Strategies for Neurological Diseases. Int. J. Mol. Sci. 2022, 23(7), 3969. [Google Scholar] [CrossRef]
- Yamagata, K. Docosahexaenoic acid inhibits ischemic stroke to reduce vascular dementia and Alzheimer's disease. Prostaglandins Other Lipid Mediat. 2023, 167, 106733. [Google Scholar] [CrossRef]
- Balakrishnan, J.; Kannan, S.; Govindasamy, A. Structured form of DHA prevents neurodegenerative disorders: A better insight into the pathophysiology and the mechanism of DHA transport to the brain. Nutr. Res. 2021, 85, 119–134. [Google Scholar] [CrossRef]
- Lo Van, A.; Bernoud-Hubac, N.; Lagarde, M. Esterification of Docosahexaenoic Acid Enhances Its Transport to the Brain and Its Potential Therapeutic Use in Brain Diseases. Nutrients 2022, 14(21), 4550. [Google Scholar] [CrossRef]
- Velmurugan, G.; Ramprasath, T.; Swaminathan, K.; Mithieux, G.; Rajendhran, J.; Dhivakar, M.; Parthasarathy, A.; Babu, D.D.; Thumburaj, L.J.; Freddy, A.J.; Dinakaran, V.; Puhari, S.S.; Rekha, B.; Christy, Y.J.; Anusha, S.; Divya, G.; Suganya, K.; Meganathan, B.; Kalyanaraman, N.; Vasudevan, V.; Kamaraj, R.; Karthik, M.; Jeyakumar, B.; Abhishek, A.; Paul, E.; Pushpanathan, M.; Rajmohan, R.K.; Velayutham, K.; Lyon, AR.; Ramasamy, S. Gut microbial degradation of organophosphate insecticides-induces glucose intolerance via gluconeogenesis. Genome Biol. 2017, 18(1), 8. [Google Scholar] [CrossRef] [PubMed]
- Guardia-Escote, L.; Basaure, P.; Biosca-Brull, J.; Cabré, M.; Blanco, J.; Pérez-Fernández, C.; Sánchez-Santed, F.; Domingo, J.L.; Colomina, M.T. APOE genotype and postnatal chlorpyrifos exposure modulate gut microbiota and cerebral short-chain fatty acids in preweaning mice. Food Chem. Toxicol. 2020, 135, 110872. [Google Scholar] [CrossRef] [PubMed]
- Mesnage, R.; Bowyer, R.C.E.; El Balkhi, S.; Saint-Marcoux, F.; Gardere, A.; Ducarmon, Q.R.; Geelen, A.R.; Zwittink, R.D.; Tsoukalas, D.; Sarandi, E.; Paramera, E.I.; Spector, T.; Steves, C.J.; Antoniou, M.N. Impacts of dietary exposure to pesticides on faecal microbiome metabolism in adult twins. Environ. Health 2022, 21(1), 46. [Google Scholar] [CrossRef] [PubMed]
- Liu, H.; Bai, Y.; Yu, Y.; Qi, Z.; Zhang, G.; Li, G.; Yu, Y.; An, T. Maternal transfer of resorcinol-bis(diphenyl)-phosphate perturbs gut microbiota development and gut metabolism of offspring in rats. Environ. Int. 2023, 178, 108039. [Google Scholar] [CrossRef]
- Luo, Y.; Tan, C.; Yang, J.; Zhang, G.; Wu, J. Maternal exposure to tris (2-chloroethyl) phosphate during pregnancy and suckling period alters gut microbiota and SCFAs metabolism in offspring of rats. Environ. Pollut. 2025, 383, 126777. [Google Scholar] [CrossRef]
- Lockridge, O.; Schopfer, L.M. Review: Organophosphorus toxicants, in addition to inhibiting acetylcholinesterase activity, make covalent adducts on multiple proteins and promote protein crosslinking into high molecular weight aggregates. Chem Biol Interact. 2023, 376, 110460. [Google Scholar] [CrossRef]
- Orcholski, M.E.; Khurshudyan, A.; Shamskhou, E.A.; Yuan, K.; Chen, I.Y.; Kodani, S.D.; Morisseau, C.; Hammock, B.D.; Hong, E.M.; Alexandrova, L.; Alastalo, T.-P.; Berry, G.; Zamanian, R.T.; de Jesus Perez, V.A. Reduced carboxylesterase 1 is associated with endothelial injury in methamphetamine-induced pulmonary arterial hypertension. Am J Physiol Lung Cell Mol Physiol. 2017, 313, L252–L266. [Google Scholar] [CrossRef]
- Chen, A.S.; Liu, D.H.; Hou, H.N.; Yao, J.N.; Xiao, S.C.; Ma, X.R.; Li, P.Z.; Cao, Q.; Liu, X.K.; Zhou, Z.Q.; Wang, P. Dietary pattern interfered with the impacts of pesticide exposure by regulating the bioavailability and gut microbiota. Sci. Total Environ. 2023, 858 Pt 2, 159936. [Google Scholar] [CrossRef]
- Liu, S.; Yang, Y.; Zong, Y.; Chen, W.; Geng, J.; Zhao, Y.; Du, R.; He, Z. Ginsenoside Rg3 alleviates brain damage caused by chlorpyrifos exposure by targeting and regulating the microbial-gut-brain axis. Phytomedicine 2025, 143, 156838. [Google Scholar] [CrossRef]
Figure 1.
(a) Drug load; (b) History of gastrointestinal diseases (0 - no disease, 1 - gastrointestinal diseases); (c) History of hepatitis (0 - no diagnosis, 1 - hepatitis); (d) Frequency of polyneuropathy diagnosis depending on localization. *, **, *** - differences from control are statistically significant (p<0.05, p<0.01, p<0.001.
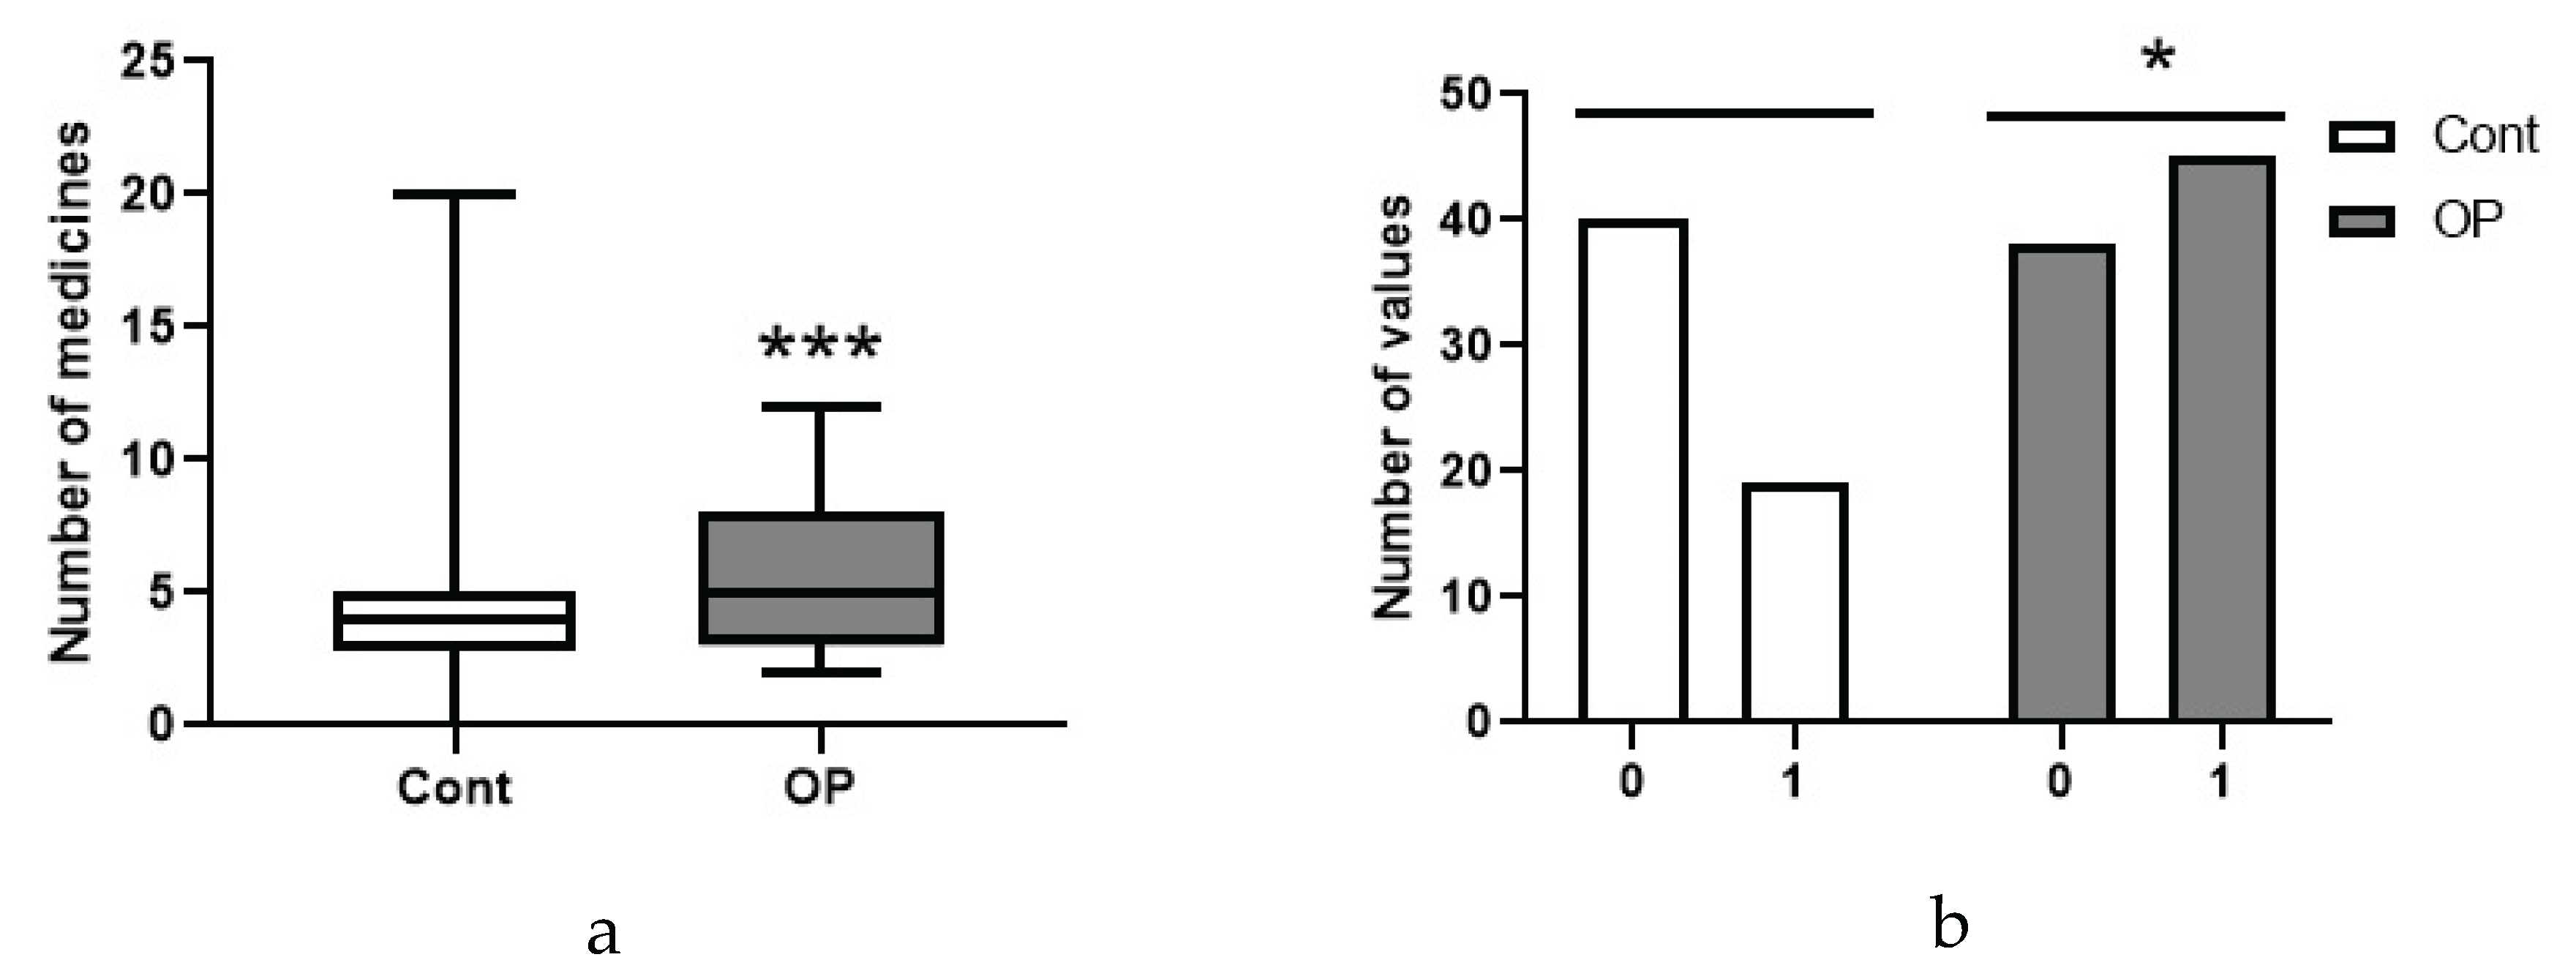
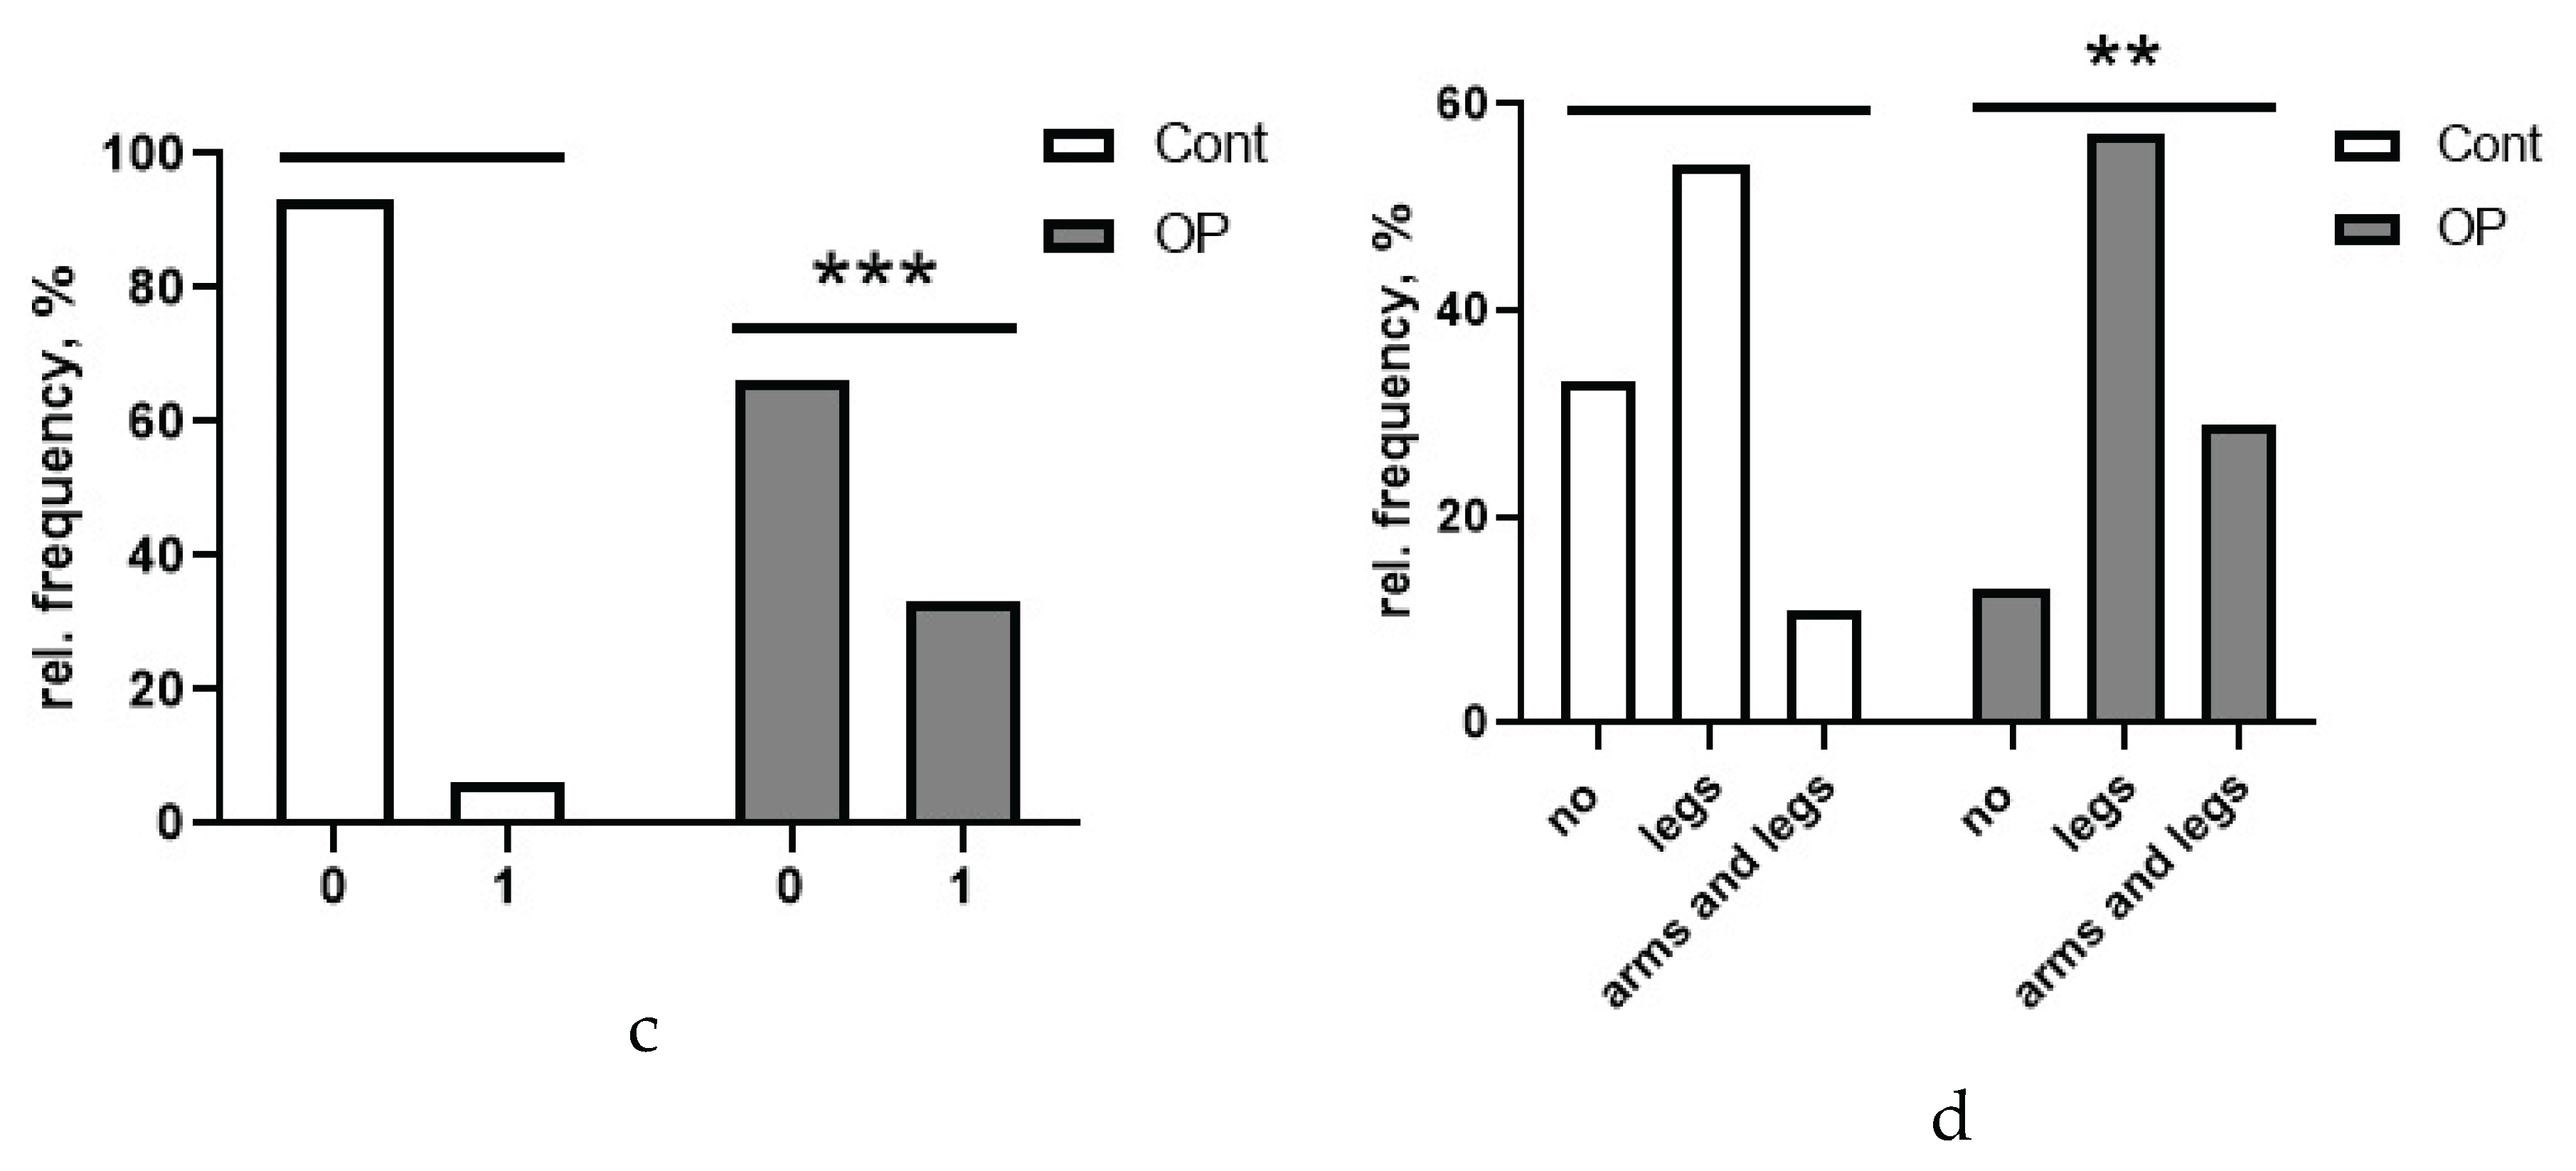
Figure 2.
Biochemical parameters measured on the Sapphire 400 biochemical analyzer (statistically significant changes are shown): AST activity (a), GGT activity (b), ALP activity (c), LDH activity (d, the dotted line indicates the normal range), calcium concentration (e), HDL concentration (f), amylase activity (g), ferritin concentration without separation by gender (h), ferritin concentration in the blood of women (i), TAS (j), lipase activity (k, individual values and normal range). *, **, ***, **** - differences from the control group (Mann-Whitney test) are statistically significant, p < 0.05, p < 0.01, p < 0.001, p < 0.0001, respectively.
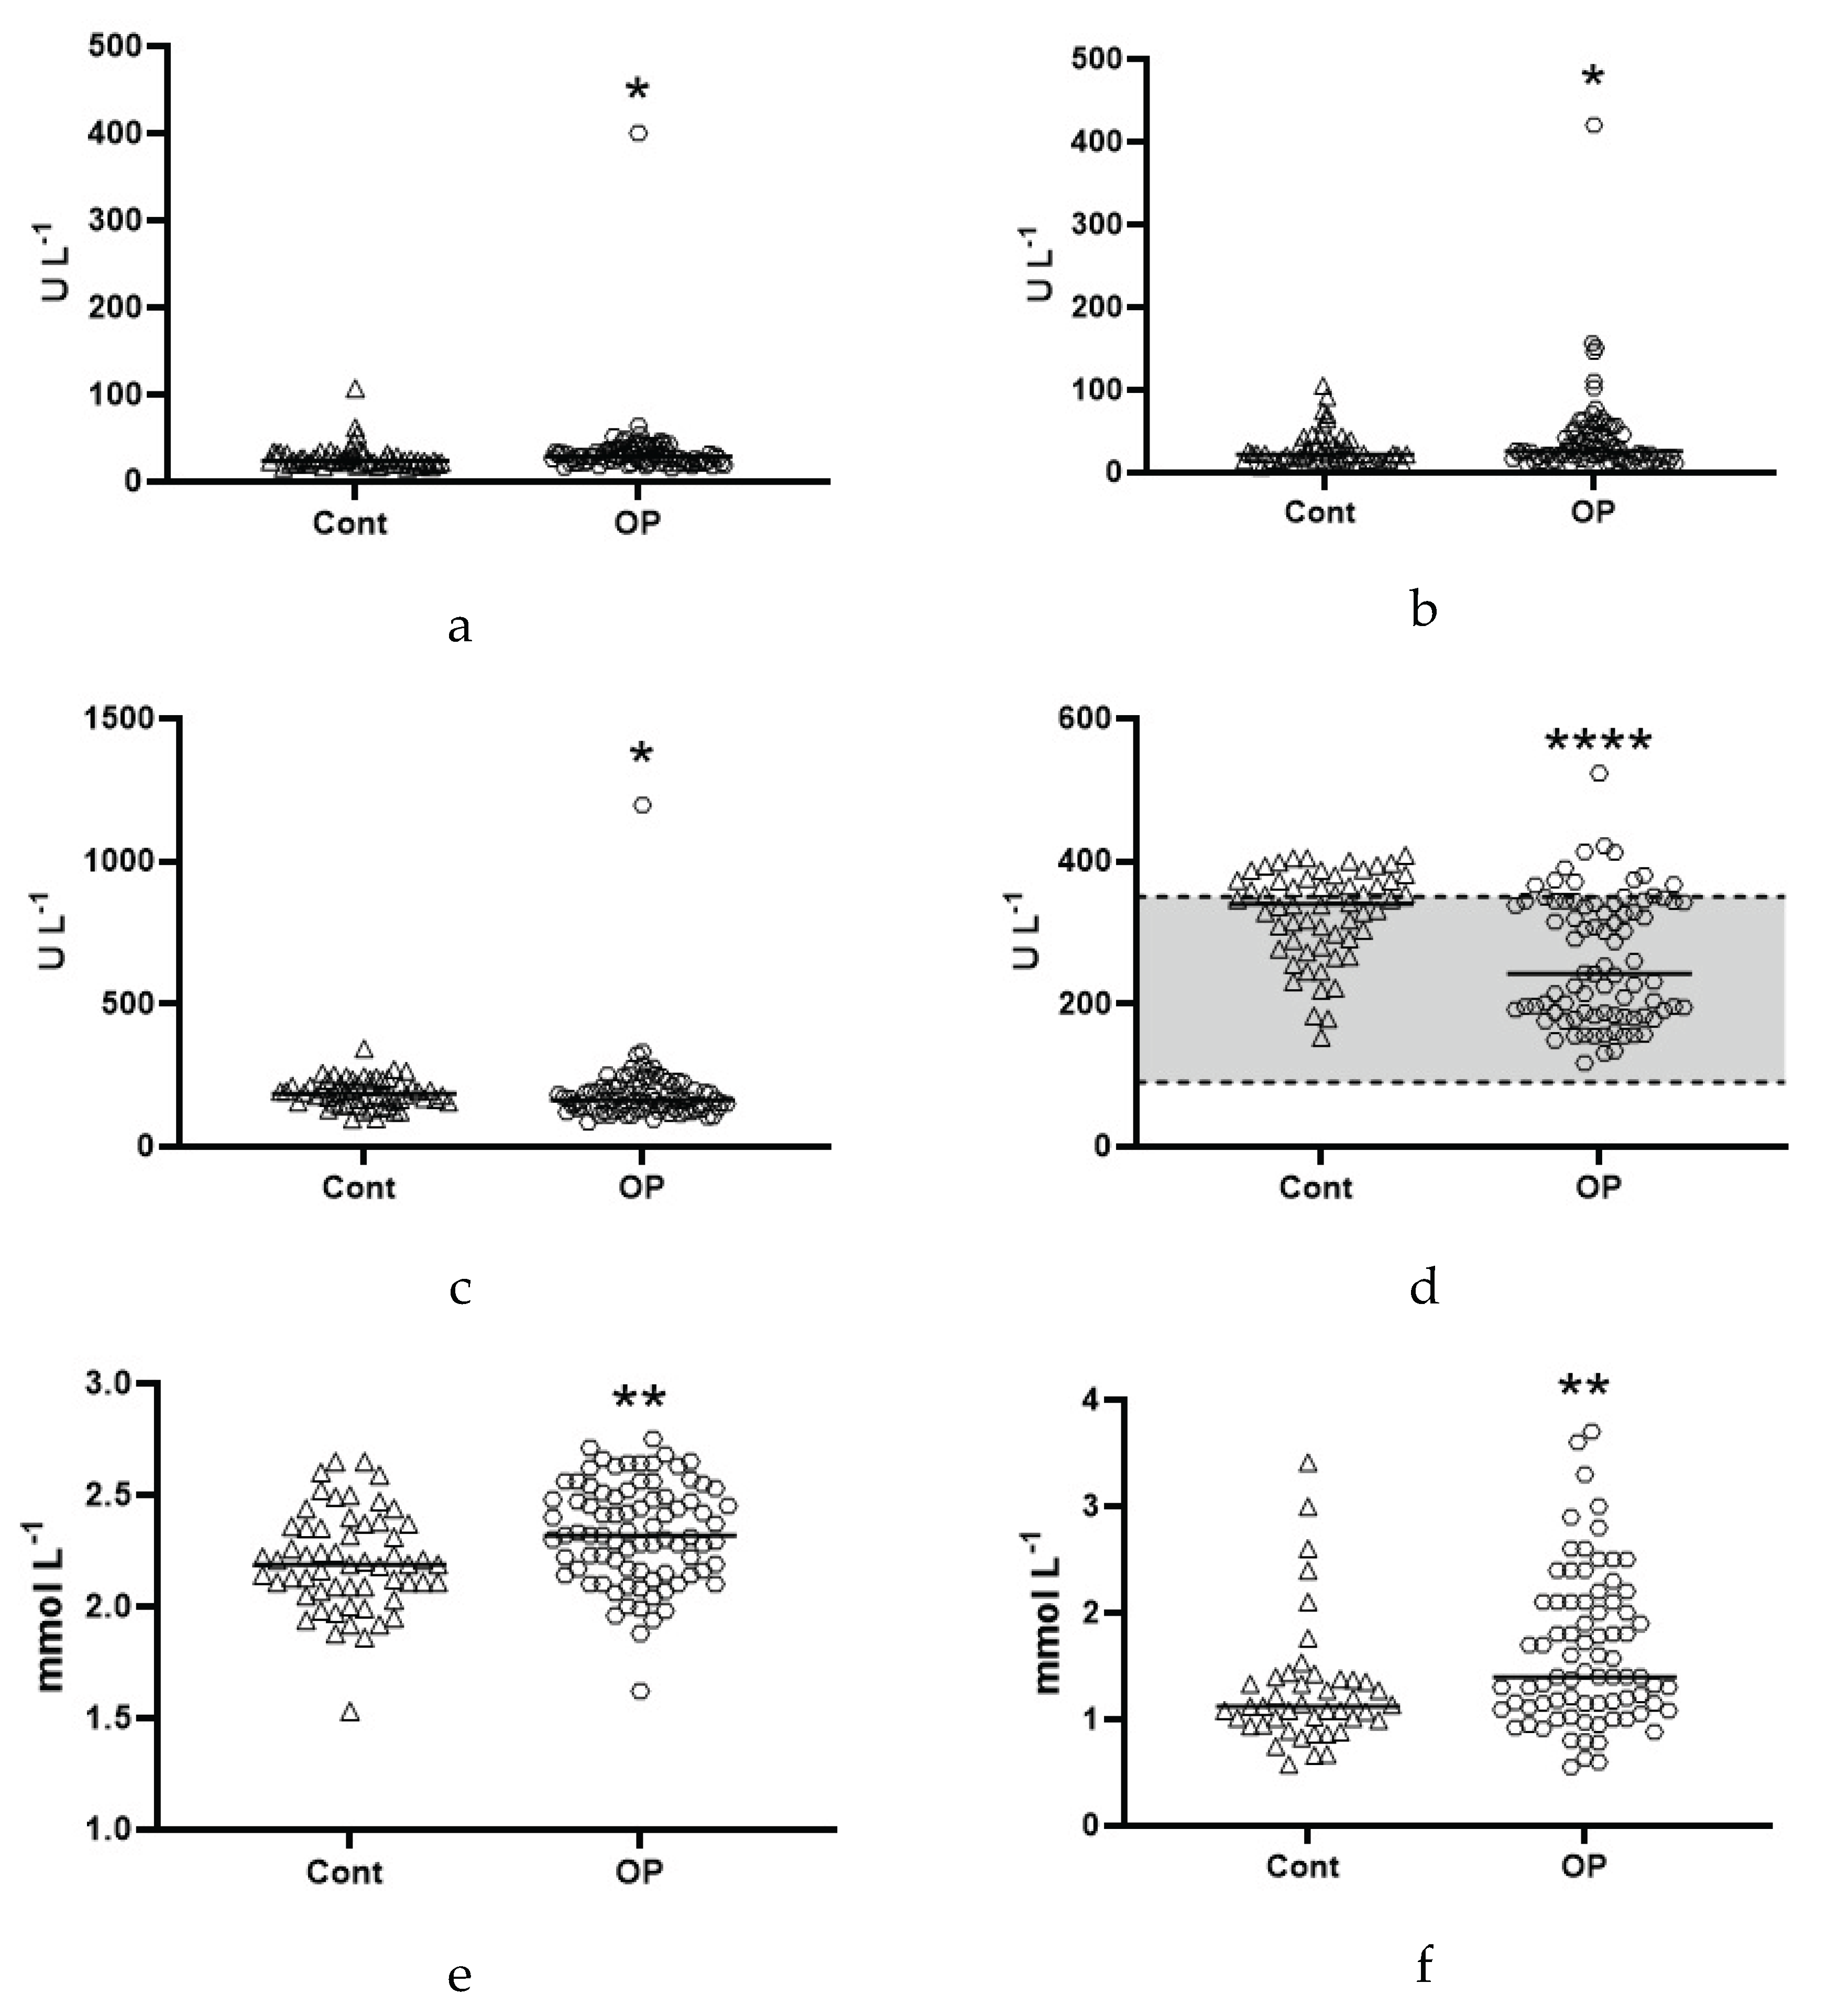
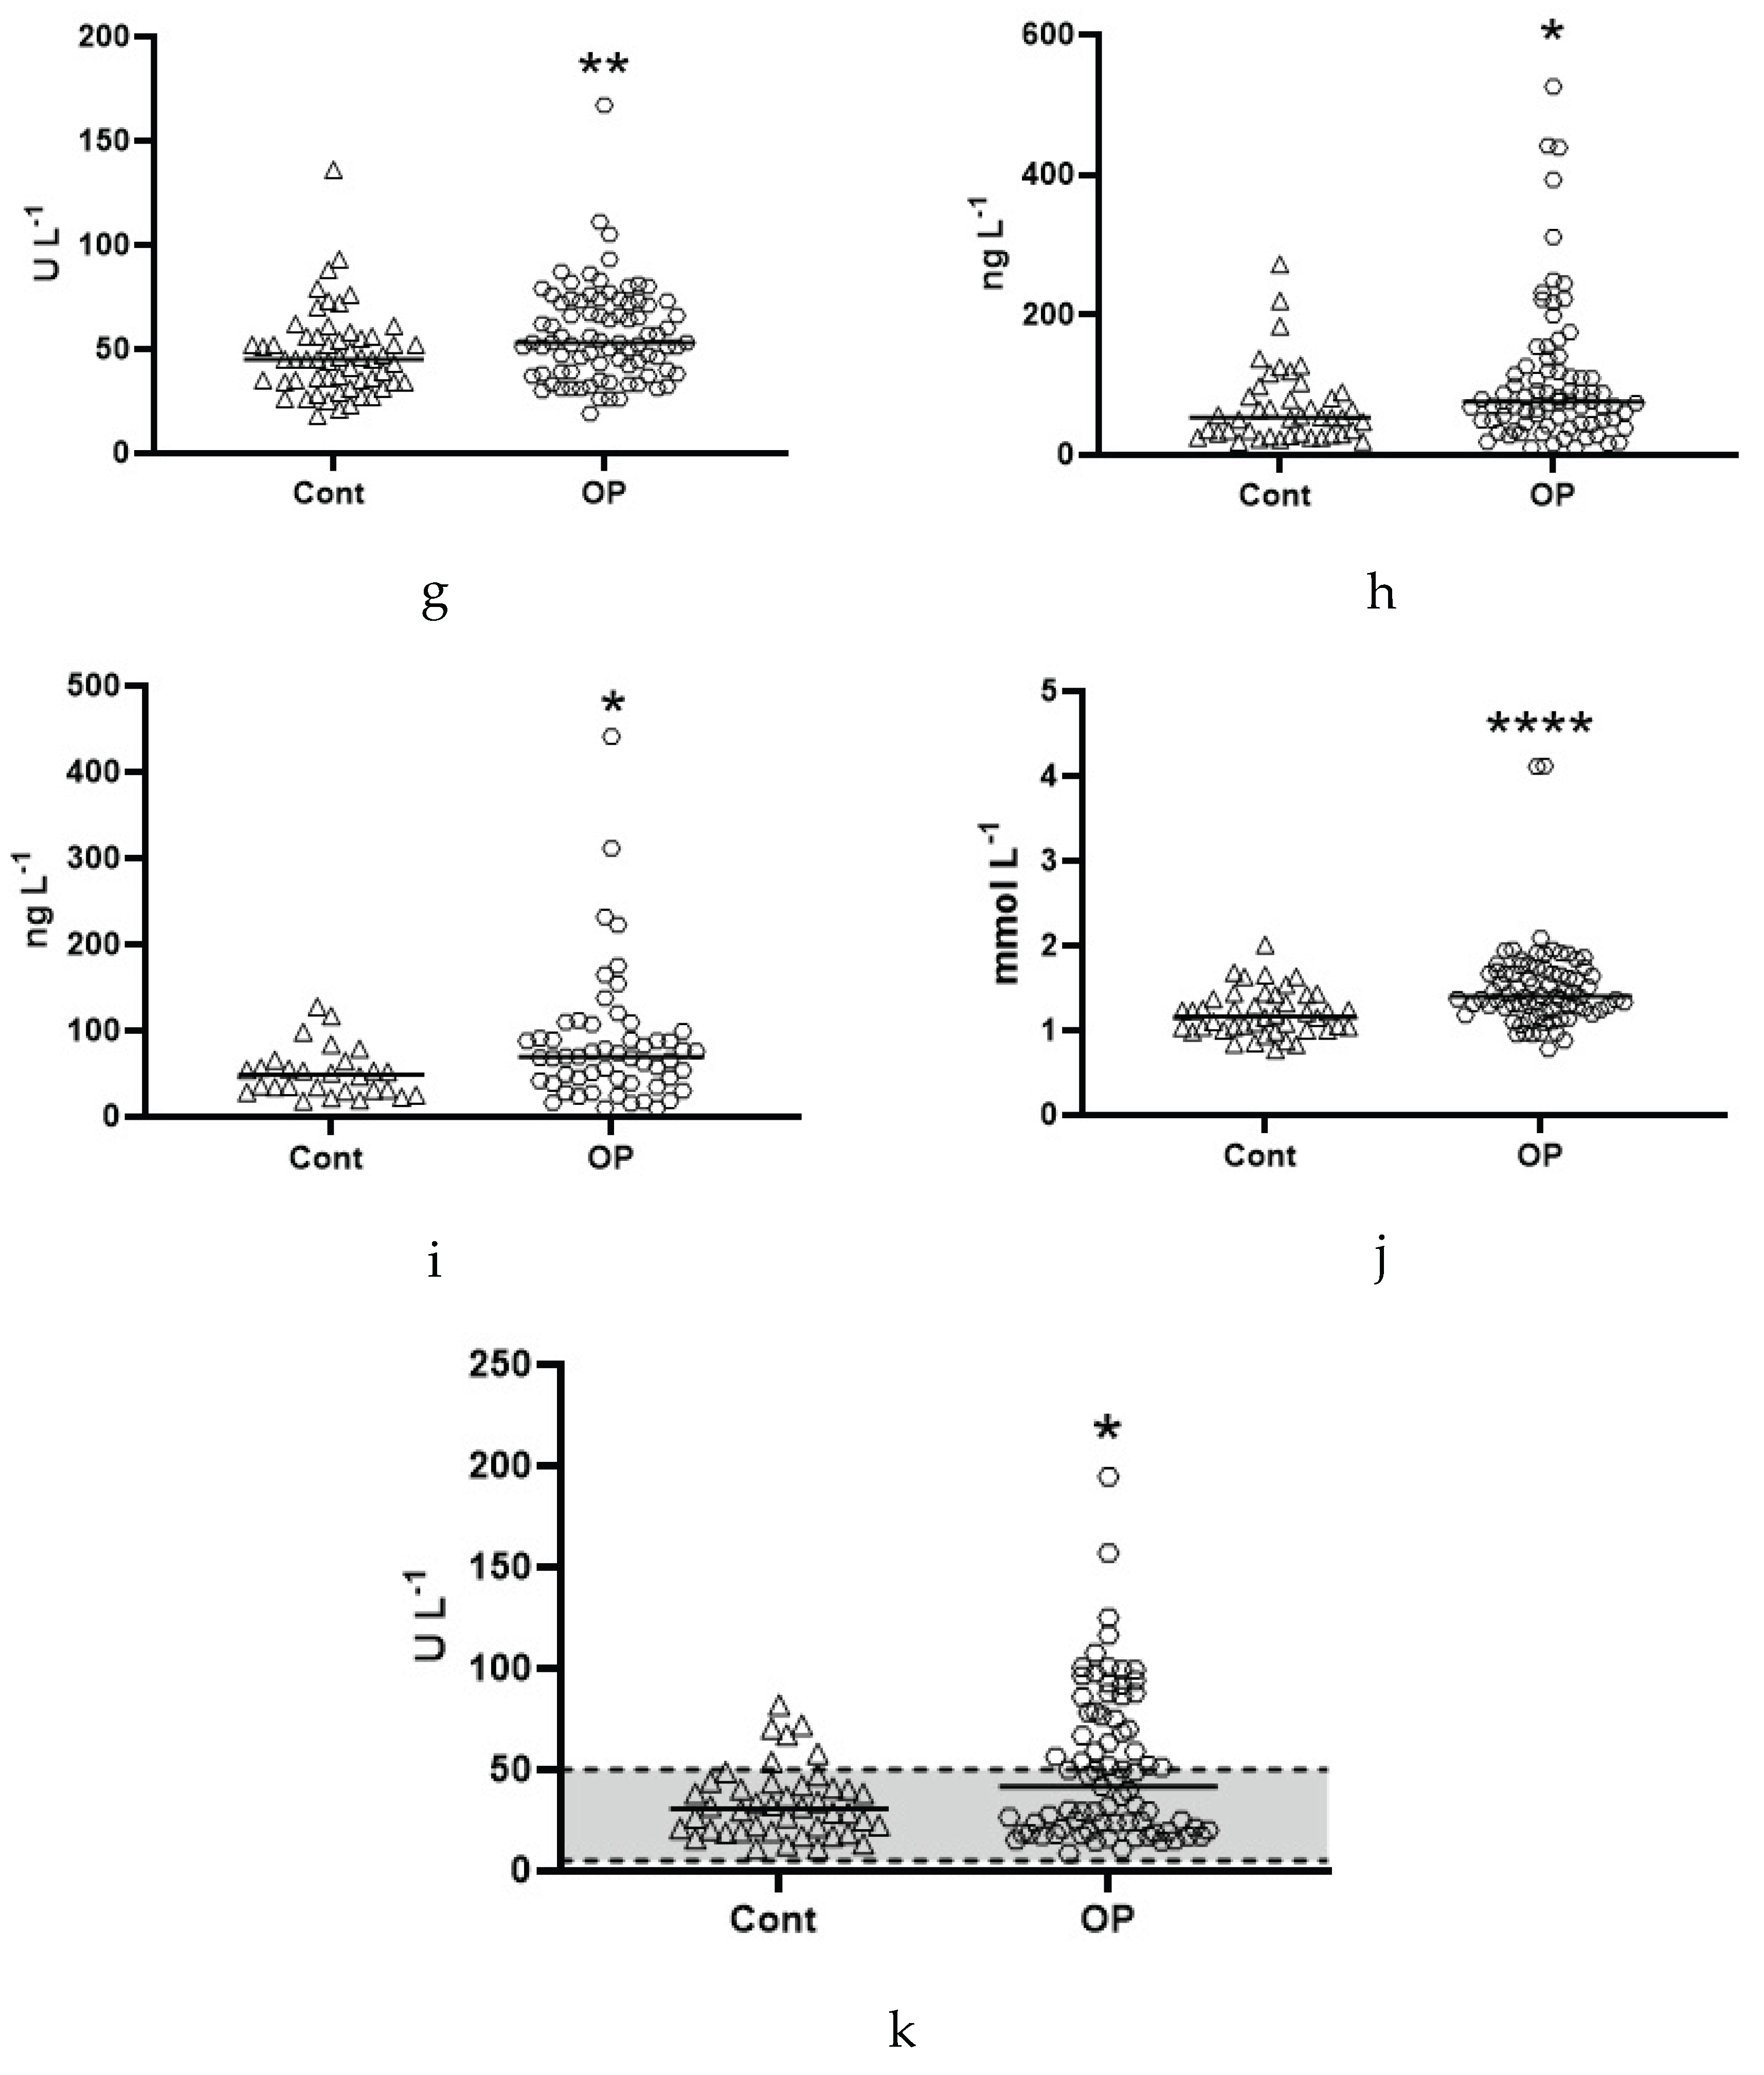
Figure 3.
Butyrylcholinesterase activity by acetylthiocholine (a) and albumin esterase activity (b). * - differences from the control group (Mann-Whitney test) are statistically significant, p<0.05.
Figure 3.
Butyrylcholinesterase activity by acetylthiocholine (a) and albumin esterase activity (b). * - differences from the control group (Mann-Whitney test) are statistically significant, p<0.05.
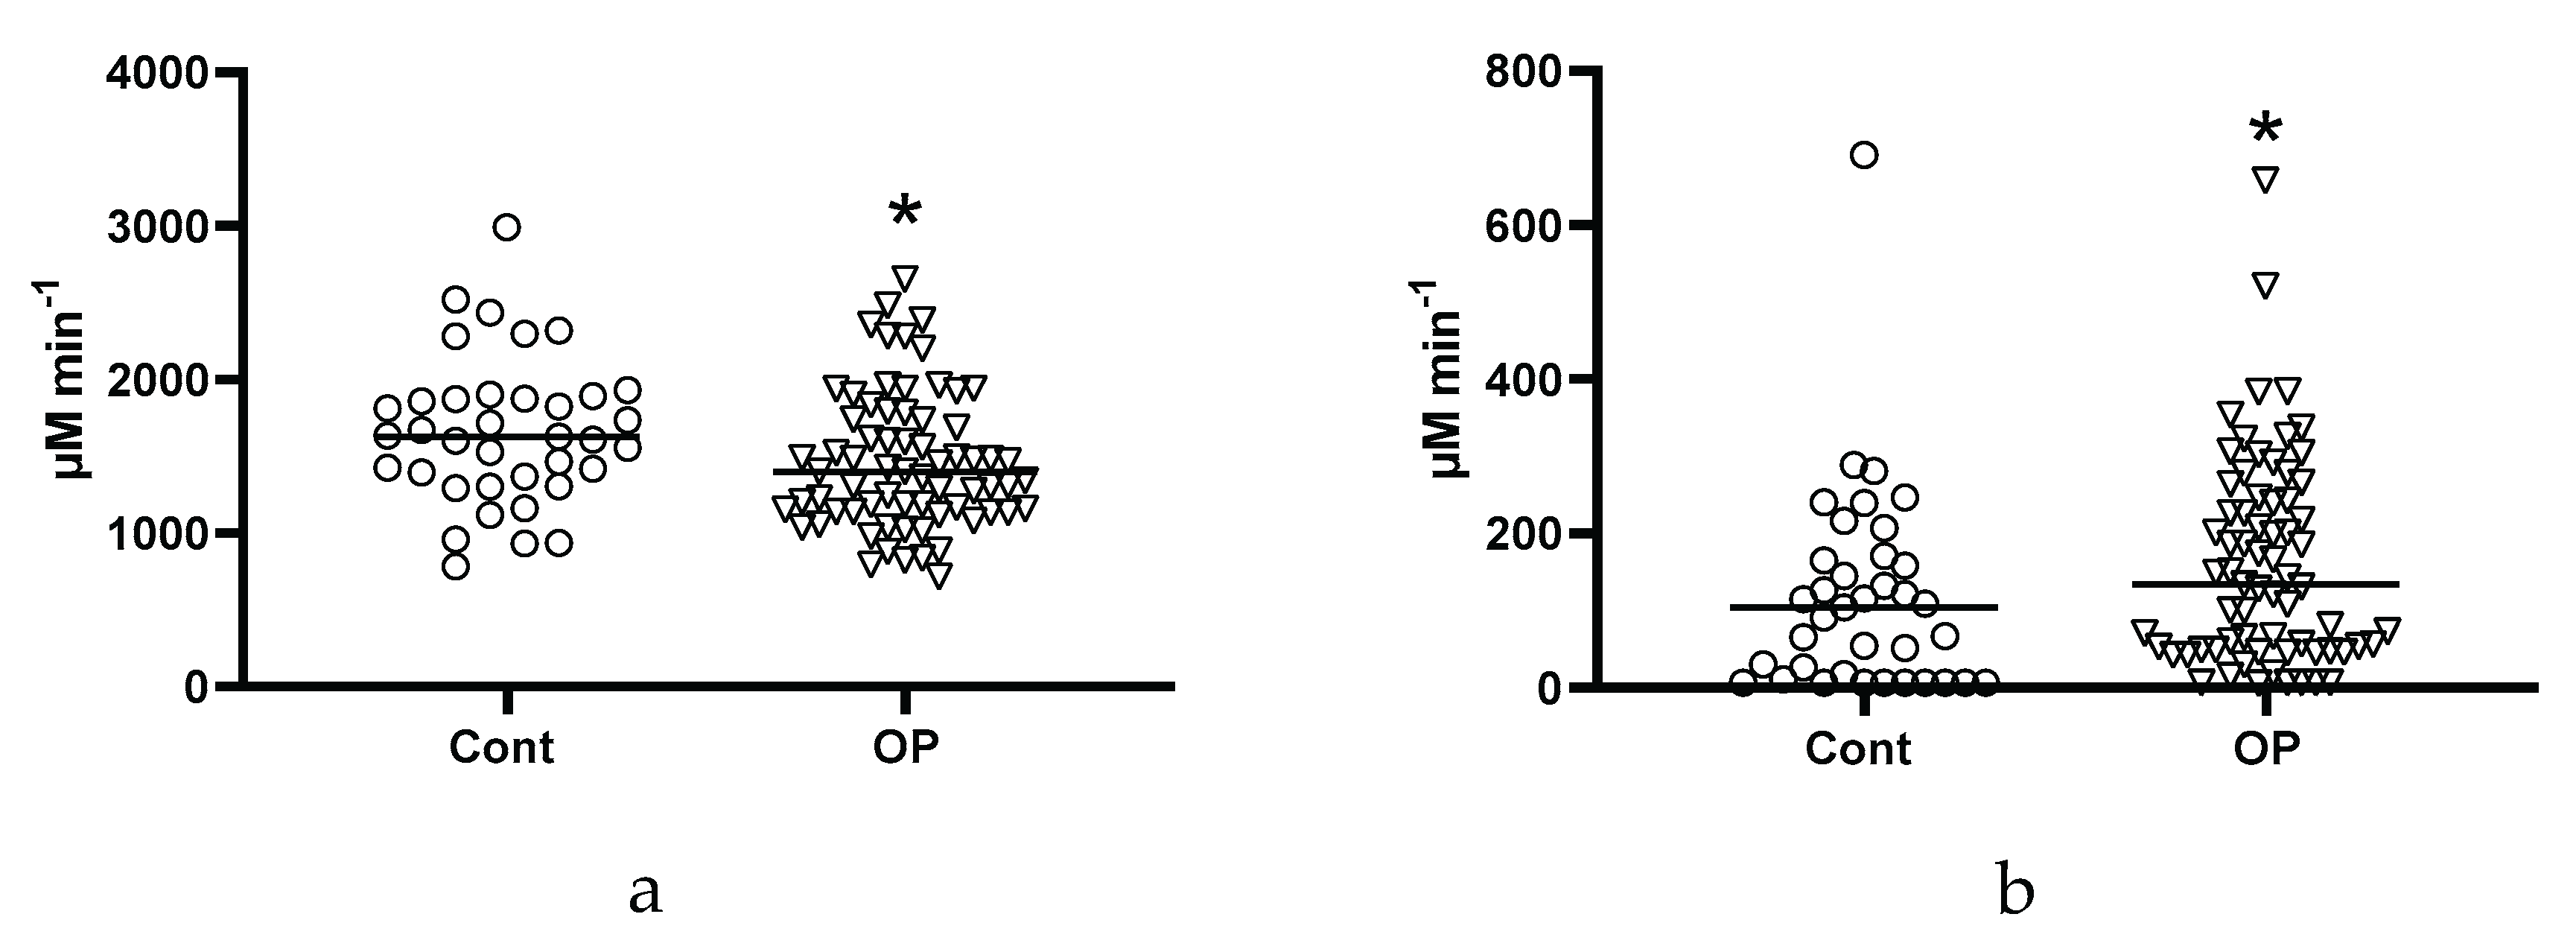
Figure 4.
Concentration of 3-hydroxybutyrate (a), 2-hydroxybutyrate (b), acetyl-L-carnitine (c) in the blood plasma of the control group (Cont) and patients with occupational pathology (OP). *, **, ***, **** - differences from the control group (Mann-Whitney test) are statistically significant, p<0.05, p<0.01, p<0.001, p<0.0001, respectively.
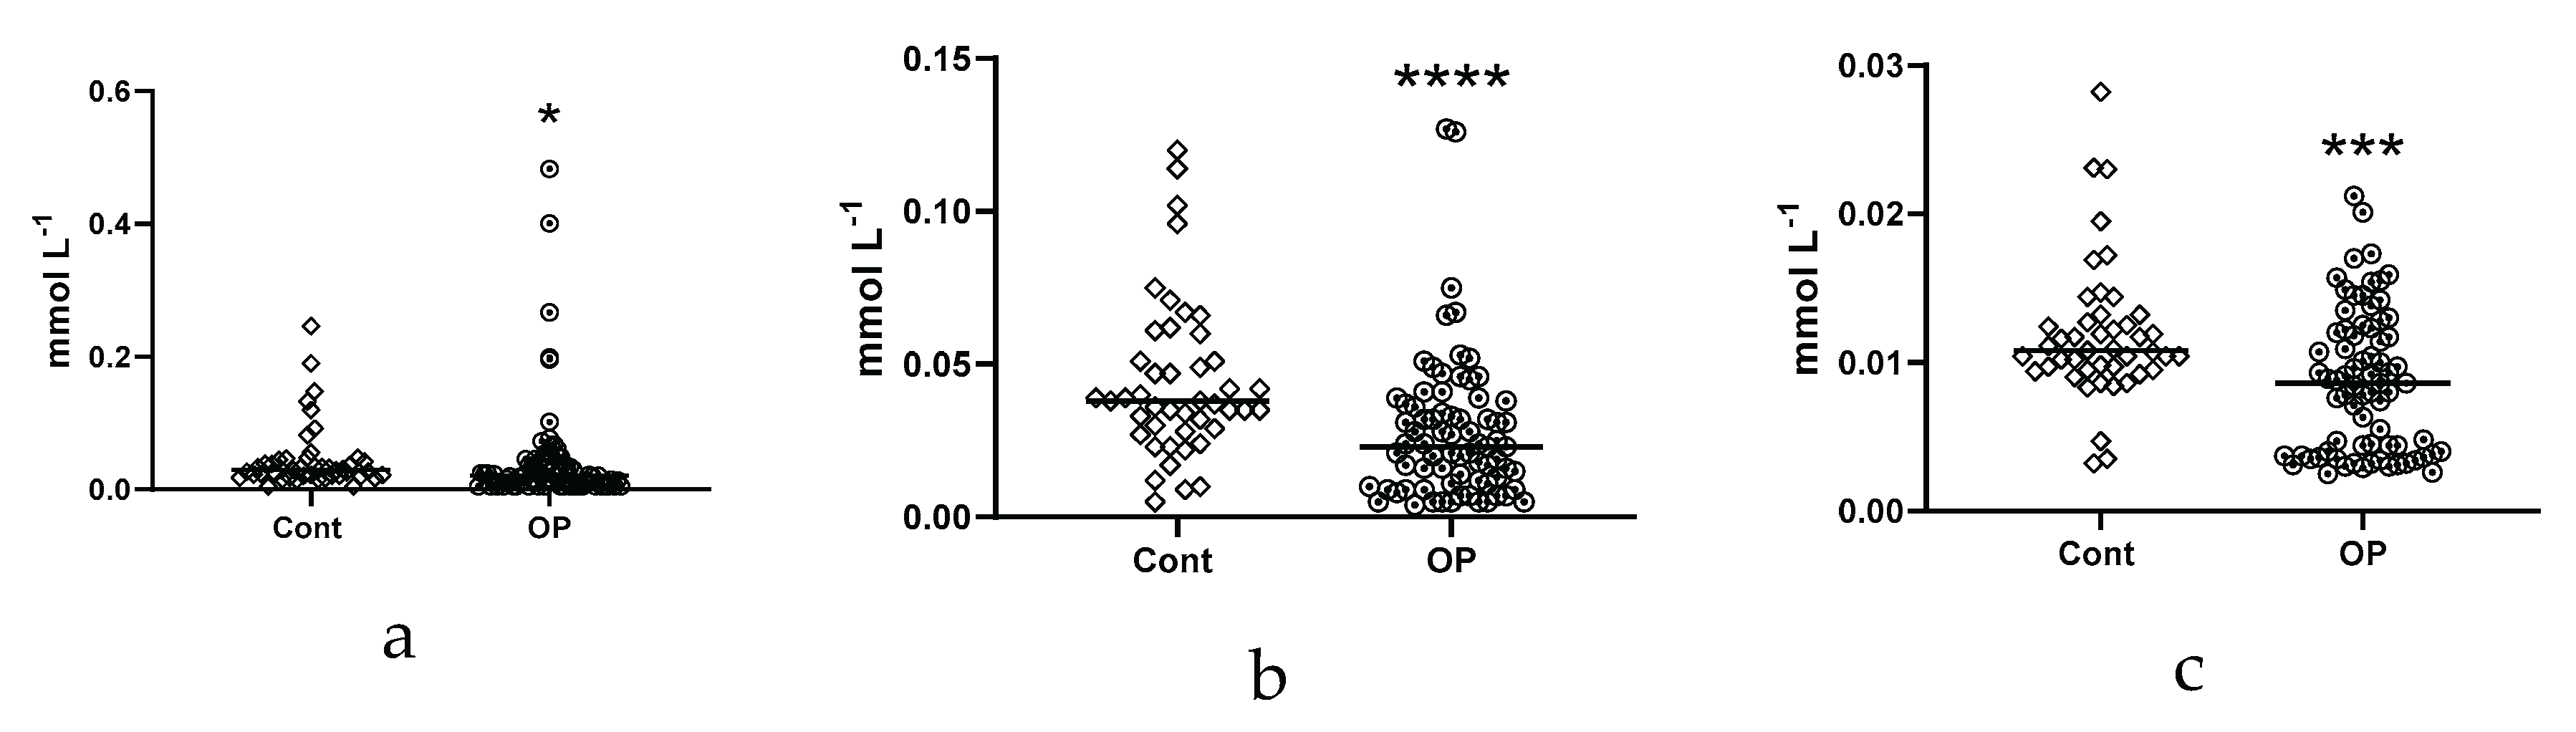
Figure 5.
Concentrations (μg/mL) of EFA in the blood plasma of the subjects: myristic C14:0 (a), myristoleic C14:1 (b), erucic, C22:1n9 (c), margaric C17:0 (d), stearic C18:0 (e), eicosadienoic, C20:2 (f), eicosatrienoic C20:3n8 (g), arachidonic C20:4n6 (h), eicosapentaenoic C20:5n3 (i), docosahexaenoic C22:6n3 (j). *, **, ***, **** - differences from the control group (Mann-Whitney test) are statistically significant, p<0.05, p<0.01, p<0.001, p<0.0001, respectively.
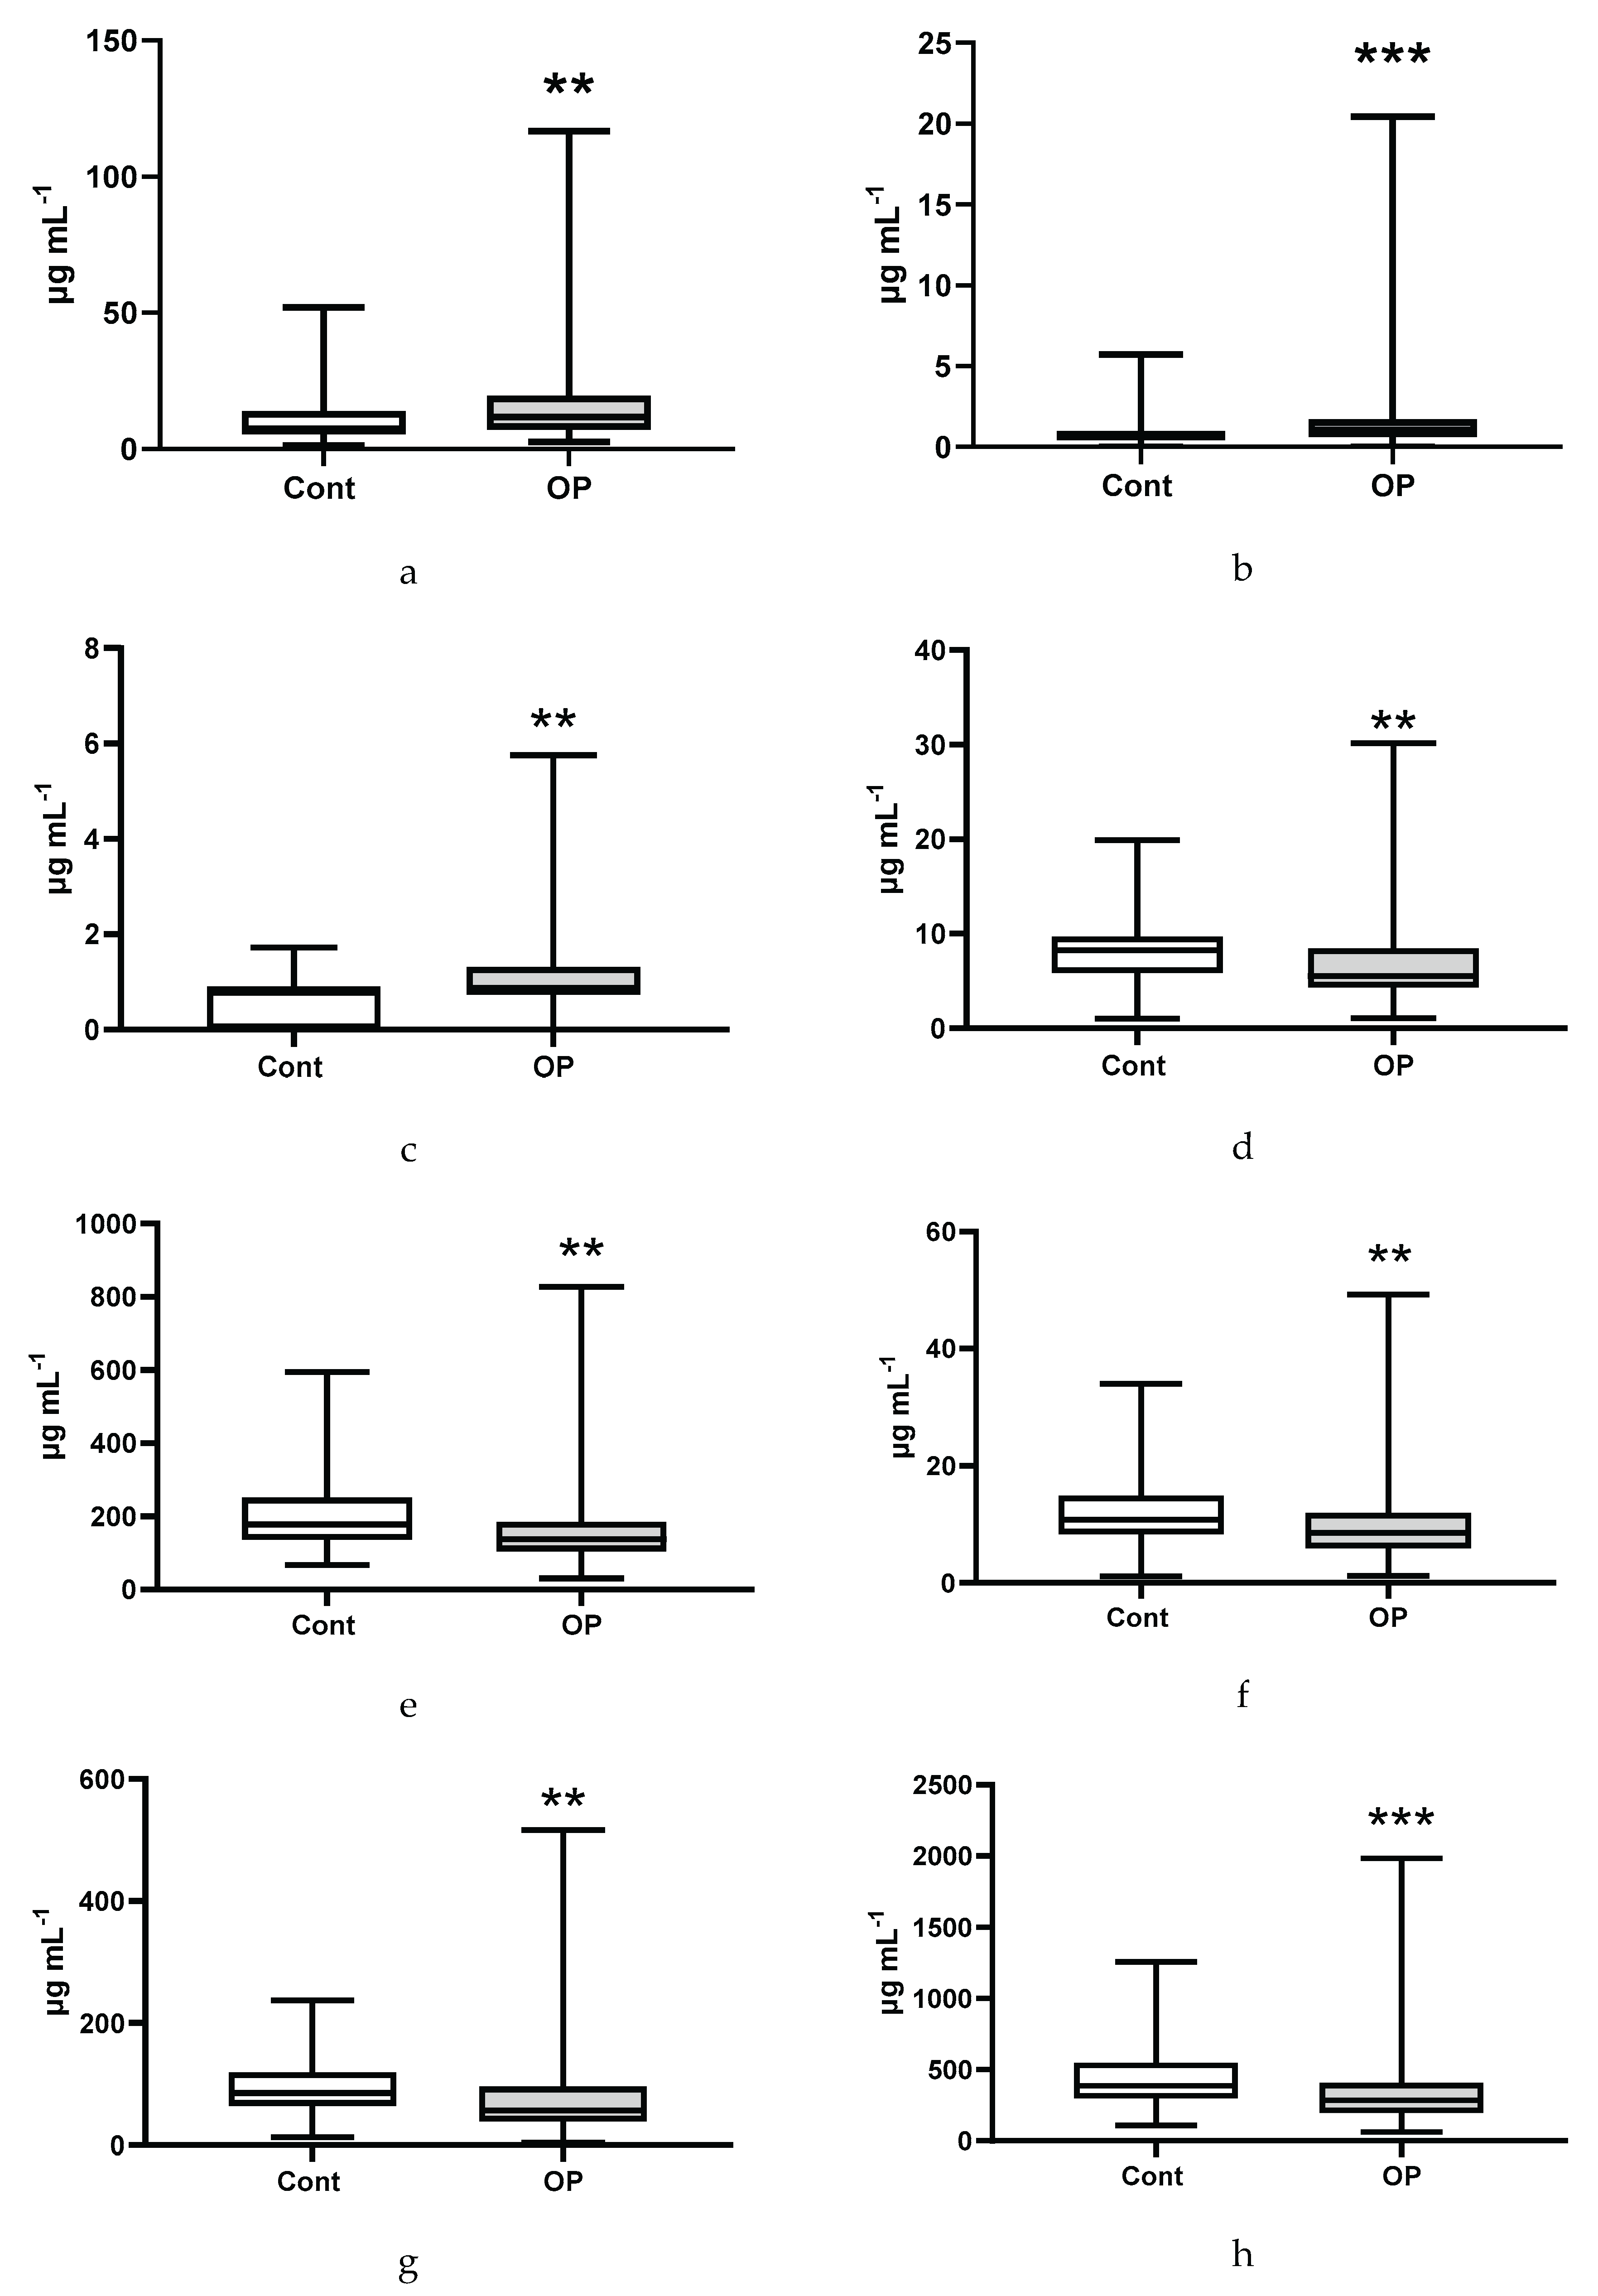
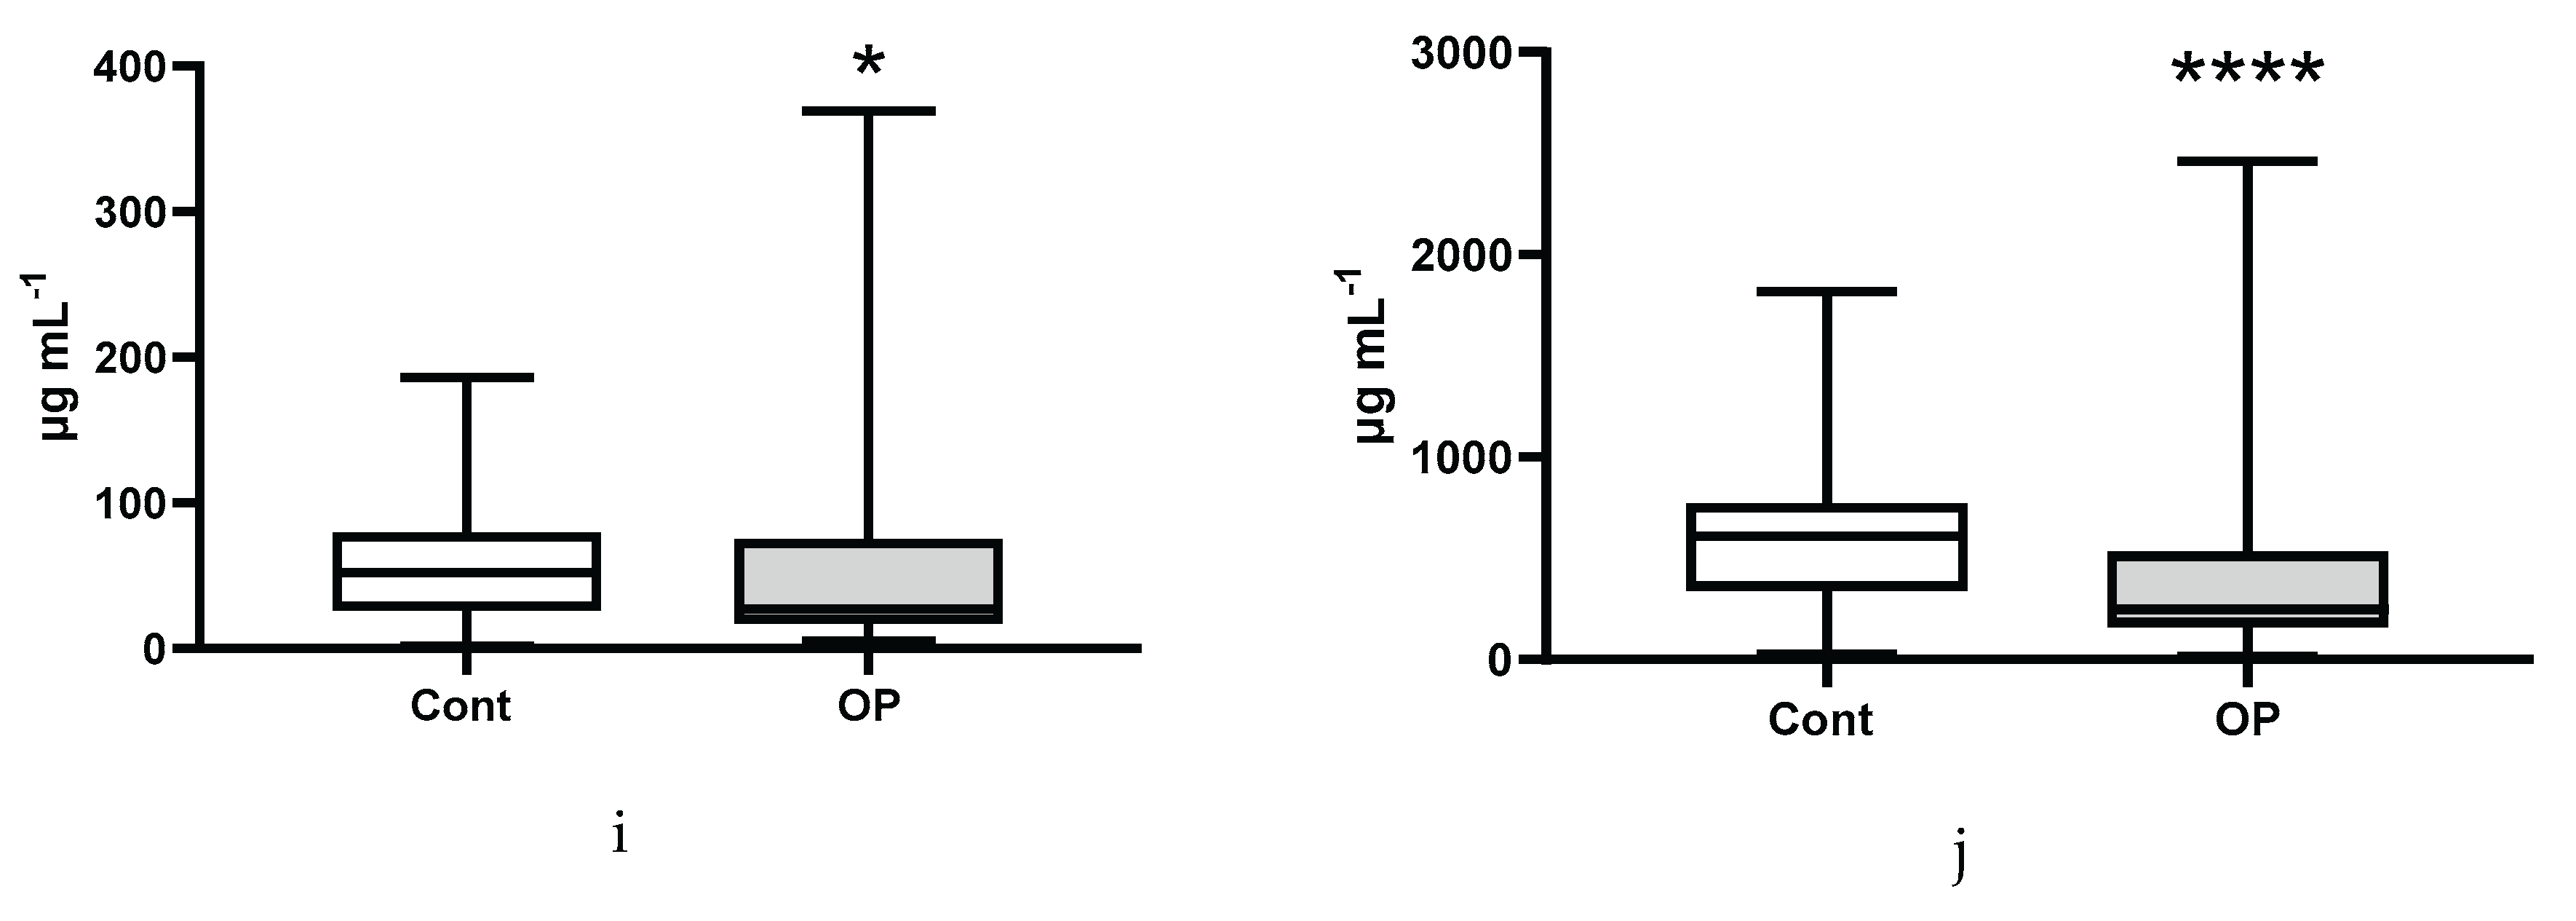
Figure 6.
Concentrations (μg/mL) of NEFA in the blood plasma of subjects: heptadecenoic C17:1 (a), docosahexaenoic C22:6n3 (b), arachidonic C20:4n6 (c), eicosapentaenoic C20:5n3 (d), eicosatrienoic C20:3n8 (e), γ-linolenic C18:3n6 (f), myristic C14:0 (g), eicosenoic (h), eicosadienoic C20:2 (i), oleic C18:1n9c (j), linoleic C18:2n6c (k), palmitic C16:0 (l), linoelaidic C18:2t (m), stearic C18:0 (n), palmitoleic C16:1n7 (o), pentadecanoic C15:0 (p), margaric C17:0 (q). *, **, ***, **** - differences from the control group (Mann-Whitney test) are statistically significant, p<0.05, p<0.01, p<0.001, p<0.0001, respectively.
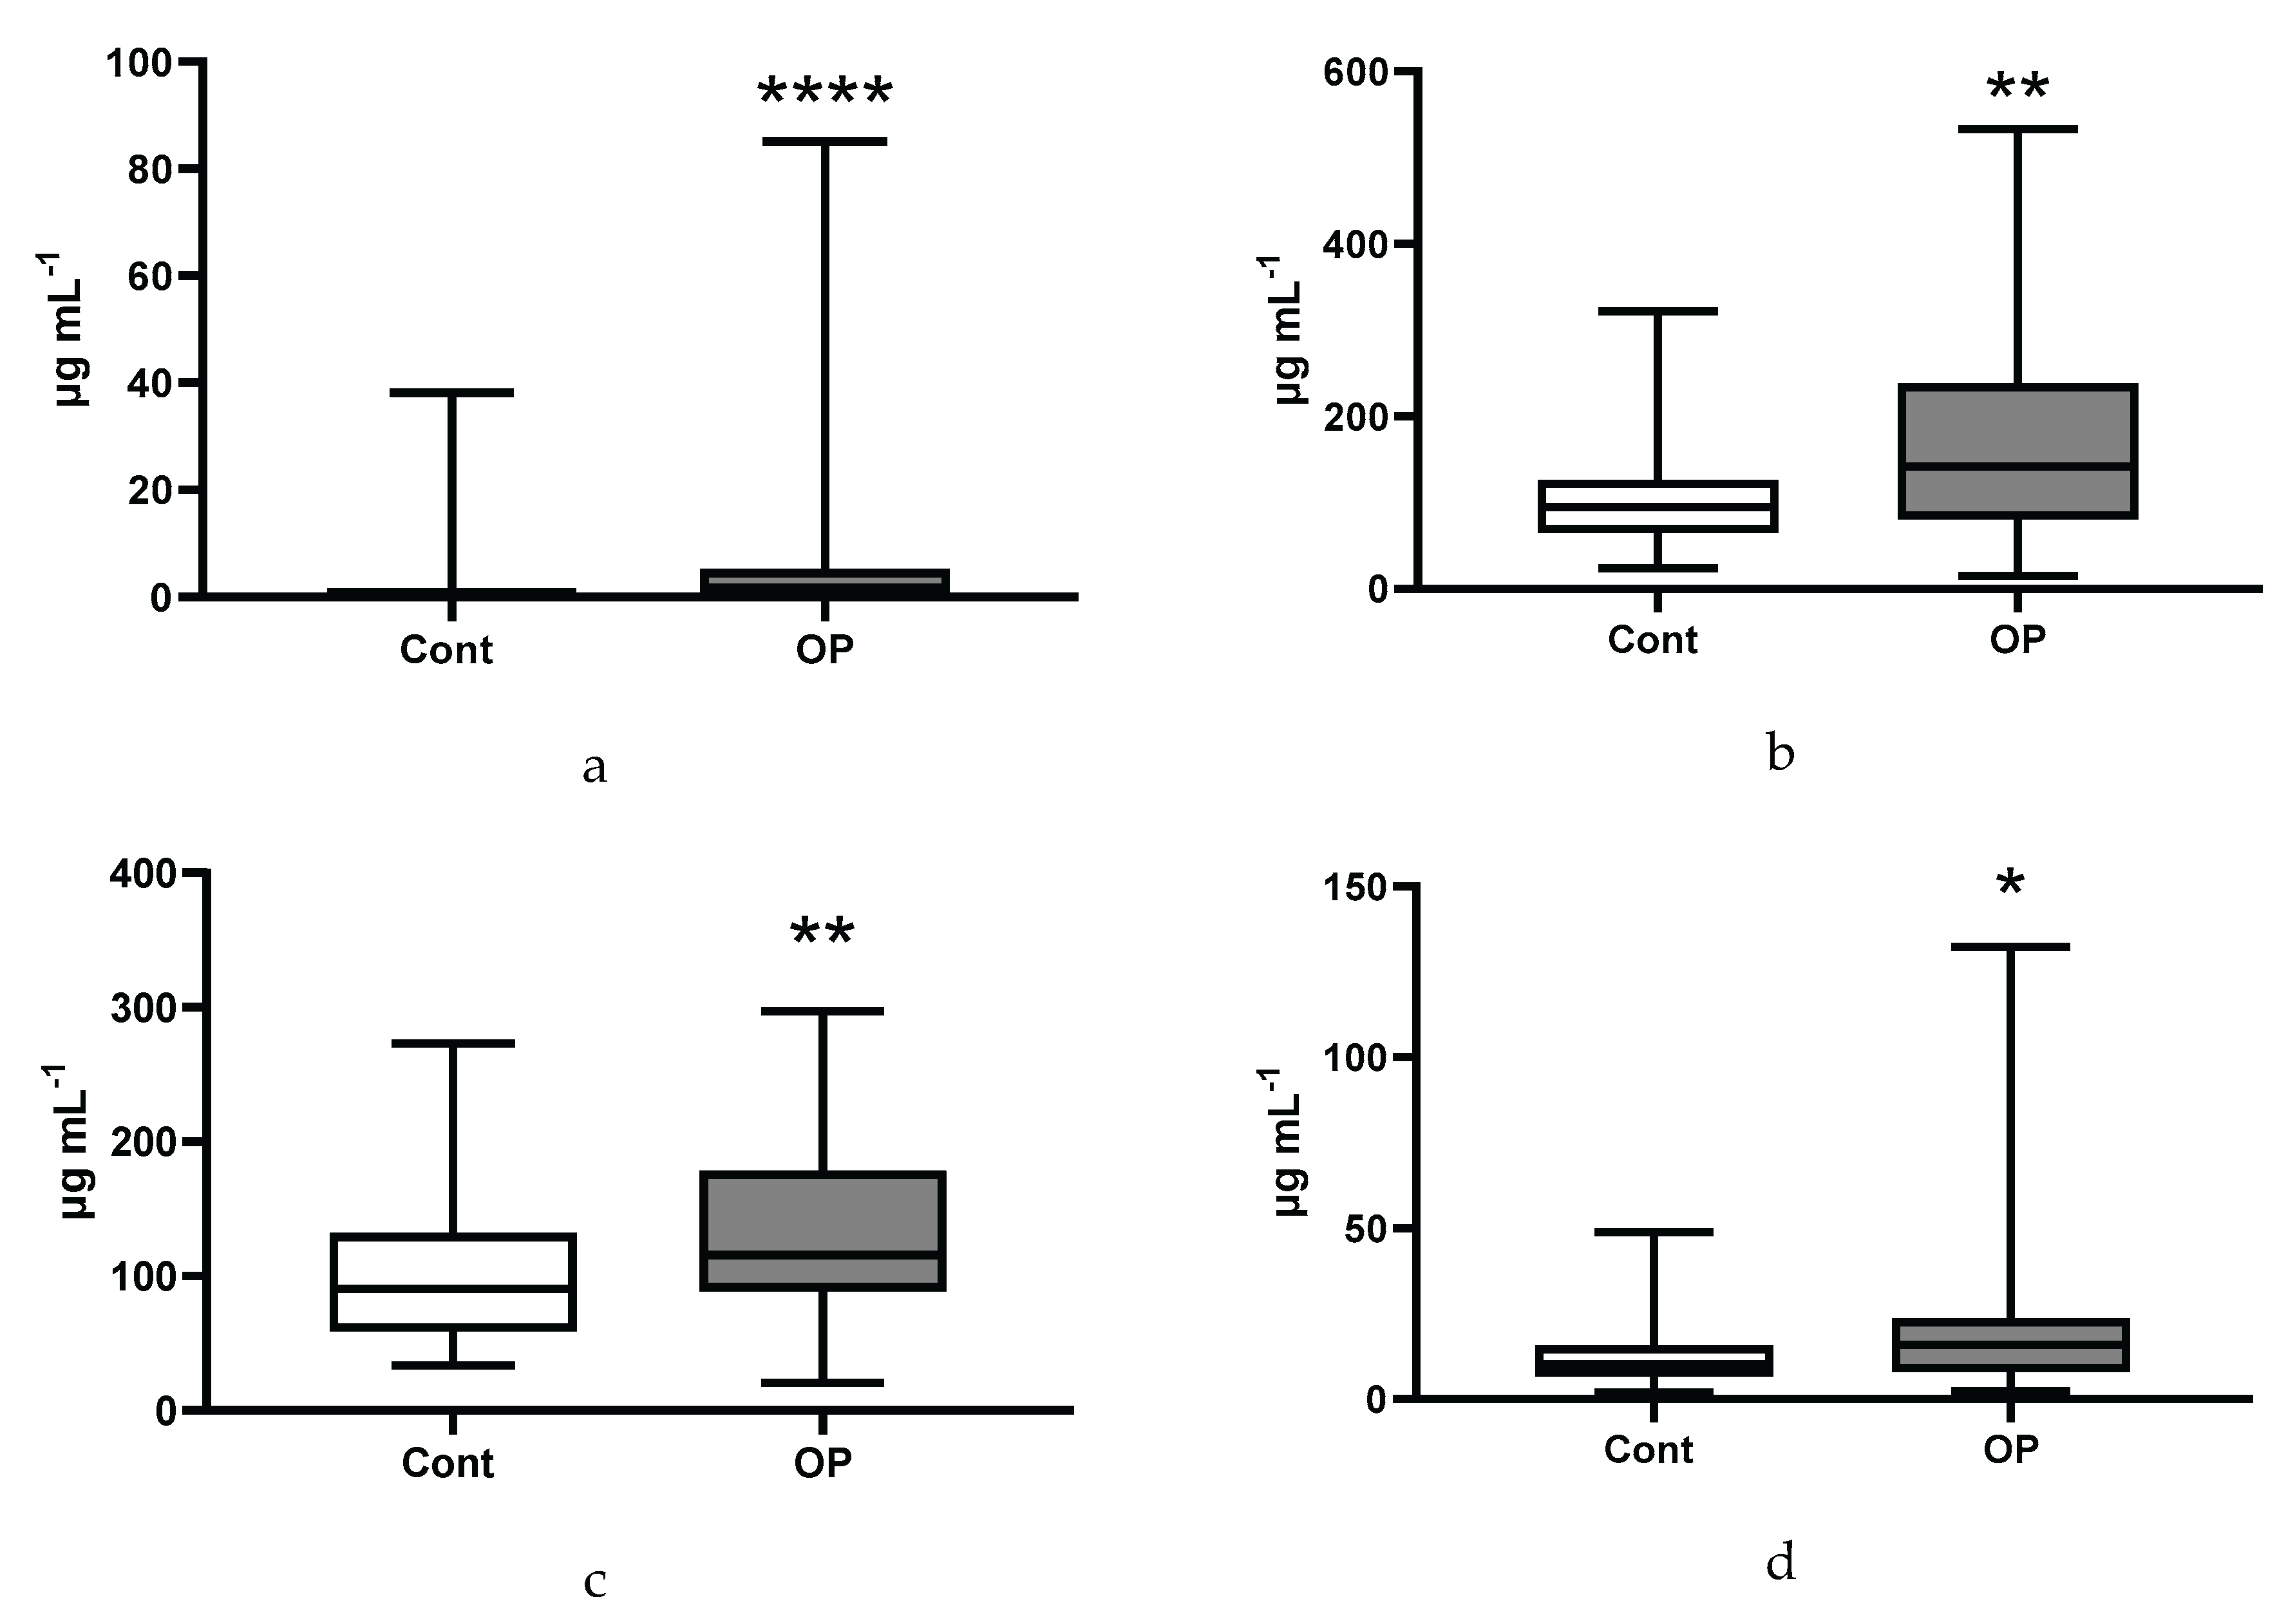
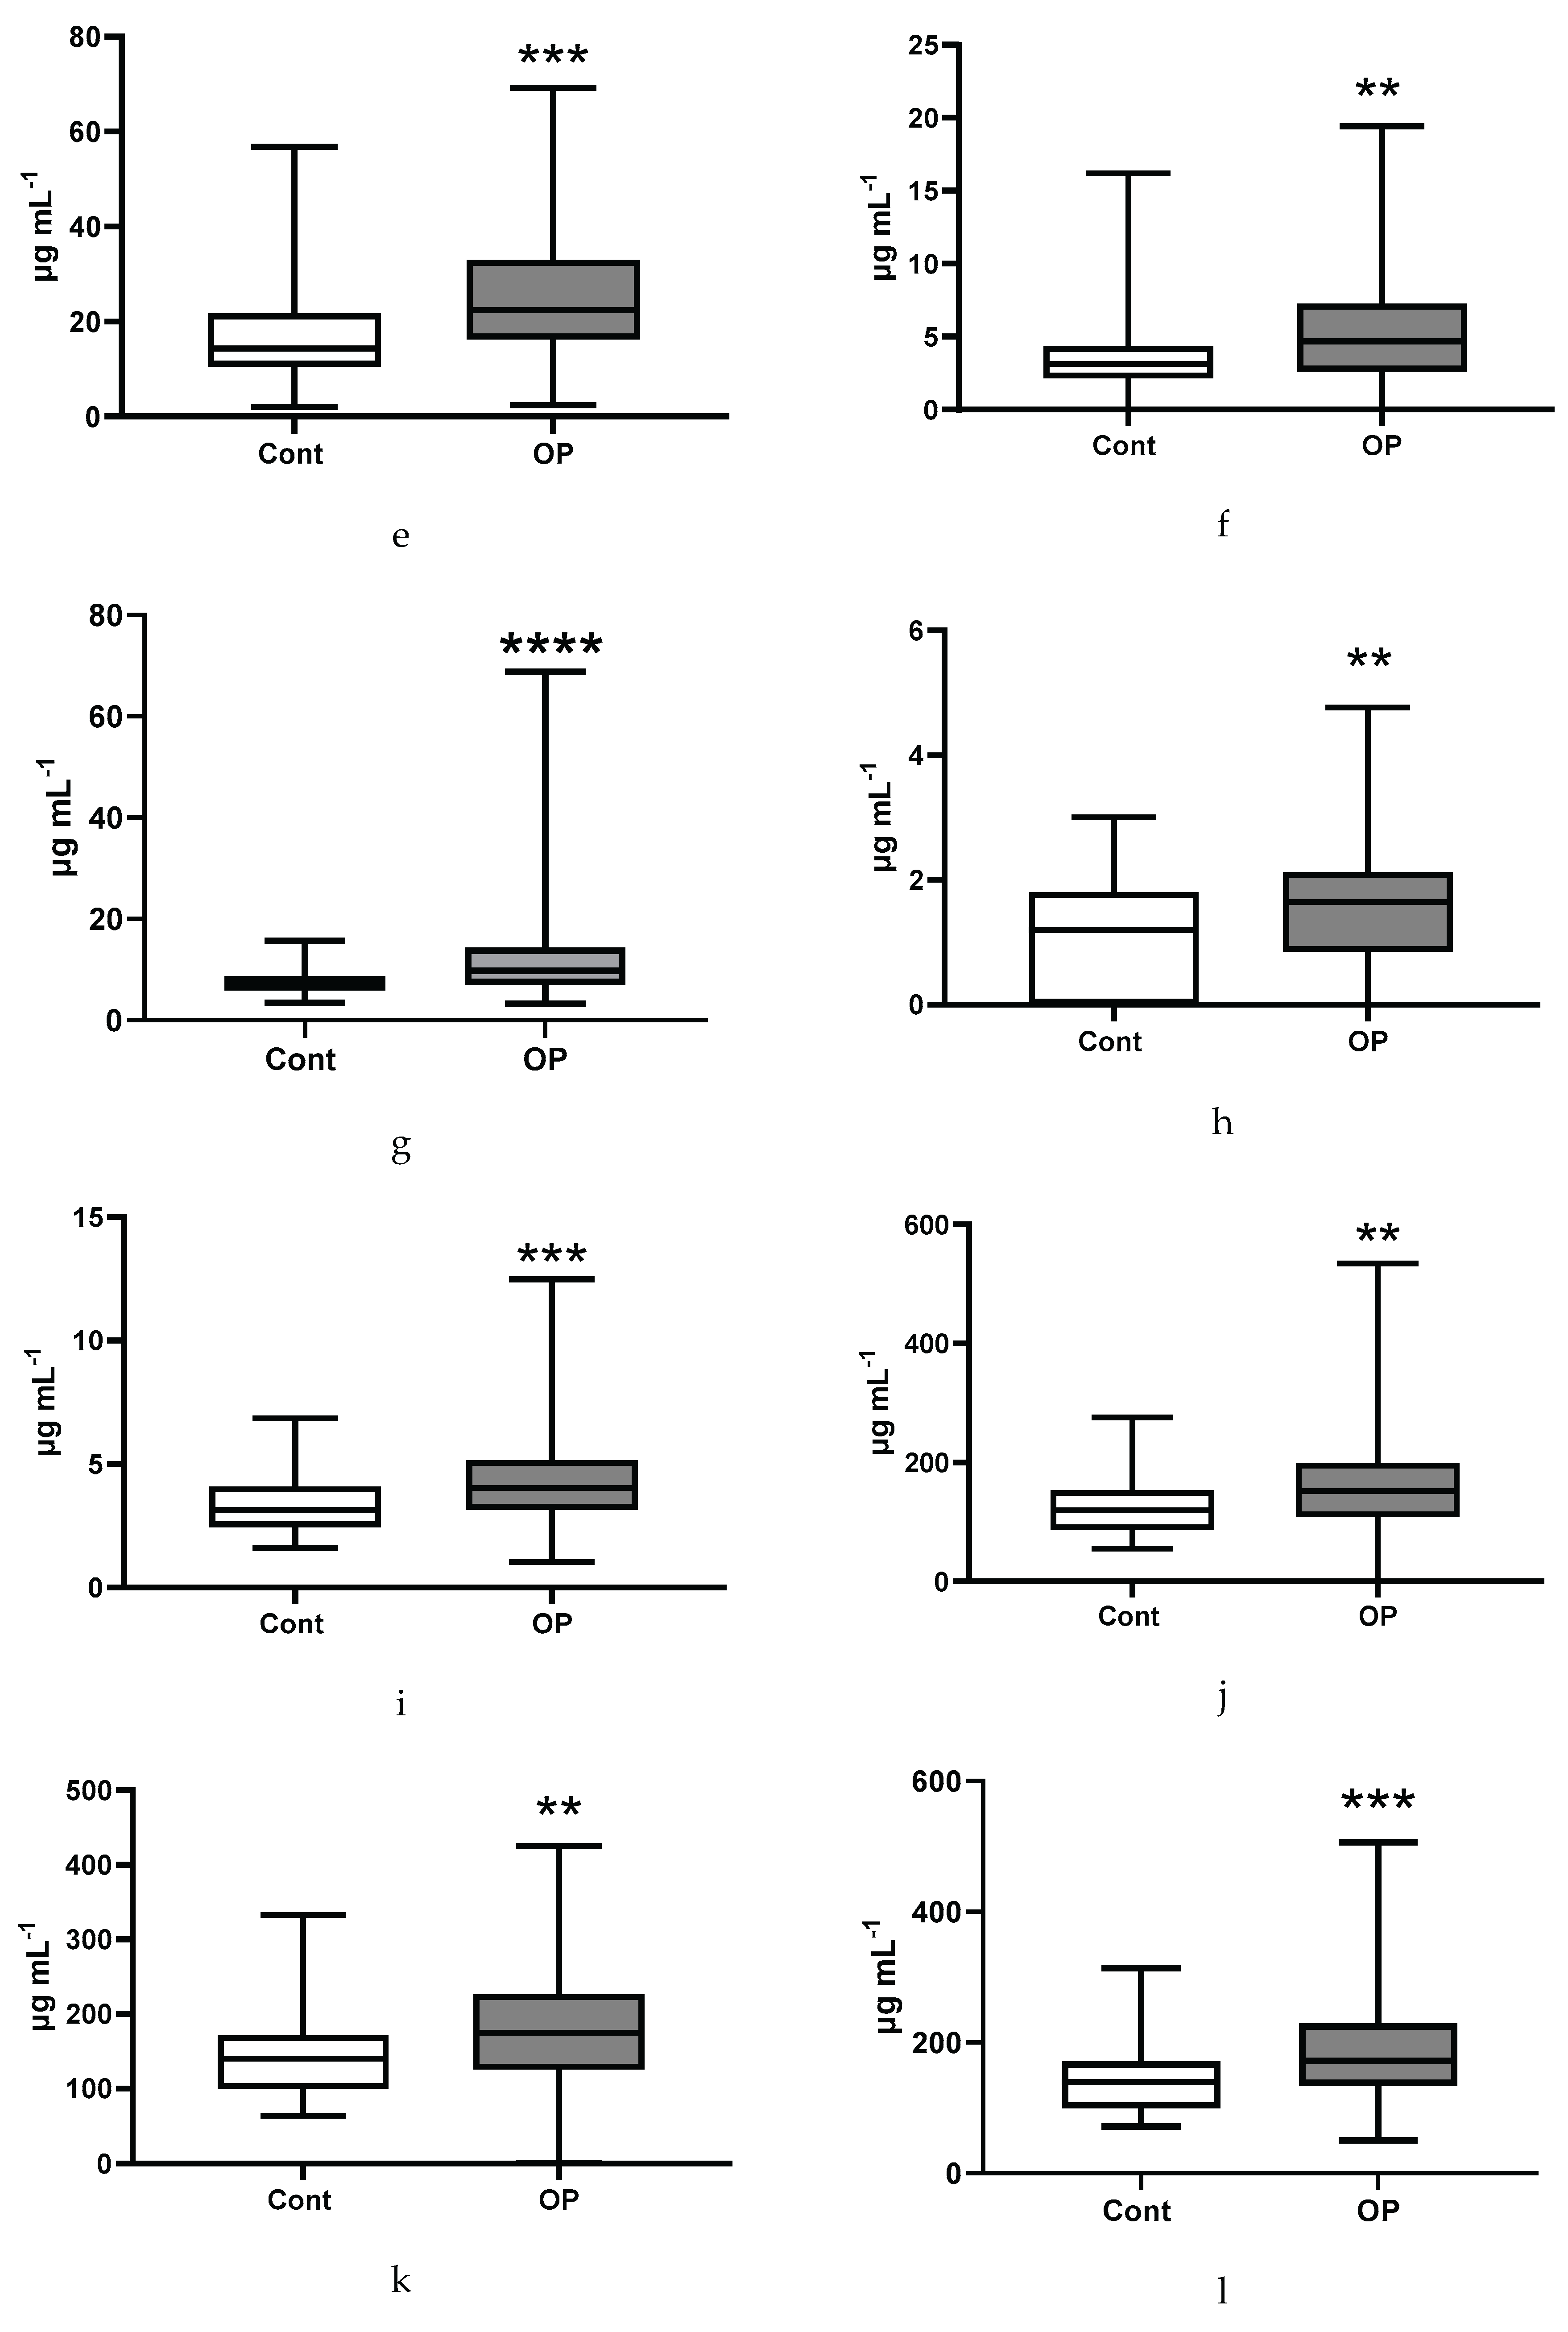
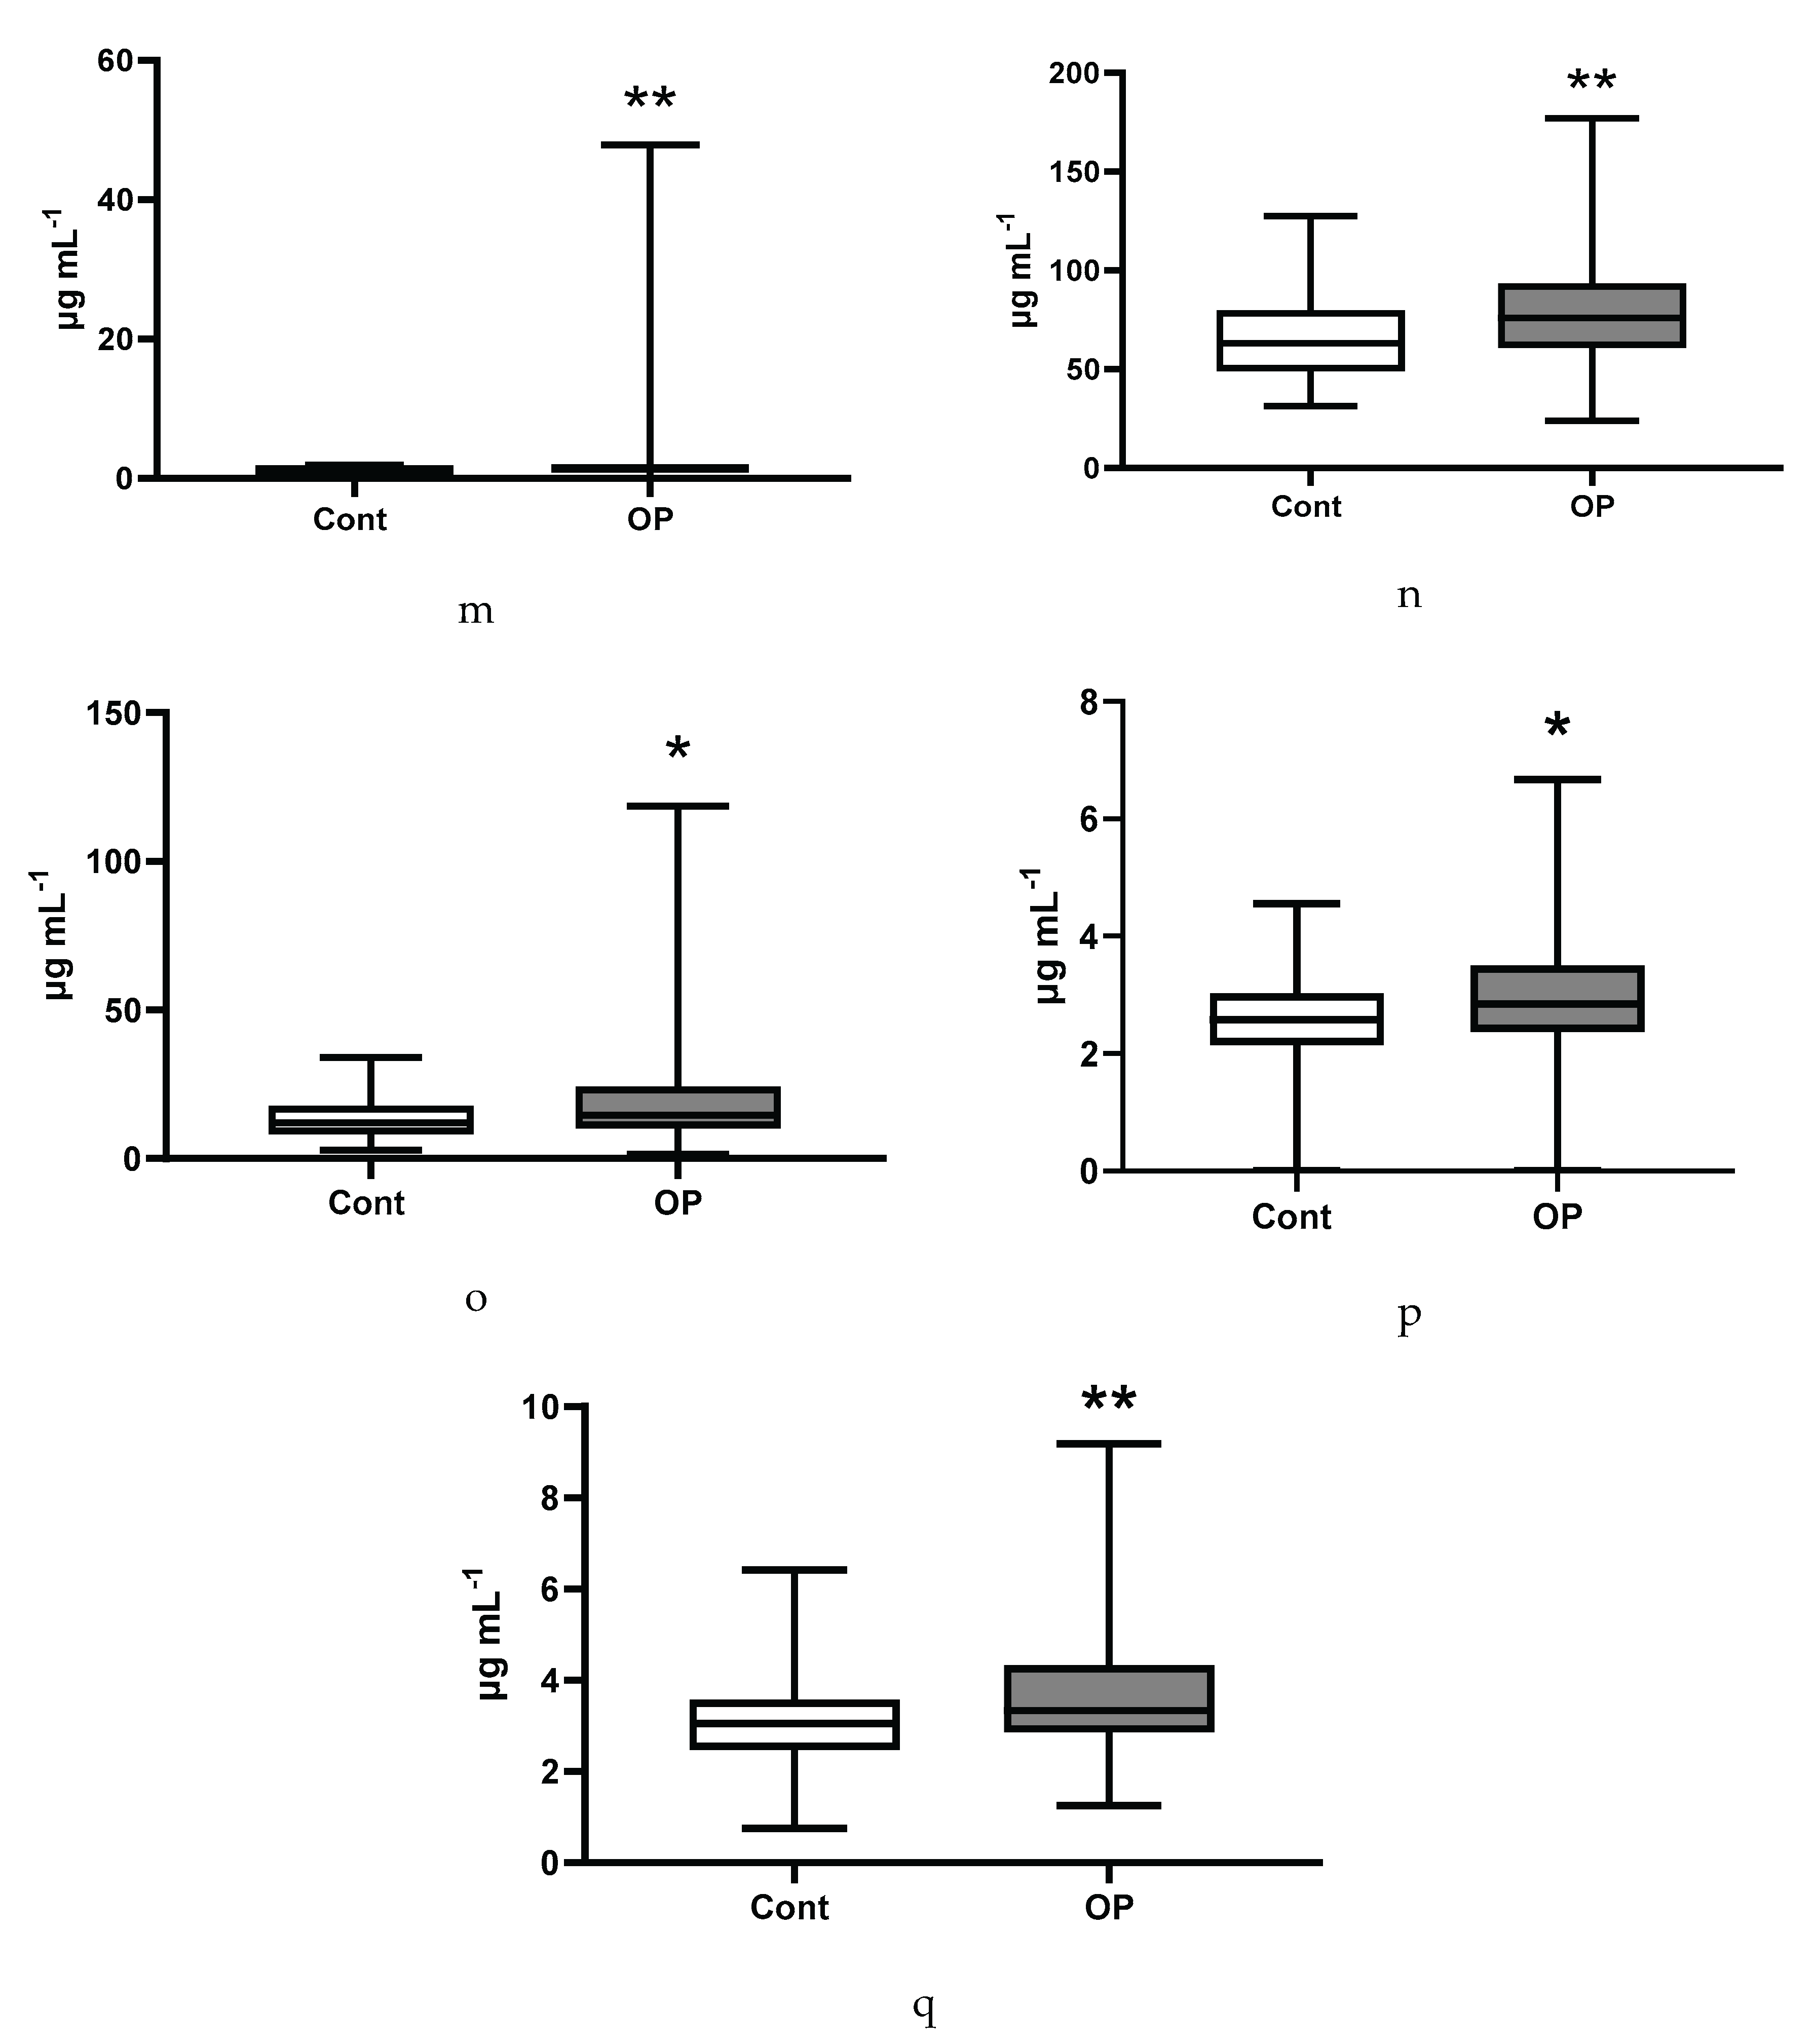
Figure 7.
Esterified major fatty acids (a), non-esterified major fatty acids (b), esterified submajor fatty acids (c), non-esterified submajor fatty acids (d), esterified ultra-long-chain fatty acids (e), non-esterified ultra-long-chain fatty acids (f), esterified unsaturated fatty acids (g), non-esterified unsaturated fatty acids (h), non-esterified minor fatty acids (i), non-esterified long-chain fatty acids (j), non-esterified saturated fatty acids (k).
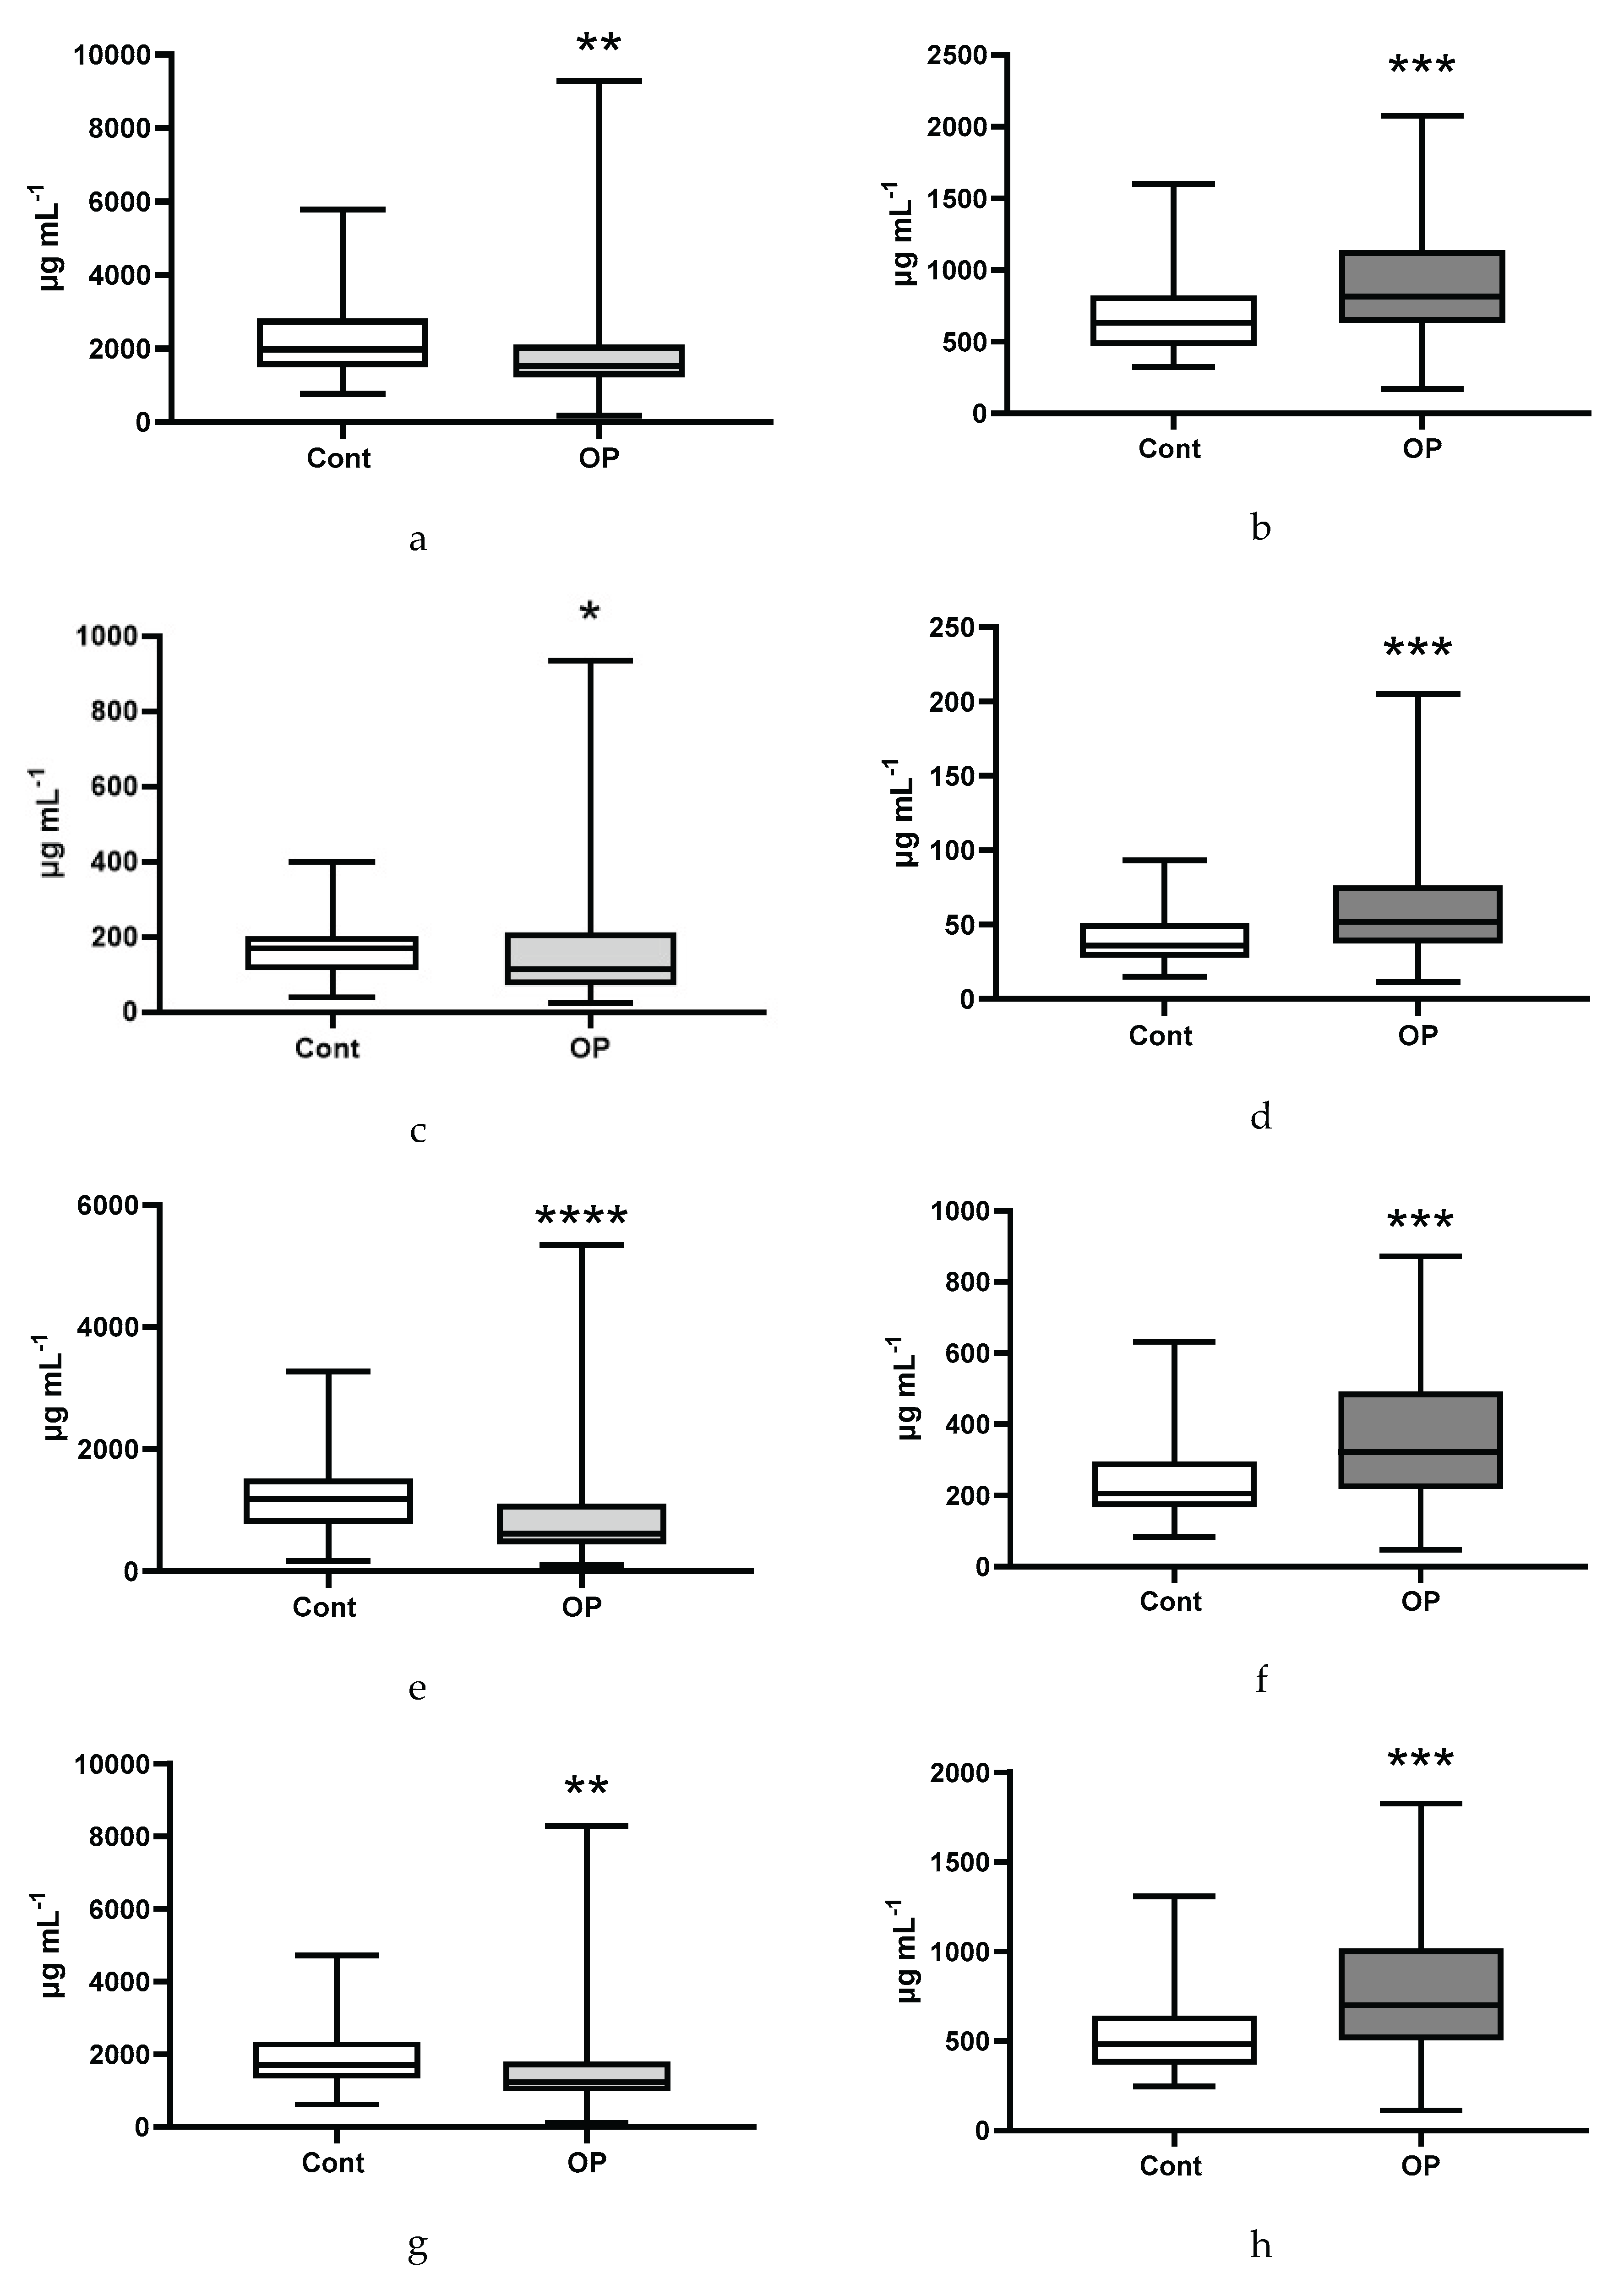
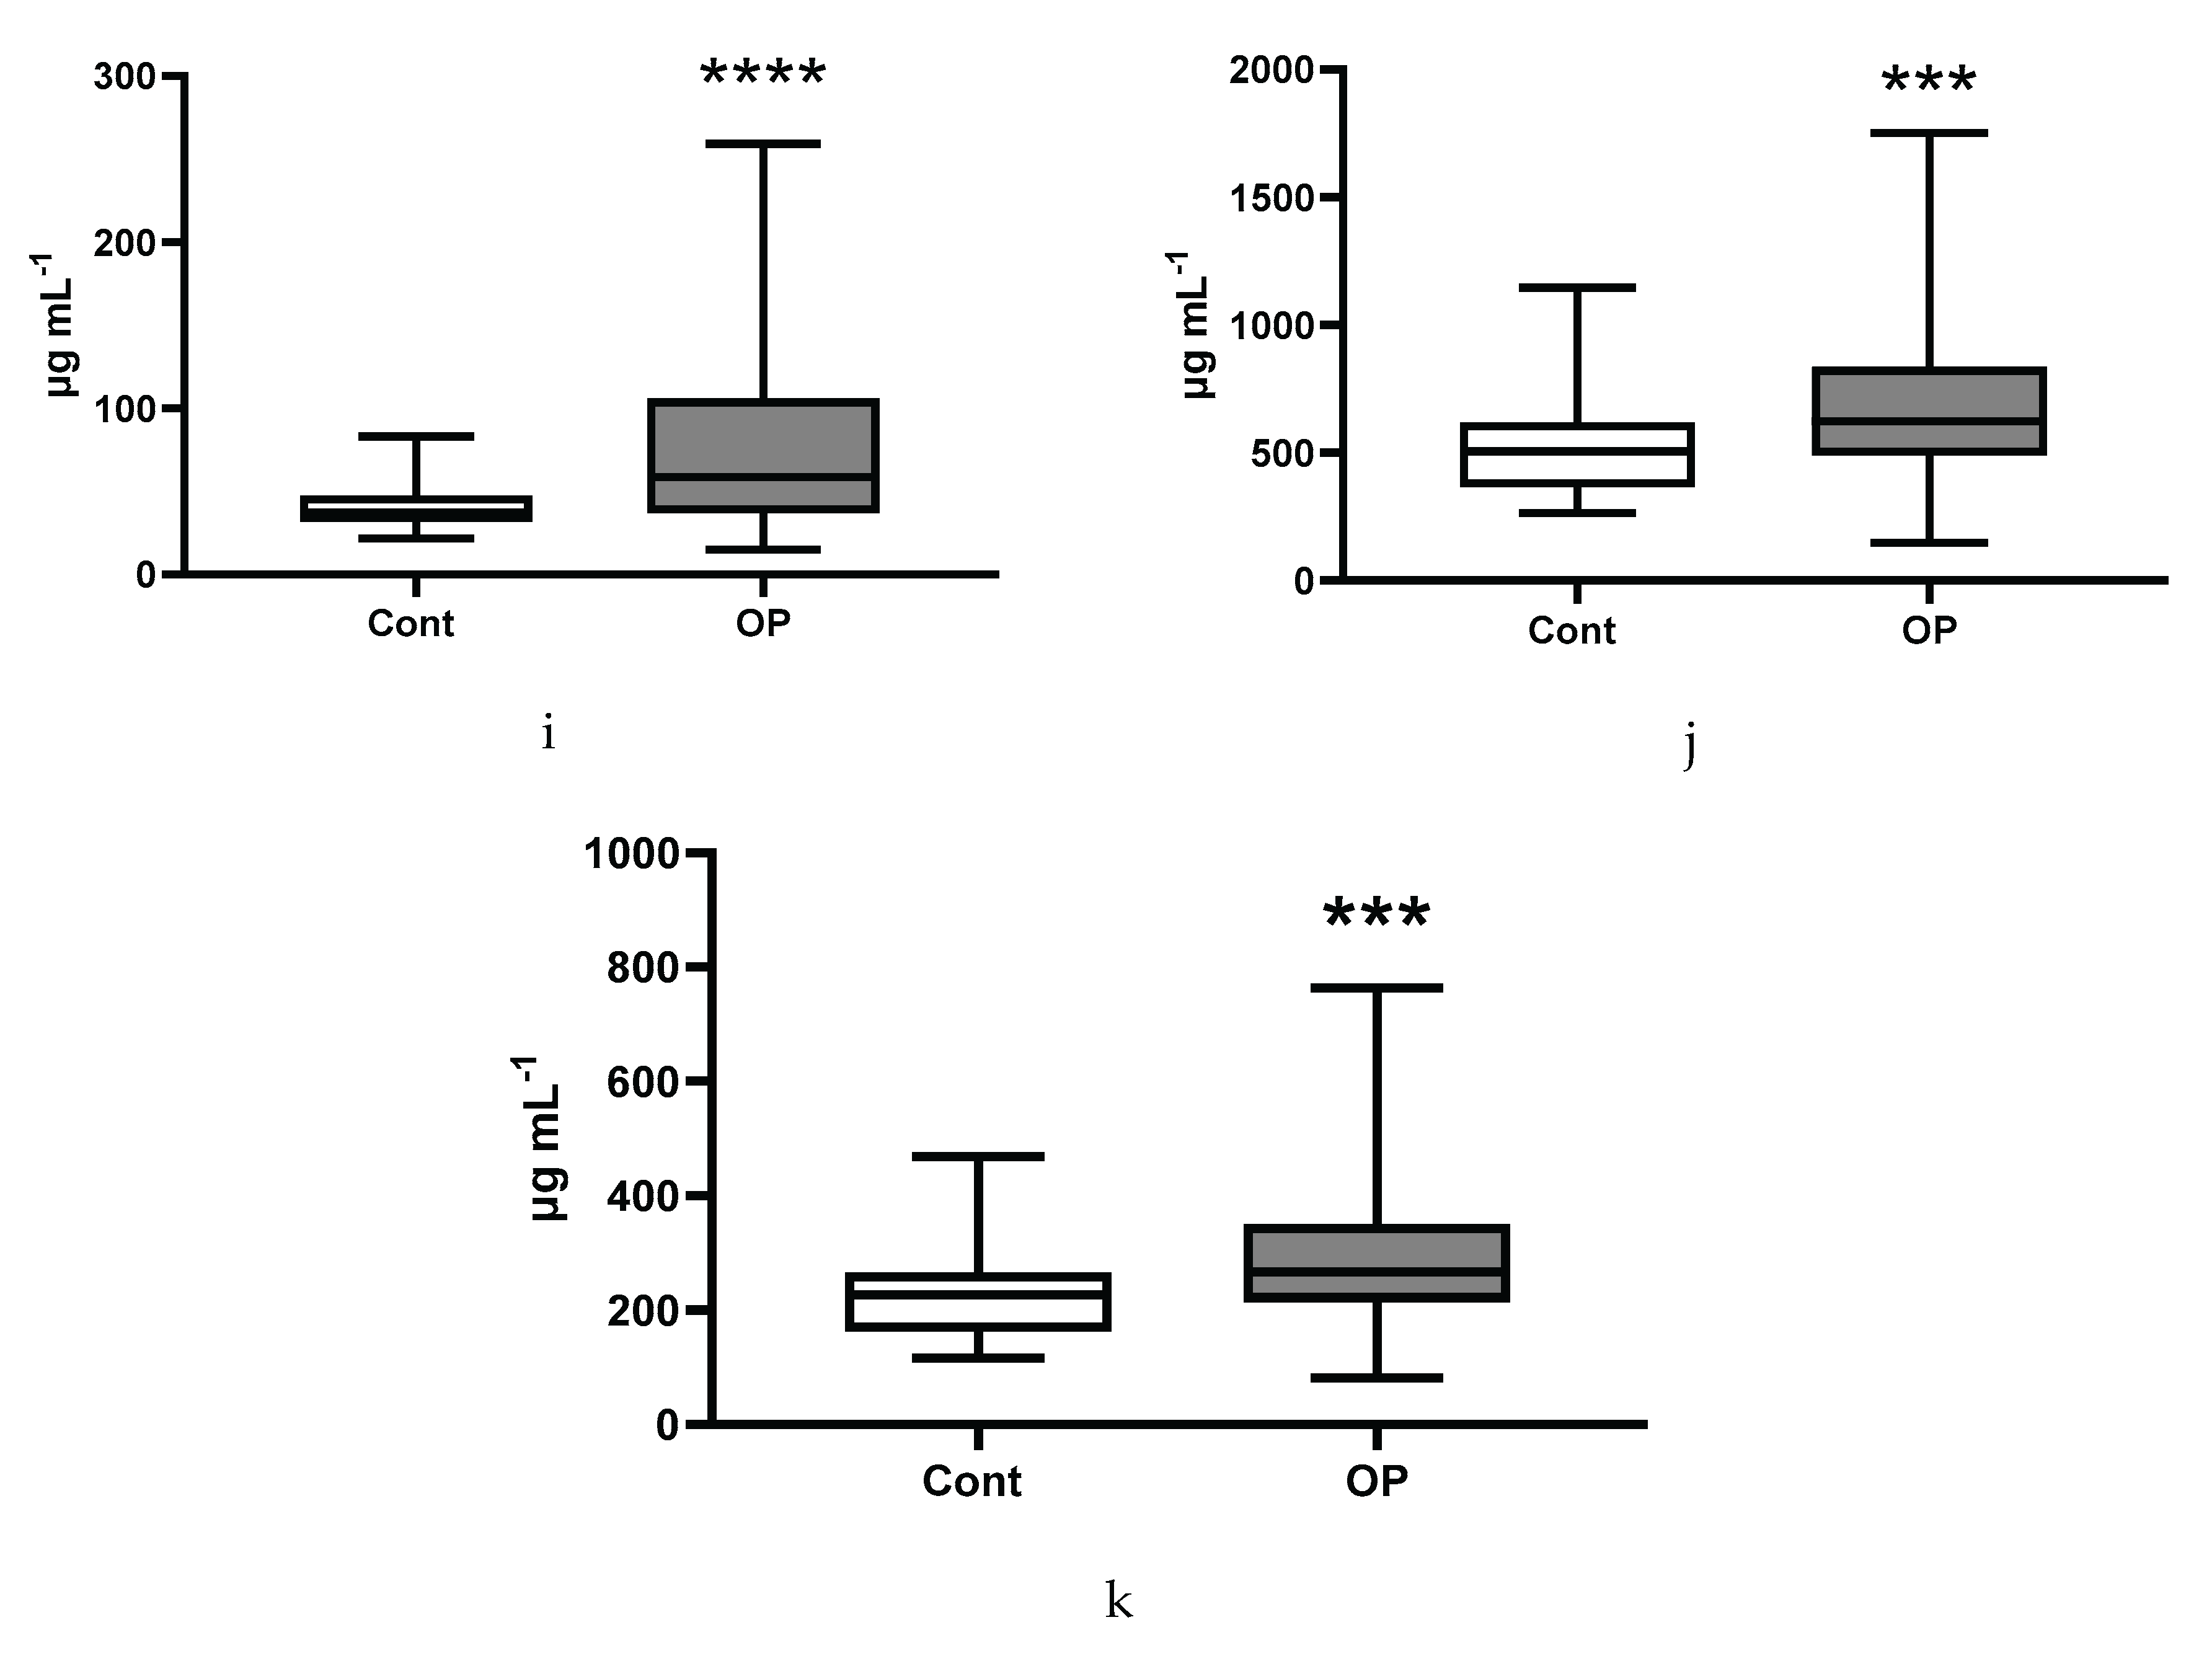
Figure 8.
Ratios of omega-3 with other groups of unsaturated fatty acids: esterified n3/n6 (a), non-esterified n3/n6 (b), esterified n3/(n6+n9) (c), non-esterified n3/(n6+n9) (d), esterified n3/others (e), non-esterified n3/others (e).
Figure 8.
Ratios of omega-3 with other groups of unsaturated fatty acids: esterified n3/n6 (a), non-esterified n3/n6 (b), esterified n3/(n6+n9) (c), non-esterified n3/(n6+n9) (d), esterified n3/others (e), non-esterified n3/others (e).
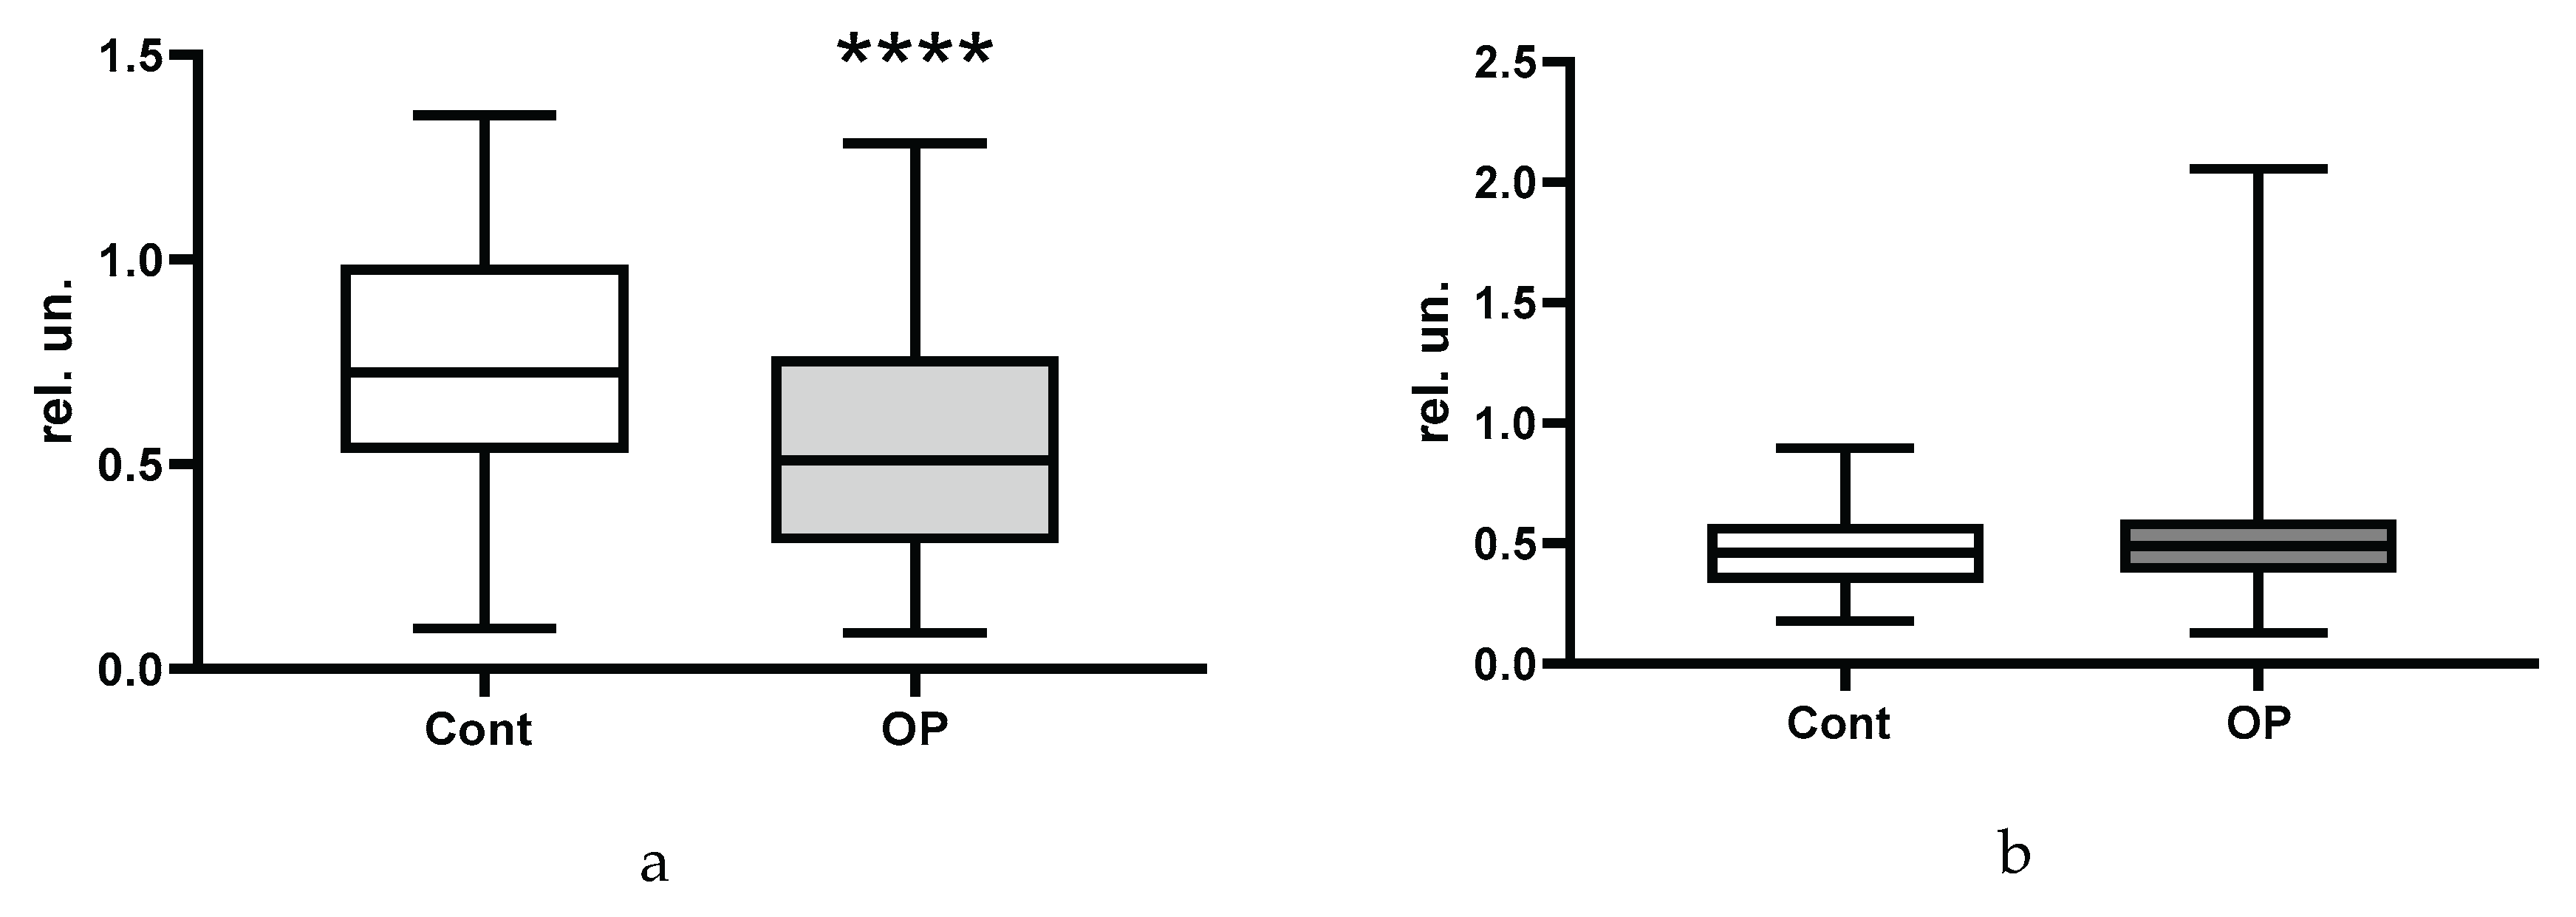
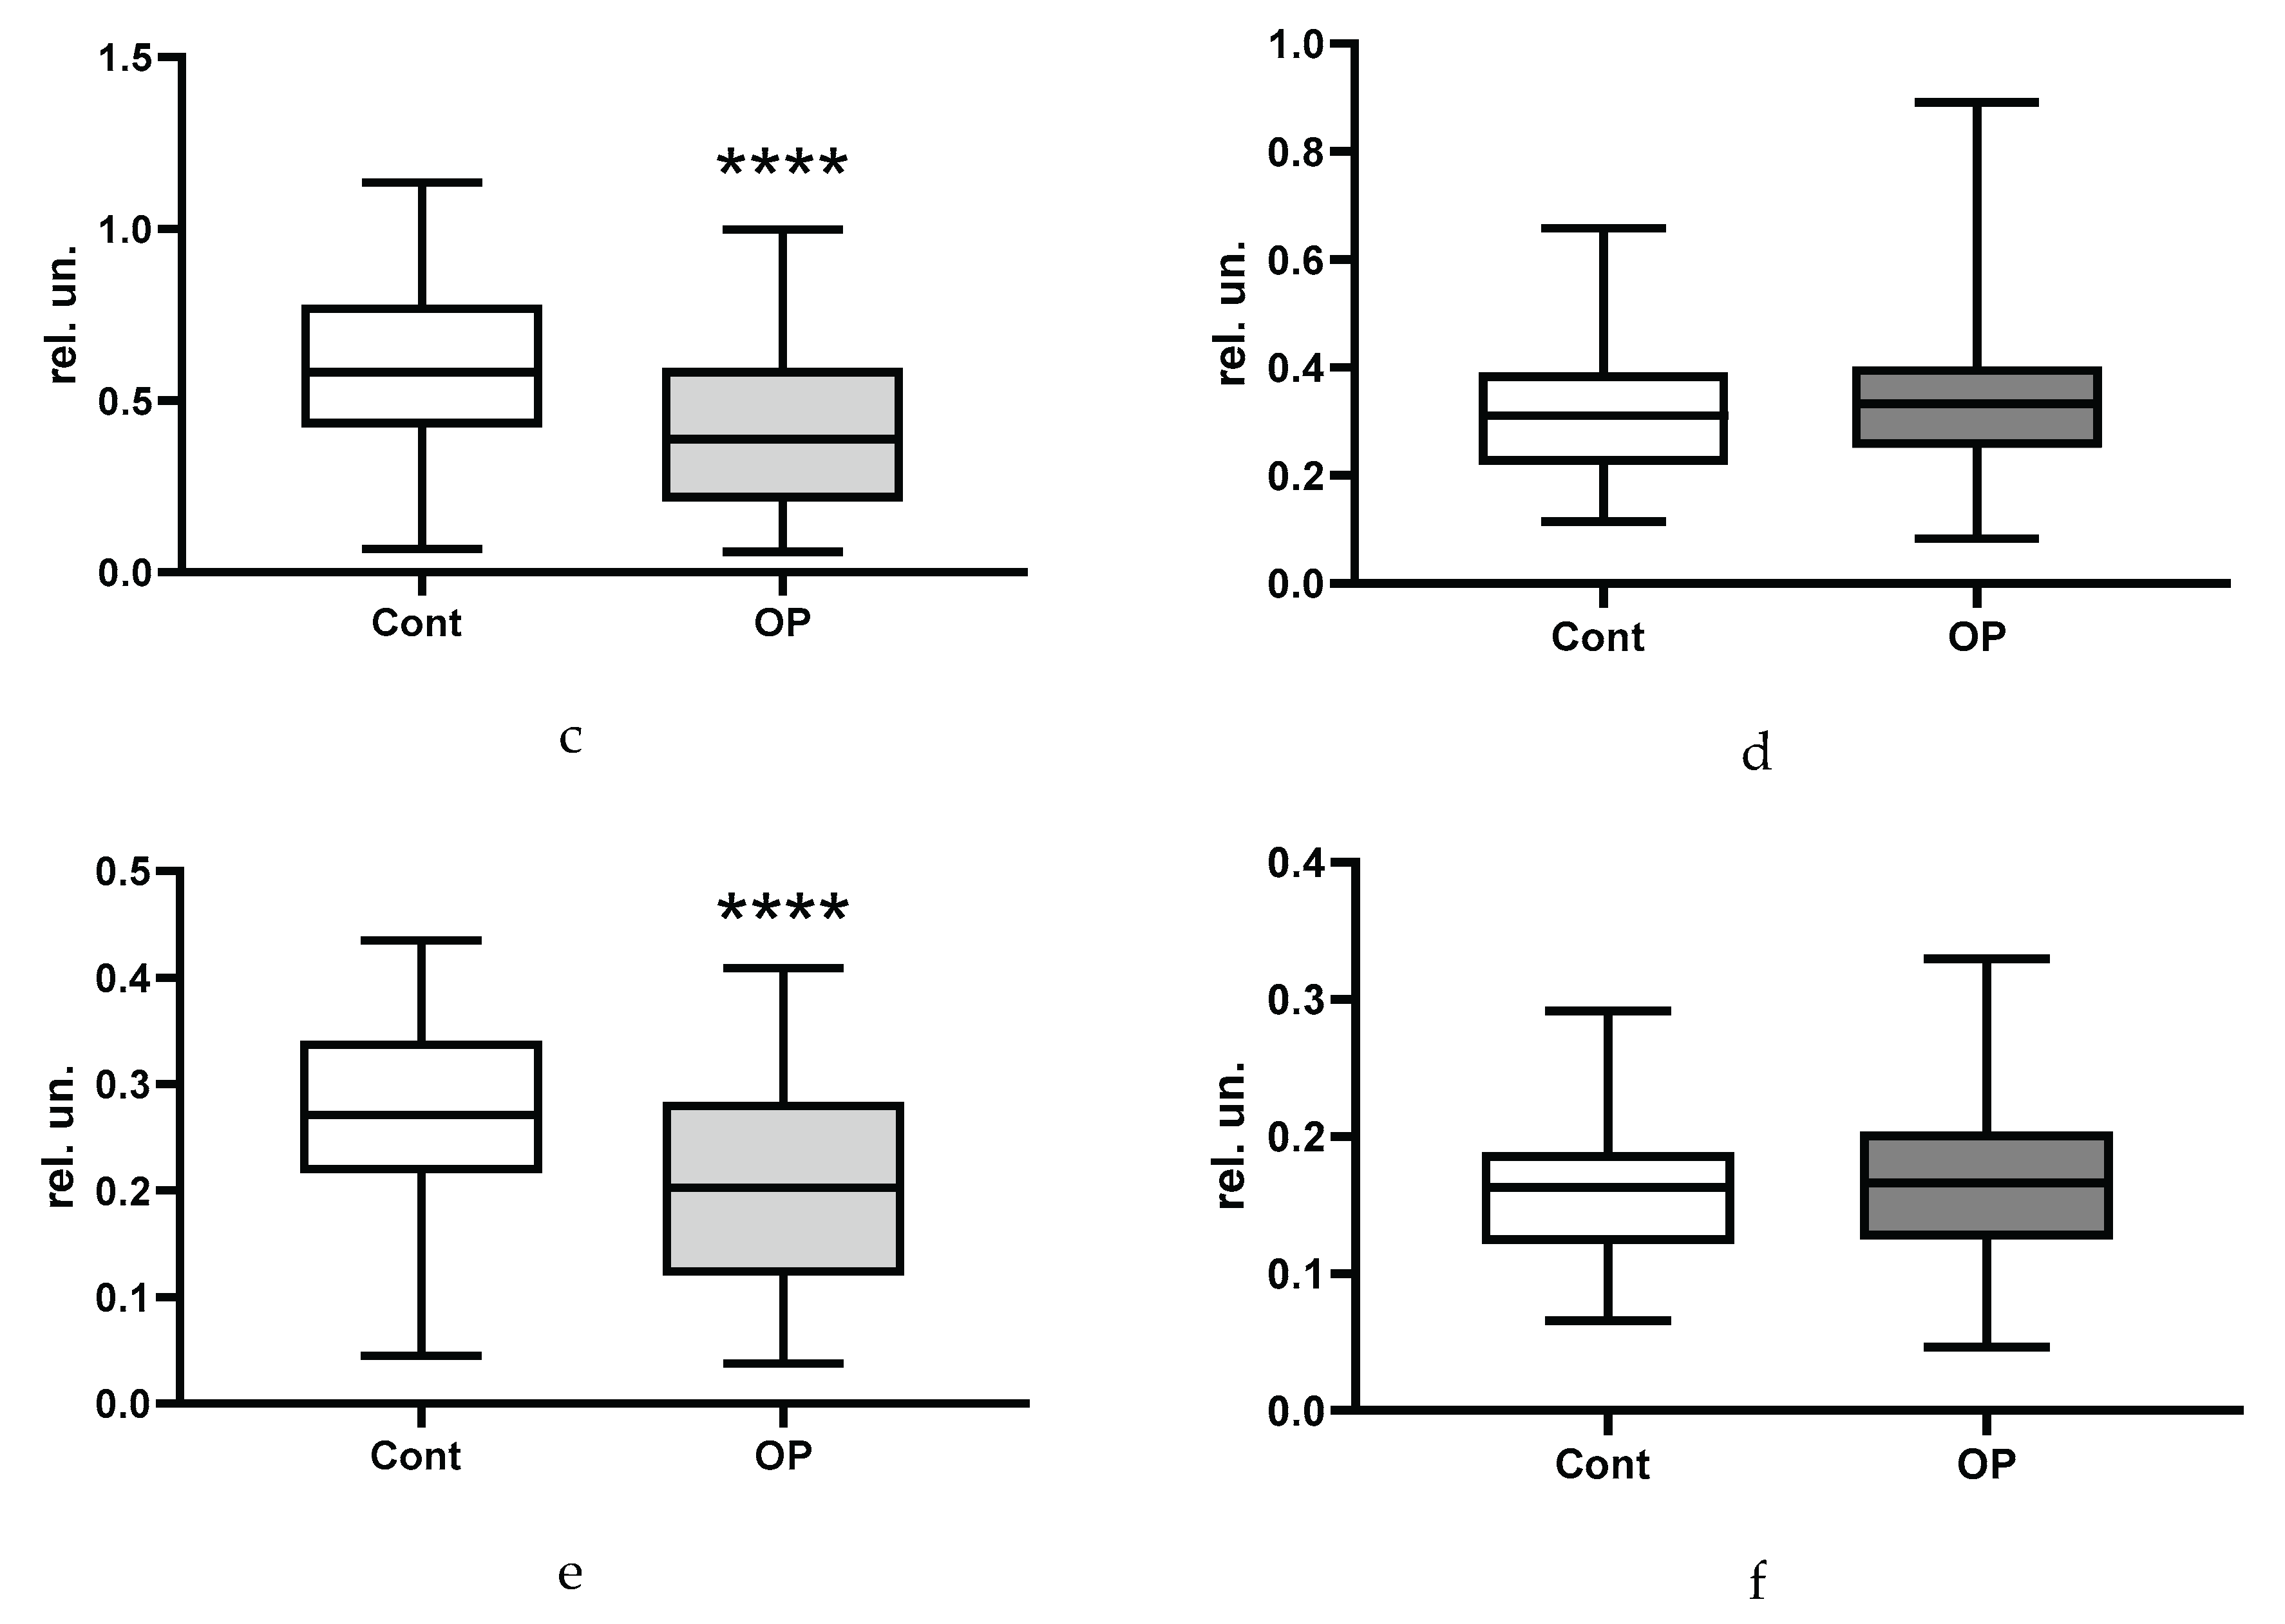
Figure 9.
Correlation matrix of the most reliable indicators (entire array). Notes: E – esterified, NE - non-esterified, Docosahex – docosahexaenoic acid, ultra-long – ultra-long chain fatty acids, 3/(6+9) – (omega 3 FA)/(omega 6 FA + omega 9 FA), 3/all - omega 3 FA / all FA), 2HB – 2-hydroxybutyrate, LDH – lactate dehydrogenase, TAS – total antioxidative status, BMI – body mass index.
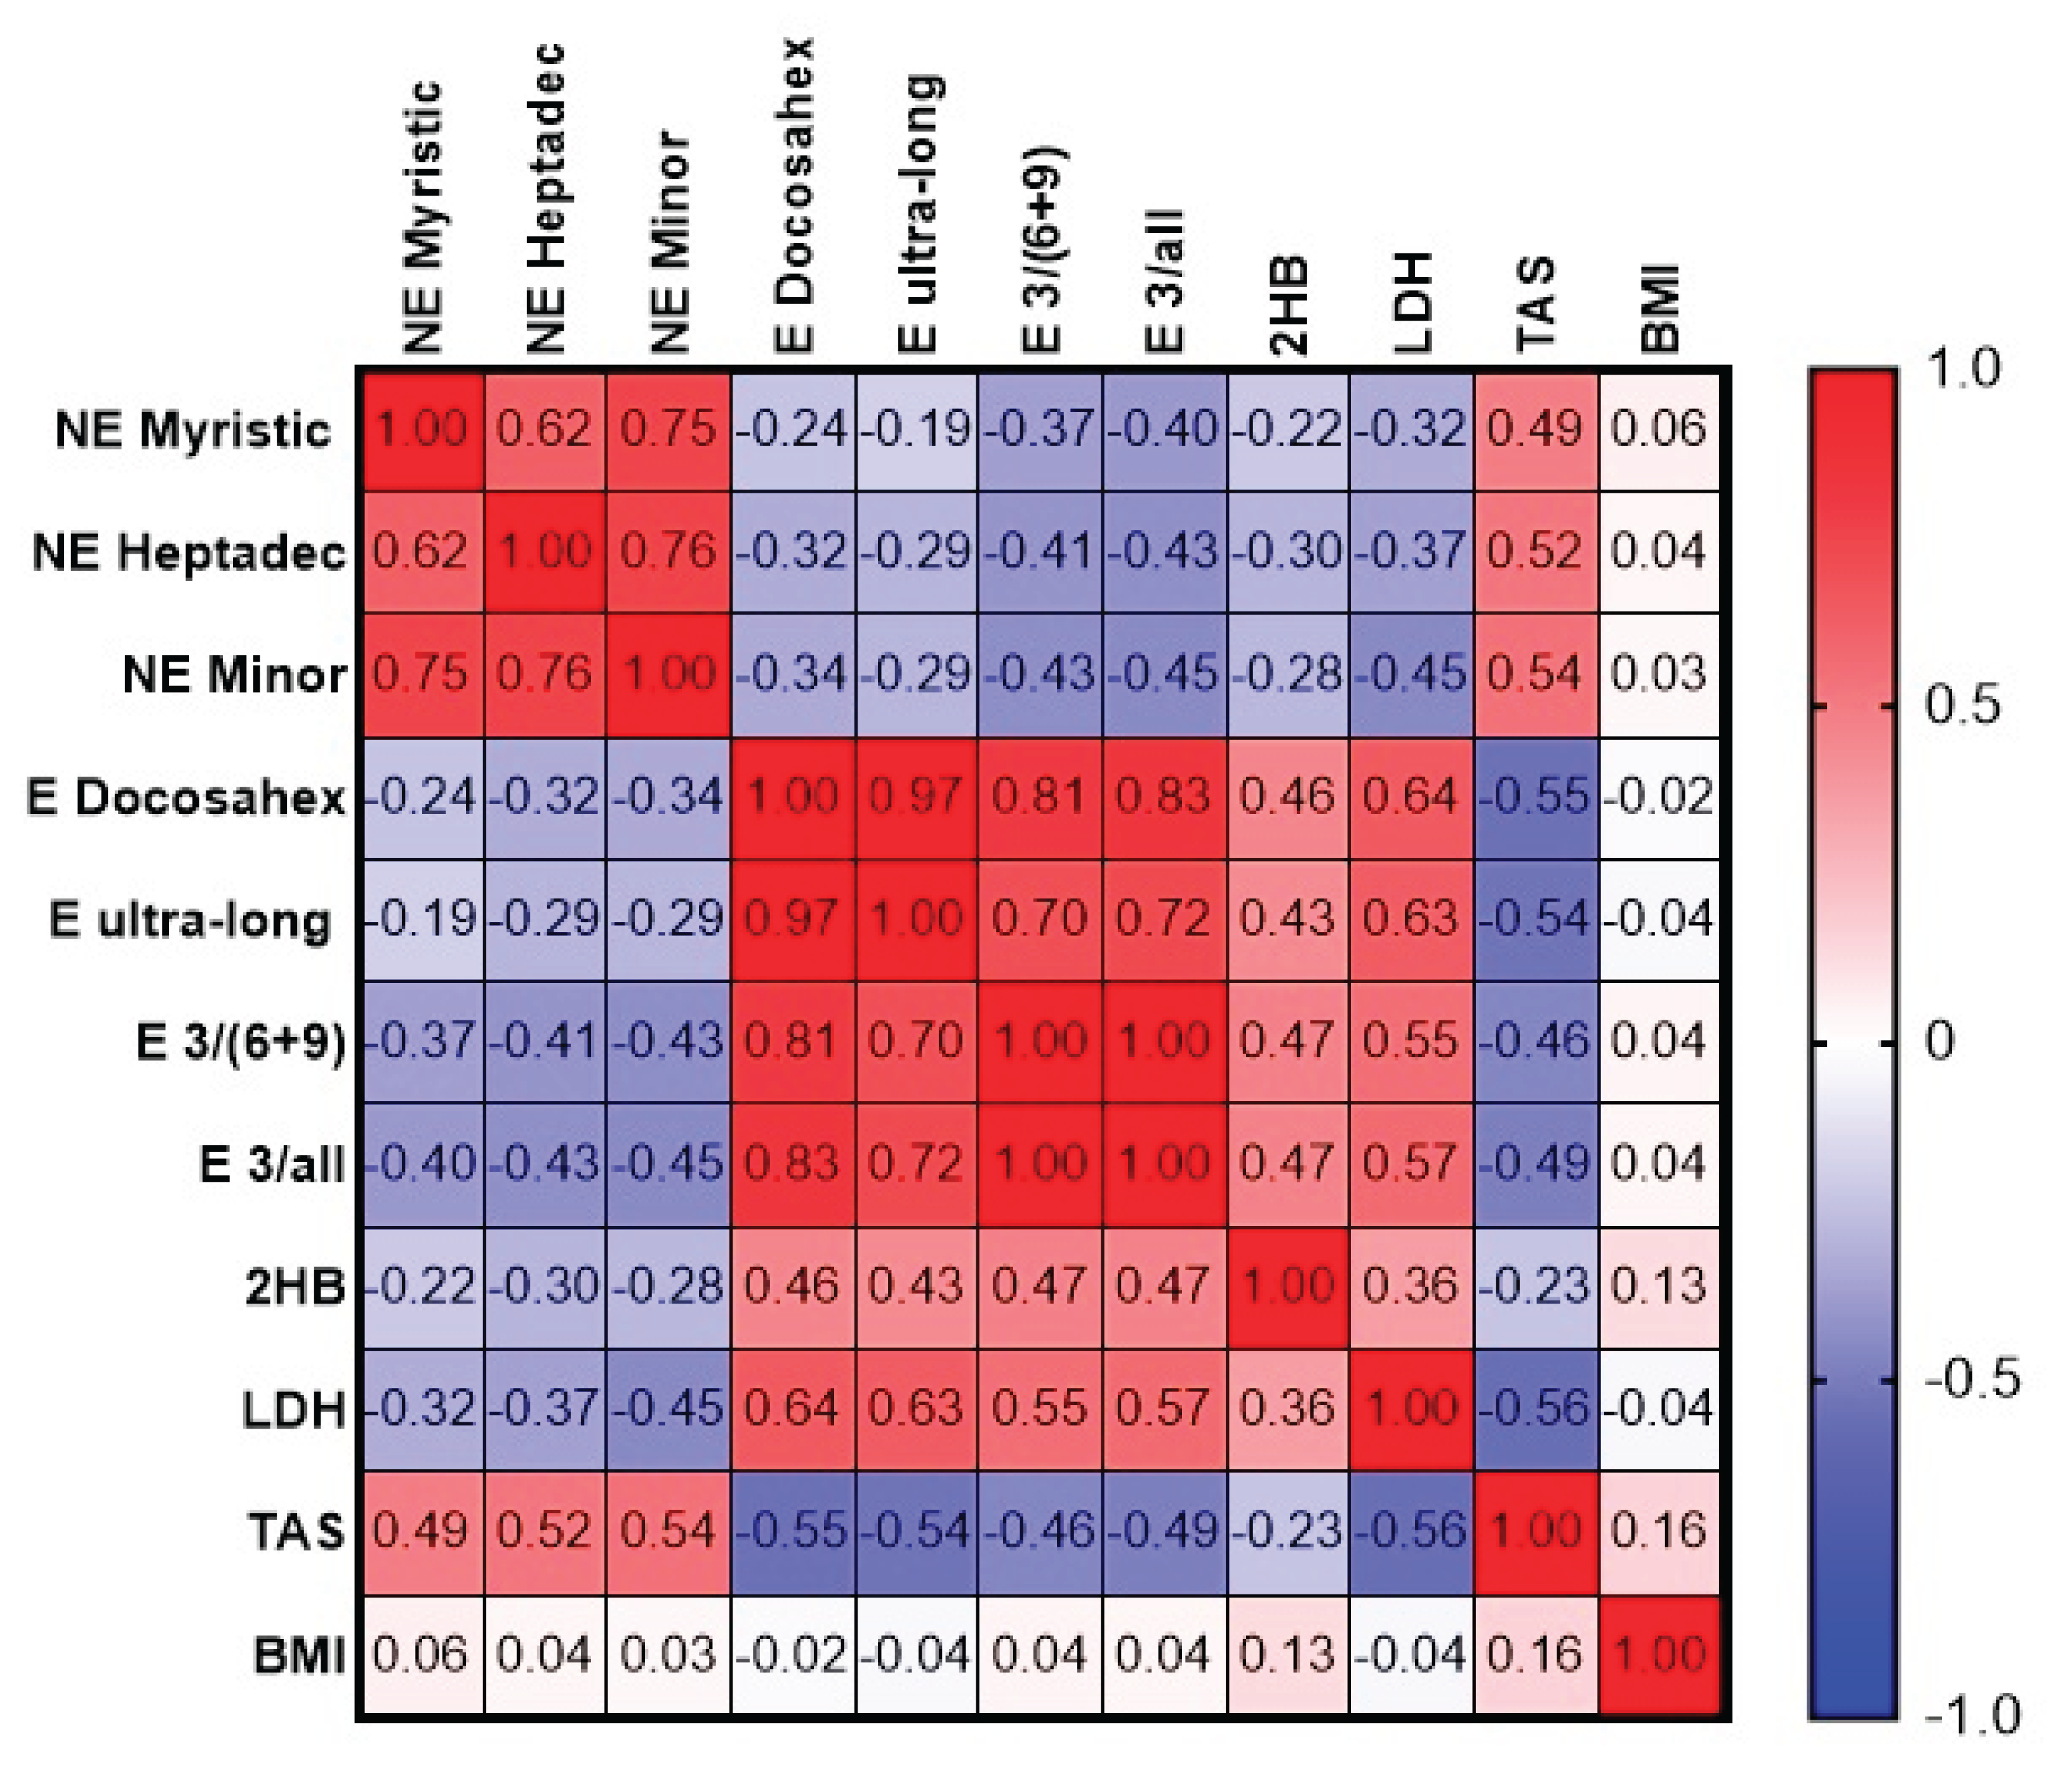
Figure 10.
Correlation matrix of fatty acids showing statistically significant differences between groups. Notes: E – esterified, NE - non-esterified, cis8,11,14Eic - cis-8,11,14-Eicosatrienoic, Docosahex – docosahexaenoic acid, Arachid – arachidonic, Eicosadi – eicosadienoic, Eicosatri – eicosatrienoic/.
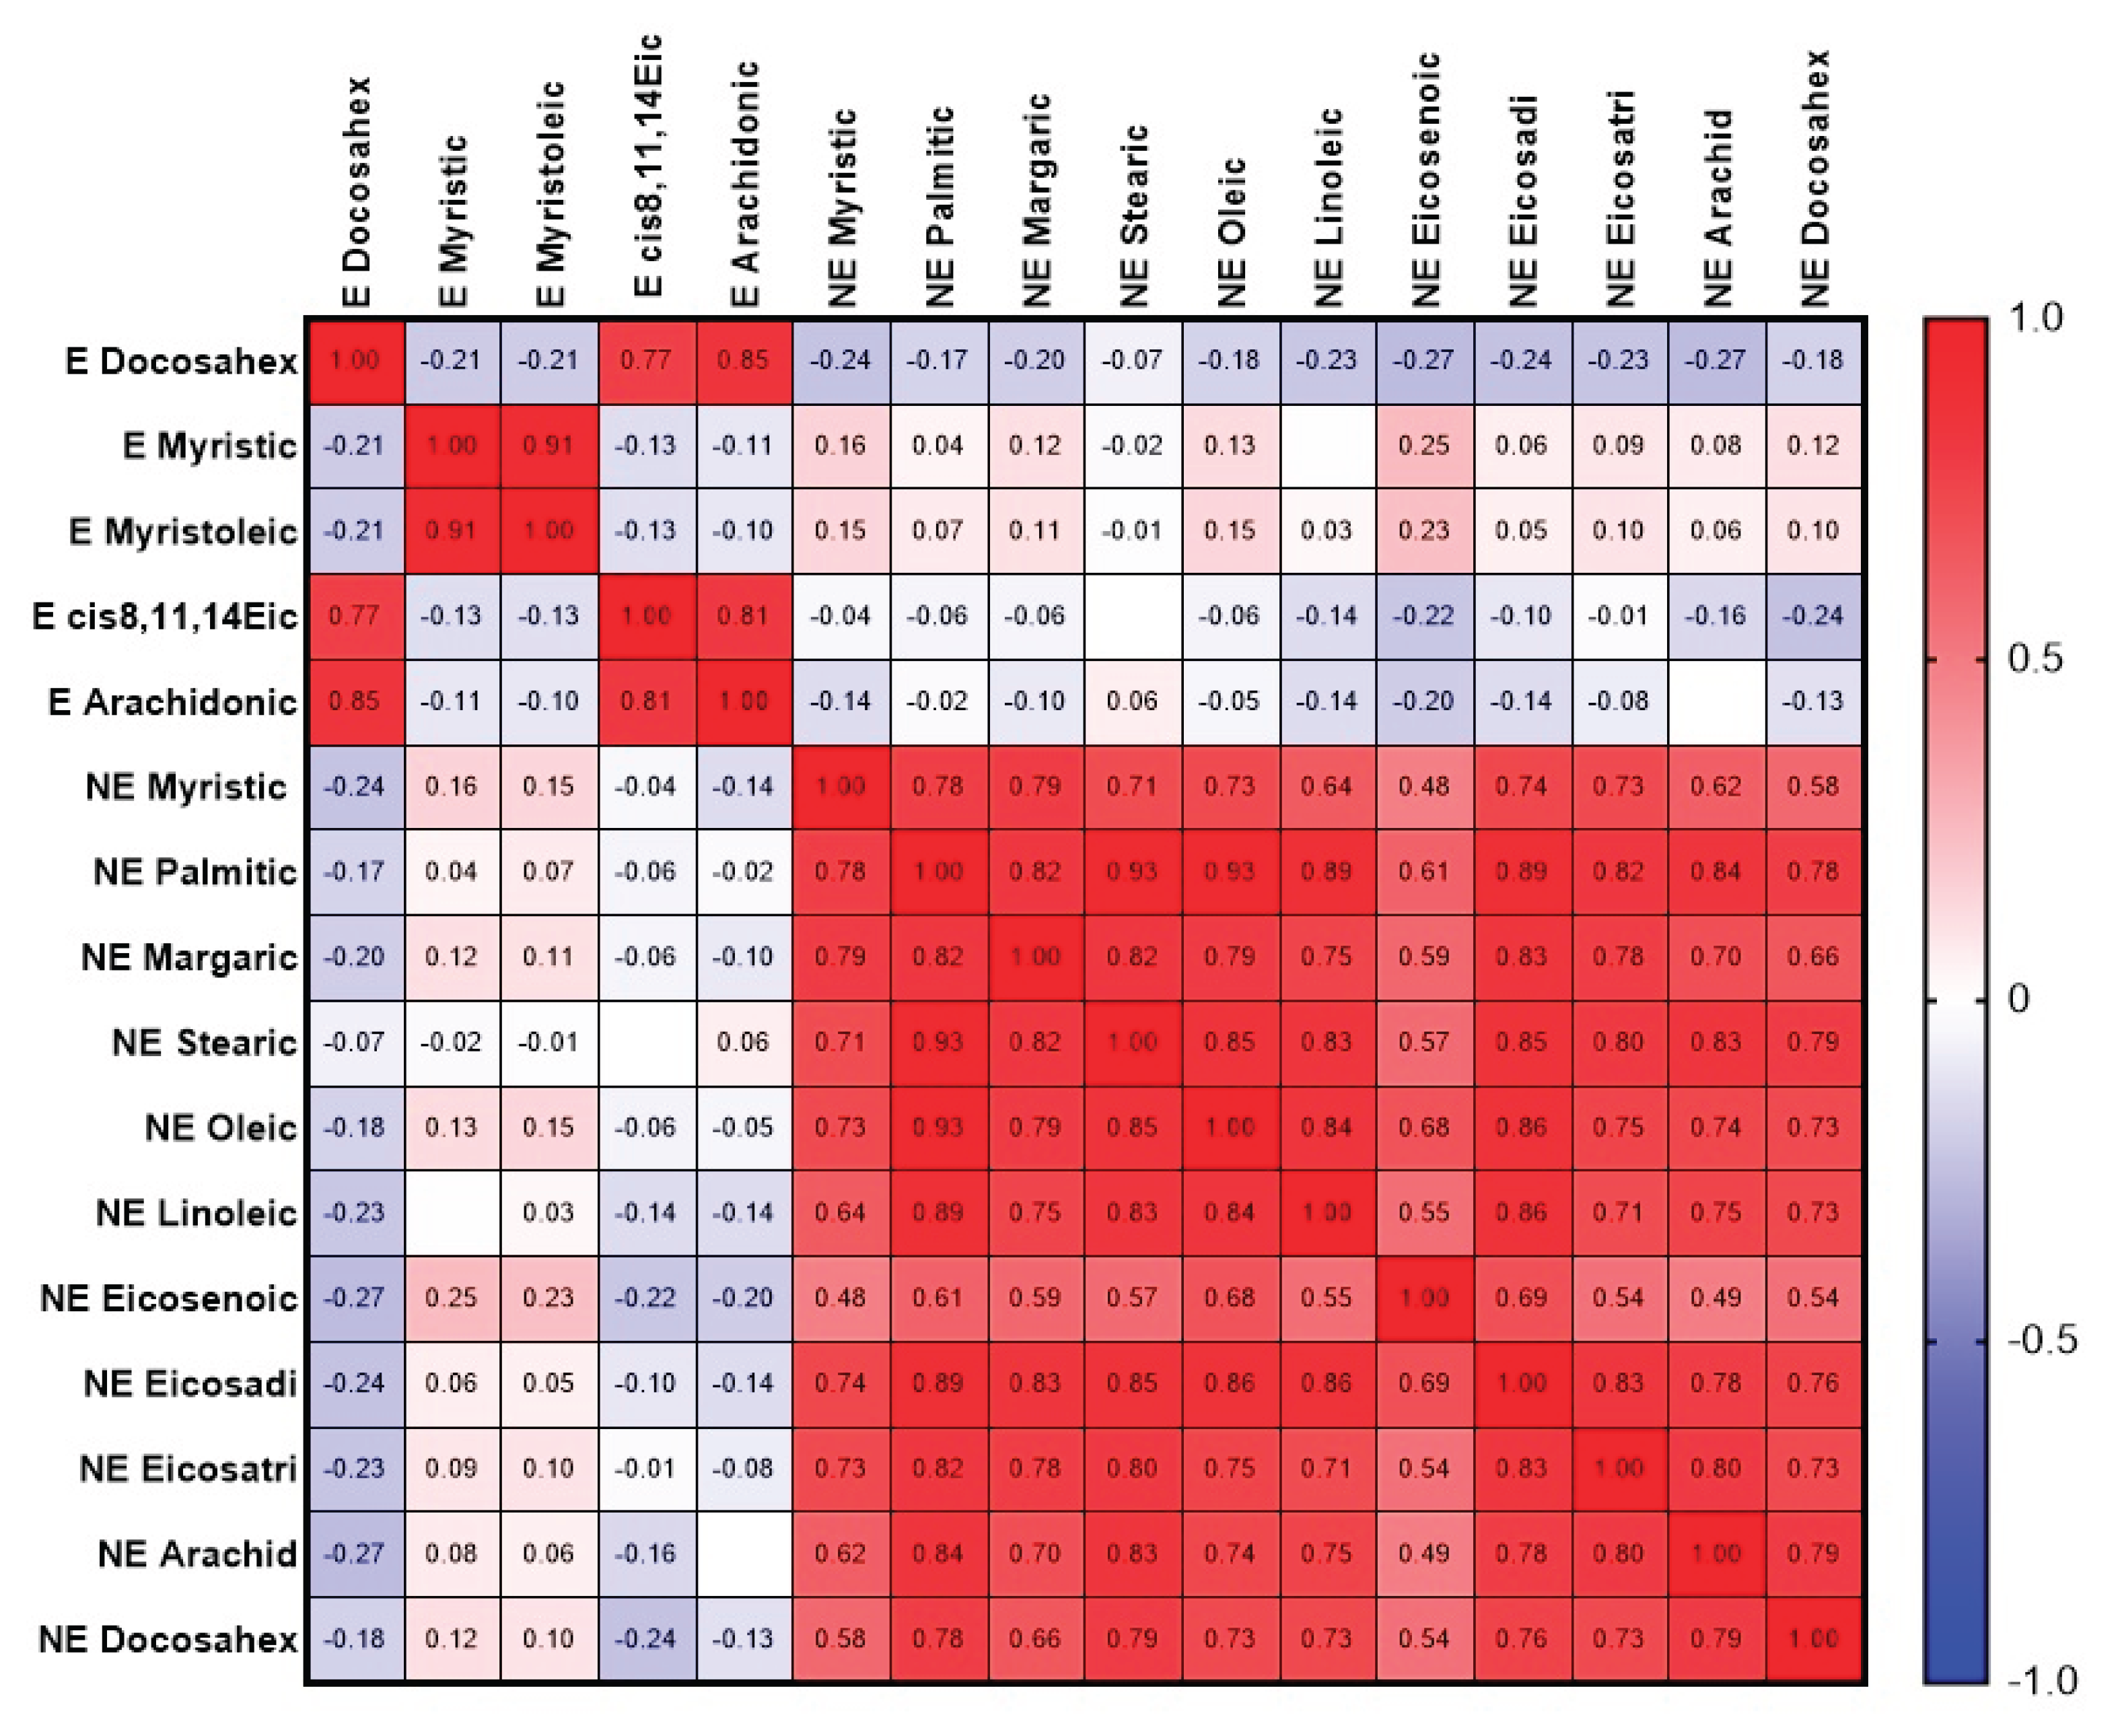

Table 1.
Characteristics of the sample of respondents. BMI is presented as the mean and standard deviation; age and drug load - median, interquartile range and range from minimum to maximum; % - the proportion of the discussed feature in the sample under consideration.
Table 1.
Characteristics of the sample of respondents. BMI is presented as the mean and standard deviation; age and drug load - median, interquartile range and range from minimum to maximum; % - the proportion of the discussed feature in the sample under consideration.
| Control | ОР | |
|---|---|---|
| Socio-demographic data | ||
| Number of people examined | 59 | 84 |
| Men, n (%) | 17 (29) | 24 (29) |
| Women, n (%) | 42 (71) | 60 (71) |
| Age, m±SD | 73±4 | 74±4 |
| BMI, m±SD | 28.4±4.1 | 30.0±4.6 * |
| BMI within normal range (18.5-25), n (%) | 13 (22.0) | 13 (16.1) |
| Overweight (BMI 25-30), n (%) | 27 (45.8) | 28 (34.5) |
| Obesity grade 1 (BMI 30-35), n (%) | 14 (23.7) | 29 (35.8) |
| Obesity grade 2 (BMI 35-40), n (%) | 4 (6.8) | 9 (11.1) |
| Obesity grade 3, n (%) (BMI 40 and more) |
1 (1.7) | 2 (2.5) |
| Proportion of smokers, n (%) | 2 (3.4) | 12 (14.6) * |
| Education (higher), n (%) | 8 (14.5) | 8 (10.4) |
| Education (secondary specialized), n (%) | 33 (60.0) | 56 (72.7) |
| Education (secondary), n (%) | 14 (25.5) | 13 (16.9) |
| Drug load | 4 (3; 5) 0-20 |
5 (3; 8) *** 2-12 |
| Diseases | ||
| Ischemic heart disease, n (%) | 20 (34) | 38 (46) |
| Hypertention, n (%) | 55 (95) | 75 (91) |
| Gastrointestinal diseases, n (%) including hepatitis, n (%) |
19 (32) 4 (7) |
45 (54) * 27 (33) *** |
| Diabetes mellitus, n (%) | 10 (17) | 19 (23) |
| Oncological diseases, n (%) | 3 (5) | 4 (5) |
| Musculoskeletal system diseases, n (%) | 54 (92) | 78 (95) |
| Acute cerebrovascular accident or chronic cerebrovascular disease cerebrovascular disease, n (%) | 54 (92) | 78 (95) |
| Total with diagnosis of polyneuropathy, including diabetes mellitus, n (%) |
39 (66) | 71 (87) ** |
| 8 (21) | 16 (23) | |
| Polyneuropathy of the upper and lower extremities, n (%) | 7 (12) | 24 (29) * |
*, **, *** - differences from control are statistically significant (p<0.05, p<0.01, p<0.001.
Table 2.
Self-assessment of cognitive impairment of subjects.
| Response | Control | OP | |
|---|---|---|---|
| Self-assessment of memory and thinking problems, n (%) | Yes | 23 (41.8) | 45 (56.2) |
| Sometimes | 25 (45.5) | 31 (38.8) | |
| No | 7 (12.7) | 4 (5.0) | |
| Self-assessment of balance problems, n (%) | Yes | 38 (69) | 66 (84) * |
| No | 17 (31) | 13 (16) | |
| Self-assessment of feelings of anxiety, melancholy, depression, n (%) | Yes | 24 (43.6) | 45 (56.3) |
| Sometimes | 25 (43.6) | 25 (31.2) | |
| No | 7 (12.8) | 10 (12.5) | |
| Self-assessment of personality change, n (%) | Yes | 28 (50.9) | 39 (48.8) |
| No | 2 (3.6) | 8 (10.0) | |
| Do not know | 25 (45.5) | 33 (41.2) | |
| Self-assessment of difficulty in performing daily activities, n (%) | Yes | 27 (49) | 59 (75) ** |
| No | 28 (51) | 20 (25) | |
| Data after grouping | |||
| There are problems with memory and thinking, n (%) | 48 (87) | 76 (95) | |
| There is a feeling of anxiety, melancholy and depression, n (%) | 48 (87) | 70 (87) | |
| There are personality changes, n (%) | 28 (53) | 39 (54) | |
*, **, - differences from control are statistically significant (p<0.05, p<0.01).
Table 3.
Test results.
| Control | OP | |
|---|---|---|
| MMSE | 27 (26; 28) 21-30 |
27 (26; 28) 13-31 |
| SAGE | 16 (12; 18) 6-21 |
16 (12; 18) 5-21 |
| “Clock” test | 9 (8; 10) 4-10 |
8 (7; 9) 4-10 |
| Total score for three tests | 51 (47; 54) 39-60 |
50 (46; 55) 24-61 |
Table 4.
Assessment of neurological status.
| Control (n=59) | OP (n=82) | |
|---|---|---|
| Subjective symptoms (0 to 9) | 8 (6; 9) 1-9 |
8 (7; 9) * 3-9 |
| Presence of pathological foot reflexes, n (%) | 4 (7) | 6 (7) |
| Presence of pathological wrist reflexes, n (%) | 1 (2) | 10 (12) * |
| Impaired coordination (0 to 3 signs) | 2 (2; 2) 0-3 |
2 (2; 3) 1-3 |
| Cranial changes (0 to 6 signs) | 2 (1; 2) 0-4 |
2 (1; 3) *** 0-5 |
| Vibration sensitivity disorder, n (%) | 47 (80) | 77 (94) * |
| Impaired distal sensitivity, n (%) | 33 (56) | 68 (83) *** |
| Depression/absence of abdominal reflexes, n (%) | 39 (66) 15 (25) |
55 (67) 21 (26) |
| Depression/absence of Achilles reflexes, n (%) | 20 (34) 24 (41) |
34 (41) 22 (27) |
| Depression/absence of plantar reflexes, n (%) | 28 (47) 21 (36) |
30 (37) 30 (37) |
| Hypothermia of the extremities, n (%) | 4 (7) | 5 (6) |
| Hyperhidrosis of the extremities, n (%) | 26 (44) | 31 (38) |
*, *** - differences from the control group (Mann-Whitney test) are statistically significant, p<0.05, p<0.001, respectively.
Table 5.
Correlation of albumin activity and the concentration of some free fatty acids. The results are presented as the r coefficient and 95% confidence interval.
Table 5.
Correlation of albumin activity and the concentration of some free fatty acids. The results are presented as the r coefficient and 95% confidence interval.
| Spearman Correlation Coefficient for the Full array, n=104 | Spearman Correlation Coefficient for Controls only, n=36 | Spearman Correlation Coefficient for OP Group only, n=68 | |
|---|---|---|---|
| Palmitic | 0.3842 (0.2014-0.5412) p<0.0001 (****) |
-0.0301 (-0.3639-0.3106) p=0.8617 |
0.4936 (0.2826-0.6590) p<0.0001 (****) |
| Stearic | 0.3488 (0.1619-0.5116) p=0.0003 (***) |
-0.0221 (-0.3569-0.3178) p=0.8984 |
0.4501 (0.2303-0.6261) p=0.0001 (***) |
| Oleic | 0.3281 (0.1390-0.4941) p=0.0003 (***) |
-0.0410 (-0.3733-0.3007) p=0.8124 |
0.4391 (0.2173-0.6178) p=0.0002 (***) |
| Linoleic | 0.3530 (0.1665-0.5151) p=0.0002 (***) |
-0.05136 (-0.3822-0.2912) p=0.7661 |
0.4695 (0.2535-0.6409) p<0.0001 (****) |
| Arachidonic | 0.4956 (0.3299-0.6317) p<0.0001 (****) |
0.1300 (-0.2171-0.4478) p=0.4500 |
0.6364 (0.4635-0.7626) p<0.0001 (****) |
| Docosahexaenoic | 0.46264 (02909-0.6051) p<0.0001 (****) |
0.0991 (-0.2467-0.4225) p=0.5653 |
0.5472 (0.3488-0.06986) p<0.0001 (****) |
| Sum of arachidonic and docosahexaenoic acids | 0.4823 (0.3142-0.6211) p<0.0001 (****) |
0.0978 (-0.2479-0.4214) p=0.5704 |
0.5993 (0.04151-0.7363) p<0.0001 (****) |
| Sum of the six NEFA | 0.4334 (0.2573-0.5816) p<0.0001 (****) |
-0.0158 (-0.3515-0.3234) p=0.9270 |
0.5564 (0.3604-0.7054) p<0.0001 (****) |
Table 6.
Main trends in changes in the concentration of fatty acids in the blood plasma of subjects from the OP group compared to the control group. The table shows the proportion of median values in the control group.
Table 6.
Main trends in changes in the concentration of fatty acids in the blood plasma of subjects from the OP group compared to the control group. The table shows the proportion of median values in the control group.
| Name of acids | EFA, % | NEFA, % |
| Myristic, С14:0 | 159 ** | 138 **** |
| Myristoleic, С14:1 | 168 *** | |
| Pentadecanoic, С15:1 | 110 * | |
| Palmitic, С16:0 | 124 *** | |
| Palmitoleic, C16:1n-7 | 120 * | |
| Margaric, C17:0 | 67 ** | 110 ** |
| Heptadecenoic, С17:1 | 171 **** | |
| Stearic, С18:0 | 78 * | 120 ** |
| Oleic, C18:1n9c | 127 ** | |
| Linoelaidic, C18:2t | 122 ** | |
| Linoleic, C18:2n6c | 125 ** | |
| γ-Linolenic, C18:3n6 | 149 ** | |
| Eicosenoic, C20:1 | 137 ** | |
| Eicosadienoic, C20:2 | 80 ** | 128 *** |
| Eicosatrienoic, C20:3n8 | 66 ** | 156 *** |
| Erucic, C22:1n9 | 112 ** | |
| Arachidonic, C20:4n6 | 73 *** | 128 ** |
| Eicosapentaenoic, C20:5 | 156 * | |
| Docosahexaenoic, C22:6n3 | 41 **** | 149 ** |
| Sum of major | 77 ** | 130 *** |
| Sum of submajor | 68 * | 144 *** |
| Sum of minor | 158 **** | |
| Sum of long chain | 123 *** | |
| Sum of extra-long chain | 52 **** | 157 *** |
| Sum of saturated FA | 117 *** | |
| Sum of unsaturated FA | 72 ** | 144 *** |
*, **, ***, **** - differences from the control group are statistically significant, p<0.5, p<0.01, p<0.001, p<0.0001, respectively.
Disclaimer/Publisher’s Note: The statements, opinions and data contained in all publications are solely those of the individual author(s) and contributor(s) and not of MDPI and/or the editor(s). MDPI and/or the editor(s) disclaim responsibility for any injury to people or property resulting from any ideas, methods, instructions or products referred to in the content. |
© 2025 by the authors. Licensee MDPI, Basel, Switzerland. This article is an open access article distributed under the terms and conditions of the Creative Commons Attribution (CC BY) license (http://creativecommons.org/licenses/by/4.0/).
Copyright: This open access article is published under a Creative Commons CC BY 4.0 license, which permit the free download, distribution, and reuse, provided that the author and preprint are cited in any reuse.


