Submitted:
10 December 2025
Posted:
10 December 2025
You are already at the latest version
Abstract
Background/Objectives: Sarcopenia, obesity, and sarcopenic obesity (SO) are common in older adults and may be associated with functional limitations in basic (ADL) and instrumental (IADL) activities of daily living. This study aimed to evaluate the association between body composition phenotypes and ADL/IADL limitations among older adults. Methods: A cross-sectional study included 440 community-dwelling adults aged ≥60 years (281 women, 159 men; mean age 74.7 ± 7.8 years). Sarcopenia was diagnosed according to EWGSOP2 criteria, obesity was defined as percent body fat >42% in women and >30% in men, and SO was classified based on the ESPEN/EASO recommendations. Participants without obesity or sarcopenia were categorized as ‘normal’ phenotype. Functional status was evaluated using the Katz and Lawton scales, with limitations defined as ADL ≤5 and IADL ≤26 points, respectively. Multivariate logistic regression analysis was performed to determine factors associated with ADL and IADL limitations. Results: Over half of the participants (57.1%) had abnormal body composition: 31.6% obesity, 11.4% sarcopenia, and 13.2% SO. SO was associated with a nearly threefold higher risk of ADL limitations (OR = 2.86; p = 0.003) and a 3.7-fold higher risk of IADL limitations (OR = 3.68; p < 0.001) compared to the normal phenotype. Sarcopenia was associated with IADL limitations in the unadjusted model (OR = 2.44; p = 0.010). Independent predictors of ADL and IADL limitations included reduced muscle strength, a higher number of chronic diseases, and a worse nutritional status. Conclusions SO was linked to higher risk of both ADL and IADL limitations, while sarcopenia was associated only with IADL deficits. Obesity severity may be relevant, but its impact on daily functioning in older adults requires further study.
Keywords:
1. Introduction
2. Materials and Methods
2.1. Study Sample
2.2. Assessment of Body Composition Phenotypes
Body Composition Analysis
- Upper limb muscle strength was assessed with a Hand Grip Strength test (HGS), using a hand dynamometer (Saehan, Changwon, Korea). The measurements were performed in a sitting position, with shoulders adducted and elbows flexed at 90°, twice for each hand. The best result out of four taken was compared with diagnostic thresholds. Cut-off point for low muscle strength was <16 kg in women and <27 kg in men [14],
- Lower limb muscle strength was assessed with a Five-Repetition Sit-to-Stand test (5STS). Participants were seated in a chair without armrests, with their arms crossed at their chest. They were instructed to stand up and sit down five times at the given sign as quickly as possible, without using their hands. Test times longer than 15 seconds indicated reduced lower limb muscle strength [14],
- Muscle mass was assessed based on Appendicular Lean Mass Index (ALM Index), defined as the sum of lean mass of lower and upper limbs divided by squared height (kg/m²) [13]. Low muscle mass was defined using cut-off points specific to the Polish population: < 5.6 kg/m² for women and < 7.4 kg/m² for men [27].
2.3. Functional Capacity
2.4. Nutritional Status
2.5. Concomitant Variables
2.6. Statistical Analysis
3. Results
3.1. General Characteristics of the Study Sample
3.2. Prevalence of Body Composition Phenotypes
3.3. Body Composition Phenotypes – Characteristics of Phenotype Groups
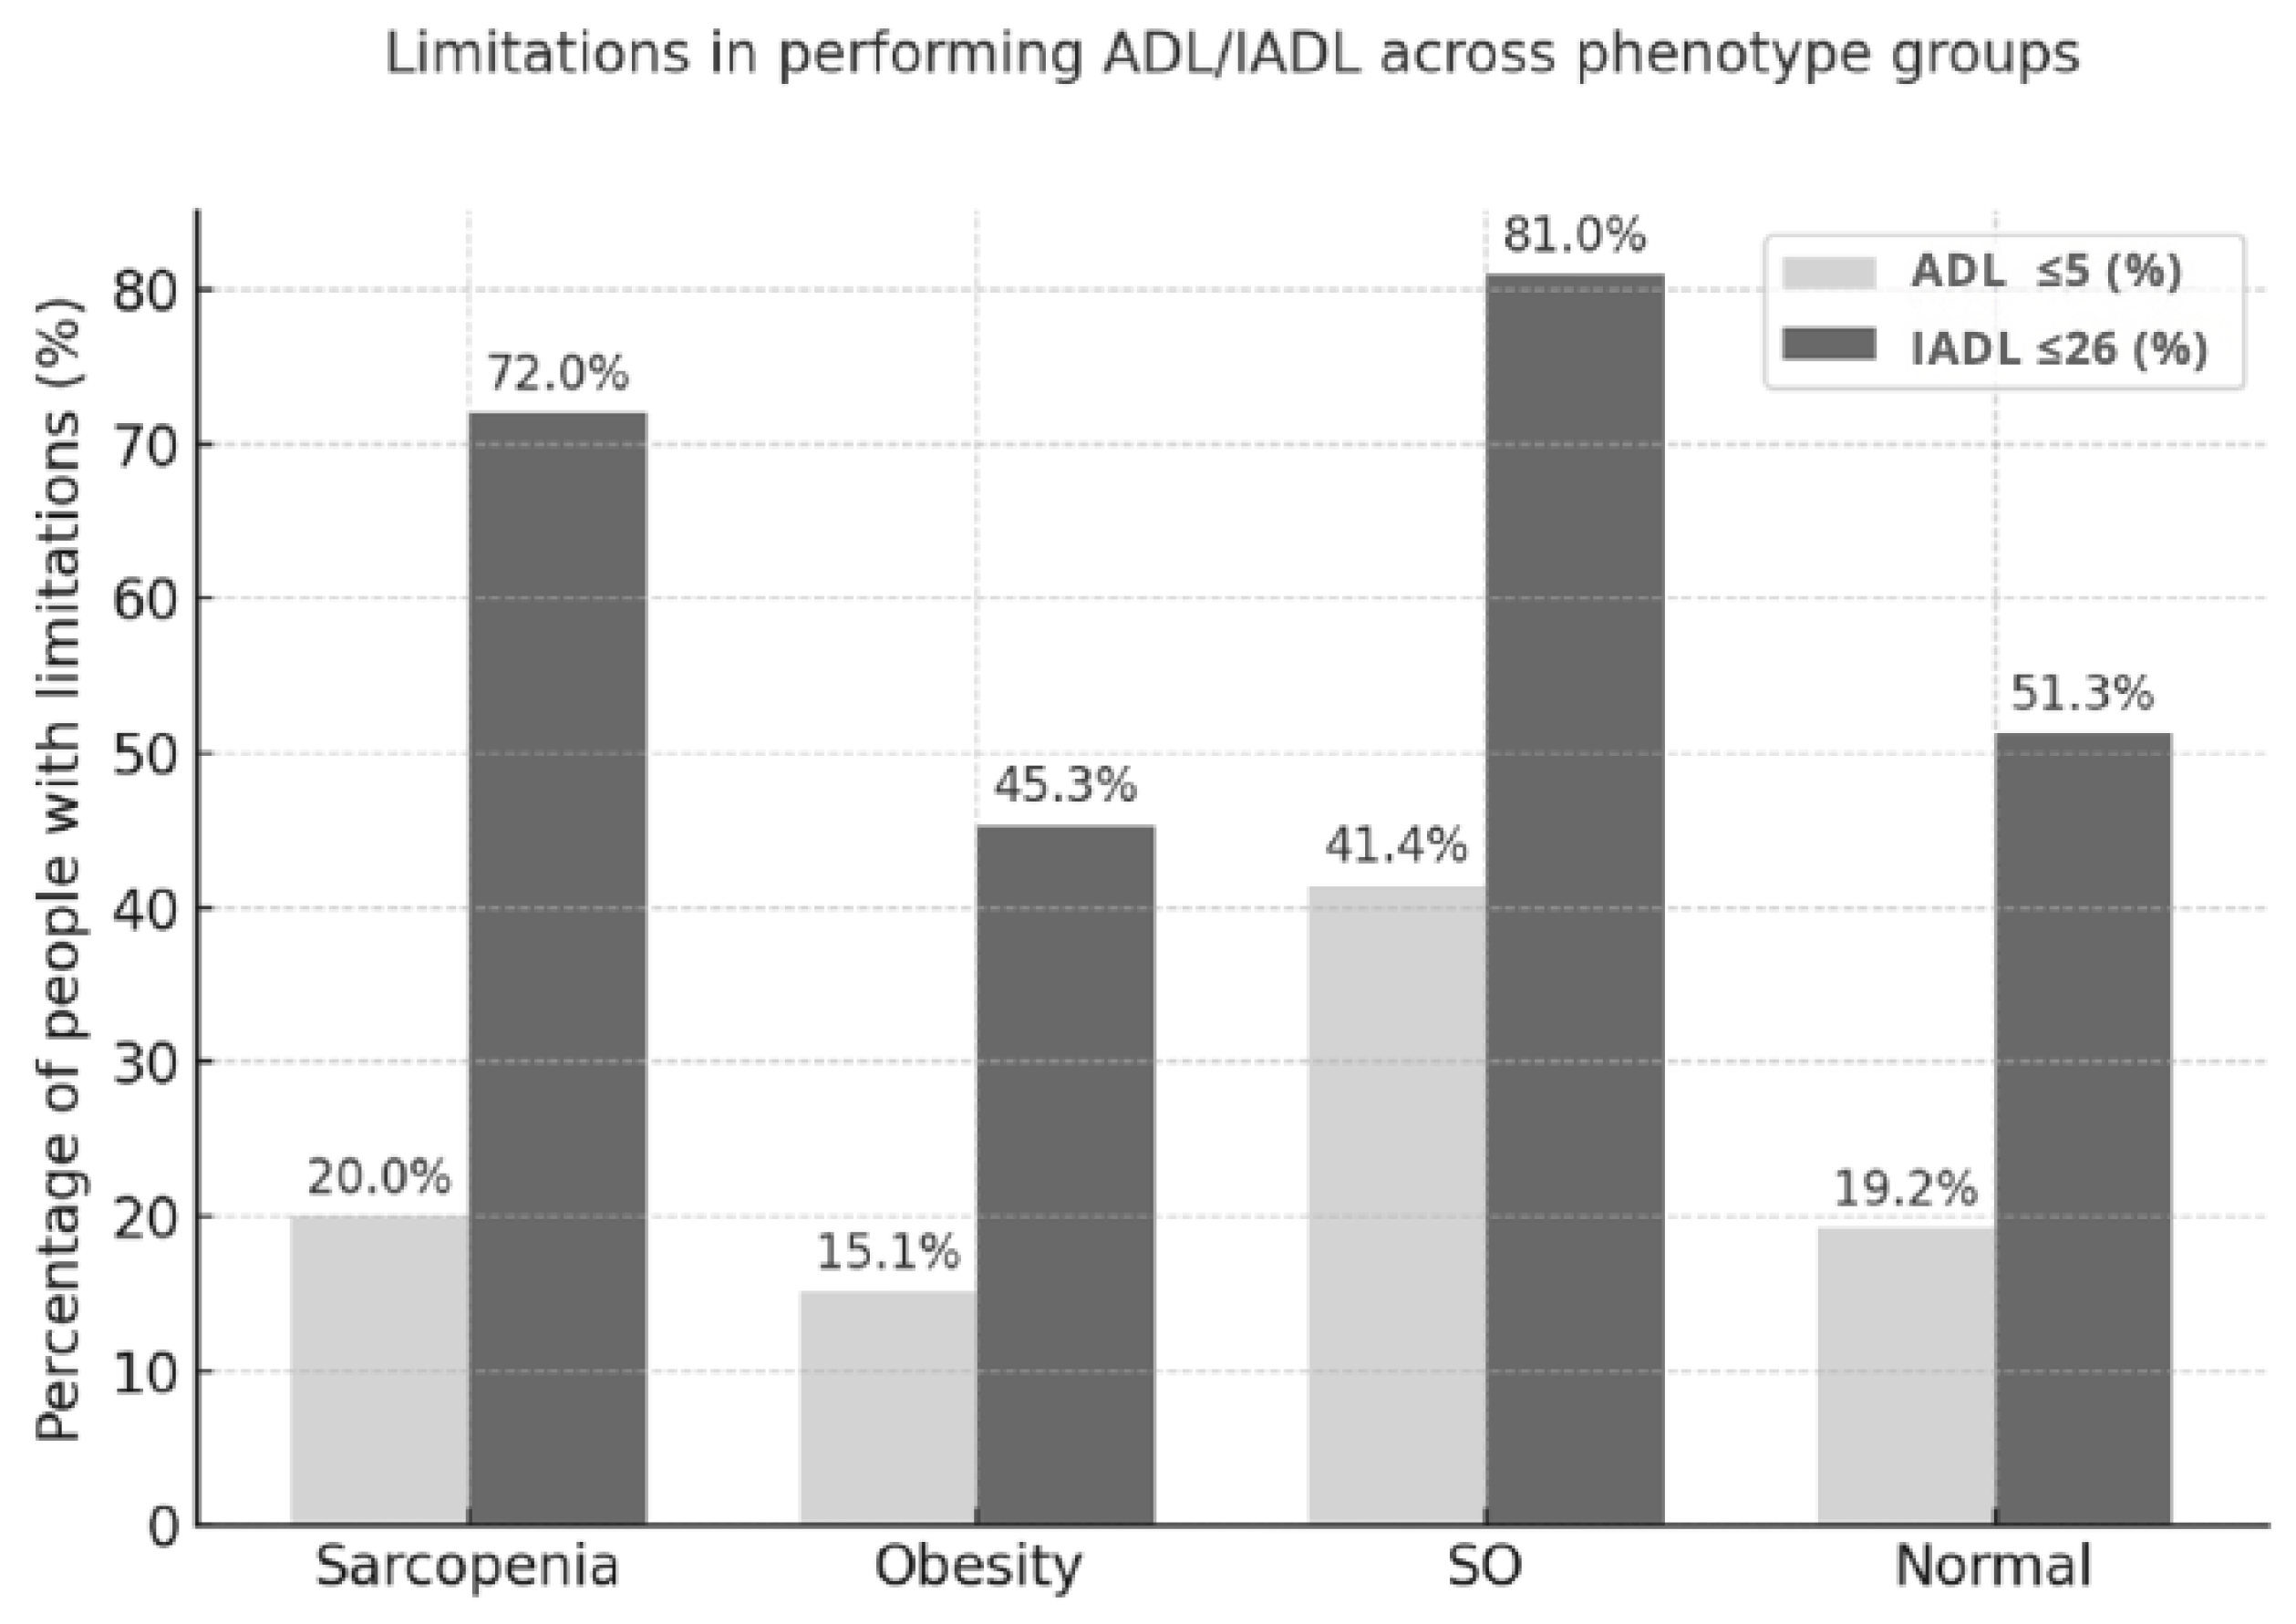
3.4. Body Composition Phenotypes - Functional Capacity ADL/IADL
3.5. Relationship Between Age, Sex, Body Composition Phenotypes, and Functional Disability
3.6. Predictors of Functional Limitations in ADL and IADL
4. Discussion
5. Conclusions
Author Contributions
Funding
Institutional Review Board Statement
Informed Consent Statement
Data Availability Statement
Conflicts of Interest
References
- Eurostat. Population structure and ageing. Luxembourg: Eurostat; 2025 [cited 2025 Jul]. Available from: https://ec.europa.eu/eurostat/statistics-explained/index.php?title=Population_structure_and_ageing.
- Amlak, BT; Getinet, M; Getie, A; Kebede, WM; Tarekegn, TT; Belay, DG. Functional disability in basic and instrumental activities of daily living among older adults globally: a systematic review and meta-analysis. BMC Geriatr. 2025, 25(1), 413. [Google Scholar] [CrossRef]
- Pashmdarfard, M; Azad, A. Assessment tools to evaluate activities of daily living (ADL) and instrumental activities of daily living (IADL) in older adults: a systematic review. Med J Islam Repub Iran 2020, 34, 33. [Google Scholar] [CrossRef]
- Depp, CA; Jeste, DV. Definitions and predictors of successful aging: a comprehensive review of larger quantitative studies. Am J Geriatr Psychiatry 2006, 14(1), 6–20. [Google Scholar] [CrossRef]
- Edemekong PF, Bomgaars DL, Sukumaran S, Levy SB. Activities of daily living. StatPearls Publishing; 2024 [cited 2025 Jul]. Available from: https://www.ncbi.nlm.nih.gov/books/NBK470404/.
- Eurostat. Disability statistics - elderly needs for help or assistance. Luxembourg: Eurostat; 2025 [cited 2025 Jul]. Available from: https://ec.europa.eu/eurostat/statistics-explained/index.php?title=Disability_statistics_-_elderly_needs_for_help_or_assistance.
- Eurostat. Functional and activity limitations statistics. Luxembourg: Eurostat; 2025 [cited 2025 Jul]. Available from: https://ec.europa.eu/eurostat/statistics-explained/SEPDF/cache/37774.pdf.
- Mlinac, ME; Feng, MC. Assessment of activities of daily living, self-care, and independence. Arch Clin Neuropsychol 2016, 31(6), 506–16. [Google Scholar] [CrossRef]
- Huang, S; Zhong, W; Cheng, Q; Shuai, Y; Zhu, J; Diao, J. Instrumental activities of daily living function and cognitive status among Chinese older adults: a serial multiple mediation model. Front Public Health 2024, 12, 1378979. [Google Scholar] [CrossRef]
- Millán-Calenti, JC; Tubío, J; Pita-Fernández, S; González-Abraldes, I; Lorenzo, T; Fernández-Arruty, T; et al. Prevalence of functional disability in activities of daily living (ADL), instrumental activities of daily living (IADL) and associated factors, as predictors of morbidity and mortality. Arch Gerontol Geriatr. 2010, 50(3), 306–10. [Google Scholar] [CrossRef] [PubMed]
- Wang, DXM; Yao, J; Zirek, Y; Reijnierse, EM; Maier, AB. Muscle mass, strength, and physical performance predicting activities of daily living: a meta-analysis. J Cachexia Sarcopenia Muscle 2020, 11(1), 3–25. [Google Scholar] [CrossRef] [PubMed]
- Vincent, HK; Raiser, SN; Vincent, KR. The aging musculoskeletal system and obesity-related considerations with exercise. Ageing Res Rev. 2012, 11(3), 361–73. [Google Scholar] [CrossRef] [PubMed]
- Akazawa, N; Kishi, M; Hino, T; Tsuji, R; Tamura, K; Hioka, A; et al. Longitudinal relationship between intramuscular adipose tissue of the quadriceps and activities of daily living in older inpatients. J Cachexia Sarcopenia Muscle 2021, 12(6), 2231–7. [Google Scholar] [CrossRef]
- Cruz-Jentoft, AJ; Bahat, G; Bauer, J; Boirie, Y; Bruyère, O; Cederholm, T; et al. Sarcopenia: revised European consensus on definition and diagnosis. Age Ageing 2019, 48(1), 16–31. [Google Scholar] [CrossRef]
- Rubino, F; Cummings, DE; Eckel, RH; et al. Definition and diagnostic criteria of clinical obesity. Lancet Diabetes Endocrinol. 2025, 13(3), 221–262. [Google Scholar] [CrossRef]
- Visser, M. Obesity, sarcopenia and their functional consequences in old age. Proc Nutr Soc. 2011, 70(1), 114–8. [Google Scholar] [CrossRef]
- Lynch, DH; Petersen, CL; Fanous, MM; Spangler, HB; Kahkoska, AR; Jimenez, D; et al. The relationship between multimorbidity, obesity and functional impairment in older adults. J Am Geriatr Soc. 2022, 70(5), 1442–9. [Google Scholar] [CrossRef] [PubMed]
- Donini, LM; Busetto, L; Bischoff, SC; Cederholm, T; Ballesteros-Pomar, MD; Batsis, JA; et al. Definition and diagnostic criteria for sarcopenic obesity: ESPEN and EASO consensus statement. Obes Facts 2022, 15(3), 321–35. [Google Scholar] [CrossRef]
- Murawiak, M; Krzymińska-Siemaszko, R; Wieczorowska-Tobis, K. Otyłość sarkopeniczna u osób starszych w świetle nowych wytycznych diagnostycznych ESPEN/EASO – rozpowszechnienie i podłoże patofizjologiczne. Gerontol Pol. 2024, 32(3), 174–82. [Google Scholar]
- Batsis, JA; Villareal, DT. Sarcopenic obesity in older adults: aetiology, epidemiology and treatment strategies. Nat Rev Endocrinol. 2018, 14(9), 513–37. [Google Scholar] [CrossRef]
- Wei, S; Nguyen, TT; Zhang, Y; Ryu, D; Gariani, K. Sarcopenic obesity: epidemiology, pathophysiology, cardiovascular disease, mortality, and management. Front Endocrinol (Lausanne) 2023, 14, 1185221. [Google Scholar] [CrossRef]
- Murawiak, M; Krzymińska-Siemaszko, R; Wieczorowska-Tobis, K. Otyłość sarkopeniczna u osób starszych - konsekwencje kliniczne oraz niefarmakologiczne metody prewencji i leczenia. Gerontol Pol. 2024, 32(4), 267–75. [Google Scholar]
- Silay K, Selvi Oztorun H. Sarcopenic obesity is linked to worse clinical outcomes than sarcopenia or obesity alone in hospitalized older adults. BMC Geriatr. 2025;25(1):443.
- Donini, LM; Busetto, L; Bauer, JM; Bischoff, S; Boirie, Y; Cederholm, T; et al. Critical appraisal of definitions and diagnostic criteria for sarcopenic obesity based on a systematic review. Clin Nutr. 2020, 39(8), 2368–88. [Google Scholar] [CrossRef] [PubMed]
- Hodkinson, HM. Evaluation of a mental test score for assessment of mental impairment in the elderly. Age Ageing 1972, 1(4), 233–8. [Google Scholar] [CrossRef]
- Kyle, UG; Bosaeus, I; De Lorenzo, AD; Deurenberg, P; Elia, M; Gómez, JM; et al. Bioelectrical impedance analysis-part I: review of principles and methods. Clin Nutr. 2004, 23(5), 1226–43. [Google Scholar] [CrossRef]
- Krzymińska-Siemaszko, R; Fryzowicz, A; Czepulis, N; Kaluźniak-Szymanowska, A; Dworak, LB; Wieczorowska-Tobis, K. The impact of the age range of young healthy reference population on the cut-off points for low muscle mass necessary for the diagnosis of sarcopenia. Eur Rev Med Pharmacol Sci. 2019, 23, 4321–32. [Google Scholar]
- Gallagher, D; Heymsfield, SB; Heo, M; Jebb, SA; Murgatroyd, PR; Sakamoto, Y. Healthy percentage body fat ranges: an approach for developing guidelines based on body mass index. Am J Clin Nutr. 2000, 72, 694–701. [Google Scholar] [CrossRef] [PubMed]
- Dodds, RM; Syddall, HE; Cooper, R; Benzeval, M; Deary, IJ; Dennison, EM; et al. Grip strength across the life course: normative data from twelve British studies. PLoS One 2014, 9(12), e113637. [Google Scholar] [CrossRef] [PubMed]
- Janssen, I; Heymsfield, SB; Ross, R. Low relative skeletal muscle mass (sarcopenia) in older persons is associated with functional impairment and physical disability. J Am Geriatr Soc. 2002, 50(5), 889–96. [Google Scholar] [CrossRef]
- Katz, S; Ford, AB; Moskowitz, R; Jackson, B; Jaffe, M. Studies of illness and the aged: the index of ADL, a standardized measure of biological and psychological function. JAMA 1963, 185, 914–19. [Google Scholar] [CrossRef] [PubMed]
- Guo, L; An, L; Luo, F; Yu, B. Social isolation, loneliness and functional disability in Chinese older women and men: a longitudinal study. Age Ageing 2021, 50(4), 1222–8. [Google Scholar] [CrossRef]
- Su, P; Ding, H; Zhang, W; et al. The association of multimorbidity and disability in a community-based sample of elderly aged 80 or older in Shanghai, China. BMC Geriatr. 2016, 16(1), 178. [Google Scholar] [CrossRef]
- Balzi, D; Lauretani, F; Barchielli, A; et al. Risk factors for disability in older persons over 3-year follow-up. Age Ageing 2010, 39(1), 92–8. [Google Scholar] [CrossRef]
- Bahat, G; Kilic, C; Eris, S; Karan, MA. Power versus sarcopenia: associations with functionality and physical performance measures. J Nutr Health Aging 2021, 25(1), 13–17. [Google Scholar] [CrossRef]
- Hirani, V; Naganathan, V; Blyth, F; et al. Longitudinal associations between body composition, sarcopenic obesity and outcomes of frailty, disability, institutionalisation and mortality in community-dwelling older men: the Concord Health and Ageing in Men Project. Age Ageing 2017, 46(3), 413–20. [Google Scholar] [CrossRef] [PubMed]
- Yang, M; Ding, X; Luo, L; Hao, Q; Dong, B. Disability associated with obesity, dynapenia and dynapenic-obesity in Chinese older adults. J Am Med Dir Assoc. 2014, 15(2), 150.e11–150.e16. [Google Scholar] [CrossRef] [PubMed]
- Lawton, MP; Brody, EM. Assessment of older people: self-maintaining and instrumental activities of daily living. Gerontologist 1969, 9(3), 179–86. [Google Scholar] [CrossRef]
- Cederholm, T; Barazzoni, R; Austin, P; Ballmer, P; Biolo, G; Bischoff, SC; et al. ESPEN guidelines on definitions and terminology of clinical nutrition. Clin Nutr. 2017, 36, 49–64. [Google Scholar] [CrossRef]
- Bahat, G; Kilic, C; Ozkok, S; Ozturk, S; Karan, MA. Associations of sarcopenic obesity versus sarcopenia alone with functionality. Clin Nutr. 2021, 40(5), 2851–9. [Google Scholar] [CrossRef]
- Schluessel, S; Huemer, MT; Peters, A; Drey, M; Thorand, B. Sarcopenic obesity using the ESPEN and EASO consensus statement criteria of 2022 - results from the German KORA-Age study. Obes Res Clin Pract. 2023, 17(4), 349–52. [Google Scholar] [CrossRef]
- Tchalla, A; Laubarie-Mouret, C; Cardinaud, N; Gayot, C; Rebiere, M; Dumoitier, N; et al. Risk factors of frailty and functional disability in community-dwelling older adults: a cross-sectional analysis of the FREEDOM-LNA cohort study. BMC Geriatr. 2022, 19;22(1), 762. [Google Scholar] [CrossRef]
- Ćwirlej-Sozańska, AB; Sozański, B; Wiśniowska-Szurlej, A; Wilmowska-Pietruszyńska, A. An assessment of factors related to disability in ADL and IADL in elderly inhabitants of rural areas of south-eastern Poland. Ann Agric Environ Med. 2018, 25;25(3), 504–11. [Google Scholar] [CrossRef]
- de Campos, GC; Lourenço, RA; Lopes, CS. Prevalence of sarcopenic obesity and its association with functionality, lifestyle, biomarkers and morbidities in older adults: the FIBRA-RJ study of frailty in older Brazilian adults. Clinics (Sao Paulo) 2020, 75, e1814. [Google Scholar] [CrossRef]
- Lynch, GM; Murphy, CH; Castro, EM; Roche, HM. Inflammation and metabolism: the role of adiposity in sarcopenic obesity. Proc Nutr Soc. 2020, 16. [Google Scholar] [CrossRef] [PubMed]
- Baarts, RB; Jensen, MR; Hansen, OM; et al. Age- and sex-specific changes in visceral fat mass throughout the life-span. Obesity (Silver Spring) 2023, 31(7), 1953–1961. [Google Scholar] [CrossRef]
- Arpón, A; Milagro, FI; Santos, JL; García-Granero, M; Riezu-Boj, JI; Martínez, JA. Interaction Among Sex, Aging, and Epigenetic Processes Concerning Visceral Fat, Insulin Resistance, and Dyslipidaemia. Front Endocrinol (Lausanne) 2019, 10, 496. [Google Scholar] [CrossRef] [PubMed]
- Schoufour, JD; Tieland, M; Barazzoni, R; Ben Allouch, S; van der Bie, J; Boirie, Y; et al. The relevance of diet, physical activity, exercise, and persuasive technology in the prevention and treatment of sarcopenic obesity in older adults. Front Nutr. 2021, 8, 661449. [Google Scholar] [CrossRef]
- Beaudart, C; Alcazar, J; Aprahamian, I; Batsis, JA; Yamada, Y; Prado, CM; et al. Health outcomes of sarcopenia: a consensus report by the outcome working group of the Global Leadership Initiative in Sarcopenia (GLIS). Aging Clin Exp Res. 2025, 37(1), 100. [Google Scholar] [CrossRef]
- Liu, C; Wong, PY; Chung, YL; Chow, SK; Cheung, WH; Law, SW; Chan, JCN; Wong, RMY. Deciphering the “obesity paradox” in the elderly: A systematic review and meta-analysis of sarcopenic obesity. Obes Rev. 2023, 24(2), e13534. [Google Scholar] [CrossRef]
- Bosello, O; Vanzo, A. Obesity paradox and aging. Eat Weight Disord. 2021, 26(1), 27–35. [Google Scholar] [CrossRef]
- Amankwaa, I; Nelson, K; Rook, H; Hales, C. Association between body mass index, multi-morbidity and activities of daily living among New Zealand nursing home older adults: a retrospective analysis of nationwide InterRAI data. BMC Geriatr 2022, 22(1), 62. [Google Scholar] [CrossRef] [PubMed]
- Lee, SY; Ahn, S; Kim, YJ; Ji, MJ; Kim, KM; Choi, SH; et al. Comparison between dual-energy X-ray absorptiometry and bioelectrical impedance analyses for accuracy in measuring whole body muscle mass and appendicular skeletal muscle mass. Nutrients 2018, 10(6), 738. [Google Scholar] [CrossRef]
- Wingo, BC; Barry, VG; Ellis, AC; Gower, BA. Comparison of segmental body composition estimated by bioelectrical impedance analysis and dual-energy X-ray absorptiometry. Clin Nutr ESPEN 2018, 28, 141–147. [Google Scholar] [CrossRef]
- Buckinx, F; Reginster, JY; Dardenne, N; Croisiser, JL; Kaux, JF; Beaudart, C; et al. Concordance between muscle mass assessed by bioelectrical impedance analysis and by dual energy X-ray absorptiometry: a cross-sectional study. BMC Musculoskelet Disord. 2015, 16, 60. [Google Scholar] [CrossRef] [PubMed]

| Variable | Women n= 281 | Men n= 159 | P value |
| Mean ± SD | Mean ± SD | ||
| Age [years] | 74.84 ± 7.66 | 74.49 ± 8.14 | 0.658 |
| Body weight [kg] | 70.40 ± 15.38 | 79.65 ± 14.87 | <0.001 |
| BMI [kg/m2] | 28.81 ± 6.20 | 27.44 ± 4.47 | 0.008 |
| PBF [%] | 38.92 ± 8.92 | 29.60 ± 7.64 | <0.001 |
| SMM [kg] | 22.46 ± 3.34 | 30.67 ± 4.71 | <0.001 |
| FFM [kg] | 41.78 ± 5.79 | 55.35 ± 7.64 | <0.001 |
| ALM index [kg/m2] | 6.55 ± 1.03 | 7.85 ± 0.96 | <0.001 |
| SMM/W [%] | 0.33 ± 0.05 | 0.39 ± 0.05 | <0.001 |
| HGS [kg] | 20.39 ± 5.43 | 32.77 ± 9.47 | <0.001 |
| 5STS [s] | 14.22 ± 6.95 | 14.30 ± 7.90 | 0.915 |
| MNA score | 24.39 ± 3.58 | 24.57 ± 3.36 | 0.598 |
| Number of chronic diseases | 4.49 ± 2.54 | 3.91 ± 2.24 | 0.013 |
| Number of medications | 6.18 ± 3.96 | 6.77 ± 3.75 | 0.121 |
| ADL score | 5.50 ± 0.67 | 5.59 ± 0.73 | 0.202 |
| IADL score | 24.12 ± 4.11 | 24.60 ± 3.35 | 0.185 |
| n (%) | n (%) | ||
| Low muscle mass (ALM Index) | 55 (19.6) | 55 (34.6) | <0.001 |
| Low muscle mass (SMM/W) | 40 (14.2) | 55 (34.6) | <0.001 |
| Reduced upper limb muscle strength | 73 (26.0) | 47 (29.6) | 0.485 |
| Reduced lower limb muscle strength | 113 (40.2) | 55 (34.6) | 0.287 |
| Probable sarcopenia | 145 (51.6) | 75 (47.2) | 0.427 |
| Limitations in ADL ≤5 | 61 (21.7) | 31 (19.5) | 0.584 |
| Limitations in IADL ≤26 | 156 (55.5) | 89 (56.0) | 0.926 |
| Poor nutritional status | 102 (36.3) | 60 (37.8) | 0.844 |
| MNA | |||
| Malnutrition | 10 (3.6) | 4 (2.5) | 0.752 |
| At risk of malnutrition | 92 (32.7) | 56 (35.2) | 0.672 |
| Normal nutritional status | 179 (63.7) | 99 (62.3) | 0.844 |
| Variable | Women n= 281 | Men n= 159 | |
| n (%) | n (%) | P value | |
| Body composition phenotypes | 0.017 | ||
| Sarcopenia | 32 (11.4) | 18 (11.3) | 0.983 |
| Obesity | 88 (31.3) | 51 (31.1) | 0.869 |
| Sarcopenic obesity | 27 (9.6) | 31 (19.5) | 0.003 |
| Normal phenotype | 134 (47.7) | 59 (37.1) | 0.032 |
| Variable | Body composition phenotypes | P value | |||
| Sarcopenia n=50 |
Obesity n=139 |
SO n=58 |
Normal n=193 |
||
| Mean ± SD | Mean ± SD | Mean ± SD | Mean ± SD | ||
| Age [years] | 77.52 ± 8.43 | 72.91 ± 7.64 | 77.09 ± 7.39 | 74.58 ± 7.60 | <0.001 |
| Body weight [kg] | 55.19 ± 9.39 | 84.14 ± 11.1 | 87.51 ± 14.10 | 66.93 ± 11.36 | <0.001 |
| BMI [kg/m2] | 21.74 ± 2.76 | 32.30 ± 3.46 | 33.78 ± 5.72 | 25.52 ± 3.68 | <0.001 |
| PBF [%] | 27.74 ± 7.87 | 41.68 ± 6.18 | 43.40 ± 7.15 | 30.81 ± 8.20 | <0.001 |
| SMM [kg] | 20.95 ± 4.19 | 27.15 ± 5.72 | 26.60 ± 5.10 | 25.00 ± 5.14 | <0.001 |
| FFM [kg] | 39.19 ± 7.21 | 49.13 ± 8.92 | 49.41 ± 8.63 | 46.04 ± 8.94 | <0.001 |
| ALM index [kg/m2] | 5.76 ± 0.87 | 7.51 ± 1.02 | 7.50 ± 1.02 | 6.85 ± 1.11 | <0.001 |
| SMM/W [%] | 0.38 ± 0.04 | 0.32 ± 0.05 | 0.31 ± 0.04 | 0.37 ± 0.05 | <0.001 |
| HGS [kg] | 18.57 ± 4.89 | 27.76 ± 9.97 | 21.88 ± 8.48 | 25.31 ± 8.93 | <0.001 |
| 5STS [s] | 15.79 ± 6.96 | 13.09 ±6.09 | 18.43 ± 9.45 | 13.42 ± 6.99 | <0.001 |
| MNA score | 21.71 ± 4.19 | 25.58 ± 2.90 | 24.01 ± 2.22 | 24.52 ± 3.62 | <0.001 |
| Number of chronic diseases | 4.44 ± 2.21 | 4.25 ± 2.55 | 5.90 ± 2.50 | 3.77 ± 2.20 | <0.001 |
| Number of medications | 6.50 ± 2.57 | 6.62 ± 3.76 | 9.05 ± 4.38 | 5.41 ± 3.68 | <0.001 |
| ADL score | 5.59 ± 0.40 | 5.63 ± 0.69 | 5.14 ± 0.86 | 5.57 ± 0.67 | 0.002 |
| IADL score | 23.00 ± 3.85 | 24.99 ± 3.55 | 20.88 ± 5.42 | 24.20 ± 4.26 | <0.001 |
| n (%) | n (%) | n (%) | n (%) | ||
| Sex | |||||
| Women | 32 (64.0) | 88 (63.3) | 27 (46.6) | 134 (69.4) | 0.017 |
| Men | 18 (36.0) | 51 (36.7) | 31 (53.4) | 59 (30.6) | |
| Low muscle mass (ALM Index) | 50 (100.0) | 8 (5.8) | 18 (31.0) | 34 (17.6) | <0.001 |
| Low muscle mass (SMM/W) | 0 (0.0) | 36 (25.9) | 58 (100.0) | 1 (0.5) | <0.001 |
| Reduced upper limb muscle strength | 40 (80.0) | 17 (12.2) | 31 (53.4) | 32 (16.6) | <0.001 |
| Reduced lower limb muscle strength | 29 (58.0) | 36 (25.9) | 46 (79.3) | 57 (29.5) | <0.001 |
| Probable sarcopenia | 50 (100.0) | 45 (32.4) | 58 (100.0) | 67 (34.7) | <0.001 |
| Limitations in ADL ≤5 | 10 (20.0) | 21 (15.1) | 24 (41.4) | 37 (19.2) | <0.001 |
| Limitations in IADL ≤26 | 36 (72.0) | 63 (45.3) | 47 (81.0) | 99 (51.3) | <0.001 |
| Poor nutritional status | 31 (62.0) | 32 (23.0) | 29 (50.0) | 70 (36.3) | <0.001 |
| MNA | |||||
| Malnutrition | 6 (12.0) | 1 (0.7) | 1 (1.7) | 6 (3.1) | <0.001 |
| At risk of malnutrition | 25 (50.0) | 31 (22.3) | 28 (48.3) | 64 (33.2) | |
| Normal nutritional status | 19 (38.0) | 107 (77.0) | 29 (50.0) | 123 (63.7) | |
| Variable | Body composition phenotypes | ||||
| Sarcopenia | Obesity | SO | Normal | P value | |
| n (%) | n (%) | n (%) | n (%) | ||
| Women | n=32 | n=88 | n=27 | n=134 | |
| ADL ≤5 IADL ≤26 |
7 (21.9) | 18 (20.5) | 10 (37.0) | 26 (19.4) | 0.237 |
| 21 (65.6) | 47 (53.4) | 22 (81.5) | 66 (49.3) | 0.012 | |
| Men | n=18 | n=51 | n=31 | n=59 | |
| ADL ≤5 IADL ≤26 |
3 (16.7) | 3 (5.9) | 14 (45.2) | 11 (18.6) | <0.001 |
| 15 (83.3) | 16 (31.4) | 25 (80.6) | 33 (55.9) | <0.001 | |
| Variables |
OR (ADL ≤5) |
95% CI | P value |
OR (IADL ≤26) |
95% CI | P value |
| Number of chronic diseases | 1.225 | 1.072-1.399 | 0.003 | 1.208 | 1.048-1.393 | 0.009 |
| Number of medications | 1.062 | 0.978-1.153 | 0.155 | 1.099 | 1.012-1.192 | 0.024 |
| MNA score | 0.842 | 0.769-0.922 | <0.001 | 0.866 | 0.794-0.945 | 0.001 |
| Reduced lower limb muscle strength | 1.591 | 0.877-2.888 | 0.127 | 2.261 | 1.202-4.253 | 0.011 |
| Reduced upper limb muscle strength | 3.225 | 1.815-5.729 | <0.001 | 4.297 | 2.497-7.394 | <0.001 |
| Low muscle mass (ALM Index) | 0.817 | 0.359-1.860 | 0.630 | 1.063 | 0.525-2.153 | 0.866 |
| BMI [kg/m2] | 1.020 | 0.926-1.125 | 0.685 | 1.107 | 1.014-1.210 | 0.024 |
| PBF [%] | 1.017 | 0.969-1.067 | 0.488 | 0.968 | 0.928-1.010 | 0.137 |
| Variable | OR ADL ≤5 | 95% CI | P value | OR ADL ≤5 (adjusted) | 95% CI | P value |
| Sarcopenia | 1.054 | 0.48-2.300 | 0.895 | 0.716 | 0.308-1.667 | 0.439 |
| Obesity | 0.750 | 0.417-1.349 | 0.337 | 0.872 | 0.465-1.634 | 0.669 |
| SO | 2.976 | 1.579-5.608 | <0.001 | 2.859 | 1.423-5.744 | 0.003 |
| Sex | 1.373 | 0.795-2.370 | 0.256 | |||
| Age | 1.129 | 1.089-1.170 | <0.001 | |||
| OR IADL ≤26 | 95% CI | P value | OR IADL ≤ 26 (adjusted) | 95% CI | P value | |
| Sarcopenia | 2.442 | 1.238-4.814 | 0.010 | 2.037 | 0.959-4.328 | 0.064 |
| Obesity | 0.787 | 0.508-1.219 | 0.283 | 0.936 | 0.576-1.520 | 0.788 |
| SO | 4.057 | 1.985-8.290 | <0.001 | 3.675 | 1.707-7.910 | <0.001 |
| Sex | 1.026 | 0.652-1.616 | 0.911 | |||
| Age | 1.141 | 1.104-1.78 | <0.001 |
Disclaimer/Publisher’s Note: The statements, opinions and data contained in all publications are solely those of the individual author(s) and contributor(s) and not of MDPI and/or the editor(s). MDPI and/or the editor(s) disclaim responsibility for any injury to people or property resulting from any ideas, methods, instructions or products referred to in the content. |
© 2025 by the authors. Licensee MDPI, Basel, Switzerland. This article is an open access article distributed under the terms and conditions of the Creative Commons Attribution (CC BY) license (http://creativecommons.org/licenses/by/4.0/).


