1. Introduction
With the growing burden of obesity and related insulin resistance, type 2 diabetes worldwide, there is an increasing interest in discovering new clinical strategies and biomarkers which can help in the early diagnosis and prevention of these metabolic conditions. Studies have shown that vitamin K(VK), best known for its effect on coagulation, is involved in glucose homeostasis and insulin sensitivity [
1]. VK can be found in two natural forms, VK1 (phylloquinone), and VK2 (the menaquinone series). VK1 exists in green leafy vegetables, and the menaquinones which consist of many sub-types, the MK-ns, differ in the length of the isoprenyl side chains and are present in fermented food [
2]. VK is involved in the post-translational modification of vitamin K-dependent proteins (VKDPs) such as coagulation factors and osteocalcin rendering them biologically active via carboxylation. Data from observational studies show that higher intake of VK1, the main dietary VK in the western diet, is associated with better glycaemic control in the postprandial states, and VK2 was inversely associated with the new diagnosis of type 2 diabetes [
3]. The Prevention with the Mediterranean Diet study showed that people who were known to have diabetes appeared to have a less energy-adjusted intake of phylloquinone at baseline [
4]. VKs effects on glucose homeostasis and insulin sensitivity are thought to involve osteocalcin (OC) present in bone [
5]. However, total osteocalcin (tOC) consists of carboxylated osteocalcin (cOC) and an uncarboxylated fraction (ucOC), and there is uncertainty as to which form of OC is required for glucose control in initial studies carried out in animal models [
6,
7]. Human studies show that the serum tOC concentrations were inversely associated with HOMA-IR, both cross-sectionally and longitudinally in older adults [
8]. There is a need for further studies and analyses to determine the impact of vitamin K on insulin secretion and sensitivity.
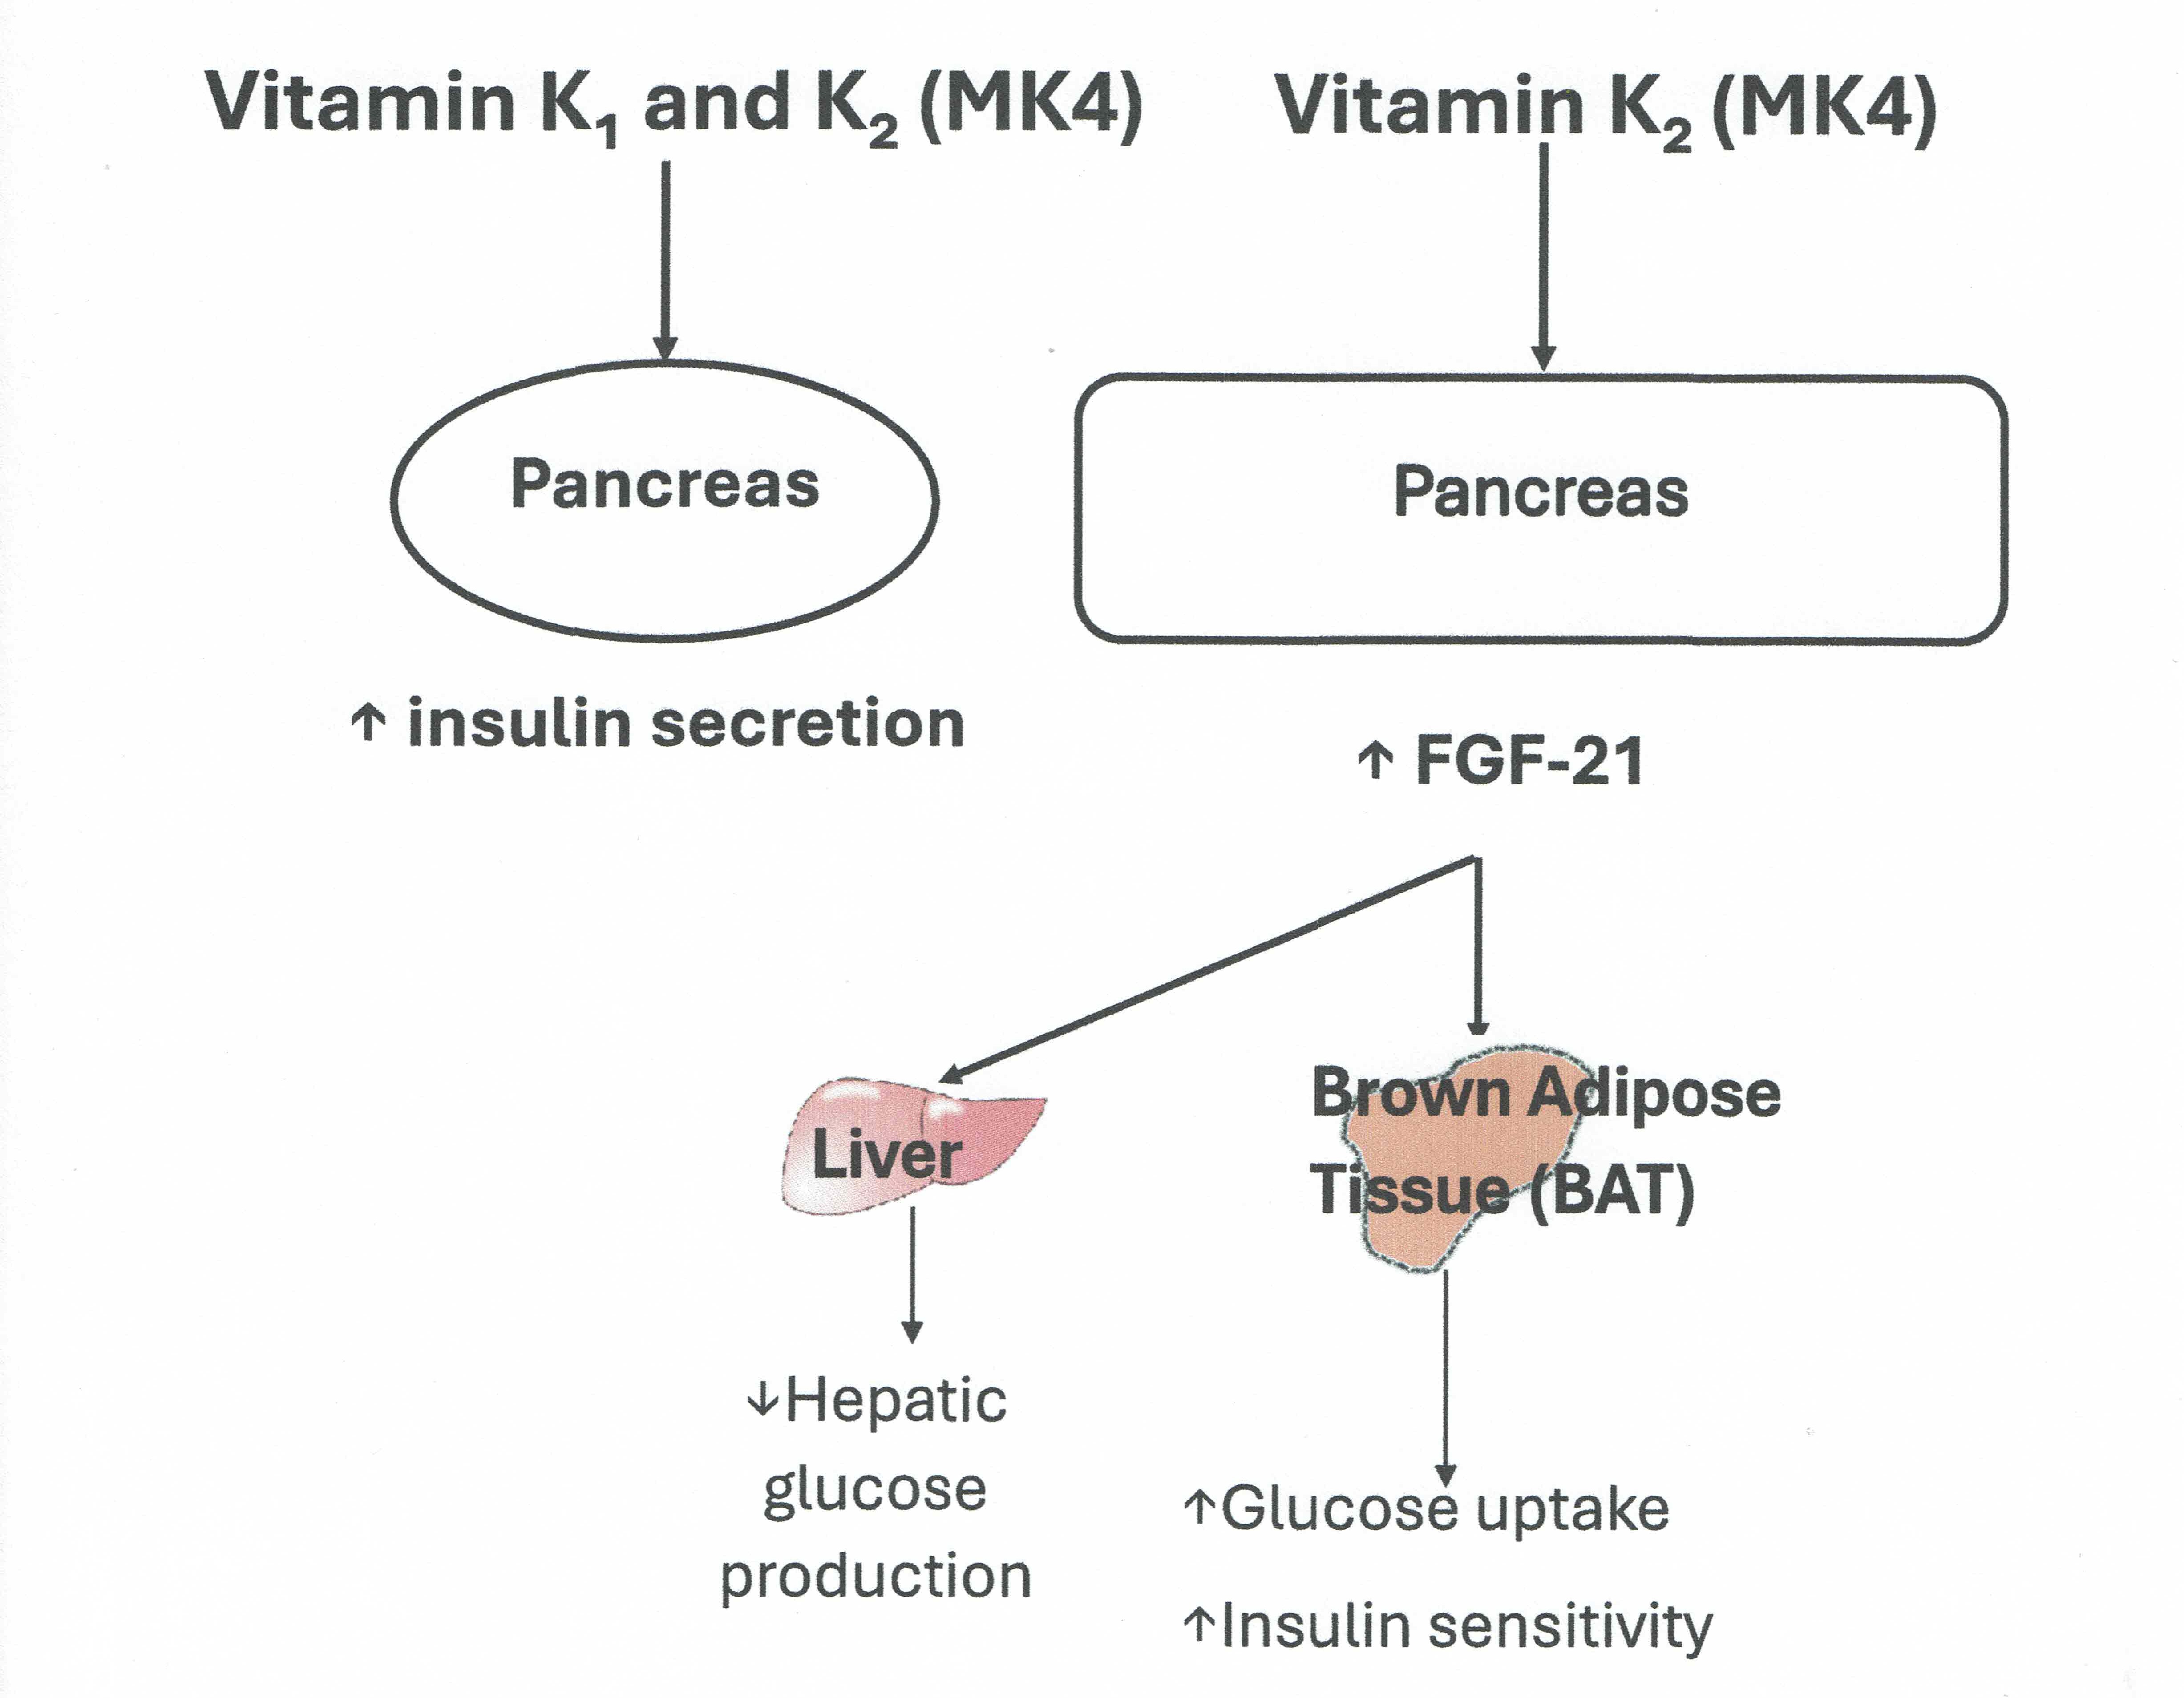
It is plausible that other factors which modulate energy metabolism could act as mediators in the vitamin K/OC/insulin axis and merit further exploration as data are lacking. FGF21, synthesized in the liver promotes energy expenditure, weight loss, and insulin sensitivity by promoting glucose uptake in the adipose tissue [
9]. FGF21 level is positively associated with metabolic conditions such as type 2 diabetes, insulin resistance and hsCRP believed to be an adaptive response [
10]. Administration of FGF21 increases insulin sensitivity in mice [
11]. Studies have shown that exogenous administration of FGF21 in mice reduced blood glucose, lipids and improved insulin sensitivity and energy expenditure, suggesting that FGF 21 could also be a potential treatment in type 2 diabetes mellitus, obesity and disorders associated with the metabolic syndrome [
11]. Indeed, several clinical trials of human FGF21 analogues have been conducted in subjects with type 2 diabetes mellitus, obesity and fatty liver. Some of these trials showed improvement in lipid homeostasis and insulin sensitivity [
12]. Disappointingly, there were no effects on body weight reduction, although treatment with pegozafermin, an FGF21 analogue led to improvement in liver fibrosis [
13]. FGF19, another member of the FGFs family, also increases energy expenditure, glucose uptake in tissues and improves insulin sensitivity [
9,
14]. Studies have shown that circulating FGF19 tends to be low in type 2 diabetes mellitus, obesity and increases after bariatric surgery [
15,
16].
Our hypothesis is that VK supplementation influences insulin secretion and that FGF-19 and FGF 21 may act as modulators of the VK/insulin axis. The aim of the study was to conduct further exploratory post-hoc analyses of insulin, FGF19 and FGF21 from stored samples from a previous 18-month randomized controlled intervention study of VK1 and VK2 which was designed initially to investigate bone metabolism in post-menopausal women with osteoporosis.
2. Material and Methods
2.1. Study Design and Intervention
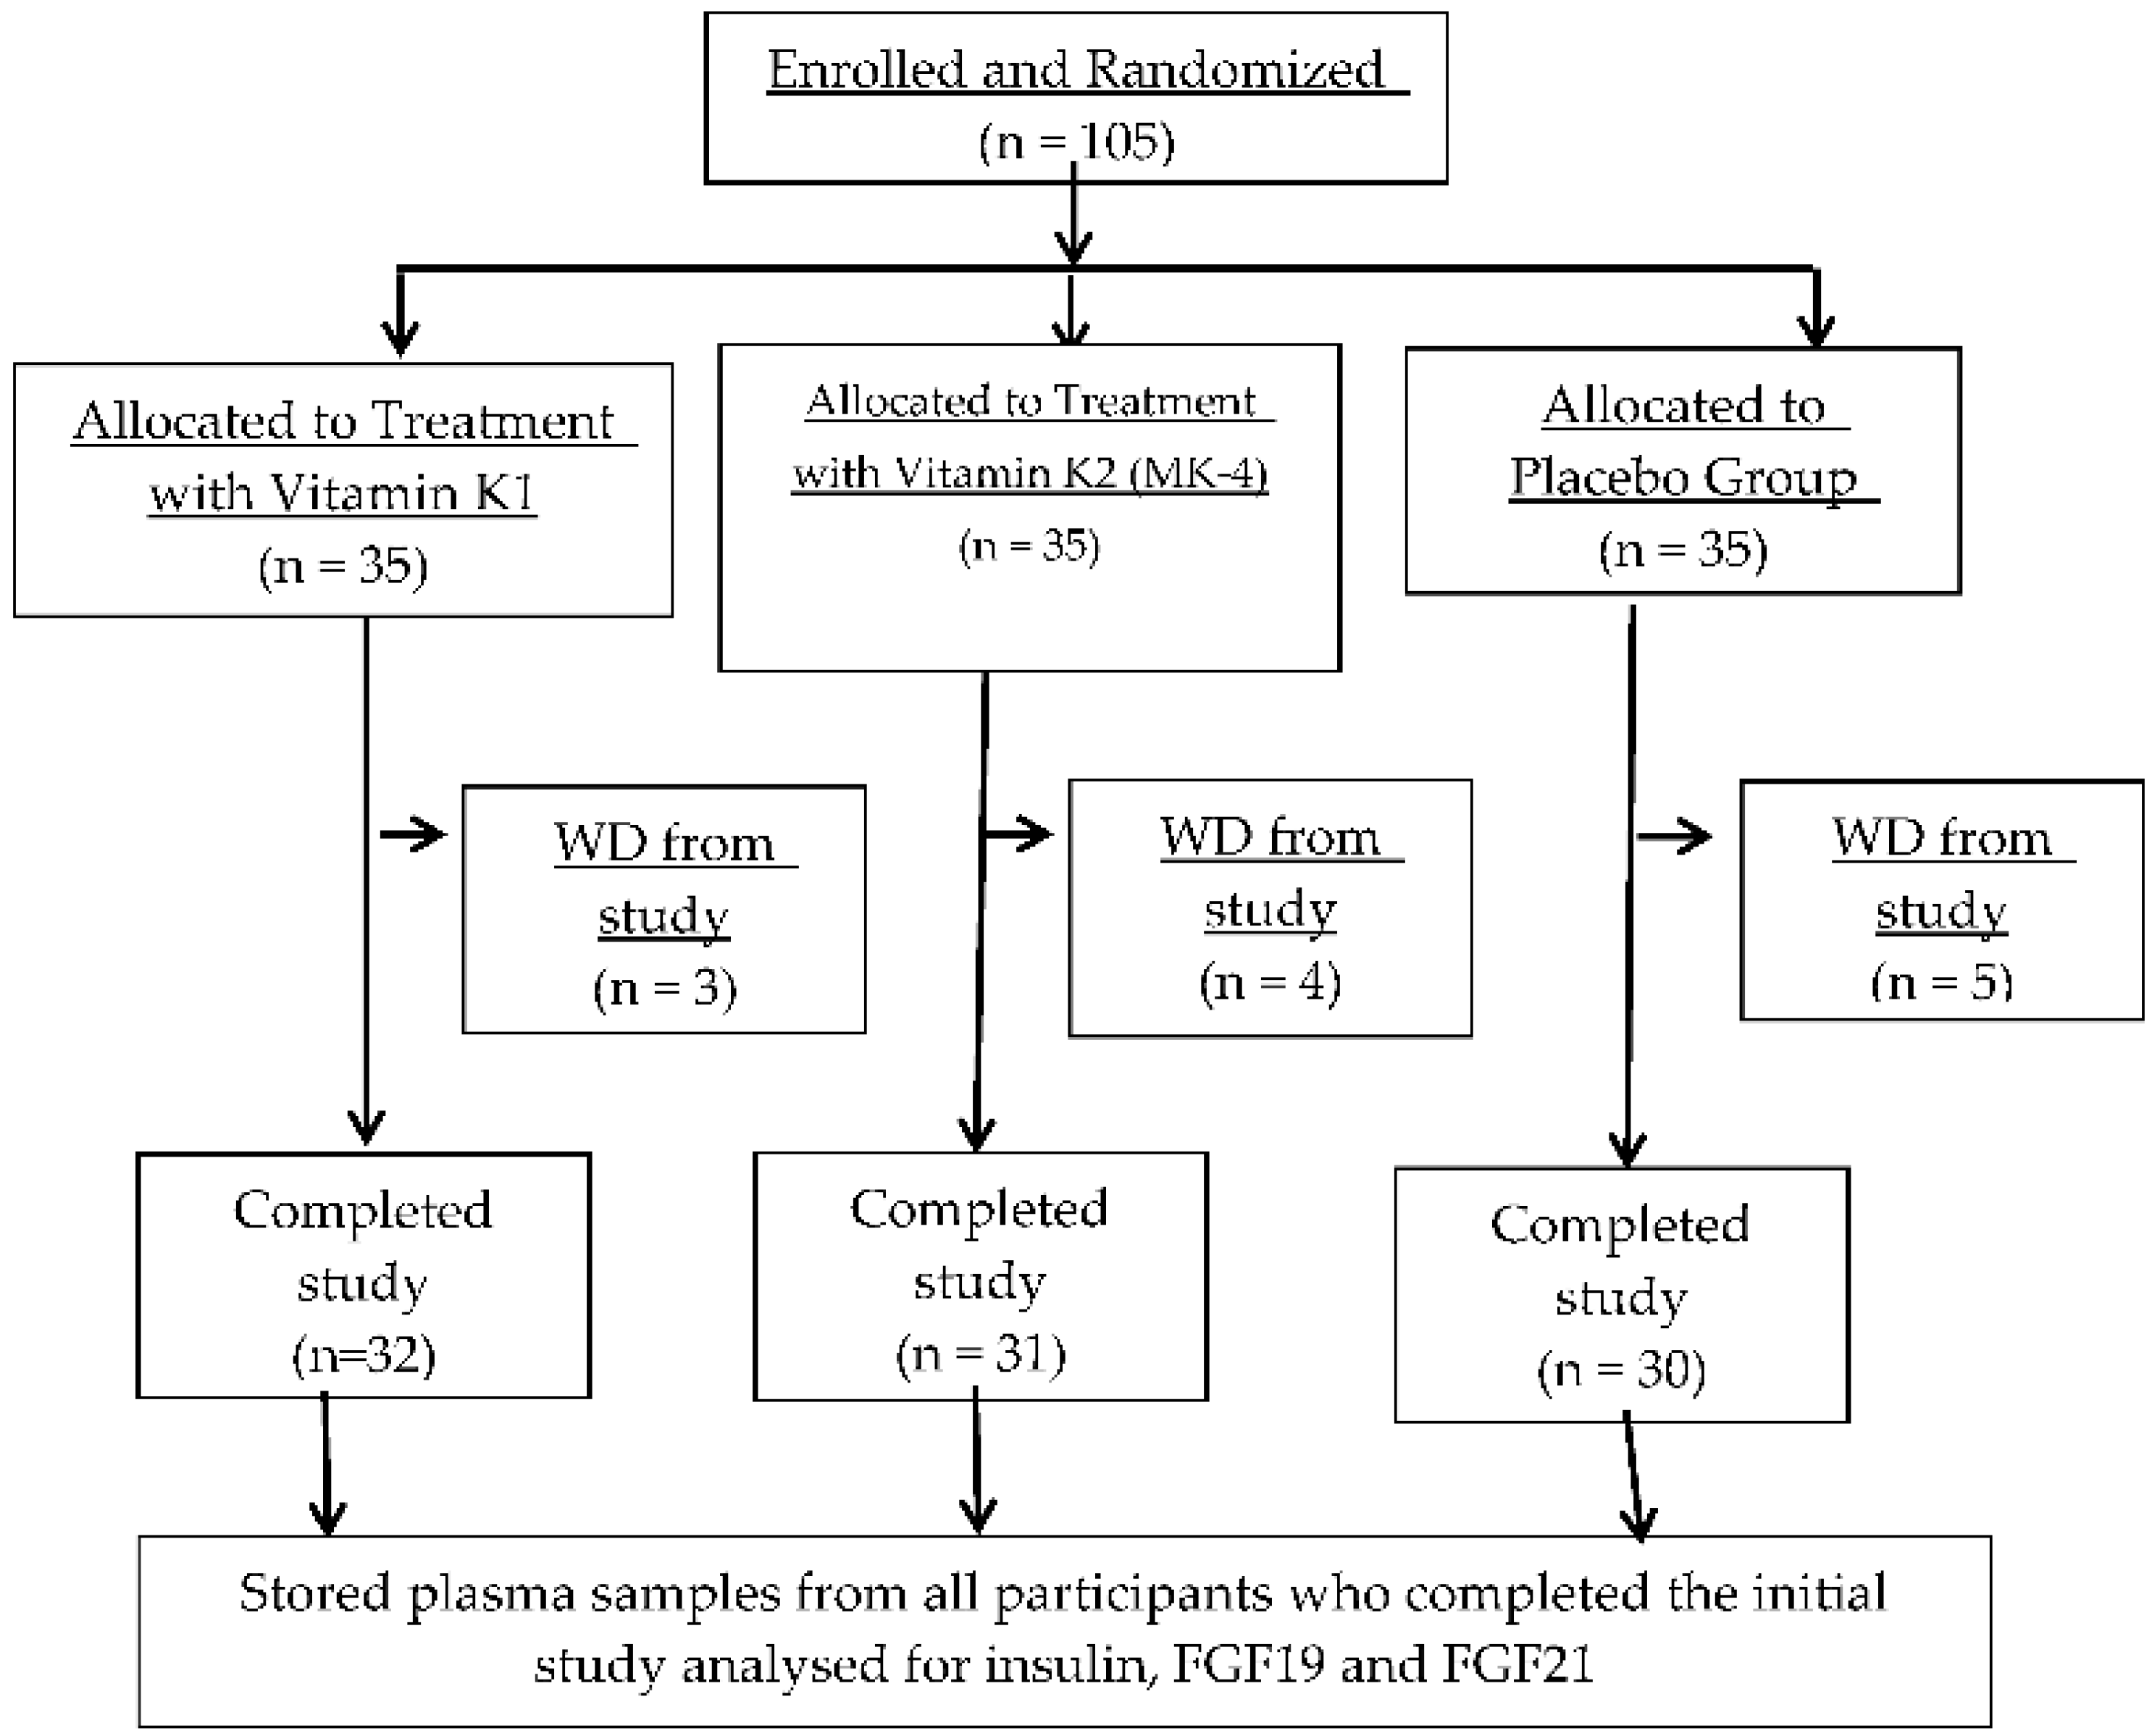
The current study investigates the relationship between VK status, insulin secretion and circulating concentrations of FGF19 and FGF21 and uses stored samples from a previous clinical trial (Vitamin K in Osteoporosis Trial, EudraCT;2010-02258712, ClinicalTrials.gov registry ID; NCT01232647). The previous trial was an 18 month double-blind randomised placebo controlled trial (RCT) of VK1 (1 mg/day) and VK2 (menaquinone-4, MK4 45 mg/day in 3 divided doses of 15 mg) conducted in 105 ambulatory post-menopausal women with osteoporosis (PMO) aged between 55-85 years [
17]. Privacy rights of participants were observed and informed consent was obtained for the study involving human subjects. The trial was in 2 stages consisting of a pre-screen stage when participants were invited to have serum VK1 concentration measured after at least a 2 hour fast. Those with serum VK1 concentration of ≤ 0.40 µg/L (defined as low or insufficient VK) were randomised into 3 groups (placebo, VK1 or VK2, n=35 in each arm). Exclusion criteria included secondary osteoporosis, glucocorticoid use, Chronic kidney disease stage 4 and 5, untreated endocrine disorders (primary hyperparathyroidism, hyperthyroidism), diabetes mellitus, chronic liver disease, malabsorption (extensive bowel surgery, short bowel, treatment with VK antagonists; warfarin. Of the 105 women who entered the intervention trial, 93 women completed the study (n=32 in VK1, n=31 in VK2 and n=30 in placebo arm). The study protocol is shown in
Figure 1. Samples which were not used in the ‘The Vitamin K in Osteoporosis Trial’ were stored in aliquots at -80
oC. All participants had consented for their stored samples to be used in future ethically approved studies. A separate ethical approval was obtained for the current study (REC reference number: 22/WA/0105). All procedures were performed in compliance with relevant laws and institutional guidelines and have been approved by the Health and Care Research Wales Committee, UK and the Human Research Authority (HRA), UK. Stored samples taken at baseline, 6 and 18 months were analysed for fasting Insulin, FGF19 and FGF21. A summary of participants demographics and baseline laboratory results at study entry is shown in
Table 1. The pre-screen serum VK1 concentration was lower compared to serum VK1 measured at study entry (median [IQR] pre-screen: 0.25 [0.18, 0.28] ug/L, study entry baseline visit: 0.32 [0.21, 0.48] ug/L
, p< 0.001).
2.2. Routine Laboratory Analyses
Routine laboratory biochemical tests, including renal, liver and bone profiles, were measured by standard laboratory methods on the Roche automated analysers (Roche Diagnostics Limited, West Sussex, UK). Results were available from the previous ‘Vitamin K in osteoporosis’ study [
17]. Estimated GFR was calculated using the Modification of Diet in Renal Disease formula. Serum vitamin K1 was measured by liquid chromatography-tandem mass spectrometry (LC-MS/MS), involving the initial sample preparation step and chromatographic separation before tandem MS detection [
18,
19]. The assay coefficient of variation (CV) was <8%. In-house standards for vitamin K1 assay calibration were prepared in line with ISO 15189 (2012) requirements, and the assay performance was evaluated through participation in the international Vitamin K External Quality Assurance Scheme (KEQAS). The reference interval of vitamin K1 for adults differs for the fasting and non-fasting states, and it is 0.17 – 0.68 ug/L (0.38 – 1.51 nmol/L) and 0.15 – 0.55 ug/L (0.33-3.44 nmol/L) respectively. Fasting plasma insulin was measured by electrochemiluminescence immunoassay on the automated Roche Cobas Elecsys analysers. The CV of the assay is less than 5%, and the measuring range is between 2.78 – 6945pmol/L. The Limit of Detection and Quantitation are 2.78 and 6.95 pmol/L, respectively. The normal range for fasting plasma insulin in healthy individuals is between 17.8 and 173 pmol/L.
Homeostasis model assessment of insulin resistance (HOMA-IR) could not be derived from fasting insulin as plasma glucose measurements were not measured during the original study [
17] and plasma glucose could not be measured in the stored samples as they were collected in specimen tubes containing EDTA which can lead to lower glucose levels [
20].
2.3. FGF19 and FGF21 Assays
FGF19 was measured using the human FGF19 DuoSet ELISA (DY969) and ancillary reagent kit (DY008) (Biotechne Ltd, Abingdon OX14 3NB, UK). The detection limit (LOD) was 6.55 pg/ml and the limit of quantification (LOQ) was 21.6 pg/ml. The inter-assay coefficient of variation (CV) was 9.1% and the intra-assay CV was 5.0%. FGF19 and FGF21 were measured in serum aliquots which had not been thawed previously. The human FGF21 Duoset (DY2539) from Biotechne was used to measure serum FGF21. The LOD and LOQ for FGF21 were 7.4 and 24.4 pg/ml respectively. Inter-assay CV and intra-assay CV were 10.2% and 8.2% respectively. There was no cross-reactivity between FGF19 and FGF21 ELISAs. Serum FGF19 and FGF21 were measured at 3 different time-points; baseline, 6 and 18 months.
2.4. Statistical Analyses
Sample size was based on power calculation done for the ‘vitamin K in osteoporosis’ study with changes in bone mineral density as primary outcome measure. The current study is an extension of the previous trial and is an explorative study with different outcome measures including insulin, FGF19 and FGF21. However, before undertaking the current study, an initial sample size calculation was done based on data on changes in serum FGF19 concentrations in controls compared to individuals with Type 2 diabetes mellitus (T2DM) [
15]. Assuming a change in serum FGF19 of 30% with a standard deviation of 35% following vitamin K1 or K2 (MK4) compared to placebo, a sample size of 29 per group would be sufficient to detect this magnitude of change with 90% power at 5 % significance level.
The statistical analyses were done using IBM SPSS Statistics version 26 for Windows (
https://www.ibm.com/products/spss-statistics). Statistical analyses were carried using data of all participants who completed the study. Mean and standard deviation (SD) or median (interquartile range; IQR) were estimated for all continuous variables. Non-parametric data including serum FGF19 and FGF21 were log-transformed before parametric statistical tests were used.
Repeated measures ANCOVA analysis with Bonferonni correction was done for multiple testing of log-transformed plasma insulin at the three different time points: Baseline, 6M and 18M. Within-group analysis evaluated the changes in plasma insulin in each treatment arm over 18 months adjusted for baseline vitamin K1 concentration. Between-group analysis assessed the difference in plasma insulin between treatment groups at each time point. Similarly, repeated measures ANCOVA was done for multiple testing of Log FGF19 and FGF21 measured at Baseline, 6M and 18M. Within-group analysis evaluated the change in serum FGF19 and FGF21 in each treatment arm over 18 months. Between-group analysis assessed the difference in serum FGF19 and FGF21 between treatment groups at each time point (Baseline, 6M and 18M). Univariate ANCOVA with Bonferonni correction was used to look at differences in FGF19 and 21 at each timepoint (dependent variable) with treatment arms (independent variable) corrected for baseline FGF19 and FGF21, age, body mass index (BMI) and baseline serum vitamin K as covariates. Non-parametric statistics (Wilcoxon-signed Rank test) was used to compare FGF21 at 6 months with baseline values in the VK2 group. A ‘p’ value of less than 0.05 was considered significant.
3. Results
3.1. Study Participants
Data presented relate to the 93 women who completed the study (n=32 in VK1, n=31 in VK2 and n=30 in placebo arm). Adherence to the vitamin K supplements and placebo was 99.3% in the vitamin K1 arm, 96.3% in the MK4 arm and 97% in the placebo arm. Body Mass Index (BMI) did not change significantly over 18 months in the entire study population (median [interquartile range IQR] baseline 23.10 [21.20, 26.00] kg/m 2 18 months; 23.50 [21.60, 25.90] kg/m 2, p=0.07). There was no significant difference in routine laboratory parameters; creatinine, e GFR, serum 25(OH)vitamin D at 18 months compared to baseline in the whole study population. There was a significant correlation between BMI and plasma insulin at baseline (r=0.525, p<0.001). Significant correlations were seen between serum FGF19 and FGF21 at all time points (baseline: r=0.614, p<0.001, 6 months: r=0.665, p<0.001, 18 months: r=0.623, p<0.001).
3.2. Changes in Plasma Insulin Following VK1 and VK2
There was no significant correlation between baseline VK1 and plasma insulin in the entire study population (r=0.062
, p=0.5). There were significant correlations between baseline plasma insulin and FGF21 at 6 (r= 0.25
, p=0.016) and 18 months (r=0.23
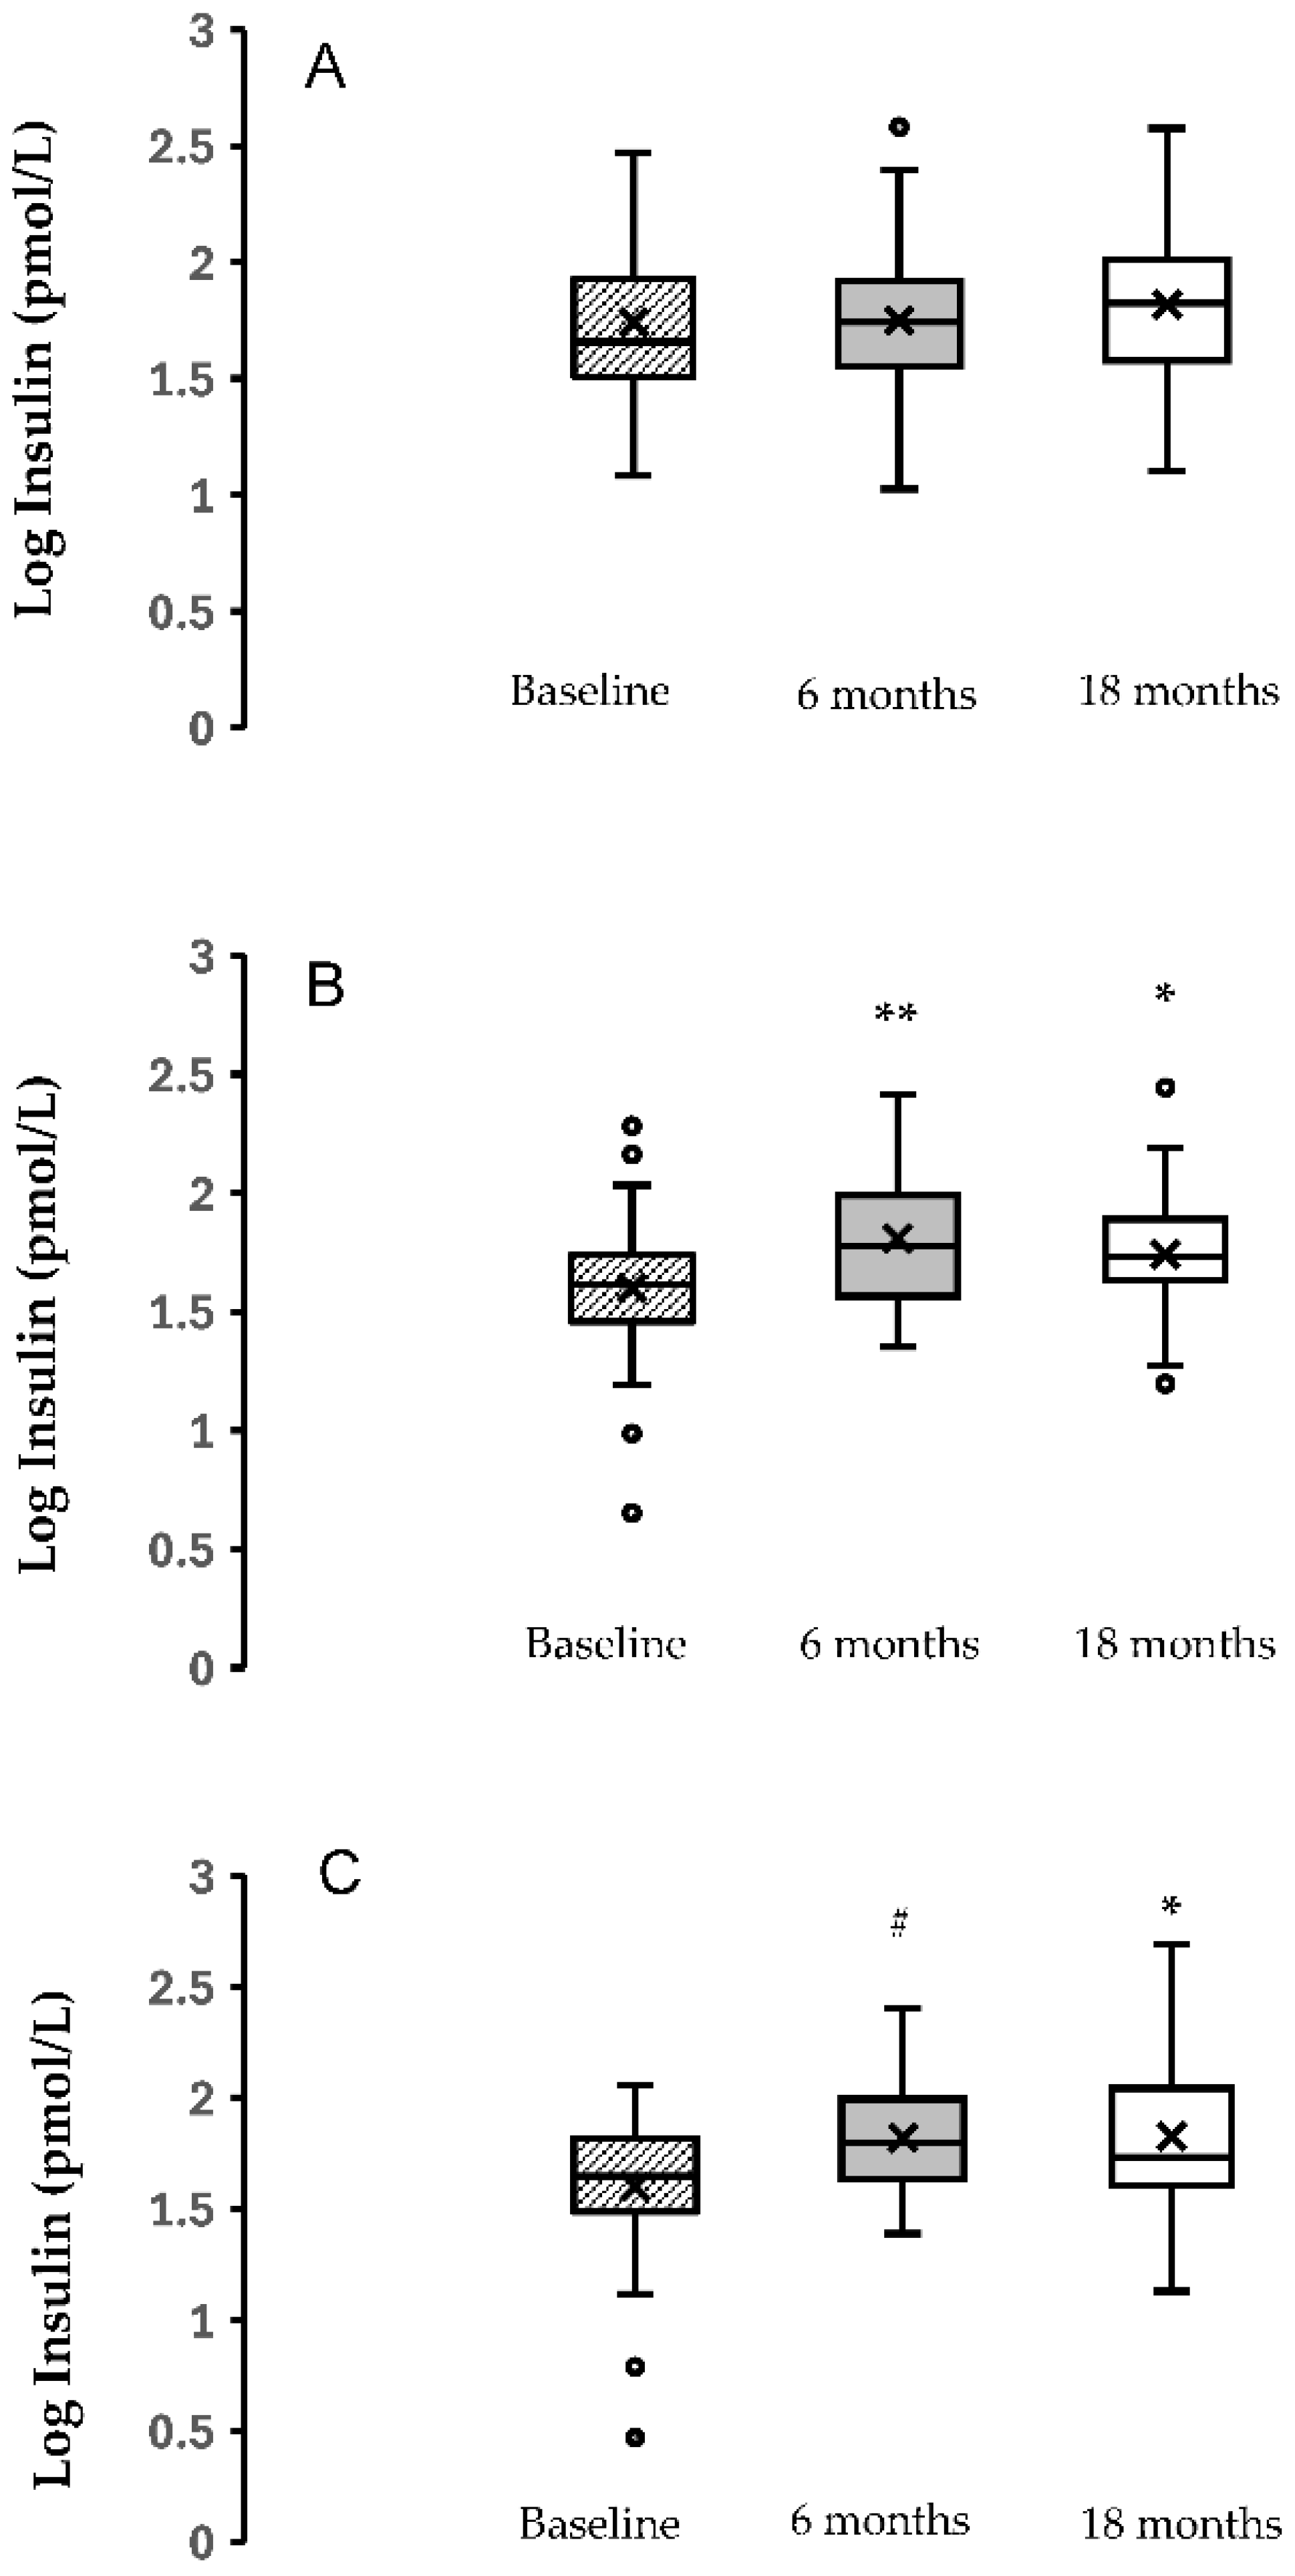
, p=0.03) in the entire study population, irrespective of treatment arms. Repeated measures ANCOVA was used to test changes in plasma insulin (within-group and between-group analyses) using log-transformed data at three different time points (Baseline, 6M and 18M. Within-group analysis, adjusted for baseline serum VK1 concentration and BMI, showed that plasma insulin at 6M and 18M increased significantly compared to baseline value in both treatment arms (VK1 and VK2 (MK4) ) (Median Insulin [IQR] VK1: baseline : 41.2 [29.3, 54.3] pmol/L, 6 months: 59.7 [37.8, 89.5] pmol/L
p<0.001, 18 months: 54.3[43.5, 73] pmol/L at 18M (
p= 0.05), VK2 (MK4) arm (Median Insulin [IQR]: baseline: 44.3[30.6, 60.9], 6 months: 63.2[43.5, 97] pmol/L
p=0.011, 18 months: 54.2[40.7, 103.5] pmol/L
p=0.05) as shown in
Figure 2. No significant changes in plasma insulin were seen over time in the placebo group (Median Insulin [IQR] placebo: baseline: 45.4 [32.6, 78.6], 6 months: 55.1 [35.8, 82.6]
p=0.2, 18 months: 66.7 [39.8, 95.9] pmol/L
p=0.07). The results are shown in
Figure 1. Between-group analysis using log -transformed plasma insulin showed no significant difference at any time point.
3.3. Changes in FGF19 and FGF21 Following VK1 and VK2
Within-group analysis showed no significant differences in serum FGF19 at any time points compared to baseline (Median FGF19 [IQR] placebo: baseline: 140.45 [67.12, 369.93], 6 months: 59.00 [65.42, 245.72]
p=0.9, 18 months: 196.2 [120.6, 387.3] pg/mL
p=0.87). No significant changes in circulating FGF19 were seen within the treatment arms (Median FGF19 {IQR] VK1: baseline: 95.9 [63.7, 228.9] pg/mL , 6 months :120.4 [60.7, 284.1] pg/mL
p=0.9, 18 months:117 [48.4, 336.3] pg/mL
p=0.9), VK2: baseline: 131.8 [63.6, 421.2], 6 months: 160.05 [64.1, 389.4]
p=0.9, 18 months: 119.4 [46.9, 333.4] pg/mL
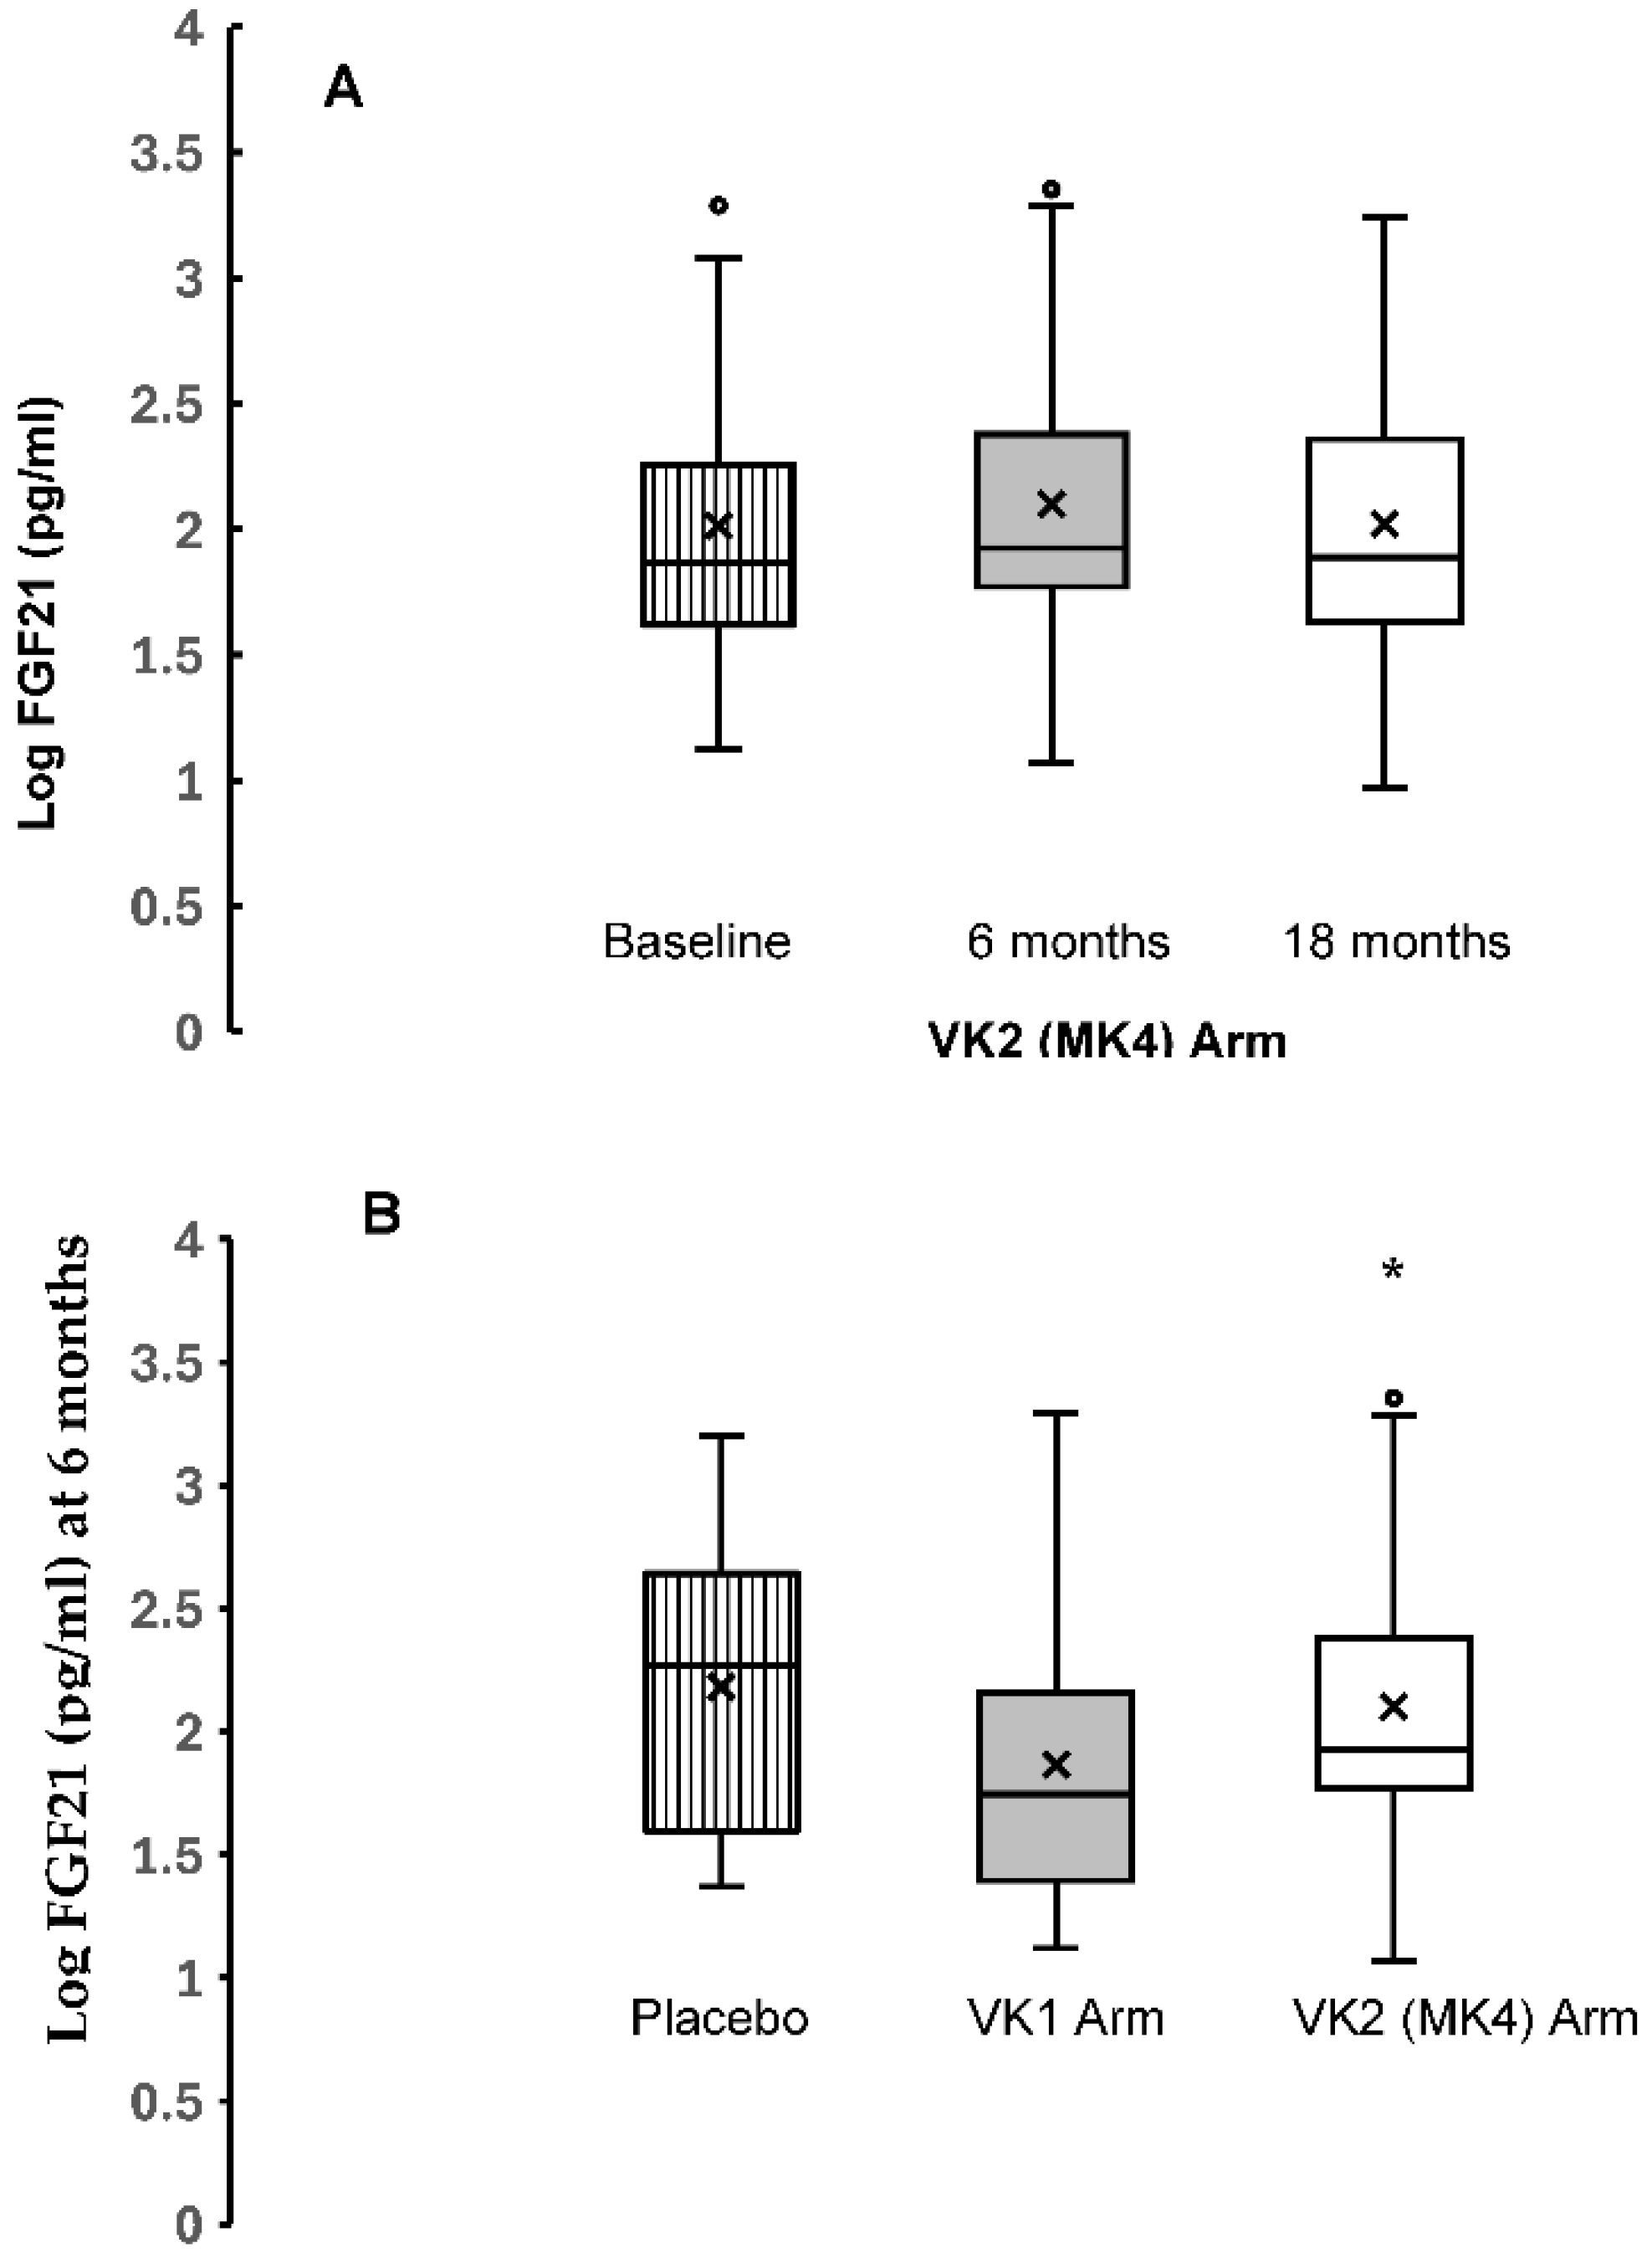
p=0.46). Between-group analysis of log-transformed FGF-19 showed no significant difference at any time points. Using repeated measures ANCOVA, FGF21 did not differ significantly at any time points compared to baseline in any groups (Median FGF21 [IQR] placebo: baseline: 125 [46, 280], 6 months : 186 [39.5,438] p=0.9, 18 months: 127.5 [51,541] pg/mL p=0.27, VK1: baseline: 101 [28, 204] pg/mL , 6 months :56 [25, 147] pg/mL p=0.7, 18 months: 62.4 [42, 198.4] pg/mL
p=0.9, VK2: baseline: 73.5 [41.5, 169.5], 6 months: 84.3 [59, 243.7]
p=0.19, 18 months: 77.4 [42.6, 228] pg/mL
p=0.96). However, FGF21 tended to be higher at 6 months compared to baseline in the VK2 group. This was significant when comparing the 2 time points using the Wilcoxon signed -rank test
(p=0.045) (
Figure 2) Between-group analysis showed no significant differences in FGF21 at any timepoints. However, using univariate ANCOVA analysis, FGF21 was significantly higher in the VK2 group compared to the VK1 group at 6 months
(p=0.02) adjusted for age, BMI, baseline FGF21 and serum vitamin K (
Figure 3).
Table 1.
Summary of participants demographics and baseline biochemical parameters.
Table 1.
Summary of participants demographics and baseline biochemical parameters.
| Characteristics |
VK1
N=35
|
VK2 (MK-4)
N=35
|
Placebo
N=35
|
P-Value |
Completed study
(n) |
32 |
31 |
30 |
|
Age (years)
Mean [SD] |
65 [6] |
69 [7] |
67 [7] |
0.064 |
BMI (kg/)
Mean [SD] |
24.5 [5.6] |
23.4 [2.5] |
24.9 [5.6] |
0.9 |
| Creatinine (µmol/L) Mean [SD} |
65 [9] |
65 [9] |
67[1]) |
0.9 |
eGFR (ml/min)
Mean [SD] |
81 [14] |
81 [16] |
79 [15] |
0.9 |
Serum Vitamin K1 (µg/L)
Mean [SD] |
0.38 [0.23] |
0.34 [0.26] |
0.45 [0.26] |
0.067 |
4. Discussion
In summary, we observed significant correlations between FGF19 and FGF21 at all time points and a significant correlation between baseline insulin in the whole study populationand FGF21 at 6 and 18 months. Vitamin K supplementation with either VK1 or K2 (MK4) significantly increased insulin secretion at 6 and 18 months. Circulating FGF21 increased at 6 months following VK2 (MK4) compared to VK1. Our data appear to suggest that improving VK status may improve insulin secretion. In addition, MK4’s effect on the insulin axis may be mediated, at least in part, by FGF21. Further confirmatory studies are needed.
Both FGF19 and FGF21 increases glucose tolerance and insulin secretion/sensitivity, thus their functions in the regulation of glucose and lipid metabolism overlapto a large extent [
9]. It is therefore not surprising to observe a significant relationship between the circulating concentrations of both factors in our study population. FGF21, in particular, is an insulin-dependent hormone and plays an important role in the insulin signalling pathways, thereby improving insulin sensitivity [
21]. Studies have also shown that insulin is an important factor in stimulating FGF21 production [
22]. This would explain our findings of the significant association between FGF21 and insulin concentrations in the study population.
Several studies point to a role of vitamin K in metabolism. Several cross-sectional and epidemiological studies have suggested that VK may reduce insulin resistance [
3,
4,
23]. There is a paucity of data as to whether VK can improve insulin secretion. Data from intervention studies of VK in humans are mixed. One clinical trial using VK1 (500 ug daily) showed an improvement in insulin sensitivity, determined by HOMA-IR, in older men but not in women at 36 months [
23]. In another small intervention study in healthy young men (n=12), one week supplementation with VK2 (MK4 90mg/d) led to improvement in insulin response following 75 gram glucose loading in the subgroup (n=4) with the highest descarboxy prothrombin (DP) levels, a marker of VK status [
24]. However, there were no significant differences in fasting insulin before and after MK4 supplementation. In our study, we observed increases in fasting insulin at all time points in the groups supplemented with VK1 and K2 (MK4) but not in the placebo group in within-group analysis but not in between-groups analysis. One explanation for our findings is that within-subject variability is smaller than between-subject, hence it is easier to show statistical significance compared to between-subject because any individual differences between participants are controlled for as each participant acts as their own control. Our study was not large enough to detect between-group differences. Nevertheless, our data suggest that both VK1 as well as K2 (MK4) increases insulin secretion in post-menopausal women. Increases in insulin secretion are unlikely to be due to increased insulin resistance as there was no significant difference in BMI in the intervention trial participants at baseline (study entry) and 18 months (study end). MK4’s bioavailability in tissues is higher than other forms of VK as it is the dominant form in tissues such as the pancreas [
25]. VK1 is metabolised to tissue (MK4) through a pathway that converts dietary VK1 to menadione, which is prenylated to MK4 in target tissues by UBIAD1, which may explain the similar effect of VK1 and MK4 supplementation on insulin secretion [
26]. The direct up-regulation of Insulin 1, Insulin 2 and Cyclin D2 gene expression has been observed following treatment with MK-4, indicating possible β-cell proliferation following MK-4 supplementation which would support the findings of this study [
27]. MK4 may also act as an incretin amplifier, increasing glucose-stimulated insulin secretion in β-cells by enhancing cyclic AMP-driven insulin exocytosis as described in animal studies [
28].
In this study, we also sought to identify if any factors such as FGF19 and FGF21 could modulate VK’s effects on insulin sensitivity. We did not observe any differences in FGF19 following VK1 or MK4 supplementation. One explanation for our findings is that FGF19 and VK may affect different target tissues. The effect of FGF-19 on energy and glucose homeostasis may primarily involve peripheral tissues, such as adipose tissues and the sympathetic nervous system, as previously described in β-Klotho knock-out mice [
29]. Vitamin K or more specifically MK4, on the other hand, may act on pancreatic tissue. We observed an increase in FGF21 at 6 months following MK4 supplementation only. This is unlikely to be due to the increase in insulin which has been shown to increase FGF21 production as this was not observed in the VK1 group. Our data would suggest that the increase in FGF21 may be MK4 specific and may also be dose- dependent as we would expect higher concentrations of MK4 following supplementation with 45 mg/day of MK4 compared to the concentrations which may be achieved through VK1 conversion. Our data would suggest that MK4 may also have an effect on insulin sensitivity as well via the FGF21 pathway. FGF21 is expressed in several tissues including the pancreas as FGF21 mRNA has been detected in adipose, muscle and pancreatic tissues [
30].
Our study, however, has several limitations. Firstly, the study was an extension of a previous study designed to assess the additive effect of VK on bone mineral density in post-menopausal women with osteoporosis who were already on standard osteoporosis treatment with oral bisphosphonate [
17]. The current study was not powered to detect any changes in insulin/FGF19 and FGF21 which could also explain why we did not observe any significant changes when between-group analyses were done. Thus, the statistical analyses and data remain exploratory. Secondly, our findings may not be representative of the general population as the study population consisted of post-menopausal women with low serum VK1 concentrations. Thirdly, we did not assess insulin sensitivity by deriving HOMA-IR as an indirect measure of insulin resistance as glucose measurements were not carried out in the original study. Fourthly, we derived BMI only and did not carry out other anthropometric measurements to assess insulin resistance and metabolic syndrome risk such as waist circumference which is an indicator of visceral fat and weight-height ratio.
In conclusion, 18 months supplementation with VK1 and MK4 increased insulin secretion. FGF21 concentration increased at 6 months following MK4 supplementation only. Our study suggests that VK, in particular MK4 may have an effect on insulin secretion and sensitivity via the modulation of FGF21. Further investigations are needed with future studies designed specifically to test whether VK has a beneficial effect on insulin secretion and insulin resistance in other populations including those at risk of the metabolic syndrome.
Author Contributions
Eunji Kim: literature review, investigation, methodology, setting up study database and formal data analyses and interpretation. Amelia Moore; project administration, participants recruitment, database management, Renata Gorska; methodology, data acquisition and interpretation. Kieran Voong; methodology, data acquisition and interpretation. Dominic. J. Harrington; Funding acquisition, investigation, data interpretation. Geeta Hampson; funding acquisition, conceptualisation, investigation and supervision, formal data analyses, writing original draft. All authors participated in the review and editing of the manuscript.
Funding
This study was funded, in part, from a research grant awarded by the Royal Osteoporosis Society, UK (research grant ref 191). The original clinical trial started in April 2015. The funder had no role in the design, data collection, data analysis, and reporting of this study.
Statement of Ethics
Study approval statement: . This study protocol was reviewed and approved by the Health and Care Research Wales Committee, UK and the Human Research Authority (HRA), UK, approval number: 22/WA/0105). Written informed consent was obtained from to participate in the original study and all participants had agreed for their stored samples to be used in future ethically approved studies.
Data Availability Statement
The data that support the findings of the study are not publicly available in order not to compromise the privacy of the research participants. The non-identifiable/anonymised data that support the findings of this study are available from the corresponding author, [GH], upon reasonable request by clinical or academic researchers for non-commercial use.
Conflicts of Interest
Amelia Moore, Kieran Voong, Renata Gorska, Dominic. J. Harrington declare that they have no conflict of interests’. Geeta Hampson has received speaker honoraria and been on advisory boards in relation to treatment agents for osteoporosis.
References
- Ho, H. J.; Komai, M.; Shirakawa, H. Beneficial Effects of Vitamin K Status on Glycemic Regulation and Diabetes Mellitus: A Mini-Review. Nutrients 2020, 12(8), 2485. [Google Scholar] [CrossRef]
- Shearer, MJ; Newman, P. Recent trends in the metabolism and cell biology of vitamin K with special reference to vitamin K cycling and MK-4 biosynthesis. J Lipid Res. 2014, 55(3), 345–62. [Google Scholar] [CrossRef]
- Varsamis, NA; Christou, GA; Kiortsis, DN. A critical review of the effects of vitamin K on glucose and lipid homeostasis: its potential role in the prevention and management of type 2 diabetes. Hormones (Athens) 2021, 20(3), 415–22. [Google Scholar] [CrossRef]
- Ibarrola-Jurado, N; Salas-Salvado, J; Martinez-Gonzalez, MA; Bullo, M. Dietary phylloquinone intake and risk of type 2 diabetes in elderly subjects at high risk of cardiovascular disease. Am J Clin Nutr. 2012, 96(5), 1113–8. [Google Scholar] [CrossRef]
- Dumitru, N; Carsote, M; Cocolos, A; Petrova, E; Olaru, M; Dumitrache, C; Ghemigian, A. The Link Between Bone Osteocalcin and Energy Metabolism in a Group of Postmenopausal Women. Curr Health Sci J 2019, 45(1), 47–51. [Google Scholar] [PubMed]
- Ferron, M; Hinoi, E; Karsenty, G; Ducy, P. Osteocalcin differentially regulates beta cell and adipocyte gene expression and affects the development of metabolic diseases in wild-type mice. Proc Natl Acad Sci U S A 2008, 105(13), 5266–70. [Google Scholar] [PubMed]
- Hill, HS; Grams, J; Walton, RG; Liu, J; Moellering, DR; Garvey, WT. Carboxylated and uncarboxylated forms of osteocalcin directly modulate the glucose transport system and inflammation in adipocytes. Horm Metab Res. 2014, 46(5), 341–7. [Google Scholar] [CrossRef]
- Bullo, M; Moreno-Navarrete, JM; Fernandez-Real, JM; Salas-Salvado, J. Total and undercarboxylated osteocalcin predict changes in insulin sensitivity and beta cell function in elderly men at high cardiovascular risk. Am J Clin Nutr. 2012, 95(1), 249–55. [Google Scholar] [CrossRef]
- Dolegowska, K; Marchelek-Mysliwiec, M; Nowosiad-Magda, M; Slawinski, M; Dolegowska, B. FGF19 subfamily members: FGF19 and FGF21. J Physiol Biochem. 2019, 75(2), 229–40. [Google Scholar] [CrossRef]
- Yan, J; Nie, Y; Cao, J; Luo, M; Yan, M; Chen, Z; He, B. The Roles and Pharmacological Effects of FGF21 in Preventing Aging-Associated Metabolic Diseases. Front Cardiovasc Med. 2021, 8, 655575. [Google Scholar] [CrossRef] [PubMed]
- Jin, L; Yang, R; Geng, L; Xu, A. Fibroblast Growth Factor-Based Pharmacotherapies for the Treatment of Obesity-Related Metabolic Complications. Annu Rev Pharmacol Toxicol. 2023, 63, 359–82. [Google Scholar] [CrossRef]
- Yan, J; Nie, Y; Cao, J; Luo, M; Yan, M; Chen, Z; He, B. The Roles and Pharmacological Effects of FGF21 in Preventing Aging-Associated Metabolic Diseases. Front Cardiovasc Med. 2021, 8, 655575. [Google Scholar] [CrossRef]
- Loomba, R; Sanyal, AJ; Kowdley, KV; Bhatt, DL; Alkhouri, N; Frias, JP; et al. Randomized, Controlled Trial of the FGF21 Analogue Pegozafermin in NASH. N Engl J Med. 2023, 389(11), 998–1008. [Google Scholar] [CrossRef]
- Wu, AL; Coulter, S; Liddle, C; Wong, A; Eastham-Anderson, J; French, DM; et al. FGF19 regulates cell proliferation, glucose and bile acid metabolism via FGFR4-dependent and independent pathways. PLoS One 2011, 6(3), e17868. [Google Scholar]
- Barutcuoglu, B; Basol, G; Cakir, Y; Cetinkalp, S; Parildar, Z; Kabaroglu, C; et al. Fibroblast growth factor-19 levels in type 2 diabetic patients with metabolic syndrome. Ann Clin Lab Sci. 2011, 41(4), 390–6. [Google Scholar] [PubMed]
- Ryan, PM; Hayward, NE; Sless, RT; Garwood, P; Rahmani, J. Effect of bariatric surgery on circulating FGF-19: A systematic review and meta-analysis. Obes Rev. 2020, 21(8), e13038. [Google Scholar]
- Moore, AE; Dulnoan, D; Voong, K; Ayis, S; Mangelis, A; Gorska, R; et al. The additive effect of vitamin K supplementation and bisphosphonate on fracture risk in post-menopausal osteoporosis: a randomised placebo controlled trial. Arch Osteoporos. 2023, 18(1), 83. [Google Scholar] [CrossRef]
- Shea, MK; Booth, SL. Concepts and Controversies in Evaluating Vitamin K Status in Population-Based Studies. Nutrients 2016, 8(1), 8. [Google Scholar] [CrossRef] [PubMed]
- Górska, RM. Methods for assessment of vitamin K. In Laboratory Assessment of Vitamin Status; Harrington, DJ, Ed.; Academic Press: London; K, 2019; pp. 107–147. [Google Scholar]
- Frank, EA; Shubha, MC; D'Souza, CJ. Blood glucose determination: plasma or serum? J Clin Lab Anal. 2012, 26(5), 317–20. [Google Scholar] [CrossRef] [PubMed]
- Zhang, H; Zhu, R; Sun, Q; Du, L. Research progress on the role of FGF21 in insulin resistance. Front Endocrinol (Lausanne) 2025, 16, 1619462. [Google Scholar] [CrossRef]
- Samms, RJ; Lewis, JE; Norton, L; Stephens, FB; Gaffney, CJ; Butterfield, T; et al. FGF21 Is an Insulin-Dependent Postprandial Hormone in Adult Humans. J Clin Endocrinol Metab. 2017, 102(10), 3806–13. [Google Scholar] [CrossRef]
- Yoshida, M; Jacques, PF; Meigs, JB; Saltzman, E; Shea, MK; Gundberg, C; et al. Effect of vitamin K supplementation on insulin resistance in older men and women. Diabetes Care 2008, 31(11), 2092–6. [Google Scholar] [CrossRef]
- Sakamoto, N; Nishiike, T; Iguchi, H; Sakamoto, K. Possible effects of one week vitamin K (menaquinone-4) tablets intake on glucose tolerance in healthy young male volunteers with different descarboxy prothrombin levels. Clin Nutr 2000, 19, 259–263. [Google Scholar] [CrossRef]
- Thijssen, H H W; Drittji-Reijnders, M J. Vitamin K distribution in rat tissues: dietary phylloquinone is a source of tissue menaquinone-4. Br J Nutr 1994, 72, 415±425. [Google Scholar] [CrossRef]
- Ellis, JL; Fu, X; Karl, JP; Hernandez, CJ; Mason, JB; DeBose-Boyd, RA; Booth, SL. Multiple Dietary Vitamin K Forms Are Converted to Tissue Menaquinone-4 in Mice. J Nutr. 2022, 152(4), 981–93. [Google Scholar] [CrossRef] [PubMed]
- Ho, HJ; Shirakawa, H; Hirahara, K; Sone, H; Kamiyama, S; Komai, M. Menaquinone-4 Amplified Glucose-Stimulated Insulin Secretion in Isolated Mouse Pancreatic Islets and INS-1 Rat Insulinoma Cells. Int J Mol Sci. 2019, 20(8). [Google Scholar]
- Hussein, AG; Mohamed, RH; Shalaby, SM; Abd El Motteleb, DM. Vitamin K(2) alleviates type 2 diabetes in rats by induction of osteocalcin gene expression. Nutrition 2018, 47, 33–8. [Google Scholar] [CrossRef] [PubMed]
- Lan, T; Morgan, DA; Rahmouni, K; Sonoda, J; Fu, X; Burgess, SC; et al. FGF19, FGF21, and an FGFR1/beta-Klotho-Activating Antibody Act on the Nervous System to Regulate Body Weight and Glycemia. Cell Metab. 2017, 26(5), 709–18 e3. [Google Scholar]
- Xie, T; Leung, PS. Fibroblast growth factor 21: a regulator of metabolic disease and health span. Am J Physiol Endocrinol Metab. 2017, 313(3), E292–E302. [Google Scholar] [CrossRef]
|
Disclaimer/Publisher’s Note: The statements, opinions and data contained in all publications are solely those of the individual author(s) and contributor(s) and not of MDPI and/or the editor(s). MDPI and/or the editor(s) disclaim responsibility for any injury to people or property resulting from any ideas, methods, instructions or products referred to in the content. |
© 2026 by the authors. Licensee MDPI, Basel, Switzerland. This article is an open access article distributed under the terms and conditions of the Creative Commons Attribution (CC BY) license (https://creativecommons.org/licenses/by/4.0/).