
Submitted:
09 December 2025
Posted:
10 December 2025
You are already at the latest version
Abstract
The degradation of vegetation cover and the vulnerability of urban market gardening systems to climate risks are a major challenge for food security in peri−urban areas. This study analyzes the spatio−temporal dynamics of vegetation using the NDVI index and assesses its correspondence with producers' perceptions of hydroclimatic impacts. NDVIs were extracted from the MODIS MOD13Q1 product via Google Earth Engine, with a spatial resolution of 250 m × 250 m and a temporal resolution of 16 days, then processed in Python using the xarray library. Additionally, 369 producers in Grand Nokoué were surveyed about the risks of flooding, drought, and heat waves, as well as the adaptation strategies they implement. The results reveal a decline in areas with a moderate to high NDVI index (between 0.41 and 0.81) and an expansion of areas with a low or very low NDVI index (below 0.41), reflecting increased fragmentation and degradation of vegetation cover. Producers' perceptions confirm this vulnerability and reveal different strategies depending on the type of crop and risk, including irrigation, temporary abandonment of plots, agroforestry, and the adoption of resilient crops. These observations highlight the need to implement targeted policies and appropriate agroecological practices in order to strengthen the resilience of urban market gardening systems to extreme climate risks.
Keywords:
remote sensing
; urban agriculture
; climate risks
; Producers’ perceptions
1. Introduction
Cities are widely recognized as major contributors to climate change due to their greenhouse gas emissions. However, they are also among the first victims of increased extreme and devastating weather events. In this context, urban agriculture is particularly vulnerable to environmental changes that affect urban ecosystems [2]. Urban vegetation is highly sensitive to increasing climate disturbances (e.g., extreme heat), and water stress, [3,4,5]. The sensitivity of vegetation to climate extremes depends heavily on its growth patterns and characteristics [6].
Therefore, climate change compromises the ability of urban agriculture to provide ecosystem services sustainably [2].
Nevertheless, urban agriculture is playing an increasingly important role in urban sustainability [7,8]. In 2016, the estimated percentage of global food production from urban areas was between 15 and 20% [9]. This contribution is expected to grow due to rapid urbanization to meet the increasing food demands of urban populations [10]. Within this sector, vegetable production plays a central role in improving the food supply in urban centers [11]. This branch of urban agriculture not only contributes to nutrition security, but can also be economically advantageous. Several studies have shown that locally grown vegetables are generally cheaper than those available in stores, especially when labor costs are excluded [12,13].
However, the development of this sector is occurring in a context of increasing climate vulnerability as systems are particularly sensitive to environmental hazards [16,17,18]. The IPCC’s sixth assessment report [19] emphasizes that continued global warming threatens the livelihoods, essential infrastructure, and food systems of billions of people. In sub-Saharan Africa, studies show that the frequency and intensity of extreme weather events are already exceeding the adaptive capacity of affected populations. This vulnerability is particularly concerning given that prolonged heat waves, drought, and limited access to water severely compromise the productivity and survival of food crops [20]. Additionally, temperature fluctuations and variations in water regimes lead to associated impacts such as the proliferation of pests, weeds, diseases, and invasive species, as well as changes in how people use and manage resources [22]. In Benin, where vegetable production plays an essential role in urban and peri−urban areas [23,24], these systems remain highly exposed to climatic hazards and environmental constraints. Research has confirmed this trend [21], revealing that the sustainability of vegetable production is severely compromised by the growing impacts of climate change, even in irrigated production systems [25]. This highlights the vulnerability of agricultural practices to environmental hazards [19]. Previous studies [26,27,28] have shown that climatic disturbances in recent decades strongly influence vegetation dynamics, compromising the productivity, stability, and spatial organization of cropping systems, as evidenced by variations in the NDVI. These impacts are amplified in urban contexts because vegetation is particularly vulnerable to hydroclimatic extremes, which are exacerbated by increased precipitation variability, intensified abiotic and biotic stresses, and rapid urbanization [24].
Furthermore, several studies show that the ecological responses of vegetation to climatic extremes result from interactions between the terrestrial biosphere and the climate system at multiple scales, in which biophysical feedback plays a decisive role in the observed dynamics [4]. In urban environments, vegetation’s sensitivity to thermal or water anomalies closely depends on the growth and ecophysiological characteristics specific to each type of land cover [6]. Herbaceous and shrub formations, which dominate market gardening systems, are among the most vulnerable due to their shallow root systems, high dependence on soil moisture, and rapid phenological cycle. This makes them highly susceptible to climate extremes [31]. These physiological responses often result in significant variations in vegetation indices, especially the normalized difference vegetation index (NDVI), which is commonly used to detect environmental disturbances in urban areas [32−35].
This vulnerability is particularly critical in African cities such as those in the Grand Nokoué region, where urban market gardening relies almost exclusively on short−cycle herbaceous crops. In recent years, studies on urban vegetation dynamics in West Africa have increased due to access to satellite data (MODIS, Landsat, and Sentinel) and the use of vegetation indices, such as the normalized difference vegetation index (NDVI) [36−39]. These studies have revealed connections between land use changes, climate variability, and the reduction of green spaces. However, research on vegetation cover density classes in cities is scarce, despite the fact that the interactions between urbanization, climate, and vegetation are particularly complex in these areas. Understanding this differential sensitivity is essential for assessing urban vegetation’s exposure to climate hazards, especially in market gardening systems, which depend heavily on stable environmental conditions for productivity [16,17,18]. The present study aims to analyze the spatiotemporal variability of urban vegetation cover using the normalized difference vegetation index (NDVI) and examine its relationship to perceived climate impacts to assess the resilience of urban horticultural production systems. Ultimately, this study aims to contribute to a better understanding of the interactions between climate, vegetation, and urban agricultural practices to support resilient urban planning and the sustainability of food systems in Grand Nokoué.
Subsequently, three specific questions guide the analysis to achieve: 1) What are the spatial and temporal trends in NDVI that reveal degradation or resilience in urban market gardening systems? 2) How do market gardeners perceive the impact of climate risks on their agricultural practices and yields? 3) What local strategies strengthen the resilience of urban market gardening in the face of climate hazards? The answers to these questions will inform and guide local land use planning policies and climate change adaptation strategies [38,39,40].
1.1. State of the Art
1.1.1. NDVI and Climate Impacts on Urban Agricultural Systems
Recent studies show that the Normalized Difference Vegetation Index (NDVI) is a reliable indicator of vegetation’s sensitivity to climate variations. By extension, it can be used to assess agricultural productivity. Several studies have revealed statistically significant correlations between the NDVI and various climate variables, demonstrating that temperature and precipitation fluctuations directly influence vegetative activity and crop performance [40,41]. The NDVI’s ability to reflect biomass status and phenological stages makes it an essential variable for anticipating the impacts of climate anomalies on agricultural yields. It supports decision−making and strengthens the resilience of production systems in the face of hazards [42]. Analyses conducted in various environments show that rising temperatures and declining precipitation significantly reduce herbaceous biomass, affecting the availability of forage resources and the productivity of agroecosystems [43]. Together, these results confirm the relevance of the NDVI as a biophysical proxy for understanding the mechanisms by which climate impacts vegetation, particularly in vulnerable urban contexts, such as Grand Nokoué. However, despite these contributions, the effects of climate risks on urban vegetation dynamics and market gardening system performance, particularly in African cities, are insufficiently documented.
1.1.2. Local Perceptions and Adaptation Strategies in Urban Market Gardening Systems: The Contribution of Participatory Approaches.
Several studies in West Africa and Benin have documented the impact of climate change on market gardening systems. These studies have highlighted the negative effects of droughts, extreme rainfall, and heat waves on agricultural productivity. For example, studies in northern Benin show that climate change significantly reduces vegetable production, leading to a measurable decline in the performance of intensive cropping systems [44]. Similarly, Monthly climate variability has been identified as a factor that determines the fluctuation of vegetable yields. This directly affects water availability, crop cycle duration, and disease incidence [2,20,21,22]. Faced with these risks, urban and peri−urban producers are adopting various adaptation strategies. Some studies have documented practices such as transplanting crops, developing shallow areas, using lowlands for irrigation, and alternative water resources to reduce losses associated with droughts and high temperatures [46]. Other studies show that these strategies include constructing wells and boreholes, improving lowland management, and implementing water conservation practices to maintain production despite increasing climate uncertainty. From a technical and agronomic perspective, some literature highlights the genetic improvement of crops, the use of resistant rootstocks, mulching techniques, organic farming, resource conservation technologies, and the integration of weather forecasting models to adapt market gardening systems to climate variability [47].
These strategies were developed in various contexts, but they can be applied to Benin, especially in urban areas where climate pressures and intense competition for agricultural land combine. However, despite the abundance of studies on climate impacts and adaptation strategies, limitations in literature persist. First, few studies distinguish between adaptation strategies according to crop category. Leafy vegetables, fruits, bulbs, and root crops have different biophysical vulnerabilities and water and heat requirements. This lack of distinction hinders our ability to understand the differential vulnerability of different crop types. Second, approaches integrating satellite data to analyze the response of vegetation to climate stress in urban environments are rare, especially in West African cities with complex socio-ecological mosaics. The NDVI, which is widely used to measure vegetation vigor and health, is rarely used to link biophysical dynamics to local perceptions in the context of urban market gardening. Nevertheless, integrating satellite data with local knowledge is particularly relevant for understanding crop health, water needs, and climate risks and for guiding management strategies adapted to coastal urban conditions [40,42]. However, the perceptions and adaptation strategies of local producers have been little analyzed from a perspective integrating both spatial (NDVI) and field data. This lack of knowledge limits the design of more resilient agro−urban models in areas such as Grand Nokoué that face increasingly severe climate hazards. This study will analyze NDVI dynamics and their climatic impacts on urban market gardening systems in Grand Nokoué using a two−pronged approach: (i) using satellite data to characterize the spatial evolution of vegetation classes and (ii) collecting participatory data from producers to integrate their perceptions of climate impacts and adaptation strategies. The ultimate goal is to provide an integrated understanding of ongoing transformations and identify strategies to strengthen the sustainability of market gardening in the context of urban climate change.
1.2. Justification for the Study
Urban farming systems are highly susceptible to climate hazards, especially rainfall fluctuations, heat stress, and frequent flooding [16,17,18]. Despite their socioeconomic importance, little research has been conducted on their ecological sensitivity and capacity to adapt to climate change. In this context, remote sensing using indicators such as the normalized difference vegetation index (NDVI) is a useful tool for analyzing vegetation dynamics and detecting signs of environmental stress affecting herbaceous vegetable crops. However, satellite data alone is insufficient for accurately interpreting observed changes, especially in fragmented urban environments, where microclimatic conditions, farming practices, and anthropogenic pressures strongly influence vegetation health. Therefore, it is useful to combine spatial analyses and participatory surveys to link biophysical signals to the experiences of producers. An integrated approach is necessary because existing studies mainly focus on rural agricultural areas [34,36,49], leaving a knowledge gap regarding vegetation dynamics in urban areas and the interactions between climate pressures and market gardening practices. Grand Nokoué, characterized by high urbanization, increased dependence on peri−urban agriculture, and direct exposure to hydroclimatic extremes, is a priority area for this type of research. The literature shows that local producers are vulnerable to rainfall variability and climate extremes, which undermines the stability and productivity of their production systems [52]. Their limited adaptation capacities increase the sensitivity of farms to climate variations.
Furthermore, national analyses indicate that Benin’s heavy dependence on agriculture and informal employment, without robust adaptation measures, exposes the country to a particularly fragile development trajectory [53]. In this context, the Benin National Adaptation Plan (NAP) emphasizes the need to integrate climate change adaptation into current and future development policies, programs, and strategies [54]. The present study fits into this context by providing up−to−date knowledge to effectively guide adaptation actions in urban market gardening systems. The study addresses three research gaps: First, it analyzes the spatio−temporal dynamics of NDVI classes in Grand Nokoué, an area that is still poorly documented. Second, it assesses the impacts of climate variables on herbaceous vegetable crops, which are highly sensitive to climate extremes. Third, it identifies and guides realistic adaptation strategies based on objective data and local perceptions, tailored to the specific realities of Grand Nokoué. This research provides a multi−source, contextualized analysis that responds to the urgent need to understand the interactions between climate and vegetation in urban environments. It also helps strengthen the scientific basis necessary for agricultural planning and urban resilience.
2. Materials and Methods
2.1. Study Area
The study area is located in southern Benin and extends between latitudes 6°18′ and 6°30′ North and longitudes 2°02′ and 2°40′ East (Figure 1). It is bordered by inland municipalities to the north, the Atlantic Ocean to the south, Nigeria to the east, and the municipality of Grand−Popo to the west (Figure 1). The study area encompasses the municipalities of Abomey−Calavi, Cotonou, Ouidah, Porto−Novo, and Sèmè−Podji. Figure 1 shows the geographical location of Grand Nokoué.
From 1979 to 2013, this region experienced spectacular demographic growth, with its population rising from 604,106 to nearly two million (1,984,206). According to the National Institute of Statistics and Demography (INStaD) projections, the population could exceed three million by 2026, accounting for approximately one−quarter of the national population. This rapid urbanization is leading to a significant increase in the need for food, highlighting the need to better understand the dynamics of vegetation cover and the impact of climate hazards on vegetable production. These hazards could hinder the development and resilience of urban vegetable farms, which are essential to food security in this strategic area.
Grand Nokoué has a tropical climate, with annual rainfall ranging from 898.2 to 1749.8 mm, averaging 1287.1 mm. The highest rainfall occurs in June, at 212.8 mm. The difference between the driest and wettest months is 194 mm. The average annual temperature is 26.7 °C, with a small range of 3.1 °C between the minimum and maximum temperatures observed during the year. Figure 2 shows the Walter−Lieth ombrothermic diagram for the s, based on average monthly temperature and rainfall data from 1991 to 2020.
2.2. Data Collection
This study takes an integrated approach, combining satellite, secondary, and primary data, to analyze the dynamics of vegetation cover and its interaction with farming practices in the Grand Nokoué region.
First, satellite data were used to evaluate the spatial and temporal evolution of vegetation from 2000 to 2024. This data consists of the normalized difference vegetation index (NDVI), which was extracted from the MOD13Q1 product of the Moderate Resolution Imaging Spectroradiometer (MODIS) sensor [55]. The data comes from NASA’s Earth Observing System Data and Information System (EOSDIS) and has a spatial resolution of 250 m by 250 m and a temporal resolution of 16 days from 2000 to 2024. The data were downloaded from Google Earth Engine (GEE), a global geospatial processing platform that uses Google’s extensive computing power to analyze and address significant societal issues [56]. These data were selected for their temporal continuity, high acquisition frequency, and ability to detect changes in vegetation cover. Therefore, it is a reliable tool for analyzing long−term vegetation dynamics.
Secondary data were collected through an in−depth literature review of scientific papers, technical reports, and national policy documents, including national communications on climate change, nationally determined contributions (NDCs), and the national adaptation plan (NAP). This step identified the main climate risks affecting urban and peri−urban market gardens. Finally, the identified risks were validated during semi−structured interviews with key stakeholders, who were selected using the snowball sampling method. A total of 20 experts in agriculture, climatology, and risk management were consulted.
Primary data collection used a mixed approach, combining quantitative and qualitative methods to cross−reference perceptions, practices, and observed dynamics. Quantitative surveys were conducted among farming households in the municipalities of Cotonou, Sèmè−Podji, and Ouidah. These municipalities were identified as major vegetable production hubs in the Grand Nokoué region.
2.3. Sampling Technique and Primary Data Collection
The sample size was determined using Daniel Schwartz’s formula, which is frequently used in field studies [57,58]. This formula is as follows:
Za represents the value of the standard deviation corresponding to a 5% risk (1.96), i.e., a 95% confidence interval, d represents the margin of error set at 10%, and P represents the estimated proportion of market gardening households exposed to climate risks. In the absence of reliable historical data to estimate this proportion, a conservative value of P = 0.5 was used to apply the formula. This choice, in line with methodological recommendations in the literature [57,59], maximizes the variance P (1 − P) and ensures a sufficient sample size to guarantee the statistical robustness of the study in a context of uncertainty. Table 1 shows the distribution of market gardeners surveyed by municipality.
To achieve the target sample size, 500 vegetable producers were initially contacted. Of those, 369 participated, representing an overall response rate of 73.8%. There were local variations in response rates, ranging from 78.2% in Cotonou to 68.4% in Ouidah.
The surveys were conducted in accordance with ethical research principles, including voluntary and informed participation. No discriminatory criteria were applied; however, particular attention was paid to the diversity of farmers in terms of gender, age, and farm size in consultation with local agricultural advisors. The questionnaire was digitized on the KoboToolbox platform and administered face-to-face by trained interviewers using the ODK Collect mobile application (v2024.3.6) [60,61]. This system minimized data entry errors, ensured the traceability of responses, and facilitated real−time monitoring of data collection.
In addition to the individual surveys, a participatory qualitative approach was implemented to enrich the understanding of the results. Three focus groups were organized, one in each municipality studied. Each session brought together eight to ten participants, including both men and women, who represented the various categories of market gardeners. These discussions allowed us to verify individual information, gain a deeper understanding of local perceptions of climate risks, gain a fuller picture of the impact of these risks, and identify adaptation strategies to environmental hazards.
2.4. Data Processing and Analysis
2.4.1. Satellite Data
To reduce the impact of atmospheric noise or cloud cover, the monthly average was calculated to obtain a representative Normalized Difference Vegetation Index (NDVI) image for each month between 2000 and 2024. We then converted all of these images into a collection and assembled them into a multiband image (25 years × 12 months), which we exported in TIFF format via Google Drive. Using monthly NDVI allows for detailed monitoring of vegetation changes over time. This temporal resolution improves the understanding of ecosystem dynamics by facilitating the analysis of Monthly and interannual vegetation variability and allowing the exploration of relationships between vegetation cover dynamics and climatic or environmental factors [62,63]. We divided the NDVI cube from Google Earth Engine according to the study area and then calculated the monthly and annual spatial averages to analyze the temporal evolution of vegetation cover. The obtained values were classified into five levels of vegetation vigor using predefined thresholds (Table 2), enabling the production of a thematic map and distribution statistics by class. Data processing was performed using the Python language and the xarray library, which is designed for efficiently manipulating multidimensional data.
Figure 3 below illustrates the steps followed to process and analyze NDVI satellite images in this study.
2.4.2. Primary Data
Several statistical and analytical approaches were employed to analyse the primary data. These included map mosaics, Sankey diagrams and statistical tests such as the chi−square (χ2) test and Fisher’s exact test. This ensured the most accurate possible interpretation and decision−making.
Additionally, an impact matrix was developed to systematically evaluate the impact of climate risks on vegetable production. This tool enabled the qualification and comparison of the perceived levels of impact according to different hazards (e.g., drought, flooding, high winds).
2.5. Justification of the Methodological Choice
Although several previous studies have used curve matching algorithms based on NDVI phenological signatures to detect horticultural plots, this approach was not used here due to specific constraints related to the data and the objectives of the study.
Firstly, the extremely fragmented landscape structure of the urban market gardening system, characterised by very small micro−plots inserted into a highly impervious urban matrix, limits the effectiveness of algorithms that rely exclusively on the shape of NDVI curves. These techniques generally perform better in large, homogeneous agrosystems — conditions that are not met here. Secondly, the main objective of this research was not to produce detailed maps of vegetable plots, but rather to conduct a spatio−temporal analysis of vegetation cover dynamics and evaluate the relationship between hydroclimatic stress and NDVI variability. From this perspective, synthetic indicators such as NDVI density classes, annual average values and Monthly anomalies are more appropriate and directly aligned with the analytical objectives pursued. Finally, the chosen approaches have the advantage of being more robust in the face of significant interannual variability in phenological cycles, making them better suited to densely populated urban environments. These approaches thus ensure greater reproducibility and consistent spatial and temporal comparisons, providing greater scientific relevance in a context marked by significant environmental and climatic heterogeneity.
3. Results
3.1. Analysis of Vegetation Cover Dynamics Derived from NDVI
3.1.1. Mapping of Vegetation Cover Density Classes
Figure 4 illustrates the spatial distribution of vegetation cover density classes based on annual average NDVI values for the period 2000−2024 in Grand Nokoué. NDVI values were classified into five main categories, reflecting degrees of vegetation cover density and vitality. Analysis of Figure 4 highlights significant spatial heterogeneity in vegetation change within Grand Nokoué. The southern coastal strip is characterised by low to very low NDVI values. In contrast, the northern and western peripheral areas have higher values, reflecting denser and more diverse vegetation. Overall, the NDVI typology reveals a clear dichotomy between the heavily degraded urban centre and the still−vegetated peripheral areas.
3.1.2. Interannual Changes in Vegetation Cover Classes Derived From NDVI
Figure 5 shows changes in area according to NDVI classes in Grand Nokoué between 2000 and 2024. Diachronic analysis of the areas corresponding to the different classes reveals significant changes in vegetation cover within the study area. The study area covers 126,727.83 hectares in total. Within this area, the proportion of medium to high vegetation (classes 3 and 4) has declined significantly, while the proportion of low and very low vegetation (classes 1 and 2) has expanded rapidly and continuously. In 2000, areas with medium vegetation (class 3) covered 89,984 hectares (ha), compared to 50,523 ha in 2024 — a decrease of around 44%. Conversely, areas with low vegetation (class 2) increased threefold, growing from 16,547 ha to over 51,000 ha during the same period. Areas with very low vegetation (class 1) also exhibited an upward trend, peaking at over 11,000 ha in 2017. This dual dynamic, characterised by a decline in areas with moderate vegetation and an expansion of areas with low coverage, reflects widespread deterioration in urban vegetation cover. Areas with dense vegetation (class 4) and very dense vegetation (class 5) remain marginal and are in steady decline.
3.2. Monthly Dynamics of Urban Vegetation Based on Monthly NDVI
Figure 6 shows the evolution of land area according to NDVI classes in Grand Nokoué between 2000 and 2024. A diachronic analysis of the areas corresponding to the different classes reveals significant changes in the vegetation cover of the study area. The study area covers 126,727.83 hectares in total. Within this area, the proportion of medium to high vegetation (classes 3 and 4) has declined significantly, while the proportion of low and very low vegetation (classes 1 and 2) has expanded rapidly and continuously. In 2000, areas with medium vegetation (class 3) covered 89,984 hectares (ha), compared to 50,523 ha in 2024 — a decrease of around 44%. Conversely, areas with low vegetation (class 2) increased threefold, growing from 16,547 ha to over 51,000 ha during the same period. Areas with very low vegetation (class 1) also exhibited an upward trend, peaking at over 11,000 ha in 2017. This dual dynamic, characterised by the decline of areas with moderate vegetation and the expansion of areas with low coverage, reflects widespread deterioration in urban vegetation cover. Areas of dense (class 4) and very dense (class 5) vegetation remain marginal and are constantly decreasing. Class 4 areas decreased from 7705 hectares (ha) in 2000 to 5879 ha in 2024, while class 5 areas remained virtually non−existent (less than 10 ha). This confirms the scarcity of areas with high biomass or closed vegetation within the urban perimeter.
A two−factor analysis of variance (class and year) applied to the mean NDVI class areas highlights a highly significant class effect (F = 2856.96; p < 0.001), reflecting marked differentiation of areas according to vegetation levels. However, the effect of year is not significant (F = 0.12; p = 0.733), suggesting that interannual variability does not explain the observed differences in isolation. Nevertheless, the ‘class × year’ interaction is highly significant (F = 75.37; p < 0.001), indicating that changes in surface area by class are context−dependent: certain vegetation categories increase or decrease in contrasting ways from one year to the next.
3.3. Perception of Climate Risks by Market Gardeners
Figure 7 presents mosaic plots illustrating market gardeners’ perceptions of the various climate risks likely to affect their crops. Analysis of these graphs shows that floods, droughts and heatwaves are the risks most often mentioned by producers in the Greater Nokoué region. Among these risks, floods and droughts appear to be the most dominant.
Examining the standardised residuals in Figure 7a reveals that bulb and root crop producers are most strongly associated with flooding, with a high positive standardised residual (between 2 and 4), indicating significant overrepresentation. In contrast, these same crops have slightly negative standardised residuals for drought (between −4 and −2), reflecting relative underrepresentation. This suggests that these crops are perceived as being less sensitive to drought than the independence hypothesis would suggest.
Figure 7b shows that respondents in Ouidah have negative standardised residuals (between −4 and −2) for floods, indicating underrepresentation, while drought is overrepresented (between +2 and +4). In Cotonou, heat waves appear to be overrepresented (residuals between +2 and +4), while drought is underrepresented (between −4 and −2).
3.4. Perception of Risk Impacts
An analysis of exposure components reveals that market gardening systems are vulnerable to various hydroclimatic risks affecting soil, water resources, and crops simultaneously (Table 3).
Flooding can cause severe soil degradation, including nutrient leaching, erosion, compaction, de-structuring, and a reduction in arable land. Flooding also degrades the quality of irrigation water and can temporarily submerge wells and boreholes. These disturbances lead to significant plant mortality and the spread of waterborne diseases. They also result in a rapid decline in crop growth, leading to immediate crop losses, lower yields and incomes, and additional costs associated with reworking the soil, fertilization, and replanting.
Drought reduces the moisture content of soil, increases its temperature, and hardens it. This causes salinization, erosion, and a decrease in organic matter. Surface water reserves decrease, and pollutants become more concentrated, which exacerbates water stress on plants. Crops then experience slower growth, smaller sizes, and increased susceptibility to diseases and pests. This leads to lower yields and incomes, as well as increased dependence on costly pumps and wells.
Heat waves exacerbate evaporation and soil degradation, decrease soil’s water retention capacity, and reduce arable land. They also lead to declining water reserves, increased pollutant concentrations, and water salinization. Crops suffer from heat stress, which disrupts photosynthesis, causes leaf burn and flower abortion, and accelerates leaf senescence. Consequences include lower yields, critical income losses, additional costs for irrigation and fertilization, increased dependence on pumps and wells, and reduced Monthly employment.
3.5. Adaptation Strategies of Market Gardeners According to Climate Risks and Crop Types
Cross−analyzing the adaptation strategies reported by market gardeners reveals a strong dependence on both climate risk types and crop categories. This highlights the diversity of agronomic responses implemented in the Greate Nokoué region. When faced with flooding, most producers adopt avoidance strategies. The most common strategy is temporarily abandoning their plots (59.7%). Complementary responses include drainage (17.9%) and adopting crops resilient to excess water (16.4%), while agroforestry remains marginal (5.97%). These choices reflect the significant exposure of urban market gardening areas to flooding and the technical difficulty of maintaining production during flooding. In the event of drought, strategies focus more on water management, with increased irrigation as the dominant response (47.4%). Market gardeners also use resilient crops (14.7%), agroforestry (12.1%), improved seeds (6.03%), and crop combinations (8.62%). Temporary abandonment is also used, albeit to a lesser extent than in the case of floods. In the face of heat waves, the range of responses is more diverse. The most popular strategies are increased irrigation (34.5%), agroforestry (17.6%), crop combinations (12.6%), rotation (11.8%), and resilient crops (10.9%). Temporary abandonment (7.56%) and improved seeds (5.04%) are the least popular methods, but they illustrate a combination of actions aimed at reducing heat stress and maintaining productivity. However, these trends vary depending on the type of crop. Bulb and root crops favor temporary abandonment (28.2%) and increased irrigation (21%) due to their sensitivity to excess water and variations in water availability. Leafy vegetables favor increased irrigation (26.5%) but also show significant use of agroforestry (16.7%), which is essential for limiting losses associated with high temperatures. Fruit vegetables have the highest proportion of temporary abandonment (35.4%) and increased irrigation (31%). All of these results, summarized in the Sankey diagram (Figure 8), highlight the clear relationship between the type of risk, the nature of the crops, and the employed adaptation strategies. Market gardeners adopt different responses depending on the biophysical constraints specific to each crop, confirming the need for targeted adaptation policies specific to urban market gardening systems.
4. Discussion
The dynamics of the NDVI reveal significant spatial and temporal variations, indicating gradual degradation of plant biomass in the Greater Nokoué region. The spatial heterogeneity observed (Figure 4) reflects the increased fragmentation of the vegetation cover, which is mainly caused by urban expansion and the growing pressure on land use. These results corroborate those of [64], which demonstrate that irregularities in NDVI distribution can be explained by the configuration of the urban landscape. Impervious surfaces, such as roads, buildings, and parking lots, are directly juxtaposed with vegetated areas. This urban configuration, characterized by the alternation of impervious surfaces and residual green pockets, creates microclimates that hinder vegetation regeneration and accentuate ecological contrasts. Low to very low NDVI values (classes 1 and 2) in coastal and downtown areas indicate a lack of vegetation and high anthropogenic pressure. These fragile areas are particularly vulnerable to urban heat islands, decreased soil moisture, and increased susceptibility to droughts and heat waves. Similarly, study [64] revealed that highly urbanized areas corresponded with the formation of new hotspots in terms of land surface temperature (LST). This highlights the impact of urban development on vegetation dynamics and ecological balance. The results of studies [3−5] showed that urban vegetation is sensitive to extreme heat, water stress, and increasing climate disturbances. Monthly spatial analysis (Figure 6) shows that these urban and coastal areas do not return to expected vegetation levels, even during wet periods, reflecting a low capacity for ecological regeneration in the face of continuous anthropogenic pressure.
Furthermore, the significant “Class × Year” interaction indicates that different vegetation categories do not uniformly respond to interannual climate variations. This heterogeneity suggests that certain classes, particularly those associated with vegetable crops, are more sensitive to rainfall and temperature anomalies, resulting in marked fluctuations in their biomass. This differentiated dynamic suggests that vegetated systems in Grand Nokoué do not have the same resilience capacity in the face of climatic hazards. This could ultimately lead to the destabilization of agricultural areas, reduced productivity, and increased vulnerability of market gardens in peri−urban zones.
These results corroborate previous findings that sensitivity to climatic extremes is largely determined by urbanization dynamics and the specific properties of each vegetation type [6].
There is a clear convergence between NDVI values and the perceptions of market gardeners in Grand Nokoué. In urban areas such as Cotonou, where NDVI values are low and vegetation cover is fragmented, heat waves are overrepresented in producers’ perceptions (residuals of +2 to +4). While floods and droughts are mentioned more frequently overall, the proportion of producers in Cotonou who report heat waves as a major risk is significantly higher than general trends suggest. This specificity reflects increased sensitivity to extreme heat episodes in highly urbanized, impervious environments subject to urban heat islands. Thus, the local perception of risk in Cotonou appears to align with the biophysical characteristics indicated by low NDVI values. This finding supports the hypothesis that the degraded urban environment directly influences vegetable production conditions and risk perception (see Figure 7.b). According to [65], episodes of extreme heat, particularly successive heat waves, can significantly reduce agricultural yields, with losses ranging from 1 to 71%, depending on the crop and region. More generally, vegetable production activities take place in environments subject to urban microclimates [66]. A number of studies carried out at the regional level demonstrate that highly urbanized areas intensify warming climate conditions [67], which has repercussions for the environment and climate. This phenomenon is strongly linked to urban heat island (UHI) effects, which can contribute to an additional increase in local temperatures of up to 2 °C. The correspondence between biophysical dynamics and local knowledge reinforces the robustness of interpretations, showing that market gardeners’ perceptions reflect observed environmental conditions. Therefore, urban market gardening systems appear particularly vulnerable to the dual pressures of rapid urbanization and increased climate variability.
The analysis of adaptation strategies (Figure 8) confirms this differentiated vulnerability. When faced with flooding, market gardeners overwhelmingly abandon their plots temporarily (59.7%), reflecting their farms’ structural inability to maintain production in the event of excess water. This choice reveals a lack of effective drainage infrastructure, compacted urban soils, and producers’ low investment capacity. This is consistent with studies showing that African market gardening systems often resort to “default” forms of adaptation when water constraints become extreme [69,70]. Though this strategy is functional in the short term, it interrupts crop cycles and undermines incomes, thereby increasing urban food vulnerability. During periods of drought, producers favor increased irrigation and supplement it with practices such as agroforestry or the use of resilient crops. This increased dependence on an already limited water resource reflects the structural constraints of urban environments in West Africa, where efficient irrigation systems are unavailable and groundwater reserves are overexploited [71]. These palliative measures temporarily reduce water stress but do not strengthen long−term resilience, confirming the persistent influence of technological and financial deficits [72].
Heat waves, amplified by the urban heat island effect and the fragmentation of vegetation cover, encourage market gardeners to intensify irrigation while implementing agroecological practices, such as agroforestry, crop combinations, and crop rotations. These practices aim to mitigate heat stress in a context where rising temperatures increase evapotranspiration, limit photosynthesis, and reduce yields [73]. This phenomenon is particularly pronounced in Cotonou, where low, sustained NDVI values, as well as the extent of impervious surfaces, exacerbate crop sensitivity. This is in line with studies showing that urban microclimates can increase heat waves by an additional 1 to 2 °C [68]. These results align with observations in several African cities where market gardeners employ similar adaptation strategies in response to climate risks. In Senegal and Chad, for example, flooding often causes the temporary abandonment of plots due to inadequate drainage infrastructure and the significant degradation of saturated soils [74]. Similarly, studies in Burkina Faso [75,76] and Ghana [77,78] show that the dominant response to drought is intensive irrigation despite growing pressure on water resources. Finally, studies in Bangladesh [79] have highlighted the urgent need for coordinated responses to the multidimensional impacts of heat waves. These studies demonstrate that integrating nature−based solutions is crucial for strengthening community resilience, protecting public health, and preserving economic and environmental stability amid accelerated warming. Strengthening sustainable agricultural practices and establishing inclusive policy frameworks that mobilize all stakeholders is essential to supporting the adaptation of agricultural systems and effectively reducing the impacts of climate change [80].
The differences among crop types reveal distinct adaptations. Bulbs and roots depend on temporary abandonment and irrigation. Leafy vegetables favor irrigation and agroforestry to mitigate heat stress. Fruit vegetables require a combination of abandonment and irrigation due to their sensitivity to extremes. These results demonstrate the need for targeted policies and strengthened agroecological infrastructure and practices to improve the resilience of urban market gardening systems, as strategies remain largely reactive.
The evolution of NDVI classes illustrates vegetation cover degradation and increasing fragmentation. The decline of moderate−to−dense classes (3 and 4) and the rapid expansion of low−to−very−low classes (1 and 2) reflect sustained weakening of biomass and reduction of potentially productive peri−urban market gardening areas. Together with the observed perceptions and adaptation strategies, this confirms that urban market gardeners face dual pressures: reduced green spaces due to urbanization and intensified hydroclimatic risks.
Based on these results, several priority actions can strengthen the resilience of urban market gardening in the Grand Nokoué area.
- Targeted urban greening, particularly around and within production areas, is essential for reducing the fragmentation of vegetation cover, as evidenced by low normalized difference vegetation index (NDVI) values. Developing green corridors and protecting residual agricultural areas would mitigate the urban heat island effect, which is particularly pronounced in Cotonou.
- Strong perceptions of flooding highlight the need to improve local drainage, clean gutters regularly, and create small retention basins inside or near market gardening sites. This infrastructure would reduce the temporary abandonment of plots, a dominant strategy identified in the study;
- In light of recurring water shortages, it is essential to develop water−efficient irrigation systems suited to small urban plots, such as micro−sprinklers, rainwater harvesting, and optimization of existing boreholes. Promoting drought− and flood−resistant varieties would also help maintain productivity.
- The results show that agroecological practices such as agroforestry, crop rotation, and intercropping mitigate the effects of heat waves. Reinforcing these practices as nature−based solutions should be encouraged in all municipalities in Greater Nokoué. Finally,
- The implementation of targeted training programs for market gardeners that incorporate water management, climate change adaptation, NDVI interpretation, and participatory monitoring would facilitate the connection between biophysical data and local experiences. This would improve decision−making and urban planning.
5. Limitations of the study and prospects
This study provides solid results on NDVI dynamics and the climate vulnerability of urban market gardening; however, it has several limitations. First, the spatial resolution of MODIS data (250 m) is too coarse to capture the high fragmentation of micro−plots in Grand−Nokoué. Using Sentinel−2 data or drones, which offer better resolution and temporal flexibility, is a promising way to improve the accuracy of the analysis. The inability to integrate land use data and imperviousness indicators limits the ability to quantify the direct impact of urbanization on low NDVI values. Additionally, seasonal and monthly analyses could be developed further to better link NDVI variations to extreme weather events. Besides, the convergence between local perceptions and biophysical data has not been statistically tested. Using advanced models could reinforce or nuance this relationship. Finally, integrating socio−economic factors and comparing with other West African cities would provide a more comprehensive understanding of the determinants of market gardening resilience. In the future, a combination of high−resolution remote sensing, in−depth spatial statistical analyses, and participatory surveys will be necessary to develop more effective adaptation strategies for urban areas in Benin.
6. Conclusions
This study analyzed the spatiotemporal evolution of the NDVI and the impact of hydroclimatic factors on market gardening systems in Grand Nokoué using an integrated approach that combined remote sensing and local producer perceptions. The results revealed that market gardening vegetation is highly sensitive to climatic variations, especially droughts, heavy rainfall, and heat waves. Observed NDVI fluctuations demonstrate that water stress primarily reduces plant biomass in an urban context characterized by surface impermeability, heat island intensification, and land pressure, all of which exacerbate the vulnerability of agroecosystems. Analysis of the surveys revealed remarkable convergence between satellite dynamics and producer perceptions, including a decline in vegetation vigor, lower yields, and increased perceived climate risks during rainfall deficits. This consistency underscores the value of local knowledge in interpreting NDVI signals and improving our understanding of environmental dynamics in urban areas.
The identified adaptation strategies remain essentially individual and autonomous. They are also limited by structural constraints, such as limited access to water, poor hydro−agricultural infrastructure, a lack of drainage systems, precarious land tenure, and weak collective coordination. These limitations reduce producers’ ability to effectively respond to an increase in hydroclimatic hazards. Thus, the results highlight the urgent need to strengthen the resilience of urban market gardening through structural interventions, such as developing appropriate water management infrastructure, building resilient hydro−agricultural facilities, implementing integrated stormwater management systems, securing land tenure, and integrating nature into urban planning. Additionally, using NDVI as an early warning tool combined with local knowledge makes it possible to anticipate climatic stresses and support decision-making.
In conclusion, this research underscores the importance of a multi-source, participatory approach to evaluating the vulnerability of urban market gardening systems to climate change. The study proposes a methodological framework that can be applied to other African cities facing similar dynamics and provides evidence to inform local food resilience policies in urban areas.
Author Contributions
Conceptualization, V.V.A.A.; Data curation, V.V.A.A.; Formal analysis, V.V.A.A. and K.K.; Funding acquisition, V.V.A.A.; Investigation, V.V.A.A.; Methodology, V.V.A.A. and K.K.; Re−sources, V.V.A.A. and K.S.K.; Software, V.V.A.A.; Supervision, K.S.K. and E.W.V.; Validation, K.K.; Visualization, V.V.A.A., D.F.B and K.K.; Writing—original draft, V.V.A.A. and D.F.B; Writing—review and editing, V.V.A.A. All authors have read and agreed to the published version of the manuscript. D.F.B.: writing, review, and editing.
Funding
This research was funded by the Regional Center of Excellence on Sustainable Cities in Africa (CERViDA−DOUNEDON), the Association of African Universities (AUA), and the World Bank. This research is funded under grant number IDA 5360 TG.
Data Availability Statement
Data will be made available upon request.
Acknowledgments
The authors would like to express their deepest gratitude to the Regional Centre of Excellence on Sustainable Cities in Africa (CERViDA–DOUNEDON), the Association of African Universities and the World Bank Group for their invaluable financial support, without which this study would not have been possible. They would also like to thank Climatematch Academy, a Neuromatch initiative, as well as African Cities Lab (ACL), which is supported by the Swiss Federal Institute of Technology in Lausanne (EPFL), and the Francophone African Community for Open Data (CAFDO) for their training programmes, capacity−building activities and technical resources, all of which contributed significantly to the processing, analysis and management of the data used in this research.
Conflicts of Interest
The authors declare that they have no conflicts of interest
Abbreviations
The following abbreviations are used in this manuscript:
| EOSDIS | Earth Observing System Data and Information System |
| GEE | Google Earth Engine |
| IPCC | Intergovernmental Panel on Climate Change |
| INStaD | Institut National de la Statistique et de la Démographie |
| LST | land surface temperature |
| MOD | Moderate |
| MODIS | Moderate Resolution Imaging Spectroradiometer |
| NAP | National Adaptation Plan |
| NASA | National Aeronautics and Space Administration |
| NDCs | Nationally Determined Contributions |
| NDVI | Normalized Difference Vegetation Index |
| ODK | Open Data Kit |
| TIFF | Tagged Image File Format |
References
- C40Cities Intégrer l’adaptation Au Changement Climatique: Un Guide Pour Les Urbanistes et Les Professionnels de l’adaptation. Glob. Platf. Sustain. Cities 2021, 66.
- Egerer, M.; Lin, B.B.; Diekmann, L. Nature Connection, Experience and Policy Encourage and Maintain Adaptation to Drought in Urban Agriculture. Environ. Res. Commun. 2020, 2, 041004. [Google Scholar] [CrossRef]
- Egerer, M.H.; Lin, B.B.; Kendal, D. Temperature Variability Differs in Urban Agroecosystems across Two Metropolitan Regions. Climate 2019, 7, 50. [Google Scholar] [CrossRef]
- Zoran, M.A.; Dida, A.I. Remote Sensing of Climate Changes Effects on Urban Green Biophysical Variables; Michel, U., Schulz, K., Ehlers, M., Nikolakopoulos, K.G., Civco, D., Eds.; Edinburgh, United Kingdom, 18 October 2016; p. 100051K. [Google Scholar]
- Wang, Y.; Mao, J.; Brelsford, C.M.; Ricciuto, D.M.; Yuan, F.; Shi, X.; Rastogi, D.; Mayes, M.M.; Kao, S.−C.; Warren, J.M.; et al. Thermal, Water, and Land Cover Factors Led to Contrasting Urban and Rural Vegetation Resilience to Extreme Hot Months. PNAS Nexus 2024, 3, pgae147. [Google Scholar] [CrossRef]
- Love, N.L.R.; Berkelhammer, M.; Tovar, E.; Romy, S.; Wilson, M.D.; Nunez Mir, G.C. Not All Green Is Equal: Growth Form Is a Key Driver of Urban Vegetation Sensitivity to Climate in Chicago. Remote Sens. 2025, 17, 2919. [Google Scholar] [CrossRef]
- Knapp, L.; Veen, E.; Renting, H.; Wiskerke, J.S.C.; Groot, J.C.J. Vulnerability Analysis of Urban Agriculture Projects: A Case Study of Community and Entrepreneurial Gardens in the Netherlands and Switzerland. Urban Agric. Reg. Food Syst. 2016, 1, 1–13. [Google Scholar] [CrossRef]
- Mensah, J.K. Urban Agriculture, Local Economic Development and Climate Change: Conceptual Linkages. Int. J. Urban Sustain. Dev. 2023, 15, 141–151. [Google Scholar] [CrossRef]
- Altieri, M.A.; Nicholls, C.I. Agroecología Urbana: Diseño de Granjas Urbanas Ricas En Biodiversidad, Productivas y Resilientes. Agro Sur 2018, 46, 49–60. [Google Scholar] [CrossRef]
- Grafius, D.R.; Edmondson, J.L.; Norton, B.A.; Clark, R.; Mears, M.; Leake, J.R.; Corstanje, R.; Harris, J.A.; Warren, P.H. Estimating Food Production in an Urban Landscape. Sci. Rep. 2020, 10, 5141. [Google Scholar] [CrossRef]
- Eigenbrod, C.; Gruda, N. Urban Vegetable for Food Security in Cities. A Review. Agron. Sustain. Dev. 2015, 35, 483–498. [Google Scholar] [CrossRef]
- Athearn, K.; Wooten, H.; Felter, L.; Campbell, C.G.; Ryals, J.E.; Lollar, M.C.; Popenoe, J.; Bravo, L.; Duncan, L.; Court, C.; et al. Costs and Benefits of Vegetable Gardening. EDIS 2021, 2021, 10. [Google Scholar] [CrossRef]
- Sanchez, S.; Funderburk, K.; Reznicek, E.; Parmer, S. How Does Your Garden Grow? Development of a Calculator to Evaluate the Economic and Dietary Impact of Edible Gardens. J. Ext. 2024, 62, 1–5. [Google Scholar] [CrossRef]
- Tomatis, F.; Egerer, M.; Correa−Guimaraes, A.; Navas−Gracia, L.M. Urban Gardening in a Changing Climate: A Review of Effects, Responses and Adaptation Capacities for Cities. Agriculture 2023, 13, 502. [Google Scholar] [CrossRef]
- Yanogo, P.I. Rainfall Variability and Changes in Market Gardening Systems: A Case Study in Réo (Mid−West Region of Burkina Faso). Present Environ. Sustain. Dev. 2024, 17, 213–228. [Google Scholar] [CrossRef]
- Ahouangan, B.S.C.M.; Koura, B.I.; Lesse, A.D.P.; Ahoyo, C.C.; Toyi, S.M.; Vissin, E.W.; Houinato, M.R.B. Typology Analysis and Adaptive Capacity of Commercial Gardening Farmers to Climate Change in Peri−Urban Areas along the Coastal Area of Benin (West Africa). Front. Sustain. Food Syst. 2024, 8, 1356665. [Google Scholar] [CrossRef]
- Kouévi, T.A.; Adé, C.K.; N’Danikou, S.; Mongbo, R.L.; Komlan, C.; Dagnon, G.N.; Djossouvi, C.O.E.A.; Legba, E.C.; Achigan−Dako, E.G. Preferences of Market Gardeners for Traditional Vegetables and Associated Factors in Urban Areas of Southern Benin. 2023. [Google Scholar] [CrossRef]
- Azagoun, V.V.A.; Komi, K.; Badou, D.F.; Vissin, E.W.; Klassou, K.S. Multidimensional Climatic Vulnerability of Urban Market Gardeners in Grand Nokoué, Benin: A Typological Analysis of Risk Exposure and Socio–Economic Inequalities. Geographies 2025, 5, 46. [Google Scholar] [CrossRef]
- Calvin, K.; Dasgupta, D.; Krinner, G.; Mukherji, A.; Thorne, P.W.; Trisos, C.; Romero, J.; Aldunce, P.; Barrett, K.; Blanco, G.; et al. IPCC, 2023: Climate Change 2023: Synthesis Report. Contribution of Working Groups I, II and III to the Sixth Assessment Report of the Intergovernmental Panel on Climate Change [Core Writing Team, H. Lee and J. Romero (Eds.)]. IPCC, Geneva, Switzerland.; First.; Intergovernmental Panel on Climate Change (IPCC), 2023.
- Lin, B.B.; Egerer, M.H. Global Social and Environmental Change Drives the Management and Delivery of Ecosystem Services from Urban Gardens: A Case Study from Central Coast, California. Glob. Environ. Change 2020, 60, 102006. [Google Scholar] [CrossRef]
- Reynolds, H.L.; Brandt, L.; Fischer, B.C.; Hardiman, B.S.; Moxley, D.J.; Sandweiss, E.; Speer, J.H.; Fei, S. Implications of Climate Change for Managing Urban Green Infrastructure: An Indiana, US Case Study. Clim. Change 2020, 163, 1967–1984. [Google Scholar] [CrossRef]
- Egerer, M.H.; Lin, B.B.; Threlfall, C.G.; Kendal, D. Temperature Variability Influences Urban Garden Plant Richness and Gardener Water Use Behavior, but Not Planting Decisions. Sci. Total Environ. 2019, 646, 111–120. [Google Scholar] [CrossRef]
- Ahouangan, B.S.C.M.; Koura, B.I.; Lesse, A.D.P.; Ahoyo, C.C.; Toyi, S.M.; Vissin, E.W.; Houinato, M.R.B. Typology Analysis and Adaptive Capacity of Commercial Gardening Farmers to Climate Change in Peri−Urban Areas along the Coastal Area of Benin (West Africa). Front. Sustain. Food Syst. 2024, 8, 1356665. [Google Scholar] [CrossRef]
- Ouikoun, G.C.; Bouka, C.E.; Lawson−Evi, P.; Dossou, J.; Eklu−Gadégbeku, K. Caractérisation Des Systèmes de Cultures Des Sites Maraîchers de Houéyiho, de Sèmè−Kpodji et de Grand−Popo Au Sud−Bénin. Eur. Sci. J. ESJ 2019, 15. [Google Scholar] [CrossRef]
- Salokhiddinov, A.; Boirov, R.; Ismailov, M.; Mamatov, S.; Khakimova, P.; Rakhmatullaeva, M. Climate Change Effects on Irrigated Agriculture: Perspectives from Agricultural Producers in Eastern Uzbekistan. IOP Conf. Ser. Earth Environ. Sci. 2020, 612, 012058. [Google Scholar] [CrossRef]
- Jin, K.; Jin, Y.; Li, C.; Li, L. Spatial and Temporal Dynamics in Vegetation Greenness and Its Response to Climate Change in the Tarim River Basin, China. ISPRS Int. J. Geo−Inf 2024, 13, 304. [Google Scholar] [CrossRef]
- Nasiri, V.; Rahmanian, S.; Aslani, Z.H.; Maftei, C.; Vaseashta, A. Spatial Trend Analysis of Vegetation Dynamics and Their Responses to Climate Change on Black Sea Coasts, Romania From 2000 to 2021: In Advances in Environmental Engineering and Green Technologies; Maftei, C., Muntean, R., Vaseashta, A., Eds.; IGI Global, 2023; pp. 162–184. ISBN 978−1−6684−8771−6. [Google Scholar]
- Guo, G.; Zou, X.; Zhang, Y. The Dual Effects of Climate Change and Human Activities on the Spatiotemporal Vegetation Dynamics in the Inner Mongolia Plateau from 1982 to 2022. Land 2025, 14, 1559. [Google Scholar] [CrossRef]
- Hoyer, S.; Hamman, J. Xarray: N−D Labeled Arrays and Datasets in Python. J. Open Res. Softw. 2017, 5, 10. [Google Scholar] [CrossRef]
- Kisvarga, S.; Horotán, K.; Wani, M.A.; Orlóci, L. Plant Responses to Global Climate Change and Urbanization: Implications for Sustainable Urban Landscapes. Horticulturae 2023, 9, 1051. [Google Scholar] [CrossRef]
- Bismark, M.−B.; Agyare Wilson, A.; Mexoese, N.; Kojo Samuel, A. Comparing Farmers’ Perceptions of Climate Variability with Meteorological and Remote Sensing Data, Implications for Climate Smart Agriculture Technologies in Ghana. Am. J. Environ. Sci. Eng. 2021, 5, 104. [Google Scholar] [CrossRef]
- Agustiyara, A.; Mutiarin, D.; Nurmandi, A.; Kasiwi, A.N.; Ikhwali, M.F. Mapping Urban Green Spaces in Indonesian Cities Using Remote Sensing Analysis. Urban Sci. 2025, 9, 23. [Google Scholar] [CrossRef]
- Magidi, J.; Ahmed, F. Monitoring Vegetation Phenology Using MODIS NDVI 250m in the City of Tshwane, South Africa. South Afr. J. Geomat. 2022, 11, 176–189. [Google Scholar] [CrossRef]
- Martins, C.F.V.; Guerra, F.C.; Ferreira, A.T.D.S.; Gonçalves, R.D. Application of an Orbital Remote Sensing Vegetation Index for Urban Tree Cover Mapping to Support the Tree Census. Earth 2025, 6, 87. [Google Scholar] [CrossRef]
- Łochowski, P.; Ciężkowski, W.; Chormański, J. Green Tracks in Urban Landscapes: Optimizing Vegetation Health Assessment with UAS NDVI. In Proceedings of the IGARSS 2024 − 2024 IEEE International Geoscience and Remote Sensing Symposium, July 7 2024; IEEE: Athens, Greece, 2024; pp. 4856–4859. [Google Scholar]
- Gbedahi, O.L.C.; Biaou, S.S.H.; Mama, A.; Gouwakinnou, G.N.; Yorou, N.S. Dynamique Du Couvert Végétal à Bassila Au Nord Bénin Pendant et Après La Mise En Œuvre d’un Projet d’aménagement Forestier. Int. J. Biol. Chem. Sci. 2019, 13, 311. [Google Scholar] [CrossRef]
- Toko Issiaka, N.; Zakari, S.; Djaouga, M.; Issifou Moumouni, Y.; Tente, B.A. Cartographie De La Dynamique Spatio−Temporelle Et De La Vulnerabilite Des Unites D’occupation Des Terres Dans Le Parc National Du W (Pnw) Au Benin. Int. J. Progress. Sci. Technol. 2024, 46, 330. [Google Scholar] [CrossRef]
- Gansaonré, R.N.; Zoungrana, B.J.-B.; Yanogo, P.I. Dynamique Du Couvert Végétal à La Périphérie Du Parc W Du Burkina Faso. Belgeo 2020. [Google Scholar] [CrossRef]
- Kouassi, C.J.A.; Qian, C.; Khan, D.; Achille, L.S.; Kebin, Z.; Omifolaji, J.K.; Ya, T.; Yang, X. LAND USE LAND COVER CHANGE MAPPING FROM SENTINEL 1B <2A IMAGERY USING RANDOM FOREST ALGORITHM IN CÔTE D’IVOIRE. Geod. Cartogr. 2024, 50, 43–59. [Google Scholar] [CrossRef]
- Chen, B. GLOBALLY INCREASED CROP GROWTH AND CROPPING INTENSITY FROM THE LONG−TERM SATELLITE−BASED OBSERVATIONS. ISPRS Ann. Photogramm. Remote Sens. Spat. Inf. Sci. 2018, IV–3, 45–52. [Google Scholar] [CrossRef]
- Mehmood, K.; Anees, S.A.; Muhammad, S.; Hussain, K.; Shahzad, F.; Liu, Q.; Ansari, M.J.; Alharbi, S.A.; Khan, W.R. Analyzing Vegetation Health Dynamics across Seasons and Regions through NDVI and Climatic Variables. Sci. Rep. 2024, 14, 11775. [Google Scholar] [CrossRef]
- Bouskour, S.; Zaggaf, M.H.; Bahatti, L.; Zayrit, S. MODIS−NDVI and Wheat Yield Patterns and Predictions in Taounate, Morocco. Indones. J. Electr. Eng. Comput. Sci. 2025, 37, 648. [Google Scholar] [CrossRef]
- Enebish, B.; Dashkhuu, D.; Renchin, M.; Russell, M.; Singh, P. Impact of Climate on the NDVI of Northern Mongolia. J. Indian Soc. Remote Sens. 2020, 48, 333–340. [Google Scholar] [CrossRef]
- Vodounou, J.B.K.; Onibon Doubogan, Y. Agriculture Paysanne et Stratégies d’adaptation Au Changement Climatique Au Nord−Bénin. Cybergeo 2016. [Google Scholar] [CrossRef]
- Atidegla, S.C.; Koumassi, H.D.; Houssou, E.S. Variabilité Climatique et Production Maraîchère Dans La Plaine Inondable d’Ahomey−Gblon Au Bénin. Int. J. Biol. Chem. Sci. 2018, 11, 2254. [Google Scholar] [CrossRef]
- Ouassa, P.; Atchadé, G.A.A.; Kodja, D.J.; Avahounlin, F.R.; Vissin, E.W. Stratégies d’adaptation Des Producteurs Agricoles Aux Risques Hydroclimatiques Dans Le Bassin Béninois de La Pendjari à l’exutoire de Porga. Proc. Int. Assoc. Hydrol. Sci. 2021, 384, 319–324. [Google Scholar] [CrossRef]
- Koundinya, A.V.V.; Kumar, P.P.; Ashadevi, R.K.; Hegde, V.; Kumar, P.A. Adaptation and Mitigation of Climate Change in Vegetable Cultivation: A Review. J. Water Clim. Change 2018, 9, 17–36. [Google Scholar] [CrossRef]
- Lobos, G.; Schnettler, B.; Mena, C.; Ormazábal, Yony; Cantillana, J.C.; Retamales, J.B. Perception of Risk Sources by Chilean Blueberry Producers 2018, 168823 Bytes.
- Aguilar Rivera, N. Percepción Remota Como Herramienta de Competitividad de La Agricultura. Rev. Mex. Cienc. Agríc 2018, 6, 399–405. [Google Scholar] [CrossRef]
- Dossou, J.F.; Li, X.X.; Kang, H.; Boré, A. Impact of Climate Change on the Oueme Basin in Benin. Glob. Ecol. Conserv. 2021, 28, e01692. [Google Scholar] [CrossRef]
- Dossou, J.F.; Li, X.X.; Kang, H.; Boré, A. Impact of Climate Change on the Oueme Basin in Benin. Glob. Ecol. Conserv. 2021, 28, e01692. [Google Scholar] [CrossRef]
- Saley, I.A.; Ganaba, A.; Lawson, N.Z.; Salack, S. Chapitre 1. Vérification de la qualité d’un service climatique pour l’agriculture. In Risques climatiques et agriculture en Afrique de l’Ouest; Sultan, B., Bossa, A.Y., Salack, S., Sanon, M., Eds.; IRD Éditions, 2020; pp. 19–30. ISBN 978−2−7099−2820−5. [Google Scholar]
- Risques climatiques et agriculture en Afrique de l’Ouest. In Collection Synthèses; IRD éditions: Marseille, 2020; ISBN 978−2−7099−2820−5.
- Ministère du Cadre de Vie et du Développement Durable (MCVDD) Plan National d’adaptation Aux Changements Climatiques Du Bénin 2022.
- Didan, K. MODIS/Terra Vegetation Indices 16−Day L3 Global 250m SIN Grid V061 2021.
- Gorelick, N.; Hancher, M.; Dixon, M.; Ilyushchenko, S.; Thau, D.; Moore, R. Google Earth Engine: Planetary−Scale Geospatial Analysis for Everyone. Remote Sens. Environ. 2017, 202, 18–27. [Google Scholar] [CrossRef]
- Garren, S.T.; Cleathero, B.A. Assessment of Required Sample Sizes for Estimating Proportions. Asian J. Probab. Stat. 2024, 26, 48–56. [Google Scholar] [CrossRef]
- Allarané, N.; Azagoun, V.V.A.; Atchadé, A.J.; Hetcheli, F.; Atela, J. Urban Vulnerability and Adaptation Strategies against Recurrent Climate Risks in Central Africa: Evidence from N’Djaména City (Chad). Urban Sci. 2023, 7, 97. [Google Scholar] [CrossRef]
- Patel, D. Sample Size Estimation in Clinical Trials. Natl. J. Community Med. 2024, 15, 503–508. [Google Scholar] [CrossRef]
- Sztabiński, P.B. The Use of Face−to−Face Interviews in Mixed Mode Design: The Problem of the Achieved Sample. Človek Spoločnosť 2019, 22. [Google Scholar] [CrossRef]
- Muszyński, M.; Jabkowski, P. What Can Interviewer−Collected Paradata Tell About Measurement Quality in Face−to−Face Surveys? Analyzing Response Styles in Six Rounds of the European Social Survey. 2023. [Google Scholar]
- Yang, X.; Huang, X.; Ma, Y.; Li, Y.; Feng, Q.; Liang, T. Development of Long-term Spatiotemporal Continuous NDVI Products for Alpine Grassland from 1982 to 2020 in the Qinghai–Tibet Plateau, China. Grassl. Res. 2024, 3, 100–112. [Google Scholar] [CrossRef]
- Ma, Z.; Dong, C.; Lin, K.; Yan, Y.; Luo, J.; Jiang, D.; Chen, X. A Global 250−m Downscaled NDVI Product from 1982 to 2018. Remote Sens. 2022, 14, 3639. [Google Scholar] [CrossRef]
- Cigerci, H.; Balcik, F.B.; Sekertekin, A.; Kahya, C. Unveiling Istanbul’s City Dynamics: Spatiotemporal Hotspot Analysis of Vegetation, Settlement, and Surface Urban Heat Islands. Sustainability 2024, 16, 5981. [Google Scholar] [CrossRef]
- Hamed, R.; Steinmann, C.B.; Ma, Q.; Balanzategui, D.; Broadman, E.; Lesk, C.; Kornhuber, K. Amplified Agricultural Impacts from Increasingly Sequential Heat Extremes 2025.
- S. Coronel, A.; R. Feldman, S.; Jozami, E.; Facundo, K.; D. Piacentini, R.; Dubbeling, M.; J. Escobedo, F.; 1 Climatología, Facultad de Ciencias Agrarias Universidad Nacional de Rosario (FCA−UNR), Rosario, Argentina; Effects of Urban Green Areas on Air Temperature in a Medium−Sized Argentinian City. AIMS Environ. Sci. 2015, 2, 803–826. [CrossRef]
- Lin, B.B.; Egerer, M.H.; Liere, H.; Jha, S.; Bichier, P.; Philpott, S.M. Local− and Landscape−Scale Land Cover Affects Microclimate and Water Use in Urban Gardens. Sci. Total Environ. 2018, 610–611, 570–575. [Google Scholar] [CrossRef]
- Intergovernmental Panel On Climate Change (Ipcc) Climate Change 2022—Impacts, Adaptation and Vulnerability: Working Group II Contribution to the Sixth Assessment Report of the Intergovernmental Panel on Climate Change, 1st ed.; Cambridge University Press, 2023; ISBN 978−1−009−32584−4.
- Monnet, M.; Vignola, R.; Aliotta, Y. Smallholders’ Water Management Decisions in the Face of Water Scarcity from a Socio−Cognitive Perspective, Case Study of Viticulture in Mendoza. Agronomy 2022, 12, 2868. [Google Scholar] [CrossRef]
- Palmisano, T.; Miguel, R.E. Dinámica Multicausal de La Escasez Hídrica. El Caso de Nonogasta, La Rioja, Argentina. Agua Territ. Water Landsc. 2025, 361–376. [Google Scholar] [CrossRef]
- Mohan, C.; Western, A.W.; Jha, M.K.; Wei, Y. Global Assessment of Groundwater Stress Vis−à−Vis Sustainability of Irrigated Food Production. Sustainability 2022, 14, 16896. [Google Scholar] [CrossRef]
- Diallo, M.C.A.; Santos, R.C.; Gomes, E.P.; Machado, C.A.C.; Dias, C.R.A.; Santos, E.C.D.; Padilha, G.A.C.; Belarmino, M.D.; Galiaso, M.; Riffel, A.S.; et al. Challenges of Smart Irrigation Implementation in Water Optimization and Agricultural Sustainability. Contrib. LAS Cienc. Soc. 2024, 17, e13723. [Google Scholar] [CrossRef]
- Xu, D.; Ivanov, V.Y.; Agee, E.; Wang, J. Energy Surplus and an Atmosphere-Land-Surface “Tug of War” Control Future Evapotranspiration. Geophys. Res. Lett. 2023, 50, e2022GL102677. [Google Scholar] [CrossRef]
- Dieye M.; Dia D.; Barbier B.; Sylla E.H.M; Sall M.; Bader Jean−Claude; Bossa A.Y; Sanfo S.; Fall C.S. L’agriculture de Décrue En Afrique de l’Ouest et Du Centre : Une Certaine Résilience Face à La Variabilité Climatique et à La Régulation Des Fleuves. IRD Ed. 121–131.
- Sawadogo, B. Drought Impacts on the Crop Sector and Adaptation Options in Burkina Faso: A Gender−Focused Computable General Equilibrium Analysis. Sustainability 2022, 14, 15637. [Google Scholar] [CrossRef]
- Zongo, B.; Barbier, B.; Diarra, A.; Zorom, M.; Atewamba, C.; Combary, O.S.; Ouédraogo, S.; Toé, P.; Hamma, Y.; Dogot, T. Economic Analysis and Food Security Contribution of Supplemental Irrigation and Farm Ponds: Evidence from Northern Burkina Faso. Agric. Food Secur. 2022, 11, 4. [Google Scholar] [CrossRef]
- Dumba, H.; Danquah, J.A.; Pappinen, A. Rural Farmers’ Approach to Drought Adaptation: Lessons from Crop Farmers in Ghana. In African Handbook of Climate Change Adaptation; Leal Filho, W., Oguge, N., Ayal, D., Adeleke, L., Da Silva, I., Eds.; Springer International Publishing: Cham, 2021; pp. 1–19. ISBN 978−3−030−42091−8. [Google Scholar]
- Opoku Mensah, S.; Osei−Acheampong, B.; Jacobs, B.; Cunningham, R.; Akoto, A.B. Smallholder Farmers’ Climate Change Adaptation in Ghana: A Systematic Literature Review and Future Directions. J. Environ. Manage 2025, 384, 125598. [Google Scholar] [CrossRef]
- Miah, Md.S.; Ullah, S.; Siddique, M.H. Heat Waves in Bangladesh: Understanding the Threats and Finding Solutions. Asia Pac. J. Energy Environ. 2022, 9, 89–98. [Google Scholar] [CrossRef]
- Rafique Khan, M.; Abubakar, M.; Tahir, A.; Waqas Dilawar, M.; Muhammad Ali Hassan, H.; Rashid Ahmad, S.; Saif, F.; Umair Chand, M. Escalating Global Threat of Heatwaves and Policy Options for Adaptation and Mitigation. J. Asian Dev. Stud. 2024, 13, 980–995. [Google Scholar] [CrossRef]
Figure 1.
Geographical location of Grand Nokoué.
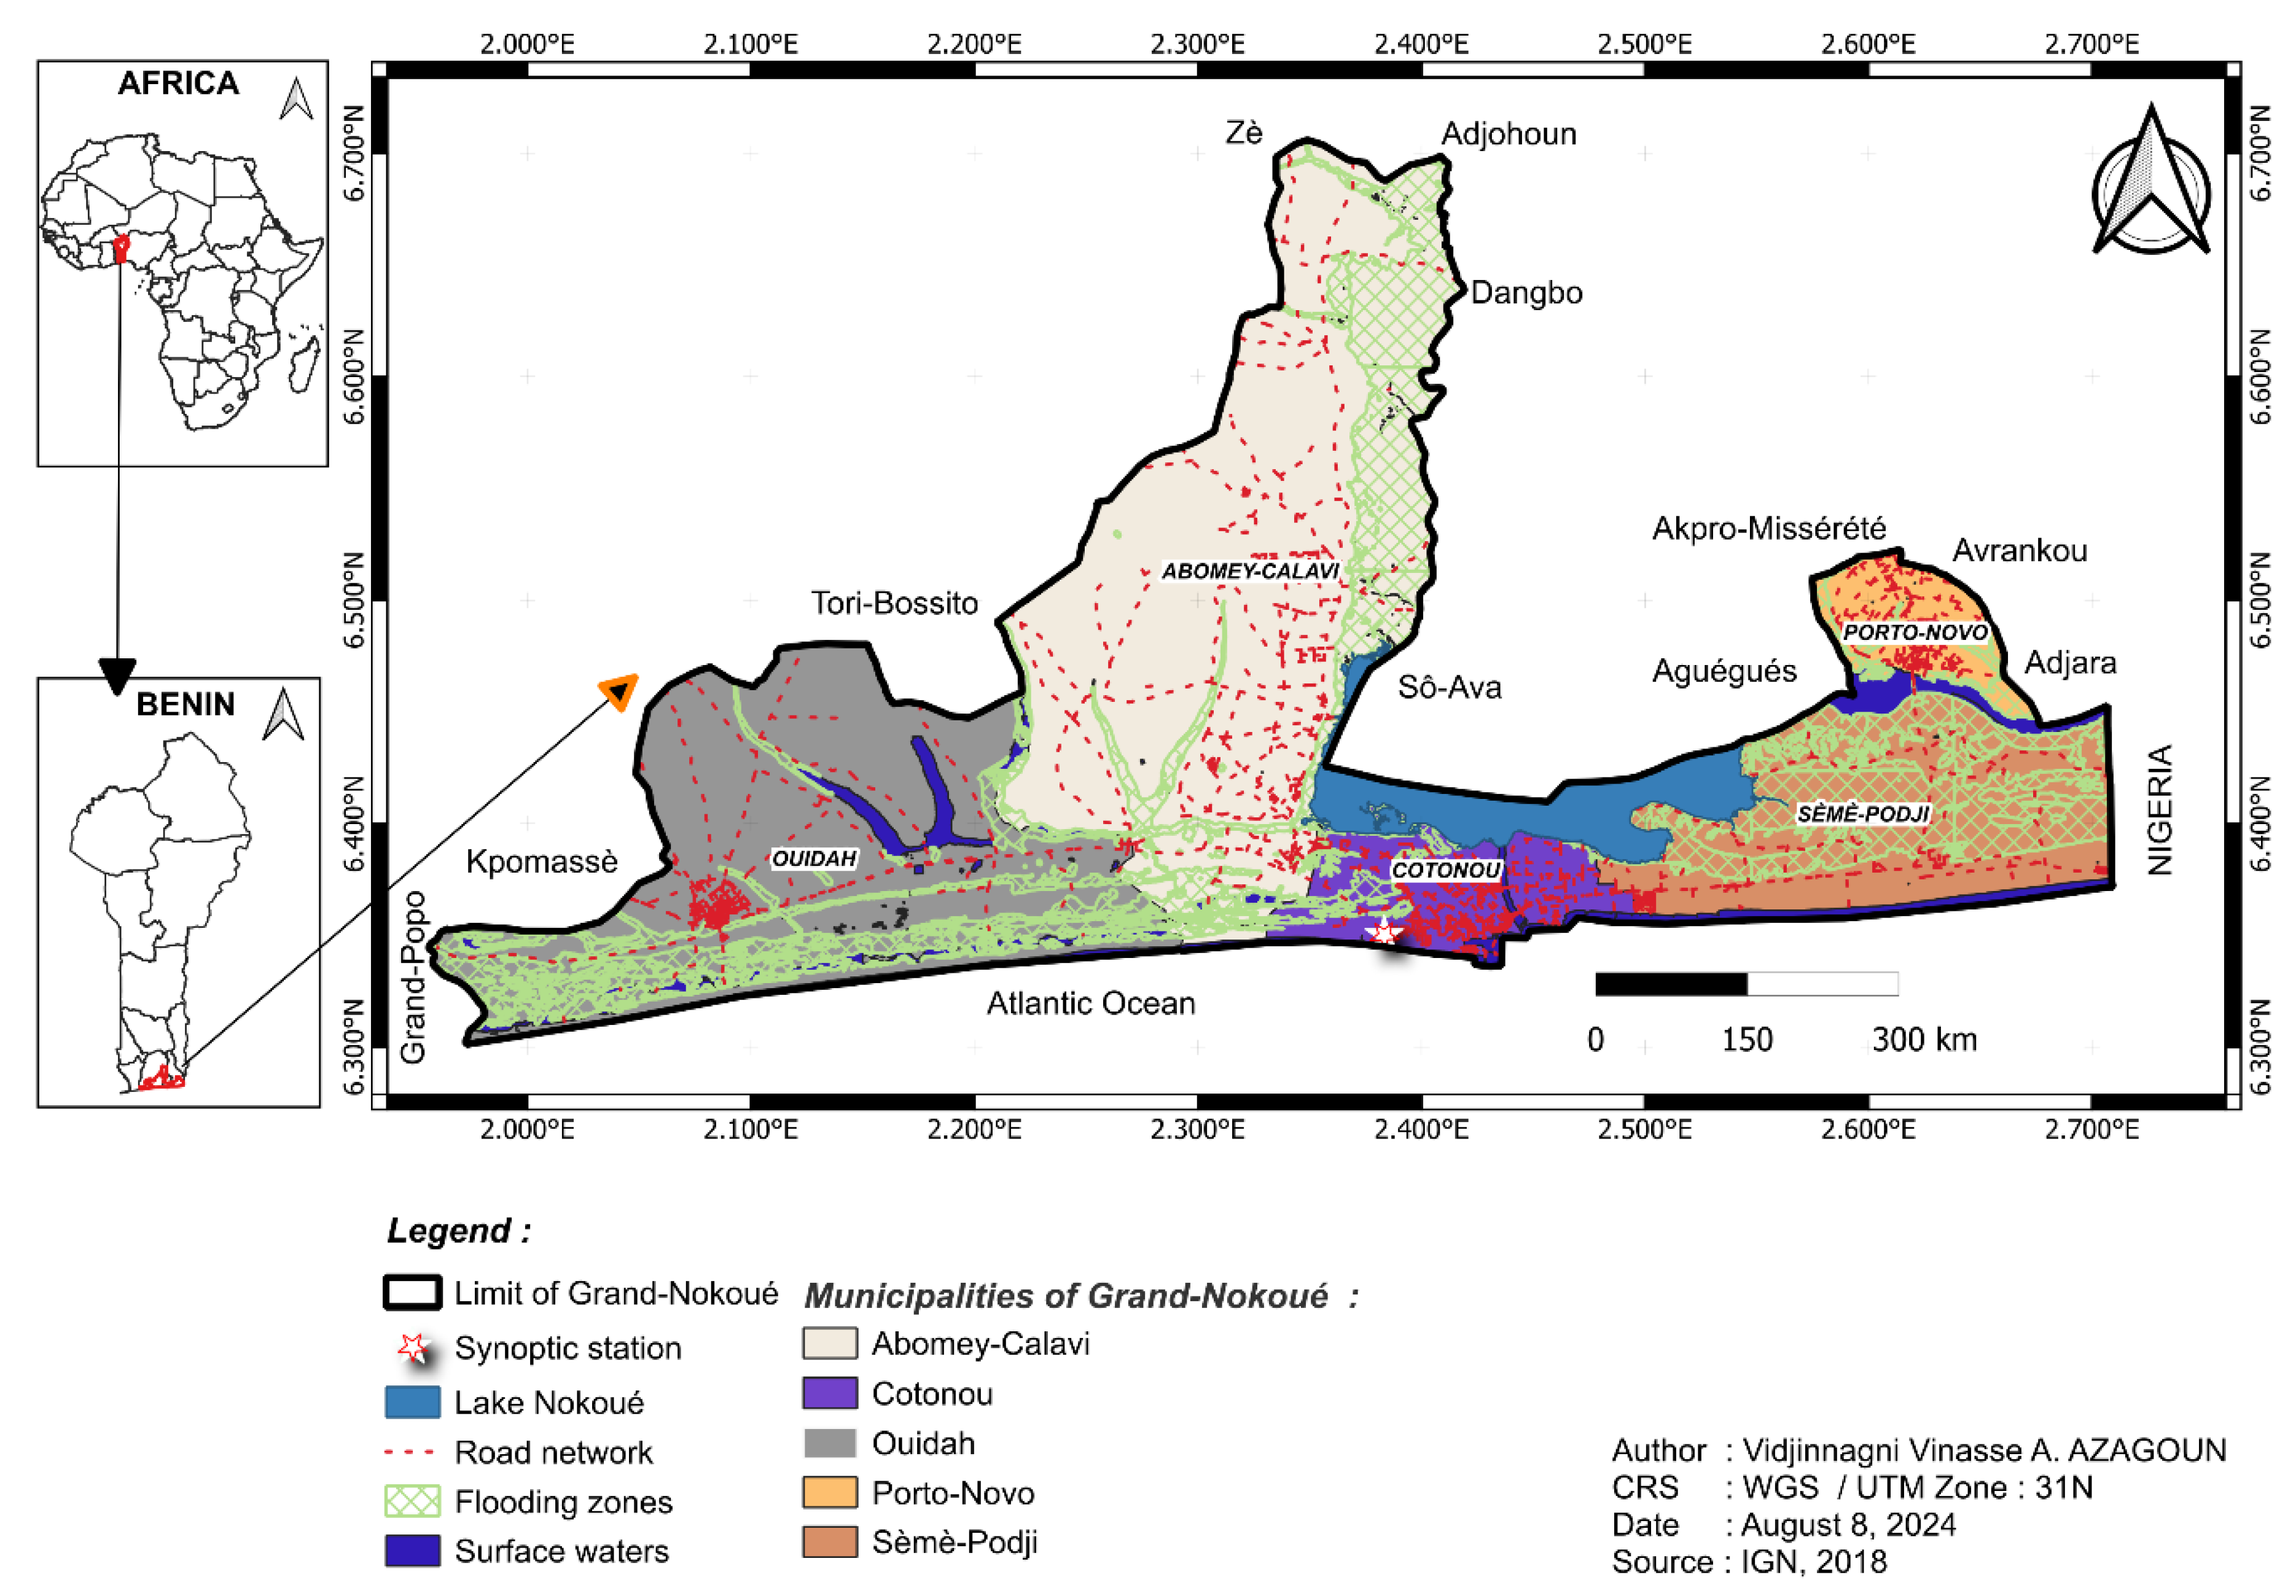
Figure 2.
Walter-Lieth ombrothermic diagram of the Grand Nokoué region, based on average monthly temperature and precipitation data from 1991 to 2020. Source: Synoptic data collected from the Benin Meteorological Agency (Météo Bénin), 2024
Figure 2.
Walter-Lieth ombrothermic diagram of the Grand Nokoué region, based on average monthly temperature and precipitation data from 1991 to 2020. Source: Synoptic data collected from the Benin Meteorological Agency (Météo Bénin), 2024
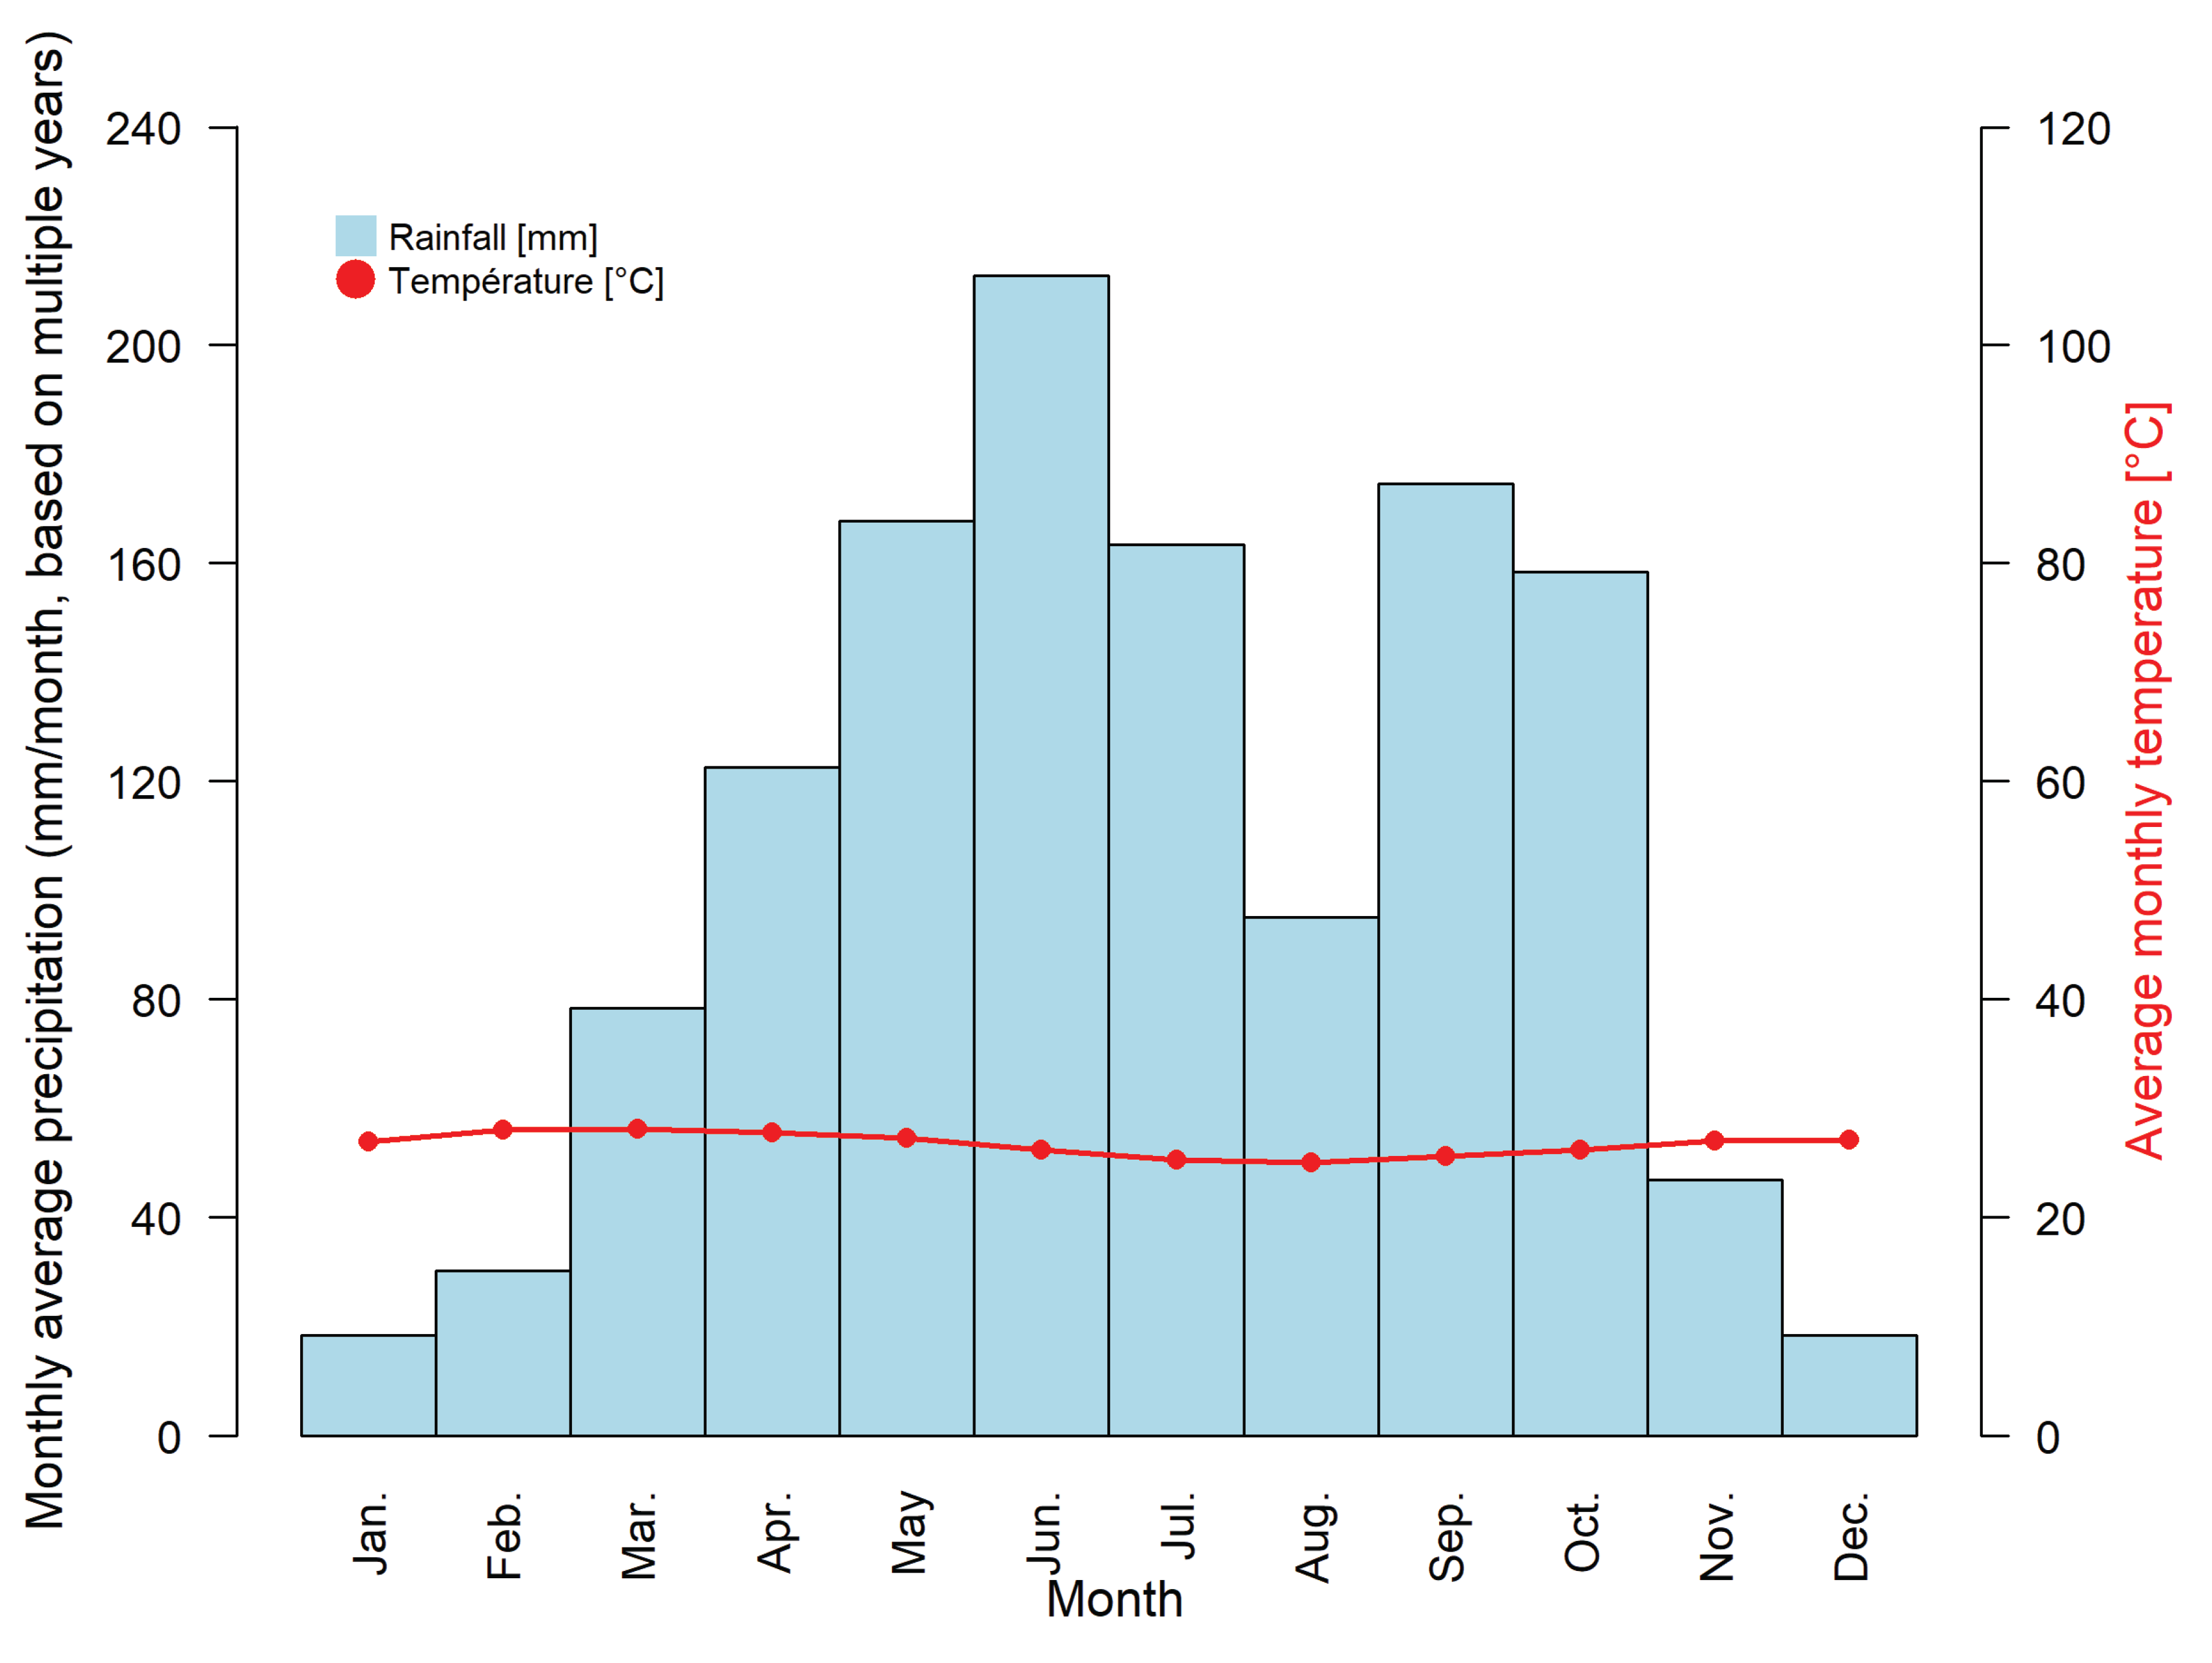
Figure 3.
Descriptive diagram of the process of satellite image processing and analysis.
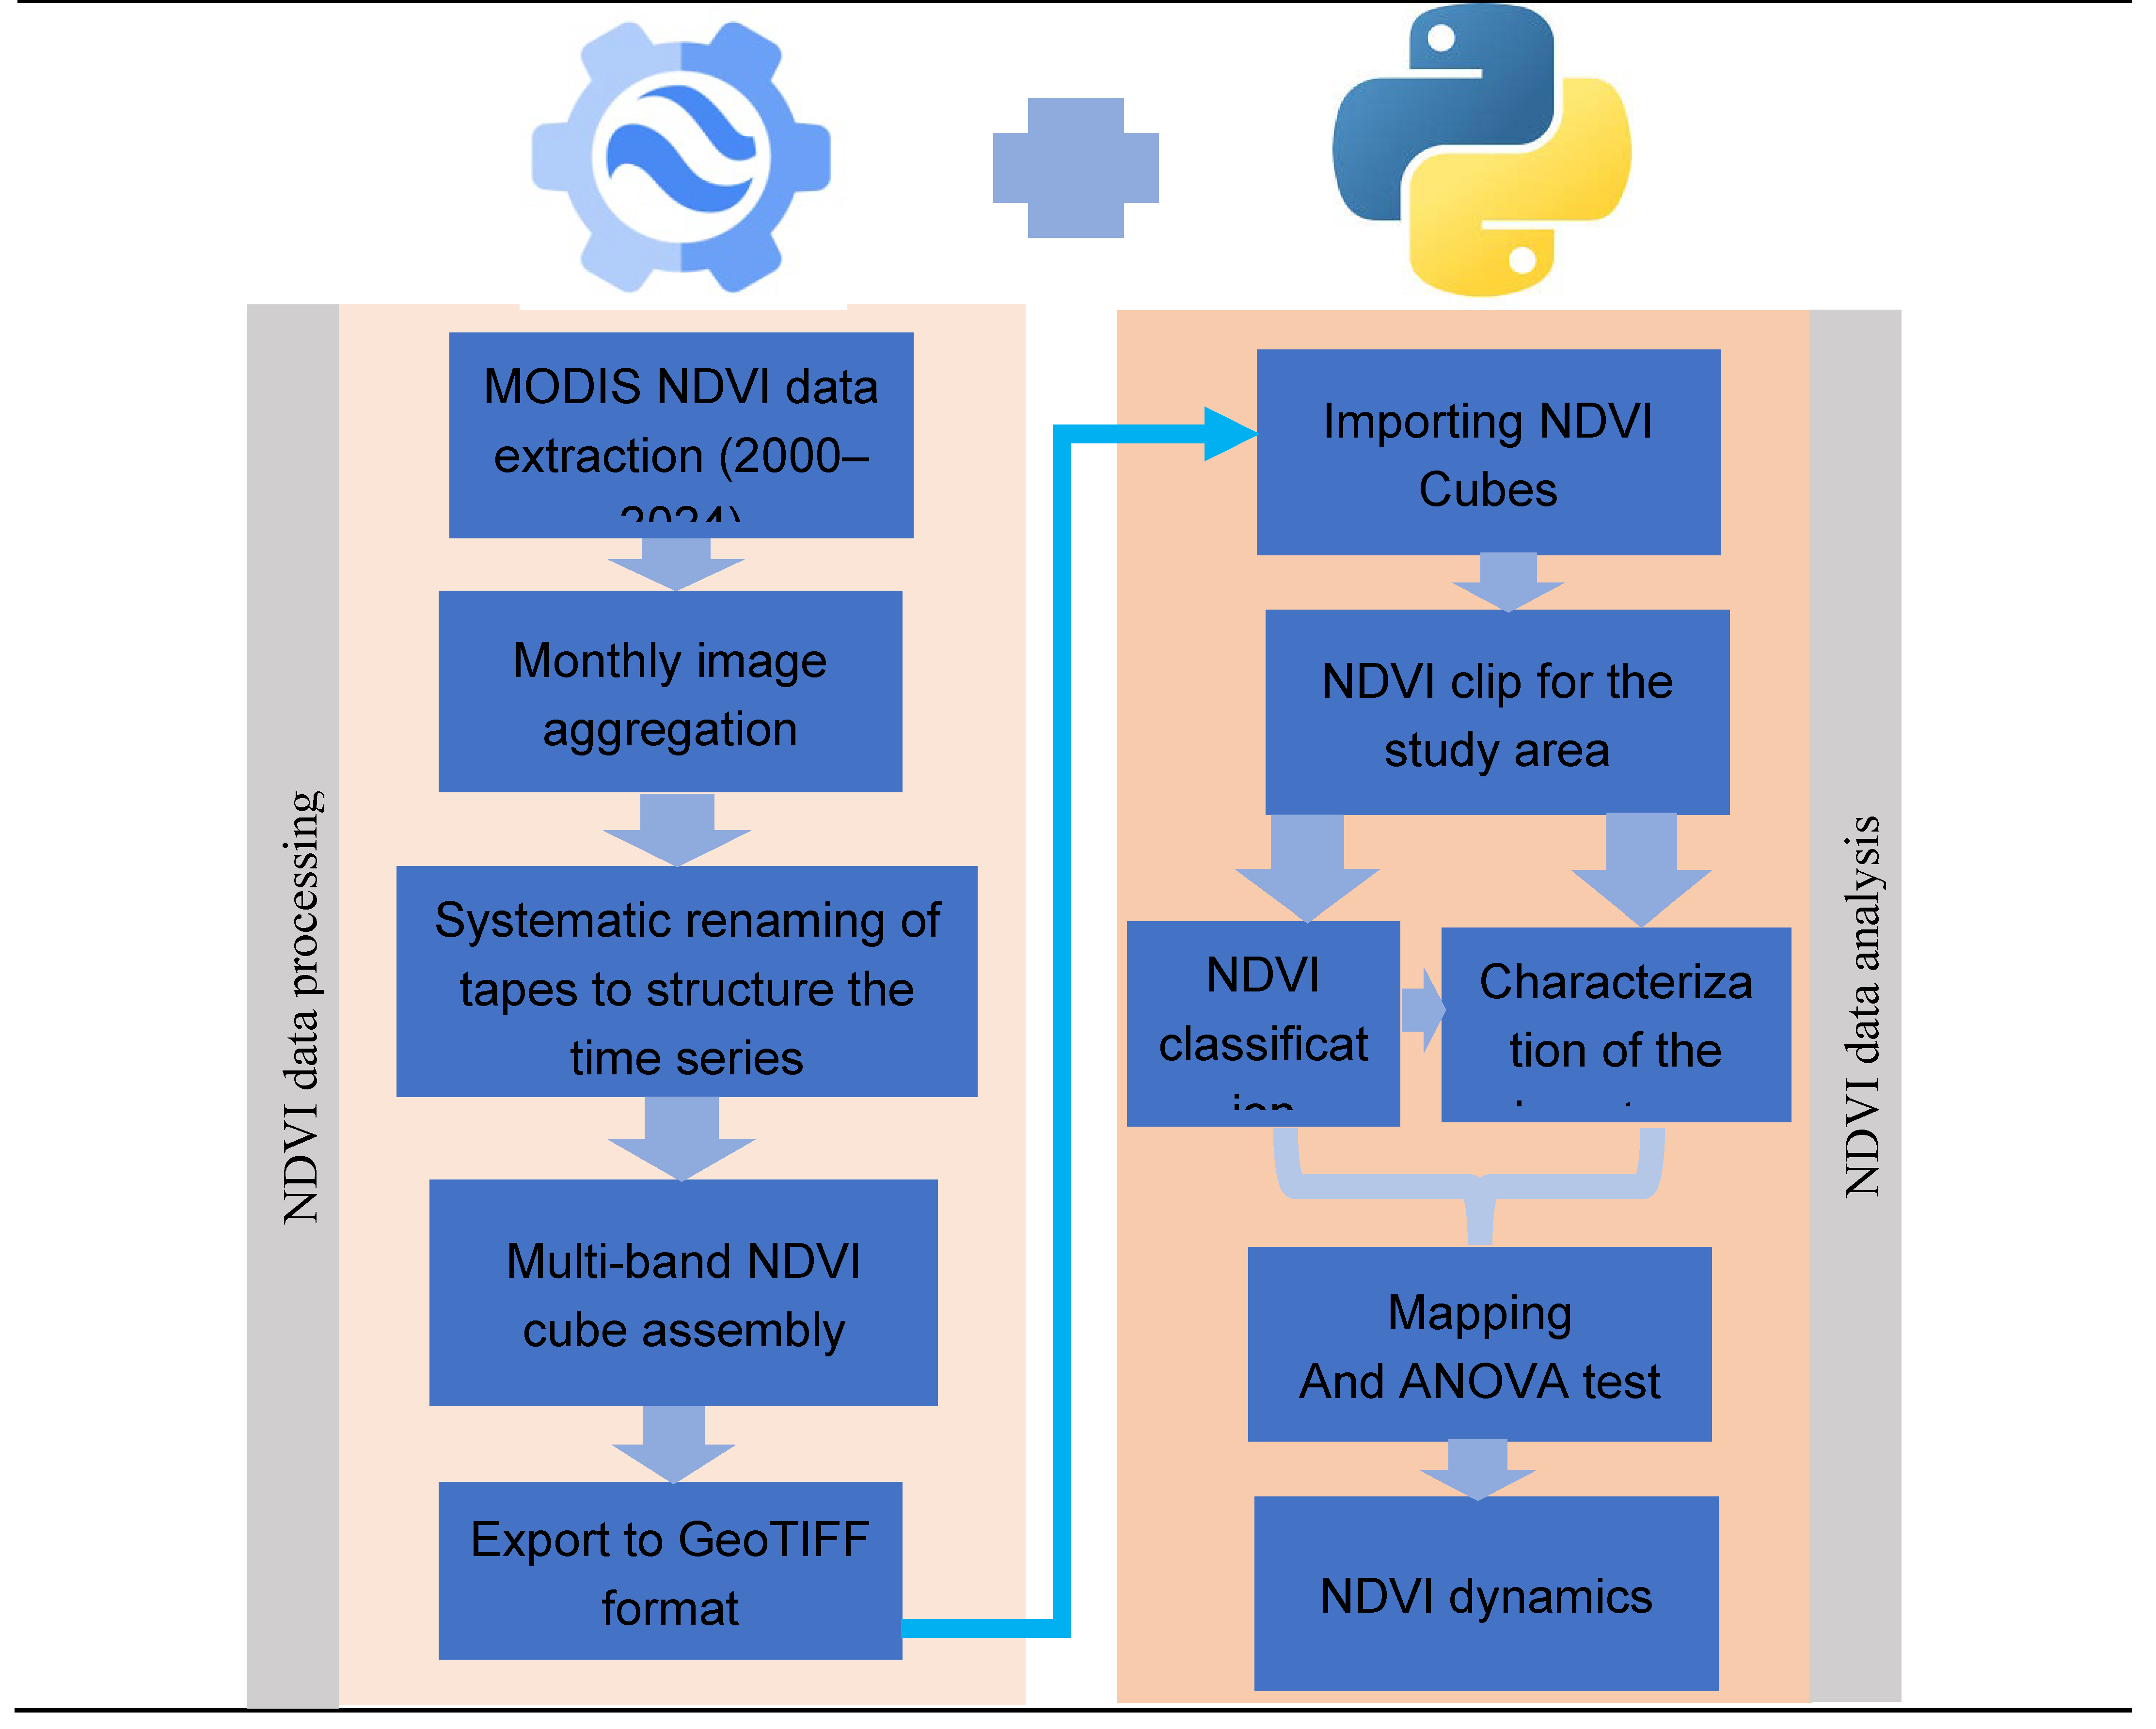
Figure 4.
Spatial distribution of vegetation density classes according to annual average NDVI values (2000 to 2024) in Grand Nokoué.
Figure 4.
Spatial distribution of vegetation density classes according to annual average NDVI values (2000 to 2024) in Grand Nokoué.
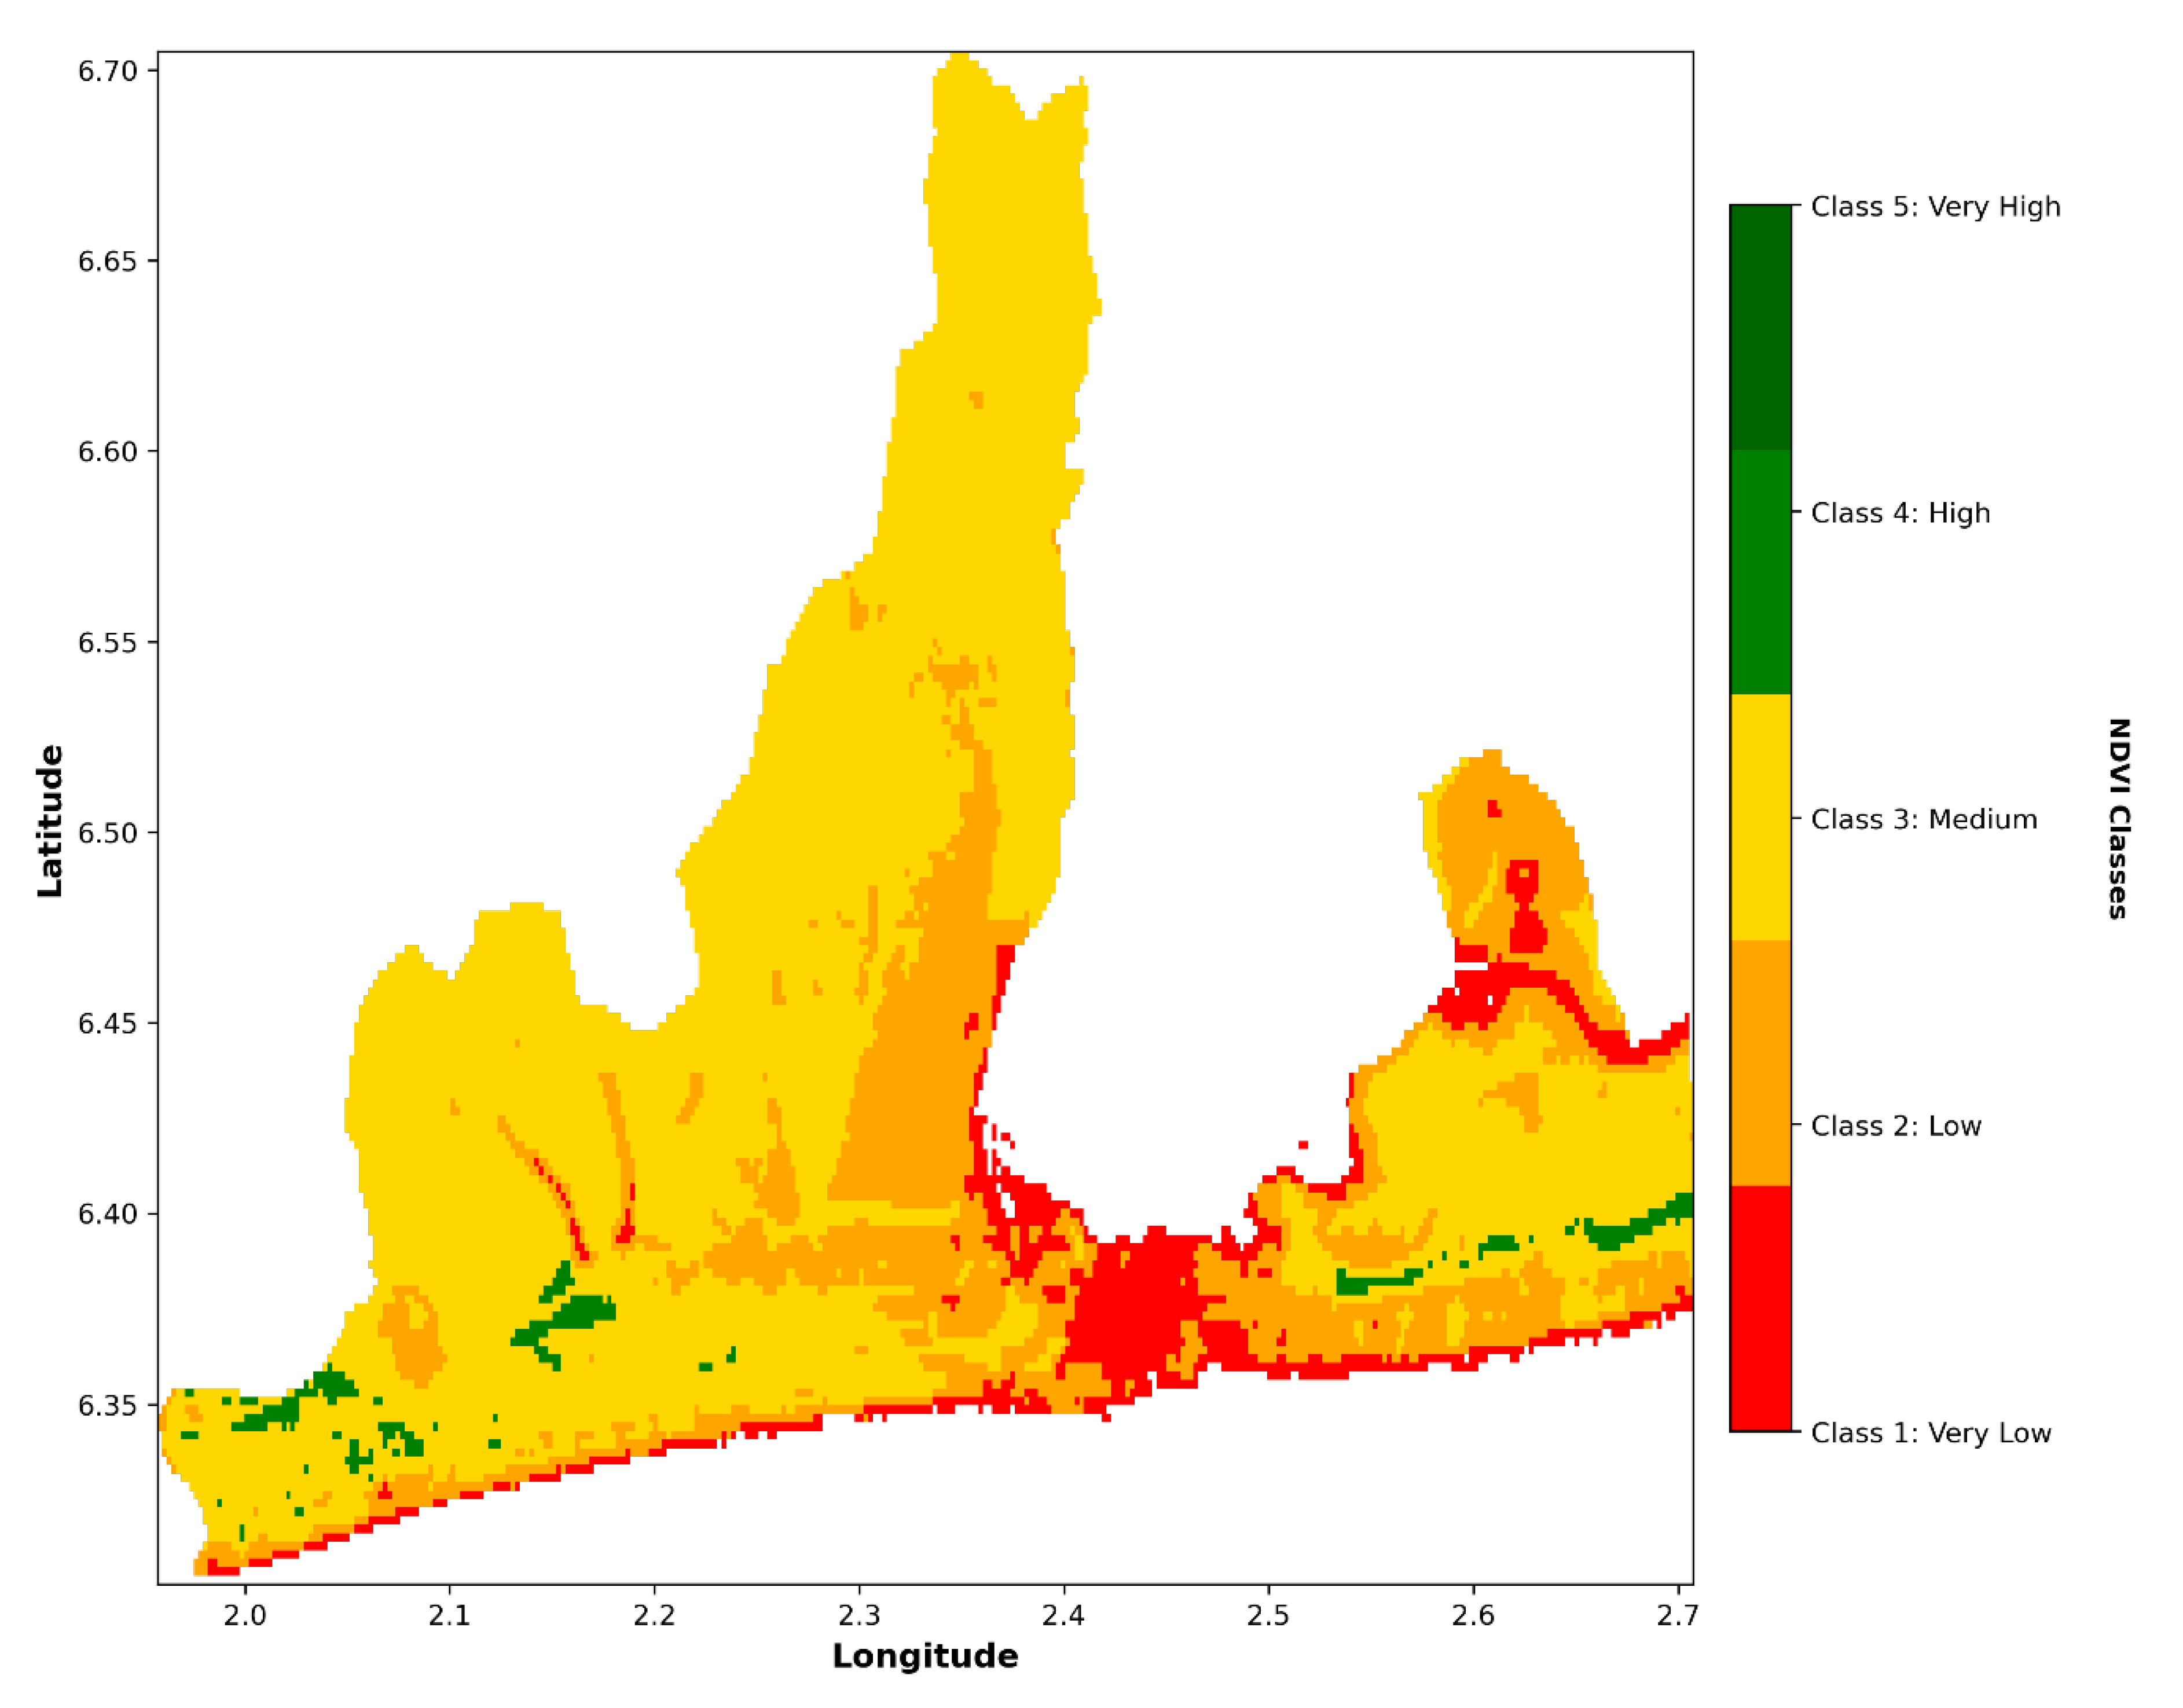
Figure 5.
Changes in land area according to NDVI classes between 2000 and 2024 in Grand Nokoué.
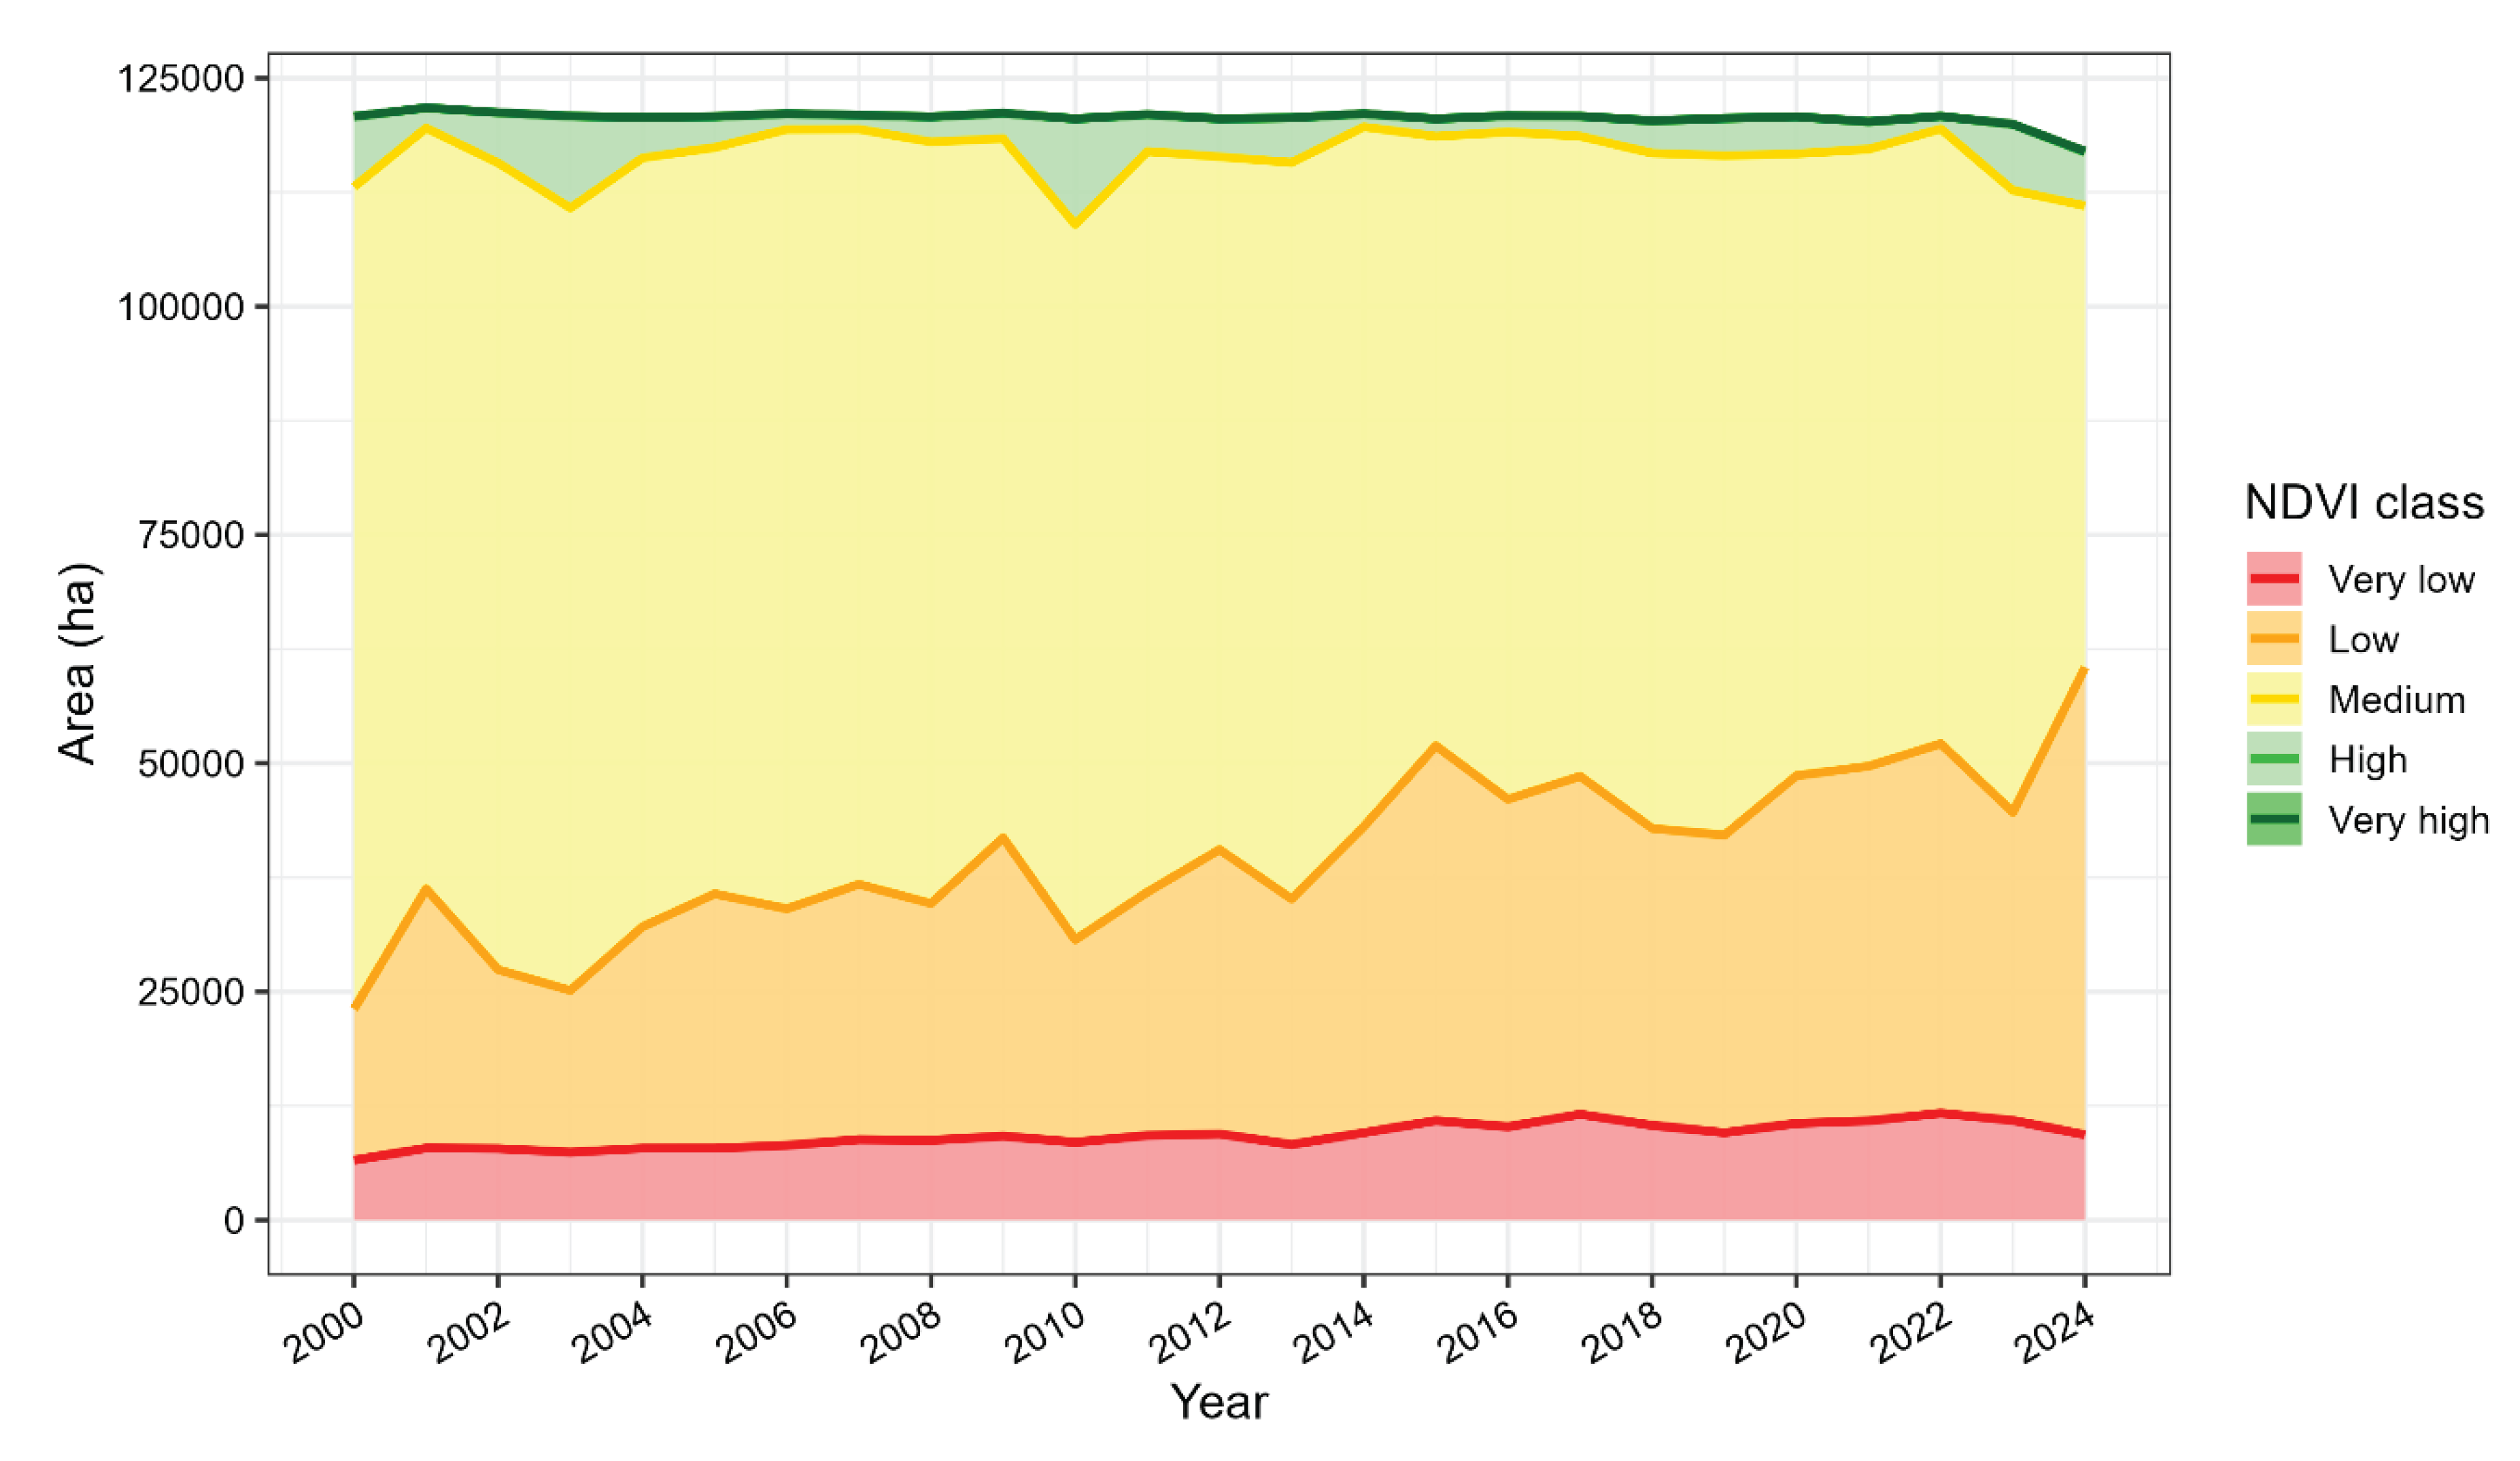
Figure 6.
Spatial variation in mean monthly NDVI (2000–2024) in the Grand Nokoué region.
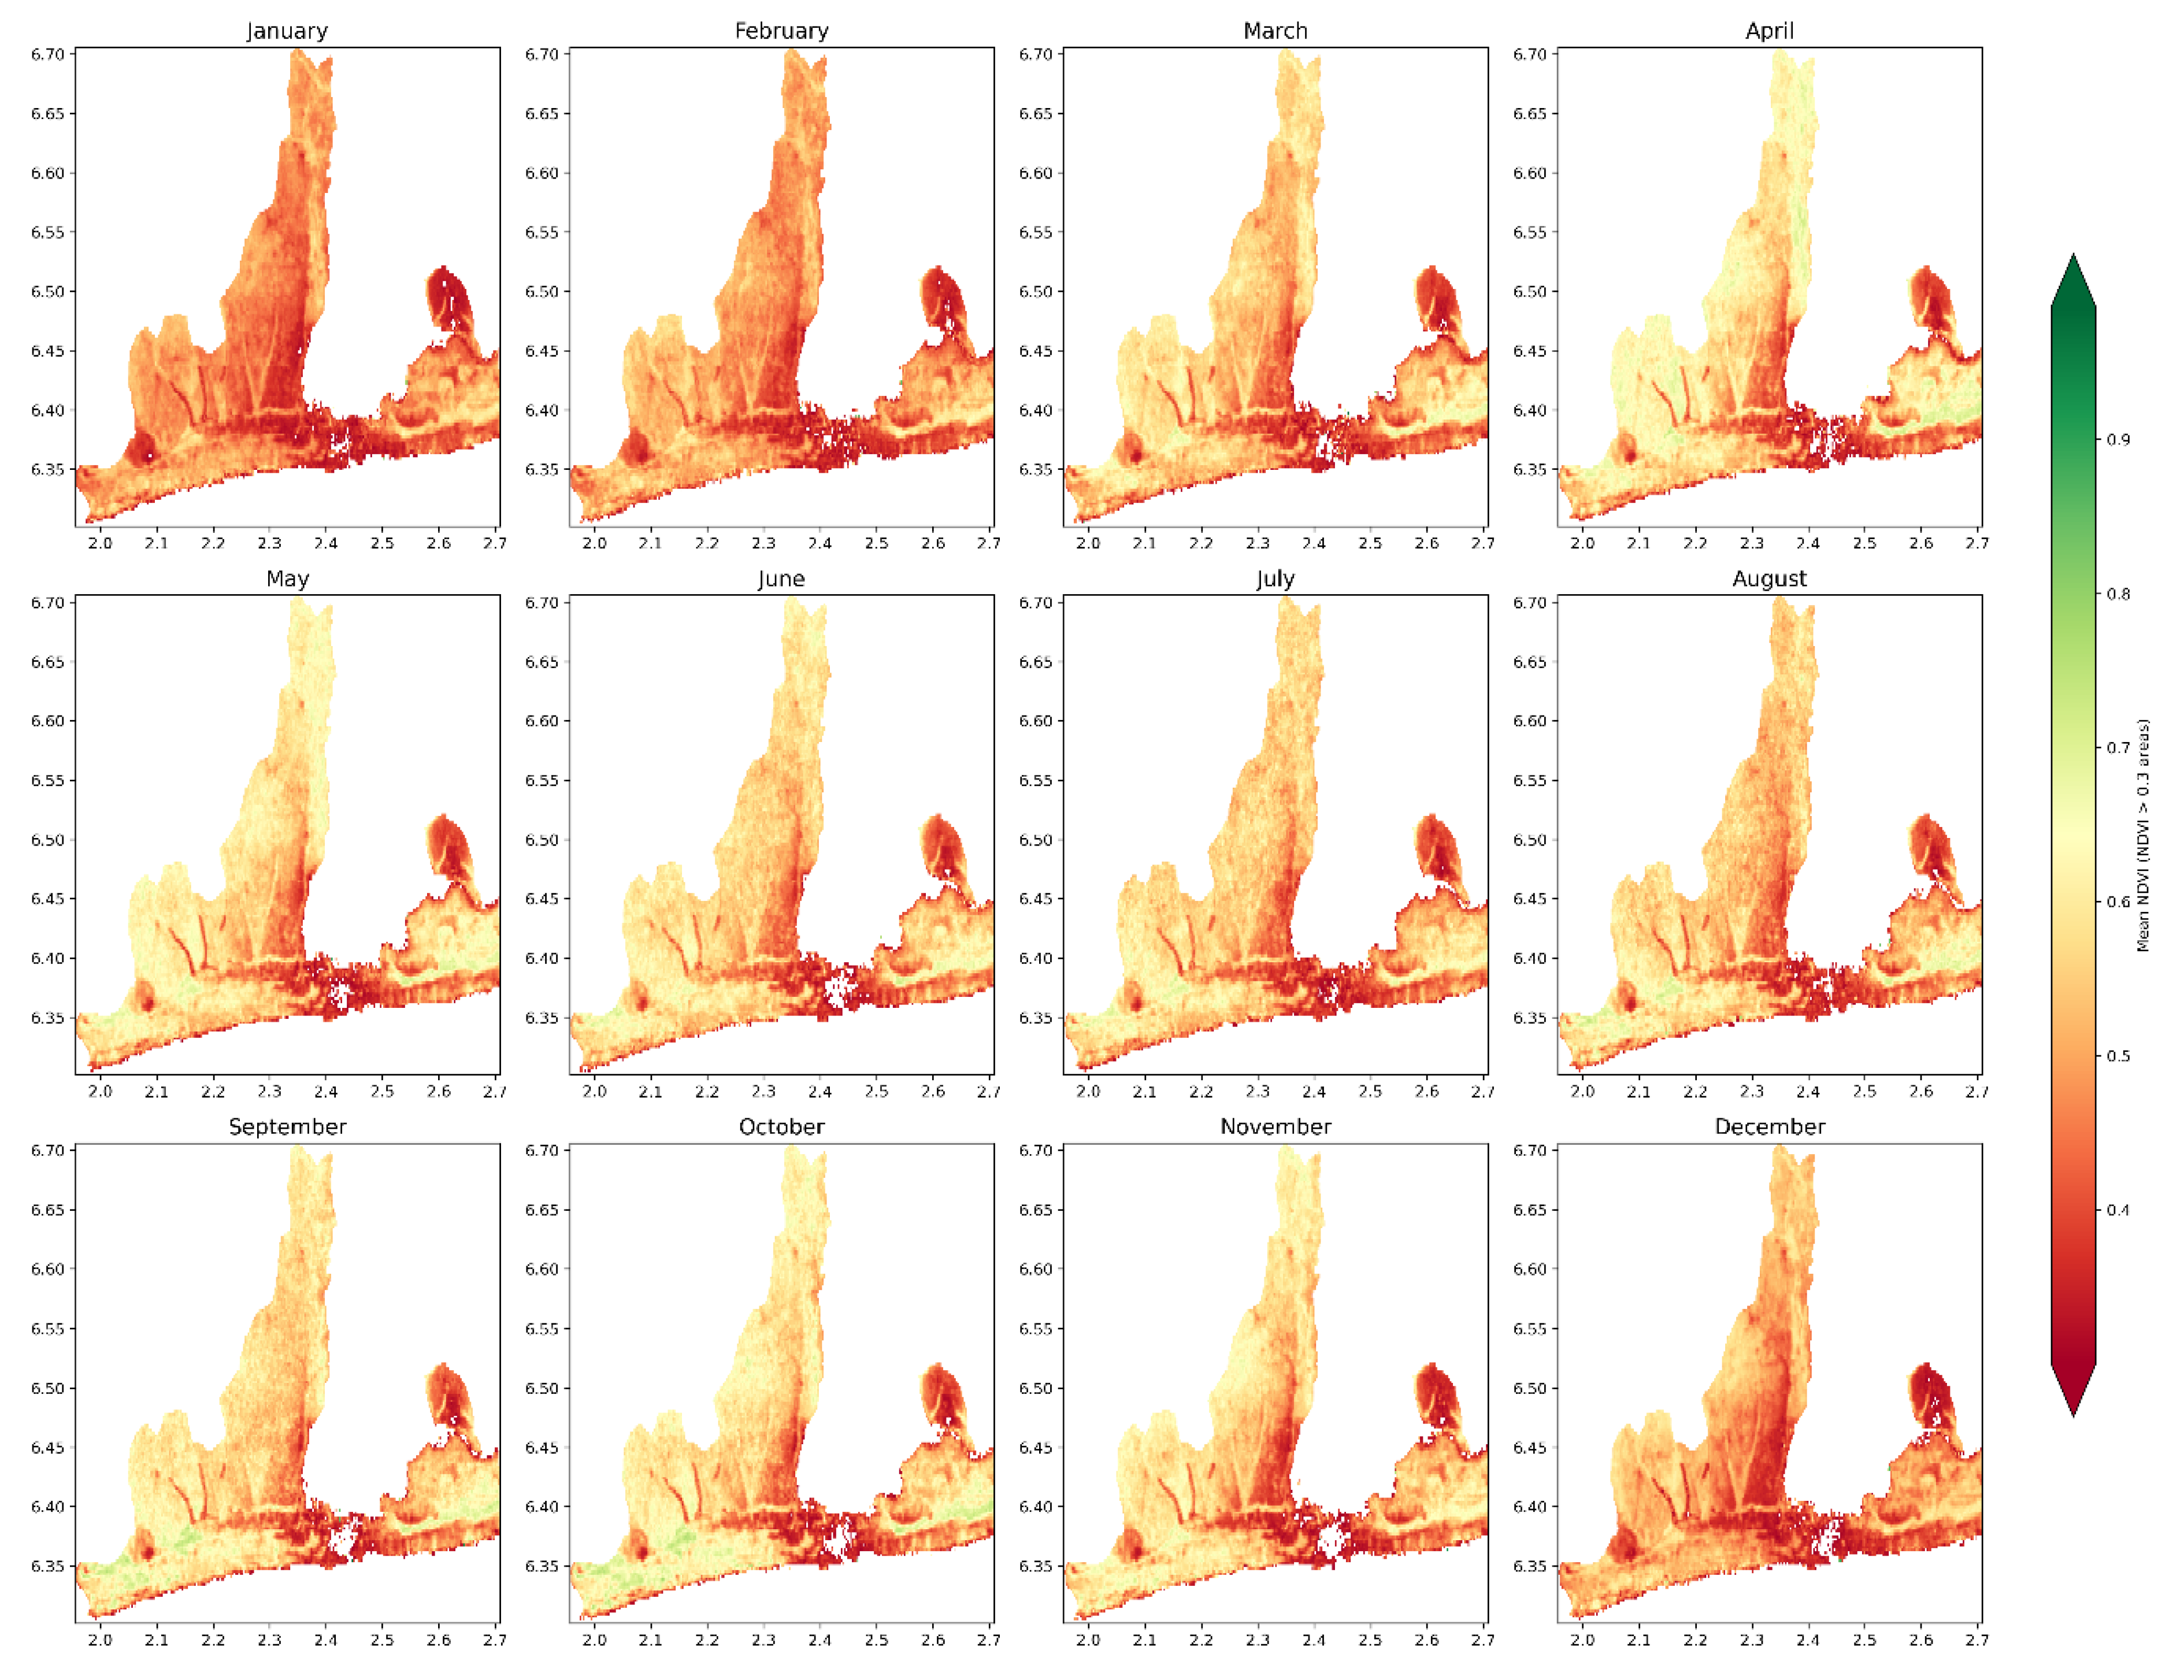
Figure 7.
Market gardeners’ perception of the various risks likely to affect their crops in Grand Nokoué, categorised by (a) crop type and (b) location.
Figure 7.
Market gardeners’ perception of the various risks likely to affect their crops in Grand Nokoué, categorised by (a) crop type and (b) location.
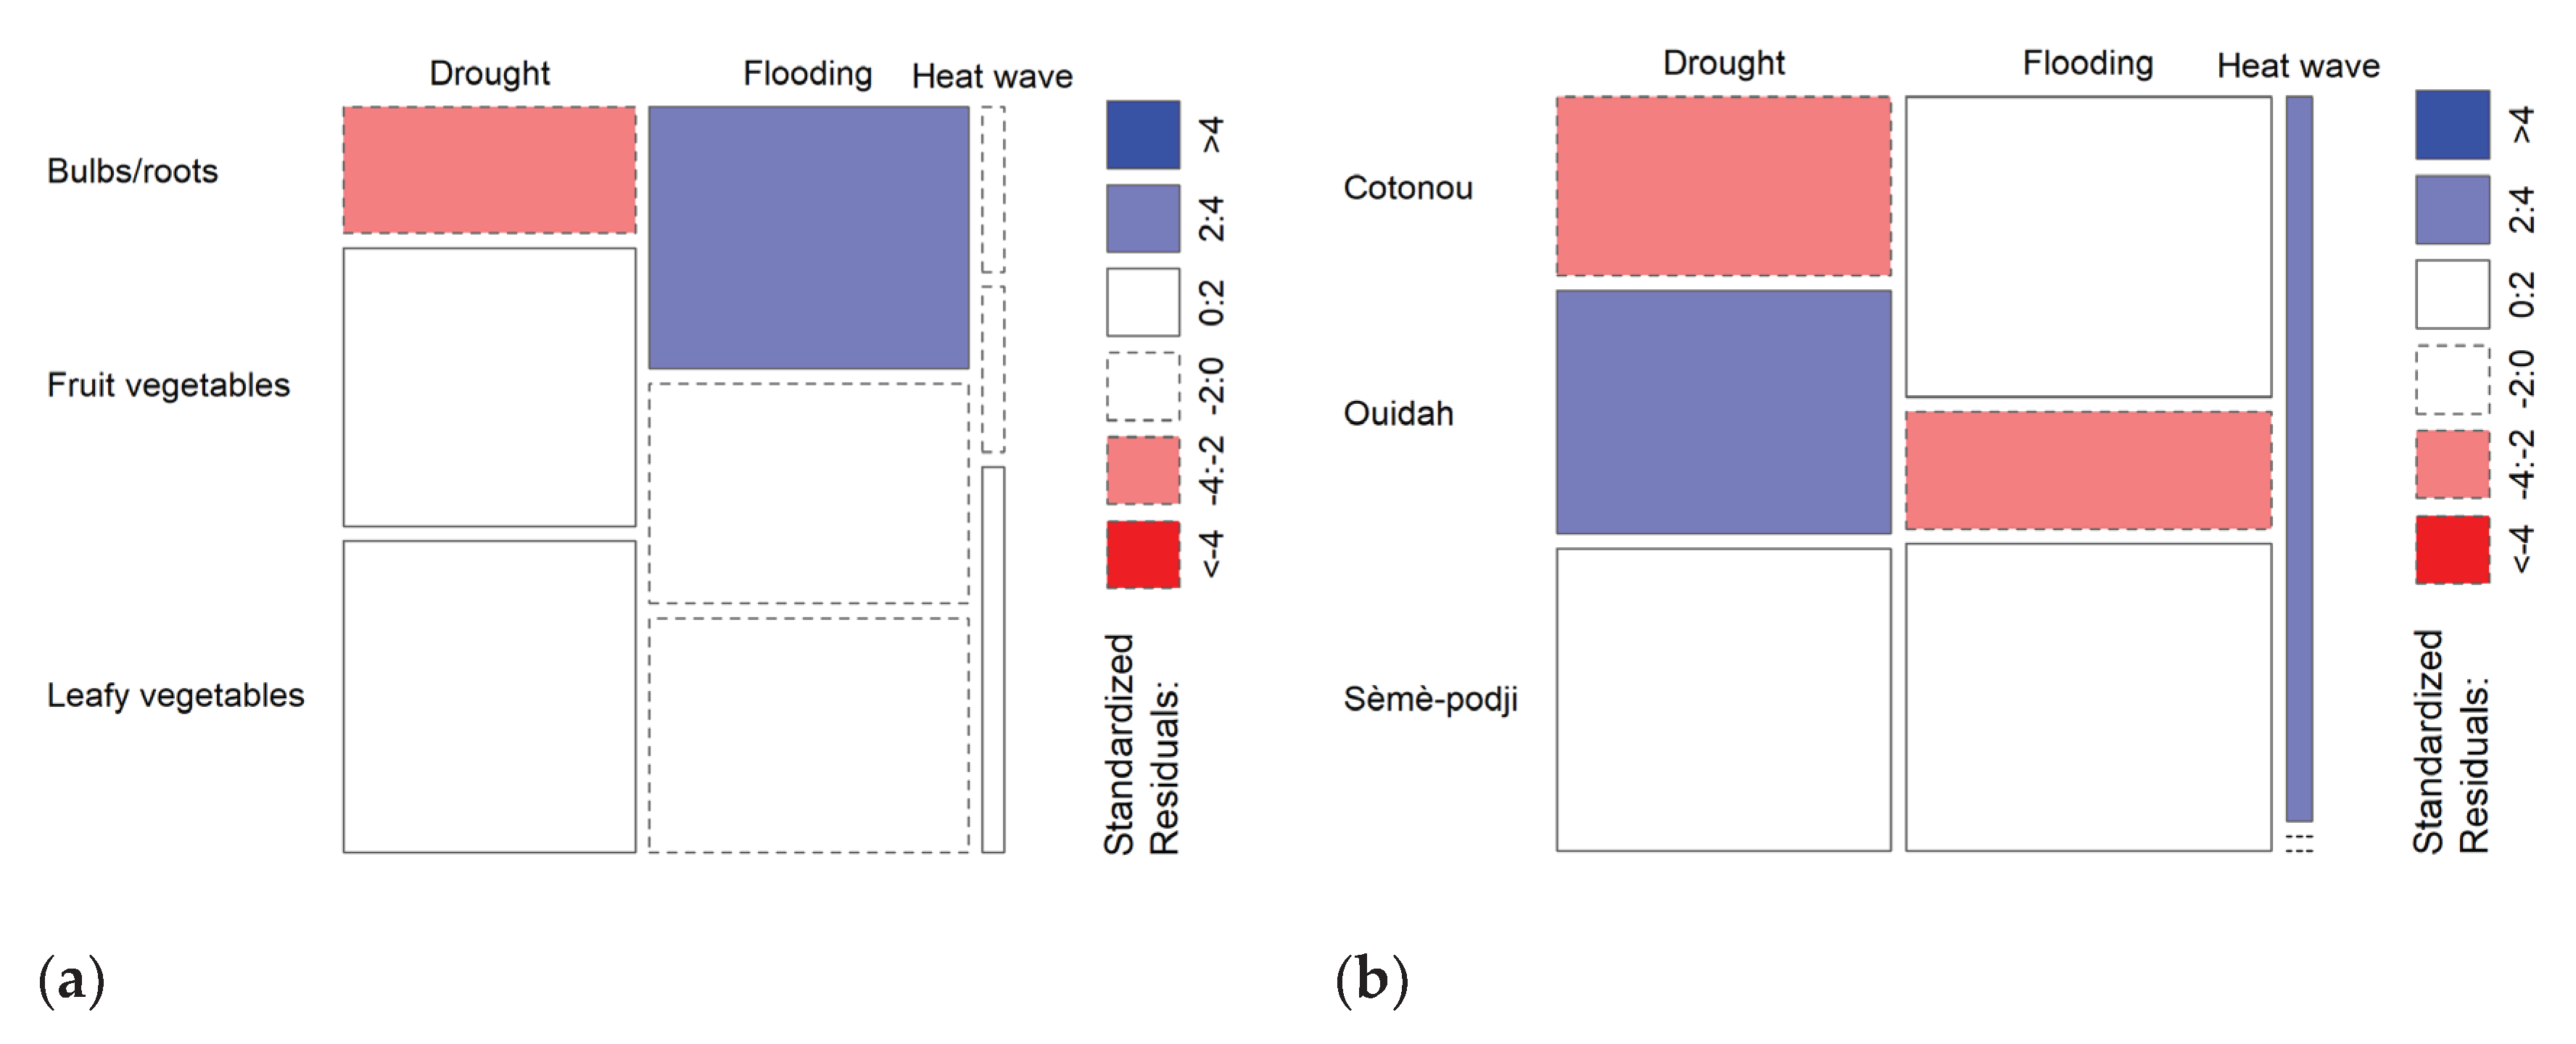
Figure 8.
Sankey diagram of adaptation strategies used by market gardeners in Grand Nokoué according to climate risks and crop categories.
Figure 8.
Sankey diagram of adaptation strategies used by market gardeners in Grand Nokoué according to climate risks and crop categories.
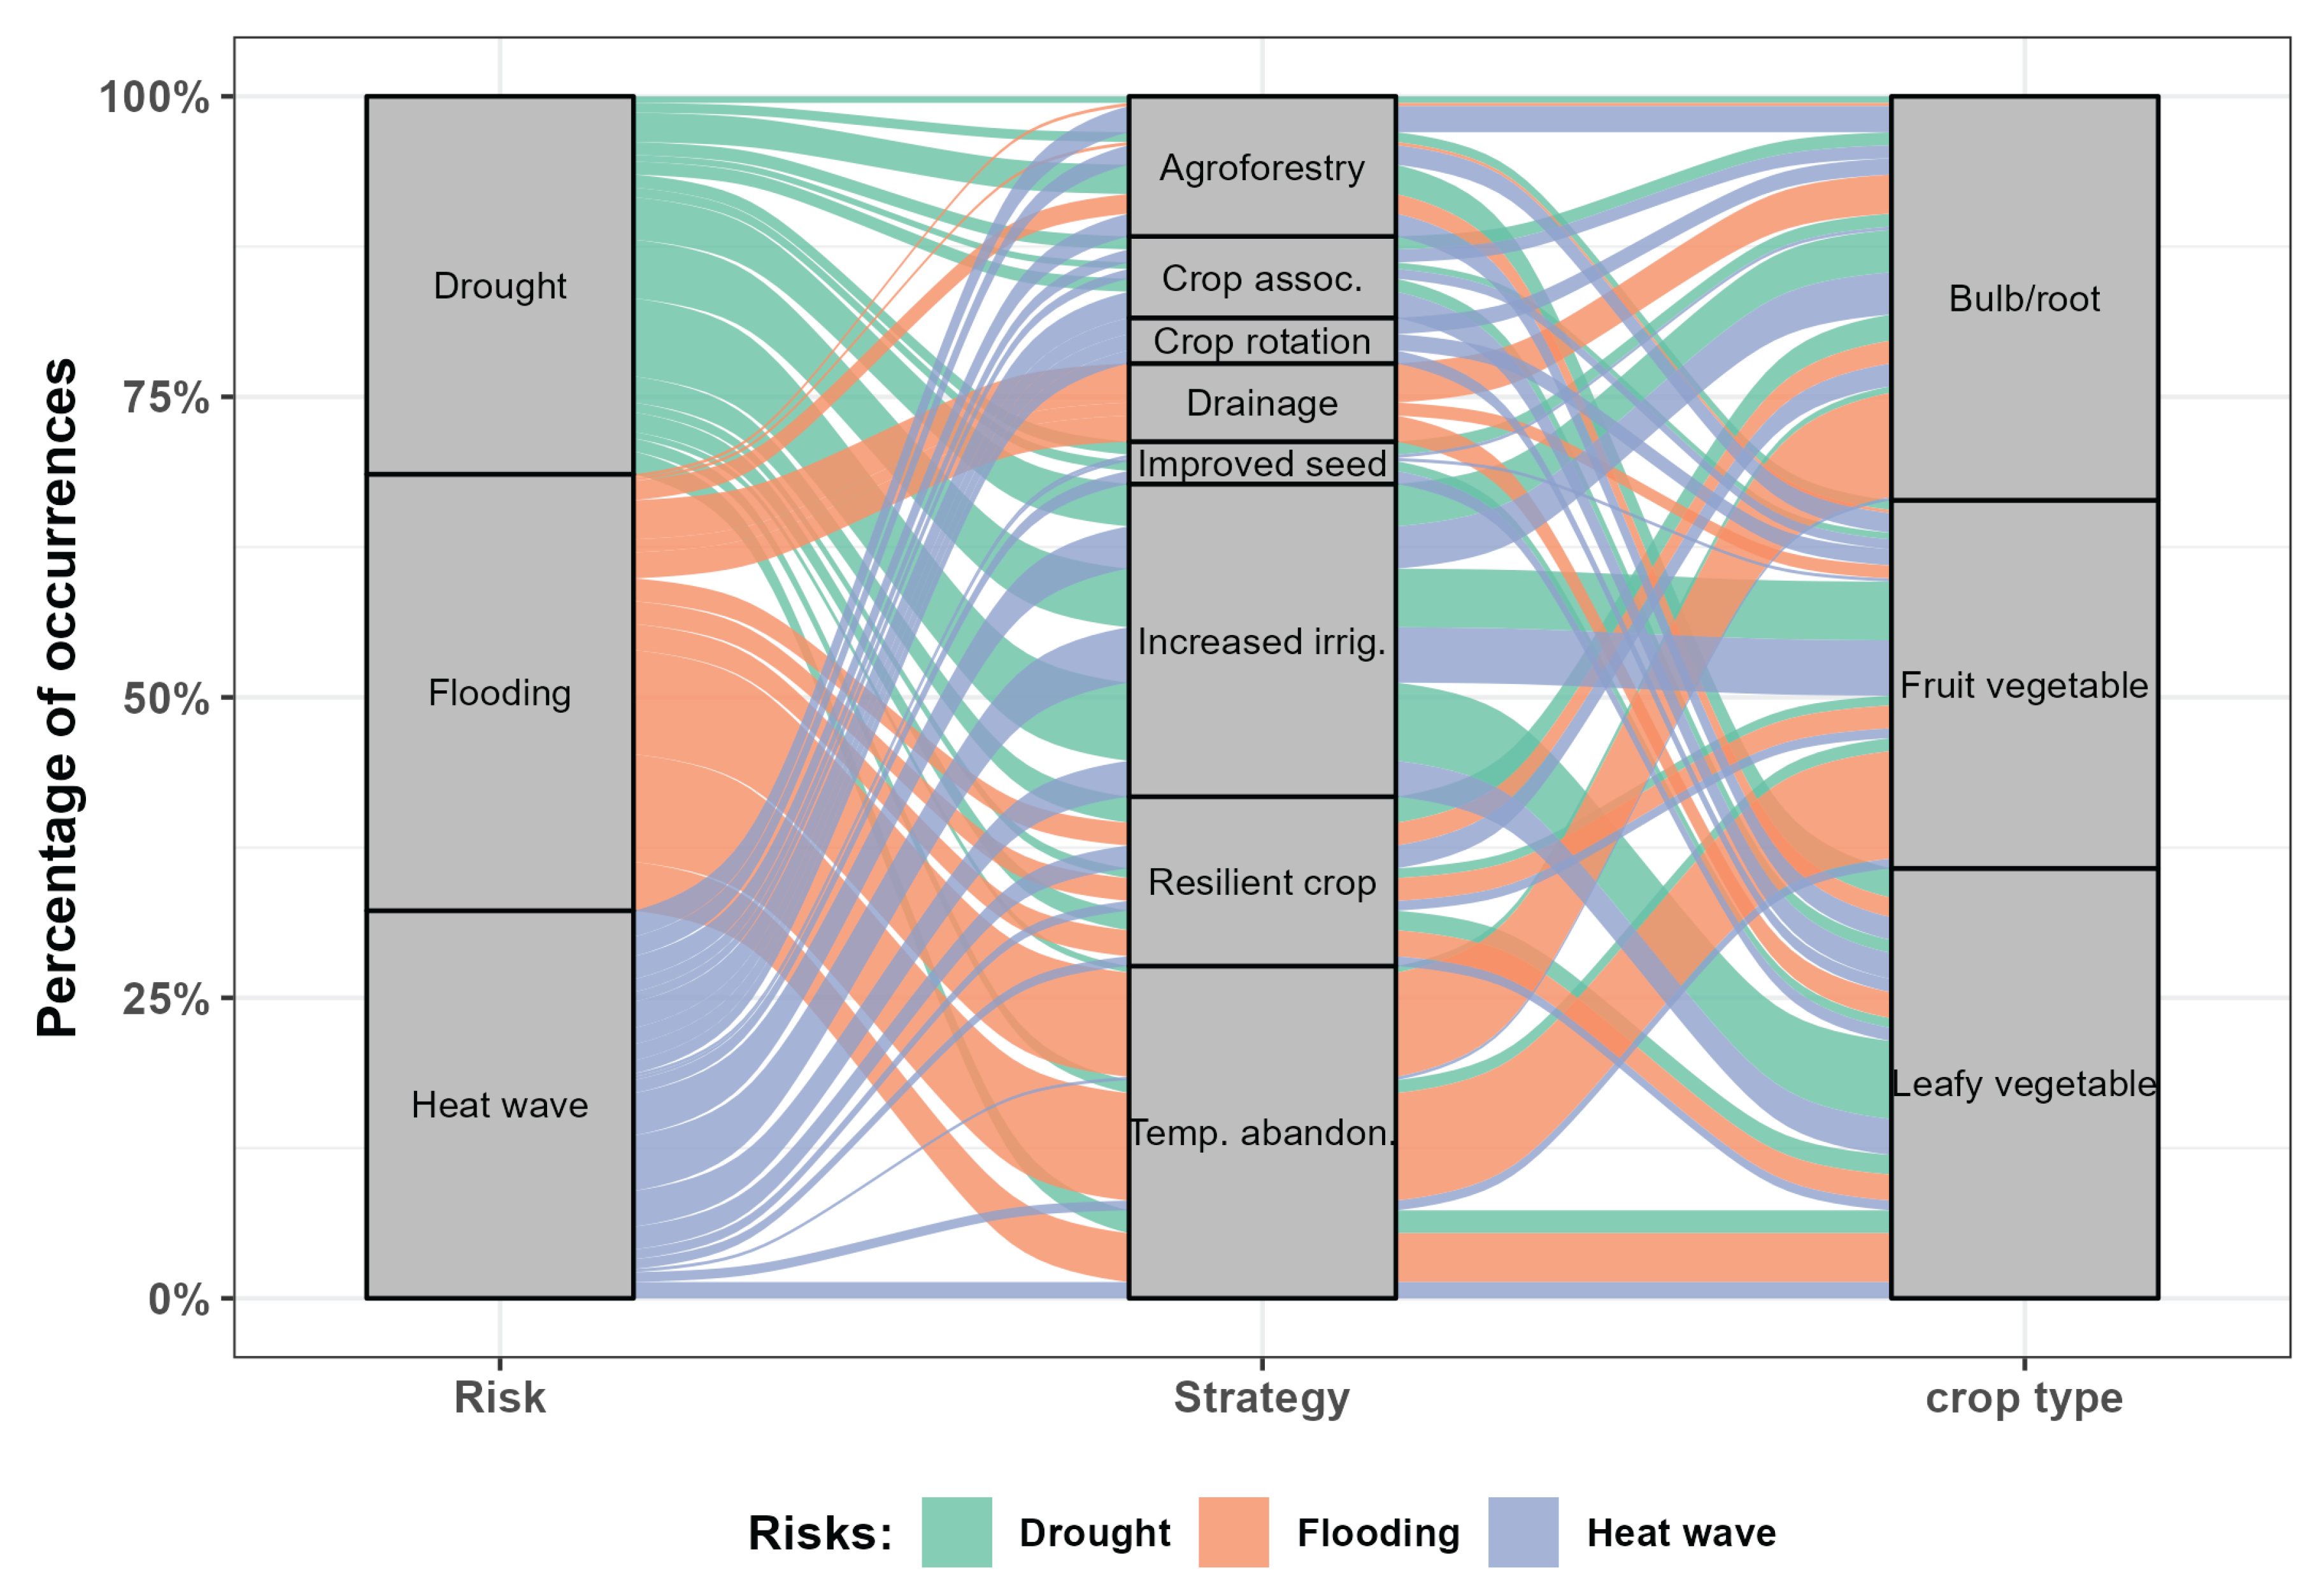

Table 1.
Table 1. Distribution of Market Gardeners Surveyed by Commune.
| Commune | Population of market gardeners | Sample | |
|---|---|---|---|
| Number | Proportion (%) | ||
| Cotonou | 608 | 132 | 36 |
| Ouidah | 322 | 87 | 23 |
| Sèmè−podji | 909 | 150 | 41 |
| Total | 1839 | 369 | 100 |
Table 2.
Classification and description of the different NDVI classes used in this study.
| classes | NDVI | Interval | Description Ecological |
|---|---|---|---|
| Class 1 | Very low | ≤ 0.20 | Degraded areas | Very low vegetation | Low photosynthetic activity. |
| Class 2 | Low | 0.21– 0.41 | Low vegetation | Degraded areas. |
| Class 3 | Medium | 0.41–0.61 | Moderate vegetation | Actively growing crops |
| Class 4 | High | 0.61–0.81 | Dense vegetation | High photosynthetic activity |
| Class 5 | Very high | 0.81–1.00 | Very dense vegetation | High biomass ecosystems |
Table 3.
Impact of climate risks on the various components of market gardening.
| Exhibition components | |||
| Hydroclimatic hazards | Soil | Water resources | Crops |
| Floods | Leaching (loss of soil nutrients) Soil depletion Erosion and destruction of crop beds Compaction and de-structuring during drying (loss of porosity, less aeration for roots) Abandonment/reduction of cultivable land |
Degradation of irrigation water quality; Temporary flooding of wells and boreholes. |
Reduced germination, stunted seedlings; Root asphyxia, rot; Plant mortality; Proliferation of waterborne diseases and crop pathogens; Rapid decline in growth and loss of yield; Loss of immediate harvests; Lower yields; Decrease in income; Additional costs (reworking the soil, applying fertilizers, replanting).; |
| Drought | Increase in soil temperature Loss of moisture, Decrease in cohesion, Soil salinization; Increased erosion; Reduction in organic matter; Soil hardening Abandonment/reduction of cultivable land |
Decrease in surface water reserves Increased concentration of pollutants Salinization of water |
Water stress; Slowed growth; Reduction in product size; Plants more susceptible to disease and pests. Loss of income during the critical season; Lower yields. Increased dependence on expensive pumps and boreholes. |
| Heat waves | Increased evaporation of soil water, Degradation of soil structures Reduction in soil water retention capacity Abandonment/reduction of cultivable land |
Decrease in surface water reserves Increased concentration of pollutants; Salinization of water. |
Heat stress; Reduced photosynthesis; Disrupted flowering (flower abortion); Leaf burn; Accelerated leaf senescence; Loss of income during the critical season; Lower yields; Additional costs (increased irrigation, fertilizer inputs, replanting); Increased dependence on expensive pumps and boreholes; Loss of Monthly jobs. |
Disclaimer/Publisher’s Note: The statements, opinions and data contained in all publications are solely those of the individual author(s) and contributor(s) and not of MDPI and/or the editor(s). MDPI and/or the editor(s) disclaim responsibility for any injury to people or property resulting from any ideas, methods, instructions or products referred to in the content. |
© 2025 by the authors. Licensee MDPI, Basel, Switzerland. This article is an open access article distributed under the terms and conditions of the Creative Commons Attribution (CC BY) license (http://creativecommons.org/licenses/by/4.0/).
Copyright: This open access article is published under a Creative Commons CC BY 4.0 license, which permit the free download, distribution, and reuse, provided that the author and preprint are cited in any reuse.


