
Submitted:
09 December 2025
Posted:
10 December 2025
You are already at the latest version
Abstract
Objectives: This prospective study aimed to assess noise levels in otolaryngology operating rooms (OR), explore noise variation across subspecialties, and examine the correlation between noise, verbal communication, and surgery complexity. Study Design: Prospective trial. Setting: Single academic institution. Methods: Noise levels and surgeon feedback from 60 otolaryngology surgeries at a Tertiary Academic Medical Center were collected between May 2023 and March 2024. Cases were randomly selected based on staff availability, excluding emergency surgeries. The cohort included 13 general ENT, 13 facial plastics, 8 head and neck, 13 laryngology, and 13 rhinology surgeries. Noise data was recorded with a Curconsa Sound Level Meter SL720. Surgeons reported communication ease and case complexity via survey, with communication deemed impaired with the incidence of repeated information in the OR. Case complexity was rated from grade 1 (lowest) to grade 4 (highest). Results: Noise differences between subspecialties’ ORs were statistically significant (p < 0.001), but the Effect size was small (η² ≈ 0.04). The Rhinology OR showed higher average noise levels compared to Facial Plastic (Rhinology louder by ~2.2 dB) and Head-Neck (Rhinology louder by ~2.6 dB). Noise did not significantly impair communication in the OR (p=0.526). Higher noise in the OR did not significantly influence surgical complexity (p=0.547). Conclusion: Noise levels in otolaryngology operating rooms varied modestly across subspecialties. No significant association between noise levels and either communication impairment or surgical complexity was observed.
Keywords:
noise
; operating room
; communication
; surgical complexity
; otolaryngology
; subspecialties
1. Introduction
Noise may be described as unintended or unwanted sound disturbances that affect a variety of fields in the workforce, including healthcare.[1,2,3] Amidst metropolitan development and technological advancement, these undesired sounds have increased dramatically in hospitals within recent decades and may negatively impact the productivity of staff and the welfare of patients.[4,5] Within the hospital, the operating room (OR) remains a setting that is particularly susceptible to noise, with peak decibel readings varying between 80 and 119 dB.[5,6,7] These levels routinely exceed the recommended threshold set by the World Health Organization (WHO) of 35 dB and at 45 dB by the Environmental Protection Agency (EPA) [6,8,9]. Noise in the OR may occur secondary to equipment use, conversation between surgical personnel, music, and background noise [5,9]. The presence and effects of noise have been widely studied in fields such as orthopedics, cardiovascular surgery, neurosurgery, general surgery, and urology [7,10,11,12,13,14,15,16]. Previous investigation across this array of surgical specialties indicates that noise exposure in operating rooms may lead to combined motor and intellectual responses. Effects include fatigue, stress reactions, impairment of sensorimotor dexterity, diminished cognitive performance, and communication deficits [10,17,18]. Transient noise in the operating room, where complex tasks are performed continuously, can disrupt the flow of the procedure and cause distractions, potentially impairing concentration and surgical performance, leading to harmful consequences [9,19]. Noise has been found to adversely affect the surgeon's operating speed, the time required to complete surgical tasks, and the efficiency of their movements, resulting in decreased accuracy and higher error rates [20]. Additionally, excessive noise exposure during a surgical career could lead to lasting effects on auditory processing [10,21]. Such adverse outcomes for affected personnel include noise-induced hearing loss (NIHL) and tinnitus [9,22,23].
Otolaryngology operating rooms have been recognized as among the loudest in surgical specialties [24,25]. Systemic review of noise in otolaryngology operating rooms supports this suspicion as the average noise level recorded in OHNS ORs was 70.1 dB, and the maximum noise level was 95.5 dB [9]. Notable noise contributors are suction and surgical instruments/power tools. It has been determined that certain procedures are associated with higher noise levels. For example, mastoid-related surgery has some of the highest recorded decibel levels, largely thought to be attributed to the constant use of high-powered drills [27]. However, the causal relationship between noise, OR communication, and effects on surgical personnel is still not well understood in otolaryngology-head and neck (OHNS) surgery [25].
This study aimed to better understand noise decibel levels within the subspecialties of otolaryngology and investigate the combined effect of background noise, speech sounds, and music on a surgeon’s concentration and communication ability.
2. Materials and Methods
After approval by the LSU Health Sciences Center-Shreveport Institutional Review Board (IRB), noise levels and survey data were prospectively collected for 60 otolaryngology surgeries performed at a Tertiary Academic Medical Center from May 2023 to March 2024. Cases were divided into the subspecialties of general ENT (13), facial plastic and reconstructive surgeries (13), head and neck (8), laryngology (13), and rhinology (13). Preceding enrollment in the study, all otolaryngology surgeons on staff were informed of study details and verbally consented to the collection of noise data in the OR. Individual cases were randomly selected based on the research staff’s availability to collect data. Emergency otolaryngology cases were excluded. For each case, the following demographic information was collected before the case started: operative procedure and corresponding otolaryngology subspecialty as designated by the qualifications of the operating surgeon.
Noise levels were measured with Curconsa Sound Level Meter SL720. The noise measurements provided by this device were in the form of instantaneous decibels and A-weighted (dBA) levels. From the information provided by Curconsa, the measuring range of the sound level meter was 30 dBA to 130 dBA with fast response speed, reliable performance, and high accuracy of ± 2.0 dBA. A validation study was designed by research staff to substantiate these claims. An audiometric hearing booth was used to generate pure tone decibels in the form of decibel hearing level (db HL) at 1000 Hz frequency. The Curconsa Sound Level Meter SL720 was placed in the center of the booth. At each magnitude of 30, 50, and 70 db HL, 15 tones were generated, and the reading from the Curconsa Sound Level Meter SL720 was recorded in the form of dBA. The difference between db HL and dBA was previously studied to be small, and it has been theorized that dbA thresholds can be treated as if they were db HL.26 The average readings collected form the sound level meter were 30.7 ± 0.84 dBA, 51.3 ± 0.70 dBA, and 71.4 ± 0.86 dBA at 30, 50, 70 db HL, respectively. With a high degree of accuracy and precision, the research team felt comfortable using this device to record noise data.
Noise Decibel Levels
To standardize the noise data collection process, the measurements were gathered using the following method in operating rooms of approximately the same size and configuration. Noise measurements were obtained by measuring the decibel level with the Curconsa Sound Level Meter SL720 on the “slow” setting during designated collection times throughout each case. Research staff collected decibel readings approximately 5 feet from the sterile field, behind the operating surgeon. The start of the procedure was indicated after case time out when the words “incision” or “scalpel” were mentioned by surgical staff or when there was visual indication of initial surgical intervention. These cues prompted the first instantaneous noise measurement to be collected. Following procedure start, instantaneous decibel measurements were collected in 15-minute increments until the conclusion of surgery. Such a conclusion was signaled by verbal cues from the operating surgeon and surgical staff.
Surgeon Survey
Once the surgery was complete, surgeons were given a consent form to participate in the survey portion of the study. Consent forms were handed to surgeons after the case to avoid possible bias and influence of noise measurements while performing the surgery. Once consented, a survey was given.
The survey contained three questions regarding communication ease and perceived surgical complexity, where surgeons circled or underlined their answers:
1. “During the surgery, could you hear: quiet talking, normal talking, or loud talking?”
2. “Did you have to ask nurses or members of the operating team to repeat themselves? Yes/No”
3. “How would you describe the difficulty of the surgery? 1-4 where 1=lowest difficulty and 4=highest difficulty”
An answer of “Yes” to question number 2 indicated the incidence of impaired communication ability.
Outcome Measures
Objective outcome measures analyzed in this study include those gathered from noise decibel measurements-minimum, maximum, and average noise levels. Such values were obtained for each operative procedure, designated otolaryngology subspeciality, and across all 60 otolaryngology cases.
Survey metrics were analyzed to determine the incidence of impaired communication ability. Additionally, the reported difficulty of the case was further evaluated with reference to the collected noise decibel data.
3. Statistical analysis
3.1. Operating room noise across five ENT subspecialties: General ENT, Laryngology, Rhinology, Head Neck Surgery, and Facial Plastic was analyzed using one-way ANOVA, and non-parametric tests to compare mean noise levels.
3.2. Operating room noise levels within each ENT sub-specialty were analyzed using descriptive statistics (mean, SD, median, quartiles, min-max), normality tests (Shapiro-Wilk), and outlier counts (Tukey IQR)
3.3:. Operating room noise levels and their relationship to surgical complexity and communication impairment were analyzed using ANOVA and t-test, respectively, with regression modeling.
4. Results
475 noise measurements (n) were recorded across 60 (N) surgeries, performed by a total of 12 surgeons over the course of ten months. Additionally, 60 surveys were collected from the primary operating surgeon following the conclusion of the surgery. An overview of the operative procedures studied is in Table 1.
4.1.1. Noise in Otolaryngology Subspecialty Operating Rooms
Table 2 and Figure 1 show the comparison and analysis of operating room noise levels across the five otolaryngology subspecialties. Noise levels differed significantly across the subspecialties (p<0.001). The Effect size was small (eta^2): 0.0405), and the non-parametric (Kruskal-Wallis) test confirmed the same (p ≈ 0.00008). Rhinology ORs were louder than Facial Plastic by ~2.2 dB (significant), and louder than Head-Neck ORs by ~2.6 dB (significant).
Rhinology ORs tend to be the loudest, likely due to the power tools used in sinus surgery. Facial Plastic and Head & Neck surgeries are quieter, possibly because they involve more delicate work and rarely use power tools.
4.1.2. Noise in Individual Subspecialty Otolaryngology Operating Rooms (Figure 2, Figure 3, Figure 4, Figure 5 and Figure 6)
4.2.1. Communication Impairment by Noise in the Operating Rooms
Mean noise impaired: 63.12 dB
• Mean noise unimpaired: 62.23 dB
• T-test p = 0.526; Mann-Whitney p = 0.513
Noise did not significantly impair communication, and effect size was negligible.
4.2.2. Noise in the Operating Room and the complexity of surgeries
Mean noise by complexity level of surgery:
- Level 1 (least complex surgery): 62.09 dB
- Level 2 (minimally complex surgery): 61.93 dB
- Level 3: (moderately complex surgery): 63.41 dB
- Level 4: (Highly complex surgery): 63.83 dB
• ANOVA: F (3,56) = 0.555, p = 0.647
• Spearman correlation: rho = 0.079, p = 0.547
There was minimal or no significant influence of higher noise levels on highly complex surgeries.
5. Discussion
In the hospital environment, the operating room is susceptible to noise disturbances. A variety of inherent and extraneous factors contribute to such noise pollution. Some sources of noise in the OR include conversation amongst staff, surgical equipment, music, anesthesia monitors, and ambient background noise such as laminar airflow systems [5,9]. The noise from some of these contributors is meant to deliver vital instruction, messages, and assist in surgical techniques throughout the case. However, they may work more ominously to impair communication, performance, and patient outcomes. The field of otolaryngology has been suspected to be among the loudest surgical specialties from the high-frequency surgical instruments used [24,27]. However, there has been limited investigation into determining if this noise affects surgeons’ communication and perception of case difficulty.
This study provides valuable insight into the noise environment within otolaryngology ORs. The overall average noise level of 63.9 dBA is within the moderate range, consistent with normal conversation [28]. Although the differences in subspecialty’ OR noise were statistically significant, the differences may not have a big real-world impact on communication or performance as most of the noise differences are probably from other factors (like instruments, team behavior, or room setup).
Rhinology procedures were associated with the highest average noise levels at 63.9 dBA, reflecting the nature of surgeries likely due to the power tools used in sinus surgery. This finding supports the common conclusion that power instruments and associated complex surgical techniques contribute to a noisier environment with higher ambient noise levels [29]. In contrast, the lowest average noise levels (60.5 dBA) were seen in head and neck surgeries despite recording the highest peak noise level (79 dBA). This discrepancy suggests procedures within this subspecialty might be associated with periodic spikes in noise that do not persist throughout the entire case, ultimately leading to an overall quieter OR environment. Facial plastic and reconstructive surgeries were also generally associated with quieter noise levels. This could be due to the inherently delicate nature of these procedures and the lower prevalence of noisy, high-speed instruments. Notably, there was evident variation in noise levels, supporting the notion that factors including duration of procedure, specific equipment used, and the requirement of precise and quiet manipulation may influence the noise levels in the OR [29].
Our study found that noise levels in the ORs were not strongly linked to communication impairment and did not influence complex surgeries. Surgeons reported impaired communication in 21% of cases, particularly in those with maximum noise levels below 70 dBA. This conclusion supports the finding by Mcleod et. al that noise can negatively impact surgeon experience and team interactions [30]. Although noise is a contributing factor during surgeries, a higher concentration level, focus and adaptation of team dynamics in more complex surgeries might alleviate the impact of noise on communication.
The variability in noise levels between subspecialties and individual procedures suggests that a uniform approach to noise management may not be effective. A custom strategy employed with reference to recommendations by the Joint Commission and National Association for Healthcare Quality (NAHQ) may be required to address the specific needs of each subspecialty [31]. For instance, in ORs where noise is more persistent, there could be a benefit from interventions designed to reduce ambient noise. This might be accomplished by sound-absorbing and monitoring devices with associated alerts, or increased awareness about external factors such as music preferences [32]. Additionally, ORs associated with transient noise spikes might benefit from a more targeted approach.
Moreover, closed-loop communication training could be of benefit, especially for teams working in louder environments [31].
This study is not without limitations. For one, due to staff availability limitations, there was limited data collected in otology operating rooms. Additionally, while continual noise monitoring would have been ideal, the cost associated with obtaining such monitors decibel data was beyond the capacity of this study. Furthermore, IRB approval was limited to the collection of succinct measurements and prohibited the recording of data on an external device for future analysis. The periodic collection of measurements could act as a temporal limitation and coincide with reduced precision in noise measurement. Despite these limitations, the data collected in this study provides insight into the observed noise levels in otolaryngology operating rooms and the corresponding investigation into the relationship between noise, perceived surgical difficulty, and communication.
Future studies can use continuous noise monitoring throughout the duration of surgeries to record transient spikes and patterns. Performing the study across multiple institutions may improve generalizability and account for variations in OR design and workflow. Investigation of team size, music, and instruments used during the surgeries can help to understand noise predictors better. Assessing surgeon stress, fatigue, and error rates to determine the real-world impact of noise on surgeon performance and patient safety can have practical application. Finally, potential adverse effects can be mitigated using sound-absorbing materials and closed-loop communication.
6. Conclusions
Noise levels in otolaryngology operating rooms vary modestly across subspecialties, with Rhinology demonstrating the highest average noise levels and Facial Plastic and Head & Neck surgeries being generally quieter. Although these differences reached statistical significance, the effect size was small, indicating limited clinical or operational impact. Furthermore, regression analysis and comparative tests revealed no significant association between noise levels and either communication impairment or surgical complexity. These findings suggest that operating room noise is influenced more by contextual factors—such as equipment type, staff movement, and room configuration—than by subspecialty or case difficulty.
Author Contributions
Conceptualization: Mankekar and Cradeur; Methodology: Mankekar and Cradeur; Validation: Cradeur, Collins, Mankekar; Formal analysis: Cradeur, Abshire, Schichtel, Hachem; Investigation: Cradeur, Abshire, Schichtel, Hachem, and Collins.; Resources: Mankekar, Nathan.; Data curation: Cradeur, Abshire, Schichtel, Hachem, Collins, Mankekar; Writing—Original Draft Preparation: Cradeur, Abshire, Schichtel, Hachem.; Writing: Mankekar and Cradeur; Supervision: Cradeur, Mankekar, Mankekar.; Project administration: Mankekar.; Funding acquisition: Mankekar, Nathan. All authors have read and agreed to the published version of the manuscript.
Funding
This research received no external funding
Institutional Review Board Statement
The study was conducted in accordance with the Declaration of Helsinki and approved by the Institutional Review Board of LSU Health, Shreveport, Louisiana # 6418 and 12.6.23. for studies involving humans.
Informed Consent Statement
Patient consent was waived by the IRB as the study was not associated with any harm to the patient and was a quality project to study noise in the operating room.
Data Availability Statement
The raw data supporting the conclusions of this article can be made available by the authors on request.
Acknowledgments
The Authors acknowledge Dinesh Vartak for technical support. The authors used Microsoft Co-Pilot based on GPT-5 for statistical analysis. The authors have reviewed and edited the output and take full responsibility for the content of this publication.
Conflicts of Interest
The authors declare no conflicts of interest.
Abbreviations
The following abbreviations are used in this manuscript:
| MDPI | Multidisciplinary Digital Publishing Institute |
| DOAJ | Directory of open access journals |
| TLA | Three letter acronym |
| LD | Linear dichroism |
References
- Gatersleben, B.; Griffin, I. Environmental stress. In Handbook of environmental psychology and quality of life research; Fleury-Bahi, G., Pol, E., Navarro, O., Eds.; Springer International Publishing/Springer Nature, 2017; pp. 469–485. [Google Scholar] [CrossRef]
- Lundberg, U.; Frankenhaeuser, M. Psychophysiological reactions to noise as modified by personal control over noise intensity. Biological psychology 1978, 6, 51–59. [Google Scholar] [CrossRef]
- Parsons, R.J. Environmental psychophysiology. In Handbook of psychophysiology, 3rd ed.; Cacioppo, J.T., Tassinary, L.G., Berntson, G.G., Eds.; Cambridge University Press, 2007; pp. 752–786. [Google Scholar] [CrossRef]
- Shapiro, R.A.; Berland, T. Noise in the operating room. The New England journal of medicine 1972, 287, 1236–1238. [Google Scholar] [CrossRef]
- Katz, J.D. Noise in the operating room. Anesthesiology 2014, 121, 894–898. [Google Scholar] [CrossRef] [PubMed]
- Hasfeldt, D.; Laerkner, E.; Birkelund, R. Noise in the operating room--what do we know? A review of the literature. In official journal of the American Society of PeriAnesthesia Nurses; Journal of perianesthesia nursing, 2010; Volume 25, pp. 380–386. [Google Scholar] [CrossRef]
- Kracht, J.M.; Busch-Vishniac, I.J.; West, J.E. Noise in the operating rooms of Johns Hopkins Hospital. The Journal of the Acoustical Society of America 2007, 121, 2673–2680. [Google Scholar] [CrossRef]
- 95 - occupational noise exposure. Occupational Safety and Health Administration. 1910. Available online: https://www.osha.gov/pls/oshaweb/owadisp.show_document?p_table=STANDARDS&p_id=9735.
- Sampieri, G.; Namavarian, A.; Levin, M.; et al. Noise in Otolaryngology – Head and Neck Surgery operating rooms: A systematic review. Journal of Otolaryngology - Head & Neck Surgery 2021, 50. [Google Scholar] [CrossRef]
- Keller, S.; Tschan, F.; Semmer, N.K.; Holzer, E.; Candinas, D.; Brink, M.; Beldi, G. Noise in the Operating Room Distracts Members of the Surgical Team. An Observational Study. World journal of surgery 2018, 42, 3880–3887. [Google Scholar] [CrossRef]
- Siverdeen, Z.; Ali, A.; Lakdawala, A.S.; McKay, C. Exposure to noise in orthopaedic theatres--do we need protection? International journal of clinical practice 2008, 62, 1720–1722. [Google Scholar] [CrossRef]
- Sydney, S.E.; Lepp, A.J.; Whitehouse, S.L.; Crawford, R.W. Noise exposure due to orthopedic saws in simulated total knee arthroplasty surgery. The Journal of arthroplasty 2007, 22, 1193–1197. [Google Scholar] [CrossRef]
- Nott, M.R.; West, P.D. Orthopaedic theatre noise: a potential hazard to patients. Anaesthesia 2003, 58, 784–787. [Google Scholar] [CrossRef] [PubMed]
- Fitzgerald, G.; O'Donnell, B. In somno securitas" anaesthetists' noise exposure in Orthopaedic operating theatres. Irish medical journal 2012, 105, 239–241. [Google Scholar] [PubMed]
- Love, H. Noise exposure in the orthopaedic operating theatre: a significant health hazard. ANZ journal of surgery 2003, 73, 836–838. [Google Scholar] [CrossRef]
- Ginsberg, S.H.; Pantin, E.; Kraidin, J.; Solina, A.; Panjwani, S.; Yang, G. Noise levels in modern operating rooms during surgery. Journal of cardiothoracic and vascular anesthesia 2013, 27, 528–530. [Google Scholar] [CrossRef]
- Clark, C.; Sörqvist, P. A 3 year update on the influence of noise on performance and behavior. Noise & health 2012, 14, 292–296. [Google Scholar] [CrossRef]
- Szalma, J.L.; Hancock, P.A. Noise effects on human performance: a meta-analytic synthesis. Psychological bulletin 2011, 137, 682–707. [Google Scholar] [CrossRef]
- Way, T.J.; Long, A.; Weihing, J.; Ritchie, R.; Jones, R.; Bush, M.; Shinn, J.B. Effect of noise on auditory processing in the operating room. Journal of the American College of Surgeons 2013, 216, 933–938. [Google Scholar] [CrossRef]
- Mentis, H.M.; Chellali, A.; Manser, K.; Cao, C.G.; Schwaitzberg, S.D. A systematic review of the effect of distraction on surgeon performance: directions for operating room policy and surgical training. Surgical endoscopy 2016, 30, 1713–1724. [Google Scholar] [CrossRef]
- Eggermont, J.J. Effects of long-term non-traumatic noise exposure on the adult central auditory system. Hearing problems without hearing loss. Hearing research 2017, 352, 12–22. [Google Scholar] [CrossRef] [PubMed]
- Golub, J.S. Occupational hearing loss. In Current Diagnosis & Treatment Otolaryngology–Head andNeck Surgery, 4th ed.; Lalwani, A.K., Ed.; McGraw Hill, 2020; pp. 924–935. Available online: https://accessmedicine-mhmedial-com.oro.
- Vaisbuch, Y.; Alyono, J.C.; Kandathil, C.; Wu, S.H.; FitzgeraldMB; Jackler, R.K. Occupational noise exposure and riskfor noise-induced hearing loss due to temporal bone drilling. Otol Neurotol. 2018, 39, 693–699. [Google Scholar] [CrossRef] [PubMed]
- Prasad, K.R.; Reddy, K.T. Live recordings of sound levels during the use of powered instruments in ENT surgery. The Journal of laryngology and otology 2003, 117, 532–535. [Google Scholar] [CrossRef]
- Fritsch, M.H.; Chacko, C.E.; Patterson, E.B. Operating room sound level hazards for patients and physicians. Otology & neurotology: official publication of the American Otological Society, American Neurotology Society [and] European Academy of Otology and Neurotology 2010, 31, 715–721. [Google Scholar] [CrossRef]
- dB A vs dB HL | Interacoustics. n.d. Available online: https://www.interacoustics.com/academy/audiometry-training/pure-tone-audiometry/db-a-vs-db-hl.
- Lee, H.K.; Lee, E.H.; Choi, J.Y.; Choi, H.S.; Kim, H.N. Noise levelof drilling instruments during mastoidectomy. Yonsei MedJ. 1999, 40, 339–342. [Google Scholar] [CrossRef]
- Chepesiuk, R. Decibel hell: the effects of living in a noisy world. Environmental health perspectives 2005, 113, A34–A41. [Google Scholar] [CrossRef]
- Shakhtour, L.; Song, S.; Orobello, N.C.; Ambrose, T.; Rana, M.S.; Behzadpour, H.K.; Reilly, B.K. Evaluation of Noise Exposure Levels in Pediatric ENT Operating Rooms. Otolaryngology--head and neck surgery: official journal of American Academy of Otolaryngology-Head and Neck Surgery 2024, 171, 1226–1231. [Google Scholar] [CrossRef] [PubMed]
- Mcleod, R.; Myint-Wilks, L.; Davies, S.E.; Elhassan, H.A. The impact of noise in the operating theatre: a review of the evidence. Annals of the Royal College of Surgeons of England 2021, 103, 83–87. [Google Scholar] [CrossRef] [PubMed]
- Louis, M.; Grabill, N.; Strom, P.; Gibson, B. Leading Through Noise: Operating Room Noise Challenges for Staff and Leadership Techniques to Ensure Optimal Operational Performance. Cureus 2024, 16, e69569. [Google Scholar] [CrossRef] [PubMed]
- Quick Safety 35: Minimizing noise and distractions in the OR and procedural units The Joint Commission. n.d. Available online: https://www.jointcommission.org/resources/news-and-multimedia/newsletters/newsletters/quick-safety/quick-safety-issue-35-minimizing-noise-and-distractions--in-the-or-and-procedural-units/minimizing-noise-and-distractions--in-the-or-and-procedural-units/.
Figure 1.
Noise levels (dB) distributed by ENT subspeciality.
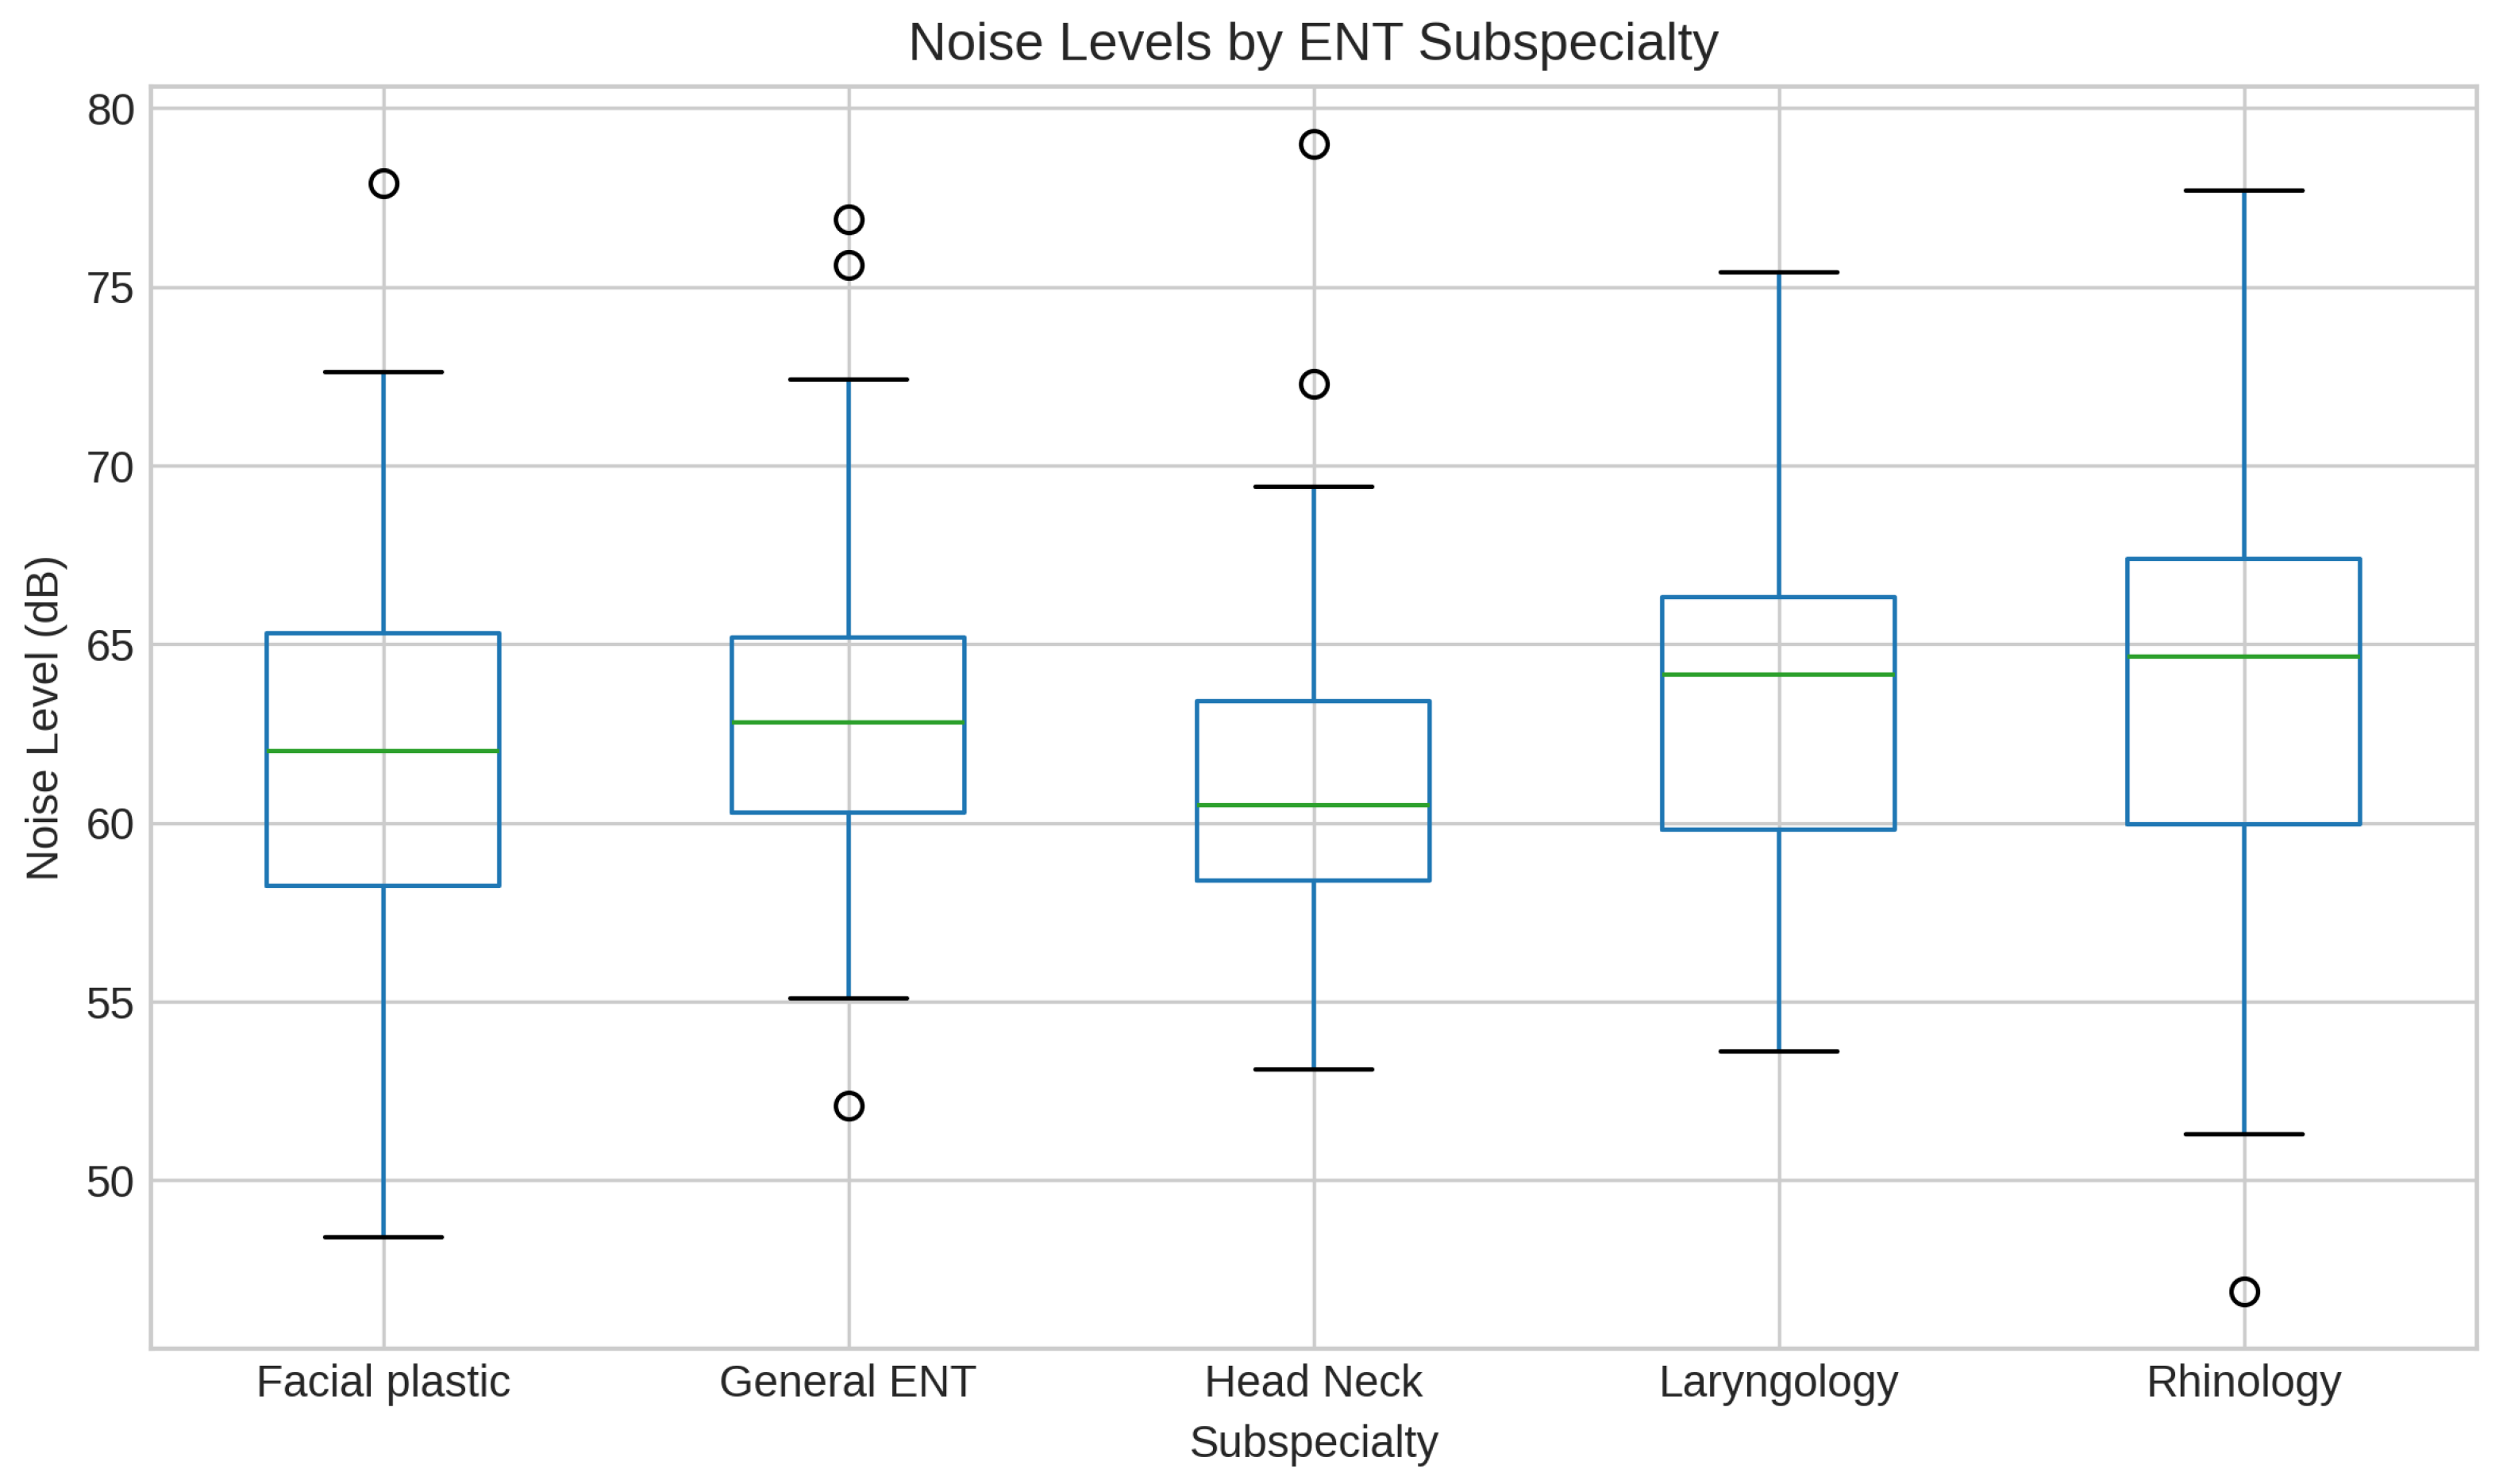
Figure 2.
Noise in General ENT Operating Room: n=100, Mean=63.08, SD=4.23, Median=62.80, Q1=60.27, Q3=65.17, Min=52.10, Max=76.90; Shapiro-Wilk W=0.981, p=0.1504.
Figure 2.
Noise in General ENT Operating Room: n=100, Mean=63.08, SD=4.23, Median=62.80, Q1=60.27, Q3=65.17, Min=52.10, Max=76.90; Shapiro-Wilk W=0.981, p=0.1504.
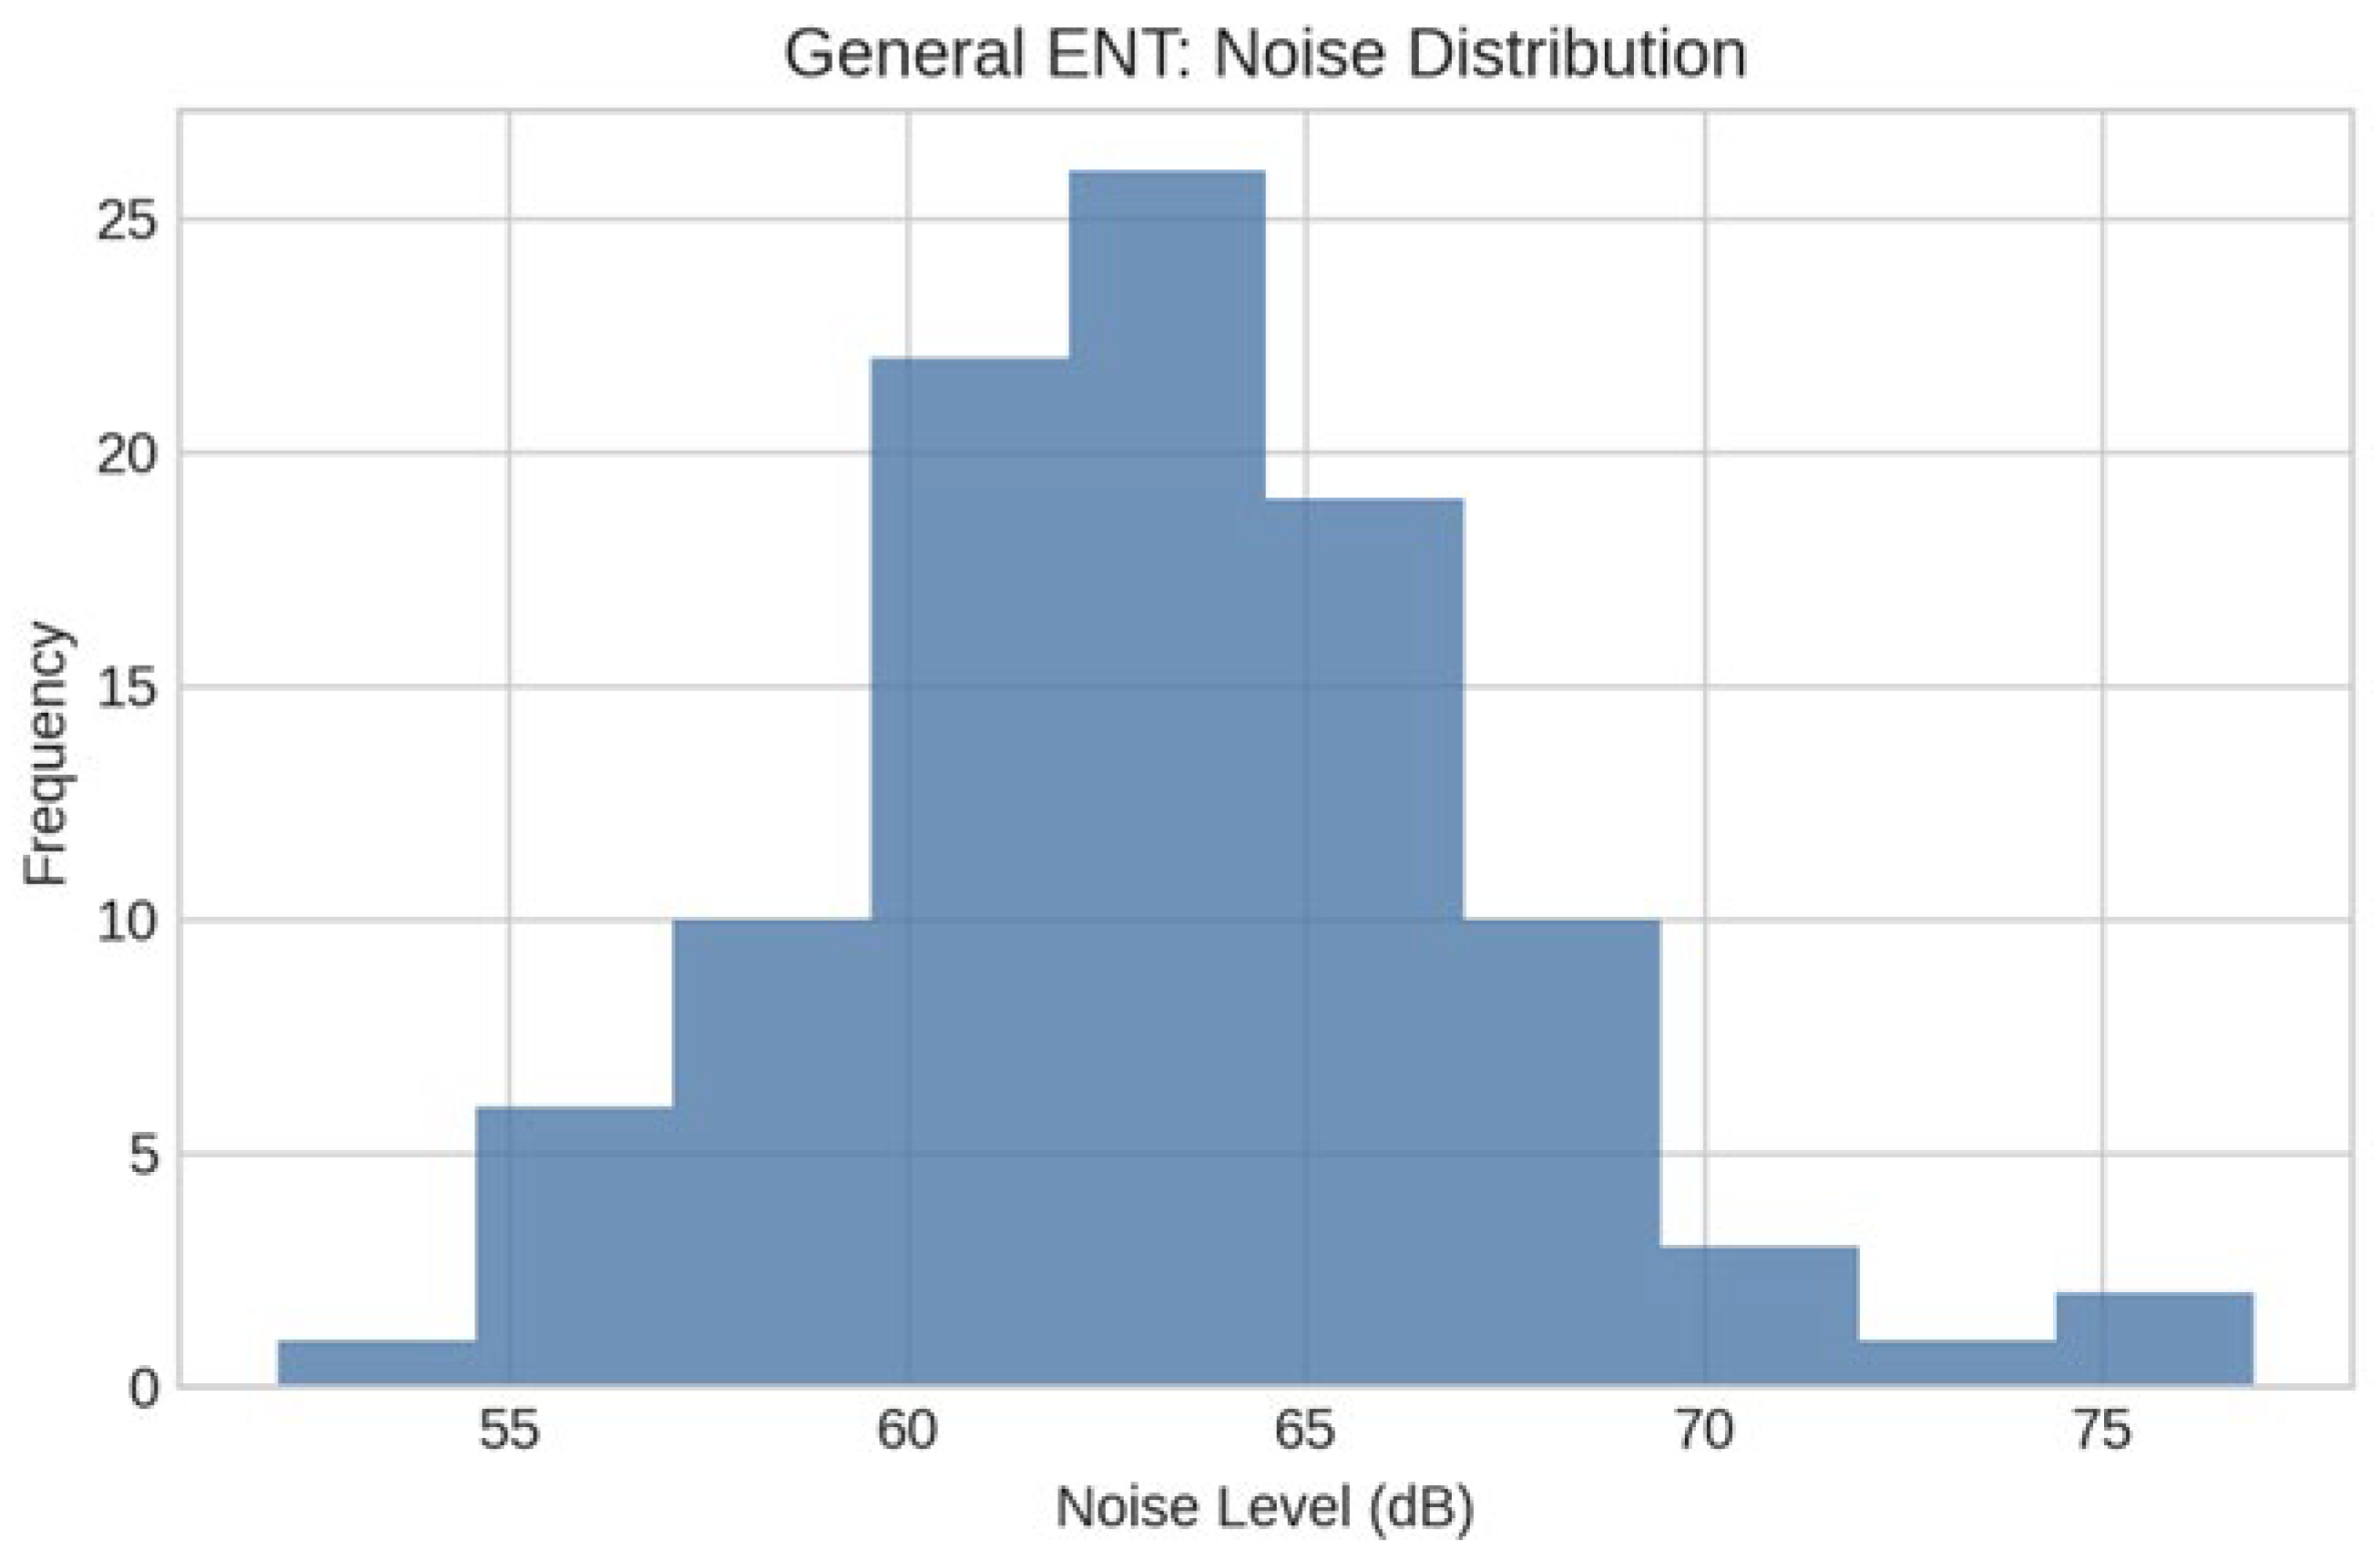
Figure 3.
Noise in Laryngology Operating room: n=58, Mean=62.98, SD=4.65, Median=64.15, Q1=59.80, Q3=66.33, Min=53.60, Max=75.40; Shapiro-Wilk W=0.974, p=0.2564; Outliers=0.
Figure 3.
Noise in Laryngology Operating room: n=58, Mean=62.98, SD=4.65, Median=64.15, Q1=59.80, Q3=66.33, Min=53.60, Max=75.40; Shapiro-Wilk W=0.974, p=0.2564; Outliers=0.
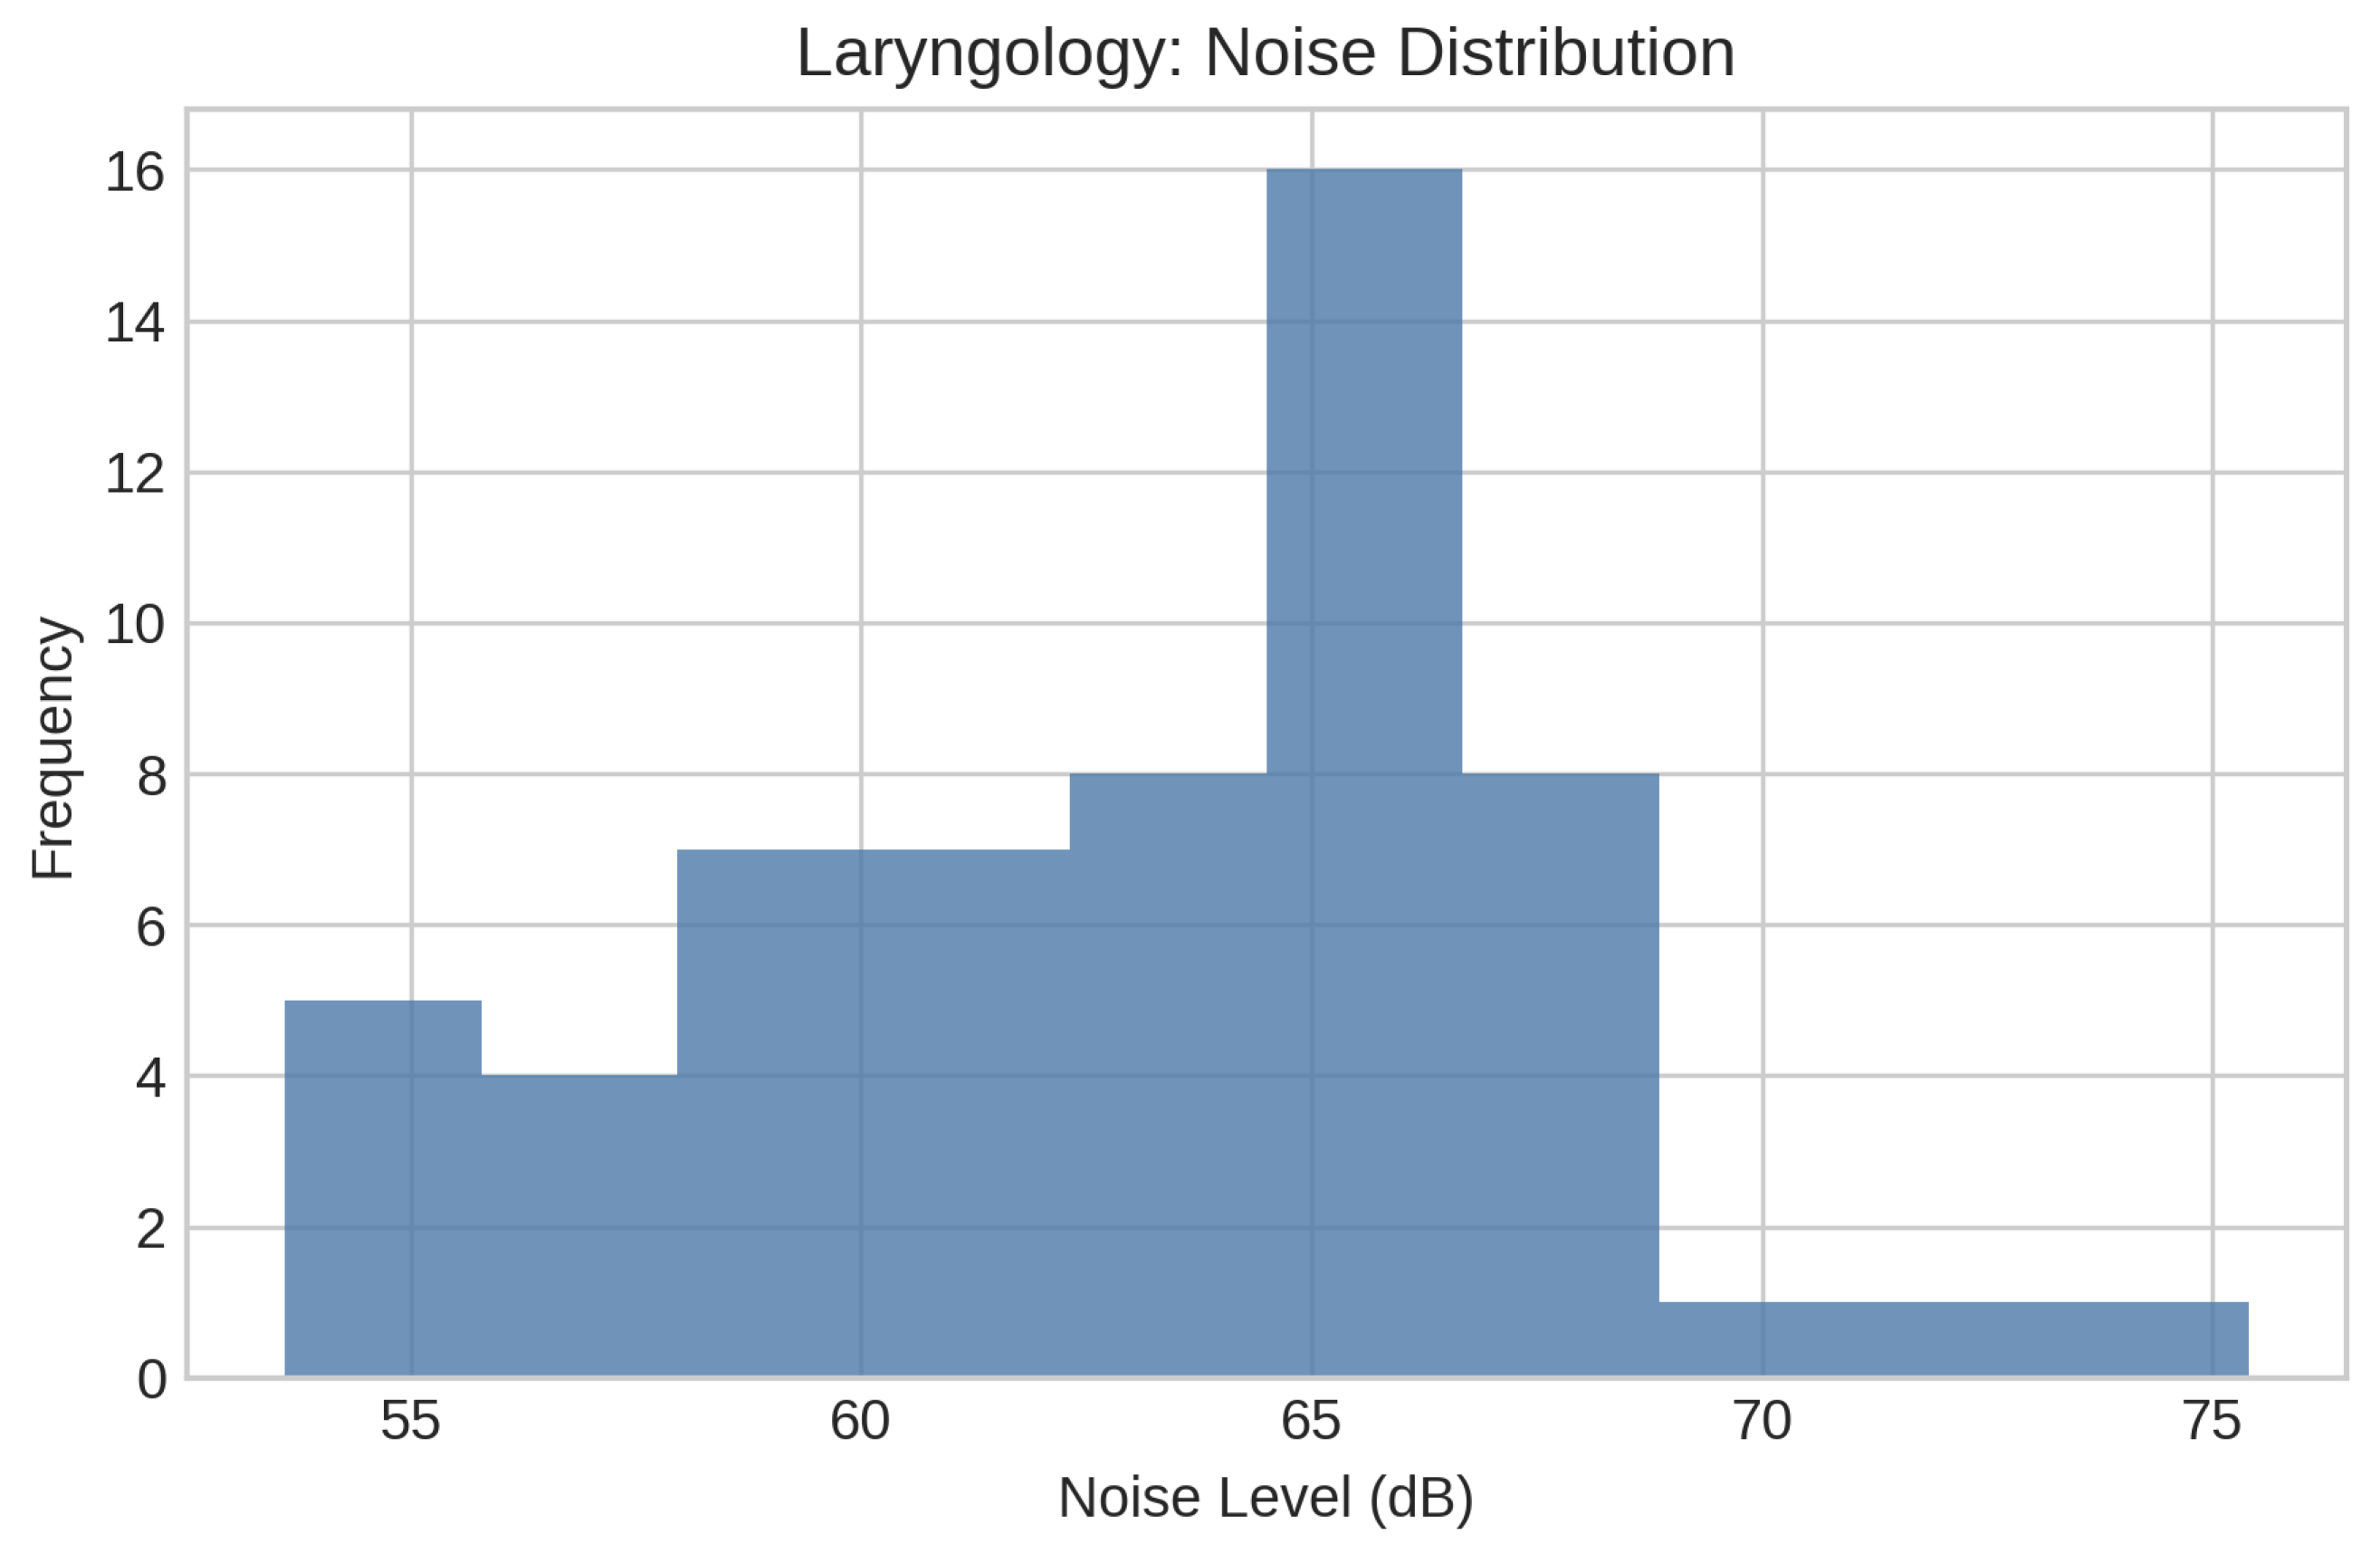
Figure 4.
Noise in Rhinology Operating room: n=166, Mean=63.92, SD=5.16, Median=64.65, Q1=59.95, Q3=67.40, Min=46.90, Max= 77.70. Shapiro-Wilk W=0.989, p=0.2236; Outliers=1.
Figure 4.
Noise in Rhinology Operating room: n=166, Mean=63.92, SD=5.16, Median=64.65, Q1=59.95, Q3=67.40, Min=46.90, Max= 77.70. Shapiro-Wilk W=0.989, p=0.2236; Outliers=1.
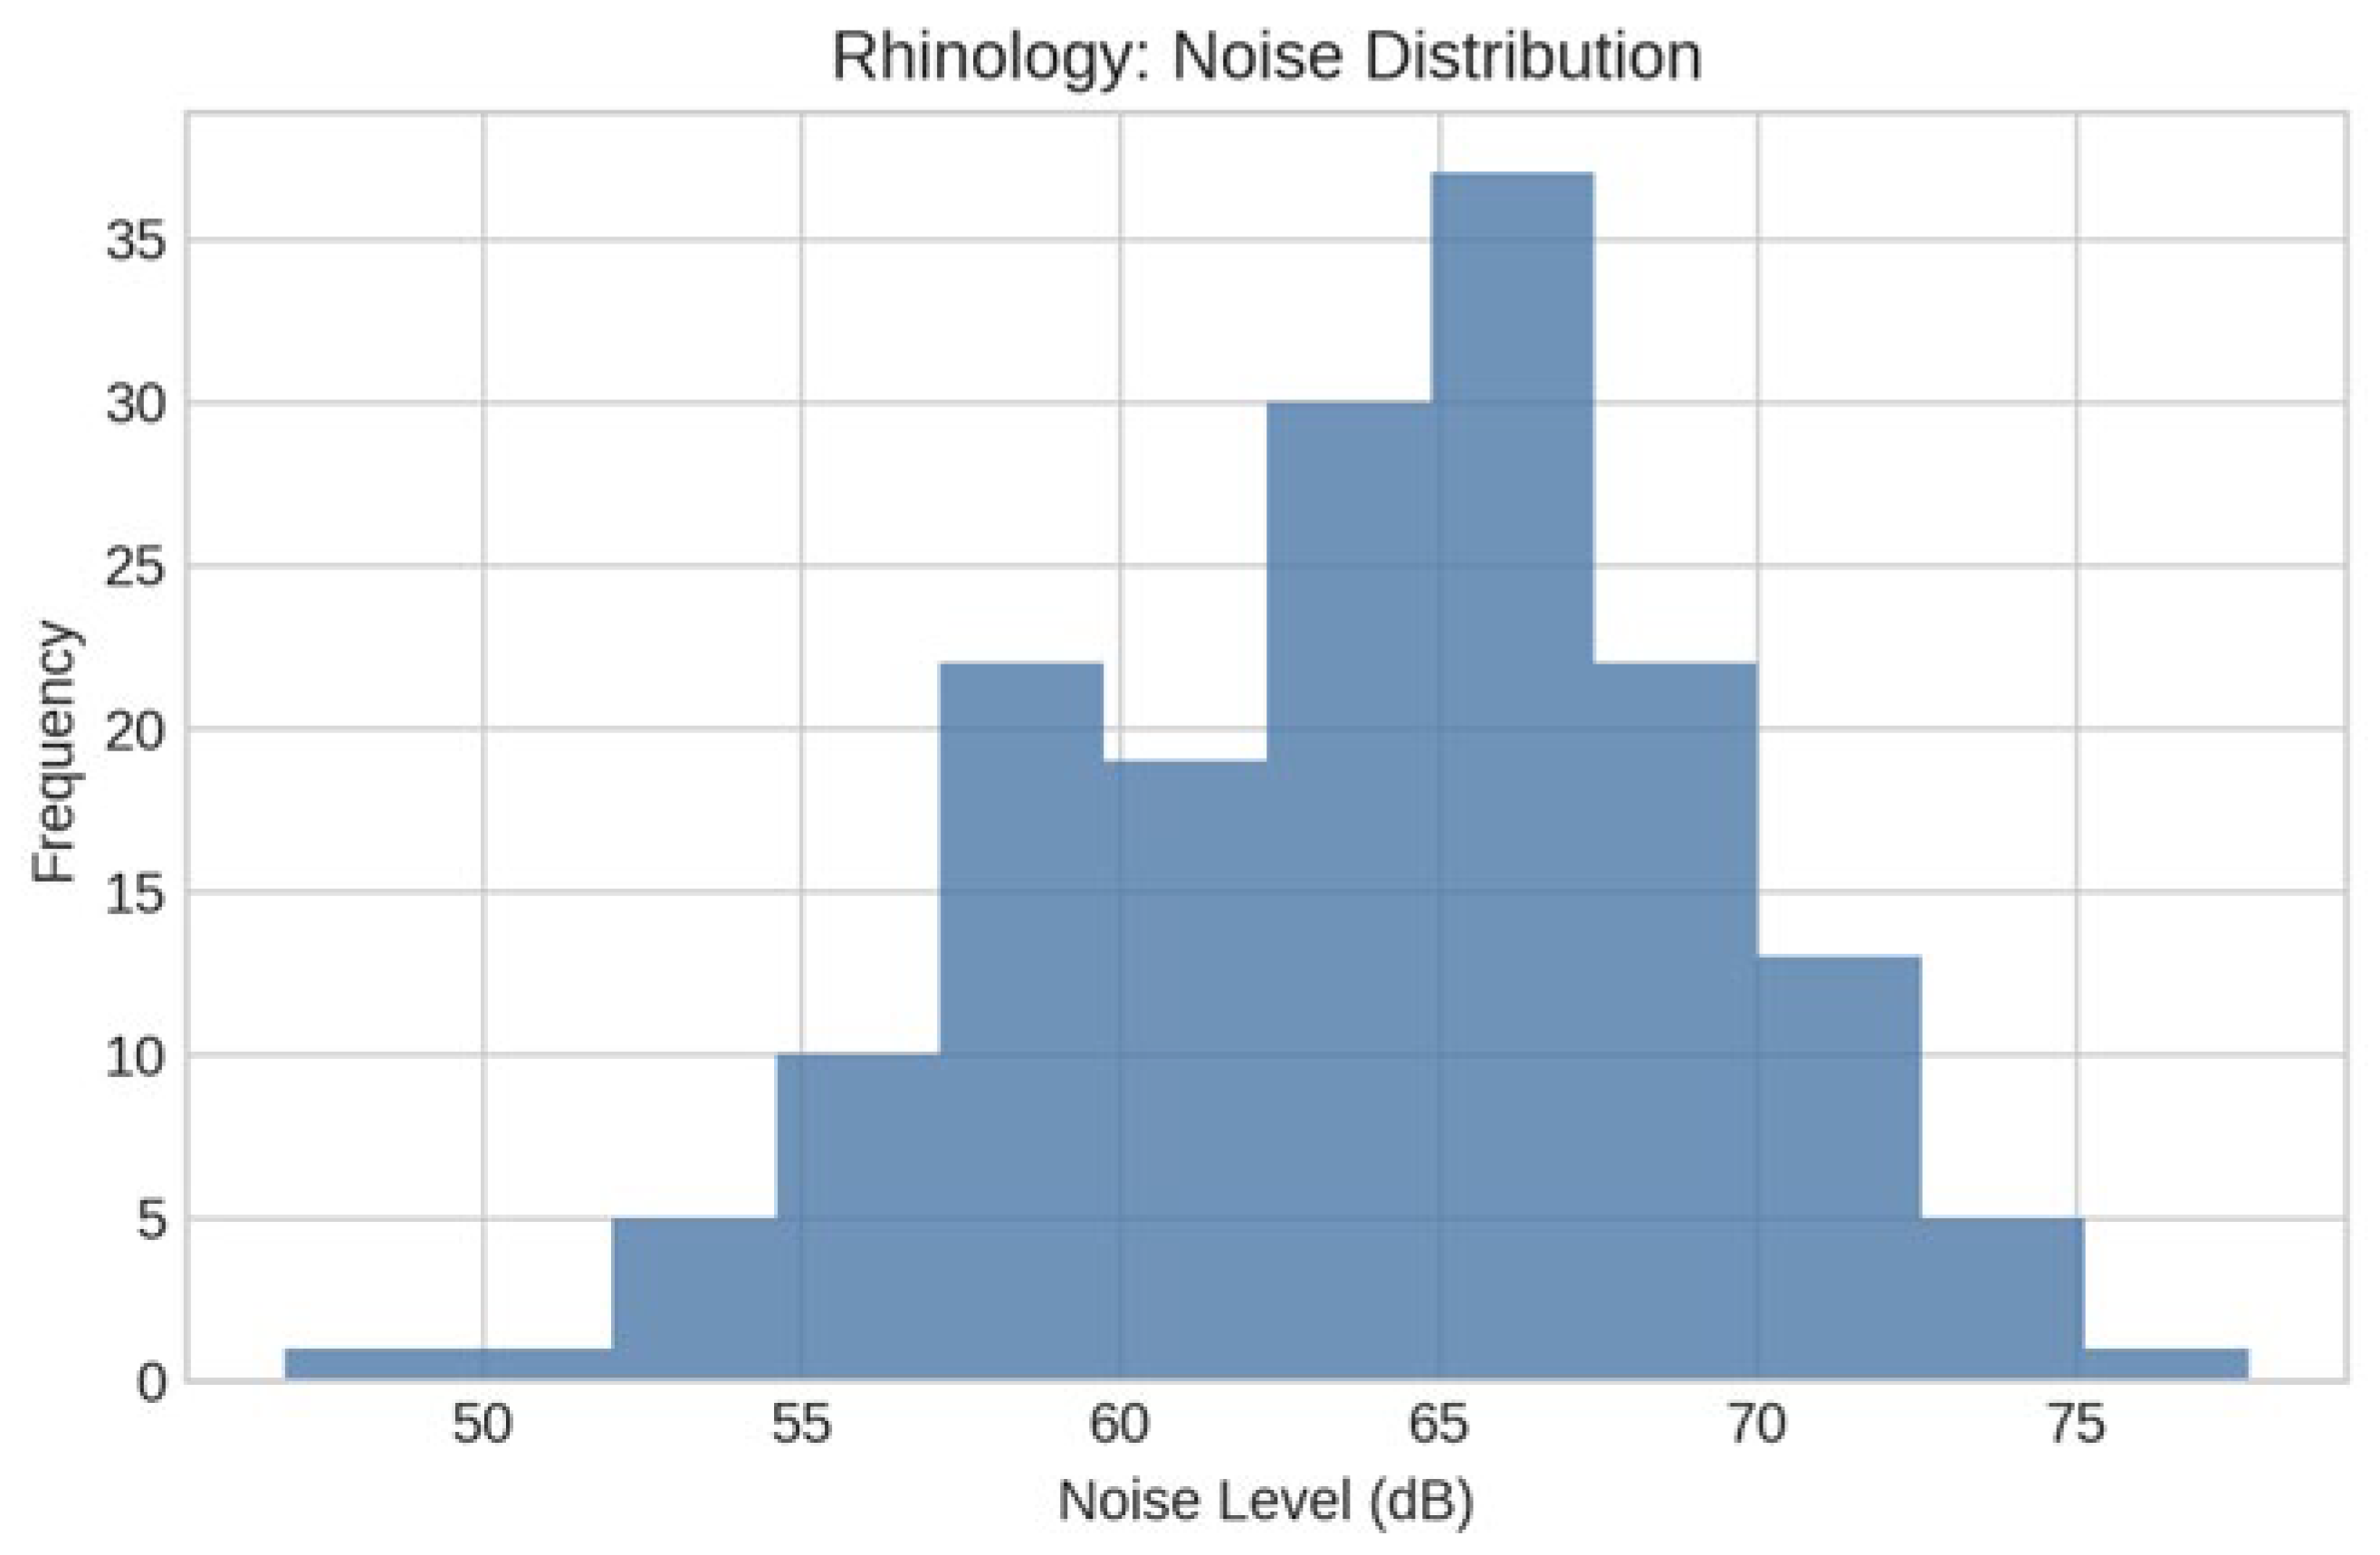
Figure 5.
Noise in Head Neck Surgery Operating room: showed non-normal distribution n=65, Mean=61.27, SD=4.66, Median=60.50, Q1=58.40, Q3=63.40, Min=53.10, Max=79.00 Shapiro-Wilk W=0.922, p=0.0006; Outliers=2.
Figure 5.
Noise in Head Neck Surgery Operating room: showed non-normal distribution n=65, Mean=61.27, SD=4.66, Median=60.50, Q1=58.40, Q3=63.40, Min=53.10, Max=79.00 Shapiro-Wilk W=0.922, p=0.0006; Outliers=2.
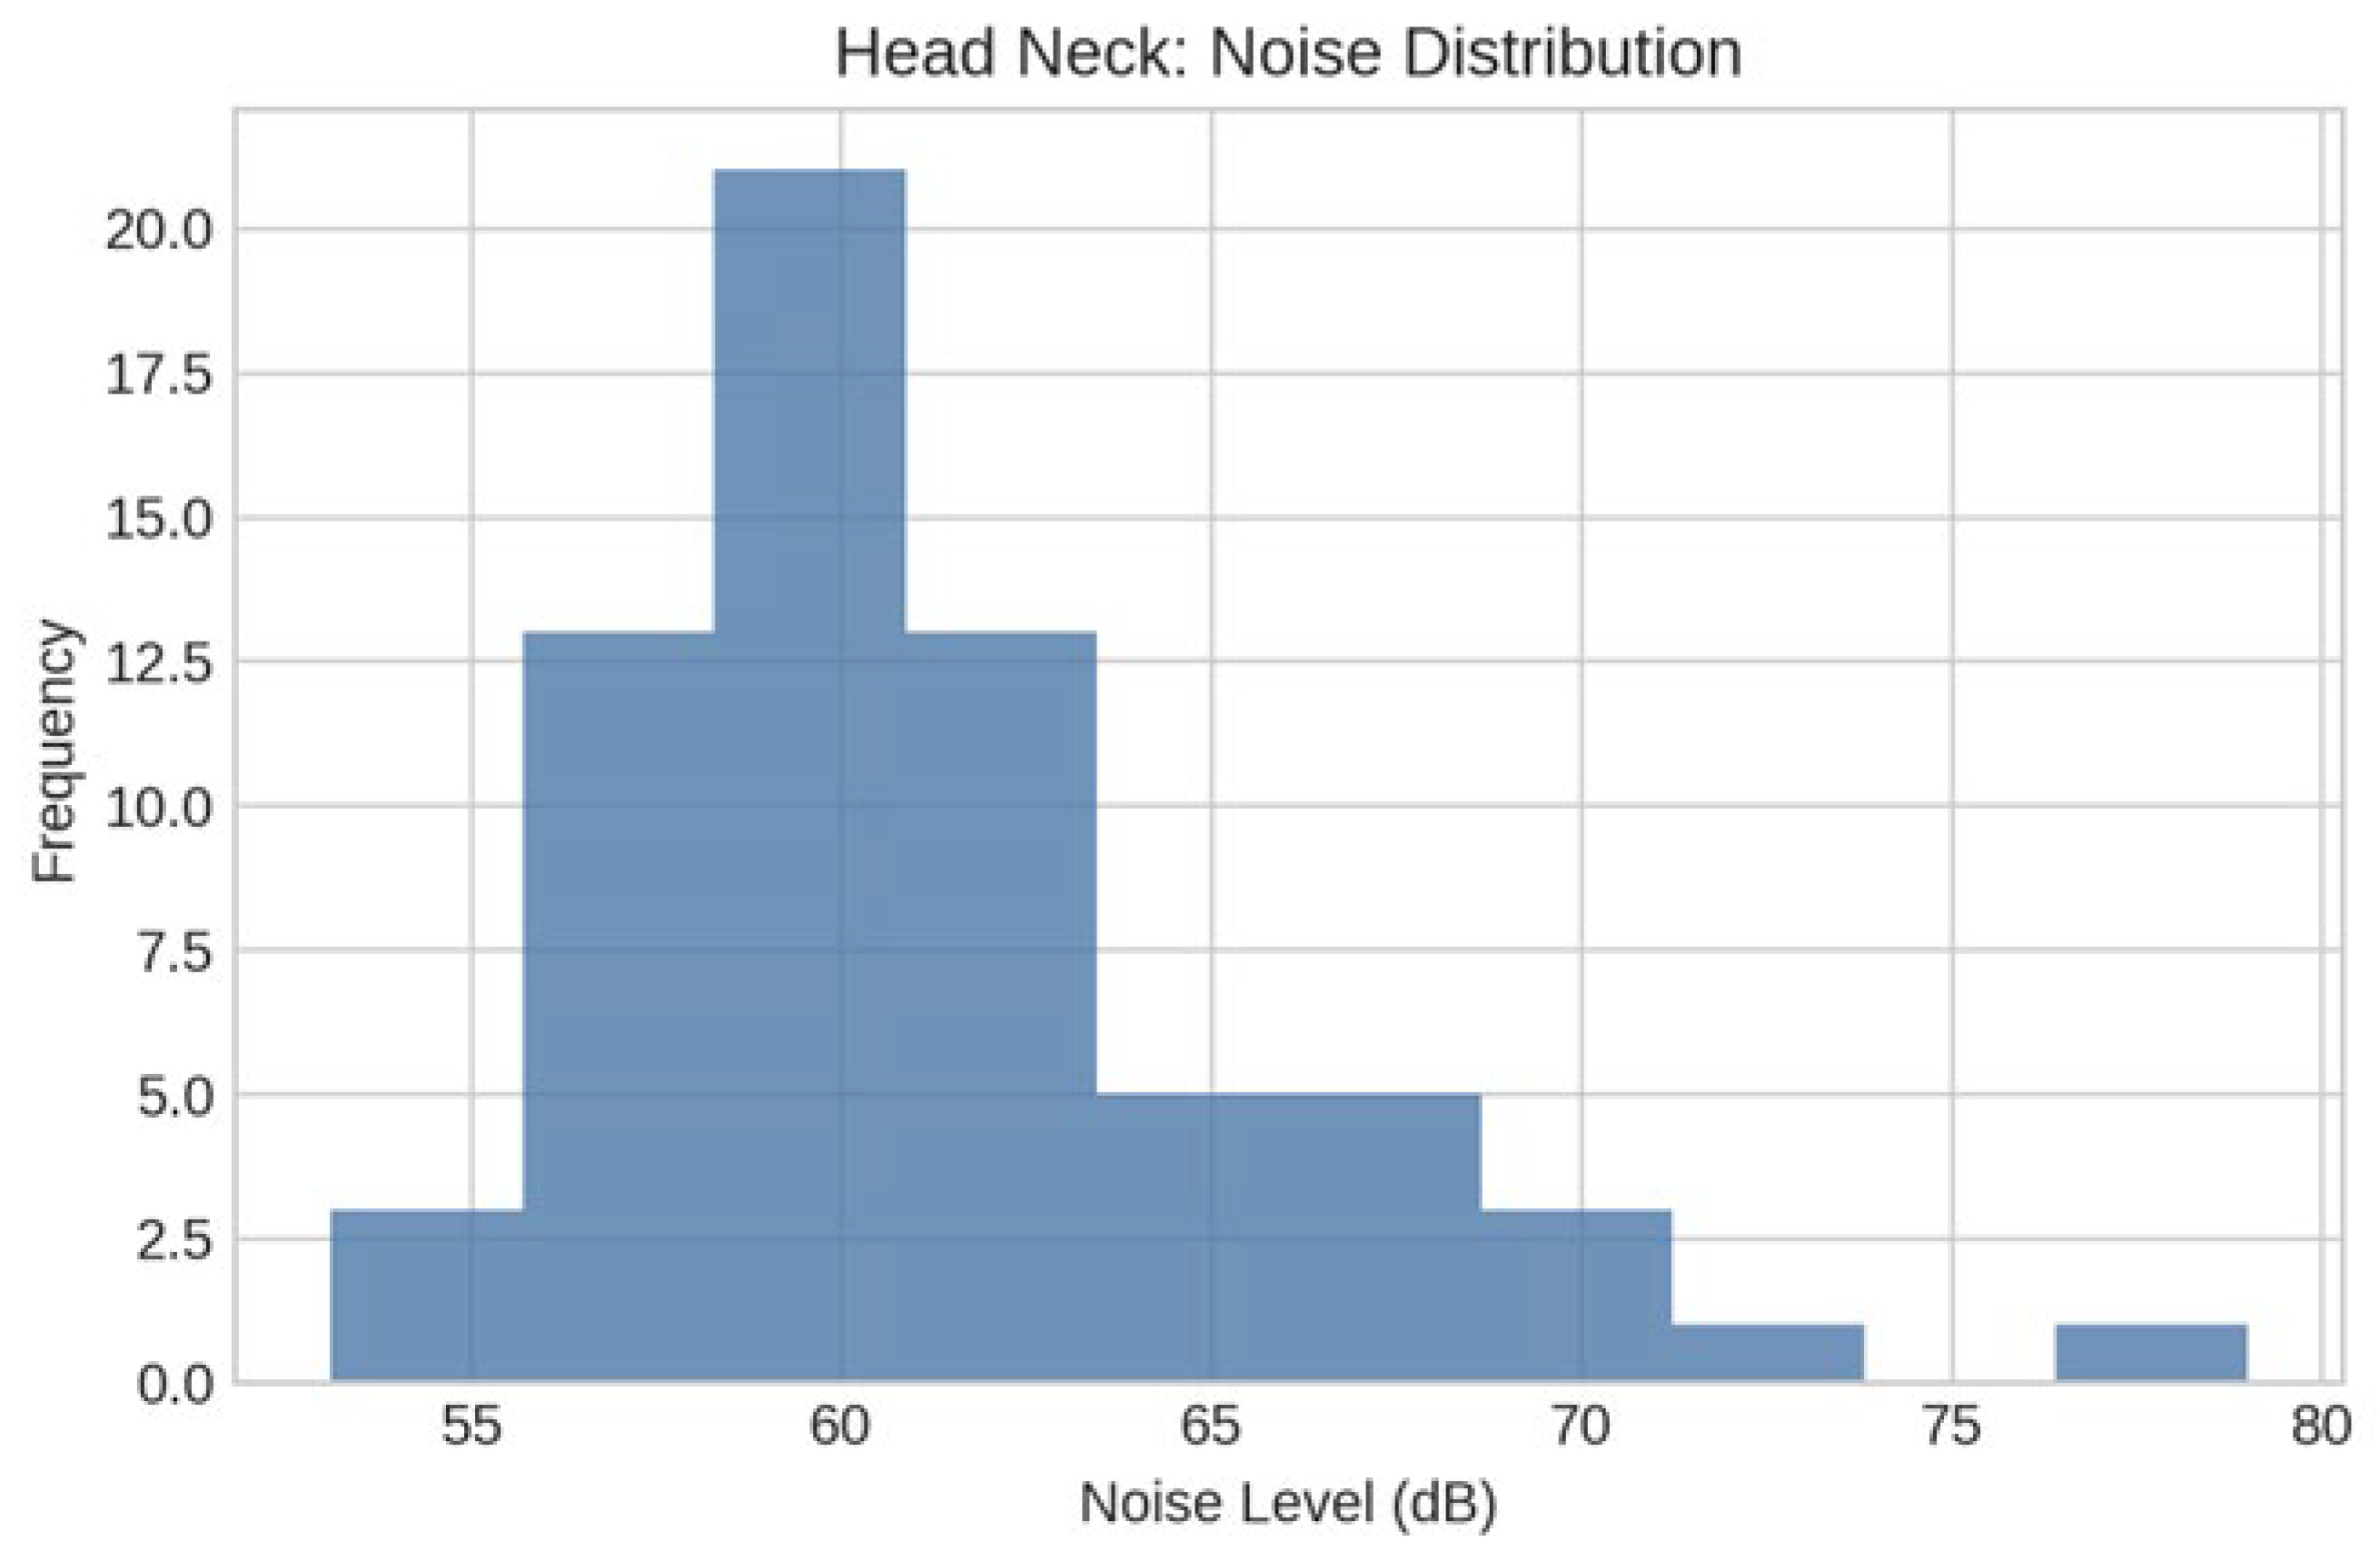
Figure 6.
Noise in Facial Plastic Operating room: n=86, Mean=61.73, SD=5.13, Median=62.00, Q1=58.25, Q3=65.30, Min=48.40, Max=77.90; Shapiro-Wilk W=0.990, p=0.7440; Outliers=1.
Figure 6.
Noise in Facial Plastic Operating room: n=86, Mean=61.73, SD=5.13, Median=62.00, Q1=58.25, Q3=65.30, Min=48.40, Max=77.90; Shapiro-Wilk W=0.990, p=0.7440; Outliers=1.
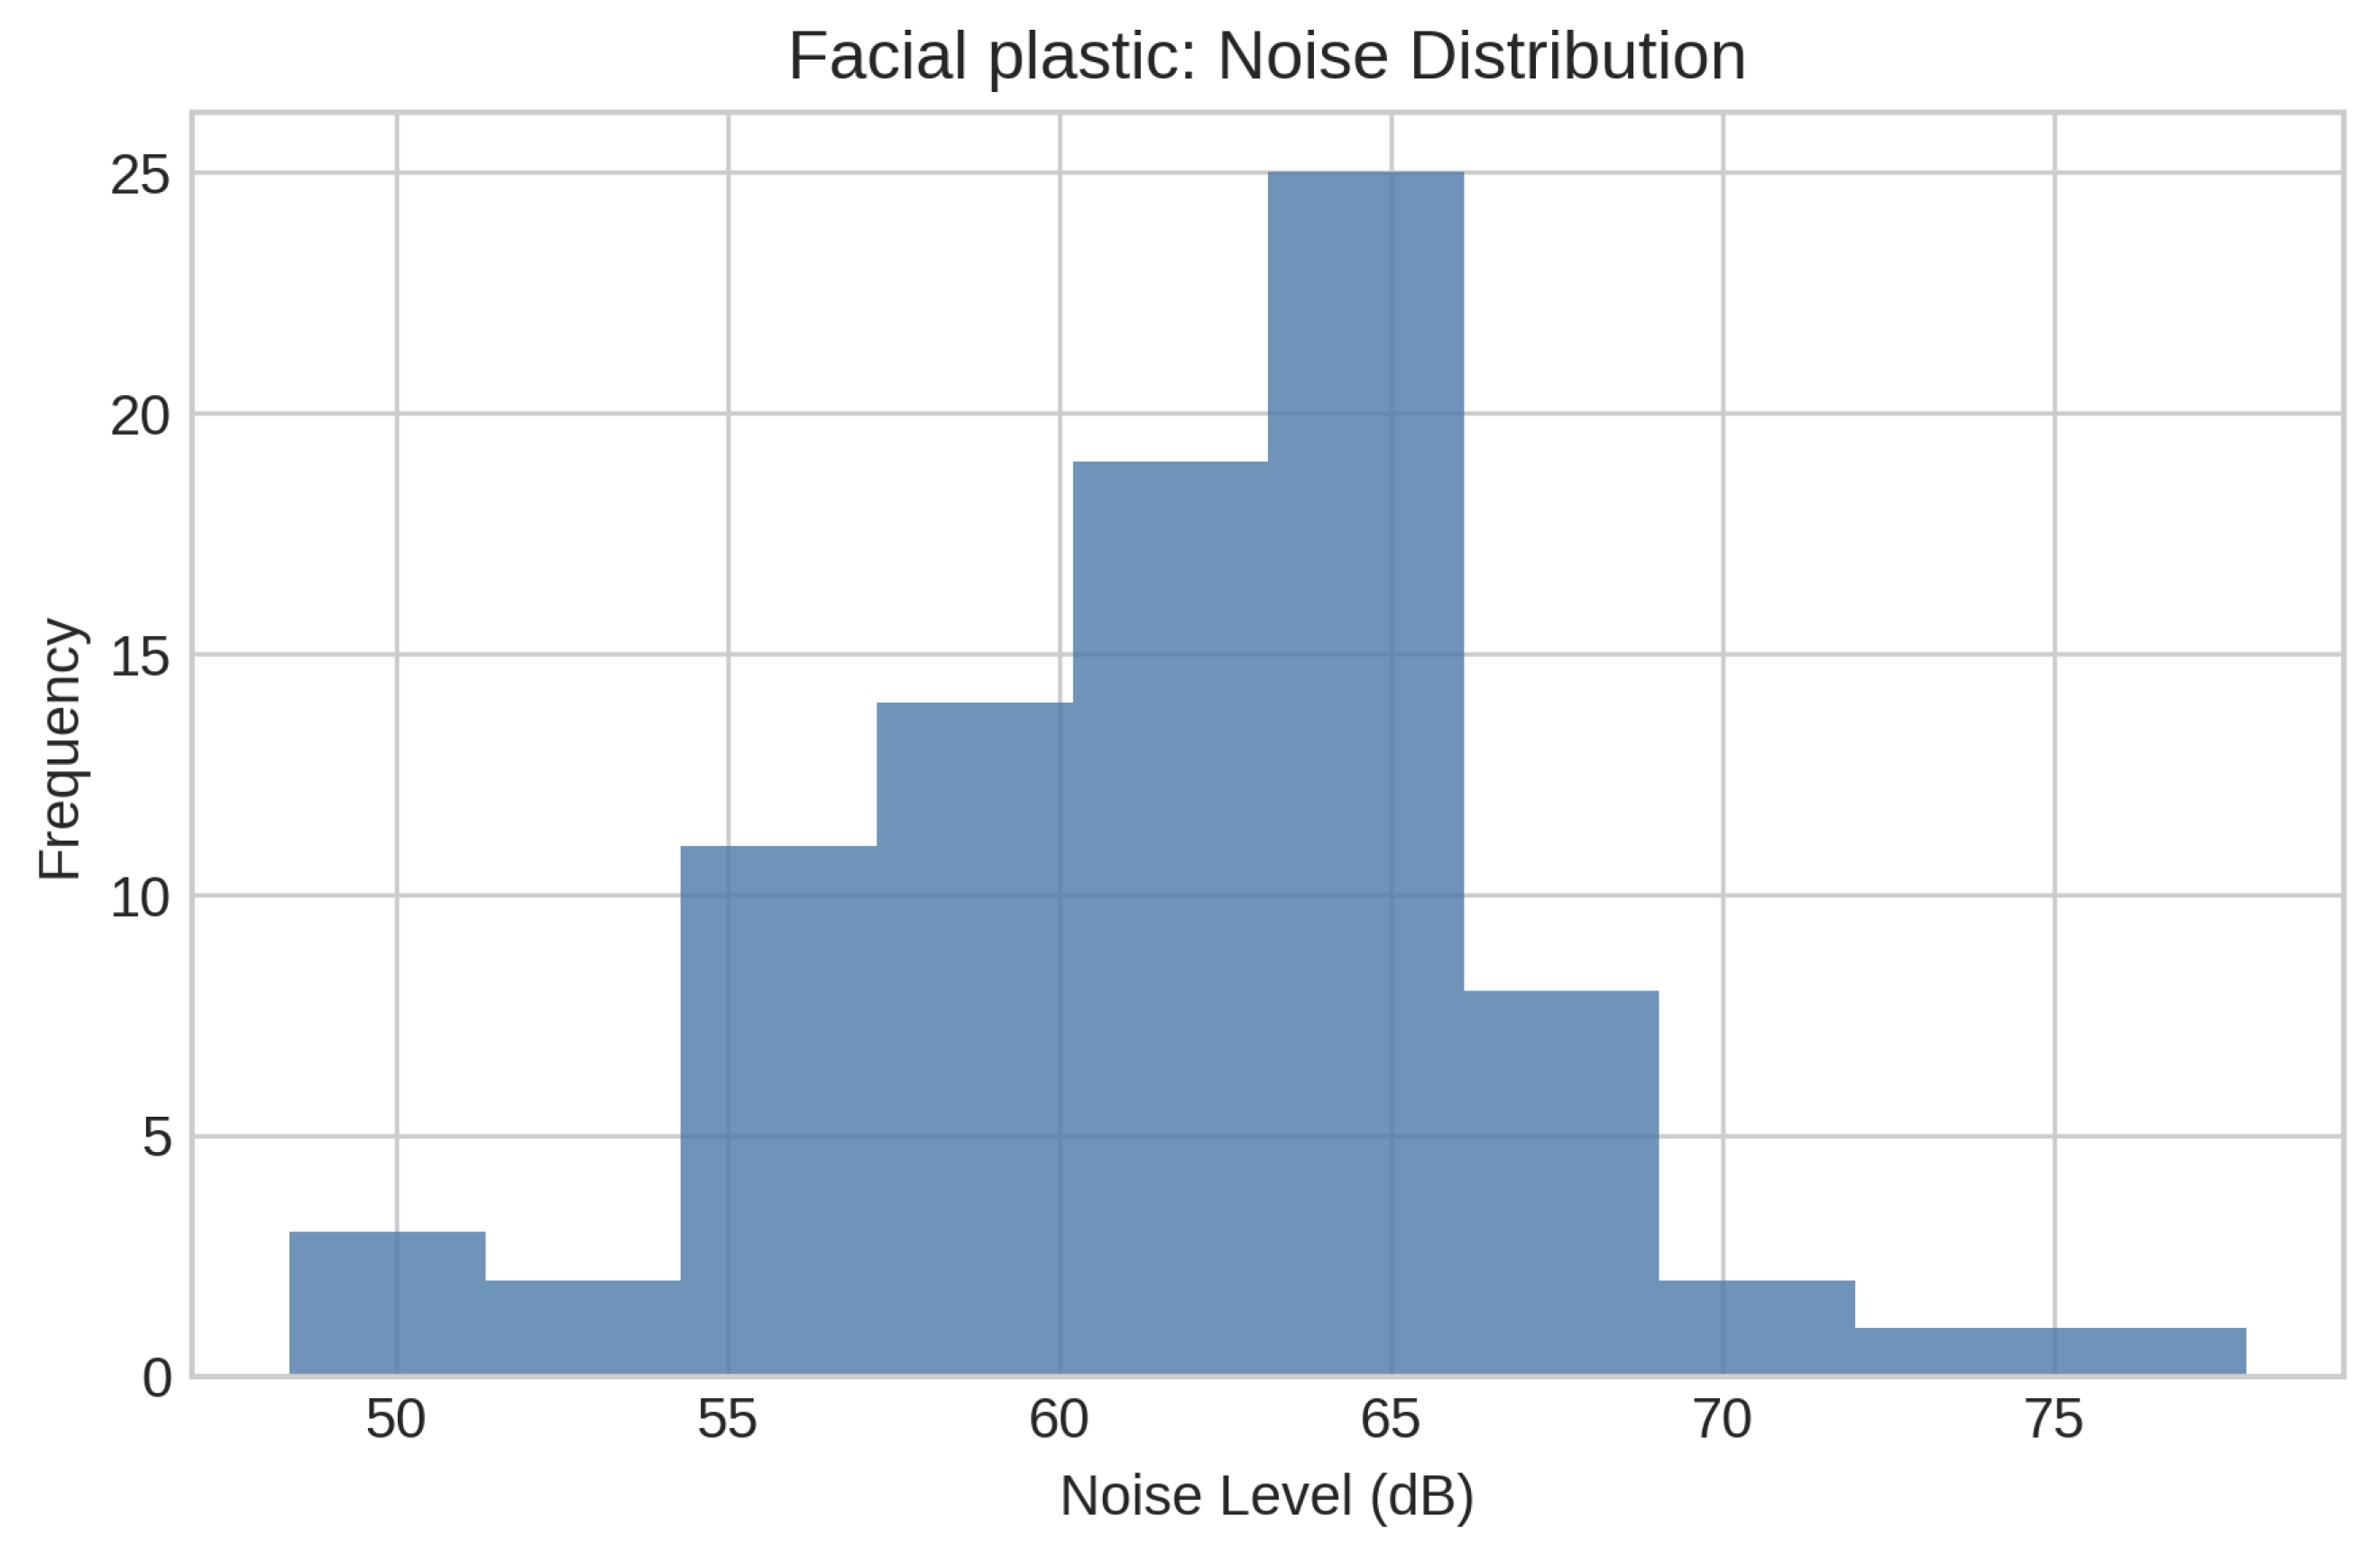

Table 1.
Overview of all operative procedures studied.
| General ENT | Facial Plastics & Reconstructive Surgery | Head-and Neck | Laryngology | Rhinology |
| Control of epistaxis, posterior | Closed reduction: nasal fracture | Bilateral parathyroid adenoma excision | Arytenoidectomy and injection | CSF rhinorrhea repair |
| DISE | Excision of scalp lesion | Excision of the lesion with tissue transfer and sentinel lymph node biopsy | Laryngocele excision | Endoscopic sinusotomy |
| Hypoglossal nerve stimulator implantation | MMF removal |
Parotidectomy | Laryngoscopy | FESS |
| Myringotomy with tympanostomy tube insertion | ORIF:facial fracture | Partial auriculectomy | Laryngoscopy and bronchoscopy | FESS with septoplasty |
| Tonsillectomy +/- adenoidectomy |
Replacement of septal button | Total thyroidectomy | Microlaryngoscopy | Removal of nasal polyps |
| Tracheostomy with placement of nasogastric feeding tube | Septorhinoplasty | WLE RMT lesion | Panendoscopy | Septoplasty with turbinate reduction |
DISE: Drug-induced sleep endoscopy; MMF, maxillomandibular fixation; ORIF, open reduction and internal fixation; WLE, wide local excision; RMT, retromolar trigone; CSF, cerebrospinal fluid; FESS, functional endoscopic sinus surgery.
Table 2.
Descriptive statistics of operating room noise levels across the five otolaryngology subspecialties.
Table 2.
Descriptive statistics of operating room noise levels across the five otolaryngology subspecialties.
| Subspecialty | N | n | Minimum dBA | Maximum dBA | Mean dBA | SD | CI | P value |
|
General ENT |
13 | 100 | 52.10 | 76.90 | 63.08 | 4.23 | 0.1504 | |
|
Facial Plastics & Reconstructive Surgery |
13 | 86 | 48.40 | 77.90 | 61.73 | 5.13 | 60.6 - 62.8 | 0.7440 |
|
Head and Neck |
8 | 65 | 52.10 | 79.0 | 61.27 | 4.23 | 60.1 - 62.4 | 0.0006 |
|
Laryngology |
13 | 58 | 53.60 | 75.40 | 62.98 | 4.65 | 61.8 - 64.2 | 0.2564 |
| Rhinology | 13 | 166 | 46.90 | 77.70 | 63.92 | 4.9 | 63.3 - 64.9 | 0.2236 |
Disclaimer/Publisher’s Note: The statements, opinions and data contained in all publications are solely those of the individual author(s) and contributor(s) and not of MDPI and/or the editor(s). MDPI and/or the editor(s) disclaim responsibility for any injury to people or property resulting from any ideas, methods, instructions or products referred to in the content. |
© 2025 by the authors. Licensee MDPI, Basel, Switzerland. This article is an open access article distributed under the terms and conditions of the Creative Commons Attribution (CC BY) license (http://creativecommons.org/licenses/by/4.0/).
Copyright: This open access article is published under a Creative Commons CC BY 4.0 license, which permit the free download, distribution, and reuse, provided that the author and preprint are cited in any reuse.


