Submitted:
08 December 2025
Posted:
09 December 2025
You are already at the latest version
Abstract
Aging and Alzheimer’s disease are associated with profound changes in glial cell morphology and signaling. This study investigates the three-dimensional morphology of microglia and the intracellular localization of phosphorylated SMAD proteins as downstream effectors of TGF-β signaling in the APP/PS1 transgenic mouse model of Alzheimer’s disease. Using confocal microscopy and the Simple Neurite Tracer software, we reconstructed and quantitatively analyzed glial cell morphology in aged wild-type and APP/PS1 mice. Immunofluorescence staining revealed altered pSMAD2 and pSMAD1/5/8 distribution in microglia, suggesting impaired canonical TGF-β and BMP signaling. Our findings indicate a disturbed glial morphology and dysfunctional TGF-β signaling cascade in the APP/PS1 model, underlining their potential role in Alzheimer’s disease pathogenesis.
Keywords:
1. Introduction
2. Materials and Methods
2.1. Materials
2.1.1. Anaesthetics and Chemicals
2.1.2. Antibodies

| Antibody | Clonality | Dilution | Species | Producer | Catalog No. |
| β-Amyloid | mono | 1:1000 | Mouse | BioLegend | 803001 |
| Iba-1 | poly | 1:500 | Guinea pig | Synaptic Systems | 234004 |
| Iba-1 | poly | 1:500 | Rabbit | Wako | 019-19741 |
| TGF-β1 | poly | 1:50 | Rabbit | Santa Cruz | sc-146 |
| pSMAD2 | poly | 1:200 | Rabbit | Invitrogen | 44-244C |
| pSMAD1/5/8 | mono | 1:800 | Rabbit | Cell Signaling | 13820 |
| Target | Species | Dilution | Conjugate | Producer | Catalog No. |
| Mouse | Goat | 1:500 | Alexa Fluor™ 488 | Abcam | ab150113 |
| Guinea pig | Goat | 1:500 | Alexa Fluor™ 488 | Abcam | ab150185 |
| Rabbit | Goat | 1:500 | Alexa Fluor™ 594 | Abcam | ab150080 |
| Rabbit | Goat | 2 gtt/ml | Alexa Fluor™ 594 | Invitrogen | R37117 |
| Mouse | Goat | 1:200 | Alexa Fluor™ 594 | Abcam | ab150116 |
2.2. Animals
2.3. Tissue Preparation, Immunohistochemistry and Image Acquisition
2.4. Data Analysis
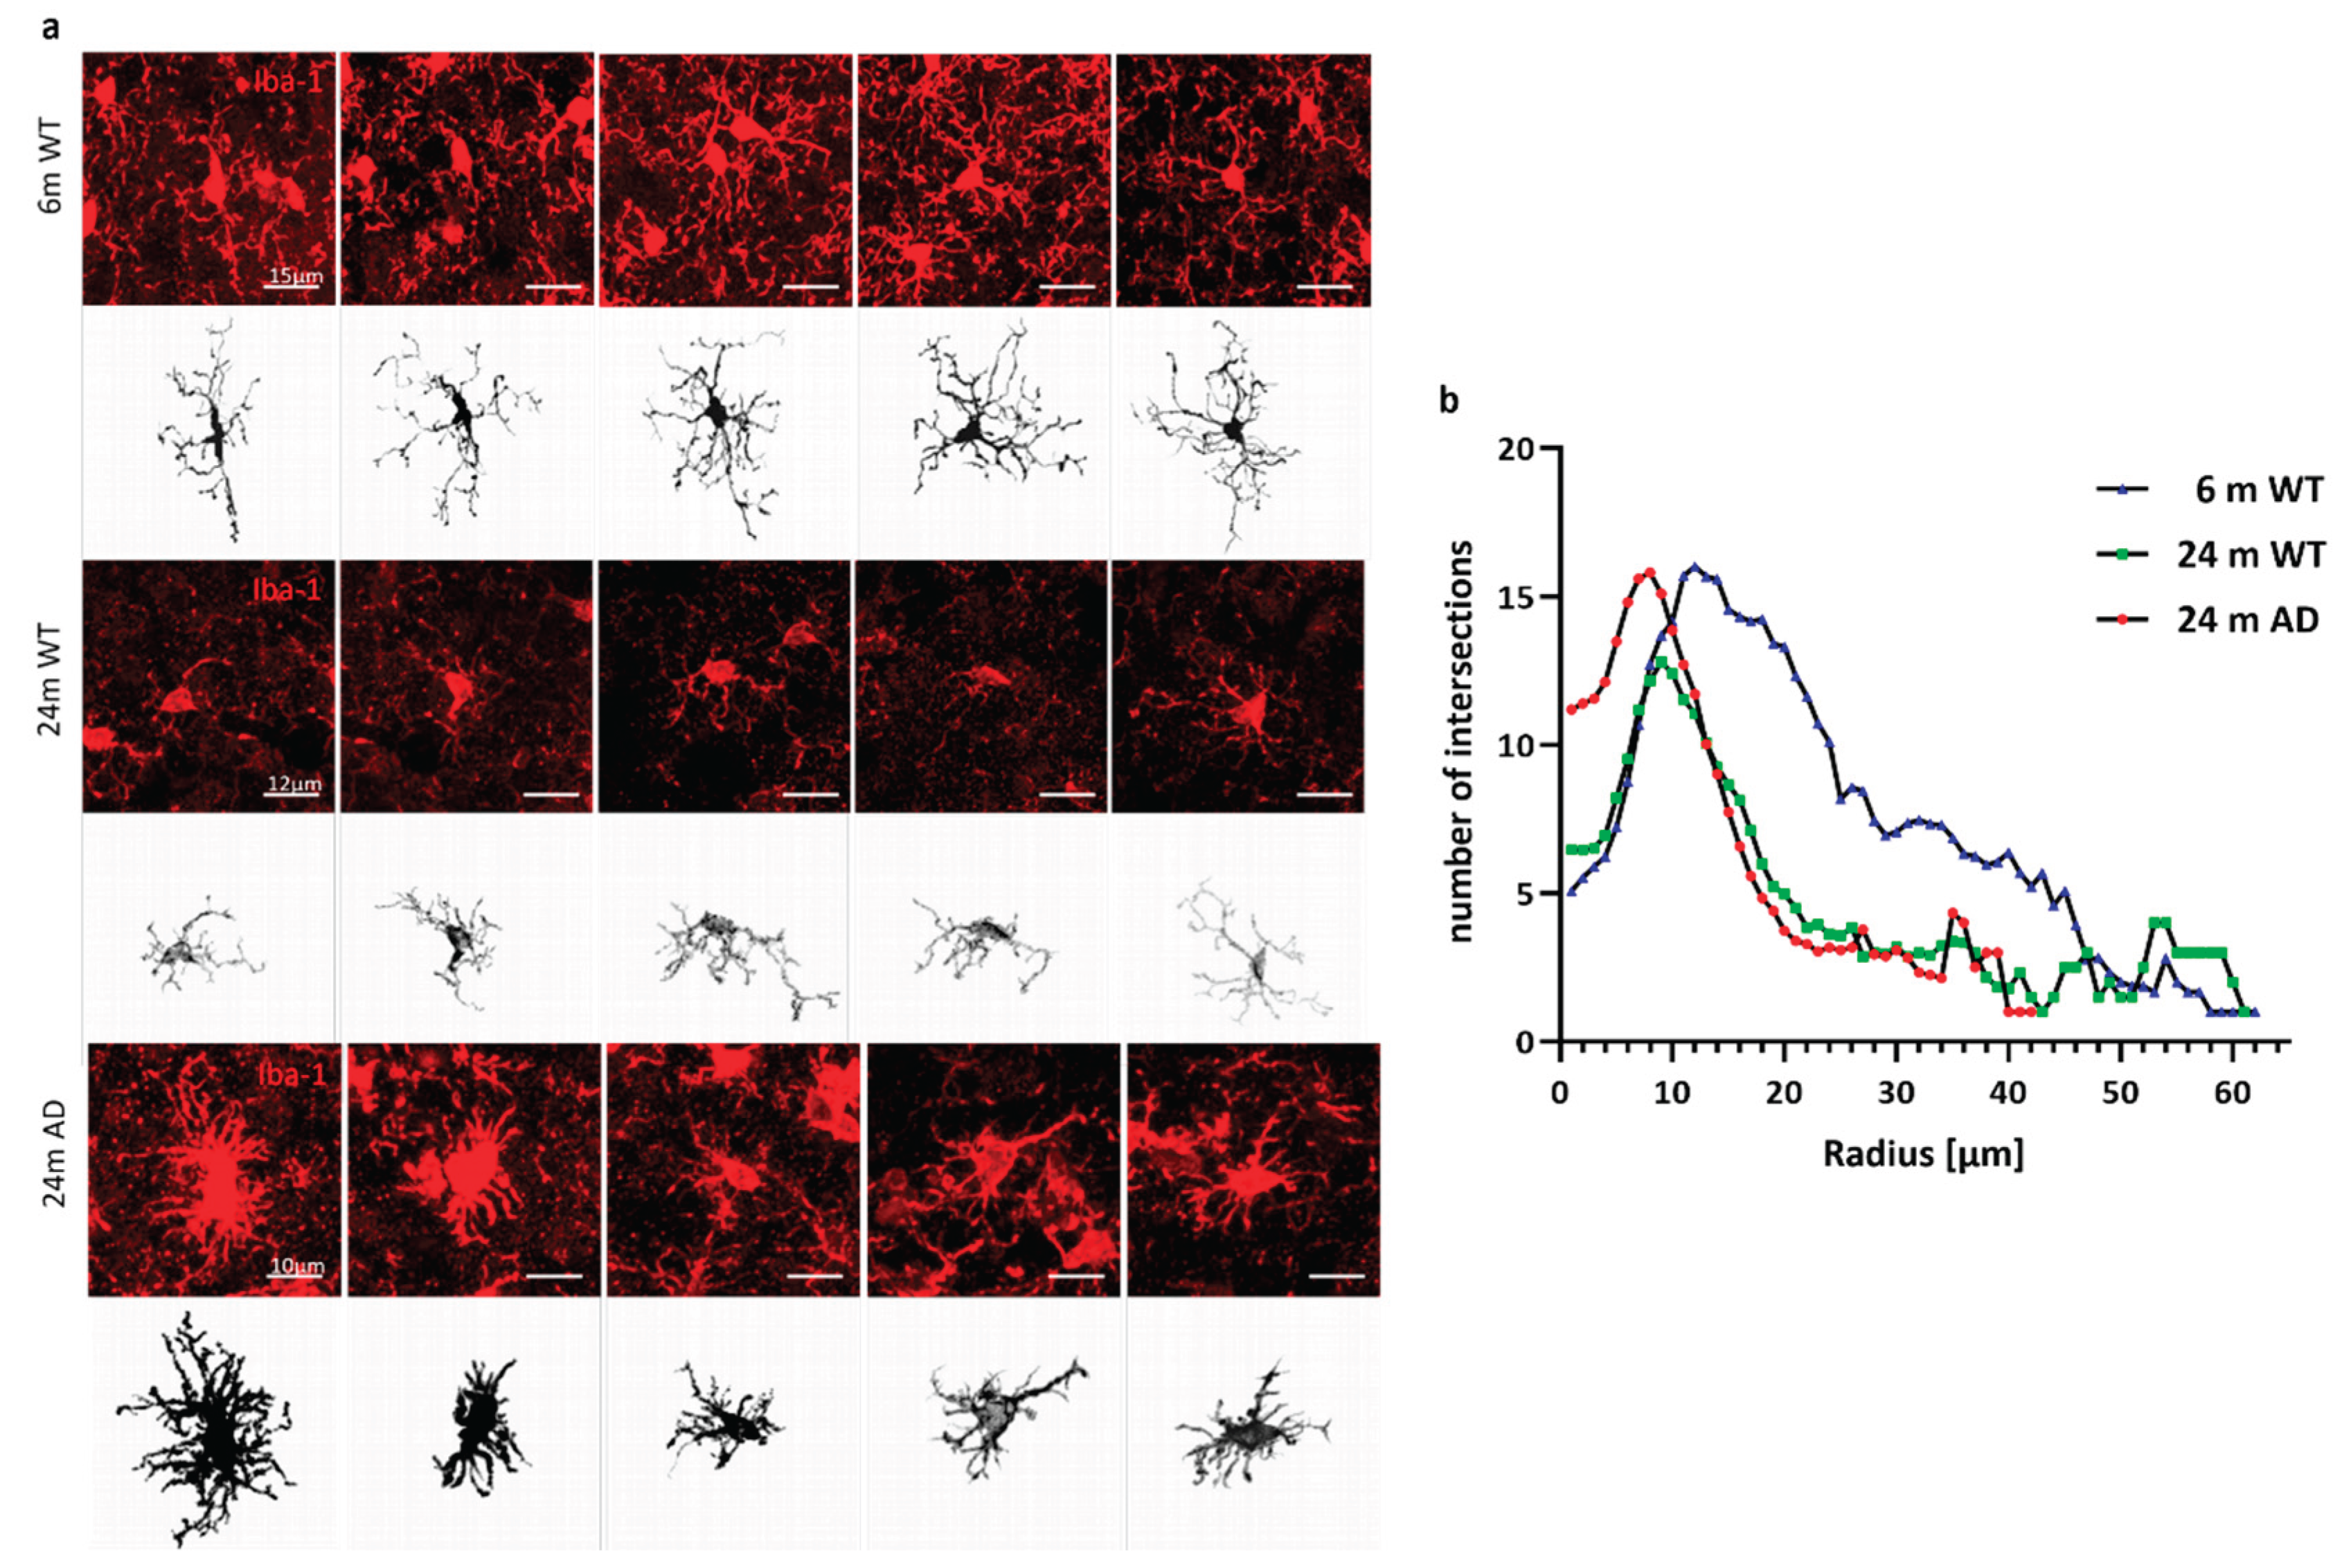
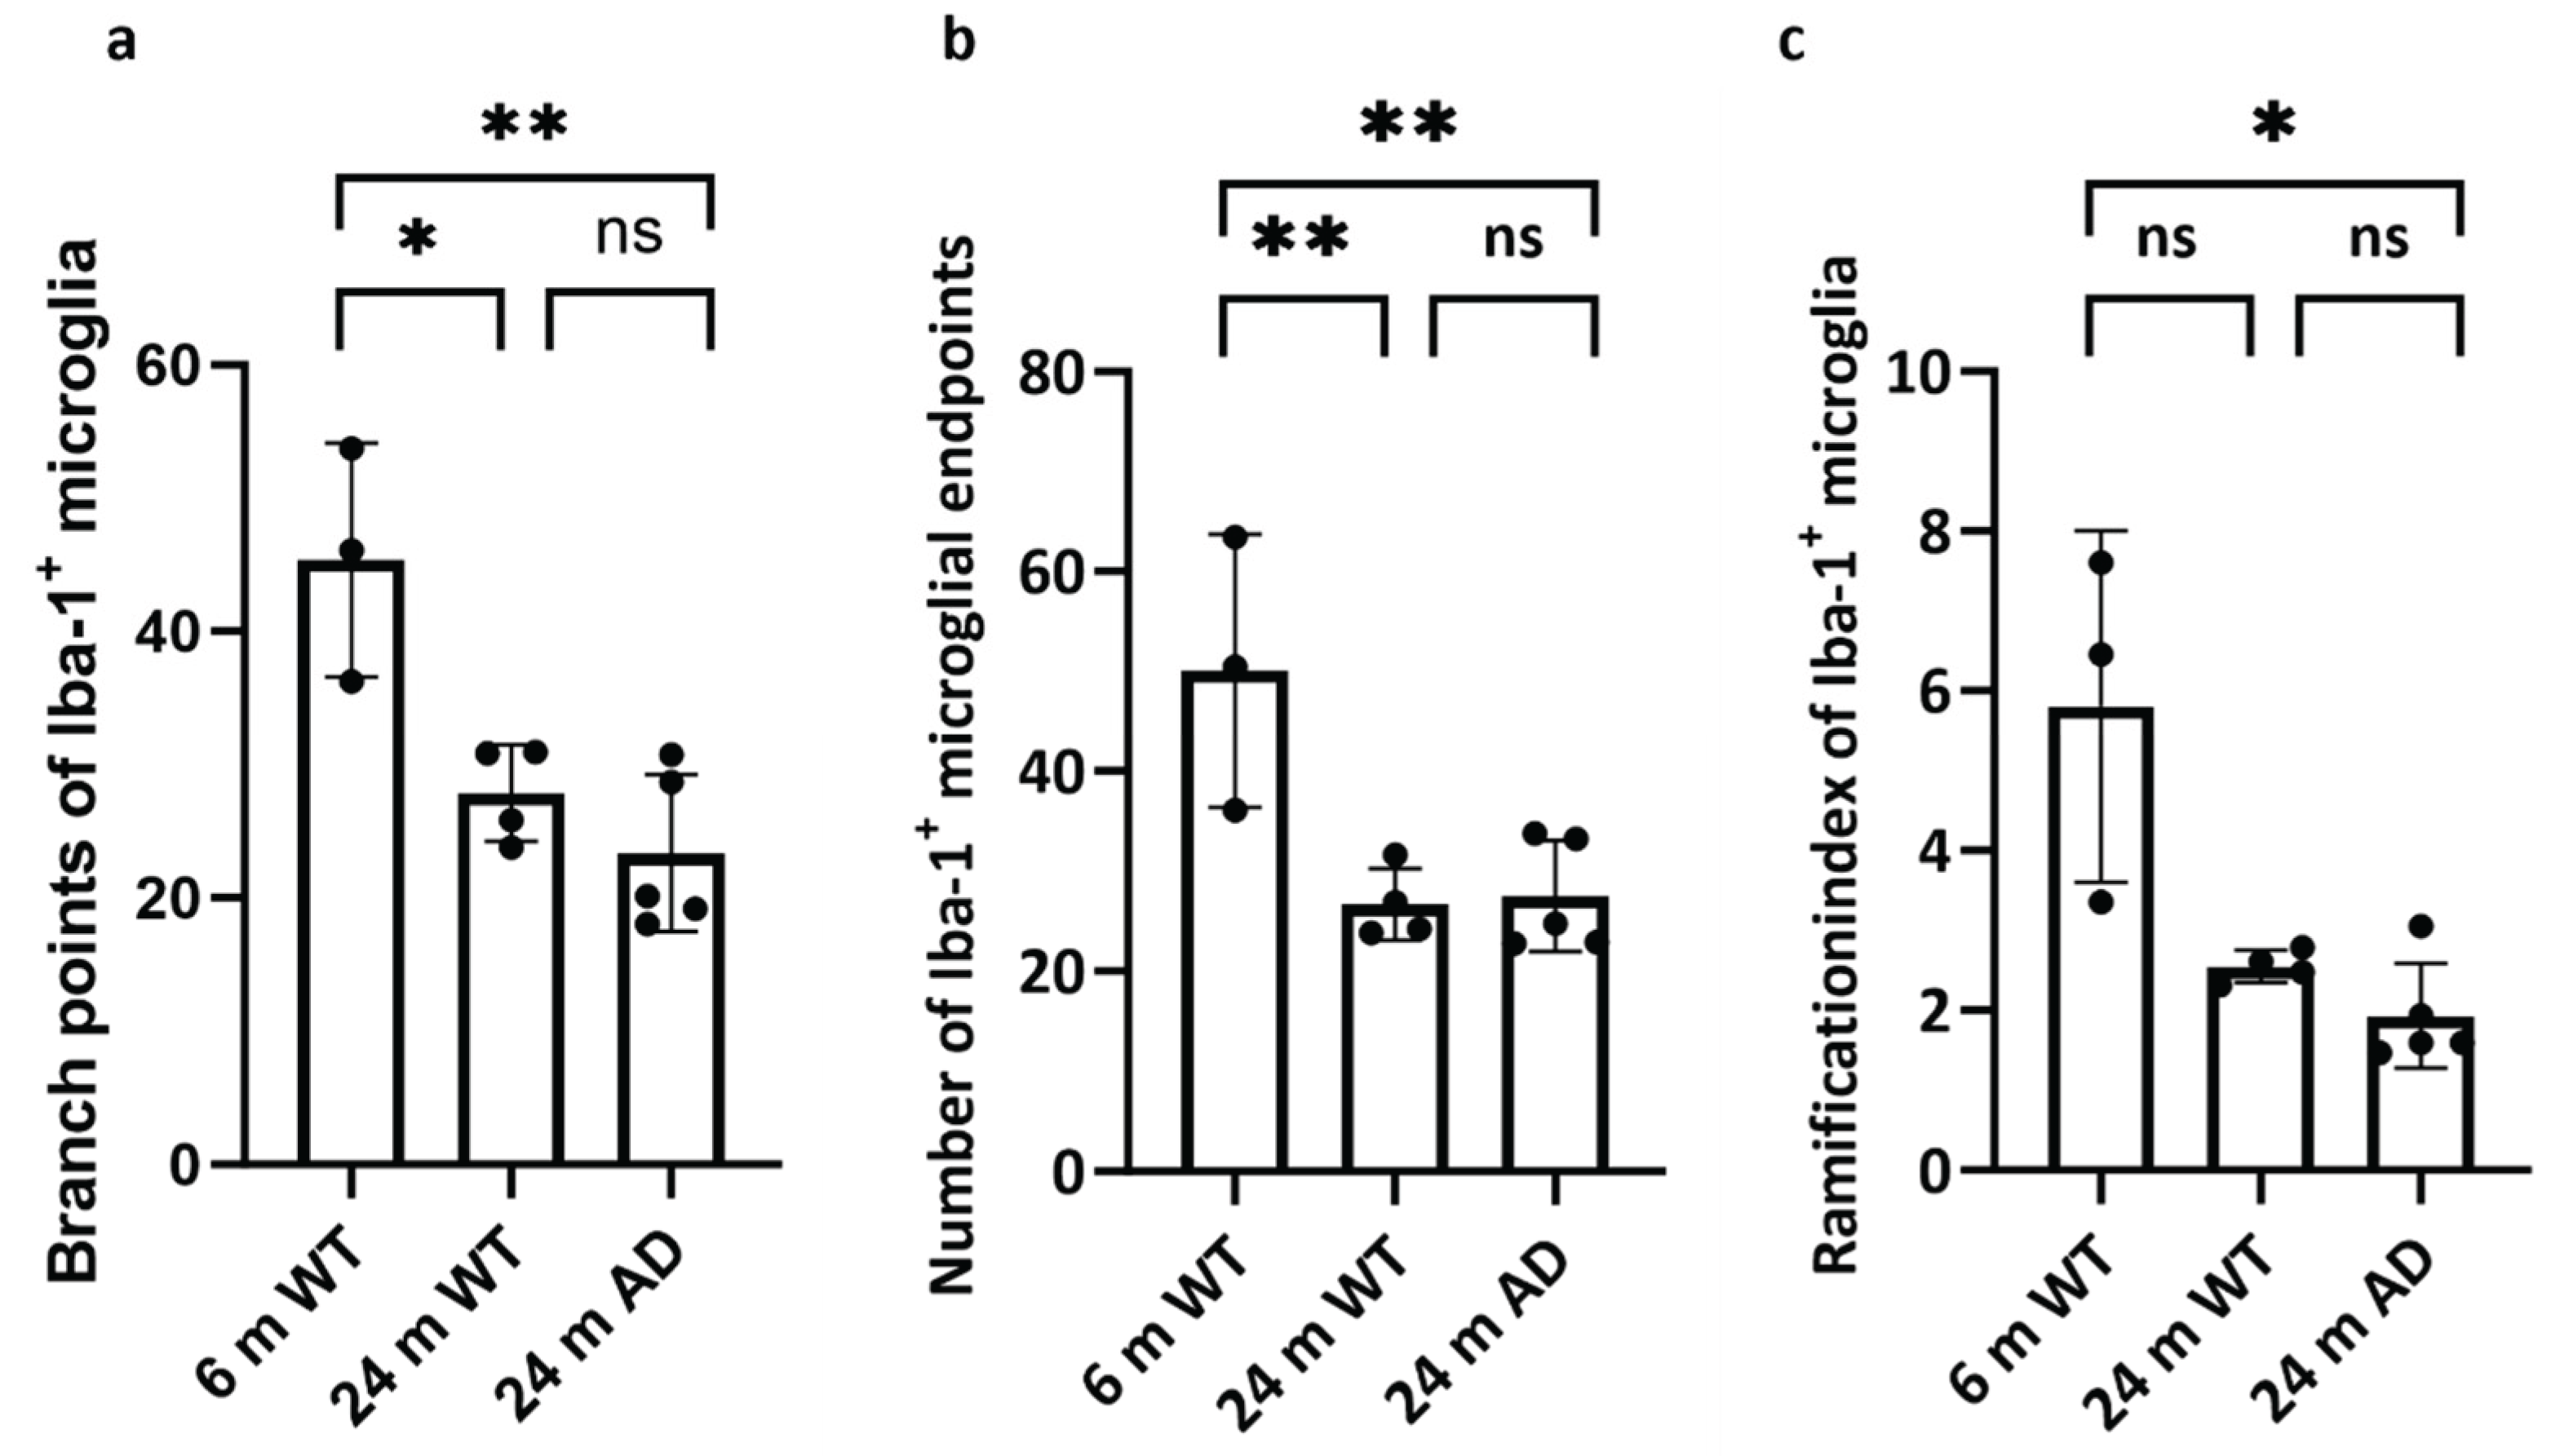
2.4.1. Quantification and Cell Morphology
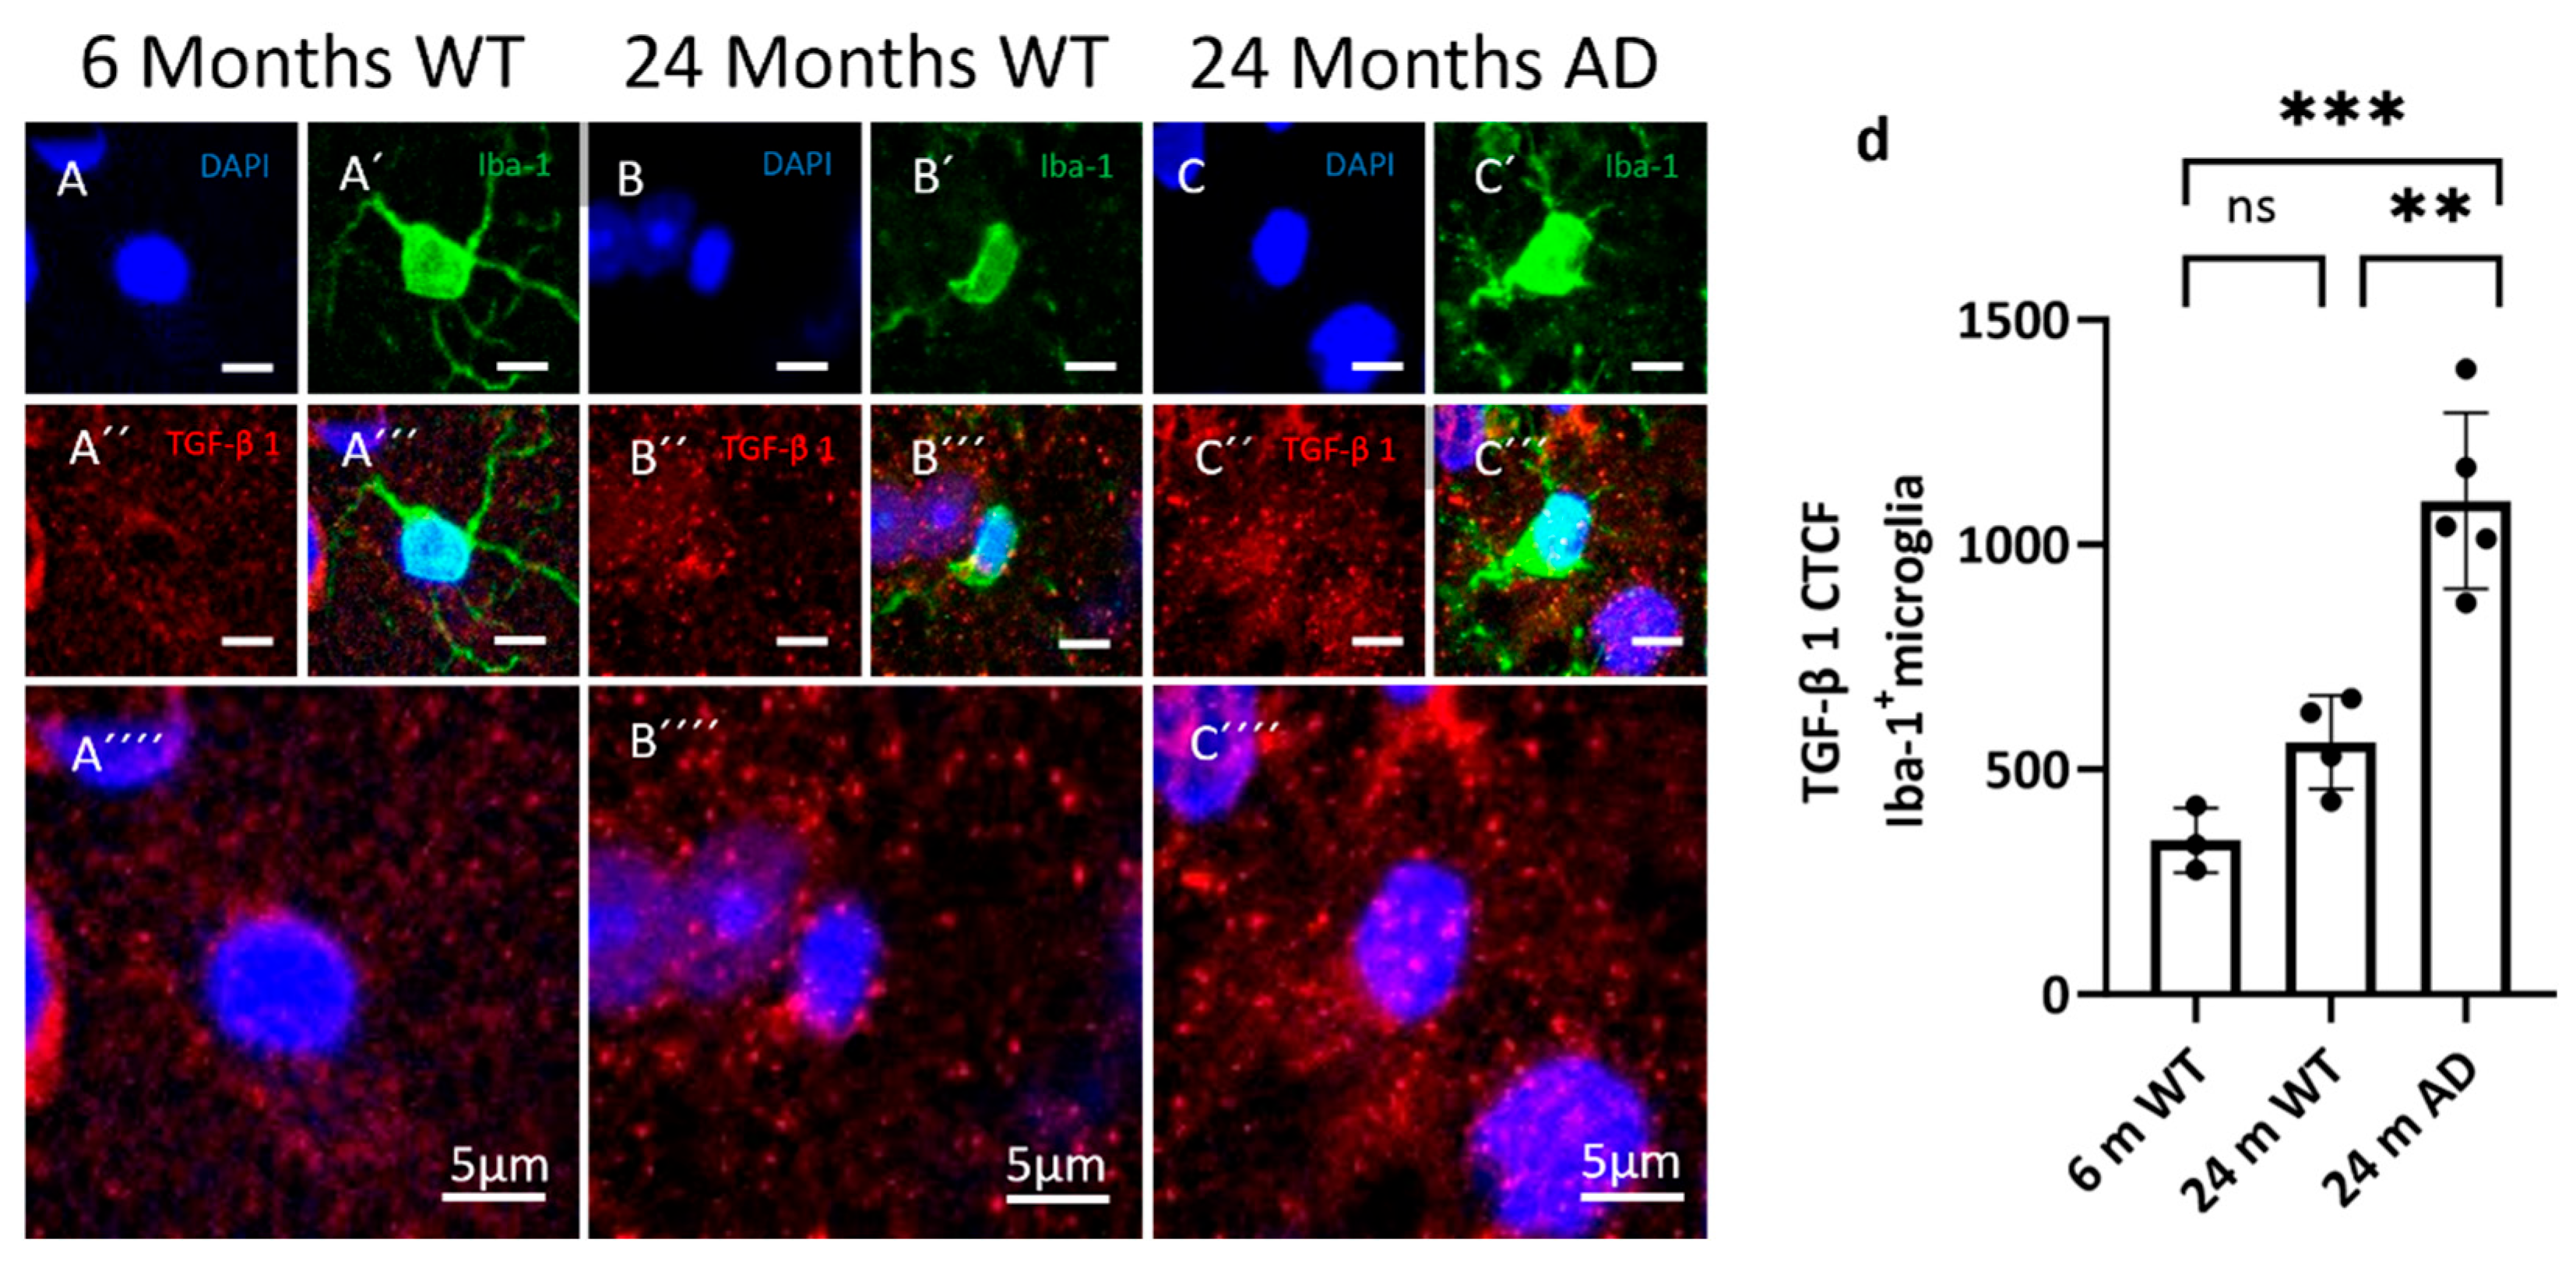
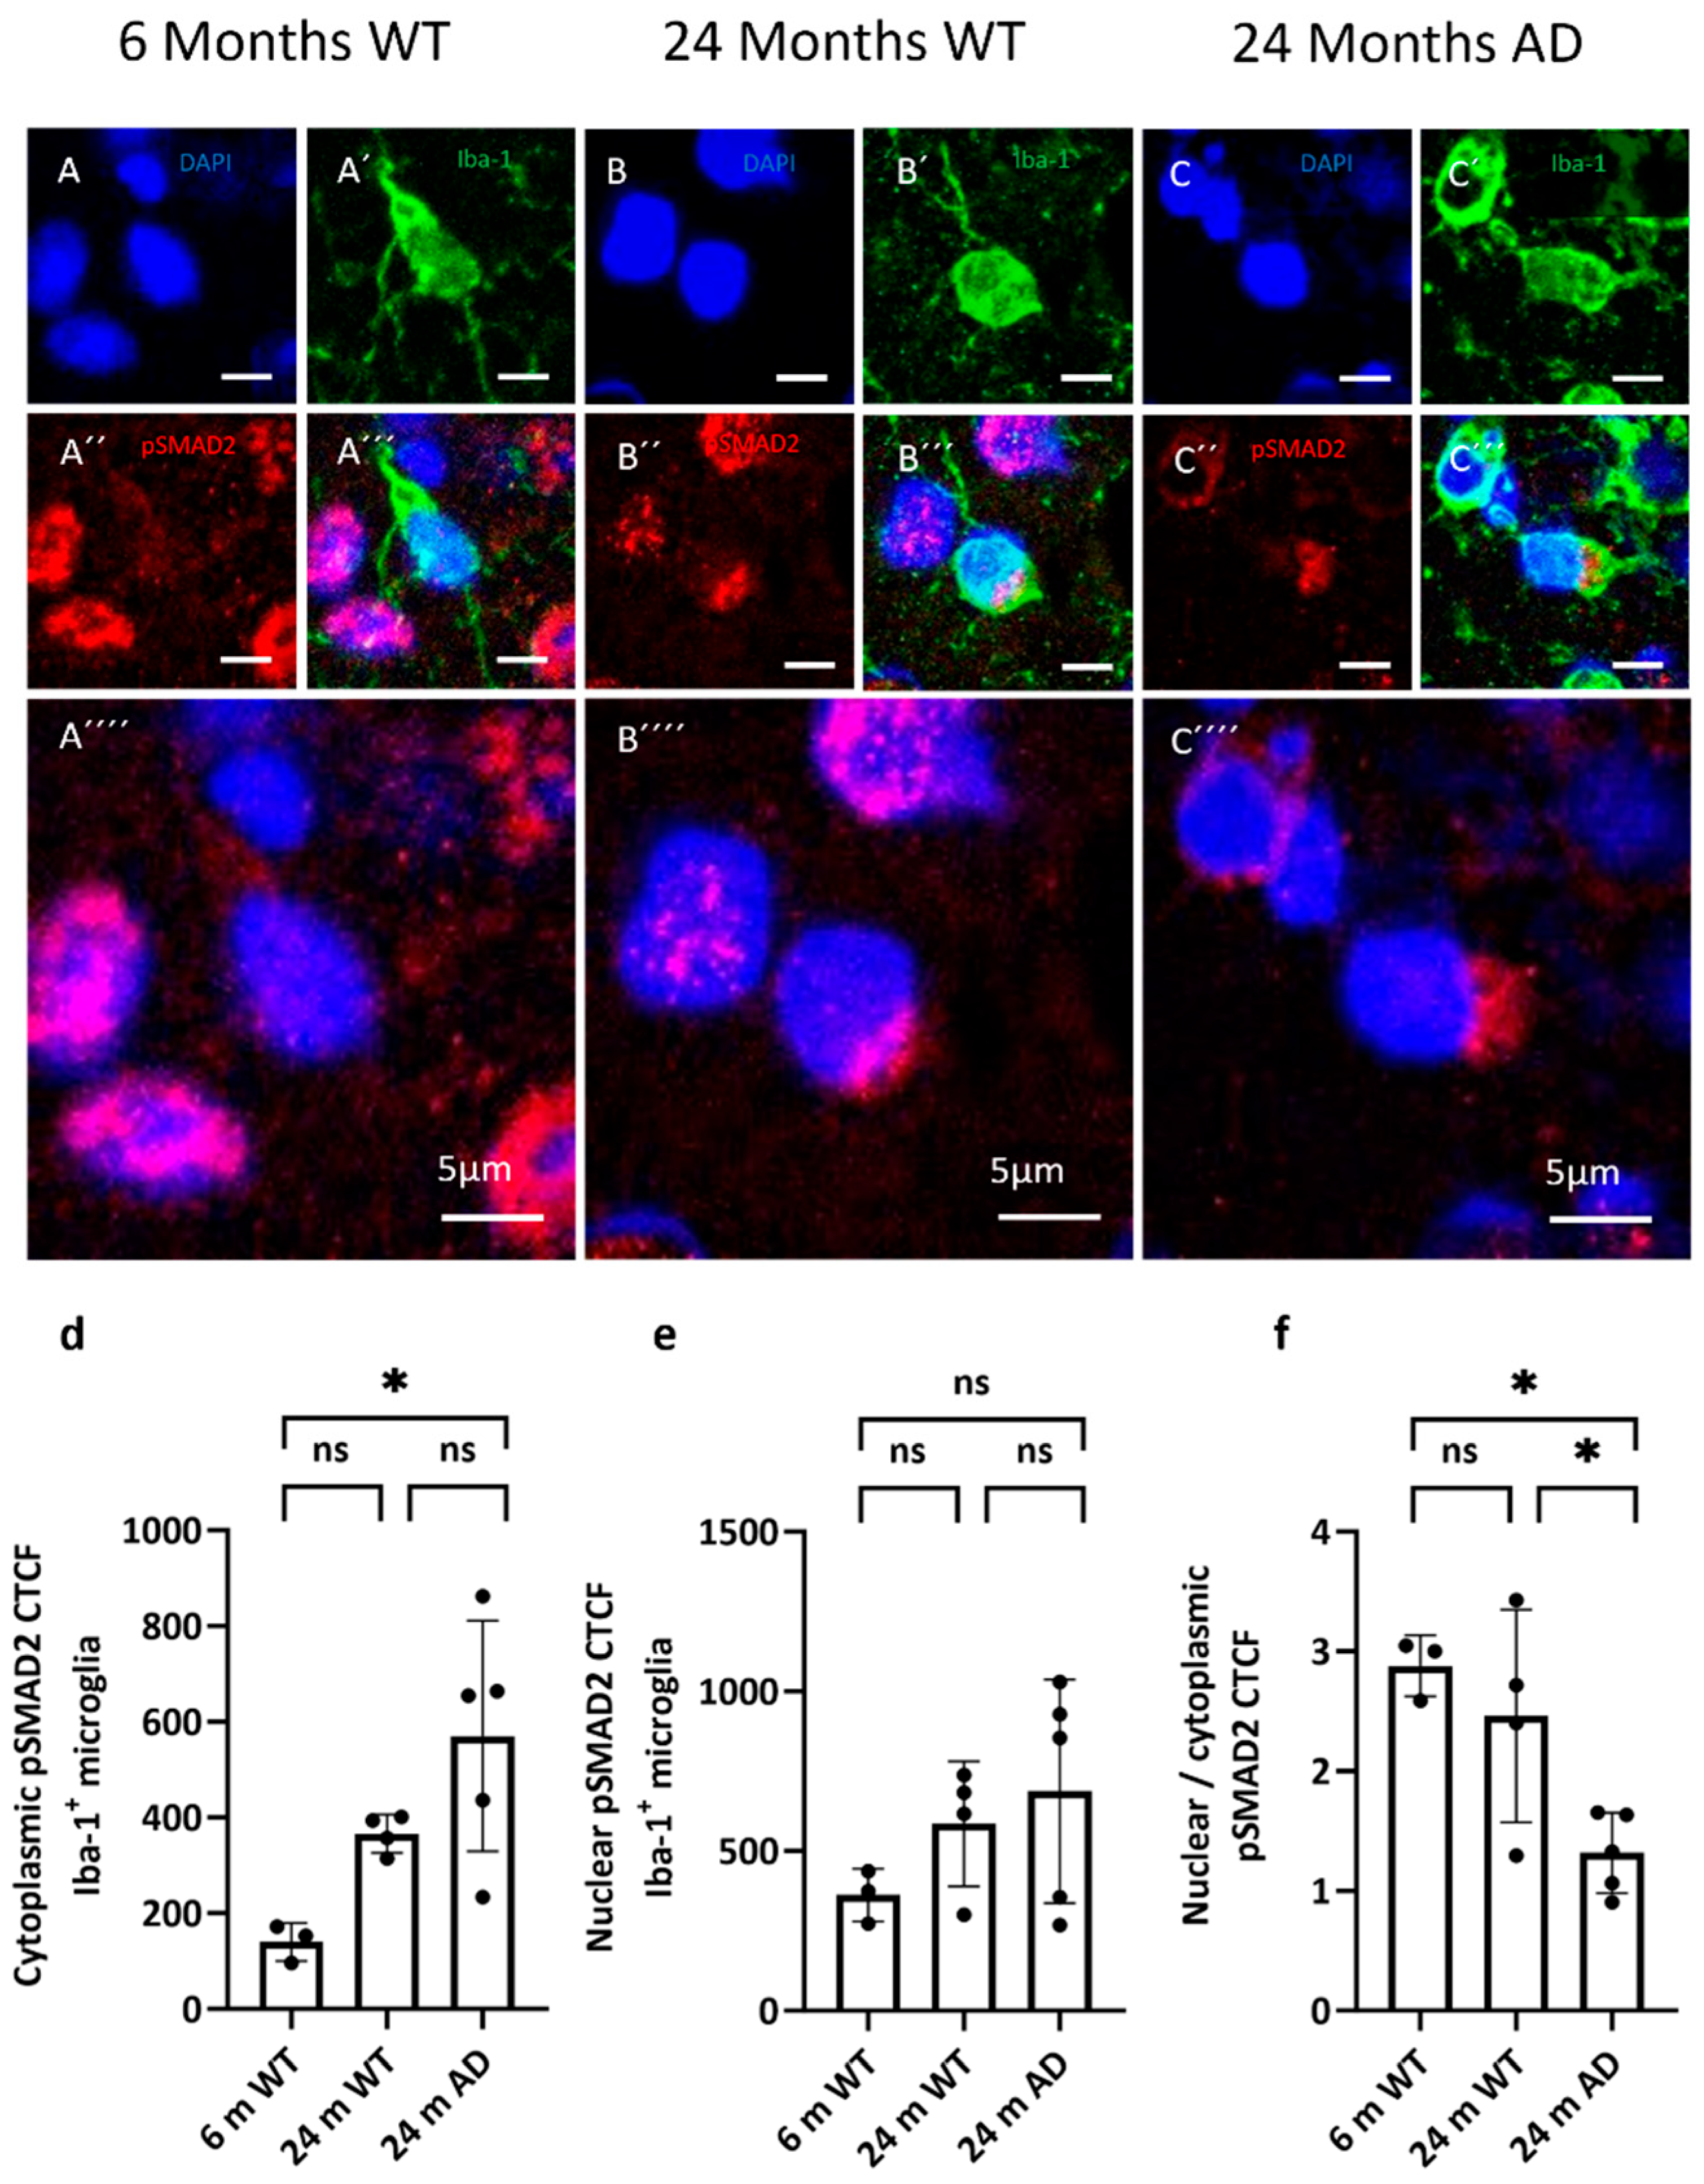
2.4.2. Quantification of Fluorescence Intensities
2.4.3. Statistical Analyses
2.4.4. Bulk RNA-Seq Data Acquisition and Processing
3. Results
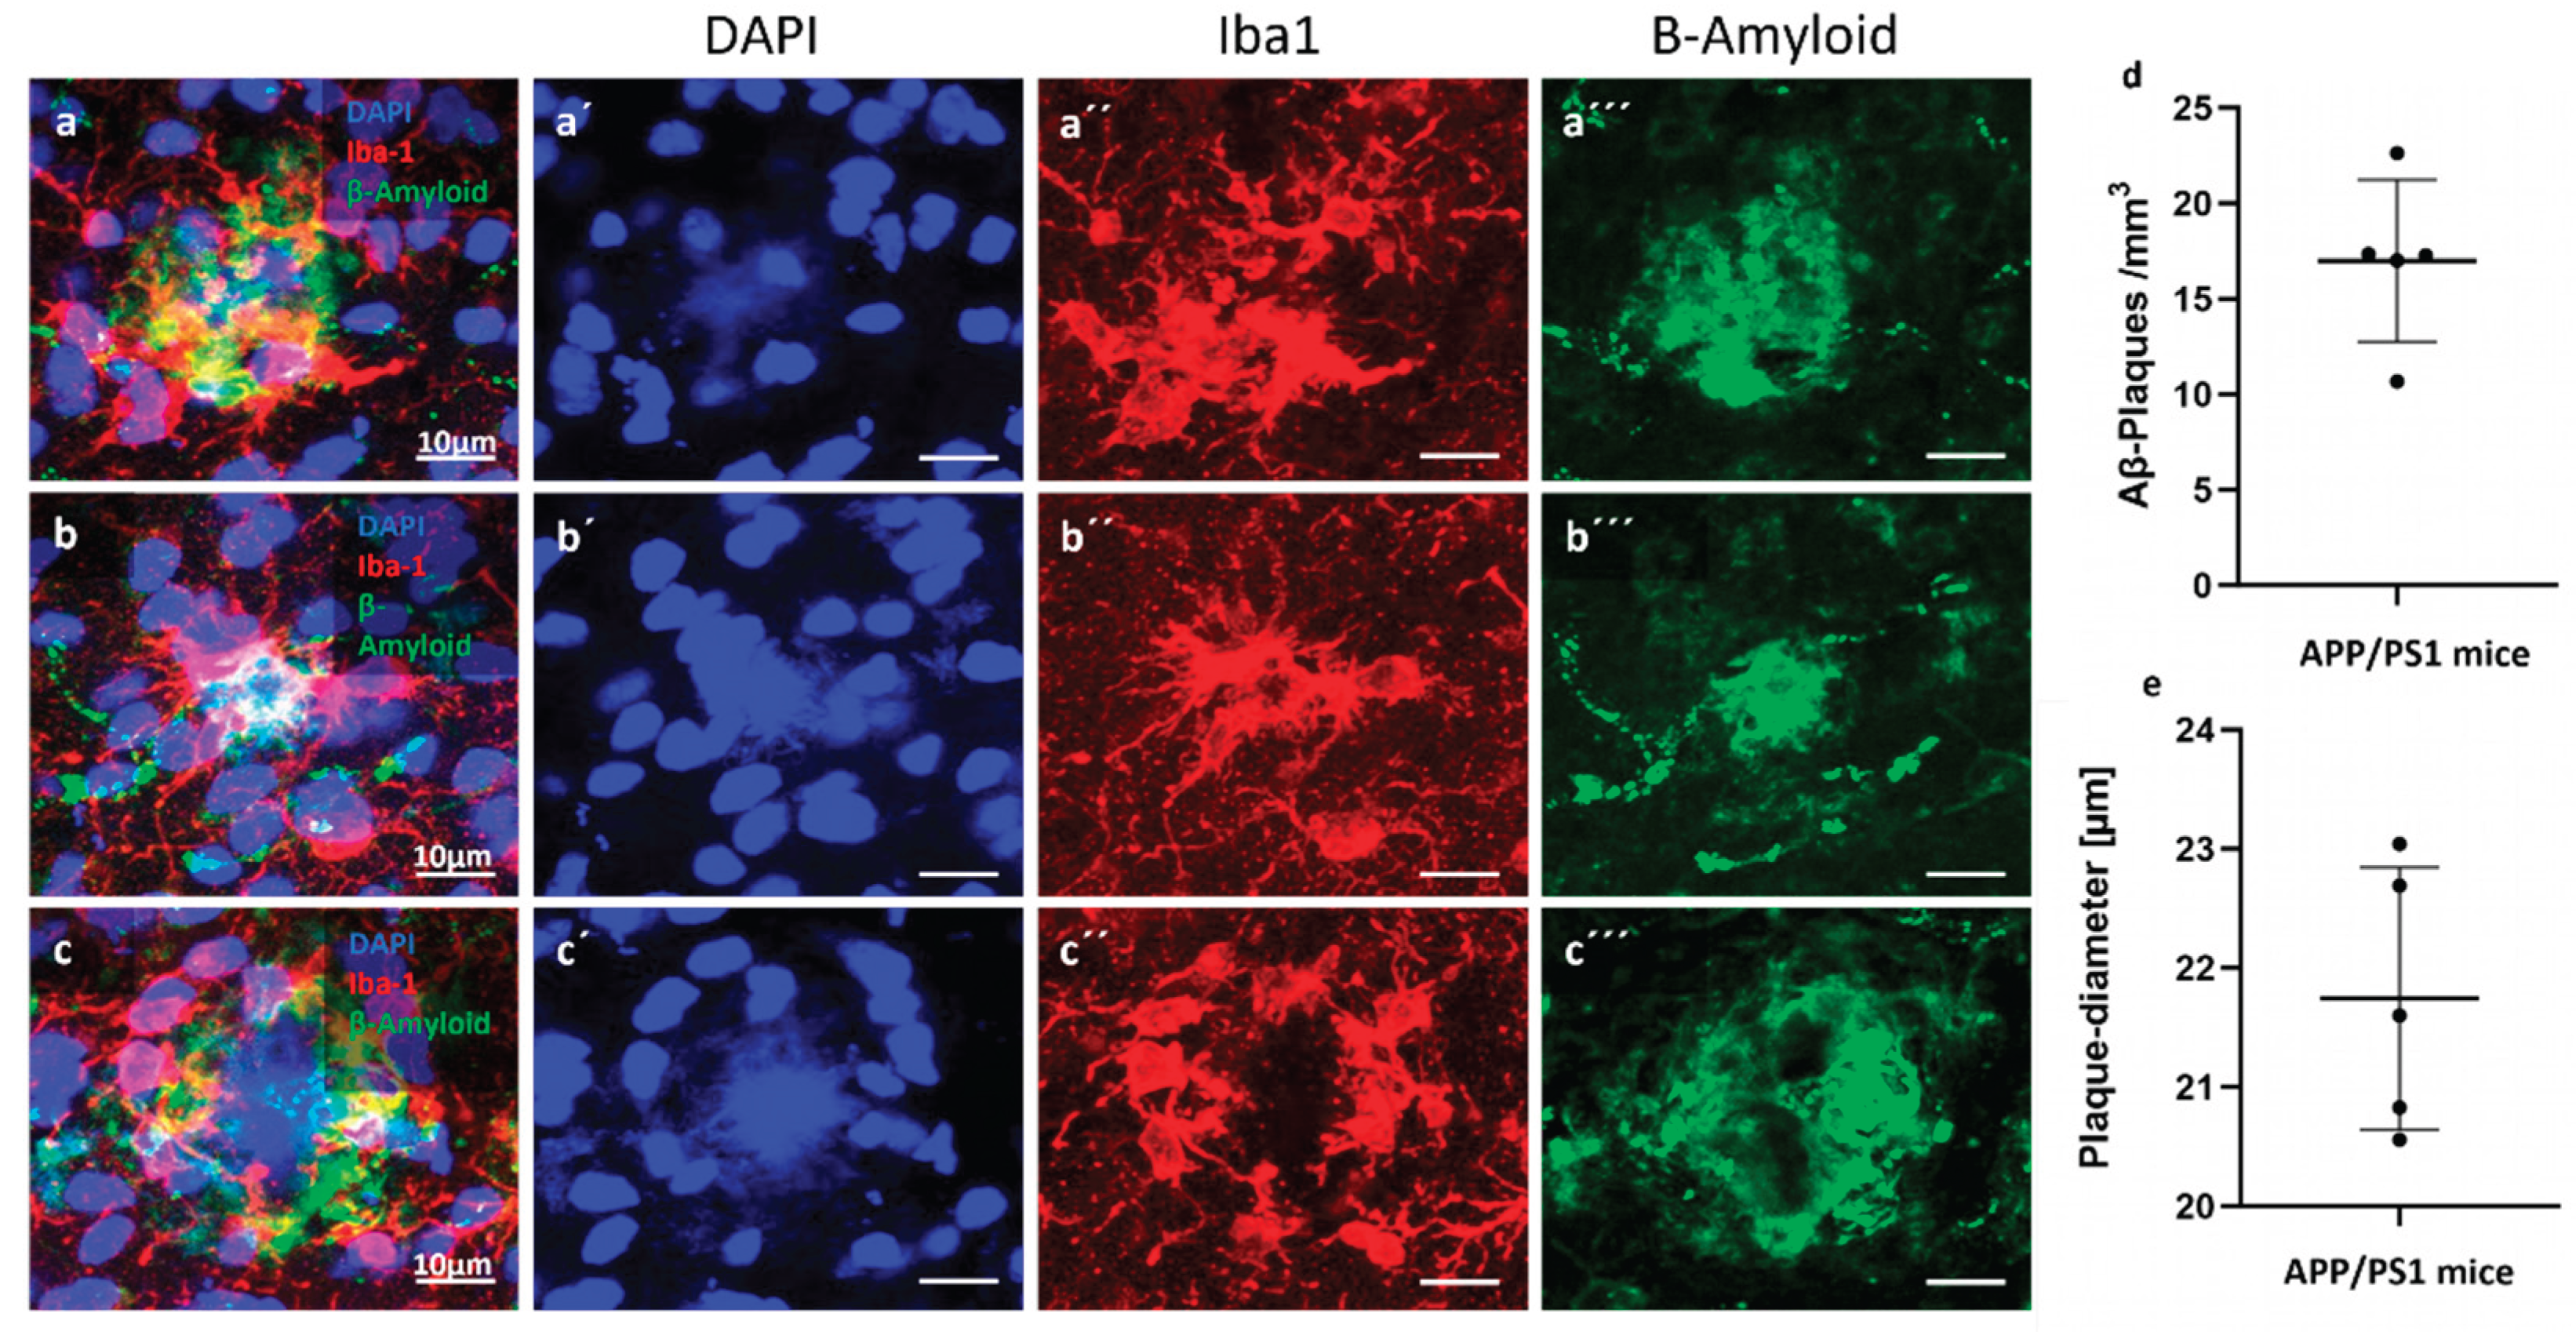
3.1. Amyloid Burden
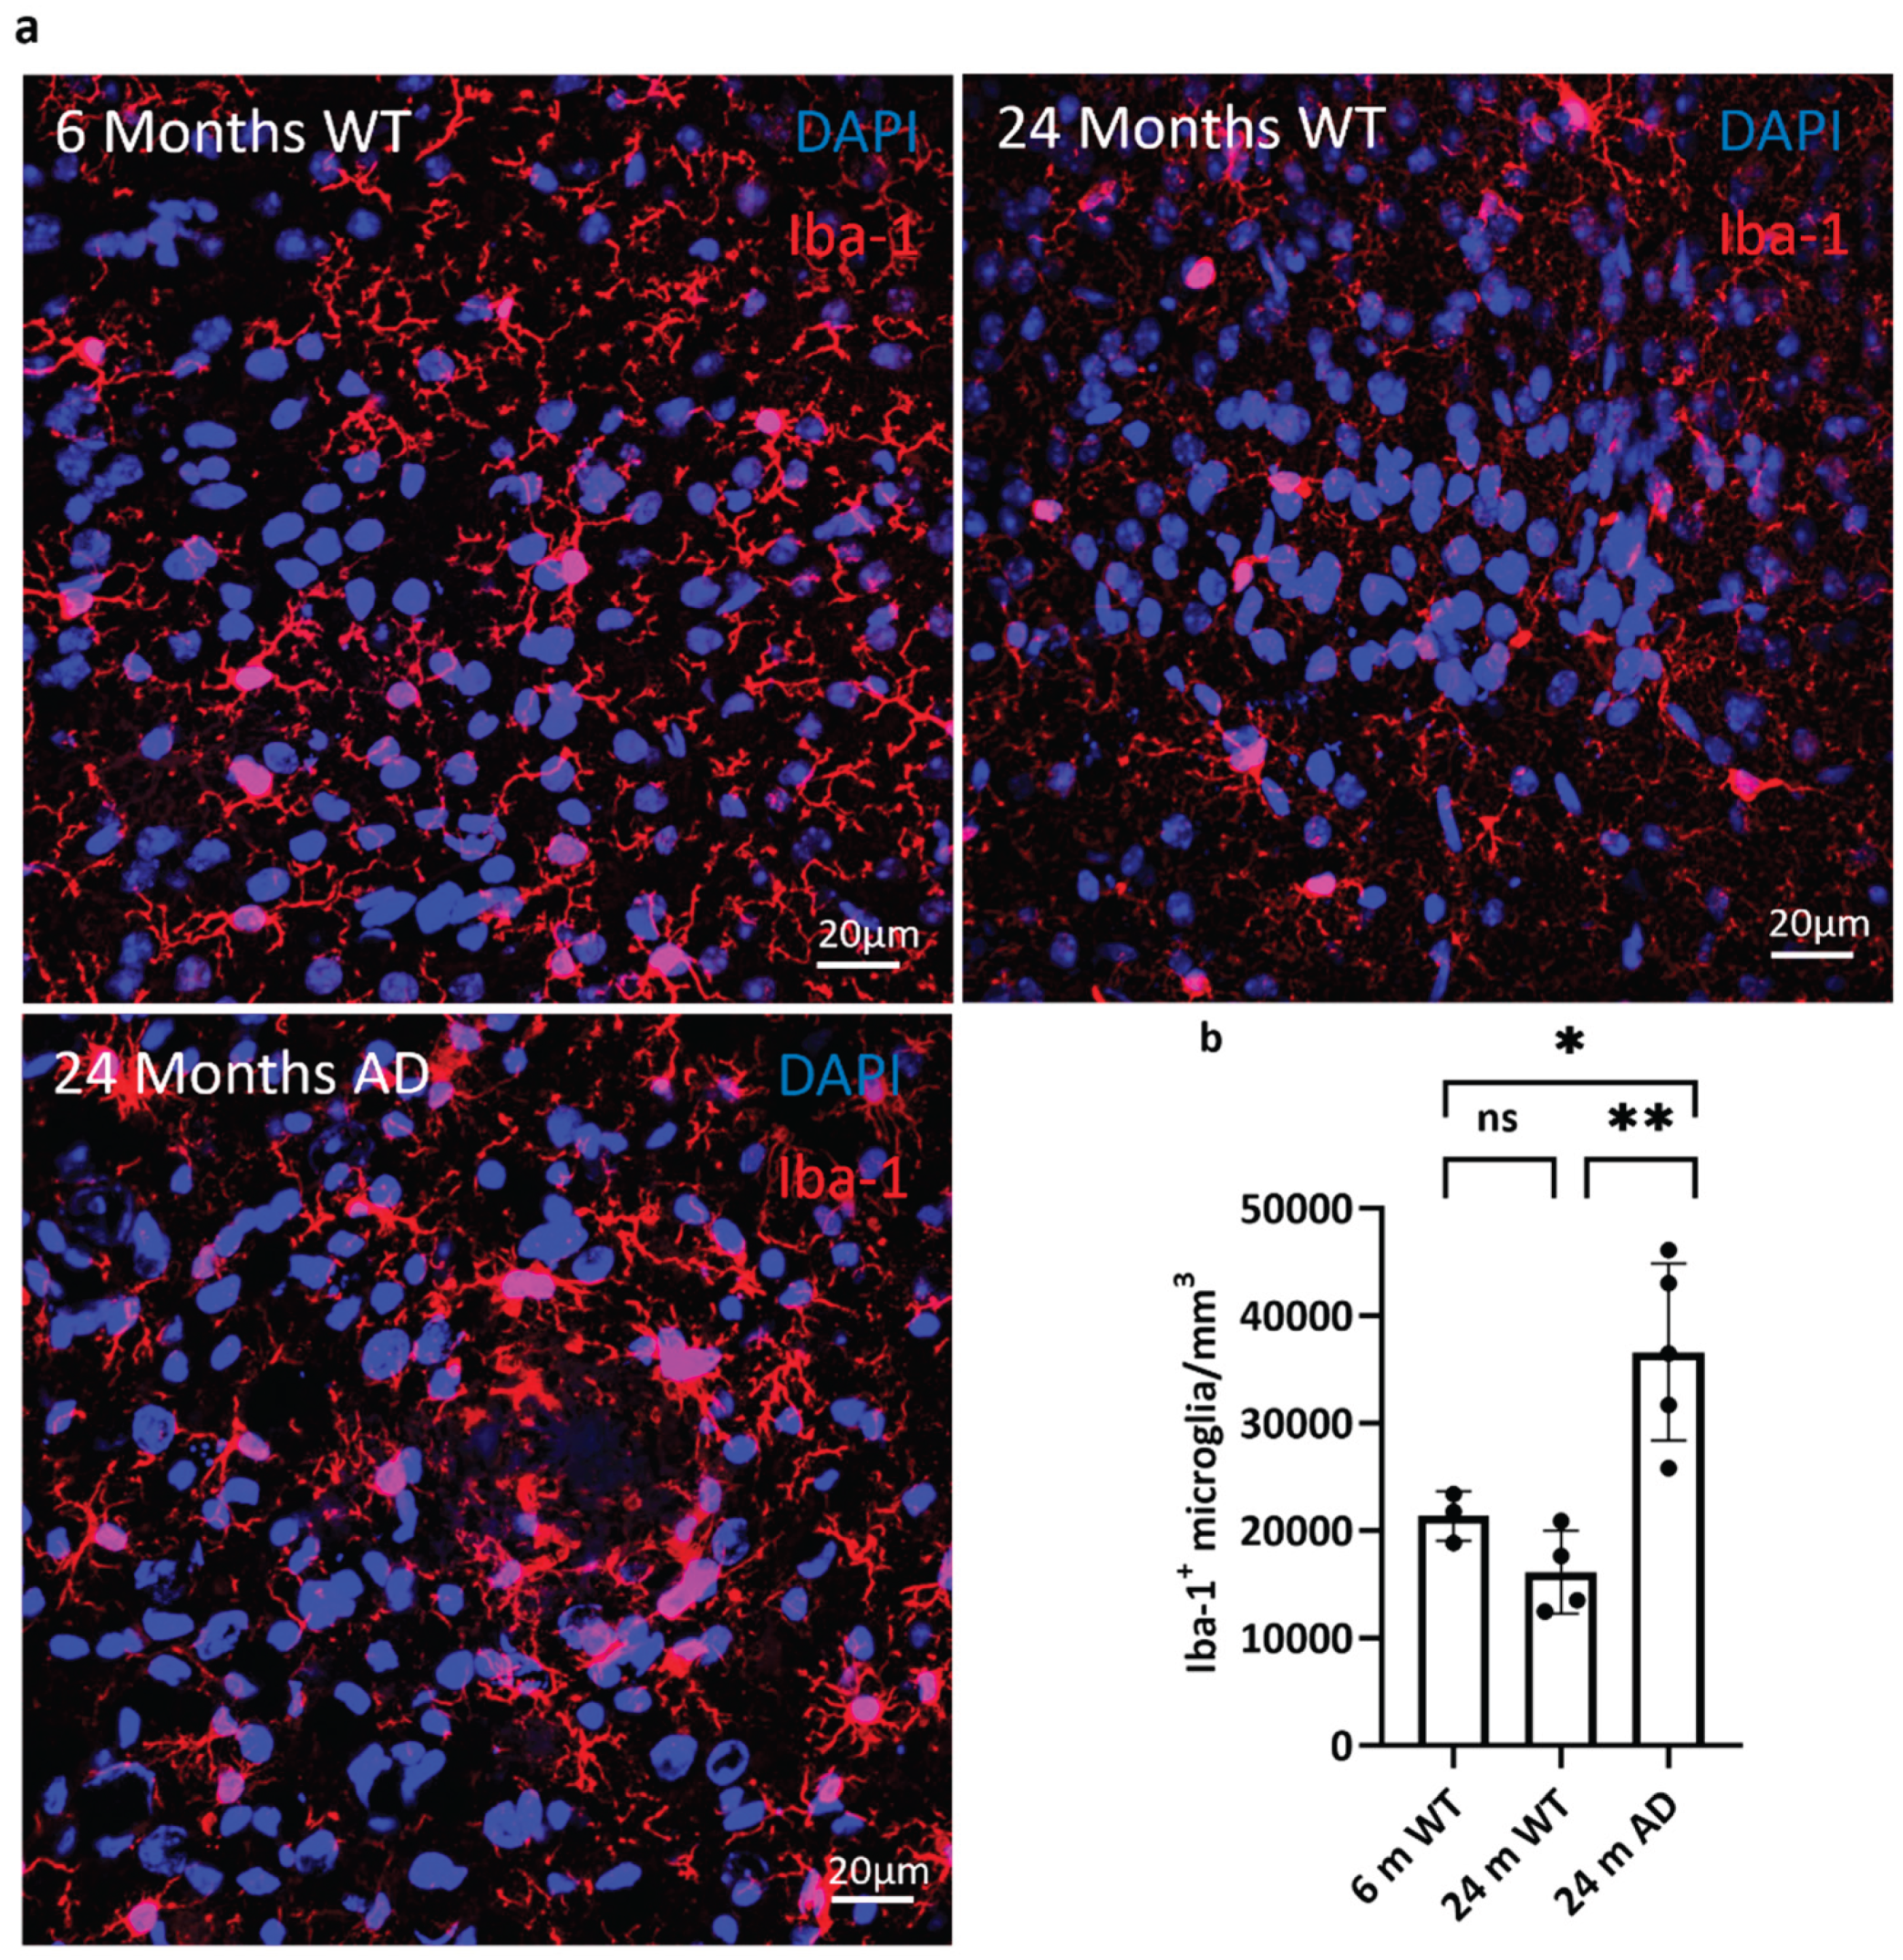
3.2. Glial Cell Density in the Brain of Aged WT and APP Mice
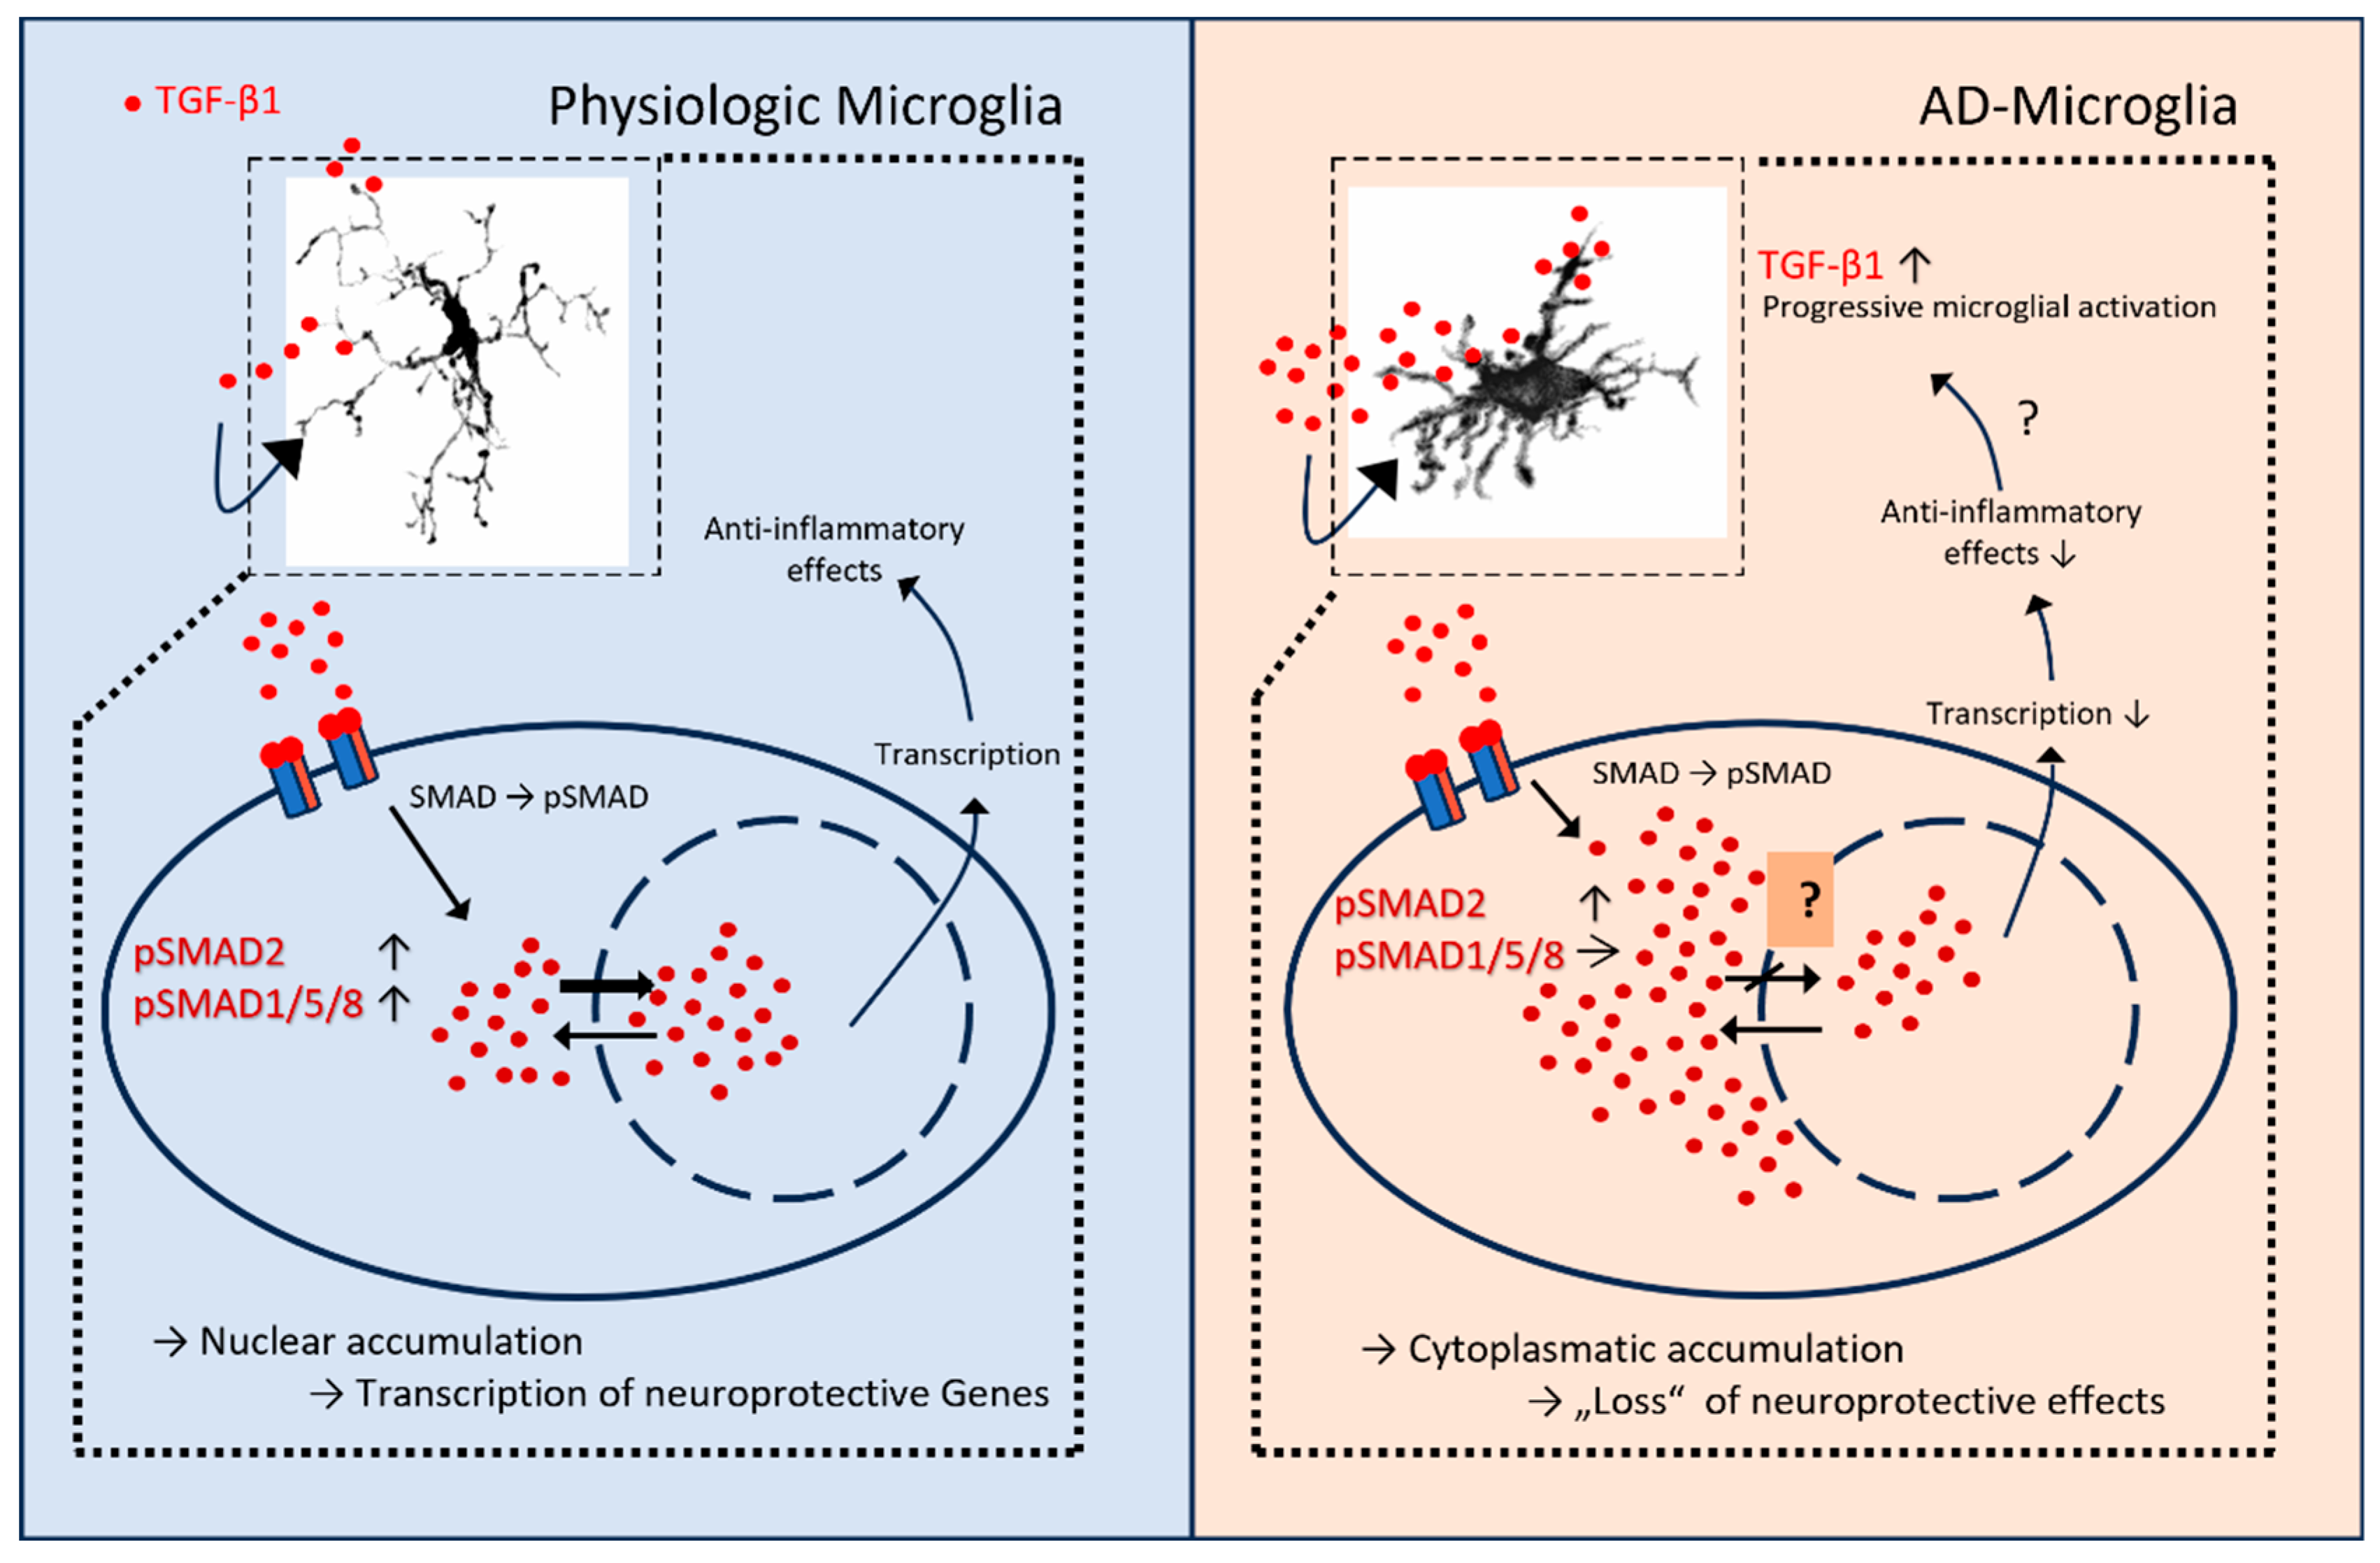
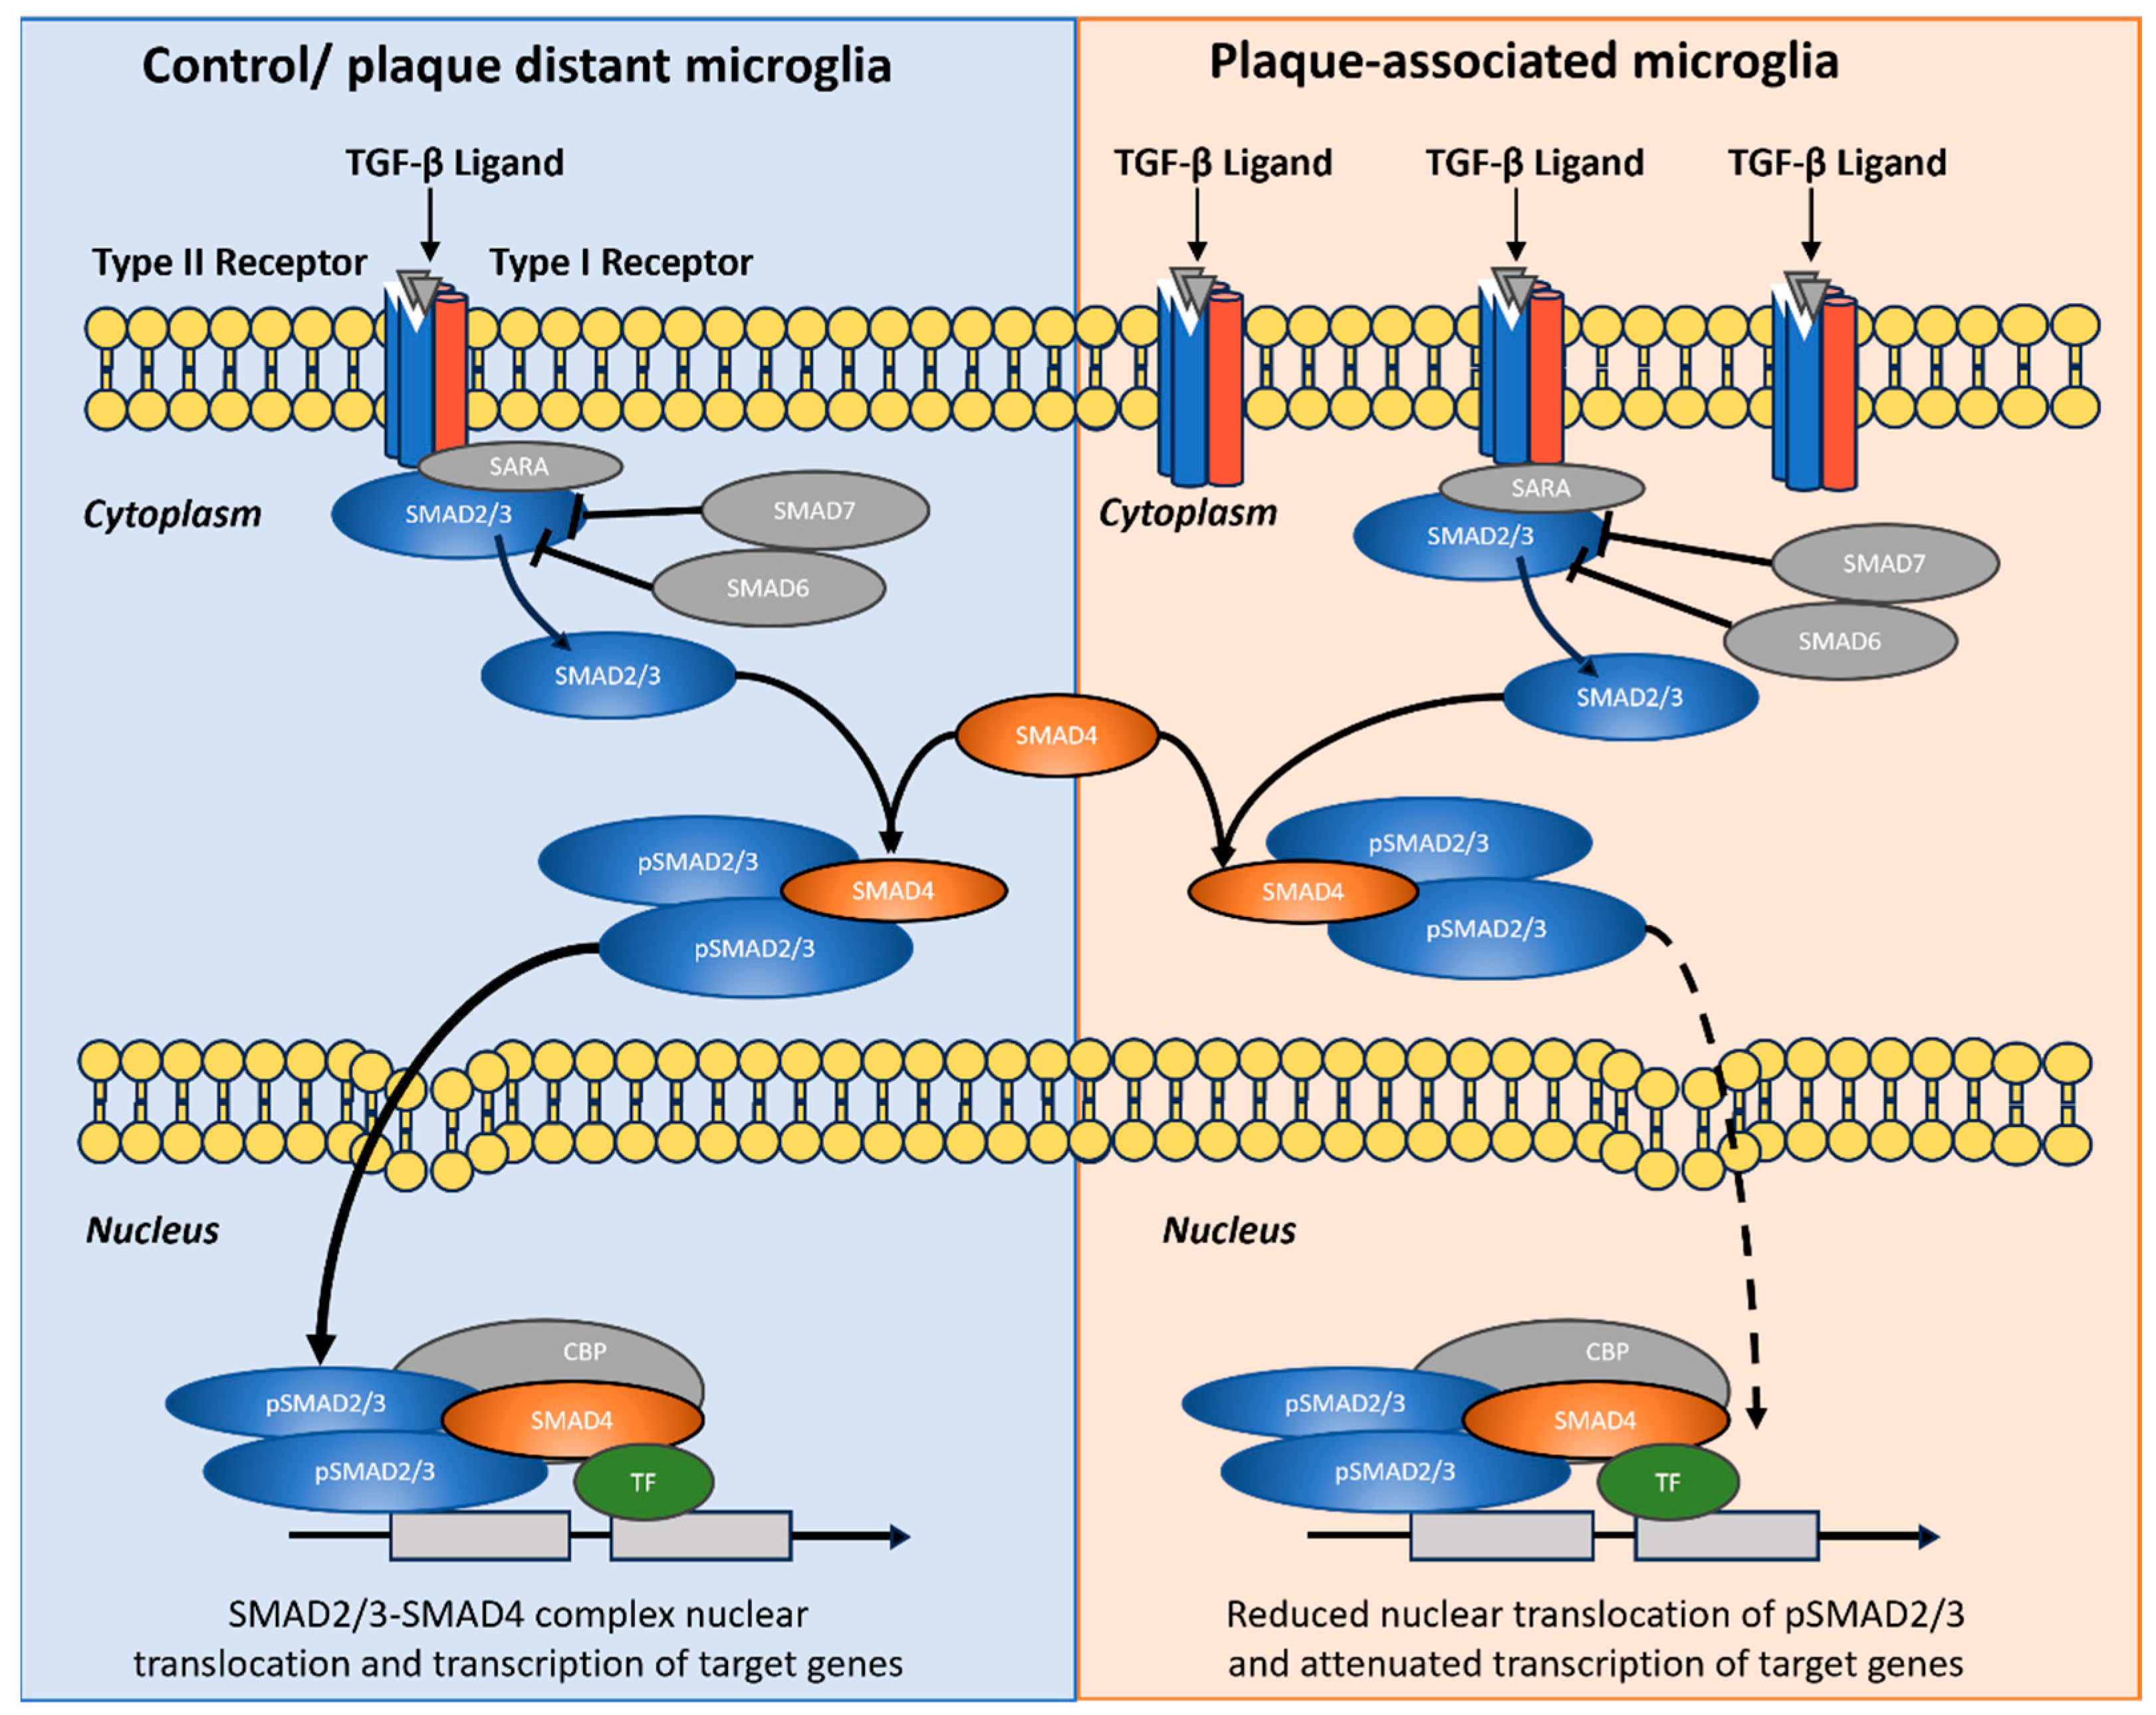
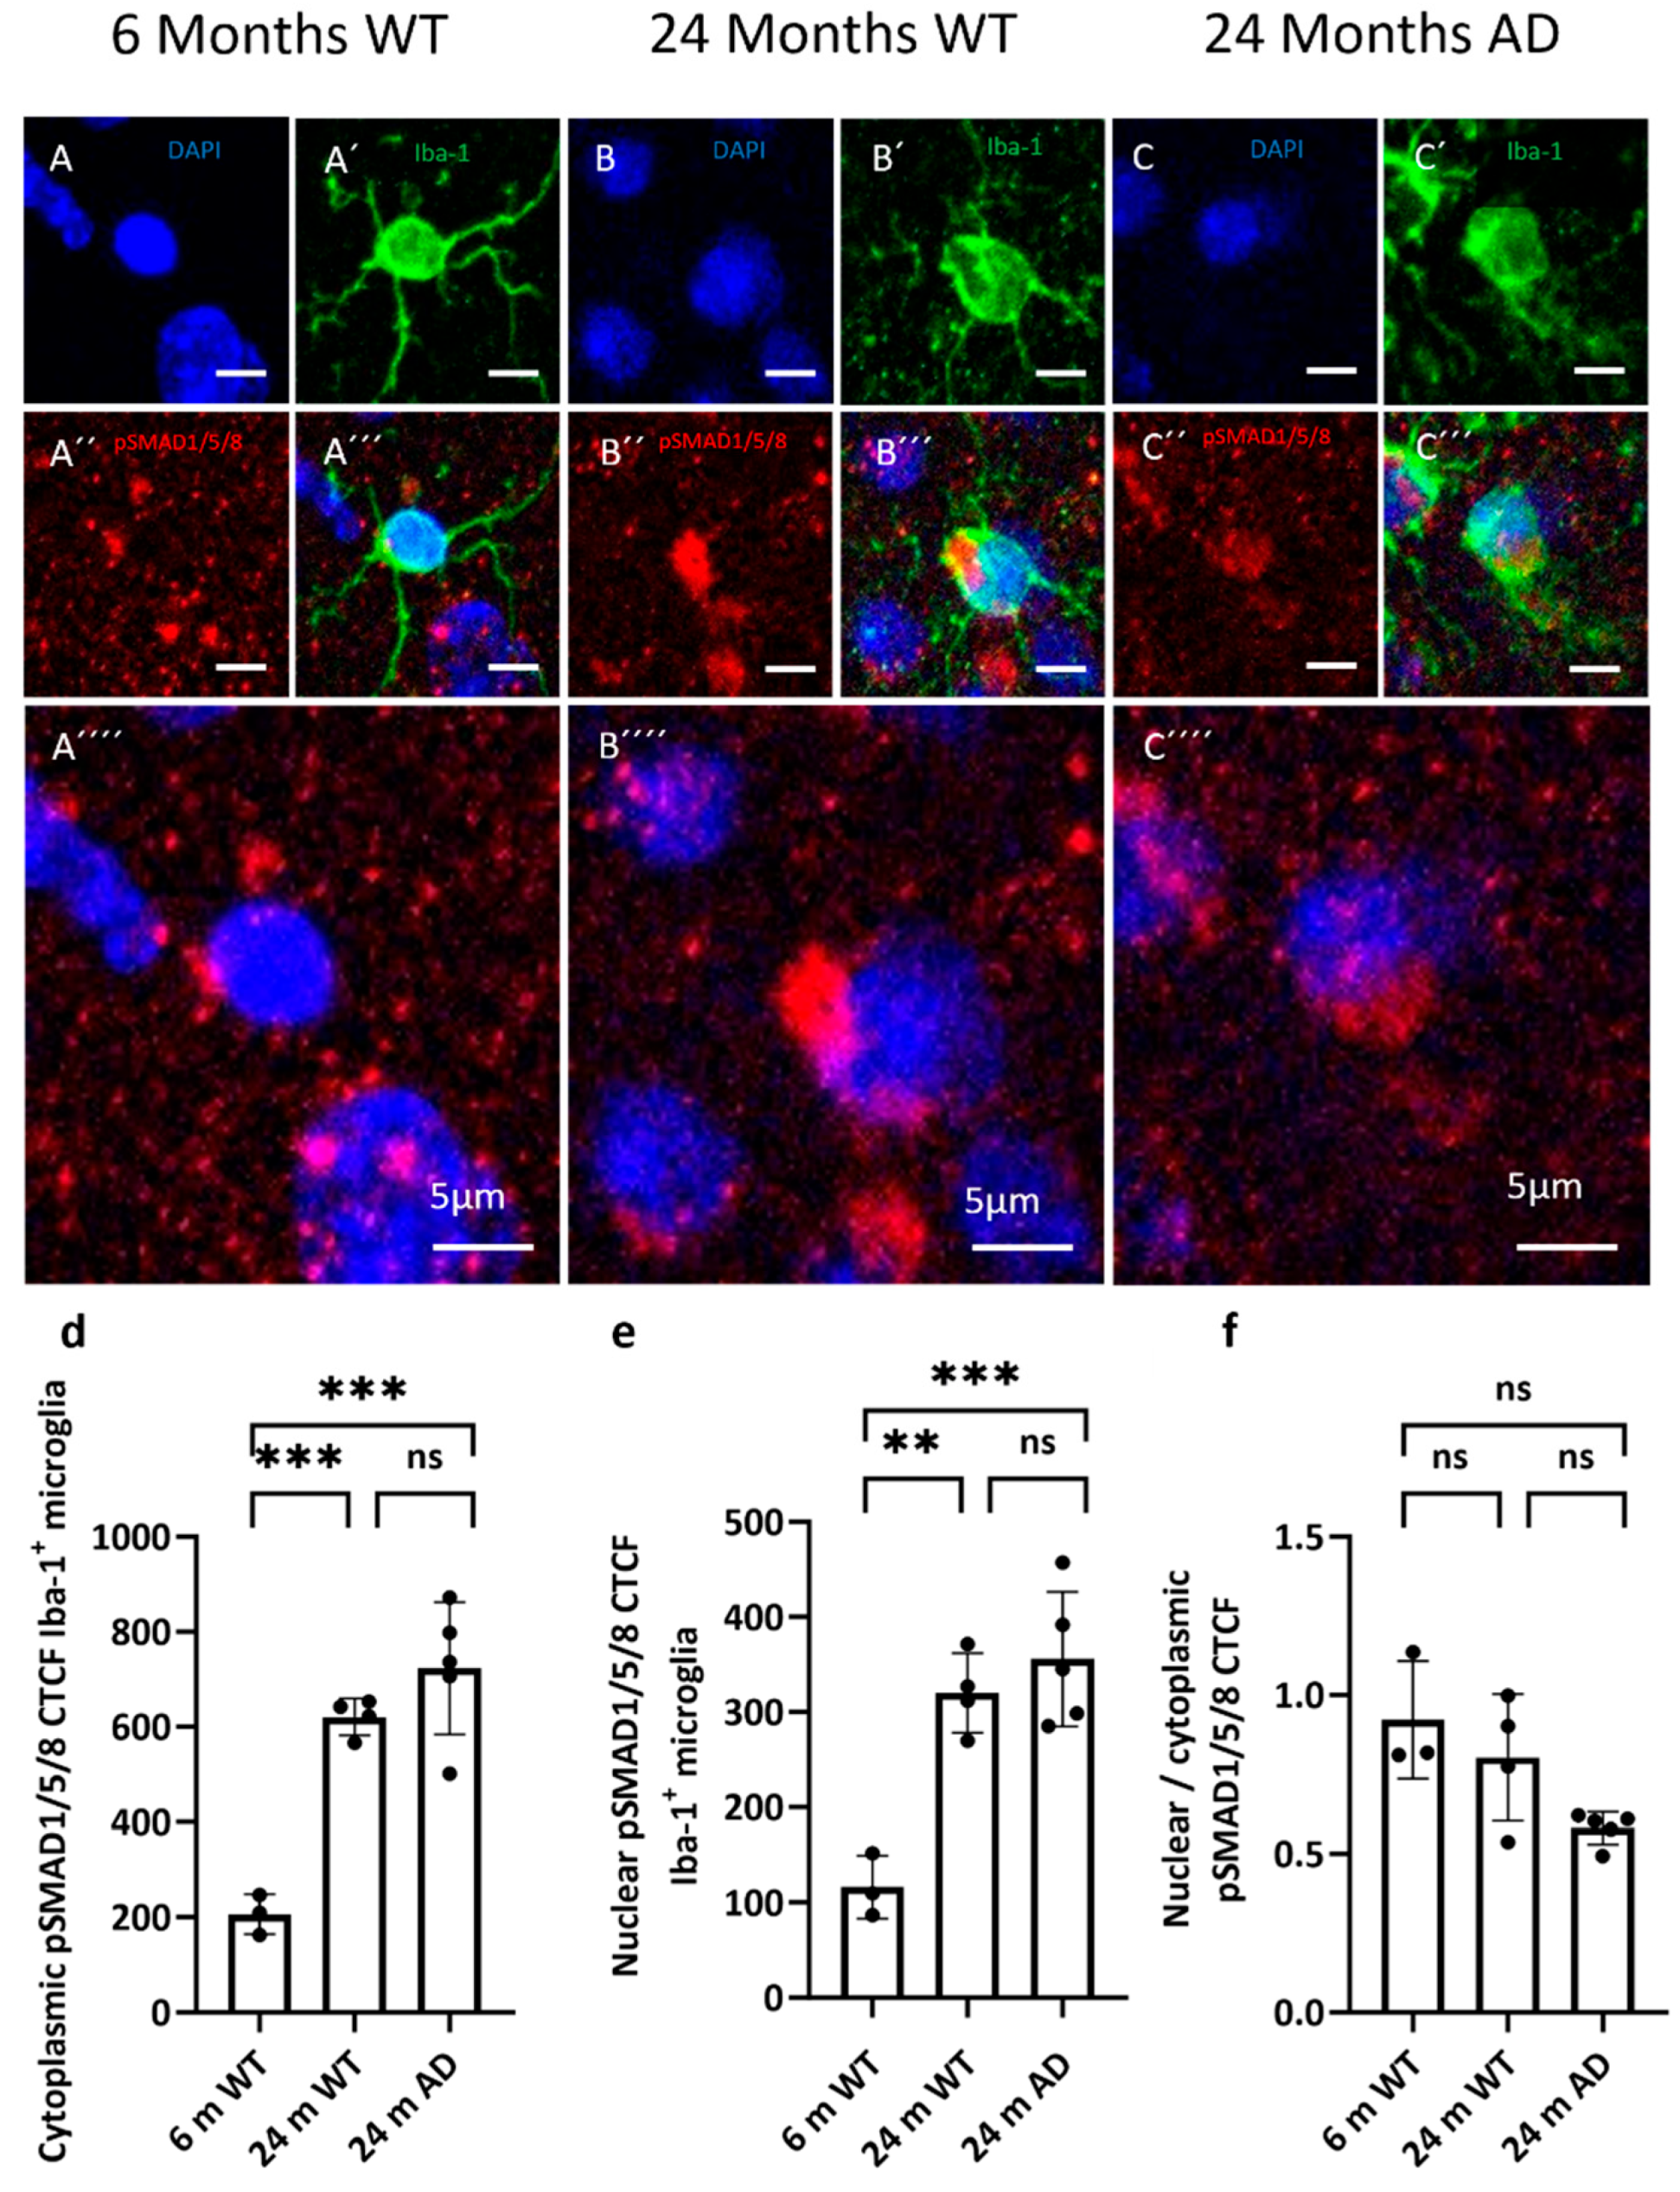
3.3. TGF-b Signaling
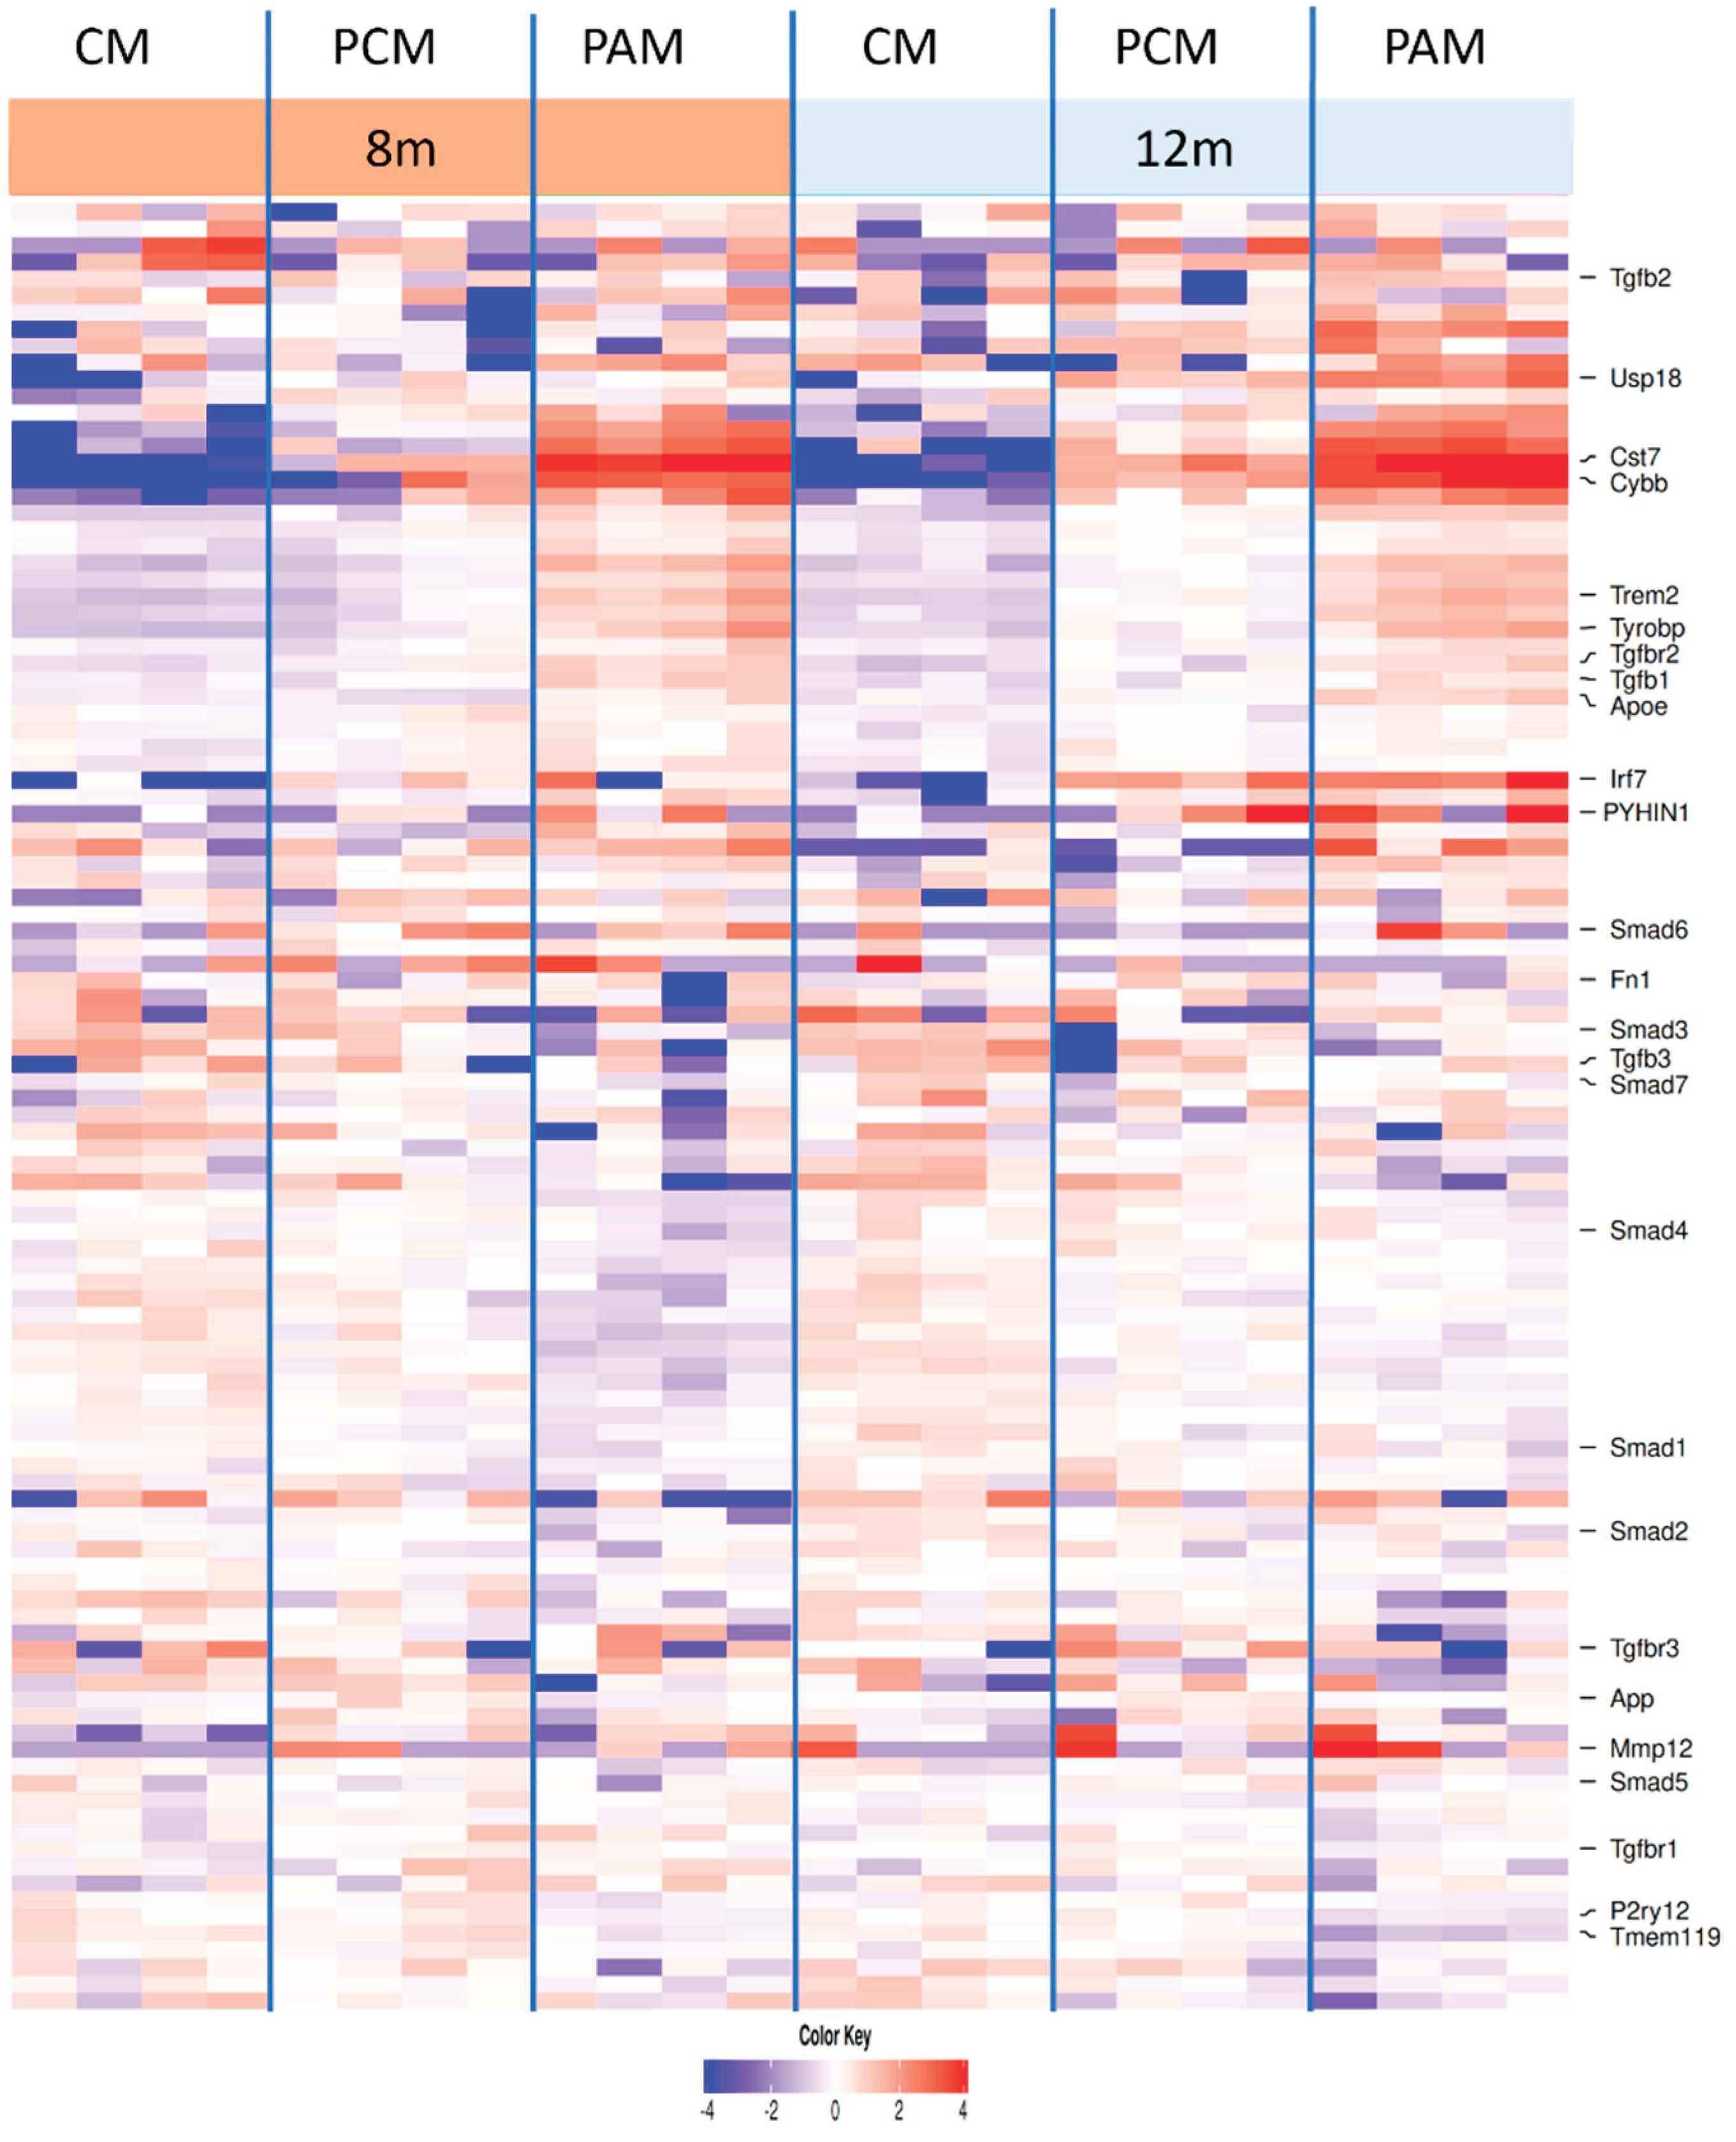
3.4. Microglia Transcriptional Context
4. Discussion
Supplementary Materials
Author Contributions
Funding
Institutional Review Board Statement
Informed Consent Statement
Data Availability Statement
Acknowledgments
Conflicts of Interest
Abbreviations
| MDPI | Multidisciplinary Digital Publishing Institute |
| DOAJ | Directory of open access journals |
| TLA | Three letter acronym |
| LD | Linear dichroism |
References
- Lo, M.W.; Woodruff, T.M. Complement: Bridging the Innate and Adaptive Immune Systems in Sterile Inflammation. J. Leukoc. Biol. 2020, 108, 339–351. [CrossRef]
- Arnold, T.D.; Lizama, C.O.; Cautivo, K.M.; Santander, N.; Lin, L.; Qiu, H.; Huang, E.J.; Liu, C.; Mukouyama, Y.; Reichardt, L.F.; et al. Impaired αVβ8 and TGFβ Signaling Lead to Microglial Dysmaturation and Neuromotor Dysfunction. J. Exp. Med. 2019, 216, 900–915. [CrossRef]
- Zöller, T.; Schneider, A.; Kleimeyer, C.; Masuda, T.; Potru, P.S.; Pfeifer, D.; Blank, T.; Prinz, M.; Spittau, B. Silencing of TGFβ Signalling in Microglia Results in Impaired Homeostasis. Nat. Commun. 2018, 9, 4011. [CrossRef]
- Hao, M.; Chen, J. Trend Analysis and Future Predictions of Global Burden of Alzheimer’s Disease and Other Dementias: A Study Based on the Global Burden of Disease Database from 1990 to 2021. BMC Med. 2025, 23, 378. [CrossRef]
- 2025 Alzheimer’s Disease Facts and Figures. Alzheimers Dement. 2025, 21, e70235. [CrossRef]
- Coppens, S.; Lehmann, S.; Hopley, C.; Hirtz, C. Neurofilament-Light, a Promising Biomarker: Analytical, Metrological and Clinical Challenges. Int. J. Mol. Sci. 2023, 24, 11624. [CrossRef]
- Kenaan, N.; Alshehabi, Z. A Review on Recent Advances in Alzheimer’s Disease: The Role of Synaptic Plasticity. AIMS Neurosci. 2025, 12, 75–94. [CrossRef]
- Kayed, R.; Lasagna-Reeves, C.A. Molecular Mechanisms of Amyloid Oligomers Toxicity. J. Alzheimers Dis. JAD 2013, 33 Suppl 1, S67-78. [CrossRef]
- Heppner, F.L.; Ransohoff, R.M.; Becher, B. Immune Attack: The Role of Inflammation in Alzheimer Disease. Nat. Rev. Neurosci. 2015, 16, 358–372. [CrossRef]
- Sobue, A.; Komine, O.; Hara, Y.; Endo, F.; Mizoguchi, H.; Watanabe, S.; Murayama, S.; Saito, T.; Saido, T.C.; Sahara, N.; et al. Microglial Gene Signature Reveals Loss of Homeostatic Microglia Associated with Neurodegeneration of Alzheimer’s Disease. Acta Neuropathol. Commun. 2021, 9, 1. [CrossRef]
- Lee, C.Y.D.; Landreth, G.E. The Role of Microglia in Amyloid Clearance from the AD Brain. J. Neural Transm. Vienna Austria 1996 2010, 117, 949–960. [CrossRef]
- Spittau, B.; Dokalis, N.; Prinz, M. The Role of TGFβ Signaling in Microglia Maturation and Activation. Trends Immunol. 2020, 41, 836–848. [CrossRef]
- Vidovic, N.; Spittau, B. Microglial Transforming Growth Factor-β Signaling in Alzheimer’s Disease. Int. J. Mol. Sci. 2024, 25, 3090. [CrossRef]
- Inman, G.J.; Nicolás, F.J.; Hill, C.S. Nucleocytoplasmic Shuttling of Smads 2, 3, and 4 Permits Sensing of TGF-Beta Receptor Activity. Mol. Cell 2002, 10, 283–294. [CrossRef]
- Von Bernhardi, R.; Cornejo, F.; Parada, G.; Eugenin, J. Role of TGFβ Signaling in the Pathogenesis of Alzheimer’s Disease. Front. Cell. Neurosci. 2015, 9. [CrossRef]
- Pettas, S.; Karagianni, K.; Kanata, E.; Chatziefstathiou, A.; Christoudia, N.; Xanthopoulos, K.; Sklaviadis, T.; Dafou, D. Profiling Microglia through Single-Cell RNA Sequencing over the Course of Development, Aging, and Disease. Cells 2022, 11, 2383. [CrossRef]
- Keren-Shaul, H.; Spinrad, A.; Weiner, A.; Matcovitch-Natan, O.; Dvir-Szternfeld, R.; Ulland, T.K.; David, E.; Baruch, K.; Lara-Astaiso, D.; Toth, B.; et al. A Unique Microglia Type Associated with Restricting Development of Alzheimer’s Disease. Cell 2017, 169, 1276-1290.e17. [CrossRef]
- Liu, W.; Taso, O.; Wang, R.; Bayram, S.; Graham, A.C.; Garcia-Reitboeck, P.; Mallach, A.; Andrews, W.D.; Piers, T.M.; Botia, J.A.; et al. Trem2 Promotes Anti-Inflammatory Responses in Microglia and Is Suppressed under pro-Inflammatory Conditions. Hum. Mol. Genet. 2020, 29, 3224–3248. [CrossRef]
- Lok, K.; Zhao, H.; Shen, H.; Wang, Z.; Gao, X.; Zhao, W.; Yin, M. Characterization of the APP/PS1 Mouse Model of Alzheimer’s Disease in Senescence Accelerated Background. Neurosci. Lett. 2013, 557, 84–89. [CrossRef]
- Reinders, N.R.; Spek, S.J.F. van der; Klaassen, R.V.; Koymans, K.J.; MacGillavry, H.D.; Smit, A.B.; Kessels, H.W. Amyloid-β-Driven Synaptic Deficits Are Mediated by Synaptic Removal of GluA3-Containing AMPA Receptors. J. Neurosci. 2025, 45. [CrossRef]
- Oshima, T.; Kater, M.S.J.; Huffels, C.F.M.; Wesseling, E.M.; Middeldorp, J.; Hol, E.M.; Verheijen, M.H.G.; Smit, A.B.; Boddeke, E.W.G.M.; Eggen, B.J.L. Early Amyloid-Induced Changes in Microglia Gene Expression in Male APP/PS1 Mice. J. Neurosci. Res. 2024, 102, e25295. [CrossRef]
- Jankowsky, J.L.; Fadale, D.J.; Anderson, J.; Xu, G.M.; Gonzales, V.; Jenkins, N.A.; Copeland, N.G.; Lee, M.K.; Younkin, L.H.; Wagner, S.L.; et al. Mutant Presenilins Specifically Elevate the Levels of the 42 Residue Beta-Amyloid Peptide in Vivo: Evidence for Augmentation of a 42-Specific Gamma Secretase. Hum. Mol. Genet. 2004, 13, 159–170. [CrossRef]
- Schnell, S.A.; Staines, W.A.; Wessendorf, M.W. Reduction of Lipofuscin-like Autofluorescence in Fluorescently Labeled Tissue. J. Histochem. Cytochem. Off. J. Histochem. Soc. 1999, 47, 719–730. [CrossRef]
- Arshadi, C.; Günther, U.; Eddison, M.; Harrington, K.I.S.; Ferreira, T.A. SNT: A Unifying Toolbox for Quantification of Neuronal Anatomy. Nat. Methods 2021, 18, 374–377. [CrossRef]
- El-Sharkawey, A. Calculate the Corrected Total Cell Fluorescence (CTCF). 2016.
- Hemonnot-Girard, A.-L.; Meersseman, C.; Pastore, M.; Garcia, V.; Linck, N.; Rey, C.; Chebbi, A.; Jeanneteau, F.; Ginsberg, S.D.; Lachuer, J.; et al. Comparative Analysis of Transcriptome Remodeling in Plaque-Associated and Plaque-Distant Microglia during Amyloid-β Pathology Progression in Mice. J. Neuroinflammation 2022, 19, 234. [CrossRef]
- Franceschi, C.; Garagnani, P.; Parini, P.; Giuliani, C.; Santoro, A. Inflammaging: A New Immune-Metabolic Viewpoint for Age-Related Diseases. Nat. Rev. Endocrinol. 2018, 14, 576–590. [CrossRef]
- Krasemann, S.; Madore, C.; Cialic, R.; Baufeld, C.; Calcagno, N.; El Fatimy, R.; Beckers, L.; O’Loughlin, E.; Xu, Y.; Fanek, Z.; et al. The TREM2-APOE Pathway Drives the Transcriptional Phenotype of Dysfunctional Microglia in Neurodegenerative Diseases. Immunity 2017, 47, 566-581.e9. [CrossRef]
- Audrain, M.; Haure-Mirande, J.-V.; Mleczko, J.; Wang, M.; Griffin, J.K.; St George-Hyslop, P.H.; Fraser, P.; Zhang, B.; Gandy, S.; Ehrlich, M.E. Reactive or Transgenic Increase in Microglial TYROBP Reveals a TREM2-Independent TYROBP-APOE Link in Wild-Type and Alzheimer’s-Related Mice. Alzheimers Dement. J. Alzheimers Assoc. 2021, 17, 149–163. [CrossRef]
- Haure-Mirande, J.-V.; Audrain, M.; Ehrlich, M.E.; Gandy, S. Microglial TYROBP/DAP12 in Alzheimer’s Disease: Transduction of Physiological and Pathological Signals across TREM2. Mol. Neurodegener. 2022, 17, 55. [CrossRef]
- Yang, C.; Xu, P. The Role of Transforming Growth Factor Β1 /Smad Pathway in Alzheimer’s Disease Inflammation Pathology. Mol. Biol. Rep. 2023, 50, 777–788. [CrossRef]
- Wu, M.; Wu, S.; Chen, W.; Li, Y.-P. The Roles and Regulatory Mechanisms of TGF-β and BMP Signaling in Bone and Cartilage Development, Homeostasis and Disease. Cell Res. 2024, 34, 101–123. [CrossRef]
- Le Dréau, G. BuMPing Into Neurogenesis: How the Canonical BMP Pathway Regulates Neural Stem Cell Divisions Throughout Space and Time. Front. Neurosci. 2022, 15, 819990. [CrossRef]
- Yousef, H.; Morgenthaler, A.; Schlesinger, C.; Bugaj, L.; Conboy, I.M.; Schaffer, D.V. Age-Associated Increase in BMP Signaling Inhibits Hippocampal Neurogenesis. Stem Cells Dayt. Ohio 2015, 33, 1577–1588. [CrossRef]
- Ueki, Y.; Reh, T.A. Activation of BMP-Smad1/5/8 Signaling Promotes Survival of Retinal Ganglion Cells after Damage in Vivo. PloS One 2012, 7, e38690. [CrossRef]
- Kamato, D.; Do, B.H.; Osman, N.; Ross, B.P.; Mohamed, R.; Xu, S.; Little, P.J. Smad Linker Region Phosphorylation Is a Signalling Pathway in Its Own Right and Not Only a Modulator of Canonical TGF-β Signalling. Cell. Mol. Life Sci. CMLS 2020, 77, 243–251. [CrossRef]
- Kretzschmar, M.; Doody, J.; Massagué, J. Opposing BMP and EGF Signalling Pathways Converge on the TGF-Beta Family Mediator Smad1. Nature 1997, 389, 618–622. [CrossRef]
- Chen, M.J.; Ramesha, S.; Weinstock, L.D.; Gao, T.; Ping, L.; Xiao, H.; Dammer, E.B.; Duong, D.D.; Levey, A.I.; Lah, J.J.; et al. Extracellular Signal-Regulated Kinase Regulates Microglial Immune Responses in Alzheimer’s Disease. J. Neurosci. Res. 2021, 99, 1704–1721. [CrossRef]
- Qu, W.-S.; Tian, D.-S.; Guo, Z.-B.; Fang, J.; Zhang, Q.; Yu, Z.-Y.; Xie, M.-J.; Zhang, H.-Q.; Lü, J.-G.; Wang, W. Inhibition of EGFR/MAPK Signaling Reduces Microglial Inflammatory Response and the Associated Secondary Damage in Rats after Spinal Cord Injury. J. Neuroinflammation 2012, 9, 178. [CrossRef]
- Goldmann, T.; Zeller, N.; Raasch, J.; Kierdorf, K.; Frenzel, K.; Ketscher, L.; Basters, A.; Staszewski, O.; Brendecke, S.M.; Spiess, A.; et al. USP18 Lack in Microglia Causes Destructive Interferonopathy of the Mouse Brain. EMBO J. 2015, 34, 1612–1629. [CrossRef]
- Hansmann, F.; Zhang, N.; Herder, V.; Leitzen, E.; Baumgärtner, W. Delayed Astrogliosis Associated with Reduced M1 Microglia Activation in Matrix Metalloproteinase 12 Knockout Mice during Theiler’s Murine Encephalomyelitis. Int. J. Mol. Sci. 2019, 20, 1702. [CrossRef]
Disclaimer/Publisher’s Note: The statements, opinions and data contained in all publications are solely those of the individual author(s) and contributor(s) and not of MDPI and/or the editor(s). MDPI and/or the editor(s) disclaim responsibility for any injury to people or property resulting from any ideas, methods, instructions or products referred to in the content. |
© 2025 by the authors. Licensee MDPI, Basel, Switzerland. This article is an open access article distributed under the terms and conditions of the Creative Commons Attribution (CC BY) license (http://creativecommons.org/licenses/by/4.0/).


