1. Introduction
The progressive neuroinflammation observed in aging and neurodegenerative diseases such as Alzheimer’s disease (AD) is increasingly linked to both functional and morphological changes in glial cells. Microglia and astrocytes are central to maintaining central nervous system (CNS) homeostasis and respond dynamically to pathological stimuli, including β-amyloid (Aβ) accumulation [
1]. One of the key regulatory pathways influencing glial function is mediated by transforming growth factor-beta (TGF-β), particularly via SMAD signaling [
2,
3]. However, it remains unclear how this pathway—especially the phosphorylation and distribution of SMAD proteins—changes in glia during aging and AD. The present study addresses this gap by examining glial morphology and intracellular TGF-β signaling in aged and APP/PS1 mice, with a focus on phosphorylated SMAD localization.
AD poses a growing global health challenge. Since 1990, its incidence and prevalence have risen markedly, and projections indicate a continued increase through 2040 [
4]. The disease typically begins decades before clinical symptoms: biomarkers such as Aβ and neurofilament light chain may rise as early as 20 years prior to diagnosis [
5,
6]. Recent work has expanded our understanding of AD pathogenesis to include not only protein aggregation but also synaptic dysfunction and altered synaptic plasticity [
7].
Aβ peptides—especially the aggregation-prone Aβ₄₂—arise from sequential cleavage of amyloid precursor protein (APP) by β-secretase (BACE1) and γ-secretase. In AD, aberrant APP processing favors Aβ overproduction, leading to self-assembly into soluble oligomers, protofibrils, and eventually extracellular plaques. These species impair synaptic plasticity, disrupt neuronal calcium homeostasis, and trigger inflammatory cascades [
8] .
In addition to direct amyloid toxicity, increasing evidence implicates neuroinflammation as a driver of both the onset and progression of AD [
9]. Neuroinflammation involves activation of the brain’s innate immune system in response to stimuli such as misfolded or aggregated proteins [
10]. A key consequence is disruption of the blood–brain barrier, enabling infiltration of peripheral immune cells and, in some cases, pathogens into the CNS. This phenomenon occurs not only in AD but also during normal aging, where low-grade inflammation may create a permissive environment for pathology. In amyloid contexts, inflammation both responds to and exacerbates disease processes [
11].
Microglia are the brain’s resident immune cells, responsible for continuous surveillance of the CNS microenvironment. In their homeostatic state, they support neuronal function through synaptic pruning, debris clearance, and release of trophic factors. Upon encountering pathological stimuli—such as aggregated Aβ—microglia undergo profound morphological and transcriptional changes, shifting from a ramified, surveillant state to an activated phenotype. This activation is accompanied by altered motility, increased phagocytic capacity, and secretion of pro- and anti-inflammatory mediators.
While acute microglial activation can be protective—facilitating removal of harmful aggregates—chronic activation is associated with sustained inflammation, oxidative stress, and synaptic dysfunction. In AD, microglial activation clusters spatially around Aβ plaques, where cells adopt specialized phenotypes to engage with the aggregated material. Emerging evidence suggests that microglial responses are highly heterogeneous, encompassing both beneficial and detrimental effects on disease progression depending on activation state, local environment, and signaling cues such as TGF-β [
3].
TGF-β, in particular TGF-β1, is a key regulator of microglial development, homeostasis and reactivity in the central nervous system. TGF-β1 signaling is required for proper microglial maturation and for maintaining a homeostatic, non-inflammatory phenotype in the adult brain, and disruption of TGF-β signaling in microglia leads to abnormalities in microglial number, morphology and gene expression, as well as neurodegeneration [
2,
12]. In AD, however, TGF-β signaling becomes dysregulated: ligand and receptor levels are altered, and downstream SMAD signaling is modified in ways that can both limit and promote neuroinflammatory responses and amyloid pathology [
13]. How canonical TGF-β/SMAD2/3 and BMP/SMAD1/5/8 branches are differentially engaged or impaired in microglia during amyloid-β pathology remains poorly understood and is a key focus of the present study.
In the canonical TGF-β pathway, signal propagation critically depends on the nucleo-cytoplasmic shuttling of SMAD proteins. In the resting state, R-SMADs continuously cycle between cytoplasm and nucleus, with the equilibrium biased toward the cytoplasm, whereas SMAD4 is more evenly distributed. Ligand-induced phosphorylation of R-SMADs promotes formation of SMAD2/3–SMAD4 or SMAD1/5/8–SMAD4 complexes, which accumulate in the nucleus and, together with additional transcription factors, drive target gene transcription. Nuclear export requires complex dissociation and dephosphorylation of R-SMADs, a comparatively slow step that favors transient nuclear accumulation of pSMADs under physiological conditions. Consequently, alterations in the balance between cytoplasmic and nuclear pSMAD provide a sensitive readout of disturbed TGF-β/SMAD signaling in aging and neurodegeneration [
14,
15].
Single-cell transcriptomic studies have identified a unique microglial phenotype—disease-associated microglia (DAM)—in neurodegenerative diseases [
16]. DAM show downregulation of homeostatic genes (e.g.,
P2ry12,
Tmem119) and upregulation of genes linked to phagocytosis, lipid metabolism, and inflammatory signaling (e.g.,
Apoe,
Trem2,
Tyrobp) [
17]. DAM activation proceeds in two stages: an initial
Trem2-independent phase, followed by a
Trem2-dependent phase that enhances the microglial response to aggregated proteins such as Aβ and hyperphosphorylated tau. While DAM may aid clearance of pathological aggregates, they also contribute to chronic inflammation and synaptic dysfunction [
18].
The APP/PS1 transgenic mouse model expresses human mutant APP (the Swedish mutation K670N/M671L) and mutant presenilin-1 (PS1; e.g., L166P or M146L). These mutations increase β-secretase cleavage, enhance Aβ₄₂ production, and accelerate amyloid deposition [
19]. APP/PS1 mice develop cortical and hippocampal plaques from 6–7 months onward, accompanied by activated microglia, astrocytosis, and an inflammatory milieu. They also display synaptic and cognitive deficits—including impaired long-term potentiation (LTP) and spatial learning—before major neuronal loss [
20]. Notably, DAM-like phenotypes emerge alongside amyloid deposition, making APP/PS1 mice well-suited to studying both amyloid-driven and immunological components of AD [
21].
By combining morphological analysis of glia with intracellular mapping of phosphorylated SMAD proteins in aged and APP/PS1 brains, this study aims to clarify whether age- and disease-related inflammatory environments alter TGF-β signaling in ways that could contribute to AD progression.
4. Discussion
This study demonstrates that aging and amyloid-β pathology jointly reshape microglial structure and signaling, with convergent effects on TGF-β/SMAD pathways and disease-associated gene expression. At the morphological level, we observe a progressive simplification of microglial arborization in aged and APP/PS1 mice, characterized by reduced branch points, endpoints and ramification index. Young microglia display a highly ramified, surveillant morphology, whereas microglia in 24-month WT and APP/PS1 animals adopt a more compact, hypertrophic shape with shorter and fewer processes. Notably, the extent of morphological simplification in APP/PS1 microglia does not markedly exceed that of age-matched WT animals, indicating that aging alone drives substantial structural remodeling of the microglial network. These findings align with the concept of “inflammaging”, in which age-related low-grade inflammation and chronic stress gradually erode the homeostatic microglial phenotype and lower the threshold for pathological activation [
27].
Despite broadly similar morphology, prior transcriptomic work has shown that microglia in APP/PS1 models diverge functionally from aged WT counterparts, acquiring a distinct DAM profile characterized by upregulation of
Trem2, Apoe, Itgax and
Cst7 and loss of homeostatic markers such as
P2ry12 and
Tmem119 [
17]. Our data are consistent with this view. The increased density of Iba-1⁺ microglia in 24-month APP/PS1 cortex (
Figure 2), together with their plaque-associated, hypertrophic morphology, suggests that aging provides the structural substrate onto which amyloid pathology imprints a specialized, plaque-engaged state. The TREM2–TYROBP axis has been identified as a central driver of this transition, integrating lipid and damage-associated cues and promoting phagocytic, DAM-like programs [
28,
29]. It is therefore plausible that, even in the presence of similar arbor simplification, APP/PS1 microglia are functionally distinct from aged WT cells due to additional TREM2-dependent reprogramming in the amyloid niche.
At the level of TGF-β signaling, we find clear evidence for disease-related alterations. Microglial TGF-β1 protein levels are highest in 24-month APP/PS1 mice, indicating that plaque-engaged microglia are exposed to enhanced TGF-β ligand availability [
29]. Our analysis of TGF-β pathway activity revealed more complex changes downstream. In cortical microglia, pSMAD2 immunoreactivity displays a predominantly cytoplasmic distribution in the aged AD-group, with comparatively weaker nuclear accumulation.
Quantitative analysis of nuclear versus cytoplasmic pSMAD2 CTCF supports a model of impaired nuclear translocation: despite robust cytoplasmic signal and local enrichment around plaques, nuclear pSMAD2 remains relatively low in aged APP/PS1 microglia. Together with the increased TGF-β1 and TGFBR2 expression observed in plaque-associated microglia, this pattern suggests a decoupling between strong upstream pathway activation and incomplete canonical nuclear SMAD2 output.
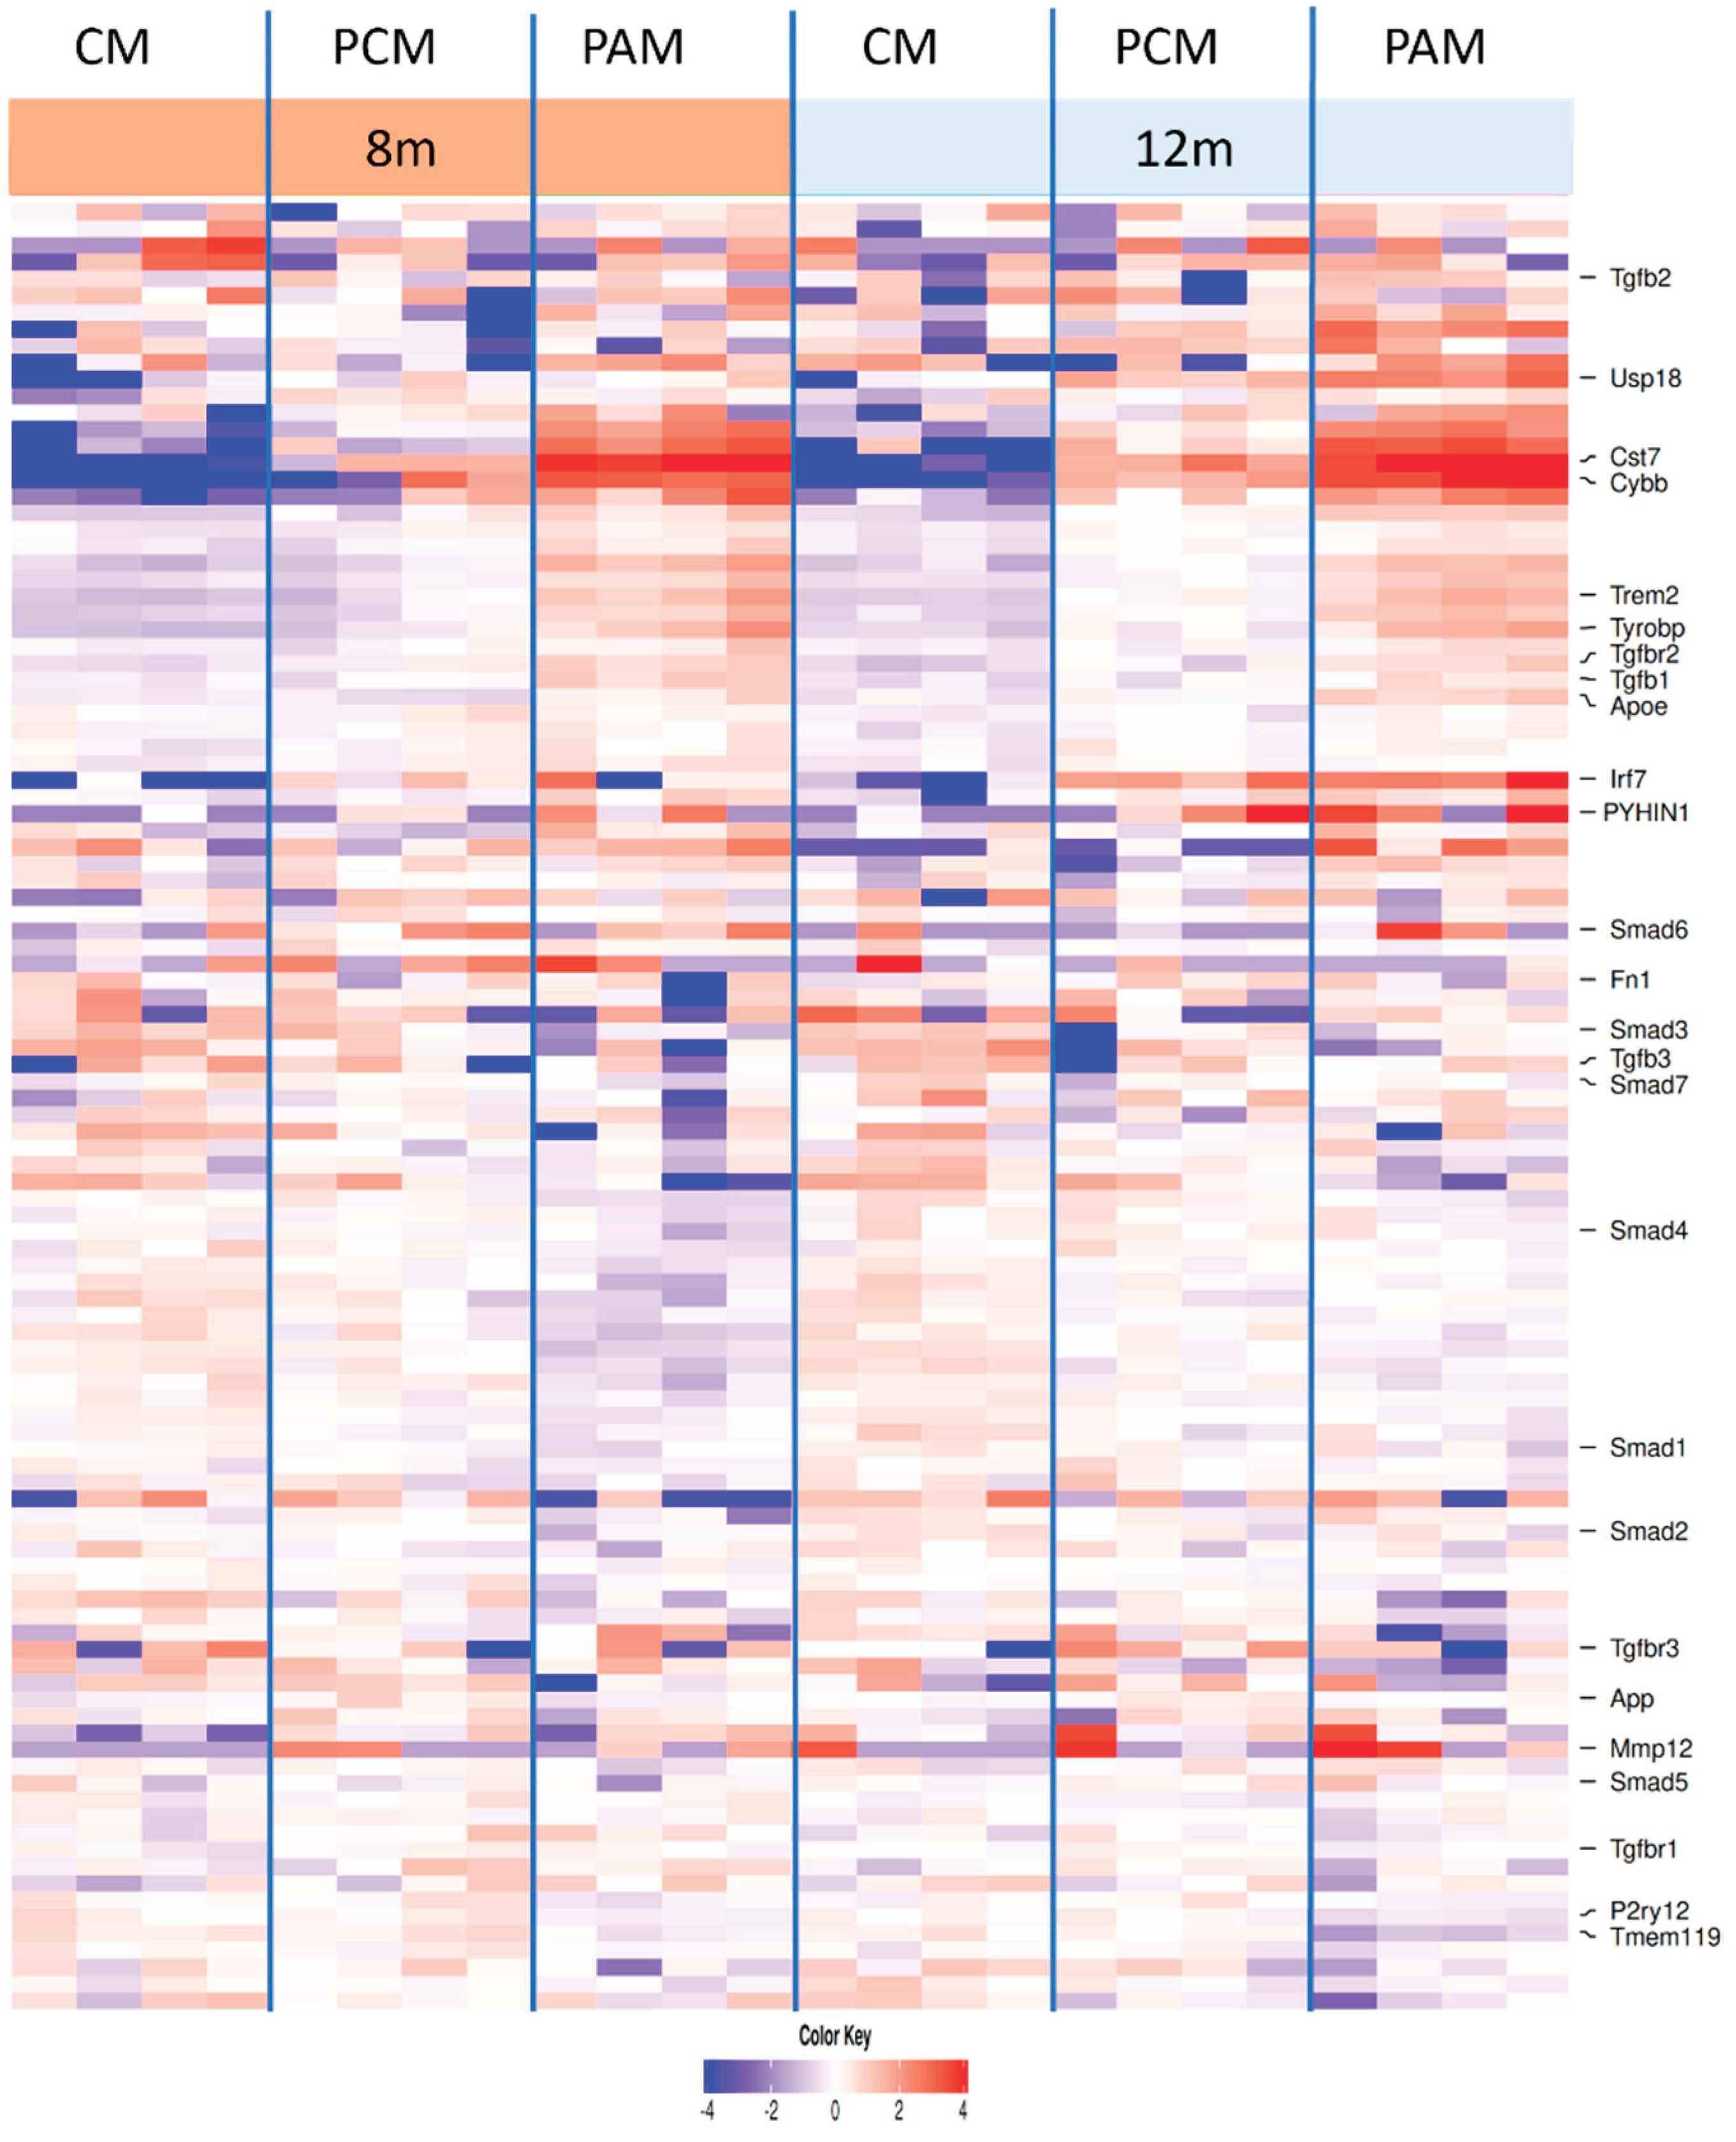
Our re-analysis of the Hemonnot-Girard bulk RNA-seq dataset provides independent support for this interpretation [
26]. Focusing on microglial subclusters classified as CM, PCM and PAM at different disease stages, we find that PAM adopt a robust DAM-like transcriptional signature characterized by loss of homeostatic genes (
P2ry12, Tmem119), strong induction of
Apoe, Trem2, Tyrobp and
Cst7, and increased expression of
Tgfb1 and
Tgfbr2 relative to CM and PCM. Thus, plaque-associated microglia appear to experience high TGF-β ligand and receptor availability in parallel with a full DAM program [
29,
30].
At the same time, canonical SMAD composition is subtly altered: while several SMAD family members (
Smad1, Smad2, Smad5) remain relatively stable or show only modest increases,
Smad3 tends to be reduced in PAM compared with CM and PCM (
Figure 8). Given the critical role of SMAD3 as an R-SMAD in the canonical TGF-β pathway, its relative depletion provides a plausible transcriptional correlate of the reduced nuclear pSMAD2 accumulation observed histologically.
Taken together, these data support a model in which plaque-associated microglia receive strong TGF-β input (increased
Tgfb1, Tgfbr2, robust cytoplasmic pSMAD2 and peri-plaque enrichment), but transmit this signal only partially into canonical nuclear SMAD2/3-dependent transcription, in part due to altered SMAD3 availability [
31]. In this scenario, TGF-β signaling may be sufficient to sustain aspects of the DAM phenotype and limit overt cytotoxicity, but insufficient to fully engage the homeostatic, anti-inflammatory and synapse-supporting programs typically associated with microglial TGF-β signaling in the healthy brain.
The selective vulnerability of the SMAD2/3 branch contrasts with our observations on pSMAD1/5/8. Both cytoplasmic and nuclear pSMAD1/5/8 levels are significantly elevated in microglia from 24-month WT and APP/PS1 mice compared with young WT animals, yet the nuclear-to-cytoplasmic ratio remains unchanged across groups. This indicates that aging and amyloid pathology globally increase SMAD1/5/8 signaling in microglia, while preserving the balance between cytoplasmic and nuclear localization. Given that SMAD1/5/8 are classically associated with BMP rather than TGF-β ligands, this pattern suggests that the BMP–SMAD axis remains functionally competent and may even be upregulated in the aged and amyloid-bearing cortex [
32,
33]. Enhanced SMAD1/5/8 activity could support tissue remodeling or survival responses, but it might also contribute to maladaptive matrix degradation and gliosis, depending on the downstream gene programs engaged [
34,
35]. Importantly, the preserved nuclear access of pSMAD1/5/8 argues against a global failure of SMAD trafficking and instead points to a selective impairment of the TGF-β–SMAD2/3 arm, consistent with studies showing that linker-region phosphorylation and MAPK-dependent modification of SMAD2/3 can specifically inhibit their nuclear translocation and canonical TGF-β signaling [
36].
Several mechanisms could account for this dissociation between upstream TGF-β activation and downstream SMAD2/3 function. One possibility is direct sequestration or mislocalization of SMAD proteins by pathological aggregates such as hyperphosphorylated Tau, as suggested in other tauopathy models. Another, not mutually exclusive explanation is cross-regulation by competing signaling cascades. The ERK/MAPK pathway can inhibit SMAD nuclear translocation by phosphorylating linker regions within SMAD proteins [
37], and ERK/MAPK activity is known to be increased in AD [
38]. Moreover, pharmacological inhibition of EGFR/MAPK signaling reduces pro-inflammatory microglial activation in experimental systems [
39].
In plaque-associated microglia, where we observe strong DAM activation, upregulation of interferon-related genes (
Irf7, Usp18, Pyhin1), increased expression of proteolytic and matrix-remodeling factors such as
Mmp12, and lipid-associated genes including
Apoc1, it is conceivable that MAPK and interferon pathways compete with or override canonical TGF-β–SMAD2/3 signaling [
40,
41]. Reduced SMAD activity would then not solely reflect intrinsic defects in the TGF-β pathway, but also the influence of these converging pro-inflammatory networks.
Our findings therefore place TGF-β/SMAD signaling into a broader context of microglial state transitions in aging and AD. Aging alone induces morphological simplification and increases overall SMAD1/5/8 activity, while preserving a more homeostatic transcriptomic profile. The addition of amyloid pathology drives microglia into a PAM/DAM state with pronounced TREM2–TYROBP activation, interferon signaling, lipid remodeling and upregulated TGF-β ligand and receptor expression. Within this state, the canonical TGF-β–SMAD2/3 axis appears to be partially uncoupled, with high upstream input but incomplete nuclear output. This imbalance may stabilize a chronically reactive, plaque-engaged phenotype that is only partially restrained by endogenous anti-inflammatory and pro-homeostatic signals.
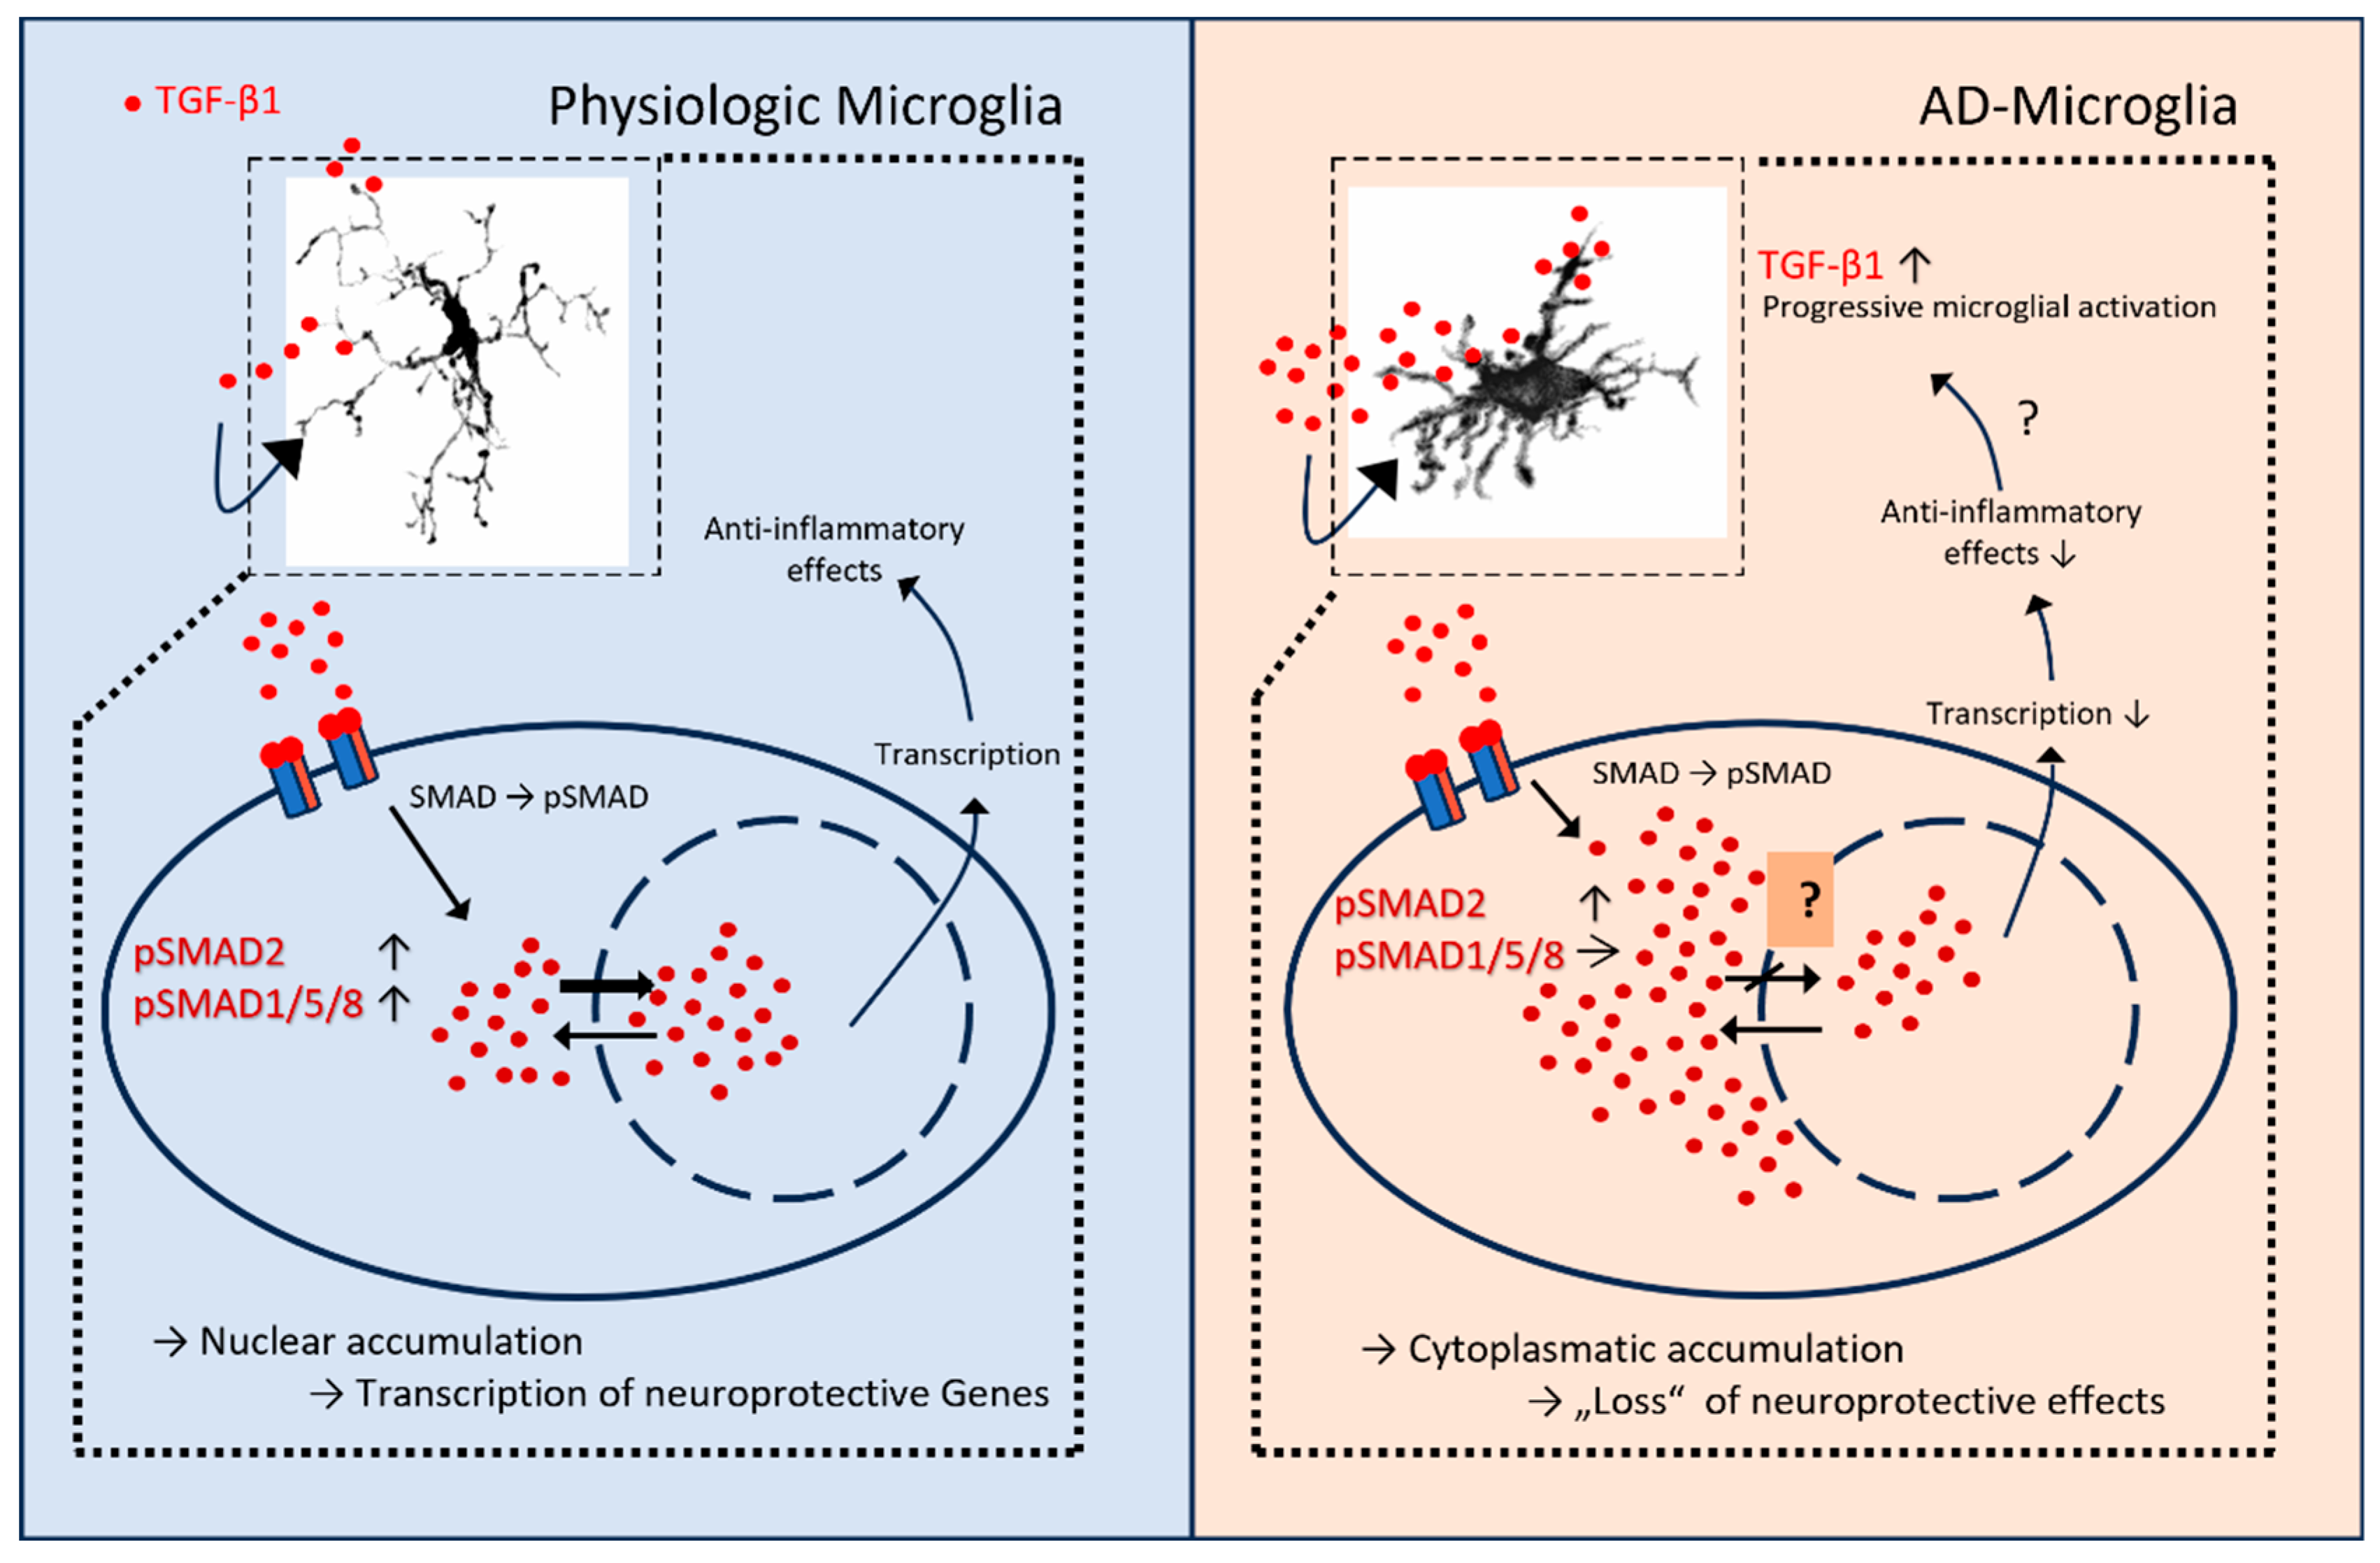
Figure 9.
Proposed model of TGF-β/SMAD signaling in physiologic versus AD microglia. Left, physiologic microglia: TGF-β1 engages its receptors, leading to SMAD phosphorylation and balanced nuclear accumulation of pSMAD2 and pSMAD1/5/8. Nuclear SMAD complexes cooperate with transcription factors to drive neuroprotective, anti-inflammatory gene programs. Right, AD microglia: despite increased extracellular TGF-β1 and receptor engagement, pSMAD2 shows predominant cytoplasmic retention with comparatively weaker nuclear accumulation, resulting in reduced transcriptional output and diminished anti-inflammatory effects; pSMAD1/5/8 remains detectable. Insets depict representative microglial morphologies in the respective conditions. Arrows summarize the shift from nuclear to cytoplasmic pSMAD2 and the putative loss of TGF-β-mediated neuroprotection in AD microglia. Graphic was designed with Microsoft Power Point.
Several limitations of our study should be acknowledged. First, our morphological and signaling analyses are based on a relatively small number of animals and a cross-sectional design, which precludes firm conclusions about temporal causality between amyloid deposition, TGF-β signaling changes, and microglial remodeling. Second, our quantification of pSMAD localization relies on immunofluorescence and corrected total cell fluorescence; while informative, this approach cannot fully capture dynamic signaling kinetics or resolve microglial subpopulations beyond Iba-1 positivity. Third, our transcriptomic conclusions are derived from re-analysis of a published single-cell dataset; although this dataset is well annotated and highly informative, it represents one specific APP/PS1 model and may not encompass the full spectrum of microglial states across brain regions and disease stages. Finally, we did not directly manipulate TGF-β/SMAD or MAPK pathways in vivo, so the causal contribution of these signaling changes to microglial function and neurodegeneration remains to be established.
Despite these limitations, our combined structural, signaling and transcriptomic analyses highlight morphological degeneration and altered TGF-β/SMAD signaling in microglia as key features of the aged and Alzheimer’s brain. Plaque-associated microglia emerge as structurally simplified yet transcriptionally hyperactive cells that integrate strong TREM2–TYROBP, interferon and TGF-β inputs, but relay only an incomplete canonical SMAD2/3 response. Modulating this imbalanced signaling landscape—either by restoring effective nuclear SMAD2/3 translocation or by dampening competing pro-inflammatory cascades such as ERK/MAPK and interferon pathways—may help re-establish glial neuroprotective functions and potentially slow disease progression.
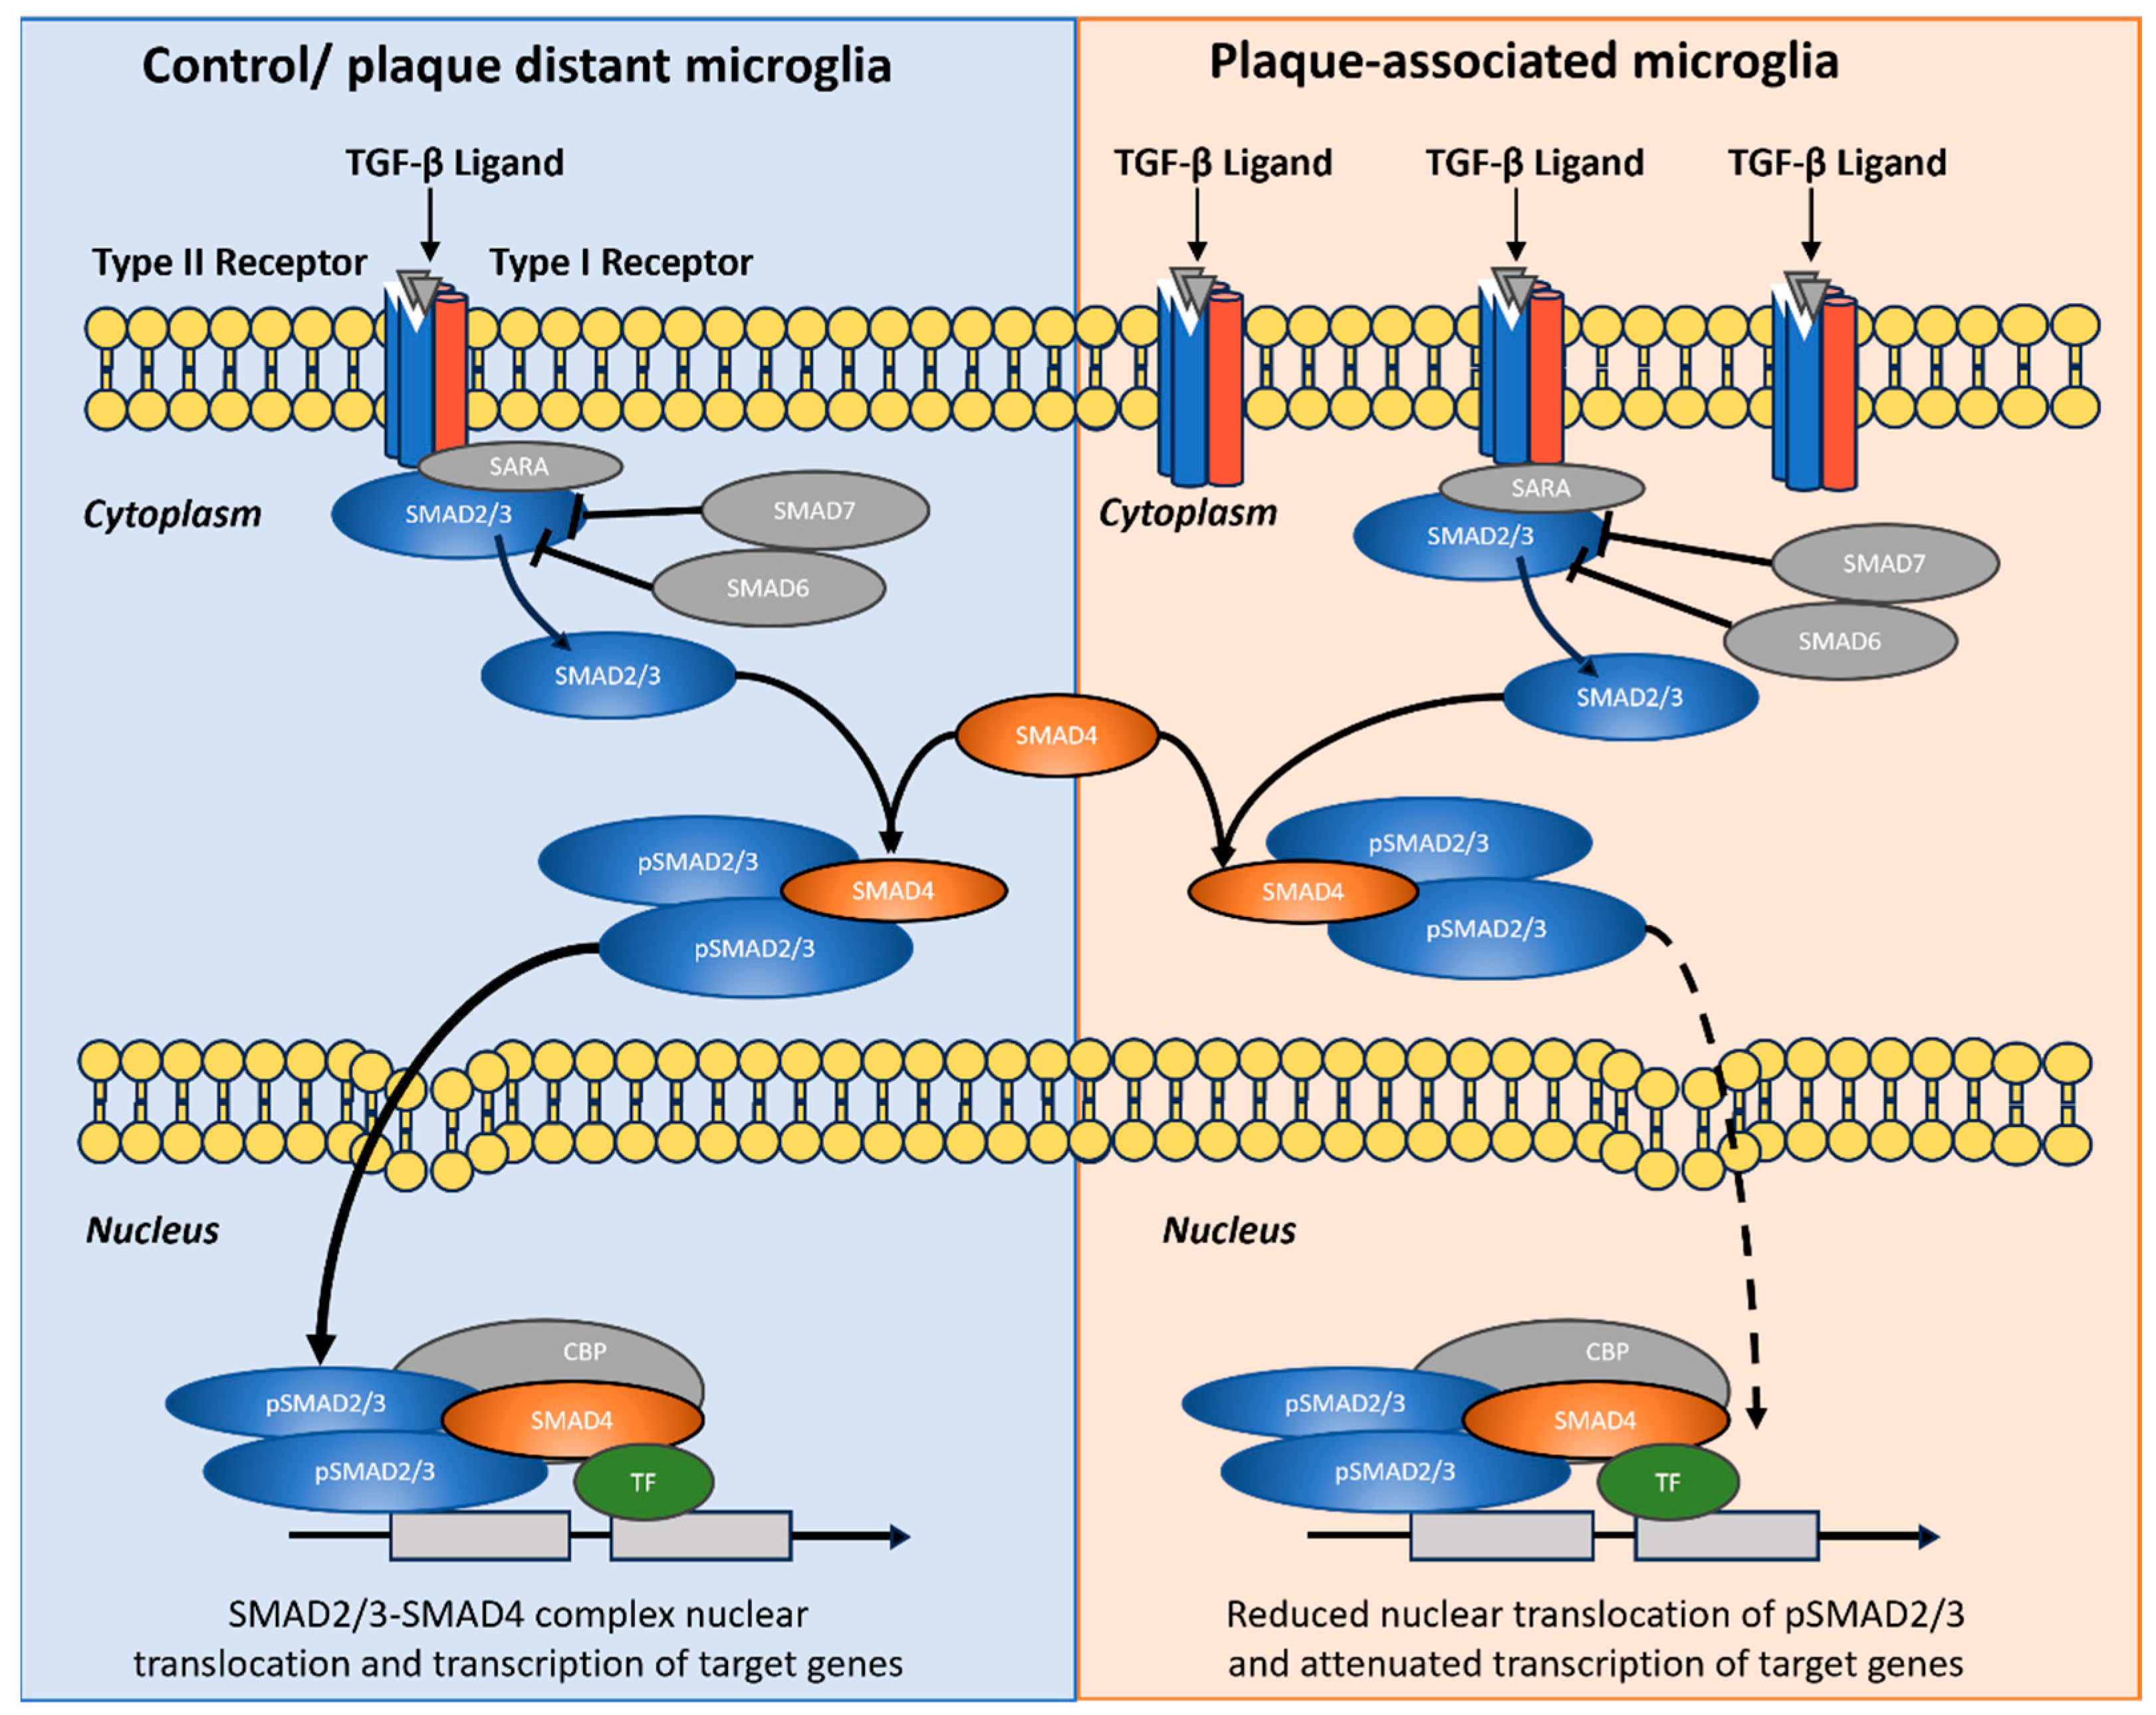
Figure 10.
Graphical summary of hypothesized role of TGF-β/SMAD2/3 signaling in control/plaque-distant microglia versus attenuated nuclear output in plaque-associated microglia. Schematic comparison of pathway organization and subcellular routing. Left (Control/plaque-distant microglia): TGF-β ligand binding to type II/I receptors recruits SMAD2/3 via SARA, leading to receptor-mediated phosphorylation (pSMAD2/3), assembly with SMAD4, nuclear translocation, and transcriptional activation with TF/CBP co-factors. Inhibitory SMADs (SMAD6/7) are shown as pathway brakes. Right (Plaque-associated microglia): Despite multiple receptor–ligand engagements at the membrane and robust cytoplasmic pSMAD2/3 formation, nuclear import of SMAD2/3–SMAD4 complexes is reduced (dashed arrow), resulting in attenuated transcriptional output. The diagram illustrates the decoupling between strong upstream activation and diminished canonical nuclear SMAD2/3 signaling in plaque-associated microglia. Graphic was designed with Microsoft Power Point.
Future work combining high-resolution morphometrics with spatial transcriptomics and targeted pathway manipulation will be essential to dissect how these intertwined signaling networks shape microglial behavior in the aging and amyloid-affected brain and to identify points of therapeutic leverage within the TGF-β/SMAD pathway.
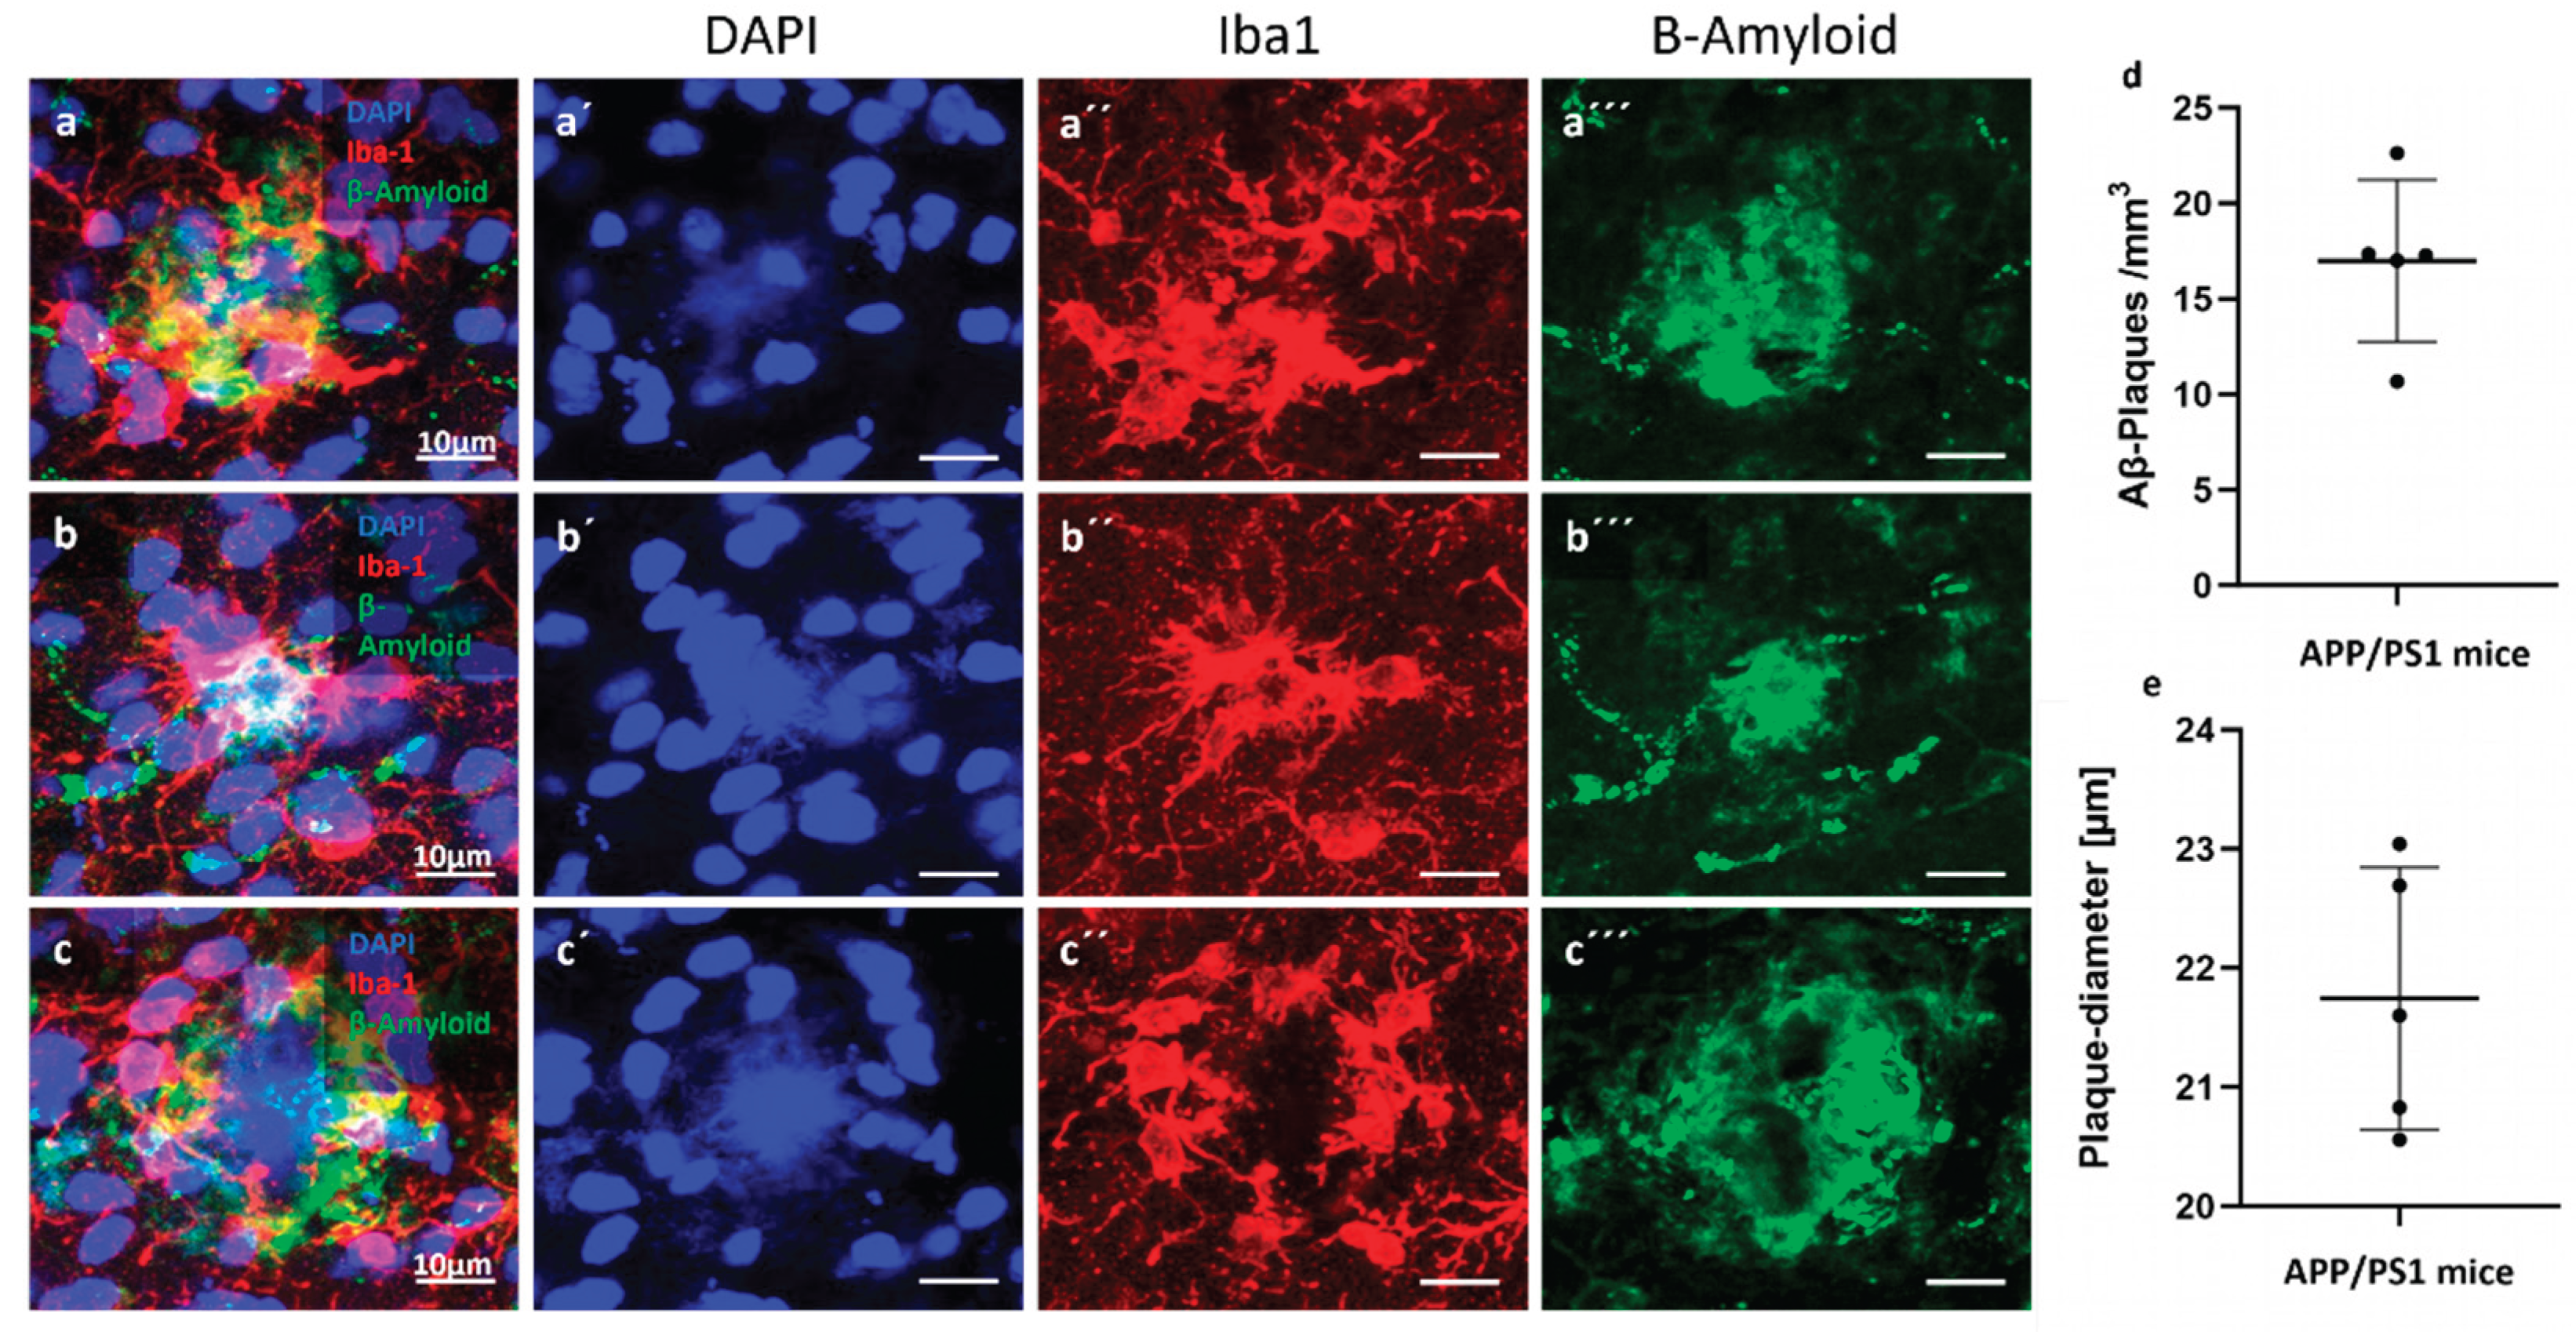
Figure 1.
Amyloid-β plaque distribution and quantification in the cortex of APP/PS1 mice. (a–c) Representative immunofluorescence images showing Aβ plaques (green) in the cortical region of 24-month-old APP/PS1 mice. Nuclei are counterstained with DAPI (blue). Microglia are stained with Iba-1 (red). (d) Density of amyloid-β (Aβ) plaques per mm³ in the cortical region of 24-month-old APP/PS1 mice. Each dot represents one animal; horizontal bars indicate the mean ± SEM. (e) Mean plaque diameter (in µm) across cortical Aβ plaques measured per animal. Data show relatively consistent plaque size with moderate variability across individuals. Measurements were obtained from immunofluorescence-labeled sections using confocal microscopy.
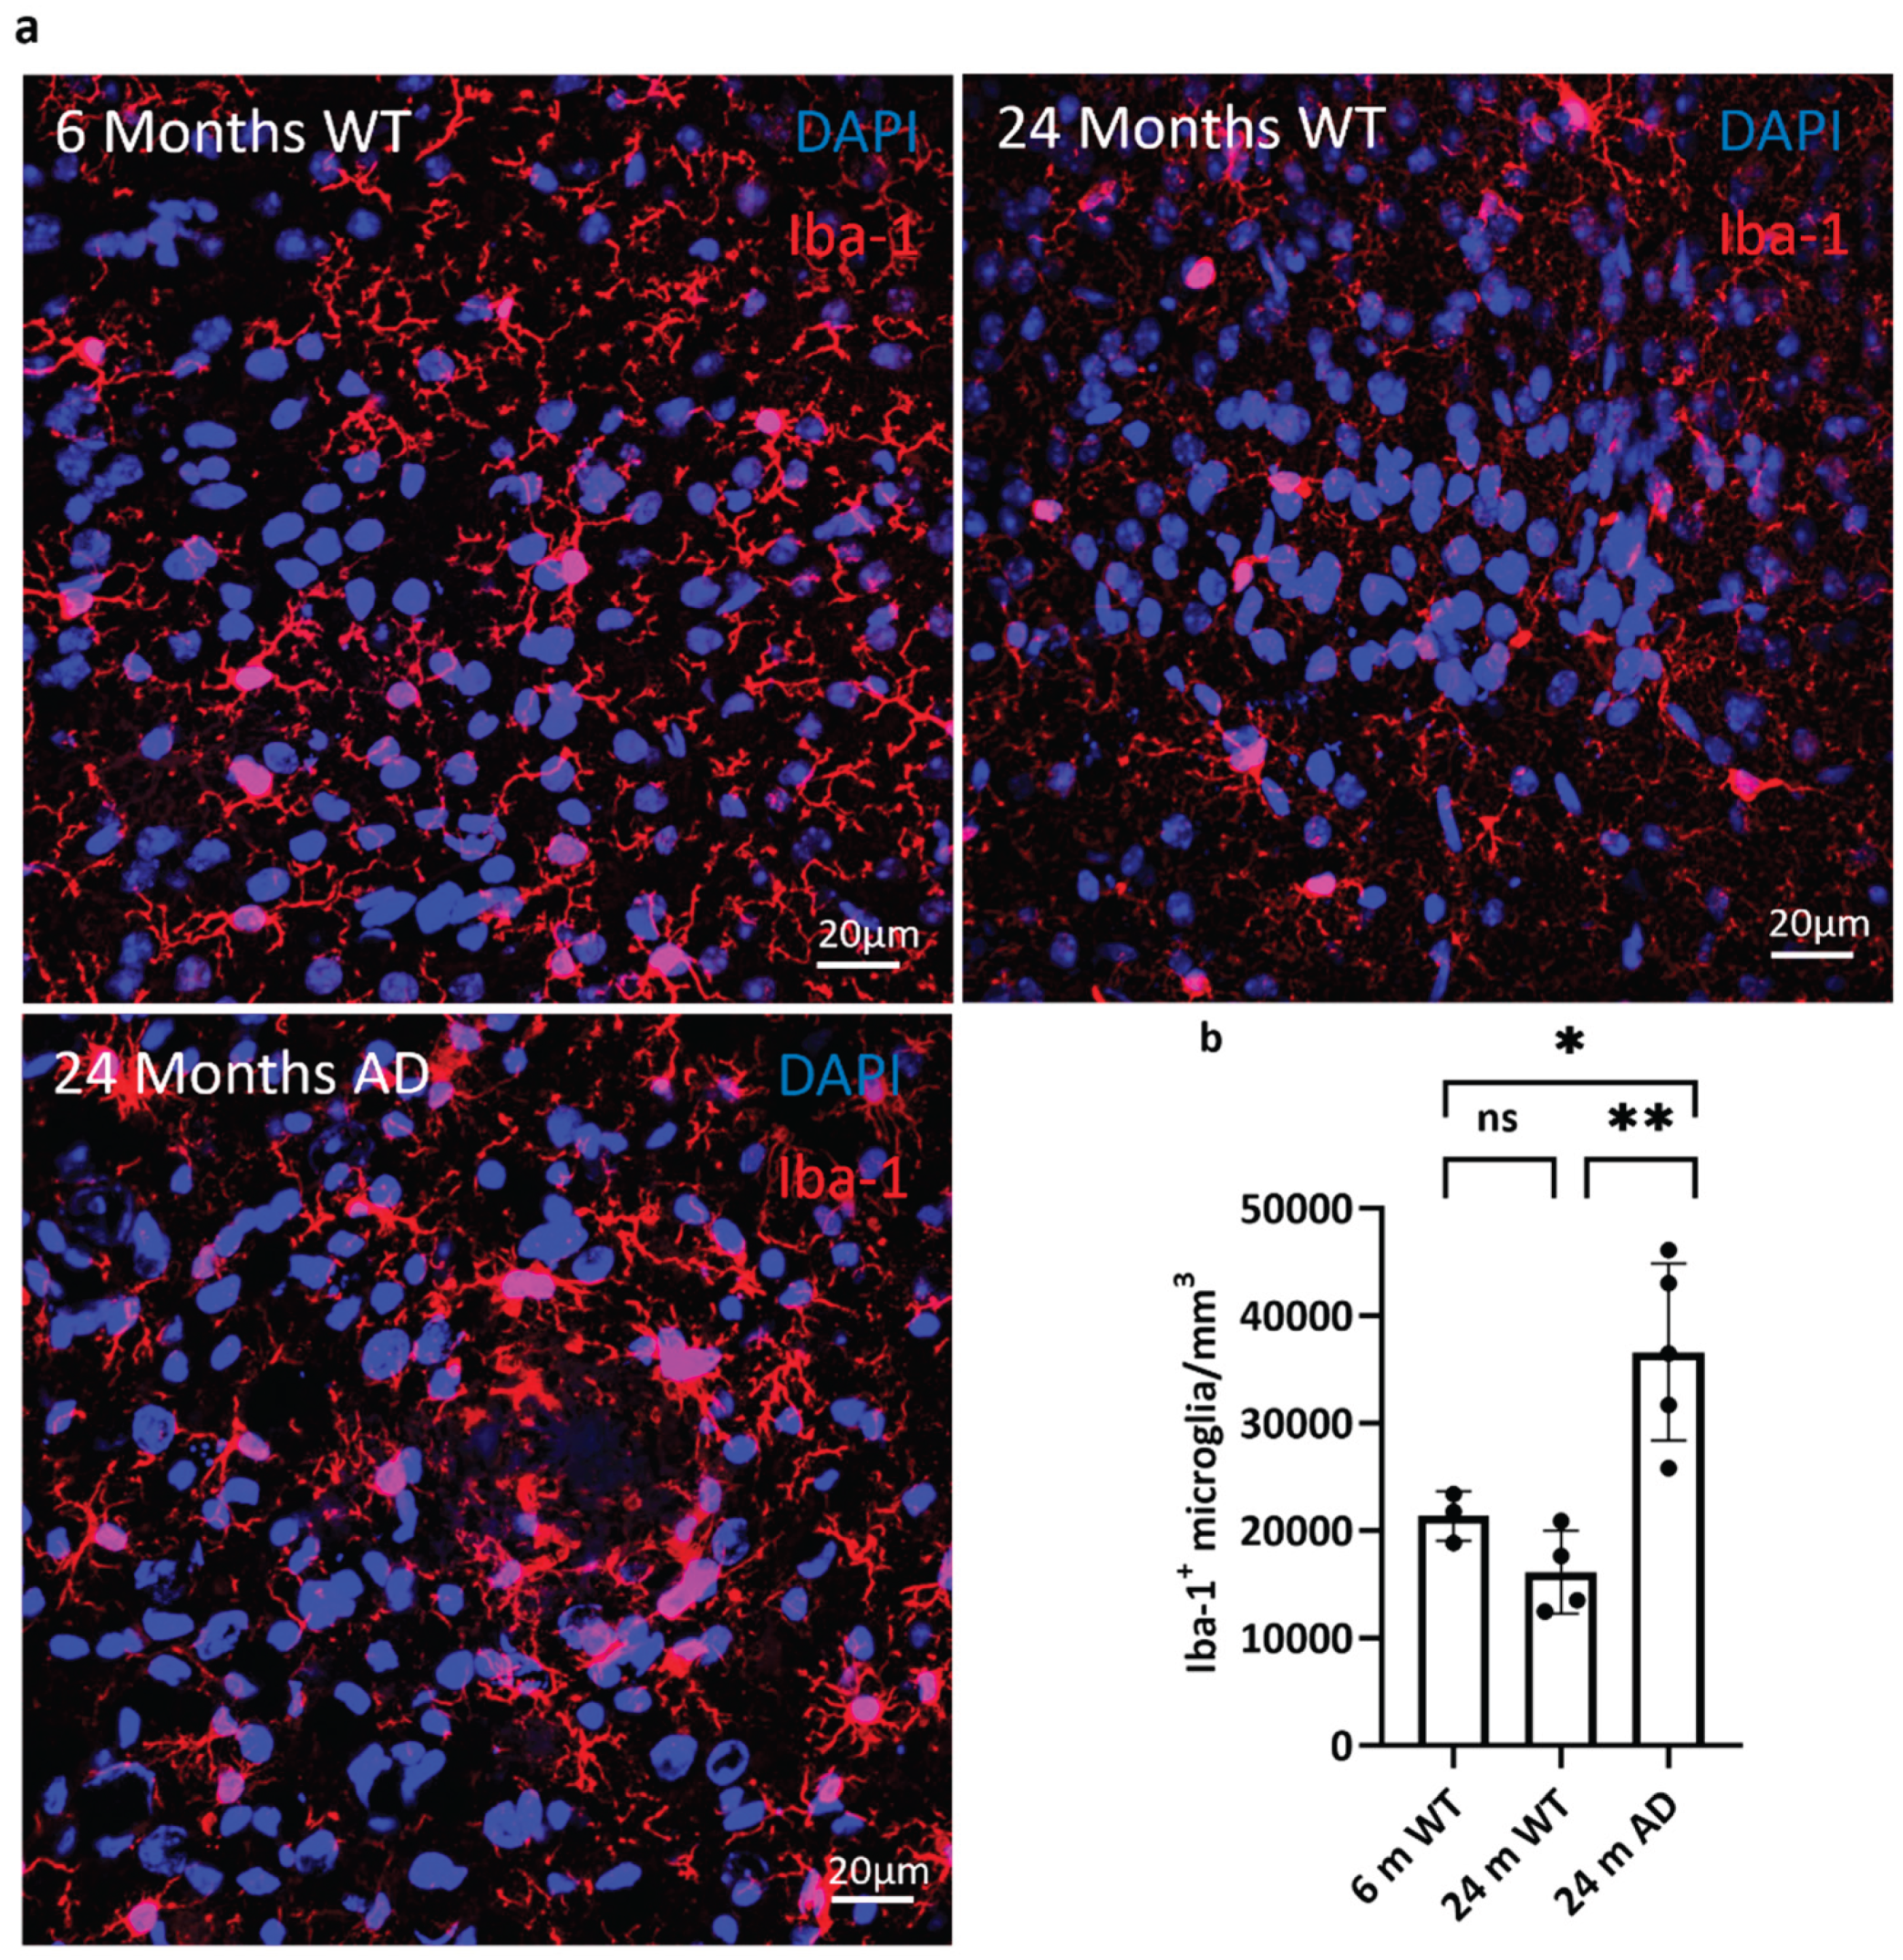
Figure 2.
Increased microglial density in the cortex of aged APP/PS1 mice. (a) Representative confocal images showing Iba-1 immunostaining (red) for microglia in the cortex of 6-month-old wild-type (WT), 24-month-old WT, and 24-month-old APP/PS1 (AD) mice. Nuclei are counterstained with DAPI (blue). Scale bar: 20 µm. An increase in Iba-1⁺ microglial density is evident in the 24-month AD group compared to age-matched controls. (b) Quantification of Iba-1⁺ microglia per mm³ reveals a significant increase in the 24-month APP/PS1 group compared to both 6-month and 24-month WT mice. Statistical significance was assessed by one-way ANOVA with Tukey’s post hoc test: p < 0.05, p < 0.01; ns: not significant; n = 3–4 per group. Data are presented as mean ± SEM.
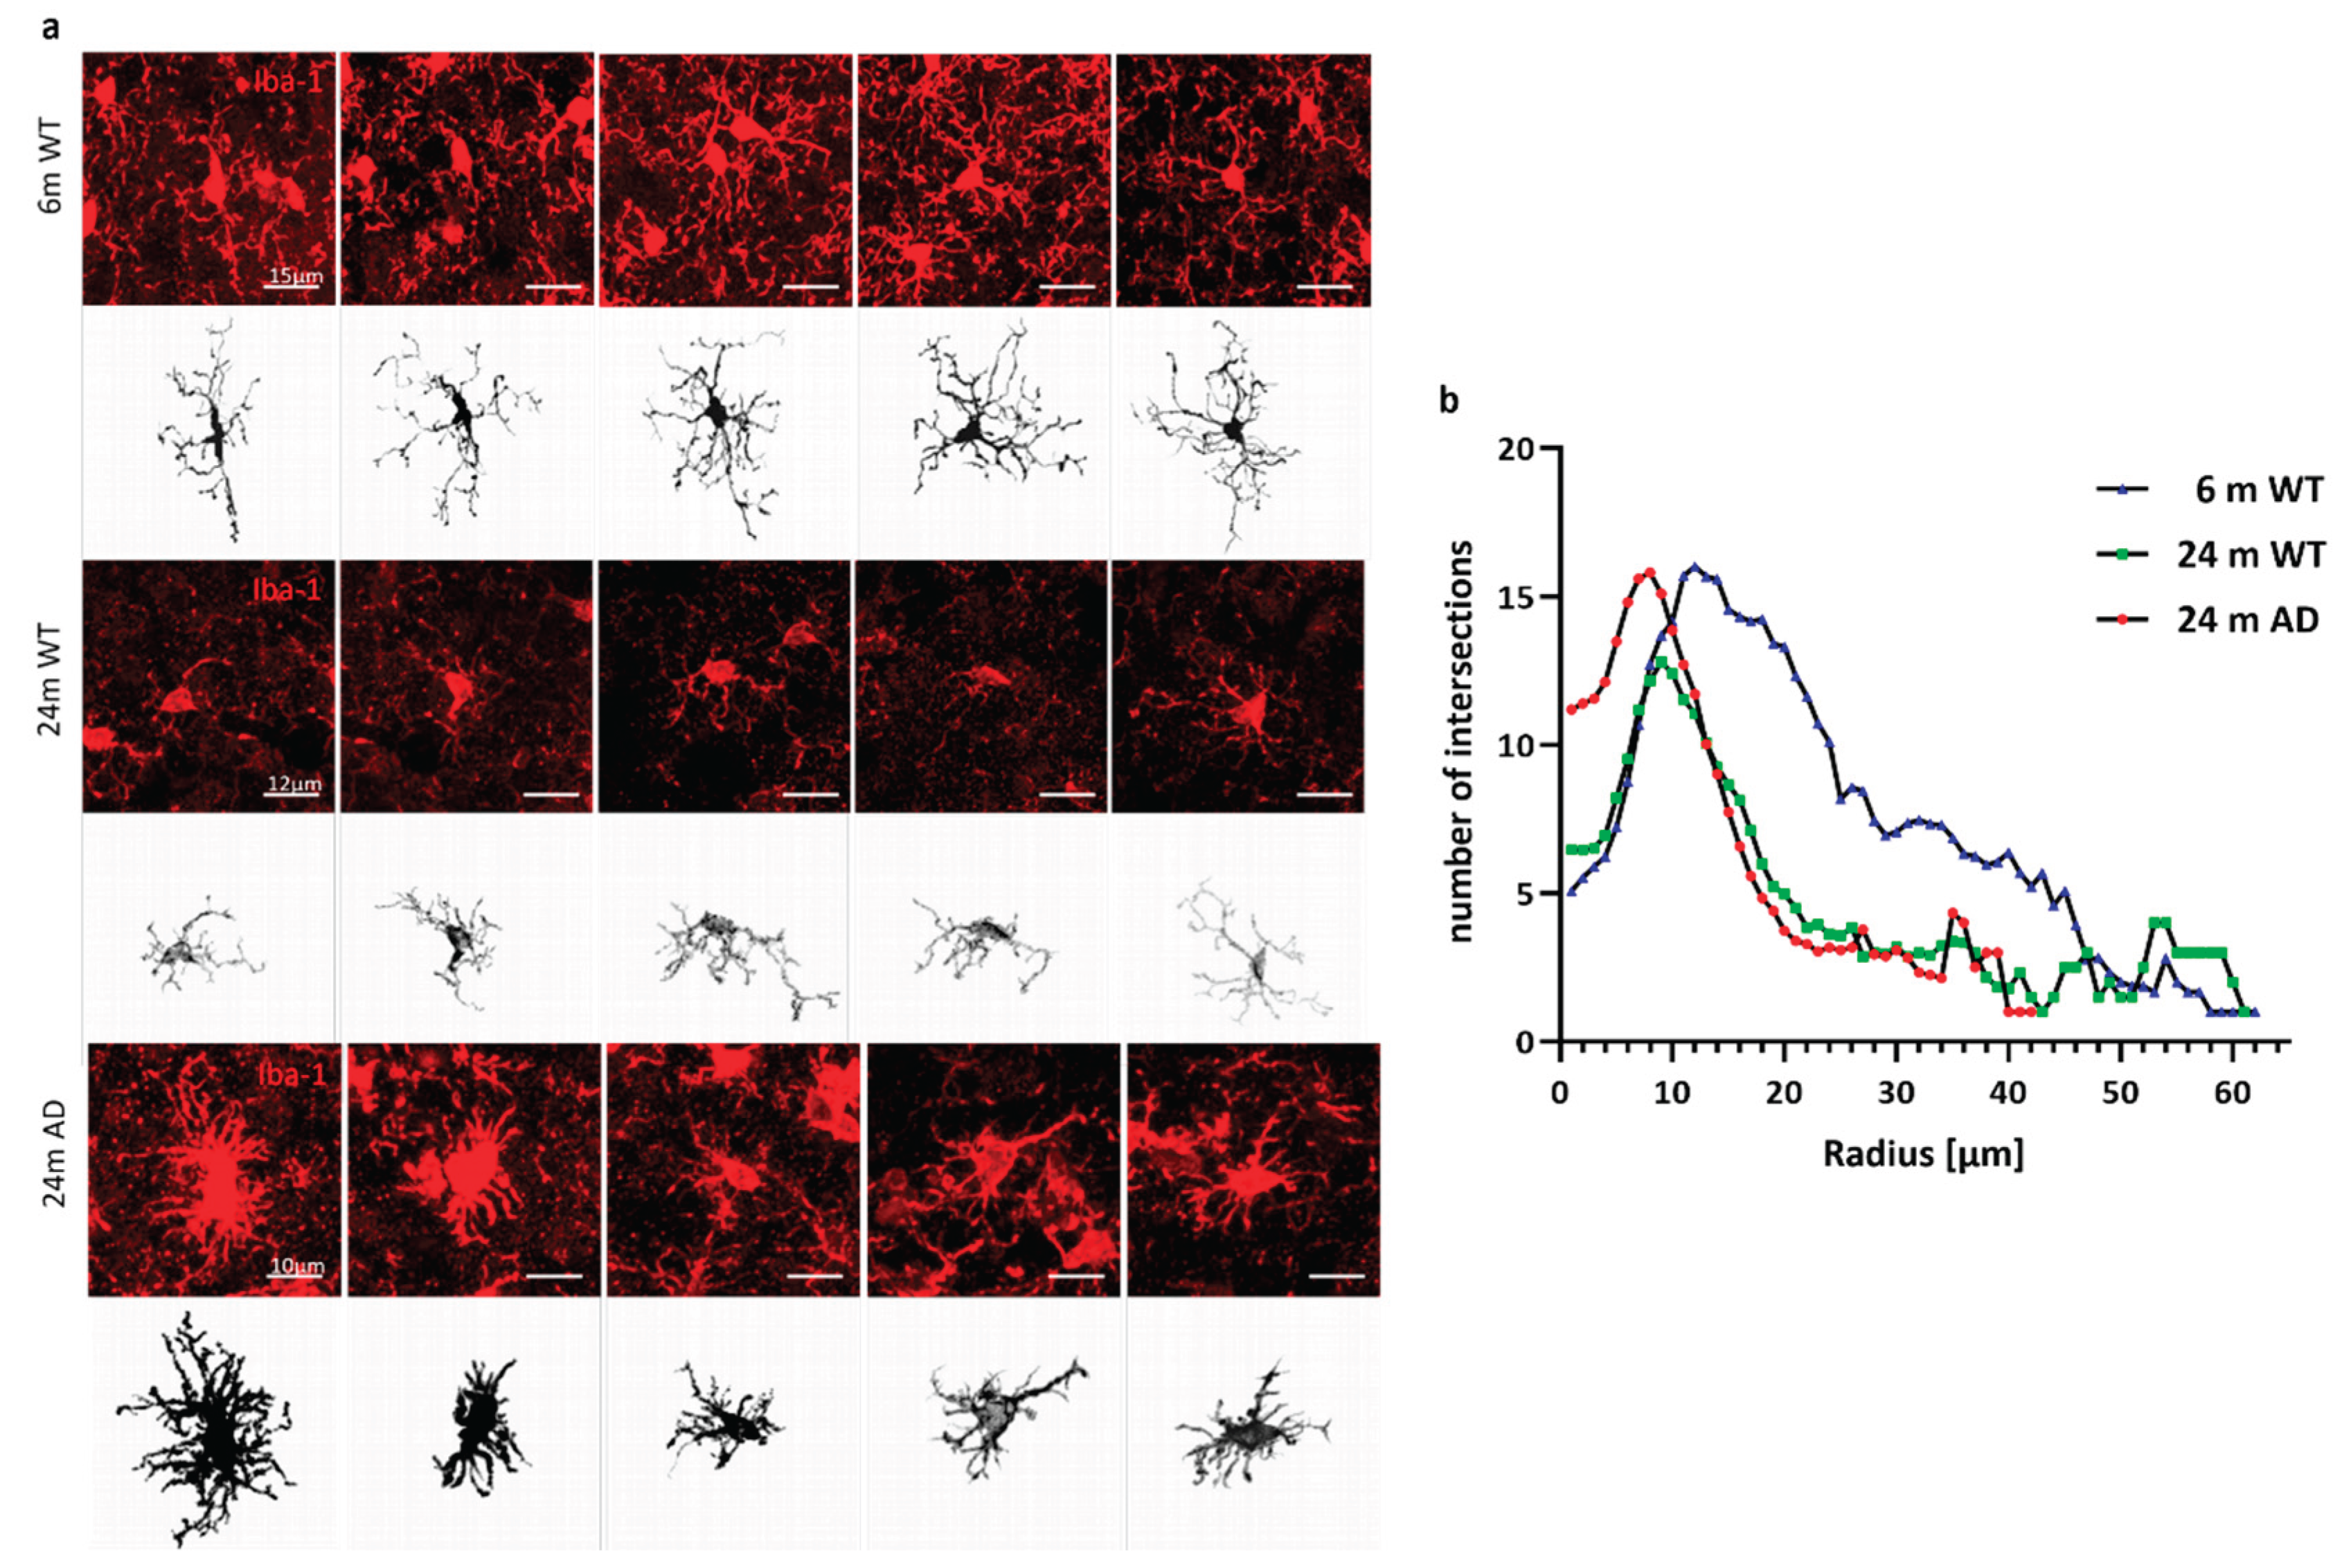
Figure 3.
Representative microglial morphologies across experimental groups. (a) Iba-1 immunostaining (red) and corresponding 3D reconstructions (black) of individual cortical microglia from 6-month-old wild-type (top rows), 24-month-old wild-type (middle rows), and 24-month-old APP/PS1 (bottom rows) mice. Scale bars: 15 µm (top), 12 µm (middle), and 10 µm (bottom). (b) Sholl analysis reveals reduced microglial arbor complexity in aged and APP/PS1 mice. Line graph showing the number of process intersections with concentric spheres (Sholl radii) at increasing distances from the soma center of microglia in 6-month-old wild-type (WT, blue), 24-month-old WT (green), and 24-month-old APP/PS1 (AD, red) mice. Data represent mean values per radius step from n ≥ 3 animals per group.
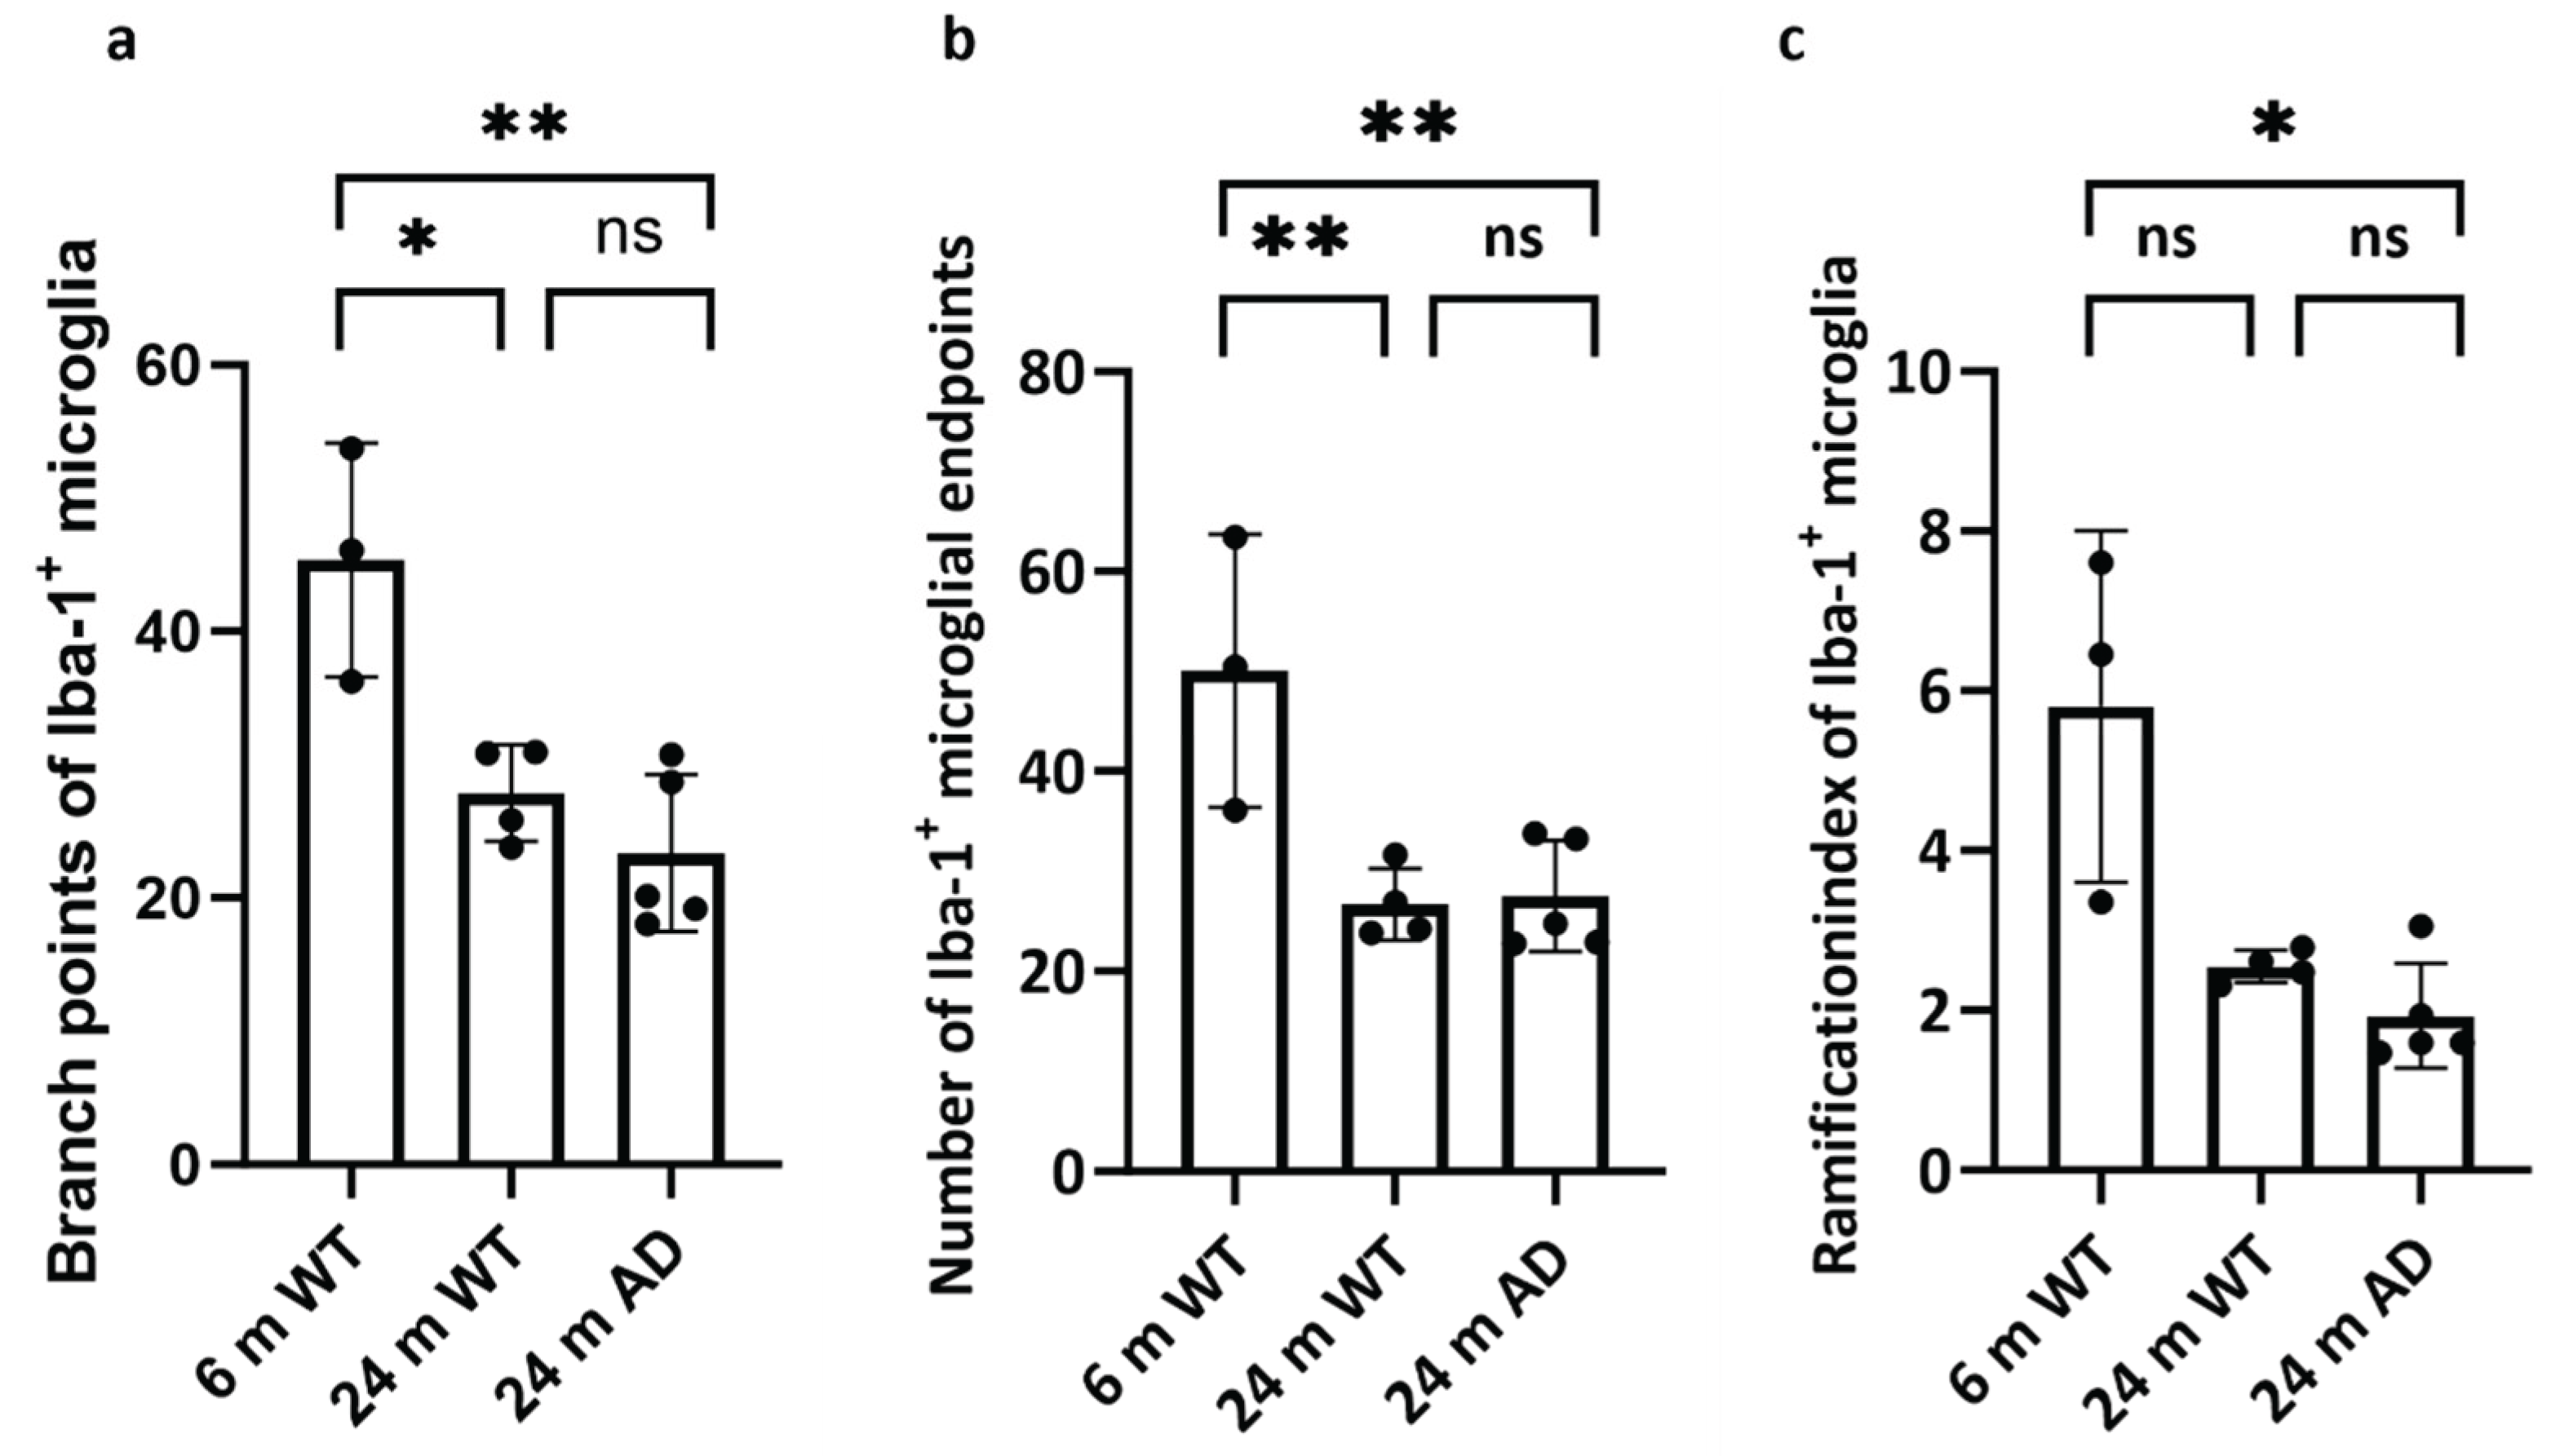
Figure 4.
Quantitative analysis of microglial morphology reveals age- and disease-associated simplification. Bar graphs showing (a) the number of branch points, (b) number of endpoints, and (c) the ramification index of individual Iba-1⁺ microglia in 6-month-old wild-type (WT), 24-month-old WT, and 24-month-old APP/PS1 (AD) mice. Statistical significance was assessed by one-way ANOVA with Tukey’s post hoc test. The ramification index of Iba-1⁺ microglia was analyzed using a Kruskal–Wallis test followed by Dunn’s multiple comparisons test, because data did not meet the assumptions of normality required for parametric testing: p < 0.05, p < 0.01, ns = not significant. Data are presented as mean ± SEM, n = 4–5 mice per group.
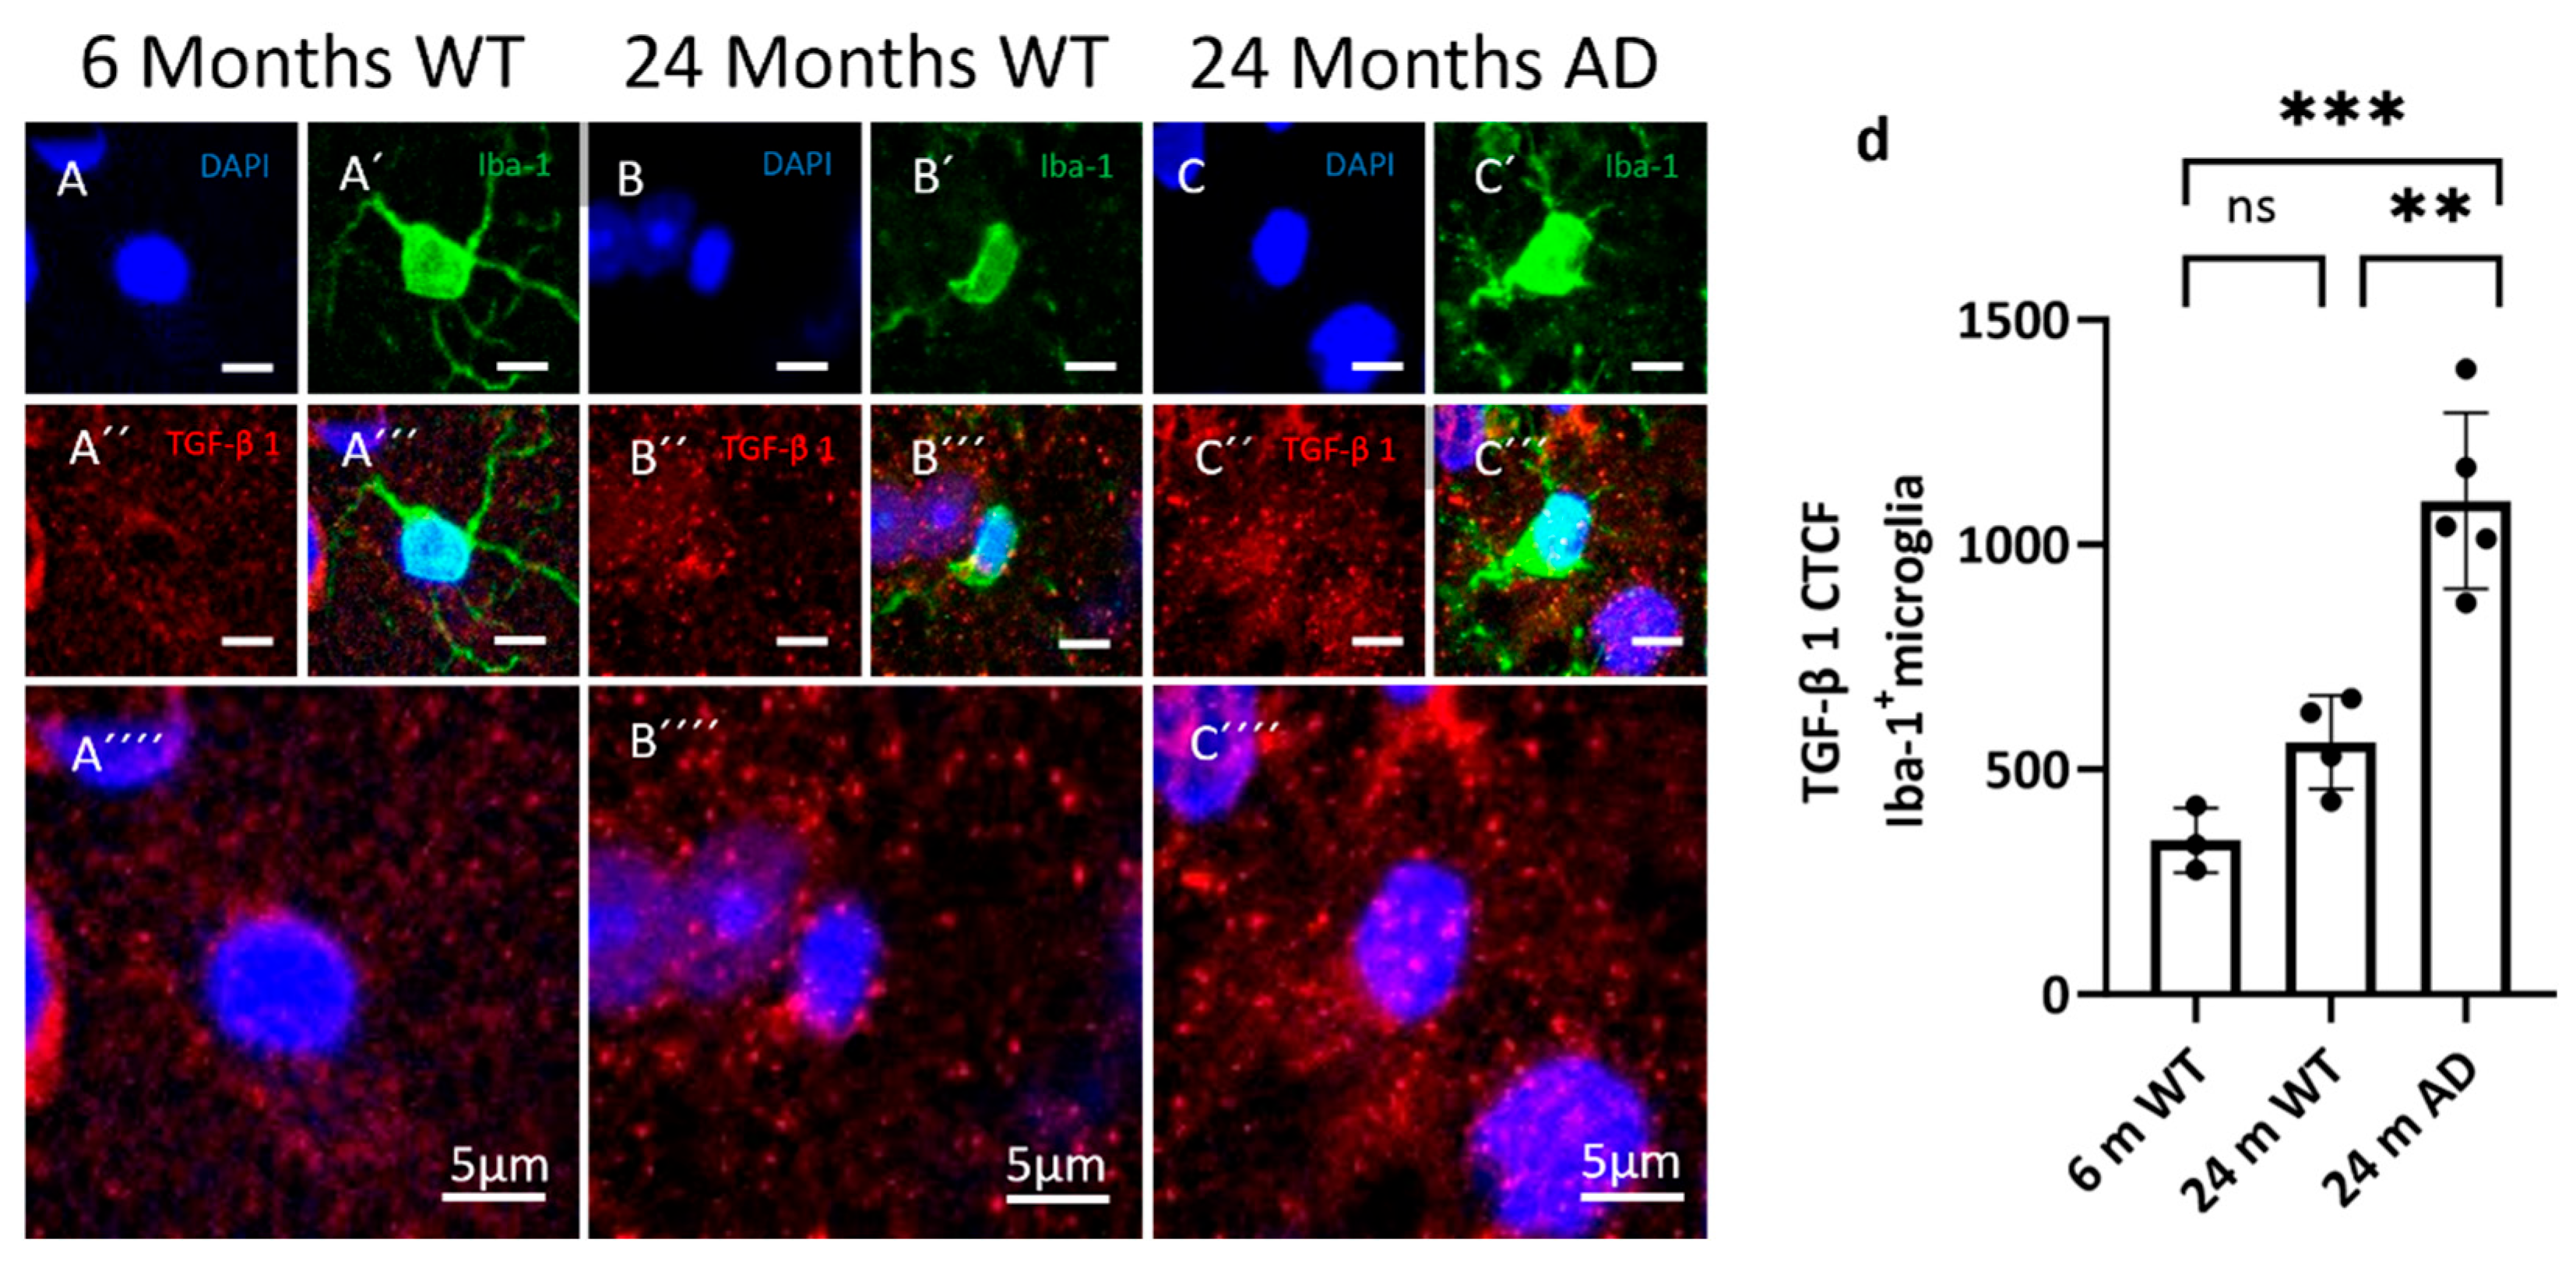
Figure 5.
Distribution of TGF-β1 in microglia. Representative confocal images from cortex showing microglia and TGF-β1 in 6-month WT, 24-month WT, and 24-month APP/PS1 mice. Iba-1 marks microglia (green, A’, B’, C’), and TGF-β1 (red, A´´, B´´, C´´), nuclei are counterstained with DAPI (blue, A, B, C). (d) Quantification of corrected total cell fluorescence (CTCF) for TGF-β1 within Iba-1⁺ microglia. Data are shown as individual animals with mean ± SEM. Statistical significance was assessed by one-way ANOVA with Tukey’s post hoc test: p < 0.01, p < 0.001; ns, not significant.
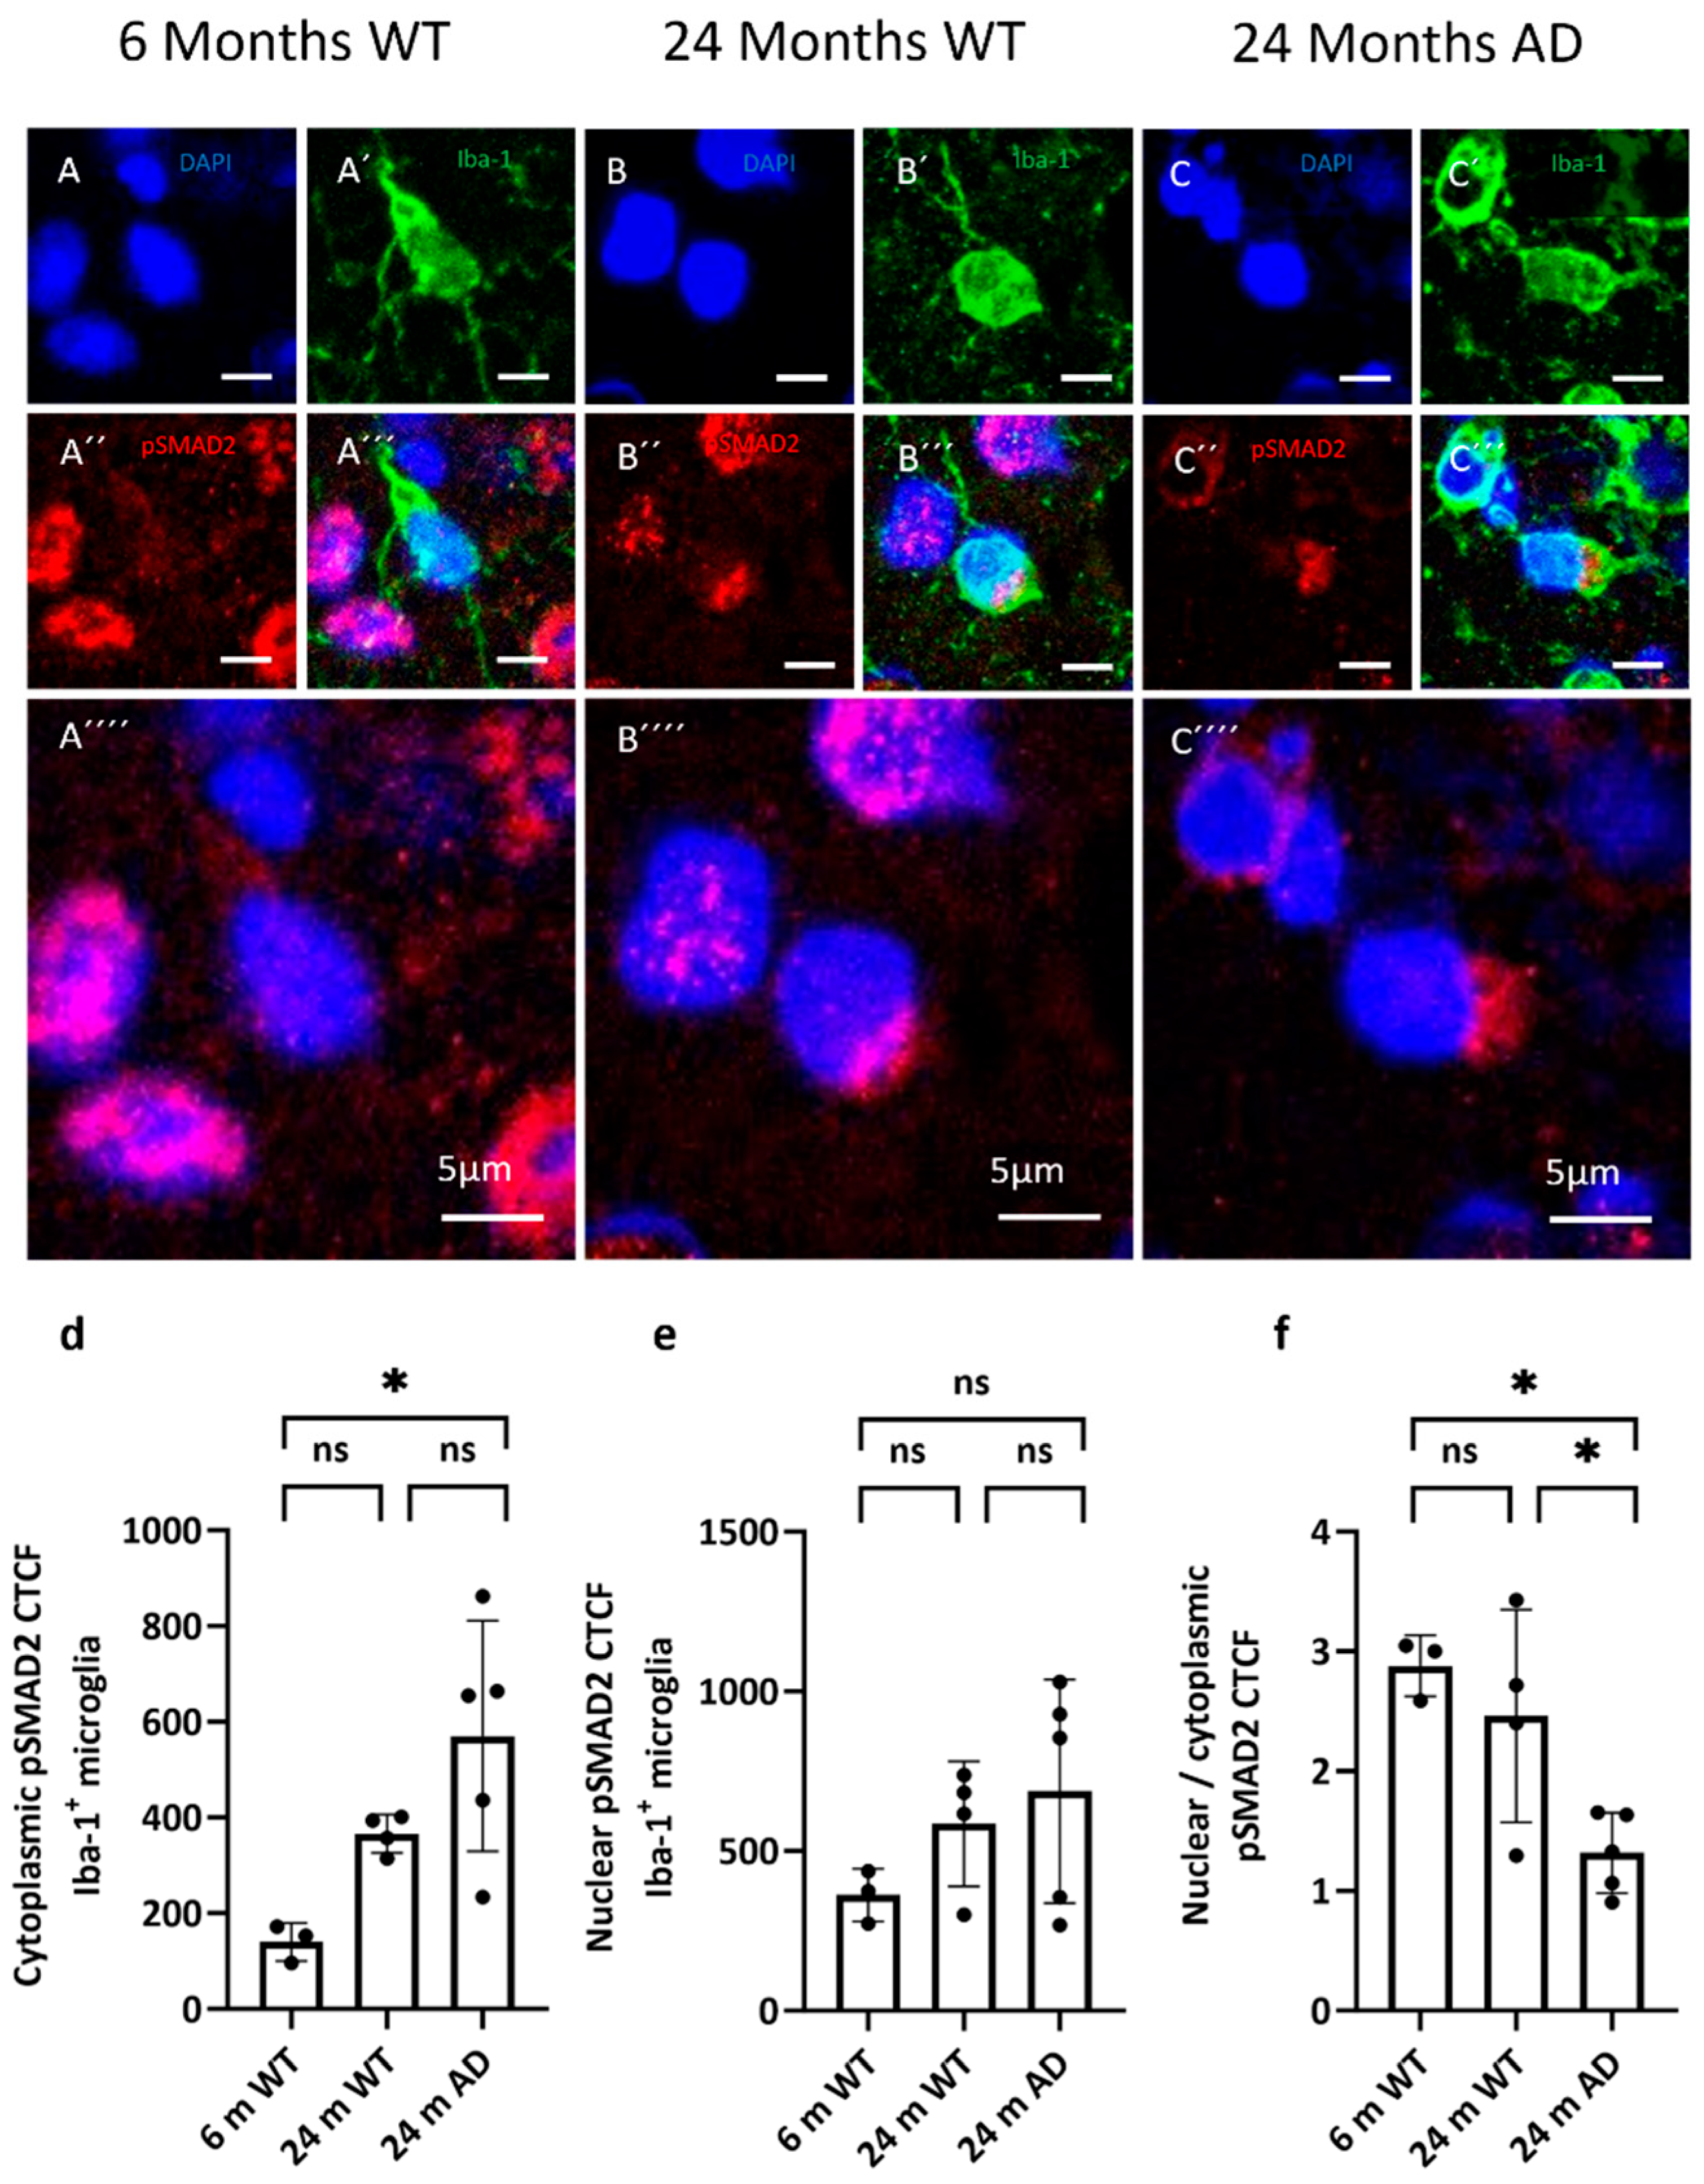
Figure 6.
Distribution of pSMAD2 in microglia. (a–c) Representative confocal images from cortex showing phosphorylated SMAD2 (pSMAD2, red, A´´, B´´, C´´) in 6-month WT, 24-month WT, and 24-month APP/PS1 mice. Microglia are labeled with Iba-1 (green, A’, B’, C’) and nuclei with DAPI (blue, A, B, C). (d + e) Quantification of cytoplasmic and nuclear pSMAD2 CTCF within Iba-1⁺ microglia. (f) Nuclear/cytoplasmic (N/C) pSMAD2 ratio per cell (values >1 indicate nuclear enrichment; <1 indicate cytoplasmic predominance). Statistical significance was assessed by one-way ANOVA with Tukey’s post hoc test: p < 0.05; ns, not significant.
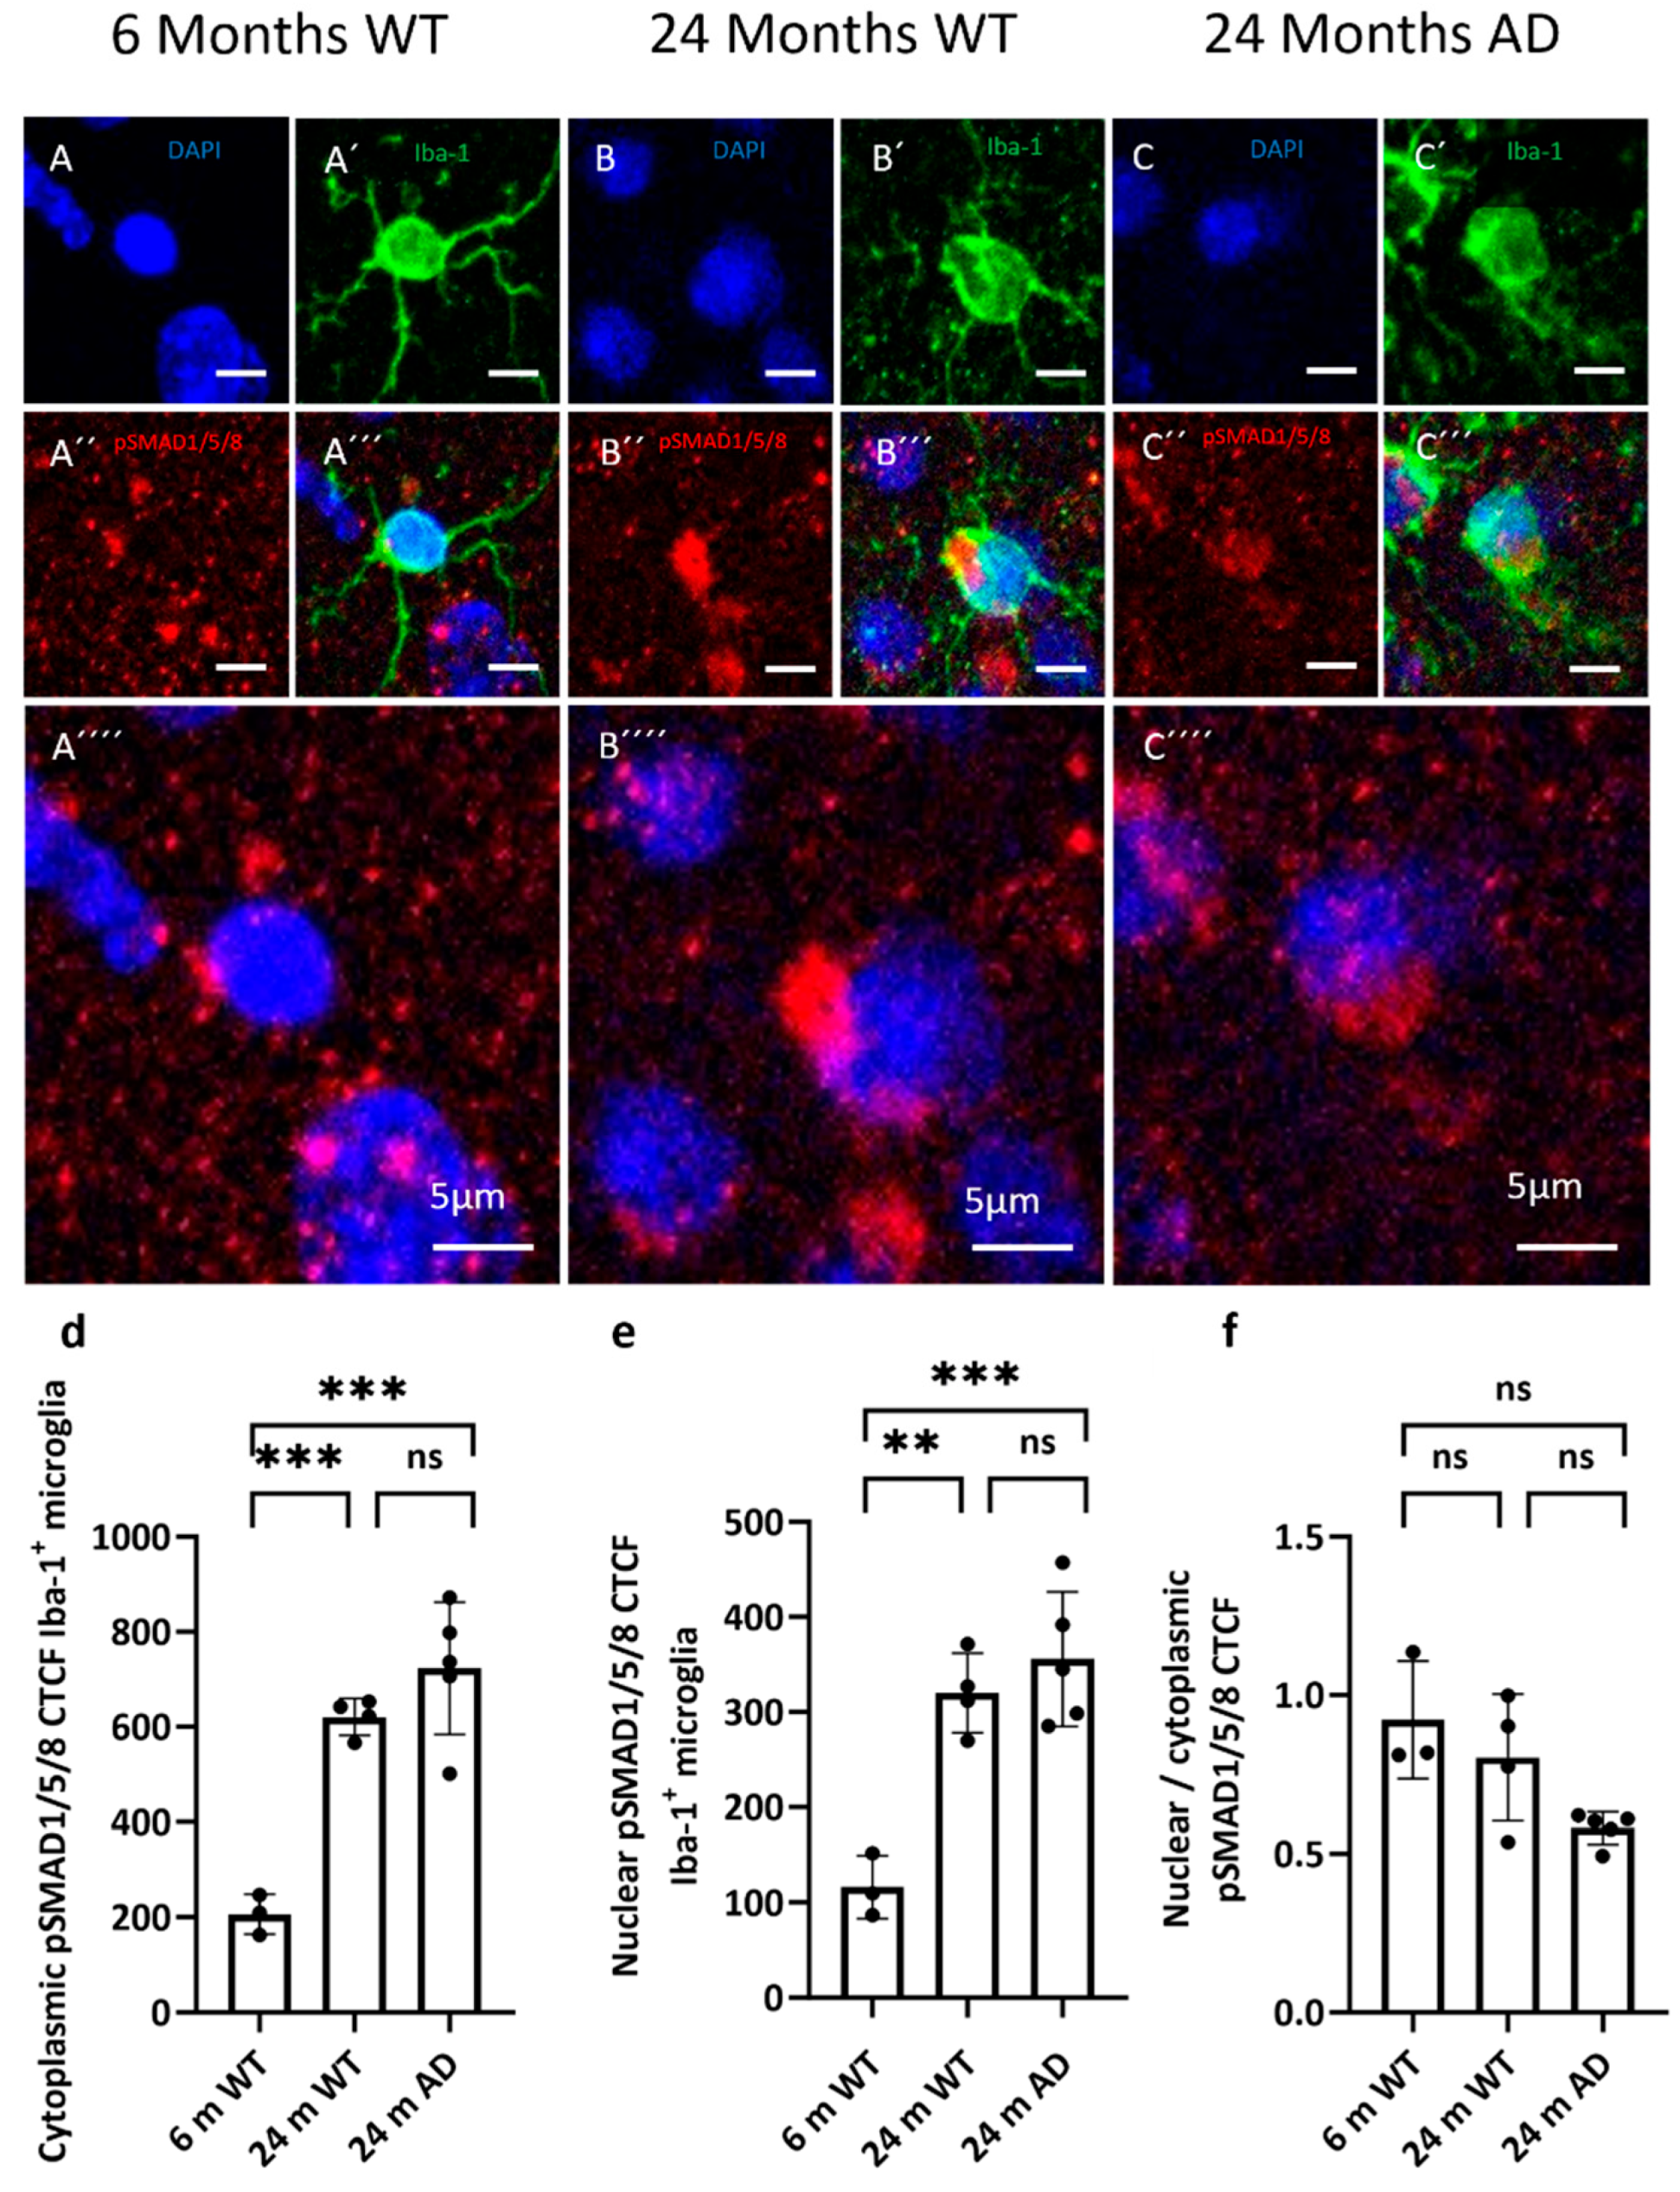
Figure 7.
Distribution of pSMADs 1, 5 and 8 in microglia. (a–c) Representative confocal images from cortex showing phosphorylated SMADs1, 5 and 8 (red) in 6-month WT, 24-month WT, and 24-month APP/PS1 mice. Microglia are labeled with Iba-1 (green) and nuclei with DAPI (blue). (d + e) Quantification of cytoplasmic and nuclear pSMADs CTCF within Iba-1⁺ microglia. (f) Nuclear/cytoplasmic (N/C) pSMADs ratio per cell (values >1 indicate nuclear enrichment; <1 indicate cytoplasmic predominance). Statistical significance was assessed by one-way ANOVA with Tukey’s post hoc test. The nuclear-to-cytoplasmic pSMAD1/5/8 CTCF ratio was analyzed using a Kruskal–Wallis test followed by Dunn’s multiple comparisons test. Significance: p < 0.01, p < 0.001; ns, not significant.
Figure 8.
Microglial gene expression across all animals, groups, and ages. Heatmap showing the expression of selected homeostatic markers (
Tmem119, P2ry12), TGF-β receptors and ligands (
Tgfbr1–3, Tgfb1–3), SMAD signaling components (
Smad1, Smad2, Smad3, Smad4, Smad5, Smad6 and
Smad7), and DAM markers (
Apoe, Tyrobp, Trem2, Cst7) as well as TGF-β target genes (
Fn1, Smad7, Tgfb1, Tmem119) in microglia classified as control microglia (CM), plaque-distant microglia (PCM) and plaque-associated microglia (PAM) at 8 and 12 months. Each column represents a single microglial sample (n = 4 per group and time point) from the dataset of Hemonnot-Girard
et al. (
Table S3). Values represent z-scores of log10(pseudocount + 1) expression per gene across all samples, with blue indicating relatively low and red relatively high expression.