1. Introduction
Coastal deltas are among the most dynamic and vulnerable geomorphic systems on the planet, shaped by the interplay of fluvial sediment delivery, wave climate, and sea-level variability [
1,
2]. The Nile Delta, one of the world’s archetypal wave-dominated deltas, has experienced profound and rapid transformation since the mid-20
th century, largely driven by extensive human intervention [
3,
4]. The construction of the Aswan High Dam (AHD) in 1964 effectively halted the annual sediment flux that once nourished the delta, reducing the pre-dam load of ≈124 × 106 tons/yr to less than 5 × 10⁶ tons/yr [
5,
6]. This sediment deficit triggered persistent shoreline retreat along the delta’s three promontories, Rosetta, Burullus and Damietta, where erosion rates commonly exceeded 50 m/yr in unprotected sectors, contributing to at least 1800 ha of cumulative land loss between 1964 and 2020 [
7,
8,
9].
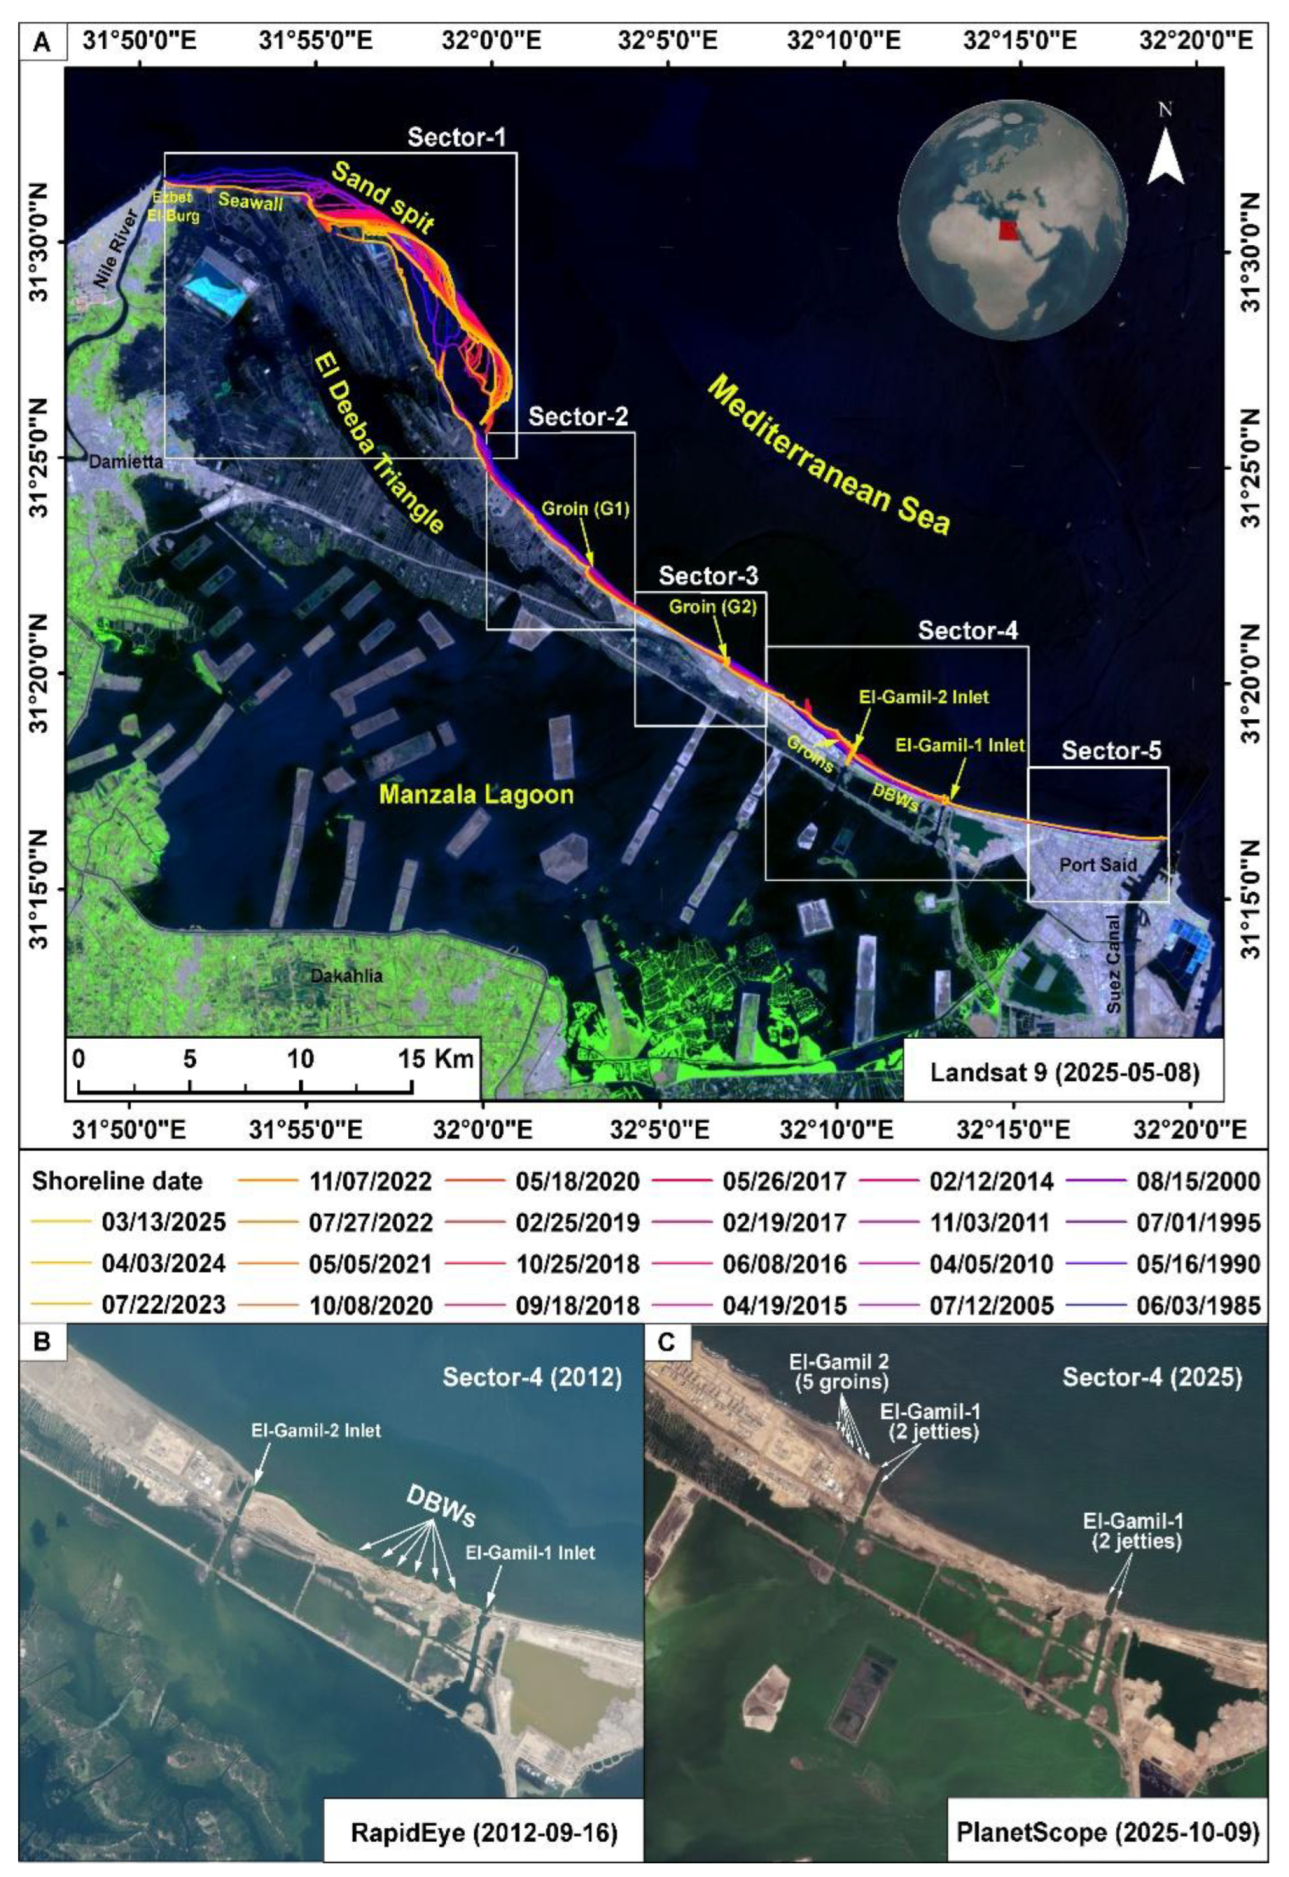
The current study focuses on a 60-km stretch of the northeastern Nile Delta coastline, extending from the western bank of the Damietta Nile branch (31°31'24.9"N, 31°50'46.3"E) to Port Said at the entrance to the Suez Canal (31°16'25.0"N, 32°19'16.6"E) (
Figure 1A), including the Damietta Promontory and the highly active Damietta sand spit, recognized as one of the most morphodynamically responsive coastal features in the Mediterranean [
10,
11,
12]. The spit, a prominent recurved barrier up to 12 km in length, has migrated southeastward at rates of 70–100 m/yr since the 1970s, driven by persistent northwesterly wave action and the near-complete cessation of fluvial sediment supply [
13,
14].
This narrow coastal margin, locally under 700 m wide, serves as the first line of defense for Lake Manzala, Egypt’s largest coastal lagoon. Low-lying zones in the Nile Delta are highly vulnerable to sea-level rise: remote-sensing studies estimate substantial portions of the delta lie below 1–2 m elevation and could be inundated under modest SLR scenarios [
4,
6,
15]. Vulnerability assessments for nearby sectors project significant land loss, saltwater intrusion, and erosion under future sea-level rise [
4,
8,
12,
16]. Additionally, modeling of groundwater dynamics in the Nile Delta coast suggests that SLR will exacerbate subsidence and raise the water table [
16]. Given that large expanses of the delta lie within just a few meters of current sea level [
17,
18], preserving this narrow barrier is critical not only for current protection but also as a climate-adaptive buffer against the risks of coastal inundation, back-flooding, or lagoon conversion to open sea.
To counteract severe post-AHD shoreline retreat, a wide array of coastal protection structures has been installed along this sector since the early 1990s. These include six detached breakwaters between the El-Gamil-1 and El-Gamil-2 inlets (2000–2005) (
Figure 1), a 6.5-km seawall located immediately west of the study area completed in 2006 (
Figure 1A, Sector-1), two large groins, constructed in 2005 and 2017 (
Figure 1A, Sector 2, 3), multiple smaller groins and jetties (2013–2017) [
12,
19,
20,
21]. While these interventions have stabilized select shoreline sectors and protected critical infrastructure, they have also interrupted alongshore sediment transport pathways, intensified downdrift erosion, and altered the natural evolution of the Damietta spit system and the El-Gamil inlets [
21,
22,
23].
The main objective of this study is to conduct a comprehensive multi-decadal assessment (1985–2025) of shoreline dynamics along this rapidly urbanizing and morphologically sensitive sector using high-resolution satellite datasets, the Digital Shoreline Analysis System (DSAS), and machine-learning predictive modeling, specifically employing Nonlinear Autoregressive with Exogenous Inputs (NARX) and Bidirectional Long Short-Term Memory (BiLSTM) models. By quantifying historical shoreline behavior, evaluating the geomorphic impacts of engineering structures, and forecasting shoreline positions through 2050, this work seeks to establish a robust scientific foundation for adaptive coastal management in sediment-starved, inlet-dominated deltaic environments. Comparable challenges have been documented at the São Francisco River mouth in Brazil [
24,
25,
26], and the Robinson River mouth in Western Australia [
27,
28].
2. Dataset and Methods
2.1. Remotely Sensed Data
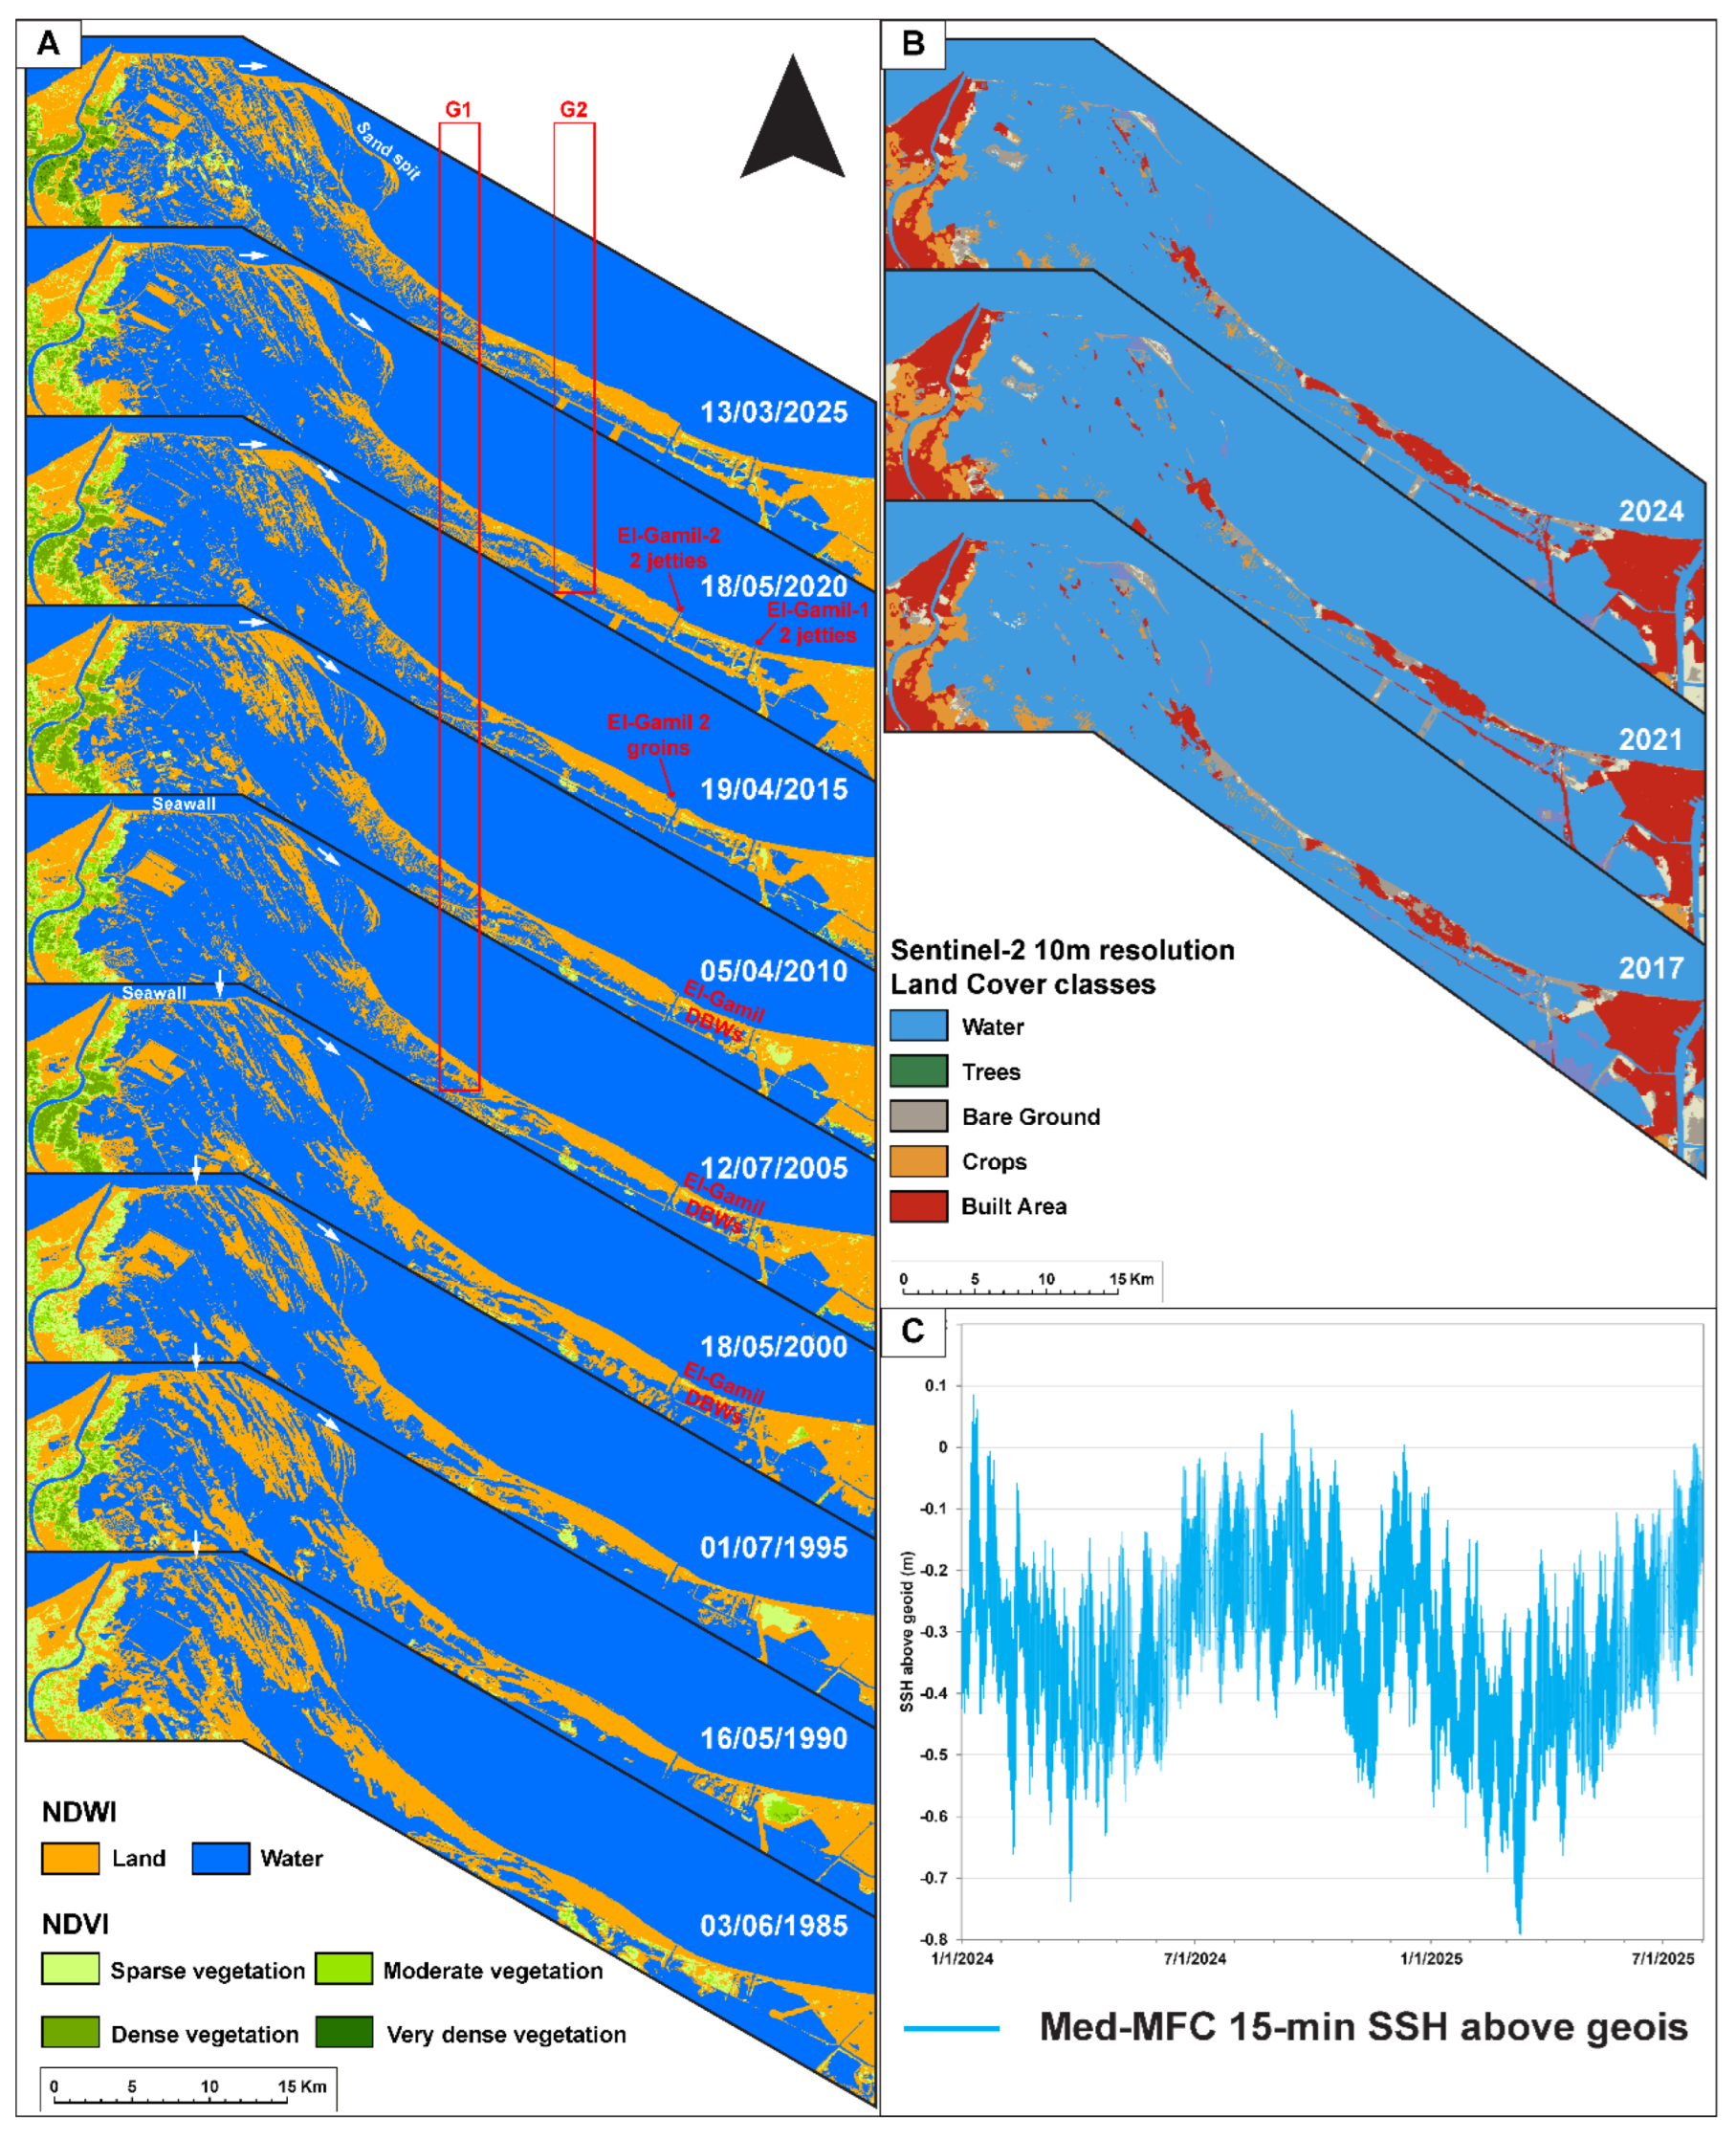
A multi-resolution satellite archive was employed to extract, refine, and validate shoreline positions over the 40-year study period. Landsat-5 TM and Landsat-8 OLI imagery (30 m/pixel) acquired between 1985 and 2025 [
29,
30] served as the primary source for historical shoreline delineation (
Figure 1A,
Table 1). To discriminate land–water boundaries, the Normalized Difference Water Index (NDWI) was applied following [
31], while the Normalized Difference Vegetation Index (NDVI) was calculated to identify and mask vegetated surfaces using established formulations [
32,
33,
34] (
Figure 2A).
To enhance positional accuracy in recent years, high-resolution PlanetScope imagery (3 m/pixel) and RapidEye data (5 m/pixel) were incorporated for the period 2011–2024) [
35] (
Figure 1B, C,
Table 1). These datasets provided precise visual references for manual shoreline digitization and quality control, ensuring consistent and reliable shoreline extraction throughout the study timeline. Additionally, Sentinel-2 annual Land Use/Land Covermaps (2017–2024) were integrated to highlight recent urban expansion patterns across the study area (
Figure 2B).
2.2. Water Surface Elevation
Water surface elevation (WSE) data were obtained from the Copernicus Mediterranean Sea Physics Analysis and Forecast product (Med-MFC) for the period 01 January 2024 to 01 July 2025 at the offshore location 31°31'53.31"N, 32°10'48.64"E [
36]. The dataset provides sea surface height above geoid (SSH) with a spatial resolution of ≈4 km (1/24°) and hourly temporal resolution. These data were used to derive tidal and non-tidal water level variations (
Figure 2C) and to define accurate hydrodynamic boundary conditions for the Coastal Modeling System (CMS) simulation. The Med-MFC product has been extensively validated against coastal tide gauges along the Egyptian Mediterranean coast, exhibiting high correlation (r > 0.91) and low RMSE (<0.08 m) [
21,
37].
2.2. Climate Data
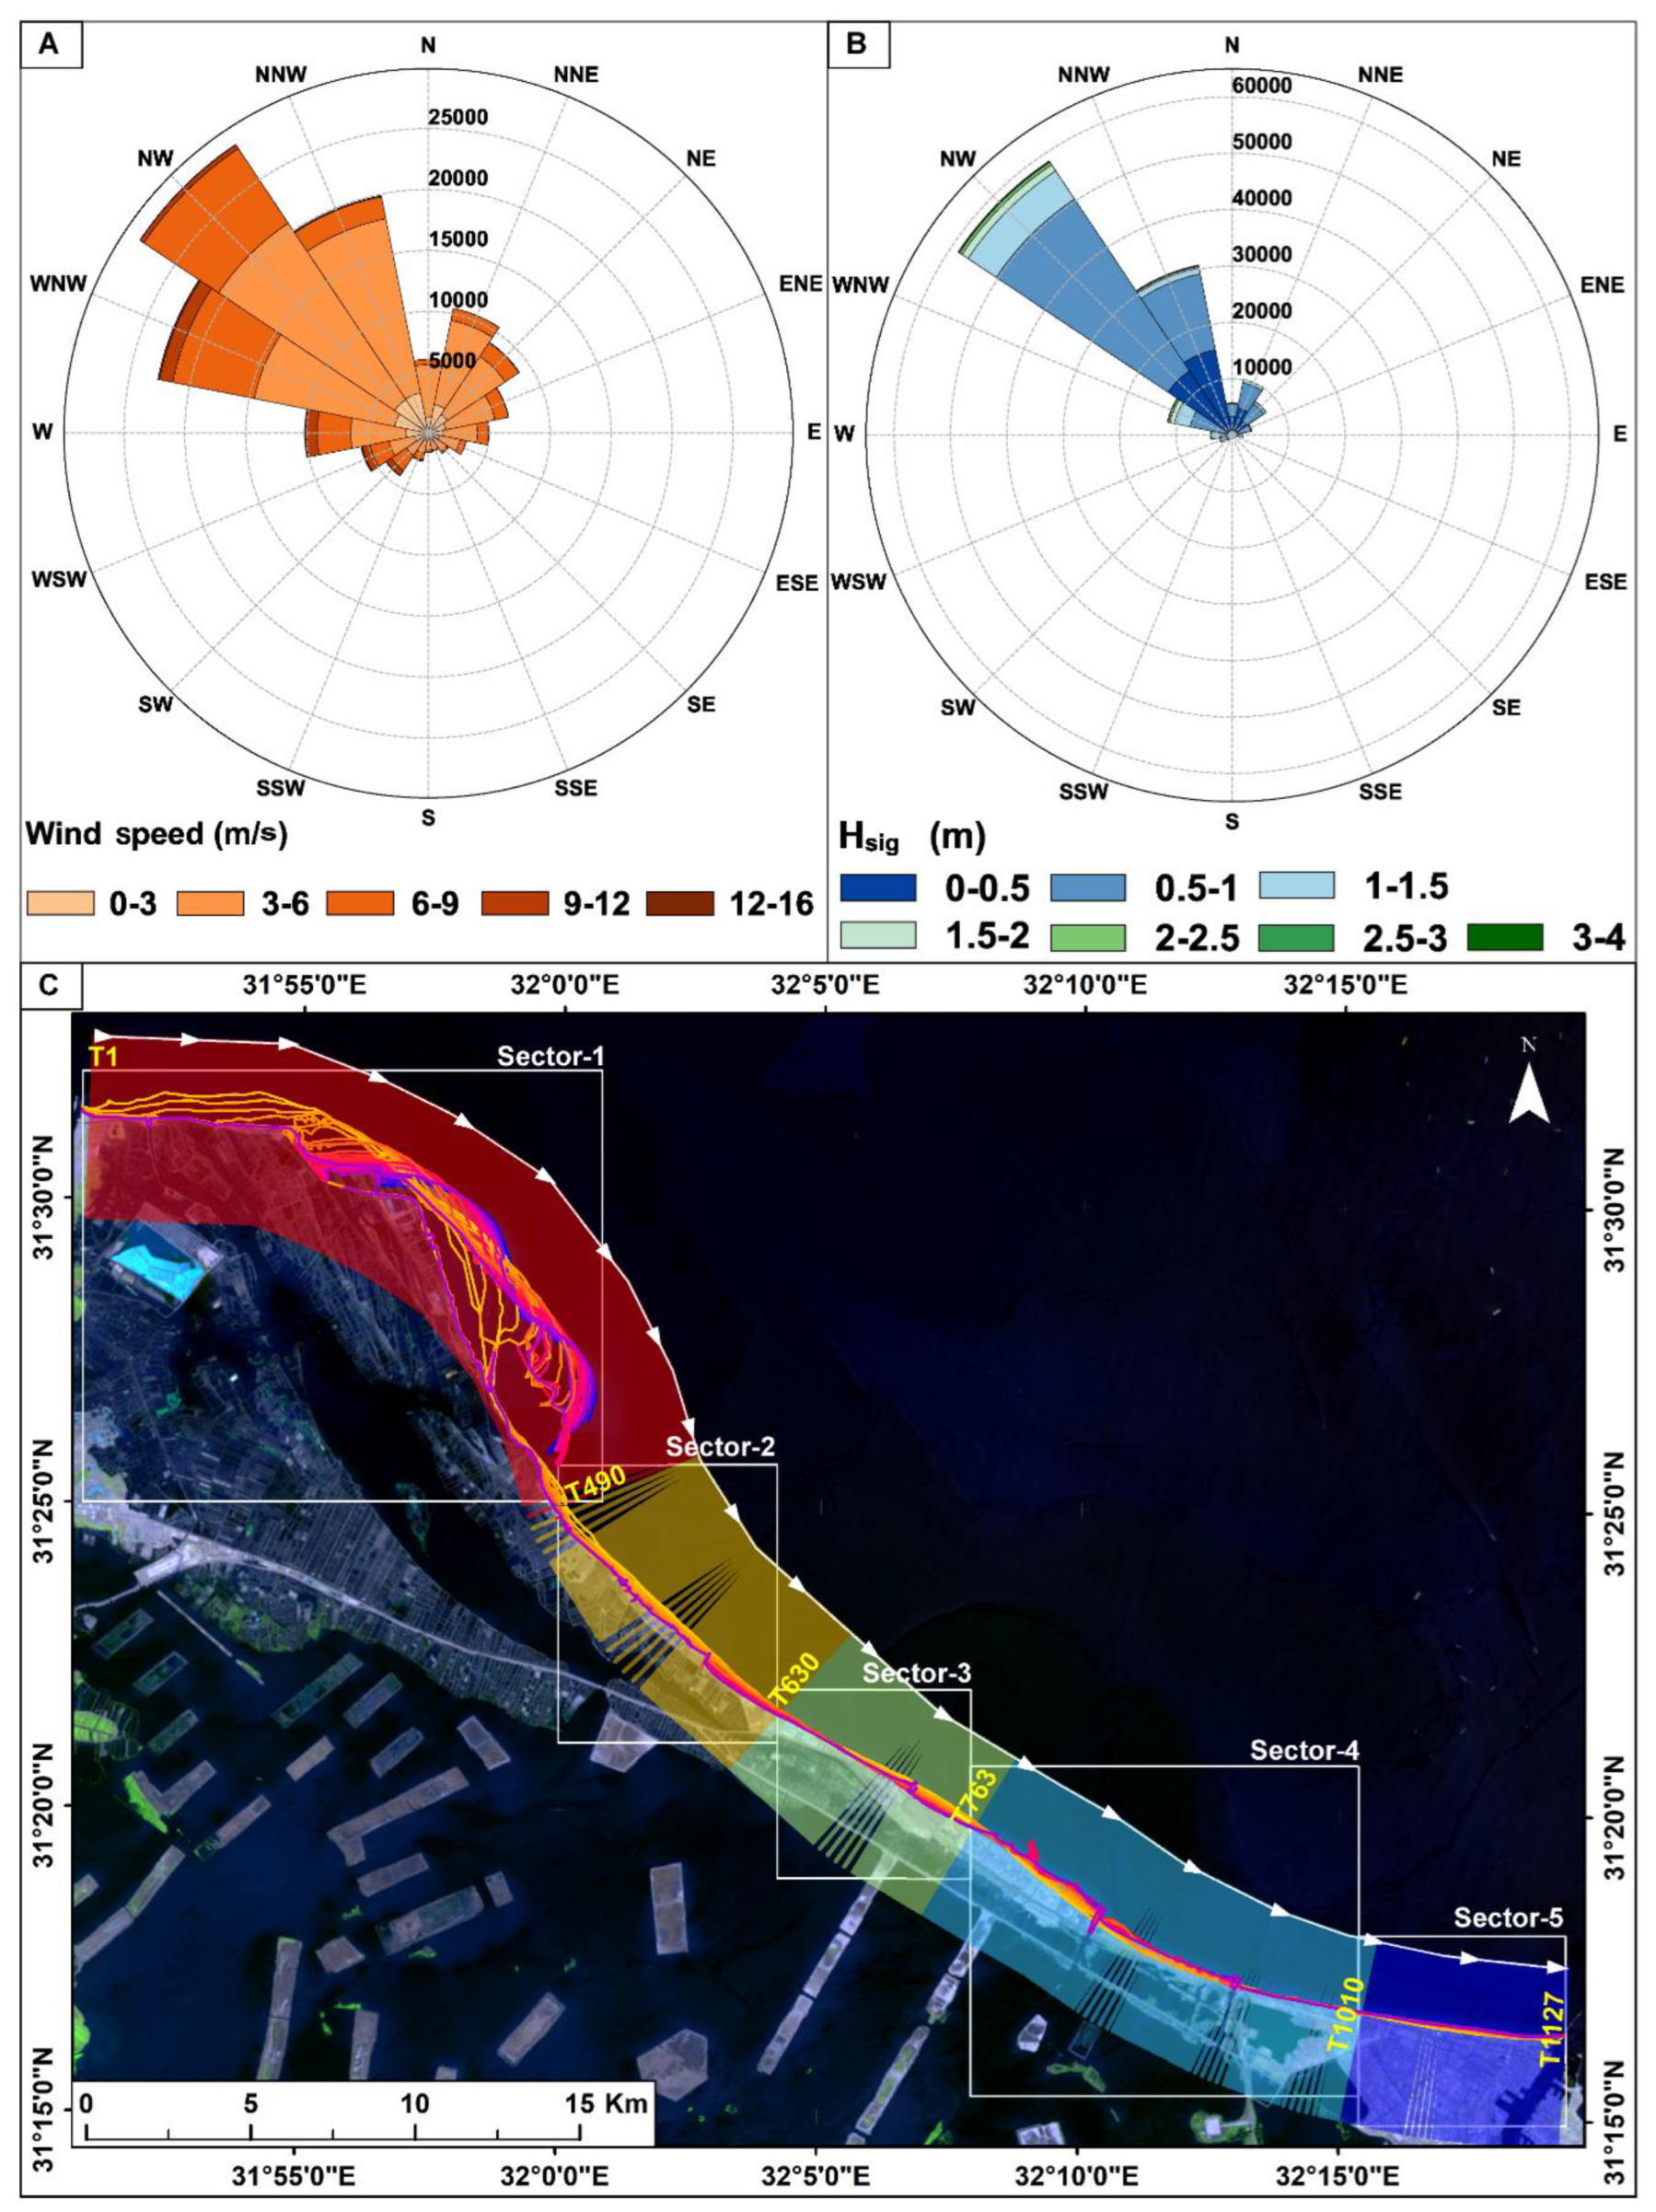
Wind and wave parameters were obtained from the ERA5 reanalysis dataset [
38] at the offshore location 31°31'53.31"N, 32°10'48.64"E for the period 1975–2024 with a 3-hour temporal resolution. The extracted variables, including wind speed, wind direction, significant wave height (
), wave direction, and peak wave period (
), were used to generate classified wind-rose and wave-rose diagrams (
Figure 3A, B). These diagrams were essential for identifying dominant wind regimes and the primary wave directions that influence nearshore currents and sediment transport along the study area’s coastline. The reliability of the ERA5 dataset was confirmed through comparison with available in-situ measurements, ensuring robust environmental characterization [
3,
7,
39,
40,
41].
2.3. Bathymetry Data
Nearshore bathymetry was sourced from the EMODnet Digital Bathymetry (DTM) 2024 product [
42], a high-resolution (≈115 m) multilayer grid for European seas compiled from 22032 bathymetric surveys, composite DTMs, and satellite-derived depths (Landsat-8 and Sentinel-2). EMODnet Bathymetry is widely regarded as the most comprehensive and quality-controlled bathymetric dataset for the Mediterranean [
43,
44]. Although high-resolution bathymetry is essential for detailed coastal engineering design, the objective of the present modelling is qualitative rather than quantitative. The simulations are intended to evaluate the relative effectiveness of proposed protection configurations and to explore their morphodynamic behaviour, not to generate final quantitative engineering parameters. Therefore, the EMODnet DTM provides an adequate baseline for this exploratory assessment, while future implementation-grade designs would require higher-resolution survey data.
2.2. Methods
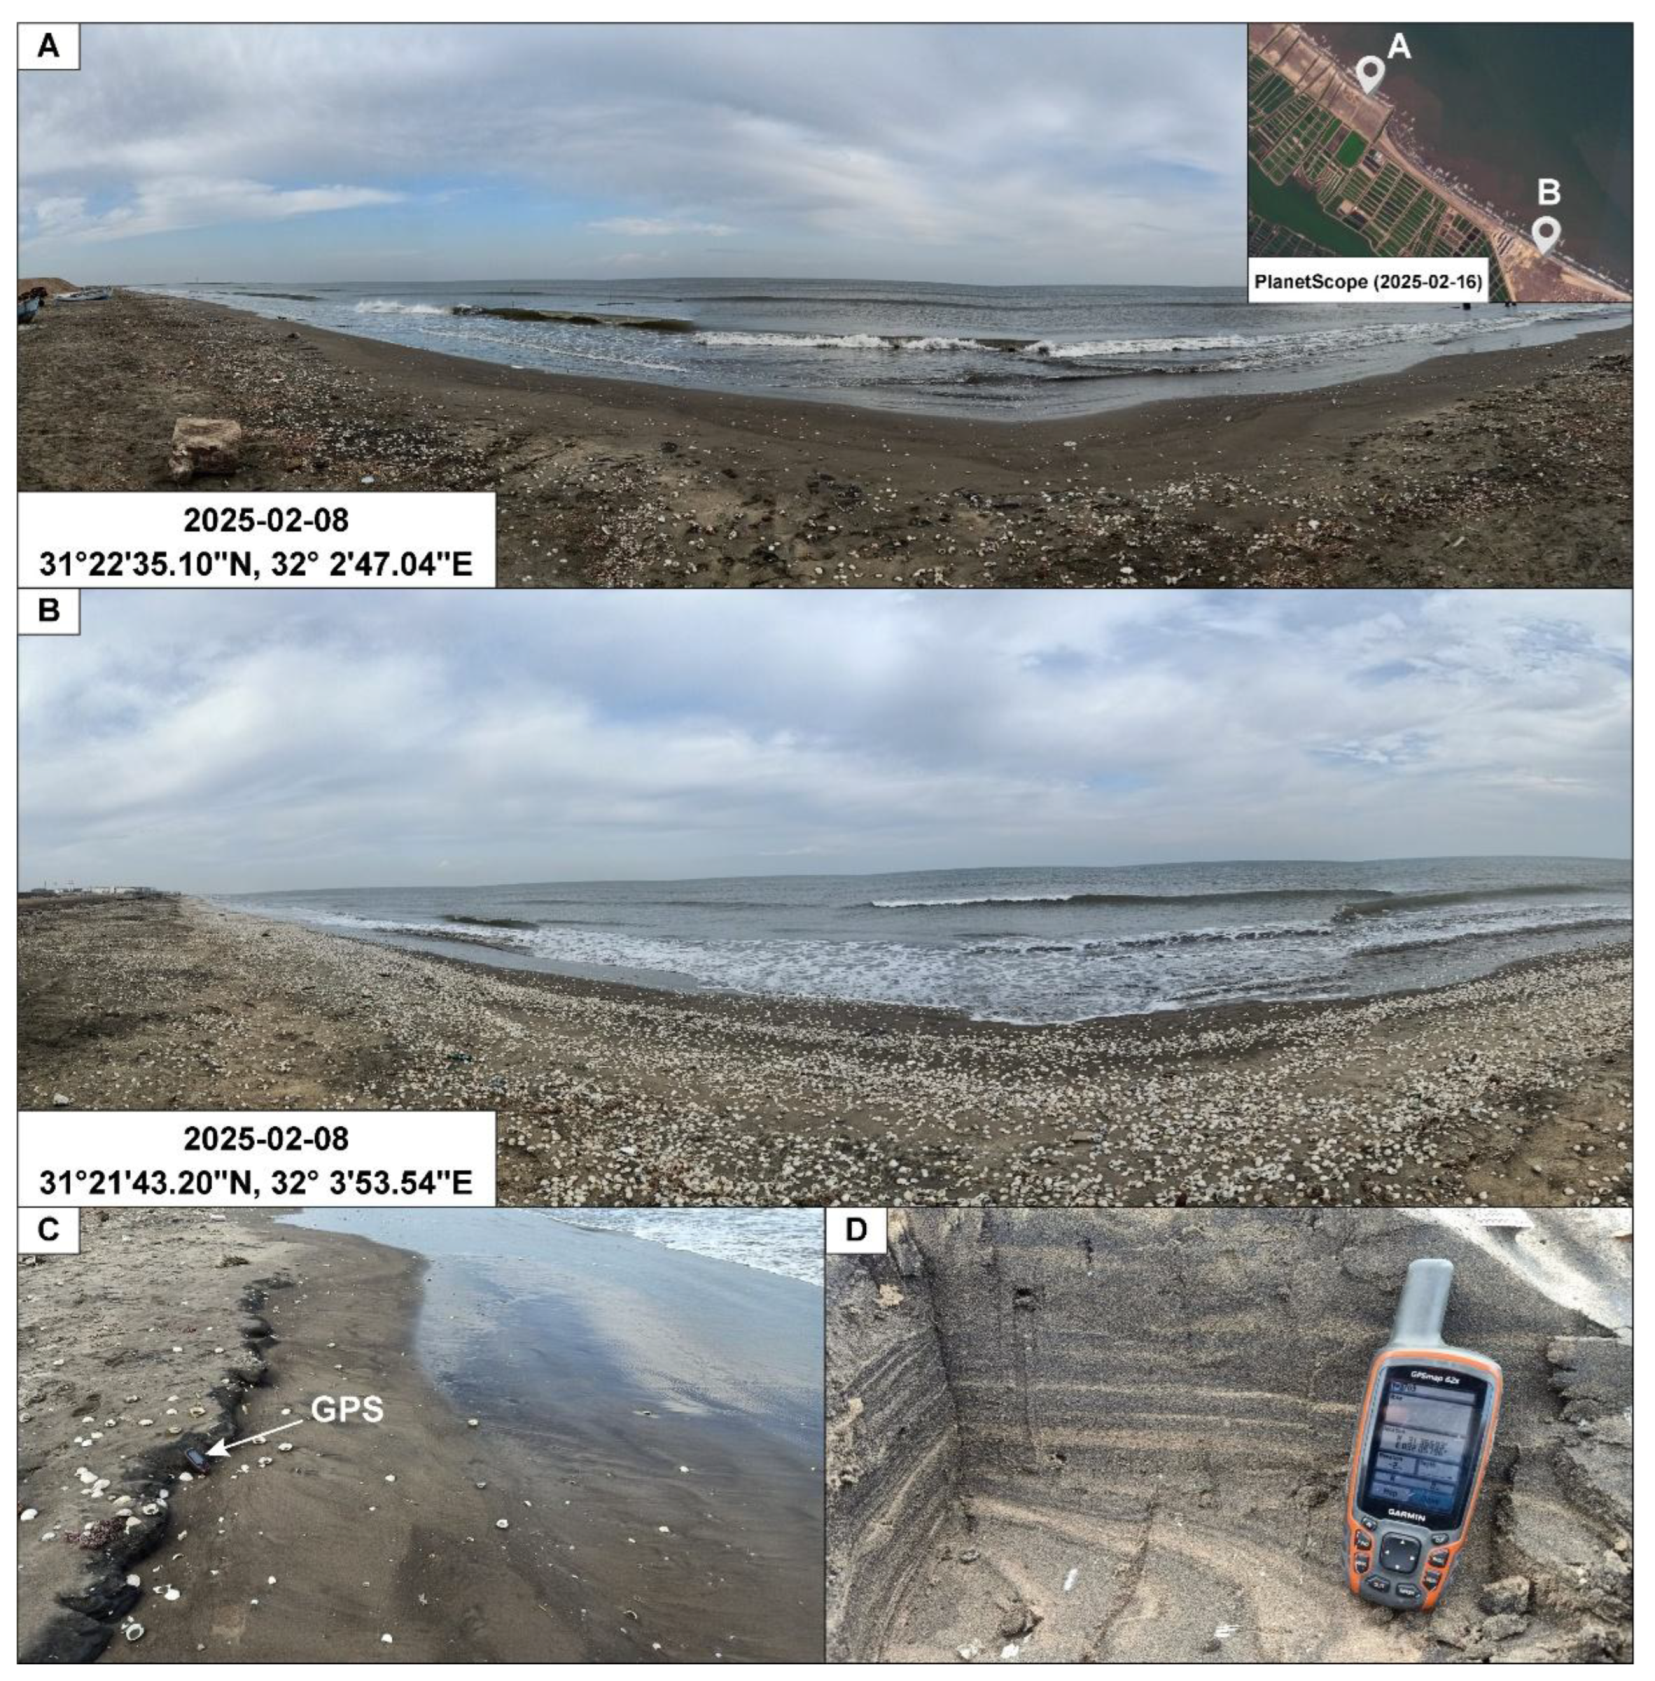
2.2.1. Field Work Investigations
Field investigations were conducted to validate the remotely sensed shoreline positions and ensure the accuracy of the extracted datasets. A Garmin 62s handheld GPS was used to collect high-precision shoreline points along the study area. The GPS-recorded shoreline traces were then systematically compared with the derived from PlanetScope and Landsat-8 OLI imagery to assess spatial consistency and quantify positional differences. This ground-truth dataset provided an essential benchmark for evaluating the reliability of satellite-based shoreline delineation across the study area (
Figure 4).
2.2.1. Digital Shoreline Analysis System
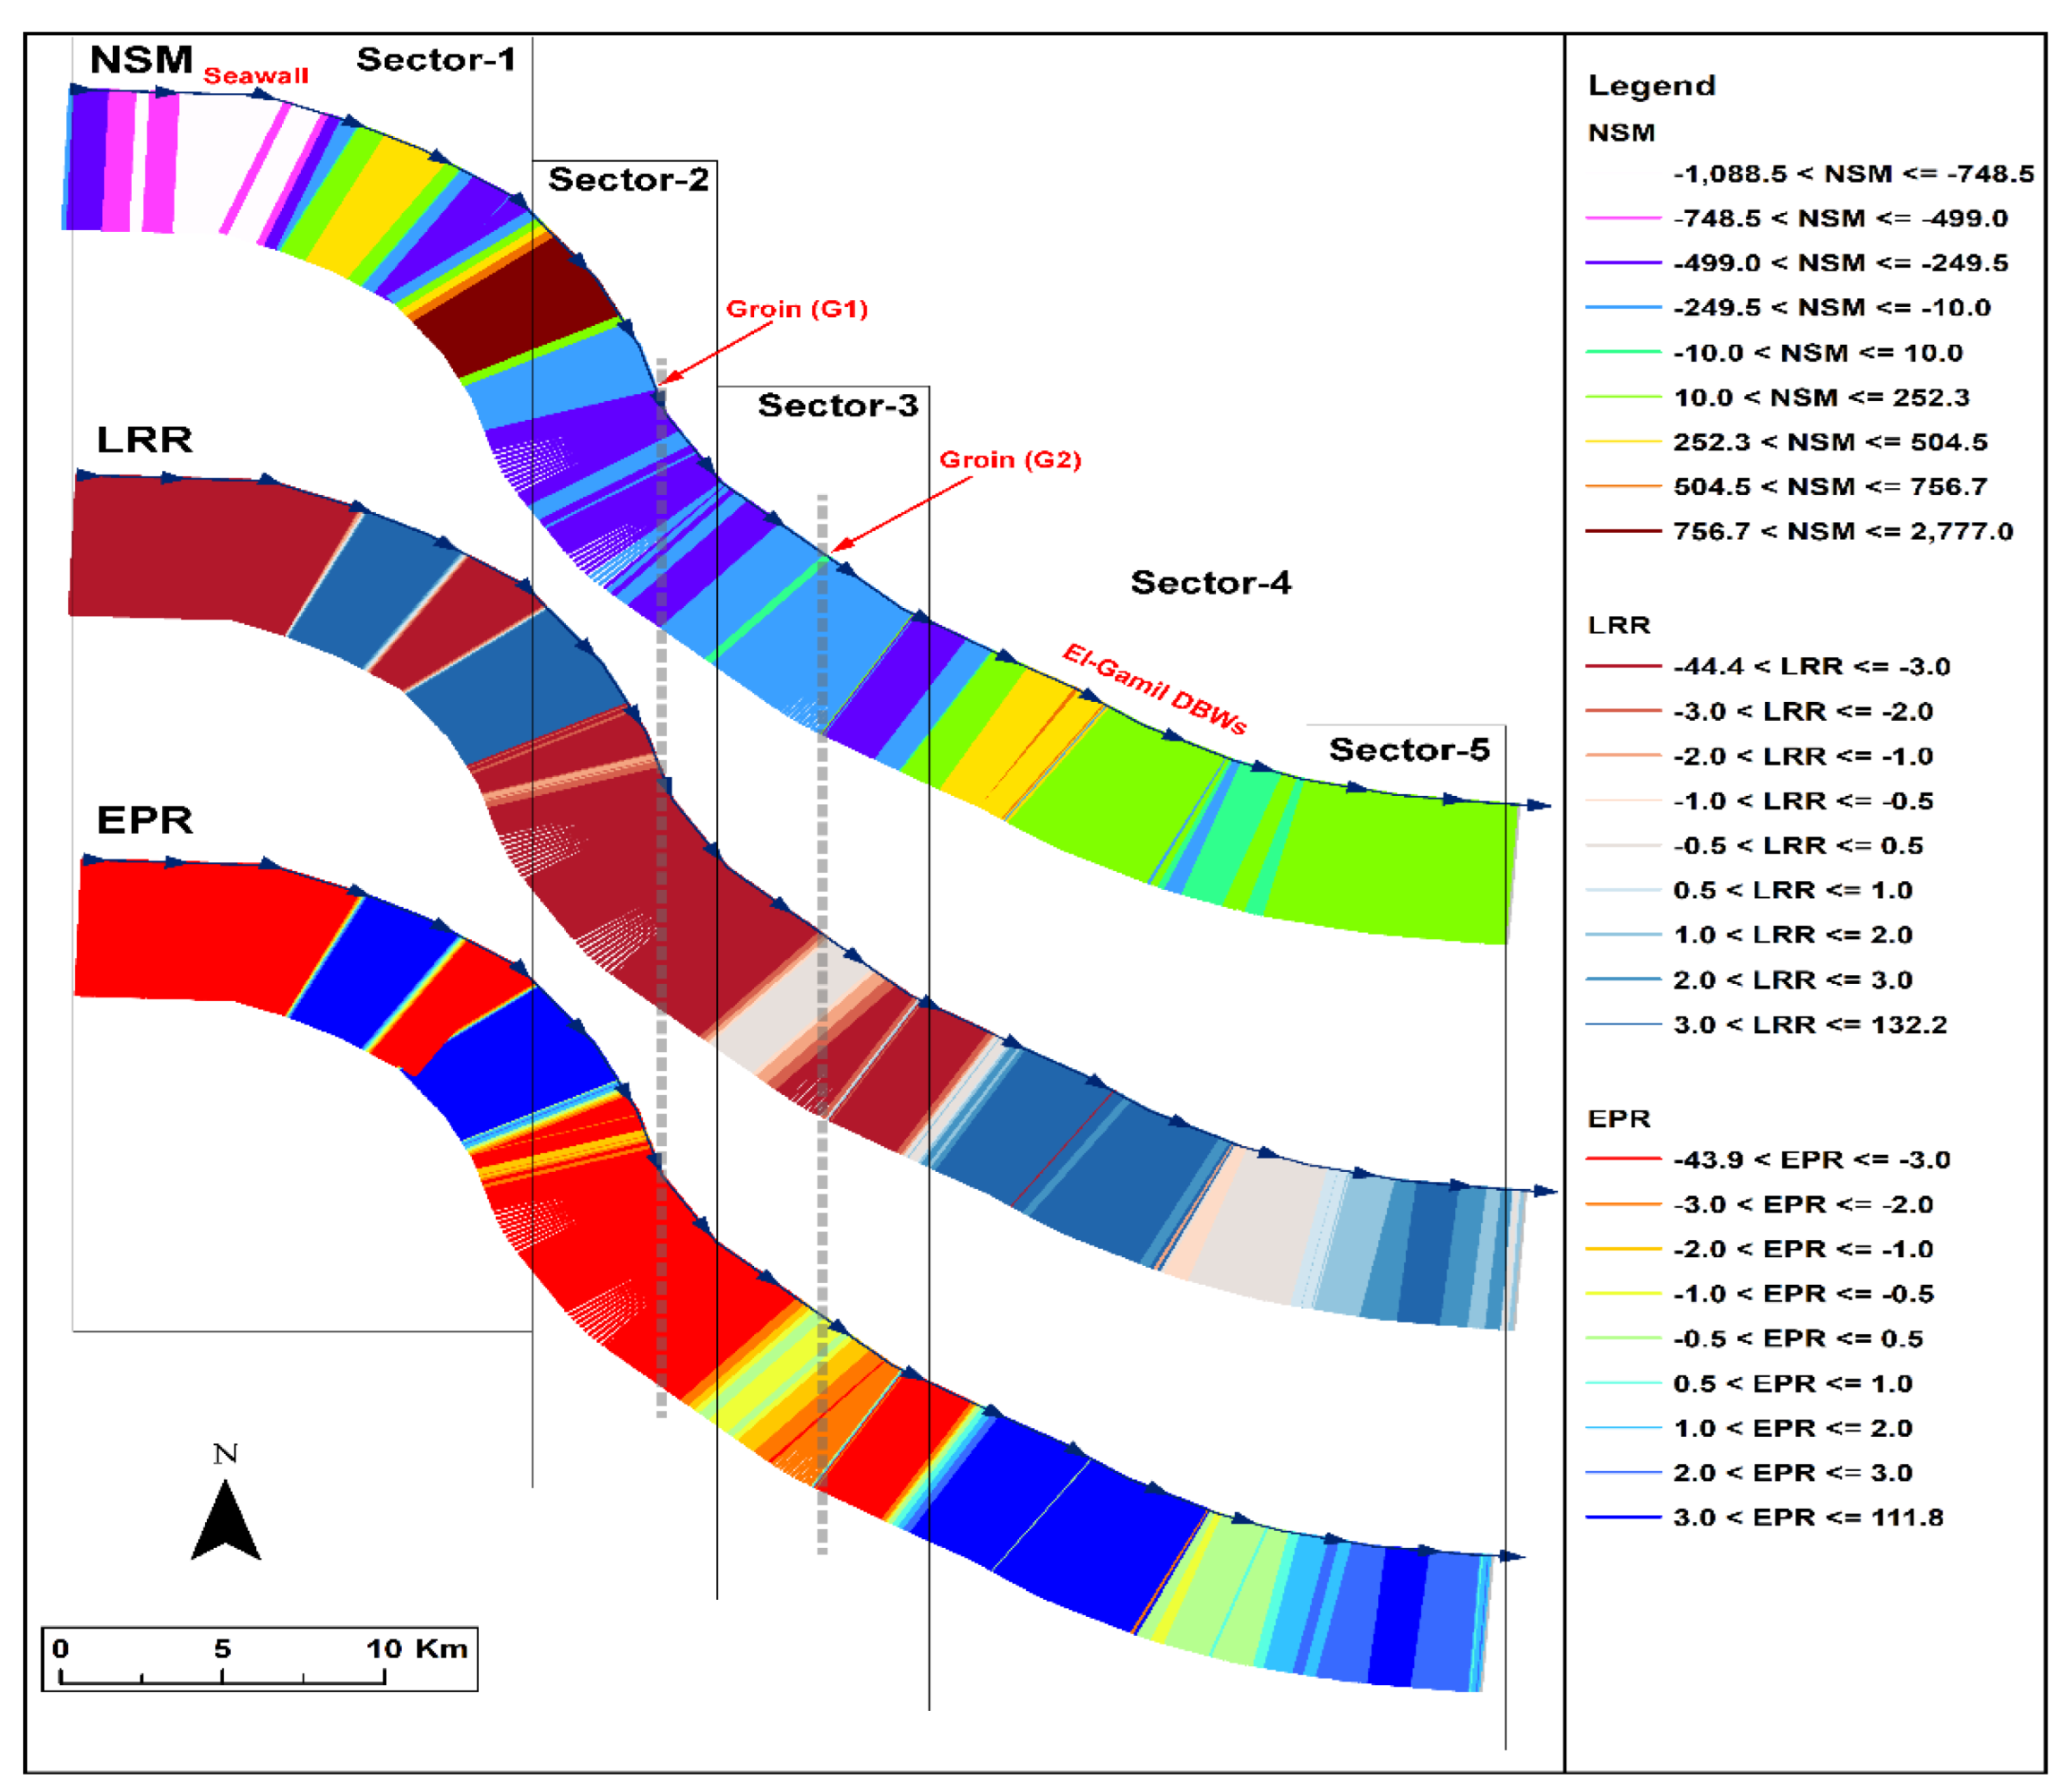
Shoreline change metrics were computed using the Digital Shoreline Analysis System (DSAS v5.1), which automates the quantification of shoreline movement along user-defined transects [
45,
46]. A baseline was constructed parallel to the general shoreline orientation, and transects were cast at 50 m spacing across the entire study area to ensure consistent sampling density. DSAS was used to calculate three primary indicators of shoreline change: Net Shoreline Movement (NSM), Linear Regression Rate (LRR), and End Point Rate (EPR) [
45].
The NSM quantifies the absolute shoreline displacement between the oldest (1985) and most recent (2025) shoreline positions, expressed as:
Where NSM is the net shoreline movement (m) along each transect. is the distance (m) from the baseline to the shoreline position in the year 2025 along a given transect. is the distance (m) from the baseline to the shoreline position in the year 1985 along the same transect. A positive NSM indicates shoreline seaward advance (accretion), whereas a negative NSM indicates landward retreat (erosion).
The LRR offers a more statistically rigorous estimate by fitting a least-squares regression line through all shoreline intersection points along each transect. The regression equation,
where
is the shoreline position (m) measured as the distance from the baseline along a given transect.
is time (years), typically represented by the shoreline acquisition date.
is the slope of the regression line (m/yr), representing the shoreline change rate (LRR).
is the y-intercept, representing the estimated shoreline position at
. A positive
m indicates long-term shoreline accretion, whereas a negative
m indicates shoreline erosion. LRR utilizes all available shoreline observations, reducing sensitivity to short-term variability and providing a stable long-term trend.
The EPR provides a simple yet widely applied measure of shoreline change by dividing the net displacement between the earliest and most recent shoreline positions by the time elapsed. For two shoreline dates and corresponding shoreline–baseline distances, EPR is computed as:
yielding a shoreline change rate in meters per year. Where EPR is the shoreline change rate (m/yr).
is the distance (m) from the baseline to the older shoreline (1985) along a given transect;
is the distance (m) from the baseline to the more recent shoreline (2025) along the same transect;
is the date (year) of the older shoreline; and
is the date (year) of the more recent shoreline [
47]. Together, these DSAS-derived metrics provided a comprehensive assessment of spatial and temporal shoreline dynamics along the Damietta–Port Said coast (
Figure 5 and
Figure 6).
2.5.3. AI-Based Shoreline Forecasting
While classical statistical techniques implemented in DSAS are reliable and widely used for quantifying historical shoreline trends, their ability to forecast future shoreline evolution in highly dynamic coastal environments is limited [
45,
48]. Several studies and technical assessments have shown that simple rate methods can produce poor predictive accuracy where shoreline behavior is non-stationary, episodic, or strongly affected by localized human interventions [
9,
21,
48,
49]. Evaluations that are more recent likewise note that while DSAS is excellent for retrospective trend analysis, its rate-based projections may be inadequate for sites with rapid regime shifts or complex forcing [
49,
50,
51,
52,
53]. In such settings, traditional approaches tend to extrapolate linear patterns from historical data, yielding unrealistic projections that overlook abrupt shifts or feedback loops [
49,
50,
52]. To address these limitations, advanced AI-based recurrent neural network (RNN) models, NARX and BiLSTM, have been increasingly employed for 2050 shoreline prediction. These models are particularly well-suited for time-series forecasting in coastal morphodynamics because they can capture long-term temporal dependencies, nonlinear relationships, and exogenous influences such as engineered structures or sediment supply variations [
52,
54,
55,
56]. Each model was trained for 300 epochs per transect using the Adam optimizer and mean squared error (MSE) loss, with early stopping to prevent overfitting [
57,
58].
2.5.4. Validation of Predictive Models’ Performance
Beyond the quantitative metrics, both models were visually validated against well-established geomorphic patterns repeatedly observed along this coast (
Figure 7). These patterns include pronounced accretion in zones immediately updrift of groins and accelerated erosion in downdrift “shadow” areas (
Figure 7C, D), consistently documented following each major intervention since the construction of groins G1 and G2. Quantitative evaluation using Taylor diagrams [
59] and RMSE heatmaps (
Figure 8) further reinforced these visual observations.
2.5.5. Hydrodynamic Modeling
To evaluate wave propagation, longshore sediment transport, and the performance of proposed strategies for coastal management, hydrodynamic simulations were performed using the CMS, a coupled wave–flow–sediment transport model developed by the U.S. Army Corps of Engineers [
60,
61], within the Surface-water Modeling System (SMS 13.4). A computational grid covering the surf and nearshore zone was constructed, incorporating the merged bathymetric dataset. CMS-Flow was run on a high-resolution telescoping Cartesian grid (cell size 5–15 m in the nearshore zone (
Figure 9B, C) forced by Med-MFC WSE and ERA5-derived offshore wave and wind conditions (1975–2024).
3. Results
3.1. Historical Spatio-Temporal Shoreline Changes
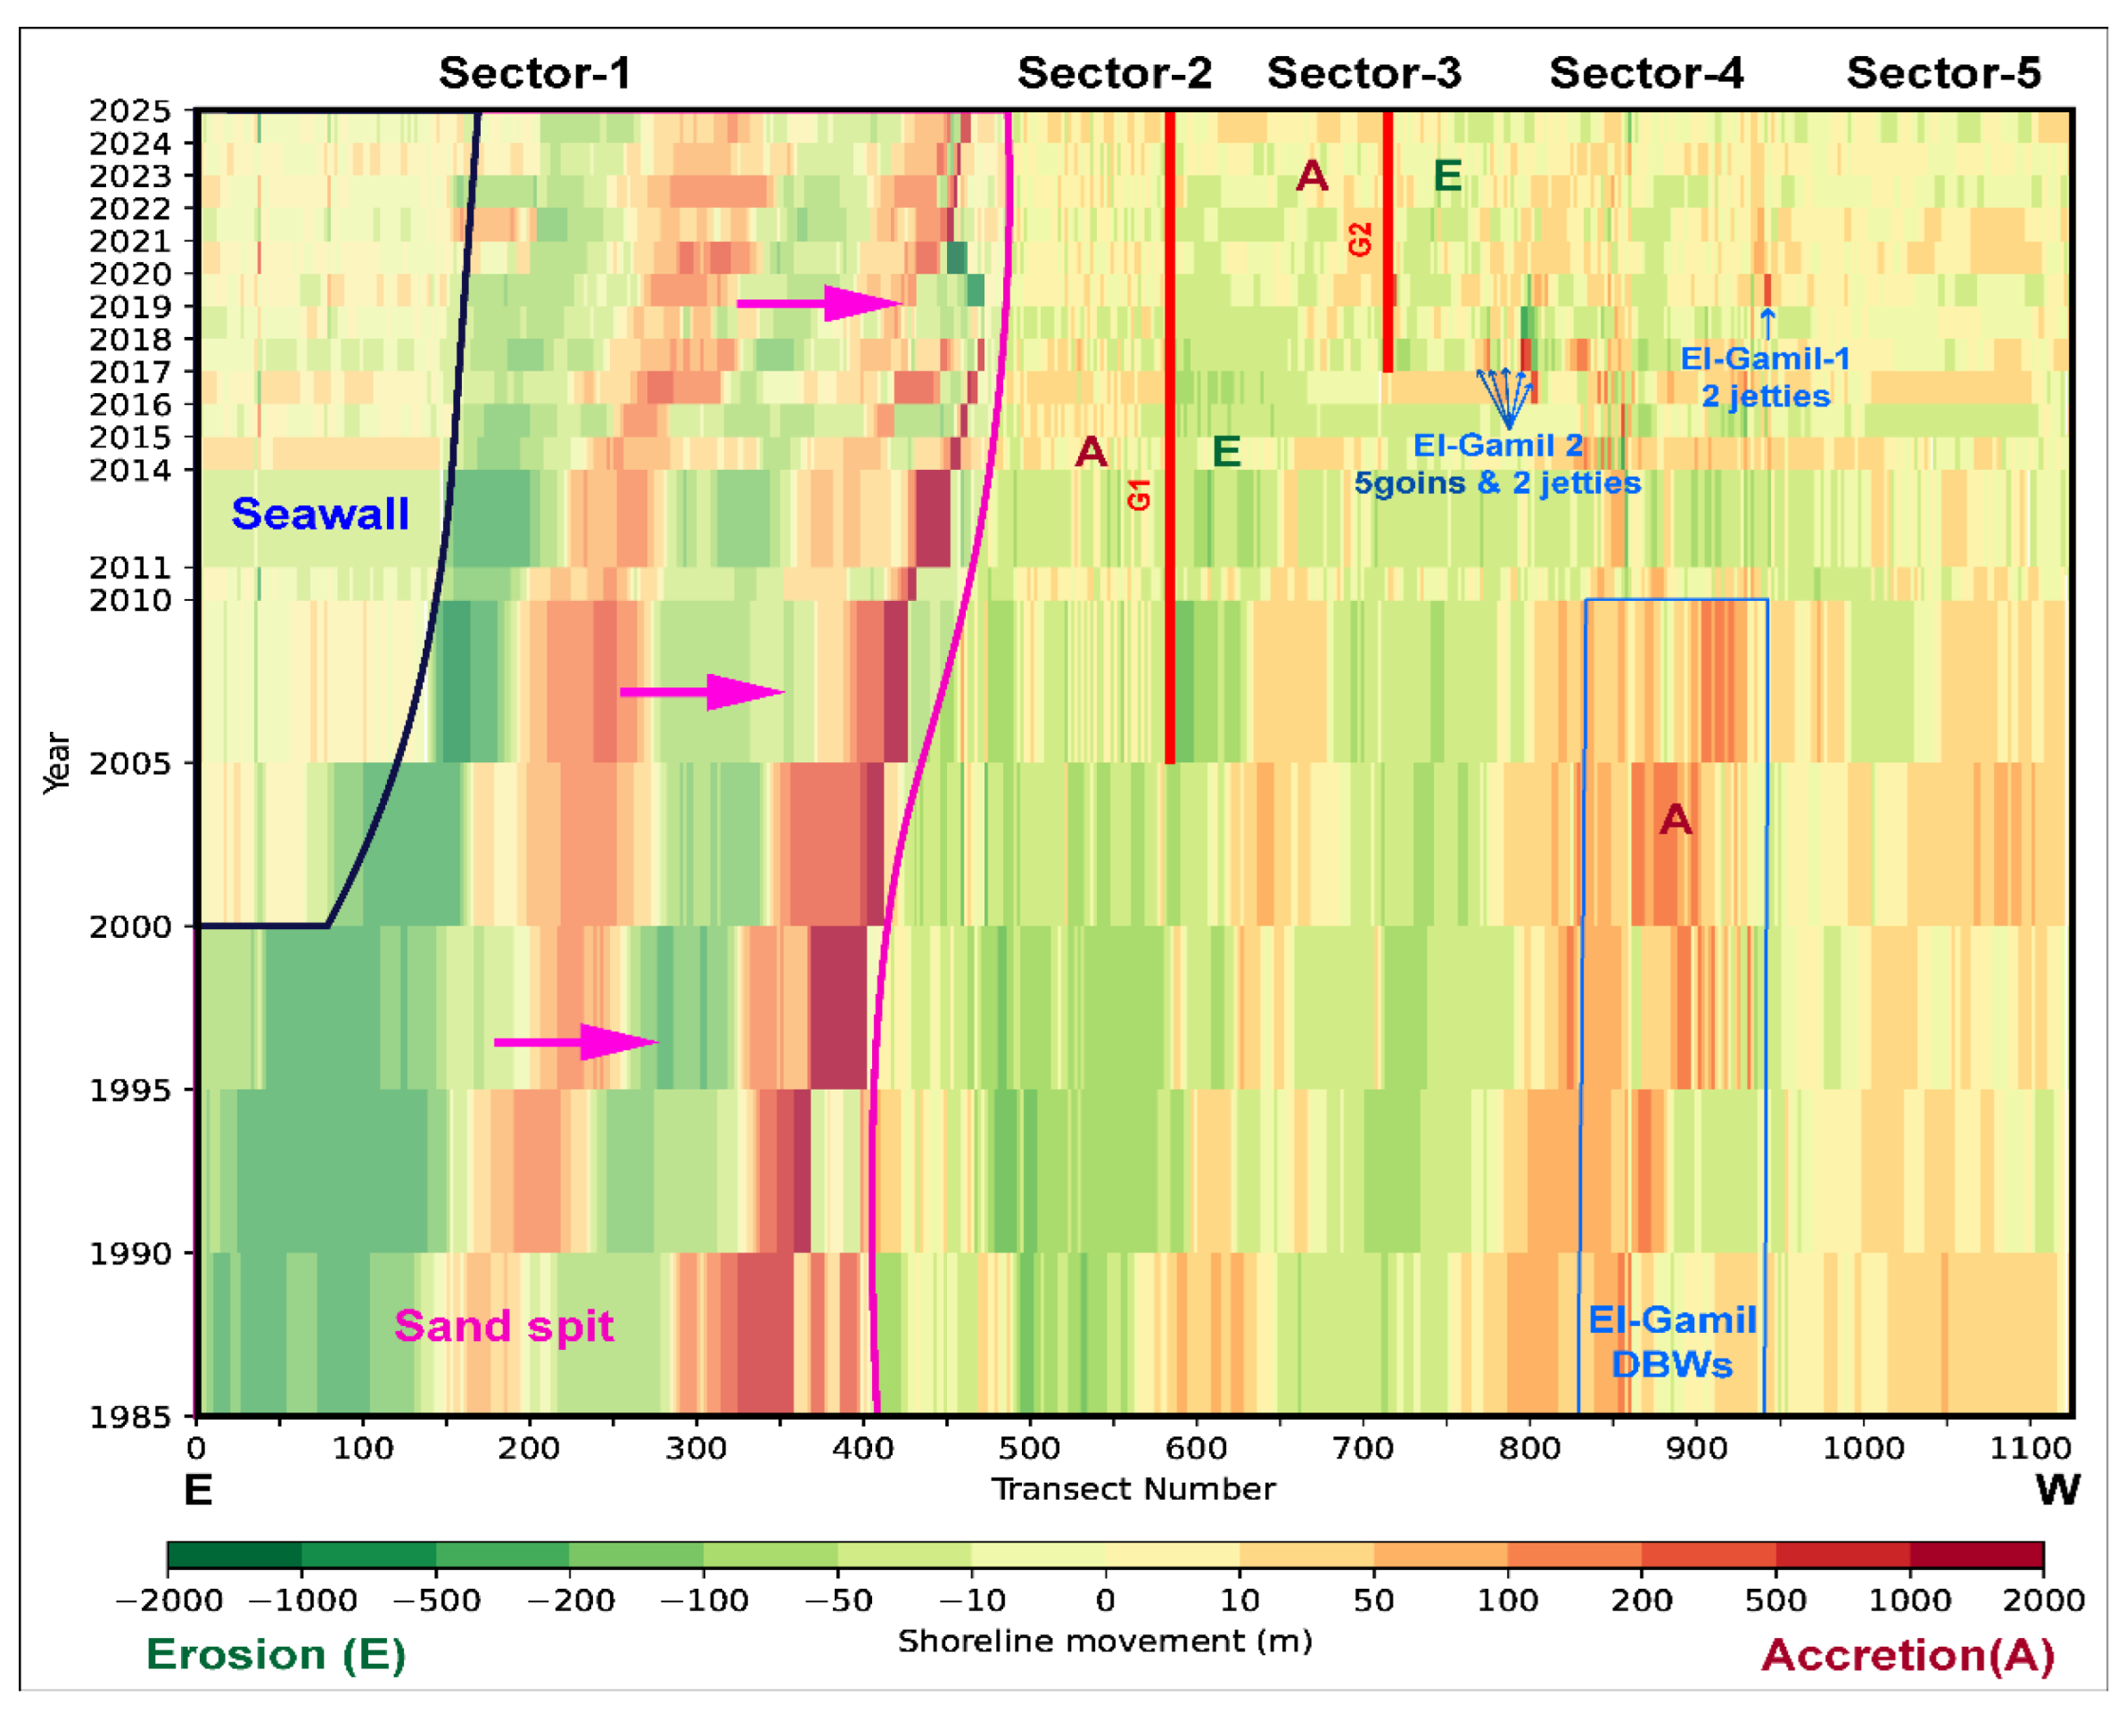
Damietta–Port Said coastline exhibits exceptionally high shoreline dynamism over the past four decades (
Figure 1A). Despite its vulnerability [
4], the area is not an undeveloped natural coastline; rather, it encompasses several residential communities, major tourist resorts, industrial facilities, and critical coastal infrastructure. This coastal strip also forms the primary protective barrier beach between the Mediterranean Sea and Lake Manzala, underscoring its strategic environmental and socio-economic importance. Given the area’s geomorphic sensitivity, long history of human intervention, and the diversity of coastal protection measures constructed along it, the shoreline was subdivided into five sectors, each defined by distinct engineering activities and corresponding morphodynamic responses (
Figure 1A,
Figure 5,
Figure 6).
A general west-to-east sediment transport trend dominates the entire coastline, consistent with the prevailing wave climate, coastal currents, and wind regime (
Figure 2A;
Figure 3A,B). These conditions generate a strong eastward longshore drift, consistent with previous findings for the Nile Delta coast [
6,
12]. Accordingly, this coastline is subdivided into five sectors, which described as follow:
Sector-1 (Damietta Promontory and Sand spit) encompasses the highly dynamic Damietta sand spit, a recurved barrier extending ≈12 km southeastward from the eastern bank of the Damietta River branch (
Figure 1A,
Figure 2A). DSAS results indicate that the spit head underwent extreme shoreline retreat with local NSM exceeding -1 km of landward erosion between 1985 and 2025 (
Figure 1A,
Figure 2A,
Figure 5,
Figure 6). Over the same interval, the distal southeastern tip of the spit migrated seaward and southeastward by ≈ 3100 m, reflecting its rapid and continuous positional shift (
Figure 1A,
Figure 2A,
Figure 6). Between 2000 and 2006, a 6.5-km seawall was constructed along the proximal, urbanized section of the spit to protect the shoreline of Ezbet El-Burg (
Figure 1A,
Figure 2,
Figure 6). This intervention stabilized the directly fronted area, which had been subject to severe erosion prior to construction. However, the structure did not halt the overall migration of the sand spit, as eastward sediment transport continued uninterrupted through 2025.
Sector-2 occupies the immediate downdrift shadow of the Damietta sand spit and is strongly influenced by its hydrodynamic sheltering effect. In 2005, Groin (G1), a 430-m-long groin, was constructed to secure a water passage supplying nearby aquaculture facilities (
Figure 1A,
Figure 2A,
Figure 4). Following its installation, DSAS analyses show pronounced sediment accretion on the updrift side of the groin, accompanied by persistent shoreline retreat downdrift, with NSM between 2005 and 2025 ranging from -250 to -330 m and LRR from -14 to -16 m/yr (
Figure 1A,
Figure 2A,
Figure 4,
Figure 5,
Figure 6).
Sector-3 encompasses critical industrial and service facilities along the shoreline, including the Petrojet Pipe-Coating Plant, the Pharaonic Petroleum Company (PHPC) administrative complex for the Zohr gas field, and the United Gas Derivatives Company (UGDC). In 2017, Groin (G2) was constructed at the entrance of a waterway supplying the aquaculture ponds and was subsequently adapted to function as a small-boat harbor (
Figure 1). DSAS analyses indicate pronounced sediment accumulation on the updrift side of G2 between 2017 and 2025 (NSM: +180 to +210 m; LRR: +22.5 to +26.25 m/yr) and persistent shoreline retreat downdrift (NSM: -60 m; LRR: -7.5 m/yr), mirroring the sediment-trapping patterns observed in Sector-2.
Sector-4 (El-Gamil Inlets sector) is the most heavily engineered segment of the entire coastline and contains the highest density of coastal structures. It encompasses El-Gamil-1 and El-Gamil-2, the two principal inlets that provide seawater exchange between Lake Manzala and the Mediterranean Sea. In 1986, six detached breakwaters (DBWs) were constructed offshore. Their length, gap width, and distance from the shore were such that they rapidly induced complete tombolo formation, transforming the originally detached structures into features now fully connected to the mainland (
Figure 1B, C). DSAS analyses indicate NSM of +150–+210 m and LRR of +3.5 to +6.8 m/yr (
Figure 5,
Figure 6). Beginning in 2017, multiple short groins (≈60 m) were installed along the sector primarily to protect existing shoreline infrastructure, with stabilization, rather than deliberate progradation, being the explicit design objective (
Figure 1,
Figure 2,
Figure 6). To eliminate recurrent siltation of El-Gamil Inlet 2, a defense system comprising five groins (125–225 m, spaced ≈180 m) and two jetties was constructed immediately at the inlet. Similarly, in 2020, two jetties were constructed at El-Gamil Inlet 1. These structures interrupted the dominant west-to-east longshore sediment transport, generating intense accretion on their updrift (western) sides while completely blocking sediment bypass toward the inlets. As a direct consequence, severe and uninterrupted erosion has persisted along the downdrift (eastern) flanks of both inlets through 2025, as clearly documented by DSAS transect statistics and shoreline position analysis (
Figure 1B,C,
Figure 2,
Figure 5,
Figure 6).
Sector-5 has exhibited the highest shoreline stability along the study area over the last decade (2015–2025). Coastal protection works were mainly designed to safeguard the Damietta–Port Said international coastal highway and adjacent tourist resorts. The main structure is a 3.3-km revetment-seawall, constructed immediately landward of the backbeach and running parallel to the highway (31°17′05.8″N, 32°13′28.2″E to 31°16′47.7″N, 32°15′15.8″E), effectively preventing wave overtopping and roadway inundation. Fourteen short groins (45–50 m long, spaced ≈170 m) were installed perpendicular to the shoreline to retain beach width for recreational use and protect resort infrastructure. DSAS analyses indicate near-complete shoreline stabilization in this sector, with very low NSM from 2015 to 2025. Long-term trends over the last four decades show limited shoreline migration (NSM < 160 m) and low LRR (+1 to +3.5 m/yr), representing the most stable coastal segment along the Manzala–Port Said tract (
Figure 5 and
Figure 6).
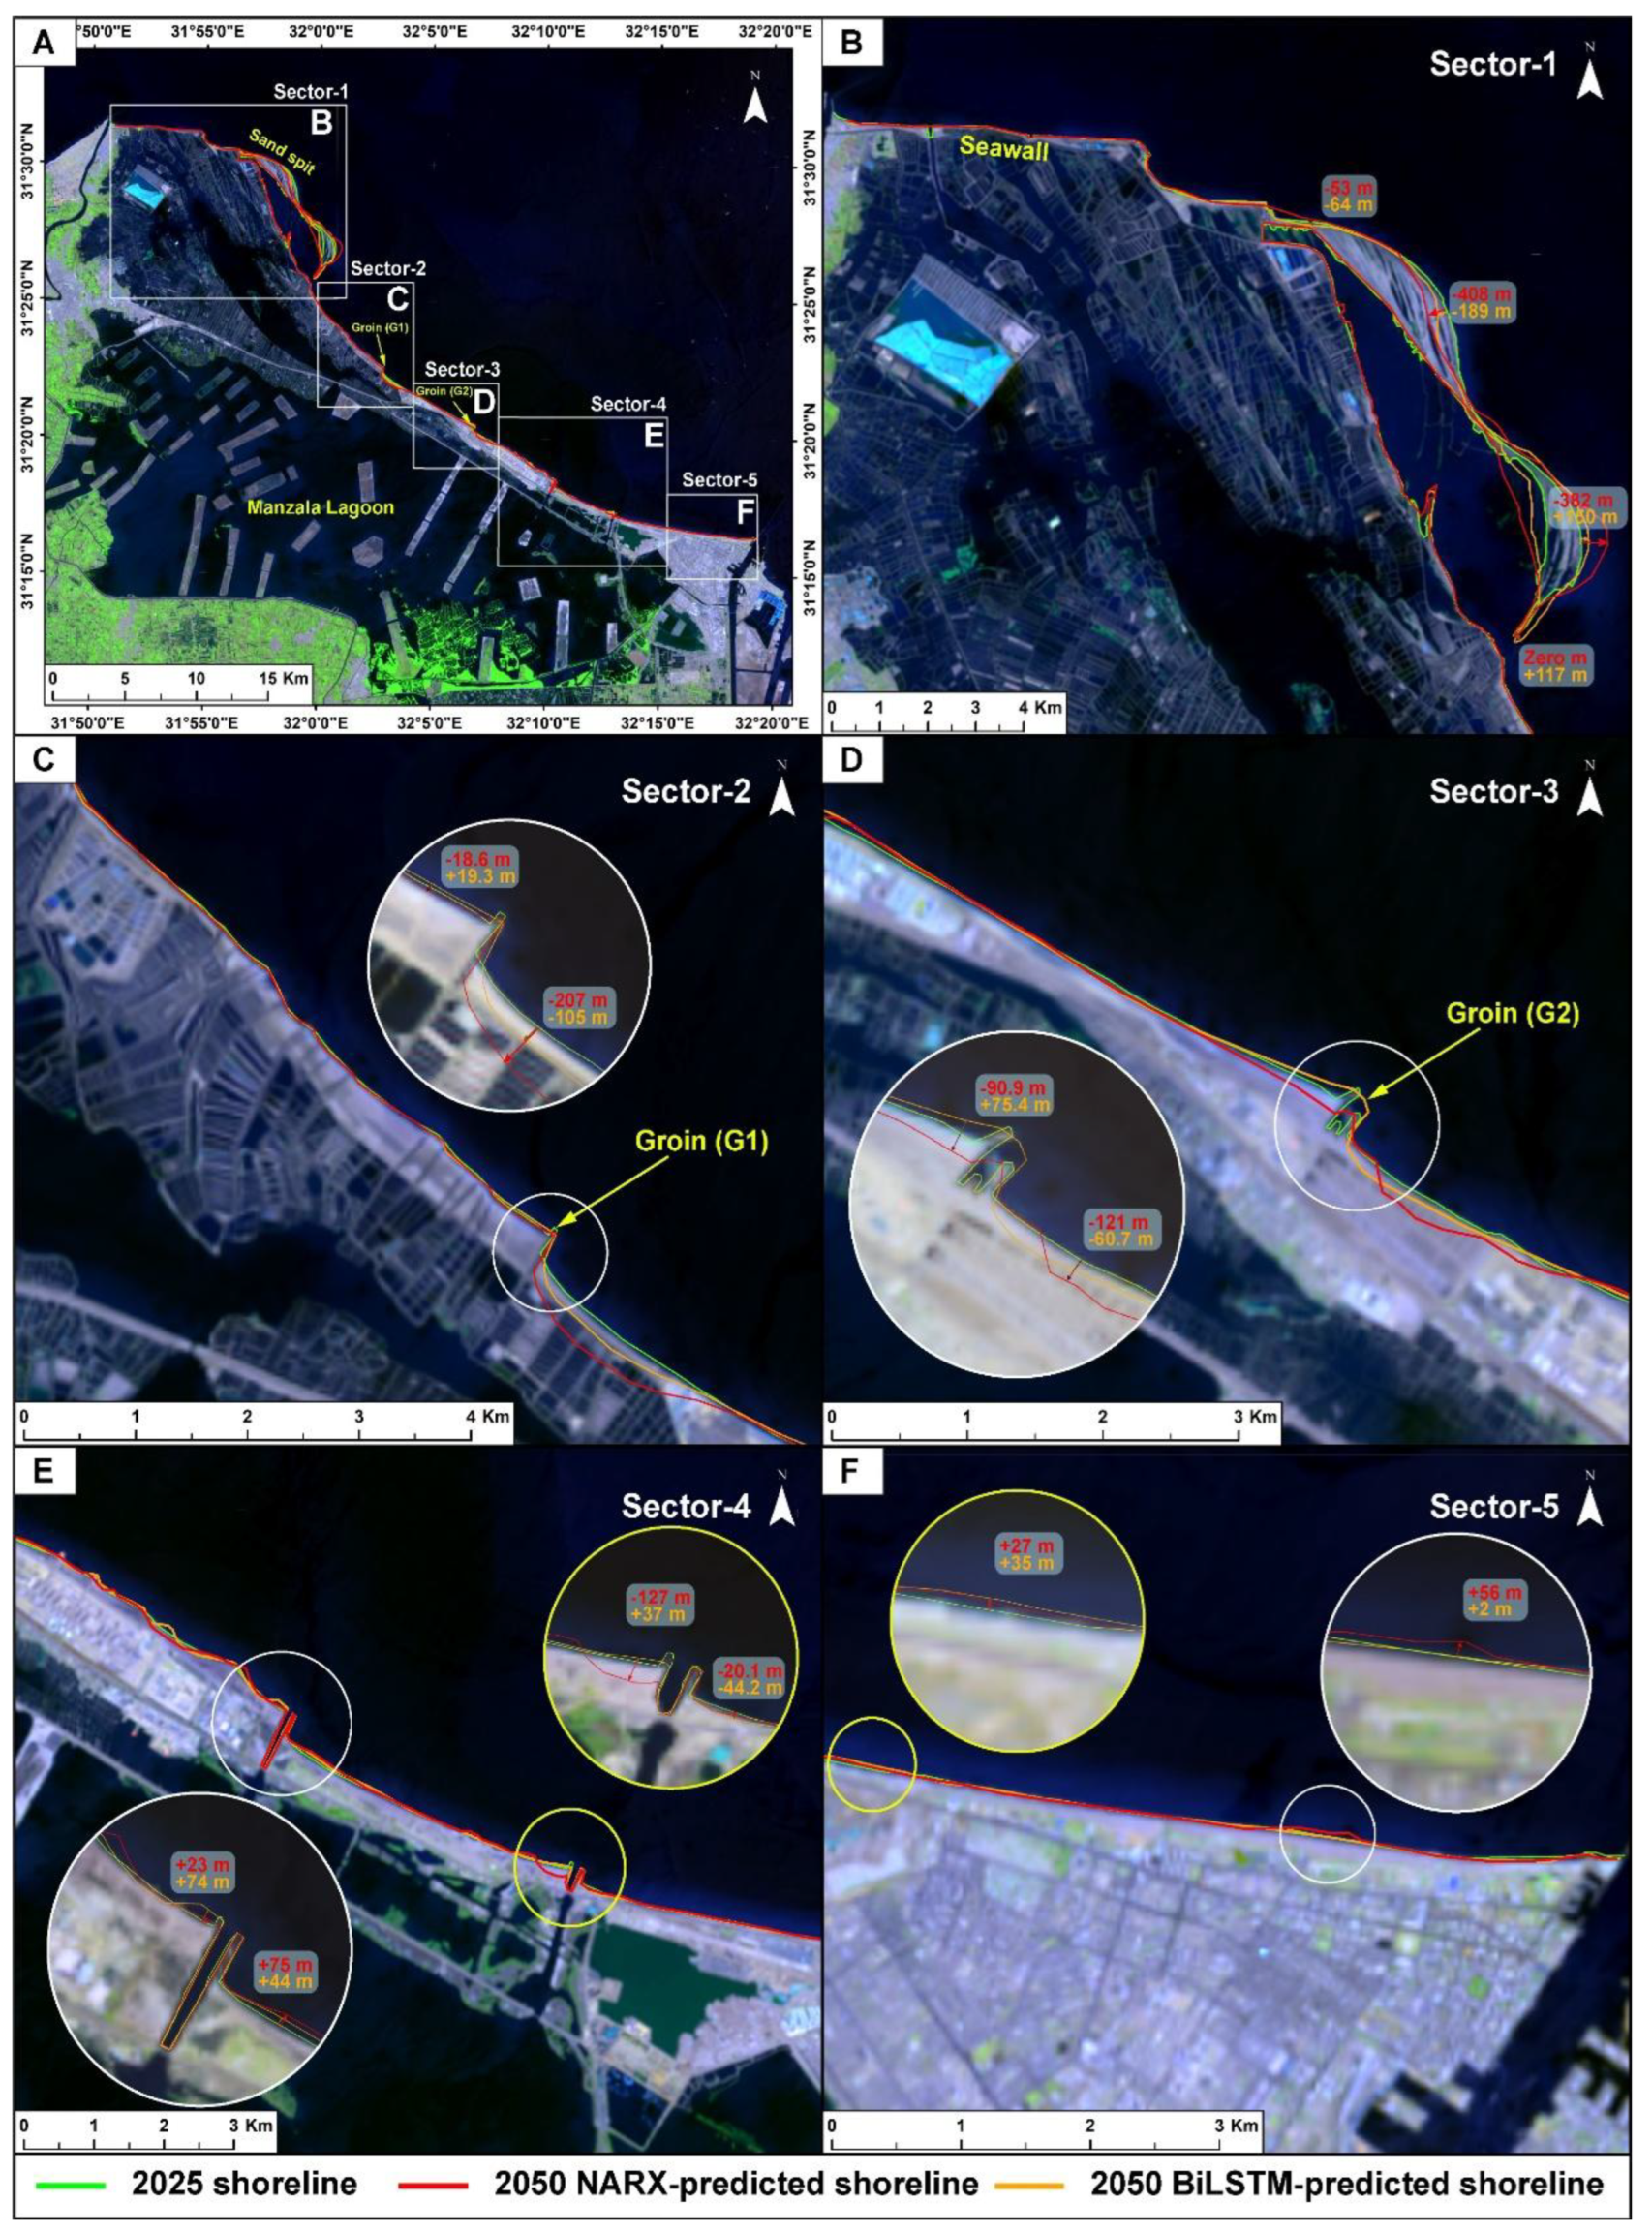
3.2. AI-Based 2050 Shoreline Position Forecasts
The 2050 shoreline projections were generated using two data-driven predictive models, NARX and BiLSTM, trained under identical conditions and using the same historical, 1985–2025, shoreline dataset. Overall, both models reproduced the general large-scale shoreline configuration of the study area; however, their predictive behaviors showed noticeable differences. While the BiLSTM model generally produced conservative and geologically consistent forecasts, the NARX model occasionally generated anomalous or exaggerated deviations that were not fully aligned with the historical shoreline trajectory or with the established sediment-transport pattern along the coast.
Sector 1: both models consistently predicted complete shoreline stability along the 6.5-km seawall-protected zone, with the 2050 shoreline fully coincident with the 2025 position and no indication of retreat or accretion (
Figure 7B). Across the exposed seaward face of the sand spit, the NARX model projected a substantial landward retreat reaching ≈385 m by 2050, relative to the 2025 position. It also forecasted continued eastward migration of the distal spit tip by ≈382 m. In contrast, the BiLSTM model produced more moderate estimates, predicting ≈189 m of retreat along the seaward face and ≈150 m of eastward extension (
Figure 7B). At the distal part of the spit, the models diverged: while NARX suggested negligible positional change in the spit’s margin, the BiLSTM model predicted a ≈117 m southeastward shift, indicating continued reorientation of the spit’s curvature through 2050 (
Figure 7B). While the NARX model exhibited marked difficulty in forecasting shoreline behavior in this highly dynamic sector, reflected in RMSE values that in some cases exceeded 300 m, particularly in predicting the sand-spit migration, the BiLSTM model demonstrated higher training stability and more reliable predictive performance (
Figure 8).
In Sector-2, both models reproduced the pronounced alongshore curvature of the shoreline adjacent to Groin G1 (
Figure 7C). The 2050 NARX prediction shows a markedly erosion along the downdrift side of the groin, with retreat magnitudes locally reaching -207 m, whereas the BiLSTM model forecasts a more moderate recession of -105 m (
Figure 7C). On the updrift side, both models predicted limited positional change relative to 2025, but the NARX model places the 2050 shoreline slightly farther landward (-18 m), whereas the BiLSTM forecast remarkable accretion (+19.3 m) (
Figure 7C). Persistent learning instability in the downdrift zone was evident in the NARX model, with RMSE reaching up to 47 m in this sector, whereas the BiLSTM model maintained a more consistent training performance throughout (
Figure 8).
In Sector-3, near G2 (
Figure 7D), both models successfully reproduce the shoreline offset induced by the structure. However, their responses differ markedly on the updrift side. The NARX model predicts updrift erosion, placing the 2050 shoreline NSM of
-90.9 m landward relative to 2025, whereas the BiLSTM model forecasts updrift accretion, advancing the shoreline by +75.4 m. On the downdrift side of G2, both models consistently indicate continued erosion. The NARX model shows a maximum retreat of -121 m, while the BiLSTM model estimates a comparatively lower erosion magnitude of
-60.7 m (
Figure 7D). Despite differences in predicted magnitudes, both models correctly capture the spatial pattern of change characterized by downdrift erosion (
Figure 7D). Both predictive models experienced a certain degree of difficulty in learning and forecasting the complex shoreline behavior around G2, particularly due to the sharp morphological gradients imposed by the structure. Nevertheless, the BiLSTM model exhibited slightly higher training stability and more consistent predictive performance compared to the NARX model in this sector (
Figure 8).
Sector-4 exhibits the most complex shoreline geometry due to the concentration of groins, detached breakwaters, and jetties (
Figure 7E). Across the groins west of El-Gamil-2, the NARX model forecasts minor accretion of up to +23 m, whereas the BiLSTM model predicts a larger accretion of +74 m (
Figure 7E). Along the shoreline updrift of the El-Gamil-1 inlet, the NARX model again yields greater retreat (up to –127 m), while the BiLSTM model forecasts shoreline accretion of +37 m (
Figure 7E). On the downdrift eastern jetties of El-Gamil-2, both models indicate continued accretion toward 2050, with the NARX model projecting +75 m compared to +44 m from the BiLSTM model (
Figure 7E). In contrast, on the downdrift side of the El-Gamil-1 inlet, both models indicate continued retreat through 2050, reaching –20.1 m for the NARX model and –44.2 m for the BiLSTM model (
Figure 7E).
Sector-5 remains the most stable portion of the coastline in the forecasts (
Figure 7F). Along the section fronted by the 3.3-km revetment, both models maintain the 2050 shoreline effectively superimposed on the 2025 position, with only minimal local displacement (
Figure 7F). Across the groin-controlled beach segments, NARX predicts modest seaward protrusions (up to +56 m) relative to 2025, while the BiLSTM model yields smaller forward shifts (
Figure 7F). Landward shifts in the downdrift pockets between groins remain limited in both models and do not exceed a few meters (
Figure 7F). The two forecasts therefore converge on a state of continued shoreline stability for the sector (
Figure 7F).
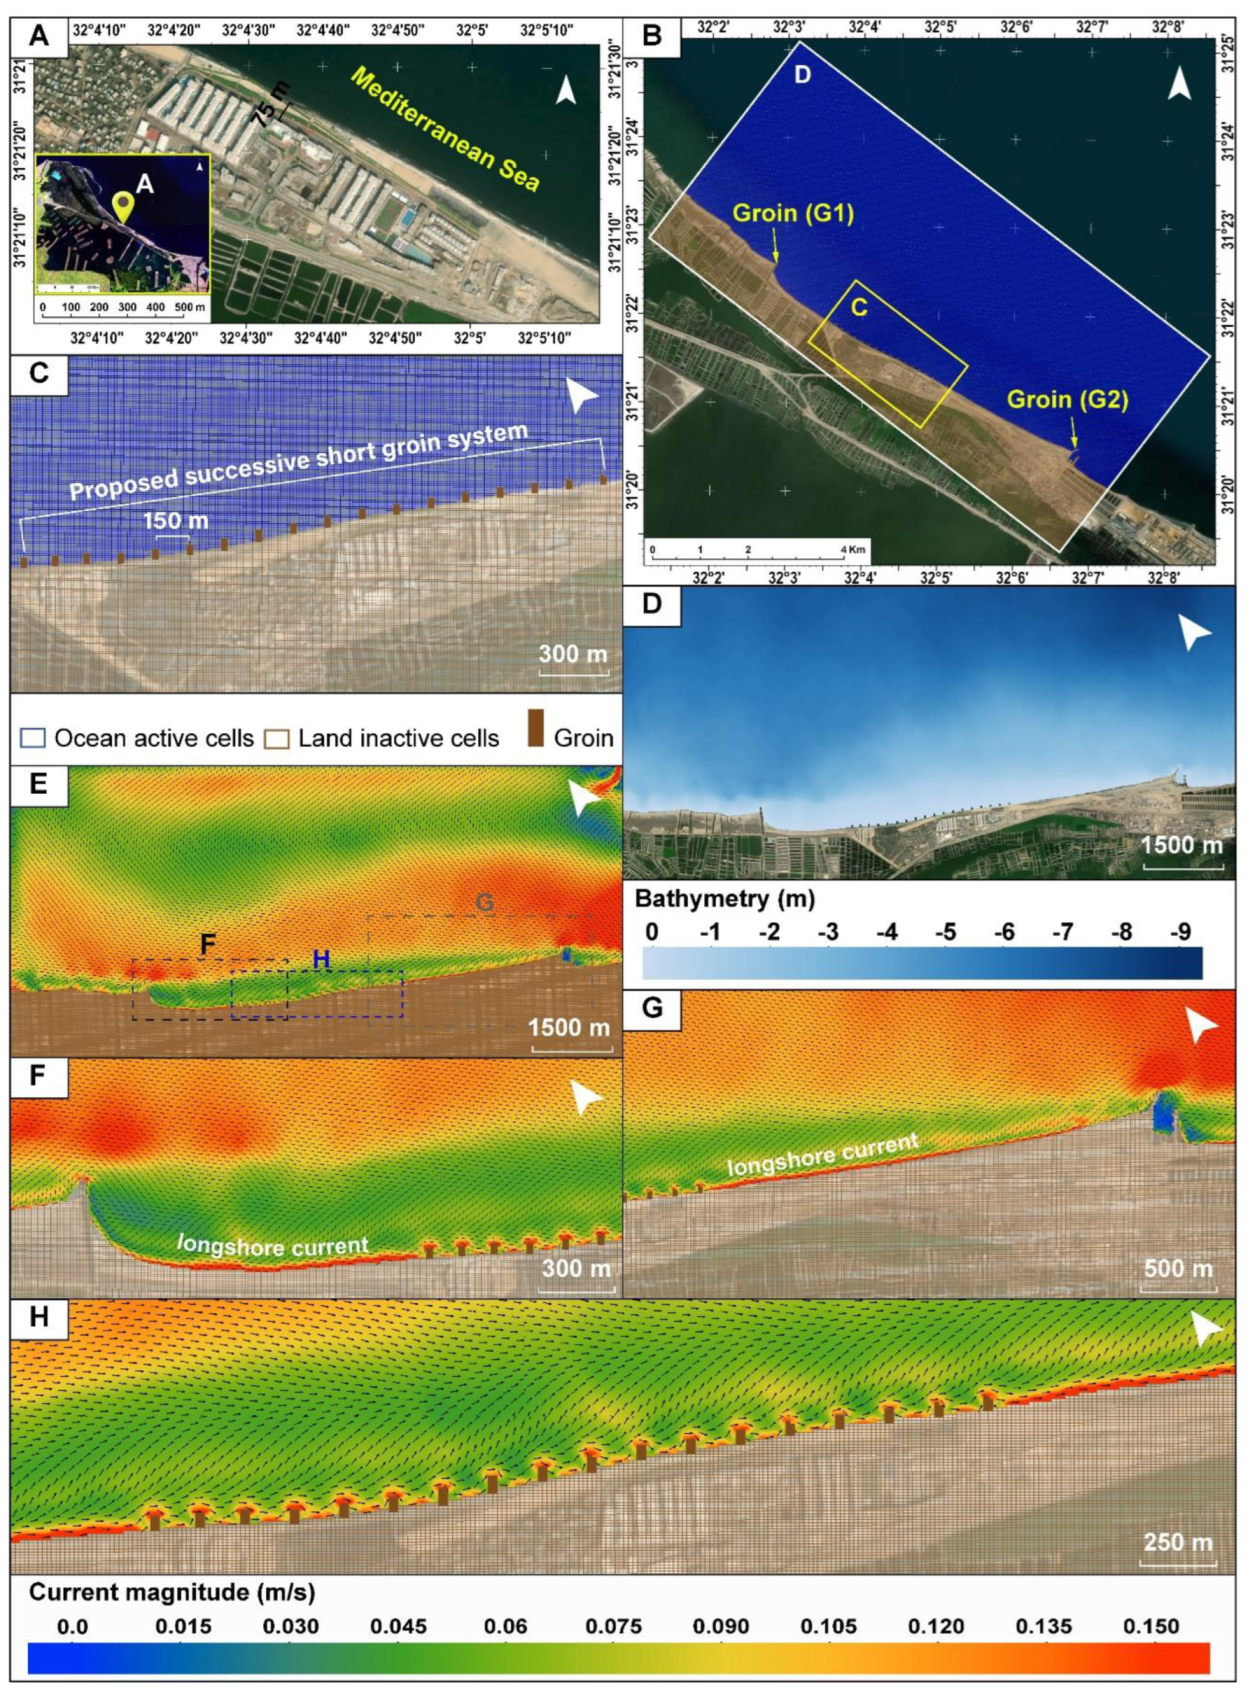
3.3. Hydrodynamic Model Simulation Results
The coupled wave–flow CMS-Flow simulations confirm the effectiveness of the proposed successive short-groin system (45–50 m length, 150 m spacing) in Sectors 2 and 3 (
Figure 9). Compared with the present-day configuration, the new groins markedly disrupt the continuity of the predominant eastward longshore current, reducing longshore current speeds by 40–60 % and dissipating wave-driven momentum within the groin field (
Figure 9E–H). Critically, the closely spaced, low-profile design suppresses the formation of strong return-flow eddies that typically develop in wider groin compartments (
Figure 9E), thereby minimizing localized scour and offshore sediment loss.
4. Discussion
4.1. Legacy of Sediment Starvation and the Aswan High Dam
The Aswan High Dam (AHD; 1964) abruptly halted the Nile’s sediment supply, reducing downstream flux by over 95 % and transforming the delta from net accretion to widespread erosion [
3,
5,
6]). The Nile River, formerly delivering ≈ 20 × 10
6 m
3/yr of sand-sized sediment, no longer nourished the northeastern delta coast, including the Damietta Promontory and the sand spit separating Lake Manzala from the sea [
4,
8,
62,
63,
64]. DSAS analysis confirms severe impact: the proximal portion of the sand spit retreated >1 km from 1985–2025 reflecting a near-complete cessation of natural beach replenishment (
Figure 5 and
Figure 6). Compounding this, Damietta Harbour jetties (1982) trapped eastward-moving littoral drift, further starving downdrift sectors, accelerating erosion, and driving the spit’s southeastward migration [
21,
64]. Comparable patterns are observed at the Rosetta and Burullus promontories, highlighting systemic post-AHD delta-wide erosion [
4,
6,
8,
63,
65,
66].
The combination of dam-induced sediment cutoff and harbor-induced transport disruption illustrates cascading anthropogenic effects, leaving the Damietta–Port Said coast highly vulnerable to further erosion, lagoon isolation, and infrastructure risk, emphasizing the need for adaptive coastal management and sediment-restoration strategies.
4.2. Morphodynamic Responses to Coastal Engineering Interventions
The five sectors of the Damietta–Port Said coast display the textbook morphodynamic fingerprint of hard-engineering in a sediment-starved, oblique-wave environment: pronounced updrift accretion and intensified downdrift erosion caused by interruption of eastward littoral drift [
67]. In sediment-deficient systems such as the post-AHD Nile Delta, even modest protruding structures amplify alongshore imbalances and produce persistent deficits [
3,
6,
11,
12,
64]
The 6.5-km seawall, at Ezbet El-Burg, successfully stabilized the protected urban shoreline, halting the >1 km retreat recorded between 1985 and 2000 (
Figure 1A,
Figure 2A,
Figure 5,
Figure 6). However, by fixing the shoreline and blocking the natural sediment leakage from the proximal part of the Damietta spit, the structure disrupted alongshore sediment continuity. Under ongoing wave-driven transport, this interception generated accelerated downdrift erosion east of the seawall and sustained southeastward migration of the spit’s distal tip (
Figure 1A,
Figure 5,
Figure 6). This morphodynamic pattern reflects the classic end-effect of coastal armouring, updrift stabilization coupled with downdrift sediment starvation, widely documented where shore-fixing structures interrupt littoral drift [
13,
14,
68]. Similar end-effects have been reported globally, including pronounced downdrift recession at Kingscliff, New South Wales, Australia [
69,
70,
71], and sustained erosion along the armored coasts of South Bali, Indonesia [
72]. The observed response is also consistent with the long-term promontory adjustments across the Nile Delta under cumulative impacts of AHD-induced sediment deficit and local engineering works [
7,
8].
Sectors-2 and -3 (G1, G2 groins). Groins produced rapid updrift salients (e.g., NSM +180 to +210 m at G2) and deep downdrift embayments (NSM -50 to -70 m) (
Figure 3C,
Figure 5,
Figure 6). This partitioning reflects classic groin mechanics under oblique wave approach, whereby impermeable protrusions trap sediment on the updrift side and starve the lee side [
6,
64]. Numerical and field studies confirm groin fields transfer erosional risk downdrift unless paired with bypassing or nourishment [
21]. Similar morphodynamic responses have been reported at engineered groin systems worldwide, including at Virginia Beach, USA [
73], and the Algarve coast, Portugal [
74], reinforcing the universal applicability of groin-induced sediment partitioning.
Sector-4 (El-Gamil inlets and DBWs). Detached breakwaters rapidly evolved into tombolos (NSM +150 to +210 m; LRR +3.5 to +6.8 m/yr), consistent with the tombolo-formation envelope when breakwater geometry and spacing favor shore connection [
64,
65,
75]. Subsequent groin and jetty installations at El-Gamil Inlets 1 and 2 (2017–2020) effectively halted sediment bypassing, intensifying updrift accretion and causing uninterrupted downdrift erosion, a well-documented inlet-jetty starvation effect (
Figure 5,
Figure 6) [
8].
Sector-5, in this sector, a combination of continuous revetment and closely spaced short groins has achieved relative long-term shoreline stability. Using shorter groins minimizes “shadow” effects while allowing sand redistribution, and when deployed as a groin field, they balance infrastructure protection with minimal system-wide disruption. Similar strategies are supported by field and numerical studies: for instance, a double 15 m permeable groin system achieved net shoreline advance and effective bypassing along the northern Yucatan coast, Gulf of Mexico [
76], and multi-groin systems were shown to regulate longshore sediment transport in groin-field configurations [
77]. Furthermore, model-based design guidance emphasizes optimizing groin spacing and combining groin fields with shore-parallel structures to reduce downdrift impacts [
77], and comparable groin-field engineering has proven effective along the Rosetta Promontory in the Nile Delta [
78] and east of Al-Arish Port [
79].
Overall, these sectoral responses show that isolated hard defences in a sediment-starved, high-energy coast redistribute rather than solve erosion risk [
67]. Persistent DSAS patterns highlight the need for sediment-compatible strategies, nourishment, engineered bypassing, and adaptive groin design, combined with system-scale planning instead of more impermeable structures.
4.3. Limitations and Comparative Performance of Shoreline Predictive Models
This study provides the first forward-looking predictive model of the Damietta sand spit, a morphodynamically active recurved barrier that has historically migrated southeastward at rates of 70–100 m/yr (
Figure 5,
Figure 6). Previous work has been limited to retrospective shoreline reconstructions, which consistently documented the spit’s exceptional variability, its post-AHD retreat exceeding 1 km, and its cyclic reconfiguration under disrupted longshore transport [
8,
9,
11,
12,
13,
14]. As our results reveal (
Figure 5,
Figure 6), classical tools such as DSAS remain invaluable for quantifying historical trends but can't generate confident forecasts in highly nonlinear, non-stationary systems where migration rates shift abruptly accumulated engineering impacts [
9,
49,
50]. Methods like LRR and EPR assume sustained, monotonic trajectories; in Damietta, these assumptions produce unrealistic futures (see
Figure 8 and
Figure 9 in [
9].
To address these limitations, we implemented RNN architectures, NARX and BiLSTM, capable of modelling nonlinear shoreline sequences. NARX networks have been successfully applied in environments dominated by non-stationary behaviours, such as wave forecasting, sediment transport fluctuations, and discharge-driven hydrological variability, owing to their ability to incorporate exogenous forcings [
80,
81]. However, the Damietta shoreline presents an additional level of complexity: directional reversals in sediment trends (accretion → erosion → accretion), particularly at the sand spit, groin updrift and downdrift zones, and near the El-Gamil inlets. Such bidirectional fluctuations are known to destabilize NARX multi-step forecasting, causing overshooting under rapid sign reversals [
82,
83]. These issues manifested in our results as exaggerated erosion predictions (e.g., 207 m retreat in Sector-2) and noise-amplified fluctuations (
Figure 7,
Figure 8A), consistent with documented NARX sensitivities in variable-transport regimes [
83].
In contrast, BiLSTM delivered more stable and geomorphologically coherent forecasts. By processing sequences in both forward and backward temporal directions, BiLSTM preserved contextual dependencies critical to shoreline mobility, reproducing expected patterns such as updrift accretion (
Figure 7C, D) and downdrift erosion (
Figure 7C, D) around groins. Its predictions remained conservative and aligned with longshore transport basics [
84]. RMSE distributions corroborate this advantage: BiLSTM achieved median errors of 1.3–29.41 m across sectors, compared with NARX’s 2.1–52.1 m, with notable improvements in fluctuation-prone downdrift pockets near G1, G2, and El-Gamil inlets jetties (
Figure 8). Similar performance gains have been reported in coastal and hydrological time-series modelling, where BiLSTM outperforms NARX by 20–30% under alternating erosion–accretion signals due to its bidirectional gating and reduced sensitivity to noise [
85,
86].
Overall, while NARX remains highly effective for exogenously forced nonlinear systems, the fluctuated highly dynamic sediment regime of study area, characterized by frequent sign reversals, favours architectures like BiLSTM that can internally resolve bidirectional sequence dependencies. These results highlight the potential for hybrid RNN frameworks to further enhance coastal forecasting in similarly complex deltaic environments.
4.4. Adaptive Strategies for Sustainable Coastal Management
The historical record and predictive forecasts presented here underscore a fundamental challenge for the Damietta–Port Said coast: the near-total loss of fluvial sediment supply following the AHD has transformed a once-prograding deltaic shoreline into a sediment-starved system where any interruption of the residual eastward longshore drift rapidly generates deficits that cannot be naturally replenished [
3,
6,
8]. The Damietta sand spit (Sector-1) historically acted as the primary natural sediment source for the eastern barrier, with its highly dynamic distal tip continuously releasing sand into the littoral system [
11,
13]. Our results (
Figure 5,
Figure 6) demonstrate that protecting the proximal urbanized apex with a seawall, while locally effective, has severed this supply, accelerating downdrift erosion and rendering the entire 60-km barrier increasingly vulnerable.
Rather than continuing to armour isolated segments with seawalls, an approach that merely displaces erosion eastward, a more sustainable strategy is to preserve the Damietta spit as a dynamic, unmanaged sediment reservoir. Allowing natural spit migration and episodic breaching would restore a portion of the lost eastward flux, mimicking pre-AHD conditions and providing a low-cost, self-regulating nourishment mechanism for the downdrift coast [
87]. Successful precedents include the unmanaged barrier-spit systems at the Copper River delta, Alaska (60°13'37.2"N, 145°06'09.1"W), where natural overwash and spit elongation sustain downdrift beaches despite glacial sediment reduction [
87]. , the dynamic barrier Northern Outer Banks, North Carolina (35°31'27.9"N, 75°28'13.1"W), where the elongation of a sand spit built a large coast [
87], and the dynamic barrier islands of the Virginia coast, USA (37°23'34.2"N, 75°51'54.7"W), where managed retreat and spit preservation have maintained sediment continuity for decades.
Hard structures alone are insufficient for the severely depleted Sectors 2-5. Seawalls and revetments (Sectors 1 and 5) protect infrastructure but reflect wave energy and prevent beach recovery [
68], detached breakwaters (Sector 4) induce rapid tombolo formation but are prohibitively expensive for widespread applicability [
64,
65,
75], and traditional long groins (G1 and G2) simply transfer erosion downdrift, and traditional long groins, G1 and G2, simply transfer erosion downdrift [
20,
67]. In contrast, the existing closely spaced short-groin field in Sector 5, the only sector achieving long-term stability, demonstrates that low-profile, successive short groins (≤50 m length, ≈170 m spacing) effectively retain sand while permitting sufficient bypassing to minimize severe downdrift impacts [
77,
88]
Hydrodynamic modelling (
Figure 9) confirms that a similar successive short-groin system (45–50 m length, 150 m spacing) proposed for the critically eroding resort beach between Sectors-2 and 3 (
Figure 9A) would reduce nearshore current velocities by 40–60 % and suppress rip-current eddies between groins (
Figure 9E–H). Once the compartments become filled, the system rapidly transitions into a sediment-laden coast, facilitating efficient bypassing of littoral drift towards the downdrift side with minimal shadowing or starvation. This outcome has been precisely observed in Sector 5. It is globally compared with the northern Yucatán coast, Mexico (21°31'15.3"N, 87°23'09.3"W). Where closely spaced short groins constructed between 2003 and 2009 restored longshore continuity [
89,
90] and Blekusu Coast, Ghana (5°59'25.1"N, 1°02'11.3"E), where similar low-profile arrays achieved complete sediment infilling with negligible downdrift impact [
91]. Implementation of successive short groins, combined with strategic nourishment using locally sourced sand and preservation of the Damietta spit as a natural feeder, offers a cost-effective, sediment-compatible pathway toward sustainable management. This hybrid approach reconciles immediate protection needs with long-term system resilience, providing a transferable model for other sediment-starved deltaic coasts facing similar anthropogenic pressures.
5. Conclusions
This study presents the first comprehensive, multi-decadal (1985–2025) assessment of shoreline dynamics along the 60-km Damietta–Port Said coastal sector of the Nile Delta, a highly urbanized and morphodynamically sensitive region that serves as a critical natural barrier protecting Lake Manzala and supporting major tourism and industrial infrastructure. DSAS analysis reveals pronounced spatial variability in shoreline behavior, driven by post-AHD sediment starvation and successive hard-engineering interventions. The Damietta sand spit (Sector-1) exhibits the highest dynamism, with more than 1 km of proximal retreat and ≈ 3100 m southeastward migration of its distal tip, whereas engineered sectors display classic updrift accretion–downdrift erosion patterns, which intensify with each successive structure. Sector-5, stabilized by a revetment and closely spaced short groins, is the only segment to achieve long-term equilibrium, emphasizing the effectiveness of low-impact, sediment-compatible designs.
By integrating multi-temporal satellite observations, DSAS-based shoreline change analysis, hydrodynamic modelling, and advanced AI predictive RNN models (NARX and BiLSTM), this study establishes a robust framework for understanding historical behavior, quantifying anthropogenic impacts, and predicting future coastal trajectories in a sediment-starved deltaic environment. Classical DSAS-based extrapolations were found inadequate for 2050 forecasting in this non-stationary, intervention-dominated system, often generating unrealistic projections that fail to account for abrupt morphodynamic shifts. In contrast, AI-driven RNN successfully captured nonlinear temporal dependencies and structural feedbacks. While NARX occasionally produced exaggerated anomalies in highly fluctuating zones (e.g., sand spit and groin downdrifts), BiLSTM consistently delivered geomorphologically coherent and conservative forecasts, accurately reflecting longshore sediment partitioning trends.
Hydrodynamic CMS-Flow modelling validates the proposed successive short-groin system (45–50 m length, 150 m spacing) as an effective, low-cost measure, reducing longshore current velocities by 40–60 % and suppressing rip-current eddies while allowing sufficient sediment bypassing. Combined with preserving the Damietta sand spit as a natural sediment source, this hybrid strategy provides a sustainable pathway to restore littoral continuity and mitigate erosion without the severe downdrift impacts typically associated with traditional long groins or impermeable seawalls.
Overall, these findings underscore the urgent need to shift from reactive hard-engineering toward adaptive, sediment-compatible strategies along sediment-starved deltaic coasts. By integrating high-resolution remote sensing, AI-based predictions, and targeted hydrodynamic interventions, this study provides a transferable framework for balancing immediate coastal protection with long-term resilience, ensuring that the Damietta–Port Said coastline can withstand escalating climate pressures while sustaining its vital ecological, economic, and cultural functions.
Author Contributions
Hesham M. El-Asmar conceptualized and supervised the research, conducted the fieldwork, developed the methodology, drafted and revised the final manuscript. Mahmoud Sh. Felfla conducted the fieldwork, performed hydrodynamic modeling and AI-based predictive models contributed to writing the manuscript. Amal A. Mokhtar conducted the fieldwork, performed remote sensing analyses and drafted manuscript.
Funding
This research received no external funds.
Institutional Review Board Statement
Not applicable.
Informed Consent Statement
Not applicable.
Data Availability Statement
Data will be available upon request.
Acknowledgments
This paper is part of the building capacity of the project (Sustainable Development of the Coastal zone between Ras El-Bar and Damietta Harbor in response to sea-level rise and climatic changes). The authors would like to express their sincere gratitude to the Academy of Scientific Research and Technology (ASRT) for funding the project through COP-27.
Conflicts of Interest
The authors declare no conflicts of interest. No personal circumstances or interest that may be perceived as inappropriately influencing the representation or interpretation of reported research results..
References
- Syvitski, J.P.M.; Kettner, A.J.; Overeem, I.; Hutton, E.W.H.; Hannon, M.T.; Brakenridge, G.R.; Day, J.; Vörösmarty, C.; Saito, Y.; Giosan, L.; Nicholls, R.J. Sinking deltas due to human activities. Nature Geoscience 2009, 2, 681–686. [Google Scholar] [CrossRef]
- Tessler, Z.D.; Vörösmarty, C.J.; Grossberg, M.; Gladkova, I.; Aizenman, H.; Syvitski, J.P.M.; Foufoula-Georgiou, E. Profiling risk and sustainability in coastal deltas of the world. Science 2015, 349, 638–643. [Google Scholar] [CrossRef]
- Stanley, D.J.; Warne, A.G. Nile Delta: recent geological evolution and human impact. Science 1993, 260, 628–634. [Google Scholar] [CrossRef]
- Hereher, M.E. Vulnerability of the Nile Delta to sea level rise: an assessment using remote sensing. Geomatics Natural Hazards and Risk 2010, 1, 315–321. [Google Scholar] [CrossRef]
- Stanley, D.J. Nile delta: extreme case of sediment entrapment on a delta plain and consequent coastal land loss. Marine Geology 1996, 129, 189–195. [Google Scholar] [CrossRef]
- Frihy, O.E.; Debes, E.A.; Sayed, W.R.E. Processes reshaping the Nile delta promontories of Egypt: pre- and post-protection. Geomorphology 2003, 53, 263–279. [Google Scholar] [CrossRef]
- Frihy, O.; Lawrence, D. Evolution of the modern Nile delta promontories: development of accretional features during shoreline retreat. Environmental Geology 2004, 46, 914–931. [Google Scholar] [CrossRef]
- El-Asmar, H.M.; Hereher, M.E. Change detection of the coastal zone east of the Nile Delta using remote sensing. Environmental Earth Sciences 2011, 62, 769–777. [Google Scholar] [CrossRef]
- Esmail, M.; Mahmod, W.E.; Fath, H. Assessment and prediction of shoreline change using multi-temporal satellite images and statistics: Case study of Damietta coast, Egypt. Applied Ocean Research 2019, 82, 274–282. [Google Scholar] [CrossRef]
- Frihy, O.E. The Nile Delta: Processes of heavy mineral sorting and depositional patterns. Developments in Sedimentology 2007, 49–74. [Google Scholar] [CrossRef]
- El-Asmar, H.M.; El-Kafrawy, S.B.; Taha, M.M.N. Monitoring Coastal Changes along Damietta Promontory and the Barrier Beach toward Port Said East of the Nile Delta, Egypt. J. Coast. Res. 2014, 297, 993–1005. [Google Scholar] [CrossRef]
- Tharwat, E.; Saad, M.E.; Sarhan, T. Assessment the impact of coastal protective structures on Damietta shoreline behaviour. J. Coast. Conserv. 2025, 29. [Google Scholar] [CrossRef]
- White, K.; El-Asmar, H.M.E. Monitoring changing position of coastlines using Thematic Mapper imagery, an example from the Nile Delta. Geomorphology 1999, 29, 93–105. [Google Scholar] [CrossRef]
- Elnabwy, M.T.; Elbeltagi, E.; Banna, M.M.E.; Elshikh, M.M.Y.; Motawa, I.; Kaloop, M.R. An approach based on Landsat images for shoreline Monitoring to support Integrated Coastal Management—A Case Study, Ezbet Elborg, Nile Delta, Egypt. ISPRS International Journal of Geo-Information 2020, 9, 199. [Google Scholar] [CrossRef]
- El-Asmar, H.M. Short term coastal changes along Damietta-port Said coast northeast of the Nile Delta, Egypt. J. Coast. Res. 2002, 18, 433–441. [Google Scholar]
- Elshinnawy, I.A.; Almaliki, A.H. Vulnerability assessment for sea level rise impacts on coastal systems of Gamasa Ras el Bar area, Nile Delta, Egypt. Sustainability 2021, 13, 3624. [Google Scholar] [CrossRef]
- Torresan, S.; Furlan, E.; Critto, A.; Michetti, M.; Marcomini, A. Egypt’s coastal vulnerability to Sea-Level rise and storm surge: present and future conditions. Integrated Environmental Assessment and Management 2020, 16, 761–772. [Google Scholar] [CrossRef]
- Day, J.; Goodman, R.; Chen, Z.; Hunter, R.; Giosan, L.; Wang, Y. Deltas in arid environments. Water 2021, 13, 1677. [Google Scholar] [CrossRef]
- Ezzeldin, M.M.; Rageh, O.S.; Saad, M.E. Assessment impact of the Damietta harbour (Egypt) and its deep navigation channel on adjacent shorelines. Revista De Gestão Costeira Integrada 2020, 20, 265–281. [Google Scholar] [CrossRef]
- El-Asmar, H.M.; Taha, M.M.N. Monitoring coastal changes and assessing protection structures at the Damietta Promontory, Nile Delta, Egypt, to secure sustainability in the context of climate changes. Sustainability 2022, 14, 15415. [Google Scholar] [CrossRef]
- El-Asmar, H.M.; Felfla, M.Sh.; El-Kotby, M.R.; El-Kafrawy, S.B.; Naguib, D.M. Multi-Decadal shoreline dynamics of Ras El-Bar, Nile Delta: Unraveling human interventions and coastal resilience. Scientific African 2025, 30, e02937. [Google Scholar] [CrossRef]
- Frihy, O.E.; Dewidar, K.M. Patterns of erosion/sedimentation, heavy mineral concentration and grain size to interpret boundaries of littoral sub-cells of the Nile Delta, Egypt. Marine Geology 2003, 199, 27–43. [Google Scholar] [CrossRef]
- ElKotby, M.R.; Sarhan, T.A.; El-Gamal, M. Assessment of human interventions presence and their impact on shoreline changes along Nile delta, Egypt. Oceanologia 2023, 65, 595–611. [Google Scholar] [CrossRef]
- Da Silva Pinto Bittencourt, A.C.; Dominguez, J.M.L.; Fontes, L.C.S.; Sousa, D.L.; Silva, I.R.; Da Silva, F.R. Wave Refraction, River Damming, and Episodes of Severe Shoreline Erosion: The São Francisco River Mouth, Northeastern Brazil. J. Coast. Res. 2007, 234, 930–938. [Google Scholar] [CrossRef]
- Oliveira, E.C.; Barboza, R.D.; Silva, B.G.G.; Filho, M.C.D. Erosion of four Brazilian coastal deltas: how dam construction is changing the natural pattern of coastal sedimentary systems. Anais Da Academia Brasileira De Ciências 2023, 95, e20220576. [Google Scholar] [CrossRef]
- Souza-Filho, P.W.M.E.; Diniz, C.G.; Souza-Neto, P.W.M.E.; Lopes, J.P.N.; Da Nascimento Júnior, W.R.; Cortinhas, L.; Asp, N.E.; Fernandes, M.E.B.; Dominguez, J.M. Mangrove Swamps of Brazil: Current status and impact of Sea-Level changes. The Latin American Studies Book Series 2023, 45–74. [Google Scholar] [CrossRef]
- Bird, E.C.F. Australia. Australia 2003, 1522–1642. [Google Scholar] [CrossRef]
- Lebrec, U.; Riera, R.; Paumard, V.; O’Leary, M.J.; Lang, S.C. Morphology and distribution of submerged palaeoshorelines: Insights from the North West Shelf of Australia. Earth-Science Reviews 2021, 224, 103864. [Google Scholar] [CrossRef]
- Earth Resources Observation and Science (EROS) Center. EarthExplorer. In Landsat 4-5 Thematic Mapper Level-2 Collection 2; 2020a. [Google Scholar] [CrossRef]
- Earth Resources Observation and Science (EROS) Center. EarthExplorer. Landsat 8-9 Operational Land Imager / Thermal Infrared Sensor Level-2 2020b, Collection 2. [CrossRef]
- McFeeters, S.K. The use of the Normalized Difference Water Index (NDWI) in the delineation of open water features. International Journal of Remote Sensing 1996, 17, 1425–1432. [Google Scholar] [CrossRef]
- Rouse, J.W.; Haas, R.H.; Schell, J.A.; Deering, D.W. Monitoring Vegetation Systems in the Great Plains with Erts. NASA Special Publication 1974, 351, 309. [Google Scholar]
- Tucker, C.J. Red and photographic infrared linear combinations for monitoring vegetation. Remote Sensing of Environment 1979, 8, 127–150. [Google Scholar] [CrossRef]
- Jensen, JR. Remote sensing of the environment: An earth resource perspective 2/e; Pearson Education India, 2009. [Google Scholar]
- Planet Team. Planet Application Program Interface: In Space for Life on Earth; San Francisco, CA, 2025. [Google Scholar]
- Copernicus Marine Service. Mediterranean Sea Physics Analysis and Forecast; 2025. [Google Scholar] [CrossRef]
- El-Asmar, H.M.; Felfla, M.Sh.; El-Kafrawy, S.B.; Gaber, A.; Naguib, D.M.; Bahgat, M.; Safty, H.M.E.; Taha, M.M.N. A little tsunami at Ras El-Bar, Nile Delta, Egypt; consequent to the 2023 Kahramanmaraş Turkey earthquakes. The Egyptian Journal of Remote Sensing and Space Science 2024, 27, 147–164. [Google Scholar] [CrossRef]
- ECMWF. ERA5: ERA5 hourly data on single levels from 1940 to present. Copernicus 2025. (accessed 5.1.25). Available online: https://cds.climate.copernicus.eu/datasets/reanalysis-era5-single-levels?tab=overview.
- Hersbach, H.; Bell, B.; Berrisford, P.; Hirahara, S.; Horányi, A.; Muñoz-Sabater, J.; Nicolas, J.; Peubey, C.; Radu, R.; Schepers, D.; Simmons, A.; Soci, C.; Abdalla, S.; Abellan, X.; Balsamo, G.; Bechtold, P.; Biavati, G.; Bidlot, J.; Bonavita, M.; De Chiara, G.; Dahlgren, P.; Dee, D.; Diamantakis, M.; Dragani, R.; Flemming, J.; Forbes, R.; Fuentes, M.; Geer, A.; Haimberger, L.; Healy, S.; Hogan, R.J.; Hólm, E.; Janisková, M.; Keeley, S.; Laloyaux, P.; Lopez, P.; Lupu, C.; Radnoti, G.; De Rosnay, P.; Rozum, I.; Vamborg, F.; Villaume, S.; Thépaut, J. The ERA5 global reanalysis. Quarterly Journal of the Royal Meteorological Society 2020, 146, 1999–2049. [Google Scholar] [CrossRef]
- Shestakova, A.A.; Fedotova, E.V.; Lyulyukin, V.S. Relevance of ERA5 Reanalysis for Wind Energy applications: Comparison with SoDAR Observations. Geogr. Envi. Sustain. 2024, 17, 54–66. [Google Scholar] [CrossRef]
- Alkhalidi, M.; Al-Dabbous, A.; Al-Dabbous, S.; Alzaid, D. Evaluating the accuracy of the ERA5 model in predicting wind speeds across coastal and offshore regions. Journal of Marine Science and Engineering 2025, 13, 149. [Google Scholar] [CrossRef]
- EMODnet Bathymetry Consortium: European Marine Observation and Data Network. 2024. Available online: https://emodnet.ec.europa.eu/geoviewer/.
- Lecours, V.; Dolan, M.F.J.; Micallef, A.; Lucieer, V.L. A review of marine geomorphometry, the quantitative study of the seafloor. Hydrology and Earth System Sciences 2016, 20, 3207–3244. [Google Scholar] [CrossRef]
- Thierry, S.; Dick, S.; George, S.; Benoit, L.; Cyrille, P. EMODnet Bathymetry a compilation of bathymetric data in the European waters. Oceans 2019. Marseille. [Google Scholar] [CrossRef]
- Thieler, E.R.; Himmelstoss, E.A.; Zichichi, J.L.; Ergul, A. The Digital Shoreline Analysis System (DSAS) Version 4.0 - An ArcGIS extension for calculating shoreline change. US Geological Survey, 2009. [Google Scholar] [CrossRef]
- Fountoulis, I.; Vassilakis, E.; Mavroulis, S.; Alexopoulos, J.; Dilalos, S.; Erkeki, A. Synergy of tectonic geomorphology, applied geophysics and remote sensing techniques reveals new data for active extensional tectonism in NW Peloponnese (Greece). Geomorphology 2015, 237, 52–64. [Google Scholar] [CrossRef]
- Dolan, R.; Fenster, M.S.; Holme, S.J. Temporal analysis of shoreline recession and accretion. J. Coast. Res. 1991, 7, 723–744. [Google Scholar]
- Frazer, L.N.; Genz, A.S.; Fletcher, C.H. Toward Parsimony in Shoreline change Prediction (I): Basis Function methods. J. Coast. Res. 2009, 252, 366–379. [Google Scholar] [CrossRef]
- Splinter, K.D.; Coco, G. Challenges and opportunities in coastal shoreline prediction. Front. Mar. Sci. 2021, 8. [Google Scholar] [CrossRef]
- Calkoen, F.; Luijendijk, A.; Rivero, C.R.; Kras, E.; Baart, F. Traditional vs. Machine-Learning Methods for Forecasting Sandy Shoreline Evolution Using Historic Satellite-Derived Shorelines. Rem. Sens. 2021, 13, 934. [Google Scholar] [CrossRef]
- Chawalit, C.; Boonpook, W.; Sitthi, A.; Torsri, K.; Kamthonkiat, D.; Tan, Y.; Suwansaard, A.; Nardkulpat, A. Geoinformatics and Machine Learning for Shoreline Change Monitoring: A 35-Year analysis of coastal erosion in the Upper Gulf of Thailand. ISPRS Internat. J. Geo-Infor. 2025, 14, 94. [Google Scholar] [CrossRef]
- La Peña, E.G.-D.; Coco, G.; Whittaker, C.; Montaño, J. On the use of convolutional deep learning to predict shoreline change. Earth Surface Dynamics 2023, 11, 1145–1160. [Google Scholar] [CrossRef]
- Dey, M.; S.P., S; Jena, B.K. A Shoreline Change Detection (2012-2021) and forecasting Using Digital Shoreline Analysis System (DSAS) Tool: A Case Study of Dahej Coast, Gulf of Khambhat, Gujarat, India. Indonesian J. of Geog 2021, 53. [Google Scholar] [CrossRef]
- Iryanto, I.; Satrio, A.; Ghozali, A.L.; Ismantohadi, E.; Baizal, Z.A.; Gunawan, P.H. Long Short Term Memory Approach for Shoreline Change Prediction on Eretan Beach. Jitk. Jurnal Ilmu Pengetahuan Dan Teknologi Komputer 2024, 1; 9(2), 227–35. [Google Scholar] [CrossRef]
- Adeli, A.; Dastgheib, A.; Roelvink, D. Shoreline dynamics prediction using machine learning models: from process learning to probabilistic forecasting. Front. Mar. Sci. 2025, 12. [Google Scholar] [CrossRef]
- Boye, C.B.; Baffoe, P.E.; Boye, P. Shoreline predictive model using artificial intelligence for the homogeneous beach of the Western Coast of Ghana. Nova Geodesia 2025, 5, 303. [Google Scholar] [CrossRef]
- Kingma, DP. Adam: A method for stochastic optimization. arXiv (Cornell University) 2014, arXiv:1412.6980. [Google Scholar] [CrossRef]
- Chollet, F. Deep learning with Python; Manning Publications Co: New York, 2018. [Google Scholar]
- Taylor, K.E. Summarizing multiple aspects of model performance in a single diagram. Journal of Geophysical Research Atmospheres 2001, 106, 7183–7192. [Google Scholar] [CrossRef]
- Reed, C.W.; Brown, M.E.; Sánchez, A.; Wu, W.; Buttolph, A.M. The Coastal Modeling System Flow Model (CMS-Flow): past and present. J. Coast. Res. 2011, 59, 1–6. [Google Scholar] [CrossRef]
- Li, H.; Lin, L.; Johnson, C.; Ding, Y.; Brown, M.; Beck, T.; Sánchez, A.; Wu, W. A revisit and update on the verification and validation of the Coastal Modeling System (CMS) : report 1--. hydrodynamics and waves 2022. [Google Scholar] [CrossRef]
- Lotfy, M.F.; Frihy, O.E. Sediment balance in the nearshore zone of the Nile Delta Coast, Egypt. J. Coast. Res. 1993, 9, 654–662. [Google Scholar]
- Chen, J. Dams, Effect on Coasts. In Encyclopedia of Coastal Science; Schwartz, M., Ed.; Springer, 2018; pp. 357–359. [Google Scholar] [CrossRef]
- Masria, A.; Iskander, M.; Negm, A. Coastal protection measures, case study (Mediterranean zone, Egypt). J. Coast Conserv 2015a, 19, 281–294. [Google Scholar] [CrossRef]
- Masria, A.; Nadaoka, K.; Negm, A.; Iskander, M. Detection of Shoreline and Land Cover Changes around Rosetta Promontory, Egypt, Based on Remote Sensing Analysis. Land 2015b, 4, 216–230. [Google Scholar] [CrossRef]
- Ghoneim, E.; Mashaly, J.; Gamble, D.; Halls, J.; AbuBakr, M. Nile Delta exhibited a spatial reversal in the rates of shoreline retreat on the Rosetta promontory comparing pre- and post-beach protection. Geomorphology 2015, 228, 1–14. [Google Scholar] [CrossRef]
- Cooper, J.A.G.; Pilkey, O.H. Pitfalls of shoreline stabilization Coastal research library; Springer, 2012. [Google Scholar] [CrossRef]
- Kraus, N.C.; McDougal, W.G. The Effects of Seawalls on the Beach: Part I, An updated literature review. J. Coast Res. 1996, 12, 691–701. [Google Scholar]
- Tweed Shire Council. Kingscliff - Dreamtime Beach Coastal Zone Management Plan . 2017. Available online: https://www.tweed.nsw.gov.au/.
- Ware, D.; Banhalmi-Zakar, Z. Strategies for governments to help close the coastal adaptation funding gap. Ocean & Coastal Management 2020, 198, 105223. [Google Scholar] [CrossRef]
- O’Donnell, T. Interrogating private property rights and path dependencies for coastal retreat. Ocean & Coastal Management 2023, 231, 106379. [Google Scholar] [CrossRef]
- Rahmawati, R.R.; Putro, A.H.S.; Lee, J.L. Analysis of Long-Term shoreline observations in the vicinity of coastal structures: A case study of South Bali beaches. Water 2021, 13, 3527. [Google Scholar] [CrossRef]
- Filho, L.M.; Roebeling, P.; Coelho, C. Influence of local factors on coastal erosion: the case of Vagueira Beach in Portugal. Environments 2023, 10, 24. [Google Scholar] [CrossRef]
- Lira, C.P.; Silva, A.N.; Taborda, R.; De Andrade, C.F. Coastline evolution of Portuguese low-lying sandy coast in the last 50 years: an integrated approach. Earth System Science Data 2016, 8, 265–278. [Google Scholar] [CrossRef]
- Karambas, T.V. Design of detached breakwaters for coastal protection: Development and application of an advanced numerical model. Coastal Engineering Proceedings 2012, 115. [Google Scholar] [CrossRef]
- Torres-Freyermuth, A.; Hofman, A.; Tuz-Pech, J.C.; Medellín, G.; Roos, P.C. Design and performance of permeable groins on a Low-Energy natural beach. J. Mar. Sci. Engin. 2020, 8, 283. [Google Scholar] [CrossRef]
- Van Rijn, N.L.C. Design and Effectiveness of coastal protection structures: case studies and modelling approaches. J. Envi. Earth Sci. 2025, 7, 72–95. [Google Scholar] [CrossRef]
- Elsayed, M. A. K.; Mahmoud, S.M. Groins system for shoreline stabilization on the east side of the Rosetta Promontory, Nile Delta Coast. J. Coast. Res. 2007, 232, 380–387. [Google Scholar] [CrossRef]
- Tolba, E. Impact of Coastal Erosion and Sedimentation along the Northern Coast of Sinai Peninsula, Case Study: AL-ARISH Harbor Coast. Port-Said Engin. Res. J. 2012, 16, 118–125. [Google Scholar] [CrossRef]
- Zeinali, S.; Dehghani, M.; Talebbeydokhti, N. Artificial neural network for the prediction of shoreline changes in Narrabeen, Australia. App. Ocean Res. 2021, 107, 102362. [Google Scholar] [CrossRef]
- Juan, N.P.; Valdecantos, V.N. Review of the application of Artificial Neural Networks in ocean engineering. Ocean Engin 2022, 259, 111947. [Google Scholar] [CrossRef]
- Wang, Z.; Li, H.; Chen, H.; Ding, Z.; Zhu, J. Linear and nonlinear framework for interval-valued PM2.5 concentration forecasting based on multi-factor interval division strategy and bivariate empirical mode decomposition. Exp. Sys App 2022, 205, 117707. [Google Scholar] [CrossRef]
- Dong, B.; Song, Y.; Wang, Y.; Yi, F.; Liang, W.; Xiong, K. A preliminary study on activated corrosion product source term prediction in pressurized water reactor using recurrent neural network. Annals of Nuclear Energy 2025, 224, 111699. [Google Scholar] [CrossRef]
- Siami-Namini, S.; Tavakoli, N.; Namin, A.S. A Comparison of ARIMA and LSTM in Forecasting Time Series. International Conference on Machine Learning and Applications (ICMLA), 2018. [Google Scholar] [CrossRef]
- Du, J.; Liao, J.; Huang, G.; Wang, K.; Long, W. Drought stress prediction in Camellia oleifera seedlings using a deep learning hybrid model with temporal-spatial feature fusion. Industrial Crops and Products 2025, 236, 122126. [Google Scholar] [CrossRef]
- Zafar, R.; Huang, P.; Sun, Y. Enhancing electric vehicle charging load prediction in data-scarce scenarios: A hybrid deep learning-based approach integrating clustering analysis and transfer learning. Energy and AI 2025, 21, 100545. [Google Scholar] [CrossRef]
- Hayes, M.O.; FitzGerald, D.M. Origin, evolution, and classification of tidal inlets. Journal of Coastal Research 2013, 69, 14–33. [Google Scholar] [CrossRef]
- Van Rijn, N.L.C. Design and Effectiveness of coastal protection structures: case studies and modelling approaches. Journal of Environmental & Earth Sciences 2025, 72–95. [Google Scholar] [CrossRef]
- Tereszkiewicz, P.; McKinney, N.; Meyer-Arendt, K.J. Groins along the Northern Yucatán Coast. Journal of Coastal Research 2018, 344, 911–919. [Google Scholar] [CrossRef]
- Gracia, V.; Sierra, J.P.; Caballero, A.; García-León, M.; Mösso, C.A. methodological framework for selecting an optimal sediment source within a littoral cell. Journal of Environmental Management 2021, 296, 113207. [Google Scholar] [CrossRef]
- Charuka, B.; Angnuureng, D.B.; Agblorti, S.K.M. Mapping and assessment of coastal infrastructure for adaptation to coastal erosion along the coast of Ghana. Anthropocene Coasts 2023, 6. [Google Scholar] [CrossRef]
Figure 1.
(A) Location map illustrating the Landsat and PlanetScope scenes derived 1985 to 2025 shorelines; the map highlights the highly dynamic sand spit, associated coastal protection structures, and subdivision into five sectors. (B, C) Zoomed-in high-resolution views depicting the historical evolution (2012–2025) of sector 4.
Figure 2.
(A) Time-sequence maps, derived from NDWI and NDVI Landsat data at 5-year intervals (1985–2025), illustrating the evolution of the sand spit and associated coastal protection structures. (B) Sentinel-2 (10 m) annual Land Use/Land Cover maps for the period 2017–2024, highlighting recent patterns of urban expansion across the study area. (C) Med-MFC WSE from 01/01/2024 to 01/07/2025.
Figure 3.
(A, B) Wind and wave rose diagrams derived from ERA5 data (1975–2025), depicting predominant wind patterns, significant wave heights. (C) Distribution of 50-m-spaced transects “T” generated using the DSAS tool for shoreline change analysis and monitoring across the area five sectors.
Figure 3.
(A, B) Wind and wave rose diagrams derived from ERA5 data (1975–2025), depicting predominant wind patterns, significant wave heights. (C) Distribution of 50-m-spaced transects “T” generated using the DSAS tool for shoreline change analysis and monitoring across the area five sectors.
Figure 4.
Field photographs from 8 February 2025 illustrating GPS-based ground-truthing and validation of remotely sensed shoreline positions along Sector-2.
Figure 4.
Field photographs from 8 February 2025 illustrating GPS-based ground-truthing and validation of remotely sensed shoreline positions along Sector-2.
Figure 5.
Spatial distribution of shoreline change statistics (NSM, LRR, EPR) across the five sectors, derived from DSAS analysis, illustrating the influence of coastal protection structures on shoreline dynamics.
Figure 5.
Spatial distribution of shoreline change statistics (NSM, LRR, EPR) across the five sectors, derived from DSAS analysis, illustrating the influence of coastal protection structures on shoreline dynamics.
Figure 6.
Cumulative spatiotemporal distribution of shoreline change per transect (1985–2025), illustrating the integrated influence of coastal protection structures and human interventions on short- to long-term shoreline dynamics.
Figure 6.
Cumulative spatiotemporal distribution of shoreline change per transect (1985–2025), illustrating the integrated influence of coastal protection structures and human interventions on short- to long-term shoreline dynamics.
Figure 7.
(A) Overview map showing the digitized 2025 shoreline alongside 2050 shoreline predictions from NARX and BiLSTM models across the study area. (B–F) Zoomed-in views of the five sectors illustrating and comparing the differential 2050 shoreline predictions of the two AI models (NARX and BiLSTM).
Figure 8.
Performance analysis of NARX and BiLSTM models for shoreline position prediction. (A, B) Taylor diagrams summarizing statistical performance (standard deviation, correlation coefficient, and centered RMSE) of both models for 10 randomly selected transects. (C) Heatmap of RMSE (m) across 43 randomly selected representative transects along the five coastal sectors, comparing NARX and BiLSTM coordinate predictions. (D) Detailed RMSE heatmap focused on main shoreline transects near key coastal structures (G1, G2, El-Gamil 1 and 2 jetties, and 5 groins), highlighting localized prediction challenges.
Figure 9.
(A) High-resolution satellite image showing the resort in Sectors 2–3 located along a historically erosional shoreline. (B) CMS high-resolution computational domain and (C) zoomed view showing the high-resolution Cartesian grid incorporating the proposed successive short-groin system, spaced at 150 m intervals to enhance shoreline stability. (D) EMODnet-derived bathymetry of the simulation domain. (E–H) CMS-Flow hydrodynamic simulation results showing that the proposed short, closely spaced groins effectively interrupt the continuity of the longshore currents, dissipating their momentum, reducing nearshore current speeds, and suppressing the formation of return-flow eddies between groins.
Table 1.
Multi-temporal satellite imagery datasets acquired and utilized for historical shoreline extraction, accuracy validation, and predictive modeling (1985–2025).
Table 1.
Multi-temporal satellite imagery datasets acquired and utilized for historical shoreline extraction, accuracy validation, and predictive modeling (1985–2025).
| Satellite |
Date of used scenes |
Bands / Spatial resolution |
|
Landsat5 (TM)
|
1985/06/03 |
Bands 1-5, 7 (Visible/NIR/SWIR) 30 m
Band 6 (Thermal Infrared) 120 m |
| 1990/05/16 |
| 1995/07/01 |
| 2000/08/15 |
| 2005/07/12 |
| 2010/04/05 |
| Landsat 8-9 (OLI/ OLI-2) |
2015/04/19 |
Bands 1-7, 9 (Visible/NIR/SWIR)30 m
Band 8 (Panchromatic) 15 m
Band 10-11 (Thermal Infrared - TIRS) 100 m |
| 2016/06/08 |
| 2017/05/26 |
| 2018/09/18 |
| 2019/02/25 |
| 2020/05/18 |
| 2021/05/05 |
| 2022/07/27 |
| 2023/07/22 |
| 2024/04/03 |
| 2025/05/13 |
| RapidEye |
2011/11/03 |
5 m |
| 2014/02/12 |
| 2017/02/19 |
| PlanetScope |
2018/10/25 |
3 m |
| 2020/10/08 |
| 2022/11/07 |
|
Disclaimer/Publisher’s Note: The statements, opinions and data contained in all publications are solely those of the individual author(s) and contributor(s) and not of MDPI and/or the editor(s). MDPI and/or the editor(s) disclaim responsibility for any injury to people or property resulting from any ideas, methods, instructions or products referred to in the content. |
© 2025 by the authors. Licensee MDPI, Basel, Switzerland. This article is an open access article distributed under the terms and conditions of the Creative Commons Attribution (CC BY) license (http://creativecommons.org/licenses/by/4.0/).