Submitted:
04 December 2025
Posted:
05 December 2025
You are already at the latest version
Abstract
Japan has largely completed the “first half” of SDG 6—universal access to safe drinking water and sanitation—through decades of investment in water supply and sewerage systems, total pollutant load control and stringent regulation of industrial effluents. National indicators show that coverage of safely managed drinking water and sanitation services is close to 99%, and domestic statistics report high achievement rates of BOD/COD-based environmental standards in rivers, lakes and coastal waters [6–11]. At the same time, SDG 6.3.2 (good ambient water quality) remains at 57% and SDG 6.6.1 (extent of water-related ecosystems) shows a −2.8% change in permanent surface water area compared with the 2000–2019 baseline [9,12,13]. The present review synthesizes how far Japan has progressed towards SDG 6, why gaps remain in the “second half” of the goal and which policy pathways are most promising for a nature-positive water future. Using national statistics from the Ministry of the Environment and the Ministry of Land, Infrastructure, Transport and Tourism (1970–2023), UN-Water SDG 6 indicators and recent literature, we map domestic indicators onto the SDG 6 framework, analyse long-term trends in BOD/COD achievement rates and organise remaining challenges using the DPSIR (Drivers–Pressures–State–Impacts–Responses) perspective [2–4,8,9,17,29]. A simple structural break analysis confirms that improvement in BOD/COD achievement essentially stalled around 2002, reinforcing policy concerns that point-source measures alone can no longer deliver additional gains [8,22]. A comparison of SDG 6.3.2 with domestic environmental standard metrics explains why the former is systematically lower: multi-parameter assessment, stricter aggregation rules and greater sensitivity to nutrients and ecological conditions mean that water bodies passing BOD/COD standards may still fail under SDG 6.3.2 [8,9,13]. Building on this diagnosis, the review proposes six strategic directions—climate-resilient water systems, infrastructure renewal and smart asset management, advanced treatment and pollution prevention, integrated water resources management and governance, citizen participation and nature-based solutions (NbS) and green–gray hybrids—and summarises their expected contributions and constraints in a concise overview table [12–14,16,17,24,26]. Finally, we outline how integrated indicator dashboards and, in the longer term, basin-scale simulation platforms (“digital twins”) could help link SDG 6 indicators, domestic statistics and scenario analysis in a transparent, reproducible way [8,9,25,26]. The paper concludes with research and policy priorities for closing the remaining gaps in SDG 6.3 and 6.6 and for advancing towards a nature-positive water future.
Keywords:
SDG 6
; water environment management
; nature-based solutions
; DPSIR
; digital twins
; water quality
; Japan
1. Introduction
Over the past half century, Japan has moved from severe industrial and domestic water pollution to near-universal access to safe drinking water and sanitation. During the period of rapid economic growth from the 1950s to the 1970s, untreated industrial effluents and municipal wastewater caused extremely high BOD levels and widespread contamination in rivers, lakes and enclosed coastal waters, contributing to well-known pollution diseases such as Minamata disease, Niigata Minamata disease, Itai-itai disease and Yokkaichi asthma [1,2,3]. In response, the national government enacted and strengthened the Water Pollution Control Law, expanded environmental quality standards, introduced total pollutant load control in major enclosed coastal waters and rapidly invested in sewerage infrastructure [2,3,4,6,7]. These measures led to dramatic improvements in organic pollution control and human health protection.
In the context of the 2030 Agenda for Sustainable Development, these achievements correspond closely to the “first half” of SDG 6: safely managed drinking water (6.1), sanitation and hygiene (6.2) and wastewater treatment (6.3.1) [9,10,11]. Japan’s coverage of safely managed drinking water and sanitation services is now close to 99%, and domestic statistics report BOD/COD environmental standard achievement rates around 90% for human health and living environment items, although with differences among rivers, lakes and coastal waters [8,9,10,11]. From a global perspective, Japan thus appears to be a front-runner in SDG 6.1–6.3.1.
However, the “second half” of SDG 6—covering ambient water quality (6.3.2), water-use efficiency and water stress (6.4), integrated water resources management (6.5) and water-related ecosystems (6.6)—presents a more complex picture. The latest UN-Water SDG 6 Data Portal reports 57% for indicator 6.3.2 (proportion of water bodies with good ambient water quality) and a −2.8% change in permanent surface water area for 6.6.1, relative to the 2000–2019 baseline [9,12,13]. These values suggest that, while basic access and point-source control are mature, Japan faces persistent and in some cases worsening challenges in diffuse pollution, groundwater nitrate contamination, emerging contaminants and ecosystem degradation [13,14,15,16,20,21,22,27,28].
The aim of this review is to synthesise Japan’s progress towards SDG 6, focusing on how past water environment policies have shaped current indicator values and what policy pathways are most promising for addressing the remaining gaps. Specifically, the paper:
The paper is explicitly framed as a review. It relies on publicly available statistics and published literature and does not claim to develop new numerical models or calibrated basin-scale digital twins. Instead, it offers an integrated, indicator-based synthesis of how Japan’s water environment management relates to SDG 6 and provides a conceptual blueprint for subsequent, more quantitative modelling and scenario analysis.
2. Methods
2.1. Review Scope and Guiding Questions
The review focuses on Japan’s progress towards SDG 6 from the early 1970s to 2023, with particular emphasis on the following questions:
- How do domestic indicators of water environment management map onto the SDG 6 framework?
- Where has Japan already reached high or very high coverage (>98%), and where do gaps remain, especially for ambient water quality and water-related ecosystems?
- What long-term trends and structural changes can be observed in key indicators such as BOD/COD achievement rates?
- How can remaining challenges be organised using the DPSIR framework, and what strategic policy directions emerge from this diagnosis?
- How might integrated indicators and scenario tools, including dashboards and simulation platforms, support future decision-making?
2.2. Data Sources and SDG 6 Indicator Mapping
This paper adopts a structured narrative review rather than a full systematic review. We focused on literature and policy documents published between 2000 and 2025 that address SDG 6-related issues in Japan, including water supply and sanitation, ambient water quality, water-related ecosystems and water governance. Academic publications were identified using Web of Science, Scopus and CiNii Articles with combinations of keywords such as “SDG 6”, “Japan”, “water quality”, “eutrophication”, “groundwater”, “ecosystem”, “sewerage”, “johkasou”, and “integrated water resources management”. Grey literature, including MOE and MLIT white papers, basic plans and statistical yearbooks, was screened using the websites of relevant ministries and agencies.
We prioritised sources that (i) provide quantitative indicators comparable with SDG 6 metrics, (ii) offer long-term time series suitable for trend analysis, or (iii) present basin-scale case studies on infrastructure optimisation, NbS, or digital-twin-type platforms. While we did not perform a formal PRISMA-type screening or risk-of-bias assessment, we cross-checked key statistics across multiple sources where possible and clearly distinguish between peer-reviewed studies and policy reports throughout the review.
Domestic data were obtained from the Ministry of the Environment (MOE) and the Ministry of Land, Infrastructure, Transport and Tourism (MLIT), including long-term statistics on water quality, sewerage development, water supply, groundwater quality and related policy indicators [2,4,6,7,8,11,13,14,23,27]. These were combined with UN-Water SDG 6 indicators (6.1.1–6.6.1) from the SDG 6 Data Portal and with supporting information from UNESCO, FAO and OECD sources [9,12,17,18,19].
Table 1 summarises the mapping between SDG 6 indicators and domestic proxy indicators in Japan, along with their latest approximate values. For example, SDG 6.1.1 (safely managed drinking water services) is mapped to water supply coverage including simplified and private systems, while SDG 6.3.1 (safely treated wastewater) is mapped to the share of population served by sewerage and on-site decentralized wastewater treatment systems (johkasou) systems [8,9,10,11]. For SDG 6.3.2 and 6.6.1, the review uses the official UN-Water values (57% and −2.8%, respectively) and compares them with domestic environmental standard achievement rates and ecosystem-related statistics [8,9,12,13].
2.3. Time-Series Analysis of BOD/COD Achievement Rates
To explore long-term trends and potential structural changes in ambient organic pollution control, the review conducts a simple time-series analysis of BOD/COD environmental standard achievement rates using MOE’s “Public Water Body Water Quality Survey Results” from FY1970 to FY2023 [8]. The analysis focuses on the monitoring-site–weighted national average achievement rate for living environment items across rivers, lakes and coastal waters.
Structural break tests are implemented using the strucchange package in R. A supF test is used to detect the most probable break date, and separate linear trends are estimated before and after the break. Point estimates and confidence intervals for the trend coefficients provide a transparent, reproducible basis for characterising phases of rapid improvement versus stagnation. The resulting break date and trend coefficients are summarised in Section 4.4 and visualised in Figure 1.
2.4. Narrative Synthesis, DPSIR and Scenarios
Beyond the descriptive statistics and structural break analysis, the paper uses a narrative synthesis of policy documents, academic literature and international reviews [1,2,3,4,12,13,14,15,16,17,20,21,22,24,25,26,27,28,29]. The DPSIR framework is employed to organise drivers, pressures, state changes, impacts and responses for Japan’s water environment, highlighting how demographic, climatic and economic drivers translate into pressures such as diffuse pollution and ecosystem loss and how current responses address (or fail to address) these pressures [29].
Scenario discussions in Section 6 and Section 7 are conceptual and qualitative by design. Rather than presenting new model runs, they draw on approximate ranges reported in MLIT, OECD and NbS case studies to describe the potential effects of infrastructure optimisation and targeted NbS on fiscal sustainability and water quality [7,11,12,13,16,17,24,26]. Table 3 provides a concise overview of the six strategic directions that emerge from this diagnosis.
3. Historical Progress Towards the “First Half” of SDG 6 in Japan
3.1. Pollution Control and the “Overcoming Pollution” Phase
In the post-war high-growth period, rapid industrialisation and urbanisation in Japan led to severe degradation of water quality. Untreated industrial effluents and domestic wastewater caused BOD levels of 20–50 mg/L in many rivers, lakes and enclosed coastal waters, contributing to Minamata disease, Niigata Minamata disease, Itai-itai disease and Yokkaichi asthma [1,2,3]. Public concern peaked in the late 1960s and early 1970s, leading to the so-called “Pollution Diet” of 1970, which enacted the Basic Law for Environmental Pollution Control and dramatically amended the Water Pollution Control Law [2,3].
Key measures included the introduction of uniform national effluent standards, stricter liability for pollution damages and the establishment of environmental quality standards for public water bodies [2,4]. In enclosed coastal waters such as Tokyo Bay, Ise Bay and the Seto Inland Sea, a total pollutant load control system focusing initially on COD and later on nitrogen and phosphorus was introduced from 1979 onwards [4,5,20,21]. These measures triggered substantial reductions in industrial pollutant loads and improvements in organic water quality.
3.2. Expansion of Sewerage and Sanitation Services
Massive public investment in sewerage since the 1970s was another pillar of Japan’s progress. Sewerage coverage rose from about 8% in the late 1960s to around 40% by the late 1980s and continued to expand thereafter [6,7]. Johkasou systems and improved night-soil treatment complemented sewerage in rural and peri-urban areas. By the early 2000s, combined sewerage and johkasou coverage had reached high levels, and by 2023 coverage of safely managed sanitation services (SDG 6.2.1) was close to 99% [7,8,9,10,11].
Parallel improvements in water supply coverage and treatment ensured that safely managed drinking water services (SDG 6.1.1) also reached approximately 99%, with almost the entire population served by piped water, simplified systems or small-scale private systems that meet national safety standards [9,10,11]. These developments underpin Japan’s very high coverage (>98%) on SDG 6.1.1, 6.2.1 and 6.3.1.
3.3. Achievements and Remaining Challenges in Organic Pollution Control
BOD/COD environmental standard achievement rates rose steadily from the 1970s through the 1990s as industrial effluents were controlled and sewerage coverage expanded. National averages for living environment items in rivers, lakes and coastal waters increased from roughly 20–30% in the 1970s to around 70% in the early 1990s and to approximately 90% by the early 2000s [4,8,22]. These trends confirm that Japan has largely overcome the most severe forms of organic pollution associated with the high-growth era.
Despite these successes, concerns emerged in the 2000s that BOD/COD achievement rates had reached a plateau and that remaining water quality issues were increasingly driven by non-point nutrient loads, groundwater nitrate, emerging contaminants and insufficient recovery of water-related ecosystems [13,14,15,16,20,21,27,28]. The following sections examine these concerns through the lens of SDG 6 indicators and long-term trend analysis.
4. Diagnosis of Remaining Gaps Using SDG 6 Indicators
4.1. Mapping Domestic Statistics to the SDG 6 Framework
To clarify Japan’s position within the SDG 6 framework, domestic statistics were mapped onto SDG indicators 6.1.1–6.6.1. Table 1 summarises the main SDG 6 indicators, their short descriptions, corresponding domestic proxy indicators and approximate latest values. For water supply and sanitation, the mapping is relatively straightforward: water supply coverage (including simplified and private systems) corresponds closely to 6.1.1, while sewerage, johkasou and night-soil treatment coverage map onto 6.2.1 and 6.3.1 [7,8,9,10,11]. For these indicators, Japan’s latest values are around 99%, placing the country among global leaders [9,10,11,17].
For indicators relating to water-use efficiency and water stress (6.4.1 and 6.4.2), FAO AQUASTAT and MLIT statistics show a steady improvement in water-use efficiency (around 56 US$/m³ in 2021) but a level of water stress of about 36%, which exceeds the 25% threshold commonly used to define “high water stress” [11,17,18,19]. Japan thus combines high economic productivity per unit of water with relatively high pressure on renewable freshwater resources.
For integrated water resources management (6.5.1), Japan’s self-assessment score is around 95 out of 100, reflecting the implementation of the Basic Act on the Water Cycle, basin plans and multi-stakeholder councils [9,17,24]. By contrast, SDG 6.3.2 (good ambient water quality) stands at 57% and 6.6.1 (extent of water-related ecosystems) shows a −2.8% change in permanent surface water area compared with the baseline [9,12,13]. These indicators point to persistent challenges in ambient water quality and ecosystems, despite high coverage of drinking water and sanitation.
4.2. Why SDG 6.3.2 is Lower than Domestic Environmental Standard Achievement Rates
At first sight, the SDG 6.3.2 value of 57% appears inconsistent with domestic achievement rates of environmental quality standards, which are typically around 80% for living environment items when averaged across monitored rivers, lakes and coastal waters [8,13]. However, the two sets of figures are not directly comparable for at least three reasons. Table 2 provides a schematic comparison.
First, the parameter set differs. Domestic achievement rates for living environment items primarily focus on BOD or COD, with some additional parameters such as total nitrogen, total phosphorus or dissolved oxygen included for specific water bodies [4,8]. By contrast, SDG 6.3.2 is based on a multi-parameter assessment including oxygen, salinity, nitrogen, phosphorus and pH, with “good” status requiring that all relevant parameters meet the prescribed thresholds for a given water body [9]. Water bodies that meet BOD/COD standards but fail for nutrients or oxygen are therefore counted as “not good” under SDG 6.3.2.
Second, the aggregation rules differ. Domestic achievement rates are typically reported separately for rivers, lakes and coastal waters and can be interpreted as the share of monitoring sites meeting standards for one or a small number of parameters within each category [8]. In contrast, SDG 6.3.2 aggregates across water-body types and parameters using a “one-out-all-out” logic: a water body is classified as “good” only if all monitored parameters satisfy the relevant criteria [9]. This stricter aggregation systematically lowers the overall percentage compared with single-parameter or single-category achievement rates.
Third, the spatial coverage and unit definitions are not identical. Domestic statistics concentrate on nationally designated monitoring sites, whereas SDG 6.3.2 uses a harmonised set of water bodies and segments to facilitate international comparability [8,9]. Differences in how water bodies are delineated and how partially monitored segments are treated can also contribute to numerical discrepancies.
Taken together, these methodological differences explain why Japan can simultaneously report domestic achievement rates of approximately 80% for BOD/COD-based living environment items and an SDG 6.3.2 value of 57%. The latter highlights challenges that are less visible in BOD/COD alone, particularly nutrient enrichment, oxygen depletion and broader ecological conditions [8,9,13,20,21,22]. This has direct implications for policy: further progress towards SDG 6 will depend more on controlling diffuse nutrient loads and improving ecological status than on incremental gains in conventional organic pollution control.
Although the SDG 6 Data Portal does not currently provide parameter-specific contributions for individual countries, domestic literature and policy discussions consistently identify nutrients (total nitrogen and total phosphorus) and dissolved oxygen (particularly bottom-layer hypoxia in enclosed coastal waters and lakes) as the primary constraining factors for Japan’s SDG 6.3.2 score [5,8,13,20,21].
4.3. Ambient Water Quality and Water-Related Ecosystems
Analysis of SDG 6.3.2 and 6.6.1 confirms that ambient water quality and water-related ecosystems remain the weakest elements of Japan’s SDG 6 performance. The SDG 6.3.2 value of 57% indicates that just over half of assessed water bodies meet multi-parameter “good” status, while the −2.8% change in permanent surface water area suggests continued contraction of water-related ecosystems [9,12,13]. These results are consistent with long-term studies showing that, although COD and nutrient loads in enclosed coastal waters such as Tokyo Bay and the Seto Inland Sea have declined, problems such as hypoxic bottom waters and sediment contamination persist [5,20,21]. Similarly, eutrophication remains an issue in some lakes, and non-point nutrient loads from agriculture and urban stormwater continue to dominate the nutrient balance in key basins [13,15,20,21,27].
Groundwater quality is another concern. Nationwide surveys and research on nitrate nitrogen in groundwater show continued exceedances of environmental standards in intensive agricultural areas and, in some regions, upward trends in nitrate concentrations over recent decades [15,27,28]. Emerging contaminants such as PFAS, pharmaceuticals and microplastics have also been detected in rivers and coastal waters, although monitoring is still limited and risk assessments are ongoing [14,16].
From an SDG 6 perspective, these findings imply that Japan’s remaining challenges lie mainly in diffuse pollution, groundwater contamination, emerging contaminants and ecosystem degradation, rather than in basic access or point-source organic pollution.
4.4. Structural Break in BOD/COD Achievement Rates
To characterise long-term trends in organic pollution control, the monitoring-site–weighted national average achievement rate for BOD/COD-based living environment items was analysed for structural breaks using the strucchange package [8]. The supF test suggests a statistically significant structural break around 2002 (p < 0.01). Linear trend estimates indicate an average improvement of approximately +2.8 percentage points per year (95% confidence interval roughly 2.1–3.5) from 1970 to 2002, followed by a trend coefficient statistically indistinguishable from zero after 2002.
Figure 1 visualises the observed national average, the estimated pre- and post-break trends and the break point. The results confirm in a simple, reproducible way that national BOD/COD achievement rates have essentially stagnated since the early 2000s. Notably, Figure 1 illustrates that while rivers and coastal waters show a pattern of rapid improvement followed by a plateau, lakes and reservoirs have remained at a chronically lower level of achievement throughout the period. This implies that most of the gains achievable through conventional point-source measures have already been realized, and that further improvements in ambient water quality will depend on addressing diffuse sources, emerging contaminants and ecosystem resilience [8,13,14,15,20,21,22,27,28].
5. Drivers, Pressures, State Changes and Responses: A DPSIR Perspective
The DPSIR framework provides a useful lens for structuring the complex interactions between socio-economic drivers, environmental pressures, state changes, impacts and policy responses in Japan’s water environment [29]. This section summarises the main elements relevant to SDG 6.
5.1. Drivers
Three interacting drivers are particularly important:
- Climate change. Observed warming, changes in precipitation patterns and increases in extreme rainfall events in Japan are well documented [18,30]. These changes affect runoff regimes, increase the frequency of short-duration, high-intensity storms and exacerbate risks of hypoxia and eutrophication in enclosed waters [13,18,30].
- Population decline and ageing. Japan’s population is projected to continue shrinking and ageing, with implications for water demand, local tax bases and the viability of small utilities [17]. In rural and peri-urban areas, decreasing population density erodes the financial base of water and sewerage services and raises per-capita maintenance costs [7,11,17].
- Economic and lifestyle changes. While industrial pollutant loads have decreased, diversified consumption patterns and the widespread use of pharmaceuticals, personal care products and synthetic chemicals have increased the diversity of trace contaminants entering water bodies [13,14,16]. Land-use change, including urbanisation and agricultural intensification or abandonment, also modifies hydrological and biogeochemical processes [12,13,20,21].
5.2. Pressures
These drivers translate into several key pressures on the water environment:
5.3. State Changes and Impacts
State changes are reflected in indicators such as SDG 6.3.2, 6.4.2 and 6.6.1 as well as in domestic statistics:
5.4. Responses and Structural Gaps
Japan has implemented a wide range of responses, including:
Nevertheless, a structural gap remains: responses are strongest where Japan historically faced crises—point-source pollution and access to water and sanitation—and comparatively weaker where diffuse pressures, ecosystem restoration and integrated, cross-sectoral governance are required. The strategic directions in the next section are formulated to address this gap.
6. Strategic Policy Directions for Completing the “Second Half” of SDG 6
Drawing on the DPSIR diagnosis and existing policy reviews [13,14,17,22,23,24], this section synthesises six strategic directions for strengthening Japan’s performance on the latter part of SDG 6, especially 6.3.2 and 6.6.1. Table 3 provides a concise overview.
6.1. Climate-Resilient Water Systems
Climate change is expected to intensify extreme rainfall, floods and droughts in Japan, with implications for water quantity, quality and infrastructure performance [18,30]. Climate-resilient water systems integrate flood control, water use and ecological considerations at basin scale. Key elements include:
These measures can contribute simultaneously to SDG 6.3, 6.4, 6.5 and 6.6 by reducing pollutant loads during storm events, improving water-use reliability and buffering ecosystems against climatic extremes.
6.2. Infrastructure Renewal and Smart Asset Management
Under demographic decline, maintaining extensive water and sewerage networks poses growing fiscal and operational challenges [7,11,17]. Strategic responses include:
- Regionalisation and consolidation of utilities to achieve economies of scale and more efficient planning.
- Adoption of asset management and stock management plans that prioritise renewal based on risk rather than age alone.
- Tariff reforms that better reflect long-run life-cycle costs while protecting vulnerable households.
International and Japanese case studies suggest that infrastructure optimisation and regionalisation can deliver reductions in the range of about 10–25% in per-capita life-cycle costs and 10–20% in energy use, depending on context [7,11,17]. While precise gains vary, such ranges provide a useful benchmark for interpreting the qualitative assessments in Table 3. Efficient, financially sustainable infrastructure is a prerequisite for maintaining high levels of access (SDG 6.1 and 6.2) and treatment (6.3.1) under fiscal constraints.
6.3. Advanced Treatment, Pollution Prevention and Circular Water Use
Addressing emerging contaminants and nutrient loads will require a combination of upstream pollution prevention and advanced treatment technologies [13,14,16]. Priority actions include:
- Implementing and enforcing PFAS guidelines, expanding national monitoring networks and targeting hotspots for remediation and upstream control [14].
- Promoting advanced treatment processes such as membrane bioreactors, activated carbon, ozonation and advanced oxidation for priority sites.
These measures can help improve SDG 6.3.2 by addressing contaminants not captured by BOD/COD and contribute to SDG 6.4 by improving water-use efficiency and reducing stress on freshwater resources.
6.4. Integrated Water Resources Management and Governance
Japan’s high score on SDG 6.5.1 reflects the existence of national frameworks such as the Basic Act on the Water Cycle and basin plans [17,24]. The remaining challenge is to translate these frameworks into substantive, cross-sectoral decision-making that aligns water, land-use, agricultural and biodiversity policies. Key priorities include:
- Aligning financial and legal instruments to support hybrid portfolios of grey infrastructure and NbS at basin scale.
6.5. Citizen Participation and Behaviour Change
Non-point pollution from households and agriculture, as well as the social acceptability of tariffs and infrastructure reforms, depend on citizen behaviour and trust. Citizen participation can:
- Enhance monitoring through citizen science initiatives that contribute to spatially richer data on water quality and ecosystems.
- Support behaviour change on issues such as fertiliser use, household chemical disposal and water conservation.
Integrating citizen-generated data into official dashboards can also help visualise progress and build shared ownership of SDG 6 targets.
6.6. Nature-Based Solutions and Green–Gray Hybrids: Potential and Constraints
Nature-based solutions (NbS), including wetland and floodplain restoration, riparian buffers, small detention ponds, and urban green–blue networks, can reduce diffuse nutrient and sediment loads, improve ecological status, and enhance flood regulation [12,13,26]. Global reviews indicate that, under favourable biophysical conditions and where sufficient area and hydraulic connectivity can be secured, wetland and floodplain restoration can reduce nutrient loads by on the order of 10–30% at sub-basin scale [26]. Recent Japanese case studies, however, report more modest effects, typically in the range of roughly 8–22% load reduction for nutrients under realistic land-use and hydrological constraints (e.g. Nakamu ra et al., 2023; Kamauchi & Matsushita, 2022; Hayashida et al., 2025). In parallel, infrastructure optimisation and regionalisation can reduce per-capita life-cycle costs and energy use by approximately 10–25% [7,17]. When combined with such optimised grey infrastructure, appropriately targeted NbS can therefore make modest but meaningful contributions to SDG indicators 6.3.2 and 6.6.1.
However, large-scale deployment of NbS in Japan faces severe land-use, cost, and disaster-risk constraints. In densely populated basins such as the Lake Biwa–Yodo system, the most suitable sites for wetland creation or floodplain reconnection are already occupied by agriculture, housing, or critical infrastructure [12,13]. Land acquisition and opportunity costs are often prohibitive, especially in peri-urban areas where land prices are high, while repurposing agricultural land raises legitimate concerns about food security and rural livelihoods. Japan’s steep topography and flash-flood-prone rivers also make it technically difficult—and sometimes risky—to create the large, low-gradient floodplains that are common in continental NbS applications. In addition, flood-risk standards under the River Act and related MLIT guidelines impose strict safety requirements that limit the scope for large-scale, intentionally inundated areas in narrow valleys.
In this context, large-scale floodplain restoration akin to European or North American examples is likely to remain the exception rather than the norm in Japan. A more realistic pathway is the deployment of “micro-NbS” at multiple scales: small detention and retention ponds, rewetting of abandoned paddy fields and terraced rice paddies, saturated buffers, riparian forest buffers and urban green–blue corridors. These measures can be integrated into existing agricultural and urban landscapes, often on publicly owned or marginal land, with lower acquisition costs and fewer conflicts with food-production and disaster-risk objectives.
For these reasons, NbS in Japan are best understood as strategic, complementary measures within green–gray hybrid portfolios, rather than as full replacements for conventional infrastructure. Priorities include: (i) coupling micro-NbS with optimised sewerage and on-site treatment systems in high-risk sub-basins; (ii) using NbS to restore habitat connectivity and ecological status where land is available (e.g. former floodplains, abandoned farmland, public land); and (iii) aligning NbS planning with agricultural, land-use and disaster-risk policies to avoid perverse trade-offs. Hybrid strategies that combine infrastructure renewal and optimisation (Section 6.2) with carefully targeted NbS can provide a context-appropriate balance of fiscal sustainability, resilience and environmental benefits, but their net effects in the Japanese context are likely to be moderate rather than transformational. Quantifying these effects systematically will require Japan-specific empirical studies and basin-scale modelling of NbS–infrastructure combinations.
7. From Indicators to Dashboards and Basin-Scale Simulation Platforms
7.1. Integrated Indicator Dashboards
Given the diversity of SDG 6 indicators and domestic statistics, integrated dashboards can help visualise where Japan has reached high or near-universal coverage and where gaps remain [8,9,13]. A basic national-scale dashboard for Japan’s water environment would integrate:
- SDG 6 indicators (6.1.1–6.6.1) from the UN-Water Data Portal [9].
At basin and municipal levels, dashboards could display indicator subsets relevant to local decision-making, such as BOD/COD achievement rates, nutrient levels, groundwater nitrate status, wetland area, infrastructure condition and population projections. Such dashboards would not in themselves constitute “digital twins,” but they would provide a transparent, shared evidence base for prioritising interventions and tracking progress toward SDG 6.
7.2. From Dashboards to Basin-Scale Simulation Platforms (“Digital Twins”)
In this review, the term “digital twin” is used in a narrow, operational sense: a basin-scale digital twin is a model-based simulation platform that integrates (i) hydrological and water-quality models, (ii) infrastructure and land-use modules, and (iii) a structured set of policy scenarios and performance indicators, thereby enabling dynamic scenario analysis [18,25,26]. This definition deliberately distinguishes digital twins from static indicator dashboards or simple visualisation tools.
Over the longer term, the integrated dashboards described in Section 7.1 could evolve into fully fledged basin-scale simulation platforms—or digital twins—that couple real-time and historical monitoring data with predictive models to support policy exploration. In the water sector, the term “digital twin” is sometimes used very broadly [25]; the narrower definition adopted here emphasises operational utility for scenario-based decision making, including the evaluation of policy portfolios, infrastructure investments and NbS–grey infrastructure hybrids.
For a basin such as Lake Biwa–Yodo, a realistic development pathway would be:
- 1)
- Dashboard phase: Begin with an indicator dashboard that integrates SDG 6 and national monitoring data with MOE/MLIT statistics for water quality, ecosystems and infrastructure assets (Section 7.1).
- 2)
- Scenario-analysis phase: Incorporate scenario modelling of selected policy portfolios—e.g. combinations of infrastructure optimisation (regionalisation and renewal), advanced treatment, demand management and targeted NbS in high-priority sub-basins—using established tools such as SWAT, MIKE SHE or equivalent catchment models where sufficient data exist.
- 3)
- Digital-twin phase: Progressively advance toward a more dynamic, near-real-time digital twin as monitoring networks densify, data pipelines mature, and institutional modelling capabilities strengthen. In this phase, dashboards and models are tightly coupled so that observed data are assimilated into state variables, and users can explore “what-if” scenarios for droughts, floods, infrastructure failures and policy interventions.
Importantly, this trajectory is not purely hypothetical. Recent initiatives such as the Tokyo Metropolitan Government–IBM “Water Digital Twin” pilot, the Lake Biwa “Virtual Biwa” platform, and emerging basin-scale modelling efforts in large river systems (e.g. the Tone River) illustrate how dashboards, supervisory control systems and process-based models can be integrated into operational decision-support tools in Japan. This review does not attempt to replicate these efforts, but positions SDG 6 indicators and domestic statistics as a natural backbone for such platforms.
In this context, Table 3 and the qualitative scenarios presented in Section 6 should be regarded as a conceptual blueprint for future basin-scale digital twins. They illustrate the key indicators, time horizons and policy combinations that such platforms should be designed to compare, rather than providing outputs from a mature system. Implementing and rigorously evaluating prototype basin-scale digital twins in real Japanese catchments—building on existing pilots in Tokyo, Lake Biwa and other basins—will require dedicated future research, sustained institutional partnerships, and attention to data governance and stakeholder participation.
8. Conclusions and Future Research Priorities
This review has examined Japan’s progress towards SDG 6 using indicators, focusing on the contrast between strong performance in access and basic pollution control, and remaining gaps in ambient water quality and ecosystems. The main conclusions are as follows.
First, Japan has largely completed the “first half” of SDG 6. Coverage of safely managed drinking water and sanitation services (6.1.1 and 6.2.1) is close to 99%, and domestic BOD/COD achievement rates for living environment items are around 90%. This reflects successful point-source control and decades of investment in water supply and sewerage [4,6,7,8,9,10,11,22]. Structural break analysis shows that most of these gains were achieved by the early 2000s, and that BOD/COD achievement rates have since levelled off [8,22].
Second, SDG 6.3.2 (good ambient water quality) and 6.6.1 (water-related ecosystems) reveal remaining structural challenges. The 57% value for 6.3.2 and the −2.8% change in permanent surface water area point to persistent problems of nutrient enrichment, groundwater nitrate contamination, emerging contaminants and ecosystem loss—issues that are not fully captured by domestic BOD/COD-based metrics [8,9,12,13,14,15,16,20,21,22,27,28]. Differences in indicator definitions explain why SDG 6.3.2 is systematically lower than domestic achievement rates and underscore the need to focus on multi-parameter compliance and ecological status.
Third, from a DPSIR perspective, Japan’s water environment is shaped by interacting drivers such as climate change, demographic decline, and economic and lifestyle change. These drivers create pressures including diffuse pollution, groundwater deterioration, and changes in flow regimes and habitats [12,13,14,15,17,18,19,27,28,29]. Policy responses have been strong in traditional areas (pollution control, infrastructure, basic access) but weaker in domains that require cross-sector coordination, such as diffuse pollution control and ecosystem restoration [13,17,22,23,24].
Fourth, the review identifies six strategic directions for completing the “second half” of SDG 6: (i) climate-resilient water systems; (ii) infrastructure renewal and smart asset management; (iii) advanced treatment, pollution prevention and circular water use; (iv) integrated water resources management and governance; (v) citizen participation and behaviour change; and (vi) nature-based solutions and green–gray hybrids. Existing case studies suggest that infrastructure optimisation can reduce per-capita life-cycle costs and energy use by roughly 10–25%, and that wetland and floodplain restoration can, under suitable conditions, reduce nutrient loads by roughly 10–20% at sub-basin scale [7,11,12,13,16,17,26]. At the same time, Japan’s steep topography, high land prices and stringent disaster-risk standards mean that large-scale, continental-style floodplain restoration is unlikely to be widely feasible. In the Japanese context, NbS are therefore expected to take the form of smaller-scale interventions—such as detention ponds, buffer strips and re-wetting of abandoned farmland—and to play a targeted, complementary role within hybrid portfolios rather than fully replacing grey infrastructure [12,13,26].
Finally, this paper argues that indicator-based dashboards and, in the longer term, basin-scale simulation platforms (“digital twins”) can support more transparent, data-driven and participatory water environment management [8,9,18,25,26]. As a narrative, indicator-based review, the article does not present calibrated basin-scale models, but it offers a conceptual blueprint for integrating SDG 6 indicators, domestic statistics and policy scenarios in future research and practice.
Three priorities emerge for future work:
- Deeper analysis of SDG 6.3.2 components. Disaggregating SDG 6.3.2 by parameter and water-body type, and linking it more clearly to domestic monitoring data, would help target interventions more effectively.
- Basin-scale modelling and evaluation of policy portfolios. Implementing and comparing scenarios of infrastructure optimisation, NbS and hybrid strategies in representative basins would move beyond qualitative assessments and provide more robust evidence on cost-effectiveness.
- Design and testing of indicator dashboards and simulation platforms. Developing open, reproducible dashboards and prototype simulation platforms for selected basins, with stakeholder participation, would help put the proposed framework into practice.
Half a century after overcoming its most severe pollution crises, Japan now faces “next-stage” challenges in water quality and ecosystems—challenges that many other countries will encounter as they approach universal access. By systematically linking SDG 6 indicators, domestic statistics and policy pathways, this review aims to inform academic and policy debates on how Japan, and other countries with mature water infrastructure, can move towards a more nature-positive water future.
Acknowledgments
This study was supported by the National Institute for Environmental Studies (NIES), Japan, through the projects “Proposal and Evaluation of Environmentally Efficient Technologies and Systems in Collaboration with Local Communities (No. 2125AA117)” and “Regional Environment Conservation Domain: Foresight and Advanced Basic Research (No. 2125AV007).”'
References
- Harada, M. Minamata disease: Methylmercury poisoning in Japan caused by environmental pollution. Crit. Rev. Toxicol. 1995, 25, 1–24. [Google Scholar] [CrossRef] [PubMed]
- Ministry of the Environment, Japan (MOE). Environment White Paper 2006 (in Japanese); MOE: Tokyo, Japan, 2006. [Google Scholar]
- Noda, H. Japan’s Experience in Overcoming Water Pollution; National Institute for Environmental Studies: Tsukuba, Japan, 2015. [Google Scholar]
- Ministry of the Environment, Japan (MOE). Environment White Paper 2018 (in Japanese); MOE: Tokyo, Japan, 2018. [Google Scholar]
- Otsuka, H.; et al. Long-term water quality and eutrophication in Tokyo Bay. Mar. Pollut. Bull. 2021, 168, 112456. [Google Scholar] [CrossRef]
- Ministry of Land, Infrastructure, Transport and Tourism (MLIT). Sewerage in Japan 2013; MLIT: Tokyo, Japan, 2013. [Google Scholar]
- Ministry of Land, Infrastructure, Transport and Tourism (MLIT). Sewerage Statistics (FY2021–2022) and Sewerage in Japan 2023/2024; MLIT: Tokyo, Japan, 2023–2024. [Google Scholar]
- Ministry of the Environment, Japan (MOE). Public Water Body Water Quality Survey Results (FY2023); MOE: Tokyo, Japan, 2024. [Google Scholar]
- UN-Water. SDG 6 Data Portal—Japan [Dataset]; UN-Water: Geneva, Switzerland, 2024–2025; Available online: https://www.sdg6data.org/country-or-area/Japan (accessed on 2 December 2025).
- Japan Water Works Association (JWWA). Water Supply in Japan 2023; JWWA: Tokyo, Japan, 2023. [Google Scholar]
- Ministry of Land, Infrastructure, Transport and Tourism (MLIT). Statistics on Water Supply and Demand (in Japanese); MLIT: Tokyo, Japan, 2024. [Google Scholar]
- United Nations Educational, Scientific and Cultural Organization (UNESCO). UN World Water Development Report 2022: Groundwater—Making the Invisible Visible; UNESCO: Paris, France, 2022. [Google Scholar]
- Ministry of the Environment, Japan (MOE). White Paper on the Environment, Sound Material-Cycle Society and Biodiversity 2024 (in Japanese); MOE: Tokyo, Japan, 2024. [Google Scholar]
- Ministry of the Environment, Japan (MOE). White Paper on Water, Soil, Ground and Marine Environment Conservation (in Japanese); MOE: Tokyo, Japan, 2024. [Google Scholar]
- Watanabe, M. Groundwater nitrate pollution and agriculture in Japan. J. Jpn. Soc. Hydrol. Water Resour. 2015, 28, 135–146, (In Japanese.). [Google Scholar]
- Abeynayaka, A.; Werellagama, I.; Yamasaki, K.; Nguyen, T. Rapid sampling of suspended and floating microplastics in riverine environments in Japan. Water 2020, 12, 1903. [Google Scholar] [CrossRef]
- Organisation for Economic Co-operation and Development (OECD). OECD Environmental Performance Reviews: Japan 2025; OECD Publishing: Paris, France, 2025. [Google Scholar] [CrossRef]
- Intergovernmental Panel on Climate Change (IPCC). Climate Change 2023: Synthesis Report. Contribution of Working Groups I, II and III to the Sixth Assessment Report of the Intergovernmental Panel on Climate Change; IPCC: Geneva, Switzerland, 2023. [Google Scholar]
- Food and Agriculture Organization of the United Nations (FAO). AQUASTAT Database—Japan [Database]; FAO: Rome, Italy, 2023. [Google Scholar]
- Ishii, Y.; Yokoyama, K.; Nakamura, M. Long-term trends in nutrient concentrations in the Seto Inland Sea. Mar. Pollut. Bull. 2008, 57, 524–532. [Google Scholar]
- Nakano, T.; Arakawa, H. Long-term changes in nutrient concentrations in Tokyo Bay. J. Oceanogr. 2022, 78, 123–138. [Google Scholar]
- Ye, L.; Kameyama, Y. Structural changes in water quality management in Japan. Environ. Sci. Policy 2020, 108, 45–56. [Google Scholar]
- Ministry of the Environment, Japan (MOE). Environment White Paper 2023 (in Japanese); MOE: Tokyo, Japan, 2023. [Google Scholar]
- Basic Act on the Water Cycle (Act, No. 16 of 2014, amended 2021). Japanese Law Translation Database, 2021. Available online: https://www.japaneselawtranslation.go.jp (accessed on 2 December 2025).
- Pedersen, A.N.; Borup, M.; Brink-Kjær, A.; Christiansen, L.E.; Mikkelsen, P.S. Digital twins for water and wastewater systems. Water Res. 2021, 204, 117597. [Google Scholar]
- Xu, L.; et al. Nature-based solutions for water quality improvement. Environ. Res. Lett. 2024, 19, 045012. [Google Scholar] [CrossRef]
- Ministry of Agriculture, Forestry and Fisheries (MAFF); Ministry of the Environment, Japan (MOE). Nationwide Groundwater Quality Survey Results (Nitrate Nitrogen, etc.) (in Japanese); Government of Japan: Tokyo, Japan, 2023. [Google Scholar]
- Itoh, S.; et al. Long-term trends of nitrate concentrations in groundwater across Japan. Sci. Total Environ. 2023, 858 Pt 3. [Google Scholar] [CrossRef]
- Musiake, K.; Koike, T. Water resources management and DPSIR framework. Hydrol. Process. 2009, 23, 285–292. [Google Scholar]
- Japan Meteorological Agency (JMA). Climate Change Monitoring Report 2022; JMA: Tokyo, Japan, 2023; Available online: https://www.jma.go.jp/jma/en/NMHS/ccmr/ccmr2022.pdf (accessed on 2 December 2025).
Figure 1.
Long-term trend in monitoring-site–weighted national average BOD/COD environmental standard achievement rates for living environment items across rivers, lakes, and coastal waters in Japan (data source: Ministry of the Environment [8], FY1970–FY2023).
Figure 1.
Long-term trend in monitoring-site–weighted national average BOD/COD environmental standard achievement rates for living environment items across rivers, lakes, and coastal waters in Japan (data source: Ministry of the Environment [8], FY1970–FY2023).
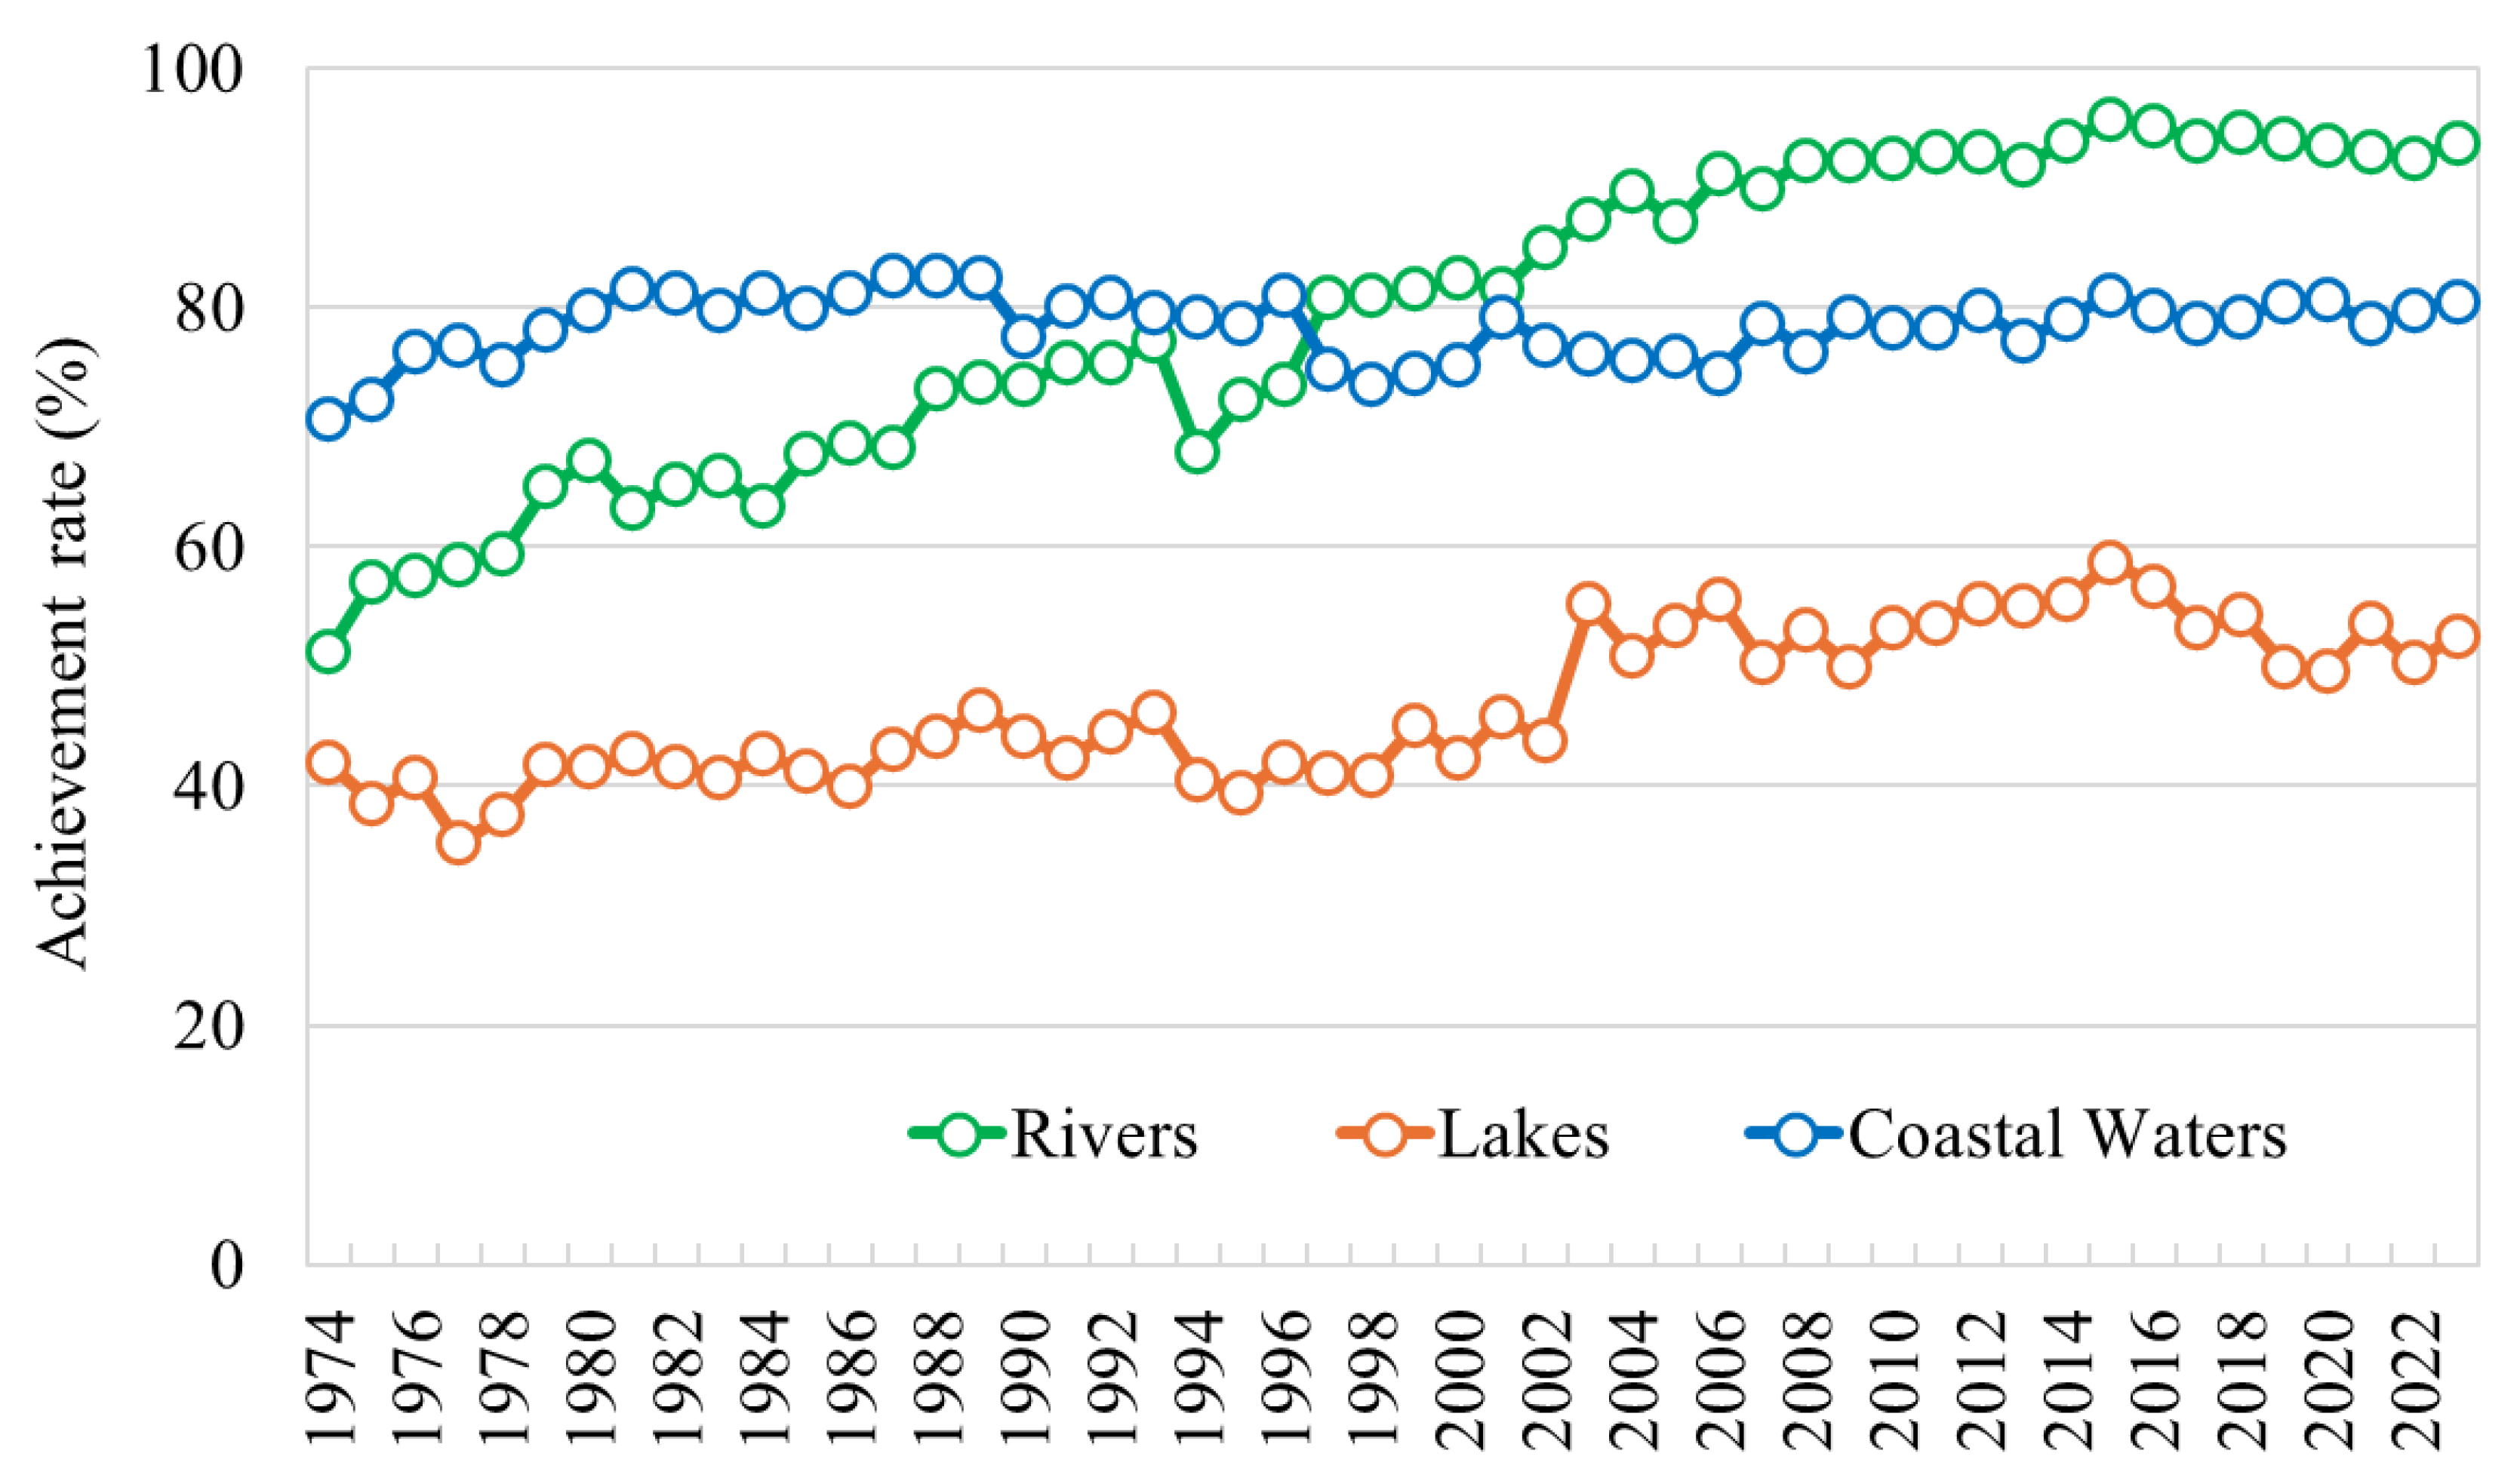

Table 1.
Overview of SDG 6 indicators, corresponding domestic proxy indicators, and approximate status in Japan (latest available values).
Table 1.
Overview of SDG 6 indicators, corresponding domestic proxy indicators, and approximate status in Japan (latest available values).
| SDG 6 indicator | Short description | Domestic proxy indicator (Japan) | Approximate status (latest) |
| 6.1.1 | Safely managed drinking water services | Water supply coverage incl. simplified/private systems | ≈99% of population (very high, stable) |
| 6.2.1 | Safely managed sanitation services | Sewerage + johkasou + night-soil treatment coverage | ≈99% of population (almost universal) |
| 6.3.1 | Safely treated wastewater | Population served by sewerage and johkasou systems | ≈99% of domestic wastewater treated |
| 6.3.2 | Good ambient water quality | Multi-parameter assessment of rivers, lakes, coastal waters | 57% of water bodies “good” (2023, SDG 6) |
| 6.4.2 | Level of water stress | Annual withdrawal / renewable water resources | ≈36% (2021; “high water stress” category) |
| 6.5.1 | IWRM implementation | IWRM score; water cycle plans and basin councils | ≈95/100 (very high implementation) |
| 6.6.1 | Water-related ecosystems | Change in permanent surface water area (2000–2019 baseline) | −2.8% (permanent surface water, 2022) |
Table 2.
Schematic comparison between SDG 6.3.2 and domestic environmental standard achievement metrics in Japan.
Table 2.
Schematic comparison between SDG 6.3.2 and domestic environmental standard achievement metrics in Japan.
| Aspect | SDG 6.3.2 “Good ambient water quality” | Domestic environmental standard achievement (MOE) | Main implication for Japan |
| Main purpose | Share of water bodies with overall “good” ambient status | Compliance with national standards for selected items (e.g., BOD) | Both describe ambient quality, but with different emphasis |
| Parameters | Multi-parameter set (oxygen, salinity, N, P, pH, etc.) | Mainly BOD or COD, plus TN/TP/DO in some waters | SDG 6.3.2 more sensitive to nutrients and ecological conditions |
| Aggregation | “One-out-all-out” at water-body level across parameters | Separate rates by parameter and water-body type | Multi-parameter aggregation lowers SDG 6.3.2 relative to single-item |
| Spatial units | Harmonised set of rivers, lakes, coastal water bodies for SDG | National monitoring sites grouped by rivers/lakes/coastal waters | Unit definitions and coverage not identical |
| Latest values | 57% of water bodies “good” (2023, SDG 6 Data Portal) | ≈80% average achievement for “living environment” items | Gap reflects issues beyond BOD/COD (nutrients, DO, ecological status) |
Table 3.
Overview of six strategic directions for completing the “second half” of SDG 6 in Japan.
| Strategic direction | Main SDG 6 links | Main focus | Key challenges addressed |
| Climate-resilient water systems | 6.3, 6.4, 6.5, 6.6 | Basin-scale flood, drought and quality management | Climate-driven extremes, storm runoff, hypoxia, habitat loss |
| Infrastructure renewal and smart asset management | 6.1–6.4 | Regionalisation, risk-based renewal, tariffs | Ageing assets, shrinking population, fiscal stress |
| Advanced treatment, prevention and circular water use | 6.3, 6.4 | PFAS, nutrients, pharmaceuticals, water reuse | Emerging contaminants, nutrient loads, high water stress |
| Integrated water resources management and governance | 6.3–6.6 | Basin plans, cross-sectoral coordination | Fragmented policies, trade-offs across sectors and scales |
| Citizen participation and behaviour change | 6.1–6.6 | Citizen science, education, demand-side measures | Diffuse pollution from households, social acceptance of reforms |
| Nature-based solutions and green–gray hybrids | 6.3, 6.5, 6.6 | Wetlands, floodplains, riparian buffers, NbS–grey mixes | Diffuse nutrient loads, ecosystem loss, resilience under land-use constraints |
Disclaimer/Publisher’s Note: The statements, opinions and data contained in all publications are solely those of the individual author(s) and contributor(s) and not of MDPI and/or the editor(s). MDPI and/or the editor(s) disclaim responsibility for any injury to people or property resulting from any ideas, methods, instructions or products referred to in the content. |
© 2025 by the authors. Licensee MDPI, Basel, Switzerland. This article is an open access article distributed under the terms and conditions of the Creative Commons Attribution (CC BY) license (http://creativecommons.org/licenses/by/4.0/).
Copyright: This open access article is published under a Creative Commons CC BY 4.0 license, which permit the free download, distribution, and reuse, provided that the author and preprint are cited in any reuse.


