Submitted:
04 December 2025
Posted:
05 December 2025
You are already at the latest version
Abstract
Previous studies have shown that a lack of air quality monitors in the US makes it difficult to understand air pollution at local scales. Access to local air pollution information can inform actions to reduce pollution and exposure that is detrimental to human health. Recognizing where exposure is concentrated helps determine where conditions need to be improved. The US Environmental Protection Agency (EPA) sets standards on air quality required by the Clean Air Act (CAA) to protect human health. Regulatory monitoring requires nonattainment areas (places where air quality exceeds the set threshold by the EPA) to take action, but only in places where there are monitors. This systematic review assesses if existing studies on the current placement of EPA regulatory air quality monitors provides equitable monitoring of air quality in the US. Existing studies find that monitoring is not distributed equitably across social groups and is concentrated in Whiter, wealthier, and urban neighborhoods. The articles reviewed in this study also found that unmonitored communities are more racially diverse. Nonetheless, it remains uncertain whether these disparities persist over time, representing a critical limitation of existing research reviewed in this systematic review.
Keywords:
equity
; outdoor air quality
; low-cost sensors
; monitor placement
; environmental justice
1. Introduction
Prior studies have shown that sparse regulatory monitoring networks make it challenging to gather local data on air quality, especially within historically disadvantaged communities (Stuart et al., 2009; Krupnick & Sullivan, 2018; Wang et al., 2024). Only about one in three counties in the United States has a monitor that is approved by the Environmental Protection Agency (EPA), and many of these counties are located in metropolitan areas where air quality monitors are required for every 500,000 people (EPA, 2024; EPA, 2025). The absence of air quality monitors contributes to the uncertainty of what air pollution levels are for both the public and regulators. Currently, about 100,000-200,000 people in the U.S. die annually because of air pollution (Thakrar et al., 2020). Short term and long term air pollution exposure have been linked to a wide range of adverse health conditions (Rau et al., 2022).
Black and Hispanic individuals, on average, consume fewer goods and services than Whites, but still face disproportionately high levels of air pollution exposure (Tessum et al., 2019). Existing literature thoroughly addresses the relationship between air quality exposure and racial minorities (Bullard, 1983; Mohai et al., 2009; Brender et al., 2011; Hajat et al., 2015; Mohai and Saha, 2015; Tessum et al., 2019; Tessum et al., 2021; Jbaily et al., 2022). Prior studies have not assessed if the placement of regulatory monitoring provides equitable monitoring of air quality across demographic, environmental, and structural equity measures. Addressing disparities in air quality monitoring requires targeted policy interventions and increased investment in monitoring infrastructure. Bridging these gaps requires a unified approach that prioritizes justice and equity with a focus on assessing the fairness and coverage of air quality monitoring to better protect underserved populations from health risks.
This systematic review assesses the current placement of outdoor air quality monitors to determine if there is equitable placement of monitoring in the U.S. Summarizing existing literature and assessing monitor placement provides justification for equity centered reforms in air quality monitoring. This review may serve as a resource to local regulators and policymakers by informing them of the equity metrics identified in the literature to assess the current placement of regulatory monitors and which demographics and environments could benefit from monitoring in the future.
2. Methodology
A systematic review is a structured process for identifying, analyzing, and synthesizing evidence from existing primary sources to address a defined set of research questions. To examine the existing literature assessing the current placement of outdoor air quality monitors for equitable monitoring, I conducted a systematic literature review using Preferred Reporting Items for Systematic Reviews and Meta-Analyses (PRISMA) procedures laid out by Pai et al. (2004).
2.1. Review Question
This systematic review addresses the following review question: Does the current placement of EPA regulatory air quality monitors provide equitable monitoring of air quality across all social groups in the United States?
2.2. Information Sources
Searches for eligible studies were conducted in four sources: (1) key academic databases including Google Scholar, JSTOR, PubMed, Agricultural & Environmental Science Collection, Web of Science, Academic Search Ultimate, GreenFILE, and Pollution Abstracts; (2) hand searching of the following ten journals: American Journal of Public Health, Journal of Exposure Science and Environmental Epidemiology, Atmosphere, Environmental Sociology, Applied Geography, GeoHealth, JAMA Network Open, International Journal of Environmental Research and Public Health, Environmental Research Letters, and Environmental Science and Technology Letters; (3) the references of articles that met the inclusion criteria in the database and journal search; and (4) the articles cited by articles found from the databases, journals, and references sections through forward searching.
2.3. Search Strategy
My search string for electronic databases consisted of the following keywords with a Boolean AND: “air quality monitoring” AND “air quality sensors” AND “environmental justice” AND “disparities” AND “united states.” The database search was conducted in June of 2025 for the study period January 1999 to June 2025. After applying the search procedures, the collected articles were compiled into a database and checked for duplicates and language of publication. After completing the database search, manual searches were performed in the journals listed above. Additionally, the references of eligible articles identified in the initial search were reviewed. Lastly, with the selected articles from the three previous search types, a forward search was performed to identify articles that cited included studies. Articles were screened based on their title and abstract, then methodology, and finally followed by a screening of the full text to determine study inclusion.
2.4. Inclusion Criteria
After removing 5 duplicate records and one non-English manuscript, 219 articles were screened by title and abstract. Of these, 214 manuscripts were selected for further assessment based on their methodology. Five articles were retained for full text review, all of which met the inclusion criteria. Additionally, two were found through forward searching the articles cited by those selected in the database, journal, and reference review search. In total, 7 peer reviewed manuscripts were included in the final review depicted in Figure 1.
The following criteria were used to select studies for analysis in this review:
- Type and Year of Publication: Studies published in a peer reviewed journal between January 1, 1999, and June 8, 2025, to ensure comprehensive coverage from the database search and manual journal searches.
- Study Focus: Research related to EPA regulatory air quality monitoring in the United States.
- Language: Only studies published in English.
- Issue of Interest: Equitable air quality monitoring categorized by sociodemographic and environmental/structural equity metrics.
-
In the methodology section each article had to have:
- a.
- At least one or both equity metrics
- b.
- EPA regulatory air quality monitoring
3. Results
3.1. Data Abstraction
Information extracted from each eligible article included general information such as the authors and year published, demographic equity measures, and environmental and structural equity measures.
3.2. Study Characteristics
Across the 7 studies included in my review, researchers combined diverse data sources (PurpleAir, EPA Air Quality System (AQS) monitors, U.S. Census/American Community Survey (ACS) sociodemographics) with spatial statistics to assess who is monitored, who is missed, and why. Studies included in Table 2 applied a range of spatial statistical techniques and spatial overlay analyses to compare the locations of government and community sensors against socioeconomic indicators from the U.S. Census to assess disparities in air quality monitoring coverage. These spatial statistics enabled researchers to probe not only where monitors are placed, but also who is monitored, and who remains overlooked in current monitoring systems.
Articles used models for algorithmic siting for future equitable monitor placement in addition to EPA monitor data. “Clustering” groups areas with similar pollution trends together to make sure the chosen sensor locations provide good coverage across the whole area, especially in places that are often overlooked (Kelp et al., 2022; 2023; Kelly et al., 2024). Grainger and Schreiber (2019) linked satellite and ground data to show that regulators in attainment counties steer monitors away from poor or minority hotspots. Bell and Ebisu (2012) extended inequity analysis to PM2.5 (fine particulate matter less than 2.5 μm in diameter) chemistry, finding 14 PM2.5 chemical components (sulfate, nitrate, ammonium, organic carbon matter, elemental carbon, sodium ion, aluminum, calcium, chlorine, nickel, silicon, titanium, vanadium, and zinc) measured by the EPA’s network having specific burdens highest for Hispanics, Blacks, children, and the poor.
Table 2 This table synthesizes peer reviewed studies and lists each study’s authors and publication year, analytical methods, equity or demographic measures examined and the primary findings related to the distribution of regulatory air quality monitors.
3.3. Inequities in EPA Monitor Placement
The articles call for identifying disparities in exposure and access, particularly among vulnerable populations, to advance environmental justice outcomes. A summary of the included studies and their findings is described in Table 2.
3.4. Findings Based on Demographic Equity Measures
Across the reviewed studies, a consistent theme emerges: demographic equity measures reveal significant disparities in the placement of air quality monitors. Demographic indicators most often examine income levels, race and ethnicity, and other markers of social vulnerability. Five of seven studies point to the underrepresentation of low income and racially minoritized communities in EPA’s regulatory network represented in Table 1 Grainger and Schreiber (2019) report that high income or predominantly White unpolluted areas were more likely to receive monitors, while low income and minority communities were systematically less likely to be covered. This pattern aligns with Kelly et al. (2024), who found that census block groups with larger proportions of Black, Hispanic, and multiracial residents had fewer monitors than expected relative to population size. Similarly, Roque et al. (2025) identified “monitoring deserts” concentrated in counties with higher proportions of African American and Hispanic residents, as well as in low income and rural regions (signaling a persistent inequity in collection of air quality monitoring data). In contrast, Bell and Ebisu (2012) find that census tracts with monitors were more likely to be low income and majority Black, suggesting that siting decisions have historically concentrated in these areas. This study stands out as an exception compared to more recent literature. The monitoring approach in Bell and Ebisu (2012) differs substantially from the other studies in the review because they rely on the small subset of EPA monitors that can measure individual PM2.5 chemical components, rather than the full PM2.5 mass monitoring network which measures the overall amount of PM2.5 particles in the air (not broken down into chemical components). These component monitors are sparse and are strategically placed in areas where pollution levels are expected to be highest, such as neighborhoods near industrial facilities, heavy traffic corridors, or large combustion sources. As a result, they are disproportionately located in urban communities with higher proportions of minority and low income residents. Bell and Ebisu (2012) found more PM2.5 component monitors in these neighborhoods because regulators historically prioritize monitoring in areas with elevated emissions and potential health risks.
3.5. Findings Based on Environmental and Structural Equity Measures
Environmental equity measures examine whether different communities experience unequal environmental conditions such as higher pollution levels or fewer environmental benefits. Structural equity measures focus on the underlying systems, policies, and historical patterns (like zoning, redlining, or land-use decisions) that create and reinforce those environmental inequalities. Table 1 shows that environmental and structural equity measures, in contrast, displayed greater variability in their findings compared to demographic equity measures. Some studies accounted for geographic features, land use patterns, and climatic conditions that shape air pollution exposure and dispersion. These measures revealed that physical and environmental factors (such as topography, regional climate, or proximity to industrial point sources) also influence where monitors are sited. While demographic indicators highlight systematic inequities in monitor placement, environmental and structural equity measures reveal a more complex and variable picture. These measures shed light on how physical and environmental factors shape monitoring networks. For instance, Kelp et al. (2022) document that communities facing wildfire smoke or industrial emissions were often left outside the reach of the regulatory monitoring system. Their study emphasized that wildfires, which generate significant PM2.5 episodes, are poorly tracked by the existing EPA infrastructure in the Pacific Northwest (suggesting a structural gap in coverage that exacerbates exposure misclassification in fire prone areas).
Other studies use regression analysis approaches to evaluate the reach of monitors. Kelly et al. (2024) employed buffer analyses to measure the effective coverage of EPA monitors, finding that many communities of color were located outside the spatial range of monitors, even when geographically proximate to polluted areas. Roque et al. (2025) described monitoring deserts not only in terms of demographics in rural, southern, and economically disadvantaged regions. Similarly, Kelp et al. (2023) pointed out that EPA monitors remain unevenly distributed due to their original regulatory purpose: to track compliance near high emitting point sources, rather than to capture community level exposures. deSouza and Kinney (2021) shows that the monitoring gaps they identify reflect structural features of how the EPA’s PM2.5 monitoring network is designed and implemented, rather than simply incomplete geographic coverage. They demonstrate that regulatory monitors are sited through processes that prioritize compliance assessment, existing infrastructure, and historical siting decisions, resulting in concentrations of monitors in certain areas while leaving large portions of the country without regulatory coverage. These structural constraints mean that some communities lack monitors not because of temporary data gaps, but because the regulatory framework and legacy siting patterns systematically favor certain locations over others. This structural perspective clarifies why EPA monitoring coverage remains uneven and strengthens the conclusion that gaps in the network stem from institutional siting practices rather than random omission.
Taken together, these findings demonstrate that environmental and structural measures do not always align with demographic analyses, but they reinforce the conclusion that physical geography, climate, and the regulatory rationale of monitor siting have created uneven monitoring landscapes. These inequities mean that certain hazards, such as wildfire smoke, or certain regions, such as rural and low income areas, remain systematically underserved by EPA’s regulatory network.
4. Discussion
4.1. Disparities in EPA Regulatory Monitoring Coverage
Across the body of literature reviewed, five of the seven studies consistently reveal that EPA regulatory monitoring is sparse, particularly in communities that are racially or ethnically minoritized (Grainger and Schreiber, 2019; deSouza and Kinney, 2021; Kelp et al., 2023; Kelly et al., 2024; Roque et al., 2025). Kelp et al. (2022) did not assess demographic equity measures, and Bell and Ebisu (2012) did not find evidence of inequitable monitor coverage in the specific set of component monitor sites included in their analysis, even though they examined this question directly. Bell and Ebisu (2012) conclude that populations at higher risk of exposure to PM2.5 components do not seem to be underrepresented in areas with monitors relative to areas without them. Together, these findings underscore that the spatial distribution of regulatory monitors is not only a technical or logistical matter but also deeply intertwined with issues of equity and justice.
The literature identifies two major categories of equity measures (demographic and environmental/structural) that scholars use to evaluate where monitors are placed and whose exposures are being captured. Six of the seven studies incorporate demographic equity measures, while five also include environmental or structural measures. Across the majority of studies, these measures consistently revealed a pattern of fewer monitors being located in low income and minoritized communities. This uneven coverage raises concerns that the health risks faced by these groups, who are already disproportionately burdened by environmental hazards, may be underestimated or overlooked by regulatory monitoring systems.
Since the selection and application of these measures varied across studies, their results were less uniform than those based on demographic equity. The variability highlights the complexity of balancing environmental representativeness with community level equity: while some regions may be covered with monitoring stations due to geographic or meteorological considerations, others (often home to vulnerable populations) remain underserved.
Taken together, this literature demonstrates that inequities in air quality monitoring are multidimensional. Demographic analyses make clear that marginalized communities are disproportionately left without sufficient monitoring, while environmental and structural assessments suggest that geography and climate may further entrench these disparities. This dual perspective underscores the need for monitoring strategies that explicitly integrate both social and environmental equity considerations in order to provide comprehensive and just protection of public health.
4.2. Inequities in Sensor Distribution
While the EPA monitoring network provides regulatory grade data, its spatial distribution is uneven (particularly across rural and lower income areas). Findings revealed that many areas with elevated pollution concentrations lack monitors, aligning with previous research documenting inequities in sensor placement. Studies such as deSouza and Kinney (2021) and Kelp et al. (2023) underscore how low-cost sensors, which could help fill these EPA gaps, are often concentrated in wealthier and Whiter neighborhoods because local regulatory decisions may be shaped by pressure from influential people or businesses (Grainger and Schreiber, 2019). This pattern reinforces environmental monitoring disparities and suggests that even community led data collection may inadvertently mirror systemic inequities in resource access. The geographic and demographic disparities seen in EPA monitor coverage are thus compounded by inequitable distribution of low-cost sensors, emphasizing the need for coordinated strategies that intentionally expand monitoring in socially and environmentally burdened areas.
4.3. The Role of Community Science and Localized Monitoring
Lu et al. (2022) demonstrated the power of community installed sensors in addressing regulatory monitoring gaps by showing that PM2.5 exposure varied substantially across neighborhoods in Southern California. Their work underscores how dense, community driven networks can uncover micro scale pollution patterns that regulatory sites overlook. Integrating localized data from community or mobile sensors could also enhance temporal and spatial resolution in the neighborhoods where EPA data indicate inconsistencies or underrepresentation. Additionally, community involvement in data collection promotes public awareness, strengthens trust in environmental science, and can guide policymakers in prioritizing regions for new monitor installations.
4.4. Modeling and Optimization for Equitable Monitoring
Recent studies have turned to optimization frameworks to address inequities in monitoring coverage. Lin et al. (2025) developed the GCLM model in Chicago to balance environmental exposure and sociodemographic vulnerability, showing significantly better coverage than existing low-cost sensor networks (though this improvement was demonstrated only through model simulation, not real world deployment). Kelp et al. (2023) used the mrDMDcc framework to improve sensor siting in cities like St. Louis and Houston, showing that incorporating race and income leads to more equitable placements. Likewise, Kelp et al. (2022) applied the mrDMD model nationwide to identify wildfire driven PM2.5 hotspots in the West that are poorly covered by the current EPA network, advocating for a westward shift in monitoring infrastructure. These modeling approaches demonstrate that equity focused sensor siting strategies can significantly improve environmental justice outcomes and public health surveillance.
4.5. Study Limitations
Across the reviewed studies on this article, many studies rely on short term data making it difficult to determine whether observed monitoring disparities are persistent or part of temporary patterns, limiting our ability to assess long term trends or causality. Other limitations include a lack of attention to how factors like race, income, and housing overlap and influence sensor placement. Optimization studies, such as Kelp et al. (2023), focus mostly on improving technical performance without addressing how their plans would work in practice. And while many studies show gaps in monitoring in disadvantaged areas, most do not explore how this affects health or policy. Together, these gaps suggest that future research should include longer time periods, combine data and community input, and consider both technical and social factors to build fairer air quality monitoring systems.
5. Conclusions
The evidence synthesized in this review underscores the need for equity centered reforms in air quality monitoring. Of the seven studies examining regulatory placement, five concluded that areas lacking sufficient monitoring were disproportionately minoritized. From the disproportionate placement of air quality monitors to the lack of coverage in high risk communities, current monitoring systems remain misaligned with the principles of environmental justice. Investments in community led sensor networks, greater transparency in siting decisions, and federal standards for equitable monitor distribution are all needed to improve environmental health outcomes in marginalized communities. Future research should aim to use nationally representative data, integrate high resolution pollution mapping, and prioritize intersectional analyses of environmental risk. Doing so will ensure that the burden of air pollution is more accurately measured, more fairly addressed, and more justly distributed. These findings reveal critical gaps in who gets monitored and where environmental interventions are targeted. As such, they call for an intentional, equity focused redesign of air quality monitoring systems that prioritizes vulnerable populations and advances environmental justice outcomes.
Author Contributions
Conceptualization, Taylor West, methodology, Taylor West; software, Taylor West; validation, Taylor West; formal analysis, Taylor West; investigation, Taylor West; resources, data curation, Taylor West; writing—original draft preparation, Taylor West; writing—review and editing, visualization, Taylor West; supervision; project administration, Taylor West; funding acquisition. All authors have read and agreed to the published version of the manuscript.
Funding
“This research is supported by work supported by the U.S. Department of Commerce, National Oceanic and Atmospheric Administration, Educational Partnership Program under Agreement No. NA22SEC4810015” and “The APC was funded by Taylor West”.
Data Availability Statement
No new data were created or analyzed in this study. Data sharing is not applicable to this article.
Acknowledgments
The author would like to thank the PROMISE Program at the University of Maryland, Baltimore County (UMBC) for professional development, community, and administrative support. The author is especially grateful to Yusuke Kuwayama and Nancy Miller for their unwavering guidance and mentorship throughout this project.
Conflicts of Interest
The authors declare no conflicts of interest.
References
- Bell, M. L., & Ebisu, K. (2012). Environmental Inequality in Exposures to Airborne Particulate Matter Components in the United States. Environmental Health Perspectives. 120(12), 1699–1704. [CrossRef]
- Brender, J. D., Maantay, J. A., & Chakraborty, J. (2011). Residential Proximity to Environmental Hazards and Adverse Health Outcomes. American Journal of Public Health, 101(S1), S37–S52. [CrossRef]
- Bullard, R. D. (1983). Solid Waste Sites and the Black Houston Community. Sociological Inquiry, 53(2–3), 273–288. [CrossRef]
- deSouza, P., & Kinney, P. L. (2021). On the distribution of low-cost PM2.5 sensors in the US: Demographic and air quality associations. Journal of Exposure Science & Environmental Epidemiology, 31(3), 514–524. [CrossRef]
- Grainger, C., & Schreiber, A. (2019). Discrimination in Ambient Air Pollution Monitoring? AEA Papers and Proceedings, 109, 277–282. [CrossRef]
- Hajat, A., Hsia, C., & O’Neill, M. S. (2015). Socioeconomic Disparities and Air Pollution Exposure: A Global Review. Current Environmental Health Reports, 2(4), 440–450. [CrossRef]
- Jbaily, A., Zhou, X., Liu, J., Lee, T.-H., Kamareddine, L., Verguet, S., & Dominici, F. (2022). Air pollution exposure disparities across US population and income groups. Nature, 601(7892), 228–233. [CrossRef]
- Kelly, B. C., Cova, T. J., Debbink, M. P., Onega, T., & Brewer, S. C. (2024). Racial and Ethnic Disparities in Regulatory Air Quality Monitor Locations in the US. JAMA Network Open. 7(12), e2449005. [CrossRef]
- Kelp, M. M., Fargiano, T. C., Lin, S., Liu, T., Turner, J. R., Kutz, J. N., & Mickley, L. J. (2023). Data-Driven Placement of PM2.5 Air Quality Sensors in the United States: An Approach to Target Urban Environmental Injustice. GeoHealth, 7(9), e2023GH000834. [CrossRef]
- Kelp, M. M., Lin, S., Kutz, J. N., & Mickley, L. J. (2022). A new approach for determining optimal placement of PM2.5 air quality sensors: Case study for the contiguous United States. Environmental Research Letters, 17(3), 034034. [CrossRef]
- Lin, Y., Robinson, C., Yeap, Q. F., & Michael, H. (2025). Optimizing air pollution sensing for social and environmental justice. Applied Geography, 178, 103606. [CrossRef]
- Lu, T., Liu, Y., Garcia, A., Wang, M., Li, Y., Bravo-villasenor, G., Campos, K., Xu, J., & Han, B. (2022). Leveraging Citizen Science and Low-Cost Sensors to Characterize Air Pollution Exposure of Disadvantaged Communities in Southern California. International Journal of Environmental Research and Public Health, 19(14), 8777. [CrossRef]
- Mohai, P., Pellow, D., & Roberts, J. T. (2009). Environmental Justice. Annual Review of Environment and Resources. 2009), 405–430. [CrossRef]
- Mohai, P., & Saha, R. (2015). Which came first, people or pollution? A review of theory and evidence from longitudinal environmental justice studies. Environmental Research Letters, 10(12), 125011. [CrossRef]
- Rau, A., Abadi, A., Fiecas, M. B., Gwon, Y., Bell, J. E., & Berman, J. D. (2022). Nationwide assessment of ambient monthly fine particulate matter (PM2.5) and the associations with total, cardiovascular and respiratory mortality in the United States. Environmental Research: Health, 1(2), 025001. [CrossRef]
- Roque, N. A., Andrews, H., & Santos-Lozada, A. R. (2025). Identifying air quality monitoring deserts in the United States. Proceedings of the National Academy of Sciences, 122(17), e2425310122. [CrossRef]
- Stuart, A. L., Mudhasakul, S., & Sriwatanapongse, W. (2009). The Social Distribution of Neighborhood-Scale Air Pollution and Monitoring Protection. Journal of the Air & Waste Management Association, 59(5), 591–602. [CrossRef]
- Sullivan, D. M. , & Krupnick, A. (n.d.). Using Satellite Data to Fill the Gaps in the US Air Pollution Monitoring Network.
- Tessum, C. W., Apte, J. S., Goodkind, A. L., Muller, N. Z., Mullins, K. A., Paolella, D. A., Polasky, S., Springer, N. P., Thakrar, S. K., Marshall, J. D., & Hill, J. D. (2019). Inequity in consumption of goods and services adds to racial–ethnic disparities in air pollution exposure. Proceedings of the National Academy of Sciences of the United States of America, 116(13), 6001–6006. [CrossRef]
- Tessum, C. W., Paolella, D. A., Chambliss, S. E., Apte, J. S., Hill, J. D., & Marshall, J. D. (2021). PM2.5 polluters disproportionately and systemically affect people of color in the United States. Science Advances. 7(18), eabf4491. [CrossRef]
- Thakrar, S. K., Balasubramanian, S., Adams, P. J., Azevedo, I. M. L., Muller, N. Z., Pandis, S. N., Polasky, S., Pope, C. A. I., Robinson, A. L., Apte, J. S., Tessum, C. W., Marshall, J. D., & Hill, J. D. (2020). Reducing Mortality from Air Pollution in the United States by Targeting Specific Emission Sources. Environmental Science & Technology Letters, 7(9), 639–645. [CrossRef]
- US EPA. (2024, February 7). Air Monitoring for Fine Particle Pollution (PM2.5) Fact Sheet. https://www.epa.gov/system/files/documents/2024-02/pm-naaqs-monitoring-fact-sheet.pdf.
- US EPA, O. (2025). Do you have outdoor air monitoring data for all counties in the U.S.? https://www.epa.gov/outdoor-air-quality-data/do-you-have-outdoor-air-monitoring-data-all-counties-us.
- Wang, Y., Marshall, J. D., & Apte, J. S. (2024). U.S. Ambient Air Monitoring Network Has Inadequate Coverage under New PM2.5 Standard. Environmental Science & Technology Letters, 11(11), 1220–1226. [CrossRef]
Figure 1.
Presents the study selection flow diagram following PRISMA guidelines, summarizing the flow of records through identification, screening, eligibility, and inclusion.
Figure 1.
Presents the study selection flow diagram following PRISMA guidelines, summarizing the flow of records through identification, screening, eligibility, and inclusion.
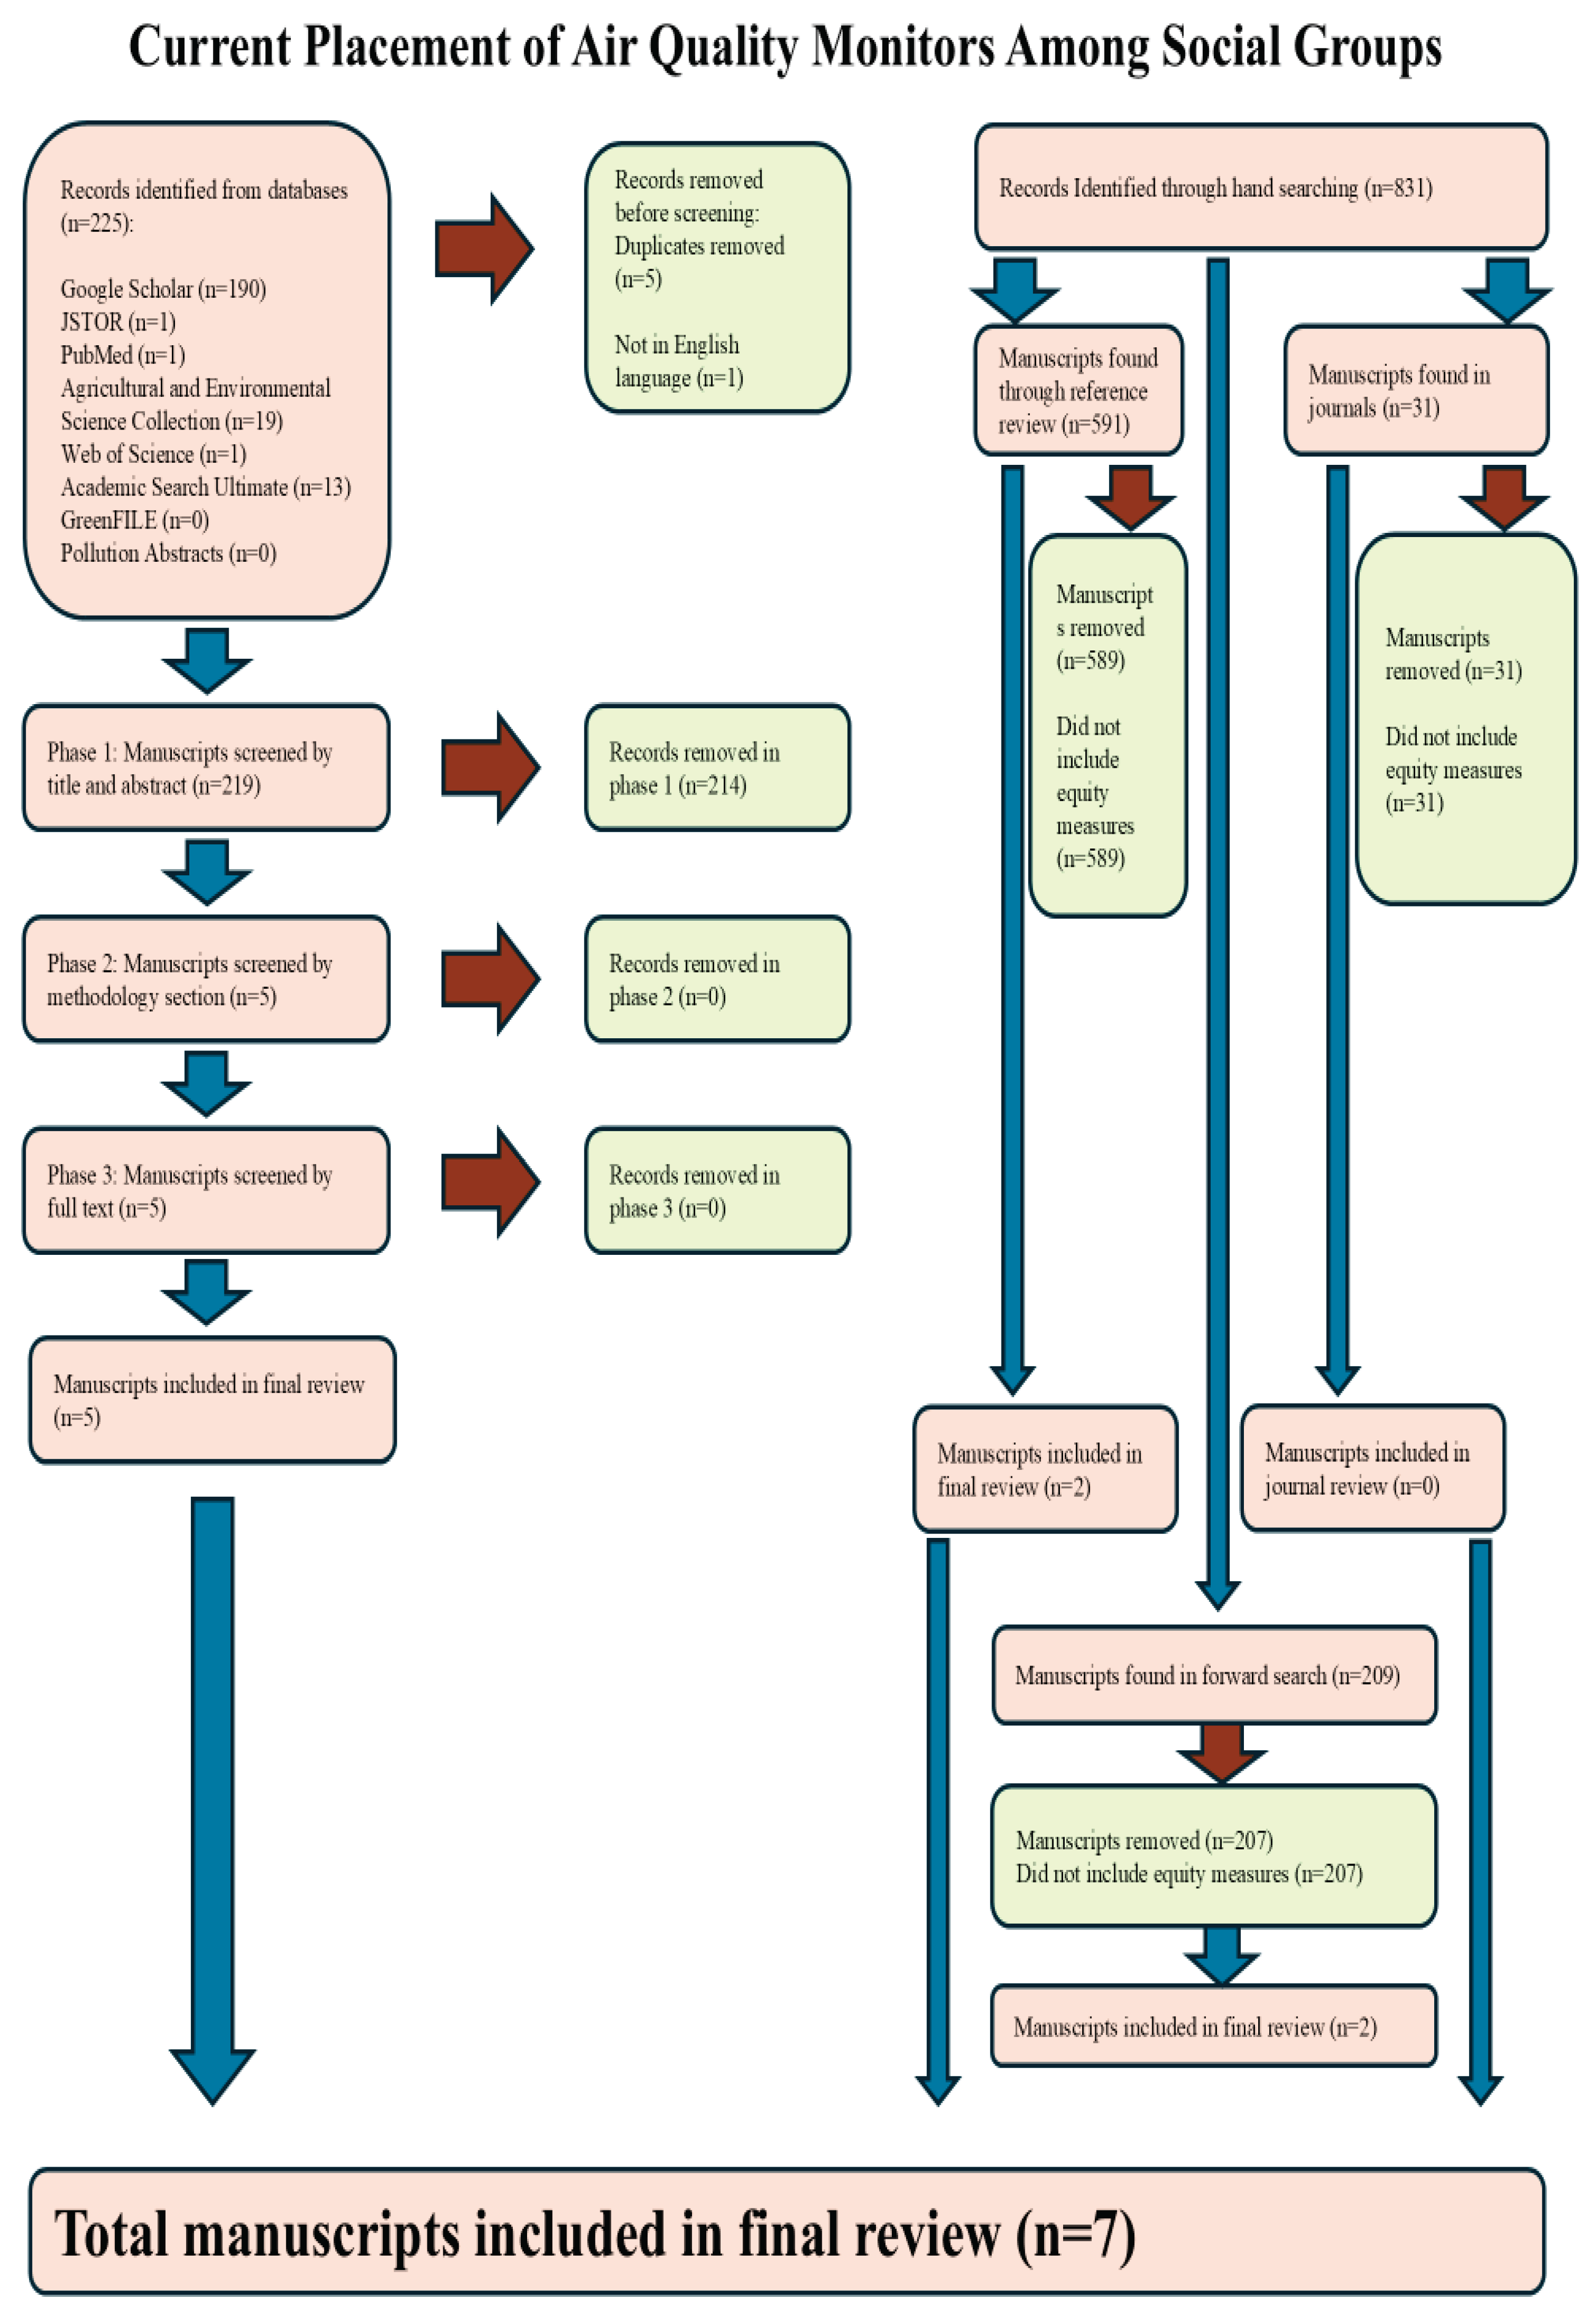

Table 1.
Overview Regulatory Air Quality Monitoring Equity Results.
| Authors | Demographic Equity Measures | Environmental/Structural Equity Measures |
| Bell & Ebisu (2012) | Census tracts with monitors were more likely to be low-income and majority Black | |
| Grainger & Schreiber (2019) | High income or predominantly White polluted areas were more likely to receive monitors than low income and minority communities | |
| Kelp et al. (2022) | Wildfires drive significant PM2.5 episodes, yet the current infrastructure is insufficient to track their impact across the Pacific Northwest. | |
| Kelly et al. (2024) | Block groups with higher proportions of Black, Hispanic, and multiracial residents had fewer monitors than expected based on population size. | Regulatory monitor coverage was defined using spatial buffers, which revealed that many communities of color were located outside the effective range of EPA monitors. |
| Roque et al. (2025) | Counties with higher African American/Hispanic populations, poverty rate and populations were more likely to be monitoring deserts. | Monitoring deserts are concentrated in rural, southern, and low income regions. |
| Regulatory and Low-Cost Sensor Monitoring | ||
| deSouza & Kinney (2021) | PurpleAir sensors were disproportionately located in Whiter, wealthier, and more educated census tracts than those with EPA monitors or the U.S. average. | PurpleAir sensors were more likely to be present where EPA monitors already existed |
| Kelp et al. (2023) | Race and income based metrics show that regulatory and low-cost sensor monitors are not predominantly in minoritized areas. | EPA monitors are still unequally distributed because of their original design which is to assess high emitting point sources of pollution. |
Table 2.
Key Studies Evaluating Air Quality Monitoring Equity in the United States.
| Authors | Data Sources | Analytical Methods | Demographic Equity Measures | Environmental & Structural Equity Measures | Findings |
| Bell et al., 2012 | 1. PM2.5 and chemical components from EPA monitors within 215 census tracts from 2000 to 2006 2.Demographic data from the 2000 U.S. Census |
1.Population-weighted exposure estimates 2.Univariate linear regression 3.Logistic regression |
1.Race/ethnicity 2.Socioeconomic status (SES) 3.Age groups |
Demographic Equity Measures 1.Minoritized racial groups had higher exposures to most PM2.5 components 2.People (0-19) had higher exposures 3.Lower SES groups had consistently higher exposures |
|
| Grainger and Schreiber, 2019 | 1.EPA Air Quality System monitoring data from 2005 to 2015 2.Remote sensing data from 2005 to 2015 3.American Community Survey’s (ACS’s) block group data from 2007 to 2011 |
1.Linear probability model 2.Utilized z-scores to compare air pollution levels |
1.Median household income, poverty rate, and percent White population | Demographic Equity Measures 1.Monitors in attainment counties were less likely to be placed in low income or less White areas | |
| deSouza and Kinney, 2021 | 1.PurpleAir sensor data from 2015 to 2020 2.EPA Air Quality System PM2.5 monitor data from 2015 to 2020 3.ACS’s demographic data from 2012 to 2017 |
1.Wilcoxon rank sum tests 2.Kolmogorov–Smirnov tests 3.Logistic regression 4.Linear regression |
1.Presence of EPA monitors (indicating prior regulatory attention) |
Environmental & Structural Equity Measures 1.Sensors were more likely to be present where EPA monitors already existed, possibly due to awareness or calibration efforts. |
|
| Kelp et al., 2022 | 1.Combined PM2.5 concentration dataset from 2000 to 2016 (Derived from a high resolution dataset created by ensemble machine learning combining EPA ground monitors, satellite-derived aerosol optical depth (AOD), land-use variables, and chemical transport models) | 1. Multiresolution Dynamic Mode Decomposition (mrDMD) 2. Dynamic Mode Decomposition (DMD) 3. QR Column Pivoting 4. Data Fusion Techniques |
1. EPA Monitor Distribution 2. Undermonitored Wildfire Regions |
Environmental & Structural Equity Measures 1.The current EPA network disproportionately favors the eastern US 2.Wildfires drive significant PM2.5 episodes, yet current infrastructure is insufficient to track their impacts across the Pacific Northwest. |
|
| Kelp et al., 2023 | 1. Modeled daily PM2.5 data from 2000 to 2016 2. 2020 ACS census data on race and income at the tract level |
1. Applied multiresolution dynamic mode decomposition (mrDMD) 2. Used QR pivoting 3. Developed a cost constrained extension (mrDMDcc) |
1. Proportion of nonwhite residents in each grid cell 2. Median annual household income 3. Normalized income |
1. Sensor location constraints based on existing EPA coverage 2. Structural placement penalties |
Demographic Equity Measures 1. Future EPA monitor placement based on income and race based model optimizations often identified more nonwhite areas to need monitors Environmental & Structural Equity Measures 1. Future EPA networks informed by model optimization incorporate more equitably distributed monitoring networks than current pollution focused monitoring |
| Kelly et al., 2024 | 1.EPA Air Quality System from 2019 to 2024 2. ACS data from 2022 |
1. Used Bayesian mixed effects negative binomial regression 2. Performed sensitivity analysis |
1. % Race/Ethnicity 2.% Total population per census block group |
1.% change in monitor distribution under sensitivity analysis with smaller buffers |
Demographic Equity Measures 1. Significant monitoring disparities exist for all criteria pollutants 2. Block groups with higher proportions of Black, Hispanic, and multiracial residents had fewer monitors than expected based on population size. Environmental & Structural Equity Measures 1. Regulatory monitor coverage was defined using spatial buffers, which revealed that many communities of color were located outside the effective range of EPA monitors. |
| Roque et al., 2025 | 1. EPA AirData of active air quality monitoring sites (as of September 2024) 2. 2017–2021 ACS county-level demographic and socioeconomic indicators 3. 2013 USDA Rural–Urban Continuum Codes |
1. Used logistic regression to model the likelihood of a county being a monitoring desert based on demographics and rurality 2. Conducted population-adjusted regression models to isolate the effects of race, poverty, and industry on monitoring access |
1. Share of population identifying as non-Hispanic Black or Hispanic. 2. Percent of population below the federal poverty line. 3. Percent of adults (age 25+) without a high school diploma. |
1. Presence or absence of an EPA air quality monitoring site at the county level. 2. Rural–Urban Continuum classification to identify metropolitan versus nonmetropolitan counties. |
Demographic Equity Measures 1. Counties with higher African American or Black populations were more likely to be monitoring deserts. 2. Hispanic population share was associated with lower odds of being a monitoring desert. 3. Poverty rate and lack of high school education were positively associated with monitoring desert classification. Environmental & Structural Equity Measures 1. 1,848 U.S. counties (58.8%) lacked any active air quality monitor as of 2024. 2. Monitoring deserts are concentrated in rural, southern, and low income regions, limiting reliable exposure estimates. |
Disclaimer/Publisher’s Note: The statements, opinions and data contained in all publications are solely those of the individual author(s) and contributor(s) and not of MDPI and/or the editor(s). MDPI and/or the editor(s) disclaim responsibility for any injury to people or property resulting from any ideas, methods, instructions or products referred to in the content. |
© 2025 by the authors. Licensee MDPI, Basel, Switzerland. This article is an open access article distributed under the terms and conditions of the Creative Commons Attribution (CC BY) license (http://creativecommons.org/licenses/by/4.0/).
Copyright: This open access article is published under a Creative Commons CC BY 4.0 license, which permit the free download, distribution, and reuse, provided that the author and preprint are cited in any reuse.


