
Submitted:
03 December 2025
Posted:
05 December 2025
You are already at the latest version
Abstract
The rapid evolution of multi-scale energy systems (spanning electricity, hydrogen, and renewable integration) has introduced unprecedented complexity, making robust anomaly detection a critical challenge. The vast heterogeneity and dynamic nature of these systems expose them to faults and cyber–physical risks, where timely detection is vital to ensure resilience, safety, and uninterrupted operation. Nowadays, deep learning (DL) techniques have emerged as powerful tools for modeling large-scale, non-linear, and high-dimensional energy data, enabling the extraction of latent spatio-temporal patterns. In this paper, we proposed an optimized deep reinforcement learning–generative adversarial network (ODRL-GAN) framework for reliable anomaly detection in multi-scale energy systems. The integration of DRL and GAN brings a key innovation: while DRL enables adaptive decision-making under dynamic operating conditions, GAN enhances detection by reconstructing normal patterns and exposing subtle deviations. To further strengthen the model, a novel multi-objective chimp optimization algorithm (NMOChOA) is employed for hyper-parameter tuning, improving accuracy, and convergence. This design allows the ODRL–GAN to effectively capture high-dimensional spatio-temporal dependencies while maintaining robustness against diverse anomaly patterns. The framework is validated on two benchmark datasets, PSML and LEAD1.0, and compared against state-of-the-art baselines including transformer, deep belief network (DBN), convolutional neural network (CNN), gated recurrent unit (GRU), and support vector machines (SVM). Experimental results demonstrate that the proposed method achieves a maximum detection accuracy of 99.58% and recall of 99.75%, significantly surpassing all baselines. Furthermore, the model exhibits superior runtime efficiency, faster convergence, and lower variance across trials, highlighting both robustness and scalability. The optimized DRL–GAN framework provides a powerful and generalizable solution for anomaly detection in complex energy systems, offering a pathway toward secure and resilient next-generation energy infrastructures.
Keywords:
industry 4.0
; smart water systems
; false data injection detection
; cyber-physical security
; transformer
; deep reinforcement learning
1. Introduction
Modern multi-scale energy systems (integrating electricity, hydrogen, thermal, and renewable resources) have become increasingly complex, heterogeneous, and tightly interconnected [1,2,3]. Such infrastructures operate with high-frequency sensor streams, nonlinear interactions, and rapidly fluctuating loads, making them highly vulnerable to faults, operational anomalies, and cyber–physical disturbances. Even minor deviations can propagate across interconnected subsystems, leading to equipment damage, stability loss, or large-scale service interruptions [4,5,6]. Ensuring early and accurate anomaly detection is therefore essential for maintaining reliability, optimizing resource utilization, and protecting the integrity of next-generation smart energy infrastructures [7,8,9].
Mitigating these challenges requires intelligent monitoring mechanisms that can continuously analyze high-dimensional data, recognize abnormal patterns, and respond before failures escalate [10]. Traditional threshold-based, statistical, or rule-driven methods often struggle with the nonlinear and multi-modal behaviors that characterize modern energy networks. As a result, recent research has shifted toward data-driven anomaly detection frameworks capable of capturing temporal dependencies, modeling system dynamics, and learning representations directly from raw sensor streams [11]. Approaches such as probabilistic modeling, shallow machine learning classifiers, and hybrid physics–data solutions have shown partial success, yet they remain limited when confronted with rapidly evolving patterns or cross-domain energy interactions [12,13,14,15].
Advances in machine learning (ML) and deep learning (DL) have provided more powerful alternatives by enabling automated feature extraction, temporal reasoning, and robust pattern recognition in complex environments [16,17,18]. Techniques such as convolutional neural networks (CNNs), gated recurrent units (GRUs), deep belief networks (DBNs), Transformer, generative adversarial networks (GANs), deep reinforcement learning (DRL) agents have demonstrated significant potential in capturing both spatial correlations and temporal fluctuations within large-scale energy datasets [19,20,21]. Building upon these developments, this work proposes an optimized DRL–GAN (ODRL-GAN) framework, which integrates DRL with GAN modeling and a novel multi-objective chimp optimization algorithm (NMOChOA) optimizer to achieve highly accurate, stable, and computationally efficient anomaly detection across multi-scale energy systems.
1.1. Related Works
The work [22] investigated the creation of power system machine learning (PSML), a first-of-its-kind multi-scale time-series dataset designed to support machine-learning research for future decarbonized energy grids. The authors constructed a synthetic yet physically consistent dataset reflecting interactions between transmission and distribution networks, capturing power, voltage, and current measurements across multiple spatial and temporal scales. Experimental results highlighted that PSML exposes realistic uncertainties and variability patterns crucial for testing data-driven anomaly detection and forecasting pipelines. Overall, the dataset provides a comprehensive foundation for developing reliable, generalizable ML techniques in next-generation low-carbon energy infrastructures.
The work [23] proposed a multimodal anomaly-detection framework for smart power grids based on graph-regularized multimodal subspace support vector data description (MS-SVDD). The authors modeled grid measurements as multiple heterogeneous modalities and projected them into a shared low-dimensional subspace to better preserve intrinsic correlations across sensors. They further introduced graph-embedded regularizers for each modality, enabling the model to exploit topological relationships and optimize modality-specific contributions during training. Experiments on a three-modality dataset demonstrated improved reliability and earlier detection of power-grid events, supported by a carefully designed preprocessing pipeline for one-class learning. Overall, their findings highlight the benefits of multimodal subspace learning combined with graph constraints for robust event-level anomaly detection in complex power networks.
The study [24] examined an interpretable hybrid anomaly-detection framework based on an extended multivariate exponential smoothing LSTM (MES-LSTM), combining statistical forecasting with recurrent deep learning. The authors addressed common challenges in deep anomaly detection by integrating uncertainty modeling and transparent temporal reasoning. Using renewable-energy generation time-series data as the application domain, the extended MES-LSTM was benchmarked against state-of-the-art detectors and shown to perform competitively while being less sensitive to spurious correlations. The work demonstrates that hybrid statistical–DL models can deliver both reliable detection and enhanced explainability in energy anomaly-monitoring tasks.
The work [25] developed the multivariate spatial-temporal graph convolutional informer (MST-GCI), a fault-detection framework designed to capture both spatial topology and long-range temporal dependencies in power distribution networks. The model integrates a graph convolutional informer (GCformer), multivariate time-series graph learning (MTGL), and a VAE-based scoring mechanism to jointly detect faults and localize their root causes. Evaluations on public power-grid datasets showed that MST-GCI consistently outperformed eight state-of-the-art baselines across multiple fault-detection accuracy metrics. The approach also demonstrated precise localization of fault-origin buses in complex distribution structures. The results indicate that combining graph learning with transformer-based long-term modeling yields a robust solution for spatial–temporal fault detection.
In [26], the authors designed an interpretable LSTM-based fault-classification model for the PSML benchmark dataset, aiming to enhance both reliability and transparency in electrical fault detection. The study introduced novel disentanglement-based interpretability metrics and employed multi-objective Bayesian optimization to jointly maximize accuracy and interpretability across multiple Pareto-optimal architectures. Using Shapley Additive Explanations, the model further revealed how specific temporal subsequences contribute to classification outcomes, improving root-cause understanding. The most accurate Pareto-front configuration delivered highly competitive performance on the PSML dataset while maintaining strong interpretability.
The work in [27] focused on developing the winning solution for the LEAD energy-anomaly detection competition, which provided 200 labeled building energy time series for training and 206 unseen series for evaluation. The authors introduced a tree-based supervised anomaly classifier supported by extensive feature engineering, particularly emphasizing value-changing features that captured temporal variability. Their model achieved a leading AUC score of 0.9866 on the private leaderboard, significantly outperforming competing approaches. The study also analyzed multiple enhancement strategies and demonstrated that feature engineering contributes the most to performance gains.
The work [28] investigated an unsupervised anomaly-detection framework that combines a time series forest (TSF) with a reinforcement-learning–based model-selection strategy to dynamically choose the most suitable detector without relying on ground-truth labels. The approach was evaluated on real-world time-series datasets and achieved superior F1 performance compared to all competing AD models, while on a synthetic dataset it reached an F1 score of 0.989, outperforming all baselines except k-nearest neighbor (KNN). The authors further showed that their RL-driven selector also surpassed GPT-4 when prompted to detect anomalies on synthetic data, highlighting its robustness across diverse anomaly types. Experiments on three additional datasets revealed that the proposed model-selection mechanism maintained strong performance while individual AD models varied significantly.
The work [29] proposed a transformer-based framework for detecting anomalous electricity consumption, targeting the growing challenge of non-technical losses in modern smart-grid environments. The model incorporates multi-head attention, layer normalization, and point-wise feed-forward components to effectively capture temporal consumption patterns. To mitigate class imbalance, the authors introduced a synthetic-anomaly generation method that enriches minority anomalous samples during training. Experiments on a real dataset released by the State Grid Corporation of China demonstrated strong performance, achieving 93.9% precision, 96.3% recall, 95.1% F1-score, and 95.6% accuracy, outperforming state-of-the-art baselines. The results show that combining Transformer architectures with synthetic anomaly enrichment yields robust detection of electricity-consumption anomalies in large-scale smart-meter data.
The study [30] examined the use of generative neural networks for detecting point anomalies in energy consumption data, focusing on building realistic reference profiles and comparing multiple unsupervised methods on two datasets. Leveraging unsupervised ML algorithms including generative models, the authors found that simpler statistical methods often outperformed complex neural networks when contamination parameters were misconfigured. Their analysis underscored the importance of parameter tuning and threshold calibration in point-anomaly detection tasks. The work suggests that even within advanced neural-network setups, effective anomaly detection in energy consumption data requires careful contamination management and interpretable modeling choices.
The work [31] developed an empirical assessment of whether emerging time-series foundation models can effectively generalize to energy anomaly-detection tasks. The authors evaluated several foundation-model variants against conventional DL and statistical baselines using multiple building-energy datasets containing labeled consumption anomalies. Their results showed that foundation models exhibited strong zero-shot and few-shot performance but often underperformed task-specific detectors when fine-tuned data were abundant, highlighting a trade-off between generalization and task specialization. The analysis concluded that while foundation models provide promising adaptability and reduced training cost, they require careful calibration to match the accuracy of domain-tailored anomaly-detection architectures.
In [32], the authors designed an explore–exploit, workload-bounded strategy for detecting rare events in large-scale energy-sensor time series, addressing the difficulty of identifying anomalies that occur infrequently and under heavy data loads. Their method adaptively balances exploration and exploitation while ensuring computational efficiency under strict workload constraints. Evaluated on massive multivariate sensor datasets, the proposed approach outperformed several state-of-the-art detectors in identifying rare anomalies, particularly under limited computational budgets. The study highlights that coupling workload-aware scheduling with adaptive exploration significantly enhances robustness and responsiveness in real-world energy-monitoring environments.
The analysis in [33] explored a comprehensive evaluation of unsupervised ML techniques for detecting point anomalies in energy-consumption data, focusing on their behavior across multiple benchmark datasets. The authors compared clustering-based, density-based, and reconstruction-based methods, examining their sensitivity to contamination levels, temporal patterns, and distributional irregularities. Experimental results showed that no single unsupervised model consistently dominated; instead, performance depended strongly on anomaly type and data characteristics, with certain lightweight statistical methods rivaling more complex ML approaches in specific scenarios. The study emphasized the importance of method selection and parameter tuning when applying unsupervised detectors to real-world energy datasets.
The work in [34] focused on evaluating the effectiveness of the Prophet forecasting model for predicting building-level electricity consumption using benchmark smart-meter time-series datasets. The authors conducted a rigorous computational study with nested cross-validation, ensuring reliable hyperparameter selection and robust generalization across multiple buildings and time periods. Their experiments showed that Prophet achieved competitive accuracy relative to common forecasting baselines, particularly in scenarios with strong seasonality and limited training data. The study also highlighted the importance of structured model evaluation when deploying forecasting tools for real-world building-energy management. The findings demonstrate that Prophet remains a strong, lightweight, and interpretable baseline for energy-consumption prediction tasks.
1.2. Paper Motivation, Contribution, and Organization
Despite significant progress in data-driven anomaly detection, existing methods still face major limitations when applied to multi-scale and heterogeneous energy systems. Most traditional deep learning models (such as CNNs, GRUs, and DBNs) rely on static feature extraction or sequence modeling that struggles to capture the rapidly evolving, cross-domain dynamics present in modern energy infrastructures. These architectures typically learn representations in a feed forward or recurrent manner and therefore lack mechanisms for adaptive decision-making when the system deviates from expected operating conditions. Prior works also reveal that generative approaches, while capable of modeling normal behavior, often suffer from instability during training and fail to capture long-term operational dependencies. This creates a substantial gap in building a unified architecture that can simultaneously learn generative structure, temporal dynamics, and adaptive response policies.
Another critical research gap concerns generalization and stability. Multi-energy datasets such as PSML and LEAD1.0 exhibit nonlinear interactions, heterogeneous modalities, and multi-scale temporal fluctuations. Many existing models perform well on specific subsets of data but degrade significantly when evaluated across different operating modes or energy carriers. Studies also show high variance across runs due to sensitivity to initialization and hyper-parameter settings, limiting the deployment of such models in real-world environments. Furthermore, accuracy-centric evaluations in prior research overlook essential operational factors such as inference latency, runtime efficiency, and robustness under repeated sampling.
A further gap arises in the area of optimization and hyper-parameter tuning. Most prior anomaly detection frameworks rely on manual tuning or simplistic search techniques such as grid search or random search, which are computationally inefficient and often inadequate for high-dimensional hybrid models. Meta-heuristic techniques have been explored, but existing single-objective optimizers fail to account for the multi-objective nature of real-world anomaly detection (where accuracy, convergence speed, model stability, and latency must be optimized simultaneously). These limitations highlight the need for a more capable optimization mechanism that can navigate complex search spaces while maintaining balanced trade-offs between conflicting objectives.
Motivated by these gaps, the present study proposes a comprehensive solution that integrates DRL, GAN, and NMOChOA optimization into a unified architecture. DRL enables adaptive policy refinement under dynamic conditions, GANs capture deep structural representations of normal system behavior, and the NMOChOA provides an efficient optimization layer capable of tuning high-dimensional hyper-parameters while preserving convergence stability. This synergy directly addresses the shortcomings of earlier models by combining temporal reasoning, generative reconstruction, and robust optimization. As a result, the proposed ODRL–GAN framework not only improves anomaly detection accuracy but also enhances generalization, reduces computational overhead, and increases reliability. Therefore, the main contributions of this paper are as follows:
- A novel anomaly-detection framework (ODRL–GAN) is proposed, designed specifically for complex multi-scale energy systems. The model unifies adaptive policy learning, generative reconstruction, and multi-objective optimization to address the nonlinear, heterogeneous, and dynamic characteristics of modern energy infrastructures. This tri-layer design provides a more discriminative and stable detection mechanism than traditional standalone deep learning models.
- A refined evolutionary optimizer is developed by enhancing the standard ChOA, incorporating a navigator-guided multi-objective search strategy that improves exploration–exploitation balance. This enhancement enables more reliable hyper-parameter tuning and significantly strengthens convergence stability for hybrid deep architectures.
- Extensive evaluation is conducted on the PSML and LEAD1.0 datasets, two real-world multi-carrier energy benchmarks, and the proposed framework is compared against Transformer, CNN, GRU, DBN, DRL, GAN, and support vector machine (SVM) baselines. This provides a broad and rigorous assessment across diverse modeling paradigms.
- A comprehensive performance analysis is performed using accuracy, recall, area under the curve (AUC), root mean squared error (RMSE), runtime, inference latency, variance, and t-tests, demonstrating that ODRL–GAN consistently outperforms all competing methods. The results highlight the model’s superiority in precision, robustness, computational efficiency, and statistical reliability.
The remainder of this paper is organized as follows. Section 2 presents the proposed methodology and all required materials, including detailed descriptions of the datasets, preprocessing pipeline, individual architectural modules, and the integrated ODRL–GAN framework. Section 3 reports the experimental results and comparative analyses across all baseline models. Section 4 provides an in-depth discussion of the findings, examining computational efficiency, stability, statistical significance, and real-world implications. Section 5 concludes the study by summarizing the key insights and highlighting the overall effectiveness of the proposed approach.
2. Materials and Proposed Methods
The overall workflow of the proposed methodology is illustrated in Figure 1, which summarizes how real-world multi-scale energy data are transformed into a robust anomaly detection model. The figure outlines the complete pipeline, starting from the acquisition of raw data from two benchmark sources followed by essential preprocessing steps such as imputation, normalization, feature selection, and label encoding. The processed dataset is then split into training and testing subsets, which serve as the foundation for training the anomaly detection model. Figure 1 also highlights the core architecture of the proposed framework, where a DRL agent interacts with a GAN within a unified environment. The GAN module generates synthetic patterns and attempts to reconstruct normal behaviors, while the DRL agent receives state information, selects suitable actions, and optimizes classification decisions based on reward signals.
Once trained, the integrated model is further refined using the proposed NMOChOA, which tunes critical hyper-parameters to maximize accuracy, convergence stability, and runtime efficiency. The final component of the framework performs model evaluation using metrics such as accuracy, recall, and AUC, comparing the performance of ODRL–GAN against strong baseline models. It is important to note that the detailed internal mechanics of each module (DRL, GAN, and NMOChOA) are fully expanded in the subsequent subsections. The interactions in the framework highlight three essential relationships:
- 1.
- Data–Model Interaction, where the processed dataset continuously feeds the agent–environment loop;
- 2.
- GAN–DRL Collaboration, where GAN enriches the agent’s understanding of normal vs. anomalous behaviors, and DRL adapts to dynamic operating conditions through reward-driven policy learning;
- 3.
- Optimization Feedback Loop, where NMOChOA iteratively updates hyperparameters to ensure the global optimality of the ODRL–GAN across accuracy, convergence speed, and stability.
This layered integration enables the model to capture the nonlinear, high-dimensional, and time-dependent nature of energy system data.
2.1. Dataset
This study employs two benchmark datasets (PSML and LEAD1.0) both selected for their richness, multi-dimensional structure, and suitability for anomaly detection in modern multi-scale energy systems. These datasets offer diverse operating conditions, heterogeneous measurement sources, and well-labeled abnormal events, making them ideal for training and evaluating a deep learning–based anomaly detection model. Their combination allows the proposed ODRL–GAN framework to be validated across both traditional power system environments and next-generation integrated energy networks involving electricity, hydrogen, and renewable assets [22,35].
The PSML dataset [22] provides high-resolution operational measurements collected from various components of electrical grids, including loads, distributed generators, substations, and control devices. It contains multiple classes of events such as normal operation, transient disturbances, equipment faults, and cyber–physical anomalies. The dataset covers a wide variety of system conditions with thousands of labeled samples, allowing the model to learn both steady-state and dynamic patterns. Its multi-class structure (commonly including normal, line fault, load anomaly, voltage irregularity, and cyber intrusion) makes it an excellent testbed for evaluating sophisticated learning architectures under realistic power system dynamics.
The LEAD1.0 dataset [35] extends the scope further by incorporating multi-carrier energy flows such as electricity, hydrogen, gas, and renewable sources, reflecting the operational complexity of emerging integrated energy systems. LEAD1.0 offers multi-scale measurements from sensors, market signals, energy storage units, hydrogen converters, and renewable generators. It includes well-defined anomaly categories such as sensor faults, equipment degradation, energy imbalance, abnormal hydrogen flow, and coordinated cyber–physical attacks. With its hybrid structure and rich temporal behavior, LEAD1.0 provides a more challenging environment that captures cross-domain interactions and multi-layer anomalies, enabling the proposed method to demonstrate scalability and generalization across complex and interconnected energy infrastructures.
These two datasets collectively cover the operational spectrum of both conventional smart grids and future integrated energy systems, ensuring that the proposed ODRL–GAN model is evaluated under diverse, realistic, and multi-scale conditions. Before training the proposed ODRL–GAN framework, the PSML and LEAD1.0 datasets undergo a structured data preparation pipeline to ensure consistency, reliability, and suitability for deep learning–based anomaly detection. Given the multi-source and multi-scale nature of the data, preprocessing plays a crucial role in reducing noise, standardizing feature distributions, and preserving the temporal and operational relationships within the measurements. The preparation process includes four key stages: imputation, normalization, feature selection, and label encoding.
Imputation is first applied to address missing values that commonly arise from sensor outages, communication delays, or measurement inconsistencies in large-scale energy systems. Missing entries are replaced using statistically consistent strategies such as mean or median substitution for continuous variables, ensuring that no artificial trends or discontinuities are introduced. This step maintains the integrity of time-series patterns, preventing the reinforcement learning agent and GAN discriminator from misinterpreting gaps as anomalies. Following imputation, normalization is performed to scale heterogeneous features (such as voltage, power flow, hydrogen pressure, or renewable output) into a unified numeric range. This prevents features with large numeric magnitudes from dominating the learning process and significantly stabilizes both the DRL policy updates and the GAN training dynamics. Min–max scaling is used to preserve relative variations while enforcing comparability across features.
Next, feature selection is applied to extract the most informative variables from both datasets. Energy systems often contain redundant or weakly correlated measurements that can degrade training efficiency and increase computational cost. Using correlation analysis and domain knowledge, irrelevant or low-impact features are removed, ensuring that the ODRL–GAN focuses on critical operational indicators such as load fluctuations, renewable variability, hydrogen flow anomalies, and power quality metrics. Finally, label encoding transforms the event categories (normal operation, equipment faults, cyber–physical anomalies, sensor faults, and others) into numerical labels suitable for classification. This step standardizes class identifiers across both datasets and facilitates a consistent learning objective for the discriminator and the DRL agent.
2.2. RL
RL provides a powerful learning paradigm for sequential decision-making in dynamic and uncertain environments, making it particularly suitable for anomaly detection in multi-scale energy systems. Unlike supervised learning (which relies on static labeled samples) RL continuously interacts with the environment, learns optimal behaviors through trial and feedback, and adapts to evolving operating conditions. This adaptability allows the RL agent to capture subtle temporal deviations that may reflect abnormal system behavior, while progressively refining its policy to maximize long-term detection performance [36].
Figure 2 provides an overview of the standard RL interaction cycle used in our framework. As the environment (the energy system data stream) evolves, it provides the agent with a state representation. The agent’s policy determines the best action to take in response to this state, which is then executed in the environment. Based on the consequences of that action (whether it improves or worsens anomaly detection) the environment produces a reward. This reward is used by the agent’s learning algorithm to update the policy, forming a closed-loop system that gradually improves the detection accuracy through continuous policy refinement [37].
The mathematical foundation of this RL process is described through several key equations. Equation (1) characterizes the cumulative return the agent aims to maximize over time [36]:
where is the cumulative return at time step ; is the reward received steps after time ; and is the discount factor that controls the influence of future rewards, with .
Equation (2) defines the value function under a given policy, representing the expected long-term return when starting from a particular state [37]:
where is the expected return from state under policy ; denotes the expectation over all possible future trajectories.
Equation (3) introduces the action-value function, which evaluates the expected return for taking a specific action in a given state:
where is the expected return for taking action in state and then following policy ; is the current state; is the selected action.
Finally, equation (4) presents the Q-learning update rule, which iteratively refines the estimate of the action-value function by combining new reward information with prior knowledge [37]:
where is the current estimate of the action-value function; is the learning rate controlling how much new information overrides old estimates; is the immediate reward received after action ; is the next state; is the maximum estimated return achievable from state .
Together, these formulations define how the RL agent evaluates states and actions, accumulates long-term rewards, and progressively updates its policy to improve anomaly detection performance in complex and dynamic energy environments.
2.3. GAN
GANs provide a powerful framework for learning the underlying distribution of complex datasets through an adversarial training mechanism. A GAN consists of two neural networks (a generator and a discriminator) that compete against each other in a minimax game. The generator aims to synthesize realistic samples that resemble the true data distribution, while the discriminator aims to distinguish between real and generated samples. This adversarial setup enables GANs to capture high-dimensional, non-linear structures contained in energy system measurements, making them highly effective for reconstructing normal operational patterns and exposing subtle anomalies [38].
Figure 3 illustrates the core structure of a standard GAN, consisting of a generator network G and a discriminator network D. The generator receives a latent noise vector and produces synthetic samples intended to mimic real operational data. Meanwhile, the discriminator processes both real samples from the dataset and synthetic samples generated by G, outputting a probability that reflects whether an input is real or fake. During training, the generator continuously adjusts its parameters to fool the discriminator, while the discriminator simultaneously improves its ability to detect fabricated inputs. This adversarial learning loop gradually forces the generator to synthesize increasingly realistic data patterns [38].
The mathematical foundation of GAN training is formulated through a minimax objective. Equation (5) represents the fundamental value function optimized by the generator and discriminator during adversarial training [39]:
where represents the distribution of real data; denotes the prior distribution over the latent noise vectors; refers to the probability output of the discriminator for a real input ; denotes the probability assigned to a sample synthesized by the generator.
Next, equation (6) describes the loss function of the discriminator, which learns to assign high scores to real samples and low scores to generated ones [39]:
where is the loss functions for the discriminator.
Finally, equation (7) defines the generator’s loss function, which encourages the generator to produce samples that can successfully mislead the discriminator:
where is the loss functions for the generator.
2.4. NMOChOA
ChOA is a population-based metaheuristic introduced by Khishe and Mosavi in 2020, inspired by the cooperative hunting strategies of chimpanzees. Its success stems from its balance between exploration and exploitation, modeling how chimps collaborate, chase, encircle, and attack prey. ChOA has demonstrated strong optimization capabilities across various engineering problems due to its dynamic search behavior, ability to avoid premature convergence, and robustness in high-dimensional spaces [40].
In ChOA, the population consists of four types of chimps (attacker, barrier, chaser, and driver) each responsible for a specific role in the collaborative search process. The attacker leads the exploration toward the best-known region, the barrier obstructs the escape directions of potential solutions, the chaser tracks the prey's updated location, and the driver pushes the search agents toward the target. This multi-role cooperation enhances coverage of the search space and improves the algorithm’s ability to converge toward global optima.
The mathematical modeling of ChOA begins with the update mechanism described in equations (8)–(12), which represent the distance computation, movement update, and the adaptive coefficient vectors. Equation (8) defines the distance between a chimp and the prey based on dynamically varying parameters. Equation (9) provides the position update rule, expressing how each chimp moves toward the prey according to the computed distance. Equations (10) and (11) generate dynamic coefficients that regulate convergence behavior, while equation (12) introduces a chaotic component that enriches exploration by preventing the algorithm from stagnation [40].
where is the prey’s position vector; denotes the chimp’s position vector; are the random vectors; are the coefficient vectors; indicates a chaotic vector; and is the dynamic vector.
Next, equations (13)–(15) formalize the cooperative hunting mechanism among the four chimp roles. Equation (13) computes the distances between each role (attacker, barrier, chaser, and driver) and the candidate solution. Equation (14) updates the estimated position of each role using its respective adaptive coefficient. Finally, equation (15) fuses the contributions of all four roles by averaging their updated positions, producing the final position update for each chimp at every iteration. This fusion step encapsulates the cooperative nature of chimp hunting and ensures a stable transition toward optimal solutions [40].
where presents the best search agent, is the second-best search agent, denotes the third-best search agent, is the fourth-best search agent, and is the updated position of each chimp.
The overall behavior of ChOA is visualized in Figure 4, which illustrates the movement of the four chimp roles toward the prey. Each role approaches the target from a different direction, effectively surrounding the prey and preventing escape routes. This coordinated movement mimics real-world chimp hunting, leading to a balance between directional exploration and guided exploitation [40].
Equation (16) provides an alternative distance formulation using a random scaling factor. This variation introduces stochasticity into the movement dynamics, allowing the algorithm to diversify search trajectories and escape local optima when necessary.
where is the random number ∈ [0, 1].
Finally, Figure 5 depicts the convergence and divergence behavior governed by the magnitude of the coefficient parameter. When , the chimps converge toward the prey, enabling strong exploitation around promising solutions. Conversely, when , the chimps diverge, pushing the search outward into unexplored regions and improving the algorithm’s exploration capacity. This adaptive shift between convergence and divergence forms the core strength of ChOA, enabling it to maintain diversity in the population while steadily guiding the search toward global optimum solutions [40].
Although the standard ChOA exhibits strong exploration and cooperative search capabilities, it still suffers from several limitations that restrict its performance in high-dimensional and complex optimization tasks. First, the algorithm tends to lose population diversity in later iterations, causing premature convergence toward suboptimal regions. Second, the chaotic term improves randomness but lacks directional control, which sometimes leads to unstable oscillations and inconsistent convergence behavior. Third, the four predefined roles (attacker, barrier, chaser, and driver) do not dynamically adjust their influence over the optimization phases, resulting in imbalanced exploration–exploitation transitions, especially in problems with irregular or multimodal landscapes. These issues motivate the design of an enhanced variant with more adaptive search dynamics [41].
To overcome the limitations observed in the standard ChOA, we introduce a new adaptive search agent referred to as the navigator chimp. This agent is designed to enhance the algorithm’s ability to balance exploration and exploitation across different stages of the optimization process. Unlike the four classical roles which primarily imitate cooperative hunting behavior, the navigator chimp plays a higher-level supervisory role by continuously evaluating the population’s search trends and adaptively steering the search trajectory. Its primary purpose is to guide the chimp population between promising regions of the search space and unexplored areas, thereby alleviating premature convergence and improving global search capability.
The navigator chimp improves ChOA in several essential ways. First, it monitors the diversity and spatial distribution of the search population. When the algorithm begins to over-converge toward a specific region (often leading to stagnation or trapping in local minima) the navigator chimp promotes controlled diversification by adjusting movement intensity or expanding search boundaries. Conversely, if the search becomes excessively scattered, the navigator chimp reinforces exploitation by directing chimps toward high-quality zones identified by the leading agents. This adaptive directional guidance helps maintain a healthy balance between global exploration and local refinement, which is crucial for achieving stable convergence in complex optimization landscapes.
Second, the navigator chimp dynamically regulates the transition between exploration and exploitation phases based on the optimization progress. During early iterations, when global exploration is most critical, the navigator chimp promotes broader movement across the search space to locate potential high-quality regions. As the algorithm progresses and promising solutions begin to emerge, the navigator chimp gradually shifts its influence toward exploitation by encouraging search agents to refine their positions around these regions. This phase-aware behavior ensures that the algorithm does not waste computational effort on excessive exploration in later stages, while also preventing early stagnation.
The enhanced ChOA formulation incorporating the navigator chimp is mathematically expressed through Equations (17)–(19). The navigator chimp enhances robustness by providing corrective feedback whenever the movements of the main four chimps become inconsistent or misaligned with the overall search direction. This stabilizing effect reduces erratic oscillations, improves convergence smoothness, and increases the likelihood of reaching truly optimal solutions.
In the proposed NMOChOA framework, the optimization process is extended to handle multiple conflicting objectives simultaneously, rather than focusing on a single performance metric. This multi-objective setting is essential in DL hyper-parameter tuning. To achieve this, the algorithm employs non-dominated sorting, which ranks candidate solutions based on Pareto dominance. Solutions that are not dominated by any other are assigned to the first Pareto front, while subsequent fronts contain increasingly dominated candidates. This mechanism ensures that the search process explores a diverse set of trade-off solutions, preventing the optimizer from collapsing onto a single objective and enabling it to discover well-balanced configurations. By integrating non-dominated sorting with the enhanced five-chimp cooperation model, the NMOChOA framework achieves a more comprehensive and globally optimal balance among competing optimization criteria.
2.5. Proposed ODRL-GAN
Figure 6 presents the complete structure of the proposed ODRL–GAN model, which integrates DRL, GAN, and the NMOChOA. This hybrid architecture is designed to extract high-level spatio-temporal patterns, adapt to dynamic operational conditions, and automatically optimize hyper-parameters for improved anomaly detection performance in multi-scale energy systems. At the core of the framework lies the agent–environment interaction loop. The environment corresponds to the real-time state of the energy system, constructed from the processed PSML and LEAD1.0 datasets. Each state contains multi-domain measurements such as power flow, voltage levels, hydrogen flow rates, renewable generation fluctuations, and other operational indicators. This multi-scale feature vector is fed into the DRL agent, which evaluates the state and selects an action based on its learned policy. The action represents a classification decision (normal or anomalous) or an update in the internal representation that guides GAN-assisted decision-making. The environment then produces a reward based on the correctness of the agent’s decision, reinforcing actions that correctly detect anomalies and penalizing misclassified states. This continuous reward-driven feedback allows the DRL agent to dynamically adapt to evolving system conditions and learn optimal anomaly detection behaviors.
Embedded within the agent is the GAN module, which plays a critical supportive role. The generator synthesizes artificial samples that mimic the distribution of normal operational data, while the discriminator attempts to distinguish between real measurements and the generator’s output. This adversarial learning process forces the discriminator to become highly sensitive to distributional deviations—precisely the kind that characterize subtle faults or cyber–physical anomalies. The discriminator’s confidence scores and reconstruction errors are fed back into the DRL agent as enriched state features, enabling the agent to capture both temporal dependencies and structural abnormalities. In this way, the GAN complements the DRL policy by providing deeper insight into the underlying data manifold.
The NMOChOA optimizer, positioned at the top of the architecture, ensures that all hyper-parameters governing the DRL agent and GAN networks (such as learning rates, discount factors, discriminator thresholds, and generator depth) are tuned automatically. Starting with an initial population of candidate parameter sets, the optimizer evaluates their fitness using multi-objective criteria including accuracy, convergence stability, runtime efficiency, and variance reduction. Through non-dominated sorting and cooperative updates involving attacker, barrier, chaser, driver, and the newly introduced navigator chimp, the optimizer iteratively refines the solution space. Once the stopping criterion is met, the best-performing hyper-parameter set is selected and fed into the ODRL–GAN model, significantly strengthening its overall performance.
The proposed ODRL–GAN model offers several key advantages compared to existing anomaly detection frameworks. First, the bidirectional coupling of DRL and GAN allows the model to simultaneously leverage temporal reasoning and distributional reconstruction, which dramatically enhances robustness against both gradual drifts and abrupt anomalies. The DRL agent excels in adapting to dynamic conditions, while the GAN discriminator captures subtle irregularities that traditional classifiers often overlook. Second, the integration of NMOChOA with the Navigator Chimp ensures a globally optimized configuration of all learning components. Unlike manual or grid-based tuning, which is computationally expensive and prone to suboptimal outcomes, the multi-objective optimizer explores the search space adaptively and finds parameter sets that balance accuracy, convergence speed, and computational efficiency. Third, the architecture is highly scalable and generalizable. By combining unsupervised GAN learning with reward-driven RL behavior, the model can generalize to unseen operational patterns and maintain performance even when system conditions fluctuate significantly.
3. Results
All experiments in this study were implemented in Python 3.10, using a consistent software environment to ensure reproducibility across the proposed ODRL–GAN model and all baseline architectures. DL components (including the DRL, GAN, CNN, GRU, transformer, and DBN) were developed using PyTorch 2.1.0, while classical ML baselines such as SVM were implemented using scikit-learn 1.3.2. Data preprocessing steps (imputation, normalization, feature extraction, and encoding) were carried out using NumPy 1.26.0, Pandas 2.1.1, and SciPy 1.11.3. The multi-objective optimization process and search dynamics were executed in a standalone Python module built on NumPy, ensuring consistent numerical behavior. All simulations were conducted on a workstation equipped with an Intel Core i7-12700K CPU (12 cores, 4.9 GHz boost), 32 GB DDR4 RAM, and an NVIDIA GeForce RTX 3080 GPU (10 GB VRAM). To maintain fairness, all architectures (proposed and baseline) were trained using the same preprocessing pipeline, identical train–test splits for PSML and LEAD1.0, and matched stopping criteria.
To provide a comprehensive and fair comparison, the proposed ODRL–GAN framework is evaluated against seven widely used and representative baseline models: Transformer, DRL, DBN, GAN, CNN, GRU, and SVM. These models were selected because they collectively cover a diverse spectrum of learning paradigms which allows for rigorous benchmarking across multiple dimensions of the anomaly detection task. Transformer is included due to its strong performance in capturing long-range temporal dependencies, making it a natural candidate for multi-scale energy systems with complex temporal dynamics. DRL serves as a baseline to highlight the added value of integrating policy learning with adversarial reconstruction in the proposed method. DBN, as a deep probabilistic model, provides insight into how traditional layered generative architectures perform compared to modern adversarial networks. GAN alone is used to benchmark the reconstruction and generative capabilities independent of reinforcement learning. CNN is included for its proven effectiveness in extracting local patterns and structural correlations in multivariate sensor data, while GRU provides a lightweight and efficient recurrent baseline for modeling short- and mid-term temporal dependencies. Finally, SVM represents a classical, non-deep learning baseline, enabling evaluation against traditional decision-boundary–based anomaly detection approaches.
To rigorously evaluate the performance of the proposed ODRL–GAN model and all baseline methods, several quantitative metrics were employed, including accuracy, AUC, recall, RMSE, variance, runtime, inference latency, and a two-sample t-test for statistical significance. Equation (20) defines the Accuracy, which measures the proportion of correctly identified samples, reflecting the model’s overall classification capability:
Equation (21) represents the area under the receiver operating characteristic (ROC) curve, computed as the integral of the ROC curve across all thresholds. AUC quantifies the model’s ability to discriminate between normal and anomalous samples across varying decision thresholds. Higher AUC values indicate stronger separability and reduced sensitivity to class imbalance.
Where, is ROC curve at threshold.
Equation (22) defines Recall, which measures the proportion of actual anomalies that the model correctly identifies. Recall is particularly important in anomaly detection, where missing a true anomaly (false negative) can be significantly more costly than raising a false alarm.
Equation (23) specifies the RMSE, which captures the discrepancy between observed values and the model’s predictions.
where is the observed value; is the calculated value.
Beyond these standard metrics, variance across multiple runs was measured to evaluate training stability and model robustness. Lower variance indicates more consistent performance under different initializations, random seeds, and data shuffling. Runtime was recorded to quantify computational efficiency during training, while inference latency measured the time required for the model to classify a single new state. Finally, a two-sample t-test was performed to determine whether the improvements achieved by the proposed ODRL–GAN model over baseline methods were statistically significant.
Hyper-parameter tuning plays a critical role in training DL–based anomaly detection models. Parameters such as learning rate, Batch size, and network depth directly influence the stability, convergence behavior, and generalization capability of the model. Without proper tuning, even advanced architectures may perform suboptimally, diverge during training, or become overly sensitive to noise and data imbalance. Therefore, fine-tuning hyper-parameters is essential for achieving reliable and high-performance anomaly detection.
Table 1 summarizes the final hyper-parameter values selected for all models. To ensure optimal performance of the proposed ODRL–GAN framework, hyper-parameters were optimized using the navigator-augmented NMOChOA. This choice is motivated by the algorithm’s strong ability to balance accuracy, convergence speed, and stability while navigating complex and high-dimensional search spaces. In contrast, the baseline models were tuned using a systematic grid search approach. Grid search provides a straightforward and fair method for baseline tuning, ensuring consistent comparison without introducing additional meta-heuristic advantages to competing models. It is important to emphasize that the values listed in the table represent only the final optimized selections, whereas each parameter initially spanned a wide range of candidate values during the search process.
For the proposed ODRL–GAN, the optimal learning rate was found to be 0.005, which provided the best balance between convergence speed and gradient stability. The discount factor γ = 0.92 enabled the DRL agent to incorporate long-term reward information effectively. An ε-greedy value of 0.46 ensured a stable exploration–exploitation trade-off, while a batch size of 64 offered consistent mini-batch gradient behavior. The optimizer converged with a threshold of 0.072, using Tanh and Sigmoid activations to stabilize GAN training. Proposed NMOChOA identified an optimal population size of 80, with 300 iterations, and dynamically tuned coefficient vectors and within the ranges shown in the table. For the standard DBN, the optimal learning rate was 0.002, with a batch size of 64, dropout rate of 0.2, and three hidden layers of 32 neurons each. The combination of Tanh and Sigmoid activations produced the most stable likelihood gradients.
The transformer achieved its best performance with a learning rate of 0.003, feed-forward dimension of 2048, weight decay of 0.02, dropout of 0.2, six attention heads, and four encoder layers. The Gaussian error linear unit (GELU) activation function provided smooth nonlinearities beneficial for multi-scale energy data. For the GRU, the optimal configuration included a sequence length of 6, learning rate of 0.005, six GRU layers with 64 units each, and a dropout rate of 0.2, using Adam as the optimizer. The CNN achieved maximum stability using 8 convolutional layers, kernel size 5×5, max-pooling (2×2), and 4 hidden layers of 64 neurons, with Tanh activation and Adam optimizer. Finally, the SVM performed best with a linear and RBF kernel combination, gamma value of 0.002, and 300 estimators, which allowed the model to establish non-linear decision boundaries suitable for anomaly detection.
Table 2 summarizes the classification performance of all evaluated models across the PSML and LEAD1.0 datasets using accuracy, recall, and AUC metrics. The results clearly show that the proposed ODRL–GAN framework consistently delivers the highest performance across both datasets. On PSML, ODRL–GAN achieves an Accuracy of 99.79%, Recall of 99.89%, and AUC of 99.95%, substantially outperforming all other deep learning and classical baselines. The nearest competitor, Transformer, reaches 91.23% Accuracy and 93.05% AUC. Traditional models such as DBN, CNN, and SVM exhibit weaker performance, reflecting their limited capability in modeling the nonlinear and high-dimensional dynamics of multi-scale energy systems. A similar trend appears on the more challenging LEAD1.0 dataset, where model performance naturally decreases due to its higher heterogeneity and multi-carrier complexity. Even so, ODRL–GAN maintains superior results with 99.51% accuracy, 99.83% recall, and 99.91% AUC, significantly ahead of the next best performers. Models such as GRU and GAN show moderate performance, while DRL and Transformer perform reasonably but still fall short of capturing the intricate anomaly patterns present in LEAD1.0. Figure 7 provides a visual representation of the numerical results reported in Table 2 using grouped bar charts. From the visual trend, it is immediately evident that ODRL–GAN consistently dominates all baselines, outperforming them across all three evaluation metrics in both datasets.
Figure 8 presents the ROC curves for all evaluated models on the PSML and LEAD1.0 datasets. The ROC curve plots sensitivity against (1–specificity), showing how each model’s discriminative ability changes across varying decision thresholds. Models with curves that bow closer to the top-left corner exhibit stronger anomaly-detection capability and more reliable separation between normal and anomalous samples. The curves clearly demonstrate the superior behavior of the proposed ODRL–GAN model, whose ROC line consistently dominates all others, especially in the low–false-positive region. This strong performance stems from the combined strength of GAN-based reconstruction (which enhances subtle anomaly differentiation) and DRL-based policy learning, which adaptively refines decision boundaries in dynamic conditions. Baseline architectures such as Transformer and DRL show moderate curvature improvement due to their temporal modeling capabilities, yet they still cannot match the synergistic generative–policy integration of ODRL–GAN. Models like DBN, CNN, and SVM show significantly weaker ROC profiles, reflecting their limited capacity for capturing the multi-scale nonlinear interactions present in energy systems. The ROC plots visually reinforce that the hybrid DRL–GAN architecture, supported by NMOChOA-driven fine-tuning, provides the most robust and reliable anomaly detection across both datasets.
Table 3 provides a comprehensive ablation study evaluating how different combinations of DRL, GAN, and meta-heuristic optimizers affect the performance of the anomaly-detection framework. By systematically enabling or disabling each module (DRL, GAN, and NMOChOA) and by replacing the proposed optimizer with several competing meta-heuristics, the table quantifies the individual and combined contributions of these components. This evaluation also allows us to assess the effectiveness of the proposed optimizer relative to standard or well-established alternatives. The meta-heuristic optimizers evaluated in Table 3 include the NMOChOA, the multi-objective orchard algorithm (MOOA), the MOChOA, the multi-objective grey wolf optimizer (MOGWO), and the multi-objective particle swarm optimization (MOPSO), providing a diverse set of search dynamics for a fair comparison within the DRL–GAN framework.
The results clearly show that ODRL–GAN equipped with the proposed NMOChOA achieves the highest performance across all metrics and datasets. On PSML, ODRL–GAN (NMOChOA) reaches 99.79% accuracy, 99.89% recall, and 99.95% AUC. Competing optimizers such as MOOA, MOChOA, MOGWO, and MOPSO improve the baseline DRL–GAN performance but still remain 3–6 percentage points below NMOChOA. This performance gap highlights the superiority of the navigator-augmented search strategy, which enhances exploration–exploitation balance and prevents premature convergence, especially in high-dimensional hyper-parameter landscapes. The partial configurations further confirm the complementary roles of DRL and GAN. Models such as NMOChOA–DRL and NMOChOA–GAN outperform their non-optimized counterparts but remain significantly weaker than the full ODRL–GAN (NMOChOA). On average, these variants lag by 7–8% in Accuracy and AUC, demonstrating that DRL alone cannot capture deep generative structure, and GAN alone cannot perform adaptive decision-making—both components are required to achieve state-of-the-art anomaly detection.
The same trend persists on the more challenging LEAD1.0 dataset, reinforcing the robustness of the proposed design. While all optimizers experience a natural performance drop due to the dataset’s heterogeneity and multi-carrier complexity, ODRL–GAN (NMOChOA) still achieves 99.51% Accuracy and 99.83% Recall, outperforming the best competitor by a substantial margin. Other optimizers improve performance relative to untuned DRL–GAN or standalone DRL/GAN models but remain unable to match the stability, discriminative power, and detection sharpness offered by the NMOChOA-enhanced framework. Table 3 confirms that the triple combination of DRL + GAN + NMOChOA delivers the strongest, most stable, and most generalizable performance.
Figure 9 illustrates the training dynamics of all competing architectures by tracking the RMSE as a function of training epochs for both datasets. Each curve represents how rapidly and smoothly a model reduces its prediction error, allowing a direct comparison of convergence rate, stability, and final error level. The ODRL-GAN consistently demonstrates the steepest decline in RMSE and reaches its minimum value significantly earlier than the other models, reflecting the strong synergy between the GAN-based synthetic data generation, the DRL policy optimization, and the NMOChOA-driven parameter tuning. The convergence patterns further highlight several performance insights. ODRL-GAN stabilizes at near-zero RMSE within roughly 80–100 epochs, whereas Transformer and DRL require almost 150–180 epochs to reach comparable stability and still plateau at noticeably higher RMSE. Classical deep models such as DBN, CNN, and GRU converge more slowly and remain less accurate throughout training, while SVM exhibits the highest error and the slowest decay due to its limited capacity for modeling nonlinear temporal-statistical dependencies. These results confirm that the proposed architecture not only achieves lower final error but also learns more efficiently, demonstrating superior convergence speed, robustness, and optimization effectiveness across both datasets.
4. Discussion
The previous section presented the predictive performance of all evaluated architectures across the PSML and LEAD1.0 datasets based on accuracy-oriented metrics. These results demonstrated clear performance differences among the models and highlighted the superiority of the proposed ODRL–GAN framework in terms of detection capability. However, accuracy-based metrics alone do not fully reflect a model’s suitability for deployment in real-world, latency-sensitive energy management environments. To understand whether an architecture can reliably operate under operational constraints, additional dimensions (such as computational efficiency, temporal responsiveness, and statistical stability) must be considered alongside the core predictive metrics.
Accordingly, this discussion extends the evaluation toward a more holistic assessment by examining several crucial dimensions: runtime and computational complexity, which determine scalability for large-scale or high-frequency data streams; inference latency, a critical factor for real-time anomaly response; variance across multiple runs, which reflects the stability and robustness of the training process; and statistical significance testing through the two-sample t-test, ensuring that observed improvements arise from genuine algorithmic advantages rather than random fluctuation. These complementary evaluations help determine not only the predictive strength but also the operational reliability and generalizability of the proposed ODRL–GAN, thereby clarifying its practical viability for real industrial and multi-energy management applications.
Table 4 and Table 5 present a detailed comparison of execution time for all competing architectures when training is terminated at different RMSE thresholds. These tables collectively evaluate computational efficiency, early-training convergence, and the scalability of each model under progressively stricter accuracy constraints. Table 4 corresponds to PSML, while Table 5 reports the same metrics for LEAD1.0. Across both datasets, the ODRL-GAN model consistently exhibits the lowest runtime in every stopping condition, demonstrating outstanding training efficiency. For PSML, ODRL-GAN reaches RMSE < 12 in only 36 s, RMSE < 9 in 68 s, and RMSE < 6 in 126 s, outperforming all baselines by a large margin. LEAD1.0 shows a similar behavior, with ODRL-GAN achieving RMSE < 12 in 45 s and RMSE < 9 in 82 s. This efficiency stems from the synergy between the DRL policy, GAN-based synthetic enhancement, and the NMOChOA optimizer, which accelerates gradient stabilization and reduces redundant exploration during training. The presence of the GAN component also helps the discriminator converge faster by providing structured synthetic samples early in training.
Other architectures show noticeably slower convergence. The Transformer maintains reasonable performance but still requires significantly more runtime—e.g., 128–749 s on PSML depending on the threshold, due to its heavy attention operations and deeper representation layers. DRL alone shows moderate efficiency but lacks the stabilizing contribution of GAN-generated samples, causing training oscillations that extend runtime (e.g., 389–826 s on PSML for RMSE < 9 and < 6). DBN, GAN, GRU, and CNN fall even further behind, often unable to reach stricter RMSE thresholds, especially RMSE < 6 or RMSE < 3. Their slower or incomplete convergence reflects architectural limitations such as shallow temporal modeling (CNN), vanishing-gradient issues (DBN, GRU), or unstable adversarial training (GAN). SVM, lacking iterative gradient-based convergence, is the slowest overall and fails to reach most RMSE targets.
Table 6 reports the average inference latency of each model when deployed on the PSML and LEAD1.0 datasets, offering insight into their real-time operational efficiency. The results show that SVM achieves the lowest latency (5.6 ms on PSML and 6.1 ms on LEAD1.0), consistent with its lightweight structure and absence of deep representation learning. In contrast, GRU presents the highest latency (8.1 and 8.2 ms), attributed to its recurrent nature and sequential gating operations. The ODRL-GAN model maintains a competitive latency profile (7.2 and 7.6 ms), remaining only slightly higher than shallow architectures yet significantly outperforming other deep models such as Transformer (7.3 and 7.9 ms) and GAN (7.1 and 7.4 ms). This balance demonstrates that although ODRL-GAN integrates both DRL decision-making and GAN-based generative modeling, its optimization via NMOChOA keeps inference overhead controlled. Meanwhile, DBN and CNN remain within moderate latency ranges, reflecting their fixed-layer feed forward computations. These results indicate that ODRL-GAN sustains high predictive accuracy while preserving practical inference latency suitable for real-time anomaly detection in smart grid applications. Its latency remains low enough for time-sensitive monitoring scenarios, ensuring that enhanced performance does not come at the cost of deployment feasibility.
Table 7 reports the variance of each architecture over 35 independent executions, offering a direct indicator of model stability and robustness against initialization noise and stochastic training dynamics. The values show that ODRL-GAN consistently achieves the lowest variance on both PSML (0.00009) and LEAD1.0 (0.00013), demonstrating extremely stable behavior with almost negligible fluctuations between runs. In contrast, conventional learning-based models such as Transformer, DRL, DBN, GAN, GRU, and CNN show noticeably higher variance, reflecting greater sensitivity to training randomness. The SVM model exhibits the highest variance on both datasets, indicating poor robustness under repeated sampling and retraining. Overall, the analysis confirms that proposed ODRL-GAN not only attains superior accuracy but also delivers exceptional stability, making it a reliable choice for real-world applications where consistency across deployments is essential.
Table 8 presents the results of pairwise statistical t-tests conducted between the proposed ODRL-GAN framework and each competing model on both datasets (PSML and LEAD1.0). The table reports p-values and their corresponding significance decisions, using a strict significance threshold of 0.01. This analysis evaluates whether the performance improvements delivered by ODRL-GAN are statistically meaningful rather than occurring by chance. The reported p-values across all comparisons are consistently far below 0.01 for both datasets, demonstrating that the performance differences between proposed ODRL-GAN and every baseline model (including transformer, DRL, DBN, GAN, GRU, CNN, and SVM) are statistically significant. This confirms that the observed accuracy, recall, AUC, RMSE, and stability gains are not random fluctuations but reflect genuine superiority in the model’s learning dynamics and optimization behavior. The consistently significant outcomes also highlight the strong contribution of the integrated DRL–GAN synergy and the proposed NMOChOA hyper-parameter optimizer, which together yield more robust generalization and reliably improved detection performance across multiple experimental runs.
The extended analysis (covering run-time behavior, inference latency, variance, and t-tests) confirms that the proposed ODRL-GAN is not only accurate but also computationally practical and highly reliable for real-world deployment. The model consistently reaches low RMSE levels far faster than competing architectures, maintains one of the lowest inference delays across both datasets, and exhibits variance values that are orders of magnitude smaller than all baselines, highlighting exceptional stability and repeatability. Moreover, the t-test results demonstrate that the improvements are statistically meaningful rather than incidental. When combined with the superior accuracy, recall, and AUC observed earlier, these characteristics indicate that ODRL-GAN offers the rare balance of precision, robustness, and efficiency required for real-time, safety-critical, and large-scale energy system applications, where both reliability and operational responsiveness are essential.
5. Conclusions
Modern smart power systems increasingly rely on high-volume, non-linear, and rapidly fluctuating data streams, making accurate and stable anomaly detection essential for operational safety and reliability. To address these challenges, this paper introduced a novel ODRL-GAN framework, which integrates deep reinforcement learning, GAN-based synthetic data enhancement, and a navigator-based NMOChOA for hyper-parameter tuning. The proposed model was extensively evaluated on two real-world benchmark datasets (PSML and LEAD1.0) and supported by a comprehensive data-preparation pipeline and a multi-stage training strategy.
Across both PSML and LEAD1.0 datasets, the proposed ODRL-GAN consistently achieved the strongest numerical performance among all compared methods, reaching up to 99.79% accuracy, 99.89% recall, and 99.95% AUC on PSML and 99.51% , 99.83% , 99.91% respectively on LEAD1.0. The ROC curves further showed a dominant sensitivity–specificity trade-off, with ODRL-GAN hugging the top-left region far more tightly than Transformer, DRL, DBN, GAN, GRU, CNN, and SVM. Training curves confirmed this advantage, with RMSE dropping to near zero within ~60 epochs, whereas competing models required ~200–300 epochs and still converged to notably higher errors. Runtime analysis demonstrated that ODRL-GAN reached low-error thresholds faster, needing only 36–68 s for RMSE < 12 or RMSE < 9 on PSML, compared to 128–351 s for Transformer and 193–593 s for GRU. Despite its deep architecture, inference latency remained highly competitive (≈7.2 and 7.6 ms), close to lightweight models like SVM (≈5.6 and 6.1 ms) while offering dramatically higher accuracy. Variance values were also exceptionally low (0.00009–0.00013), demonstrating unmatched stability across 35 repeated runs. Collectively, these numerical results validate ODRL-GAN as the most accurate, stable, and computationally efficient solution across all evaluation criteria.
From a practical perspective, the final outcomes confirm that the proposed model achieves a rare balance between predictive strength and operational reliability (offering high detection precision, fast convergence, low inference overhead, and strong run-to-run consistency). Such characteristics are essential for real-time monitoring in modern energy infrastructures where decisions often need to be made within milliseconds and under conditions of uncertainty. The demonstrated robustness across both datasets indicates that the framework can generalize across different energy modalities, making it suitable for deployment in multi-carrier systems, renewable-integrated grids, and large-scale monitoring platforms. Ultimately, the study validates ODRL-GAN as a dependable and high-performing solution for safeguarding critical energy infrastructures against anomalous behaviors.
Looking ahead, several promising directions can extend the capabilities of the proposed framework. Incorporating more advanced generative models (such as diffusion-based architectures) or integrating model-based RL components could further enhance reconstruction fidelity and decision stability under extreme operating conditions. Additionally, exploring lightweight or compressed variants of ODRL-GAN may enable efficient deployment at the edge in resource-constrained environments. Expanding the analysis to multi-node, fully distributed energy networks and incorporating spatiotemporal graph structures would allow the model to capture inter-device dependencies more effectively. Likewise, evaluating the framework under adversarial scenarios or real-time streaming conditions would provide deeper insight into its resilience in operational smart-grid environments.
Author Contributions
Conceptualization, A.E.O., M.K.D., P.S.M., N.S., F.H.G., D.M., J.V.A.B.; methodology, A.E.O., M.K.D., P.S.M. and F.H.G.; software, A.E.O., N.S. and F.H.G.; validation, A.E.O., M.K.D., F.H.G. and D.M.; formal analysis, M.K.D., P.S.M., N.S. and F.H.G.; investigation, A.E.O., M.K.D., P.S.M., N.S., F.H.G., D.M. and J.V.A.B.; resources, D.M. and J.V.A.B.; data curation, A.E.O., P.S.M., N.S. and F.H.G.; writing—original draft preparation, A.E.O., M.K.D., P.S.M., N.S., F.H.G., D.M. and J.V.A.B.; Writing - Review & Editing, F.H.G., D.M. and J.V.A.B.; visualization, A.E.O., M.K.D., N.S. and F.H.G.; supervision, D.M. and J.V.A.B.; project administration, D.M.; funding acquisition, D.M. All authors have read and agreed to the published version of the manuscript.
Funding
This research received no external funding.
Data Availability Statement
The raw data supporting the conclusions of this article will be made available by the authors on request.
Conflicts of Interest
The authors declare no conflicts of interest.
References
- Allen, R.C.; Iseri, F.; Demirhan, C.D.; Pappas, I.; Pistikopoulos, E.N. Improvements for decomposition-based methods utilized in the development of multi-scale energy systems. Comput. Chem. Eng. 2023, 170, 108135. [Google Scholar] [CrossRef]
- Kaveh, M.; Ghadi, F.R.; Li, Z.; Yan, Z.; Jäntti, R. Secure backscatter communications through RIS: Modeling and performance. IEEE Trans. Veh. Technol. 2025, (in press). [Google Scholar] [CrossRef]
- Chen, Z.; Li, X.; Liu, H.; Zhang, Y.; Wang, T.; Yang, J. Load prediction of integrated energy systems for energy saving and carbon emission based on a novel multi-scale fusion convolutional neural network. Energy 2024, 290, 130181. [Google Scholar] [CrossRef]
- Khalid, M. Smart grids and renewable energy systems: Perspectives and grid integration challenges. Energy Strateg. Rev. 2024, 51, 101299. [Google Scholar] [CrossRef]
- Kaveh, M.; Ghadi, F.R.; Zhang, Y.; Yan, Z.; Jäntti, R. Voltage profile-driven physical layer authentication for RIS-aided backscattering tag-to-tag networks. IEEE Internet Things J. 2025, 12, 51099–51113. [Google Scholar] [CrossRef]
- Diaba, S.Y.; Shafie-Khah, M.; Elmusrati, M. Cyber-physical attack and the future energy systems: A review. Energy Rep. 2024, 12, 2914–2932. [Google Scholar] [CrossRef]
- Hseiki, H.A.; El-Hajj, A.M.; Ajra, Y.O.; Hija, F.A.; Haidar, A.M. A secure and resilient smart energy meter. IEEE Access 2024, 12, 3114–3125. [Google Scholar] [CrossRef]
- Kaveh, M.; Yan, Z.; Jäntti, R. Secrecy performance analysis of RIS-aided smart grid communications. IEEE Trans. Ind. Inform. 2024, 20, 5415–5427. [Google Scholar] [CrossRef]
- Aghazadeh Ardebili, A.; Ghaemi, N.; Fahimi, M.; Mirzaei, F.; Bressan, S.; Calì, A. Enhancing resilience in complex energy systems through real-time anomaly detection: A systematic literature review. Energy Inform. 2024, 7, 96. [Google Scholar] [CrossRef]
- Yao, Y.; Han, T.; Yu, J.; Xie, M. Uncertainty-aware deep learning for reliable health monitoring in safety-critical energy systems. Energy 2024, 291, 130419. [Google Scholar] [CrossRef]
- Sun, M.; He, L.; Zhang, J. Deep learning-based probabilistic anomaly detection for solar forecasting under cyberattacks. Int. J. Electr. Power Energy Syst. 2022, 137, 107752. [Google Scholar] [CrossRef]
- Reshadi, M.; Li, W.; Xu, W.; Omashor, P.; Dinh, A.; Xiao, J.; Dick, S.; She, Y.; Lipsett, M. Deep–shallow metaclassifier with synthetic minority oversampling for anomaly detection in a time series. Algorithms 2024, 17, 114. [Google Scholar] [CrossRef]
- Kaveh, M.; Mosavi, M.R. A lightweight mutual authentication for smart grid neighborhood area network communications based on physically unclonable function. IEEE Syst. J. 2020, 14, 4535–4544. [Google Scholar] [CrossRef]
- Gaggero, G.B.; Girdinio, P.; Marchese, M. Artificial intelligence and physics-based anomaly detection in the smart grid: A survey. IEEE Access 2025, 13, 23597–23606. [Google Scholar] [CrossRef]
- Kaveh, M.; Mosavi, M.R.; Martin, D.; Aghapour, S. An efficient authentication protocol for smart grid communication based on on-chip-error-correcting physical unclonable function. Sustain. Energy Grids Netw. 2023, 36, 101228. [Google Scholar] [CrossRef]
- Zamanzadeh Darban, Z.; Webb, G.I.; Pan, S.; Aggarwal, C.; Salehi, M. Deep learning for time series anomaly detection: A survey. ACM Comput. Surv. 2024, 57, 1–42. [Google Scholar] [CrossRef]
- Najafi, F.; Kaveh, M.; Mosavi, M.R.; Brighente, A.; Conti, M. EPUF: An entropy-derived latency-based DRAM physical unclonable function for lightweight authentication in Internet of Things. IEEE Trans. Mob. Comput. 2024, 24, 2422–2436. [Google Scholar] [CrossRef]
- Rafique, S.H.; Abdallah, A.; Musa, N.S.; Murugan, T. Machine learning and deep learning techniques for internet of things network anomaly detection—current research trends. Sensors 2024, 24, 1968. [Google Scholar] [CrossRef]
- Merlino, V.; Allegra, D. Energy-based approach for attack detection in IoT devices: A survey. Internet Things 2024, 27, 101306. [Google Scholar] [CrossRef]
- Fährmann, D.; Martín, L.; Sánchez, L.; Damer, N. Anomaly detection in smart environments: A comprehensive survey. IEEE Access 2024, 12, 64006–64049. [Google Scholar] [CrossRef]
- Ghadi, F.R.; Kaveh, M.; Martin, D.; Hernando-Gallego, F.; Wong, K. UAV-relay assisted RSMA fluid antenna system: Outage probability analysis. IEEE Wirel. Commun. Lett. 2025, 14, 2907–2911. [Google Scholar] [CrossRef]
- Zheng, X.; Xu, N.; Trinh, L.; Wu, D.; Huang, T.; Sivaranjani, S.; Liu, Y.; Xie, L. A multi-scale time-series dataset with benchmark for machine learning in decarbonized energy grids. Sci. Data 2022, 9, 359. [Google Scholar] [CrossRef]
- Debelle, T.; Sohrab, F.; Abrahamsson, P.; Gabbouj, M. Anomaly detection in smart power grids with graph-regularized MS-SVDD: A multimodal subspace learning approach. arXiv 2025, arXiv:2502.15793. [Google Scholar]
- Mathonsi, T.; van Zyl, T.L. Statistics and deep learning-based hybrid model for interpretable anomaly detection. arXiv 2022, arXiv:2202.12720. [Google Scholar] [CrossRef]
- Du, J.; Chen, N.; Gao, D.; Huang, Z. Spatial–temporal fault detection in power distribution networks via multivariate time series analysis. In Proceedings of the International Conference on Intelligent Computing, Singapore, 23–26 July 2025; Springer Nature Singapore: Singapore, 2025; pp. 197–213. [Google Scholar]
- Biju, G.M.; Pillai, G.N. Hyperparameter optimization of long short-term memory models for interpretable electrical fault classification. IEEE Access 2023, 11, 123688–123704. [Google Scholar]
- Fu, C.; Arjunan, P.; Miller, C. Trimming outliers using trees: Winning solution of the large-scale energy anomaly detection (LEAD) competition. In Proceedings of the 9th ACM International Conference on Systems for Energy-Efficient Buildings, Cities, and Transportation, Boston, MA, USA, 9–10 November 2022; ACM: New York, NY, USA, 2022; pp. 456–461. [Google Scholar]
- Ghanim, J.; Awad, M. An unsupervised anomaly detection in electricity consumption using reinforcement learning and time series forest-based framework. J. Artif. Intell. Soft Comput. Res. 2025, 15(1), 5–24. [Google Scholar] [CrossRef]
- Mu, T.; Yu, Y.; Feng, G.; Luo, H.; Yang, H. Detecting anomalous electricity consumption with transformer and synthesized anomalies. PeerJ Comput. Sci. 2023, 9, e1721. [Google Scholar] [CrossRef]
- Maryasin, O.Y.; Tihomirov, L. Using generative neural networks to detect point anomalies in energy consumption data. In Proceedings of the 2024 6th International Conference on Control Systems, Mathematical Modeling, Automation and Energy Efficiency (SUMMA), Lipetsk, Russia, 13–15 November 2024; IEEE: New York, NY, USA, 2024; pp. 636–641. [Google Scholar]
- Hela, B.; Handigol, P.P.; Arjunan, P. Are time series foundation models good for energy anomaly detection? In Proceedings of the 16th ACM International Conference on Future and Sustainable Energy Systems, Singapore, 10–13 June 2025; ACM: New York, NY, USA, 2025; pp. 656–665. [Google Scholar]
- Ting, L.P.Y.; Chao, R.; Chang, C.S.; Chuang, K.T. An explore–exploit workload-bounded strategy for rare event detection in massive energy sensor time series. ACM Trans. Intell. Syst. Technol. 2024, 15, 1–25. [Google Scholar] [CrossRef]
- Maryasin, O.Y.E.; Tihomirov, L.I. Detecting point anomalies in energy consumption data using unsupervised machine learning methods. Large-Scale Syst. Control 2025, 113, 232–272. [Google Scholar]
- Shcherbakova, A.; Philipp, P.; Altherr, L.C. Predicting building energy consumption from electricity meters using Prophet: A computational study with nested cross-validation on benchmark time series data. In Proceedings of the 2024 8th International Symposium on Innovative Approaches in Smart Technologies (ISAS), Barcelona, Spain, 5–6 December 2024; IEEE: New York, NY, USA, 2024; pp. 1–6. [Google Scholar]
- Gulati, M.; Arjunan, P. LEAD1.0: A large-scale annotated dataset for energy anomaly detection in commercial buildings. In Proceedings of the 13th ACM International Conference on Future Energy Systems, Virtual Event, 28 June–1 July 2022; ACM: New York, NY, USA, 2022; pp. 485–488. [Google Scholar]
- Shakya, A.K.; Pillai, G.; Chakrabarty, S. Reinforcement learning algorithms: A brief survey. Expert Syst. Appl. 2023, 231, 120495. [Google Scholar] [CrossRef]
- Hu, K.; Li, M.; Song, Z; Xu, K.; Xia, Q.; Sun, N.; Xia, M. A review of research on reinforcement learning algorithms for multi-agents. Neurocomputing 2024, 599, 128068. [Google Scholar] [CrossRef]
- Creswell, A.; White, T.; Dumoulin, V.; Arulkumaran, K.; Sengupta, B.; Bharath, A.A. Generative adversarial networks: An overview. IEEE Signal Process. Mag. 2018, 35, 53–65. [Google Scholar] [CrossRef]
- Liu, X.; Huang, H.; Bian, J.; Zhou, R.; Wei, Z.; Zhou, H. Generating intersection pre-crash trajectories for autonomous driving safety testing using Transformer time-series generative adversarial networks. Eng. Appl. Artif. Intell. 2025, 160, 111995. [Google Scholar] [CrossRef]
- Khishe, M.; Mosavi, M.R. Chimp optimization algorithm. Expert Syst. Appl. 2020, 149, 113338. [Google Scholar] [CrossRef]
- Nasayreh, A.; Alawad, N.A.; Jaradat, A. Enhanced chimp optimization algorithm using crossover and mutation techniques with machine learning for IoT intrusion detection system. Clust. Comput. 2025, 28, 455. [Google Scholar] [CrossRef]
Figure 1.
Overall workflow of the proposed methodology in multi-scale energy systems.
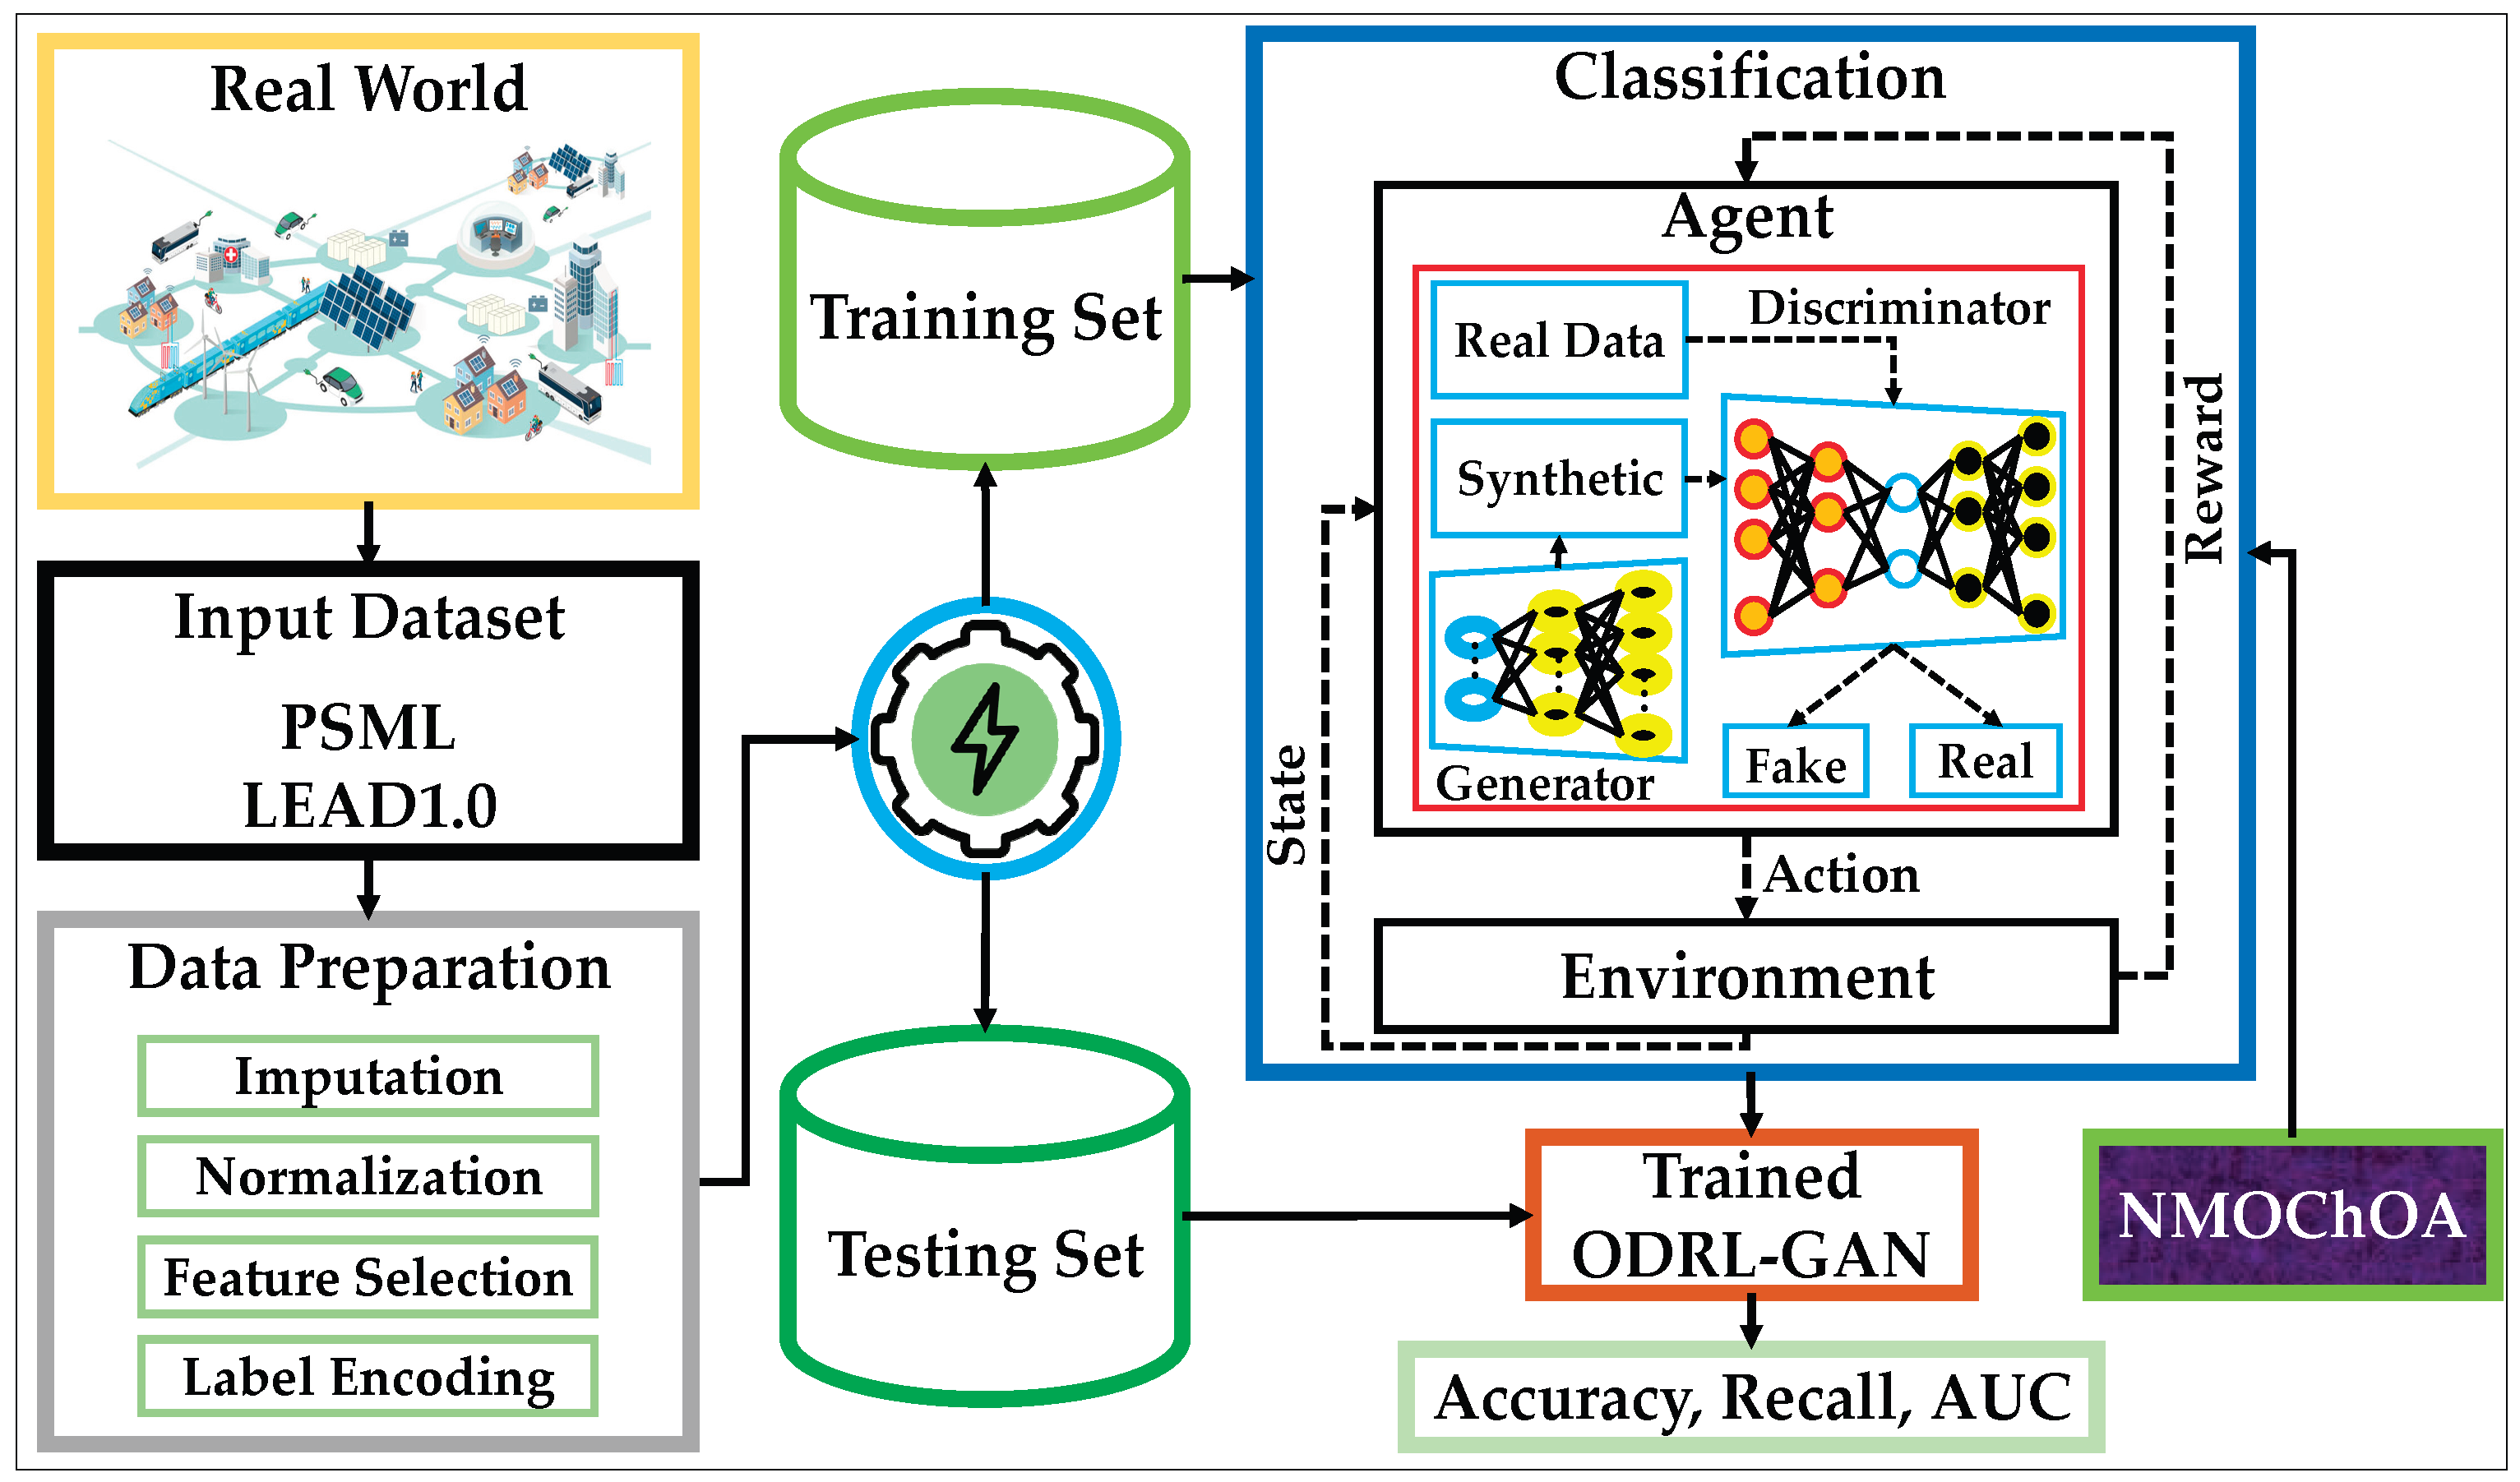
Figure 2.
The interaction loop between the RL agent and its environment.
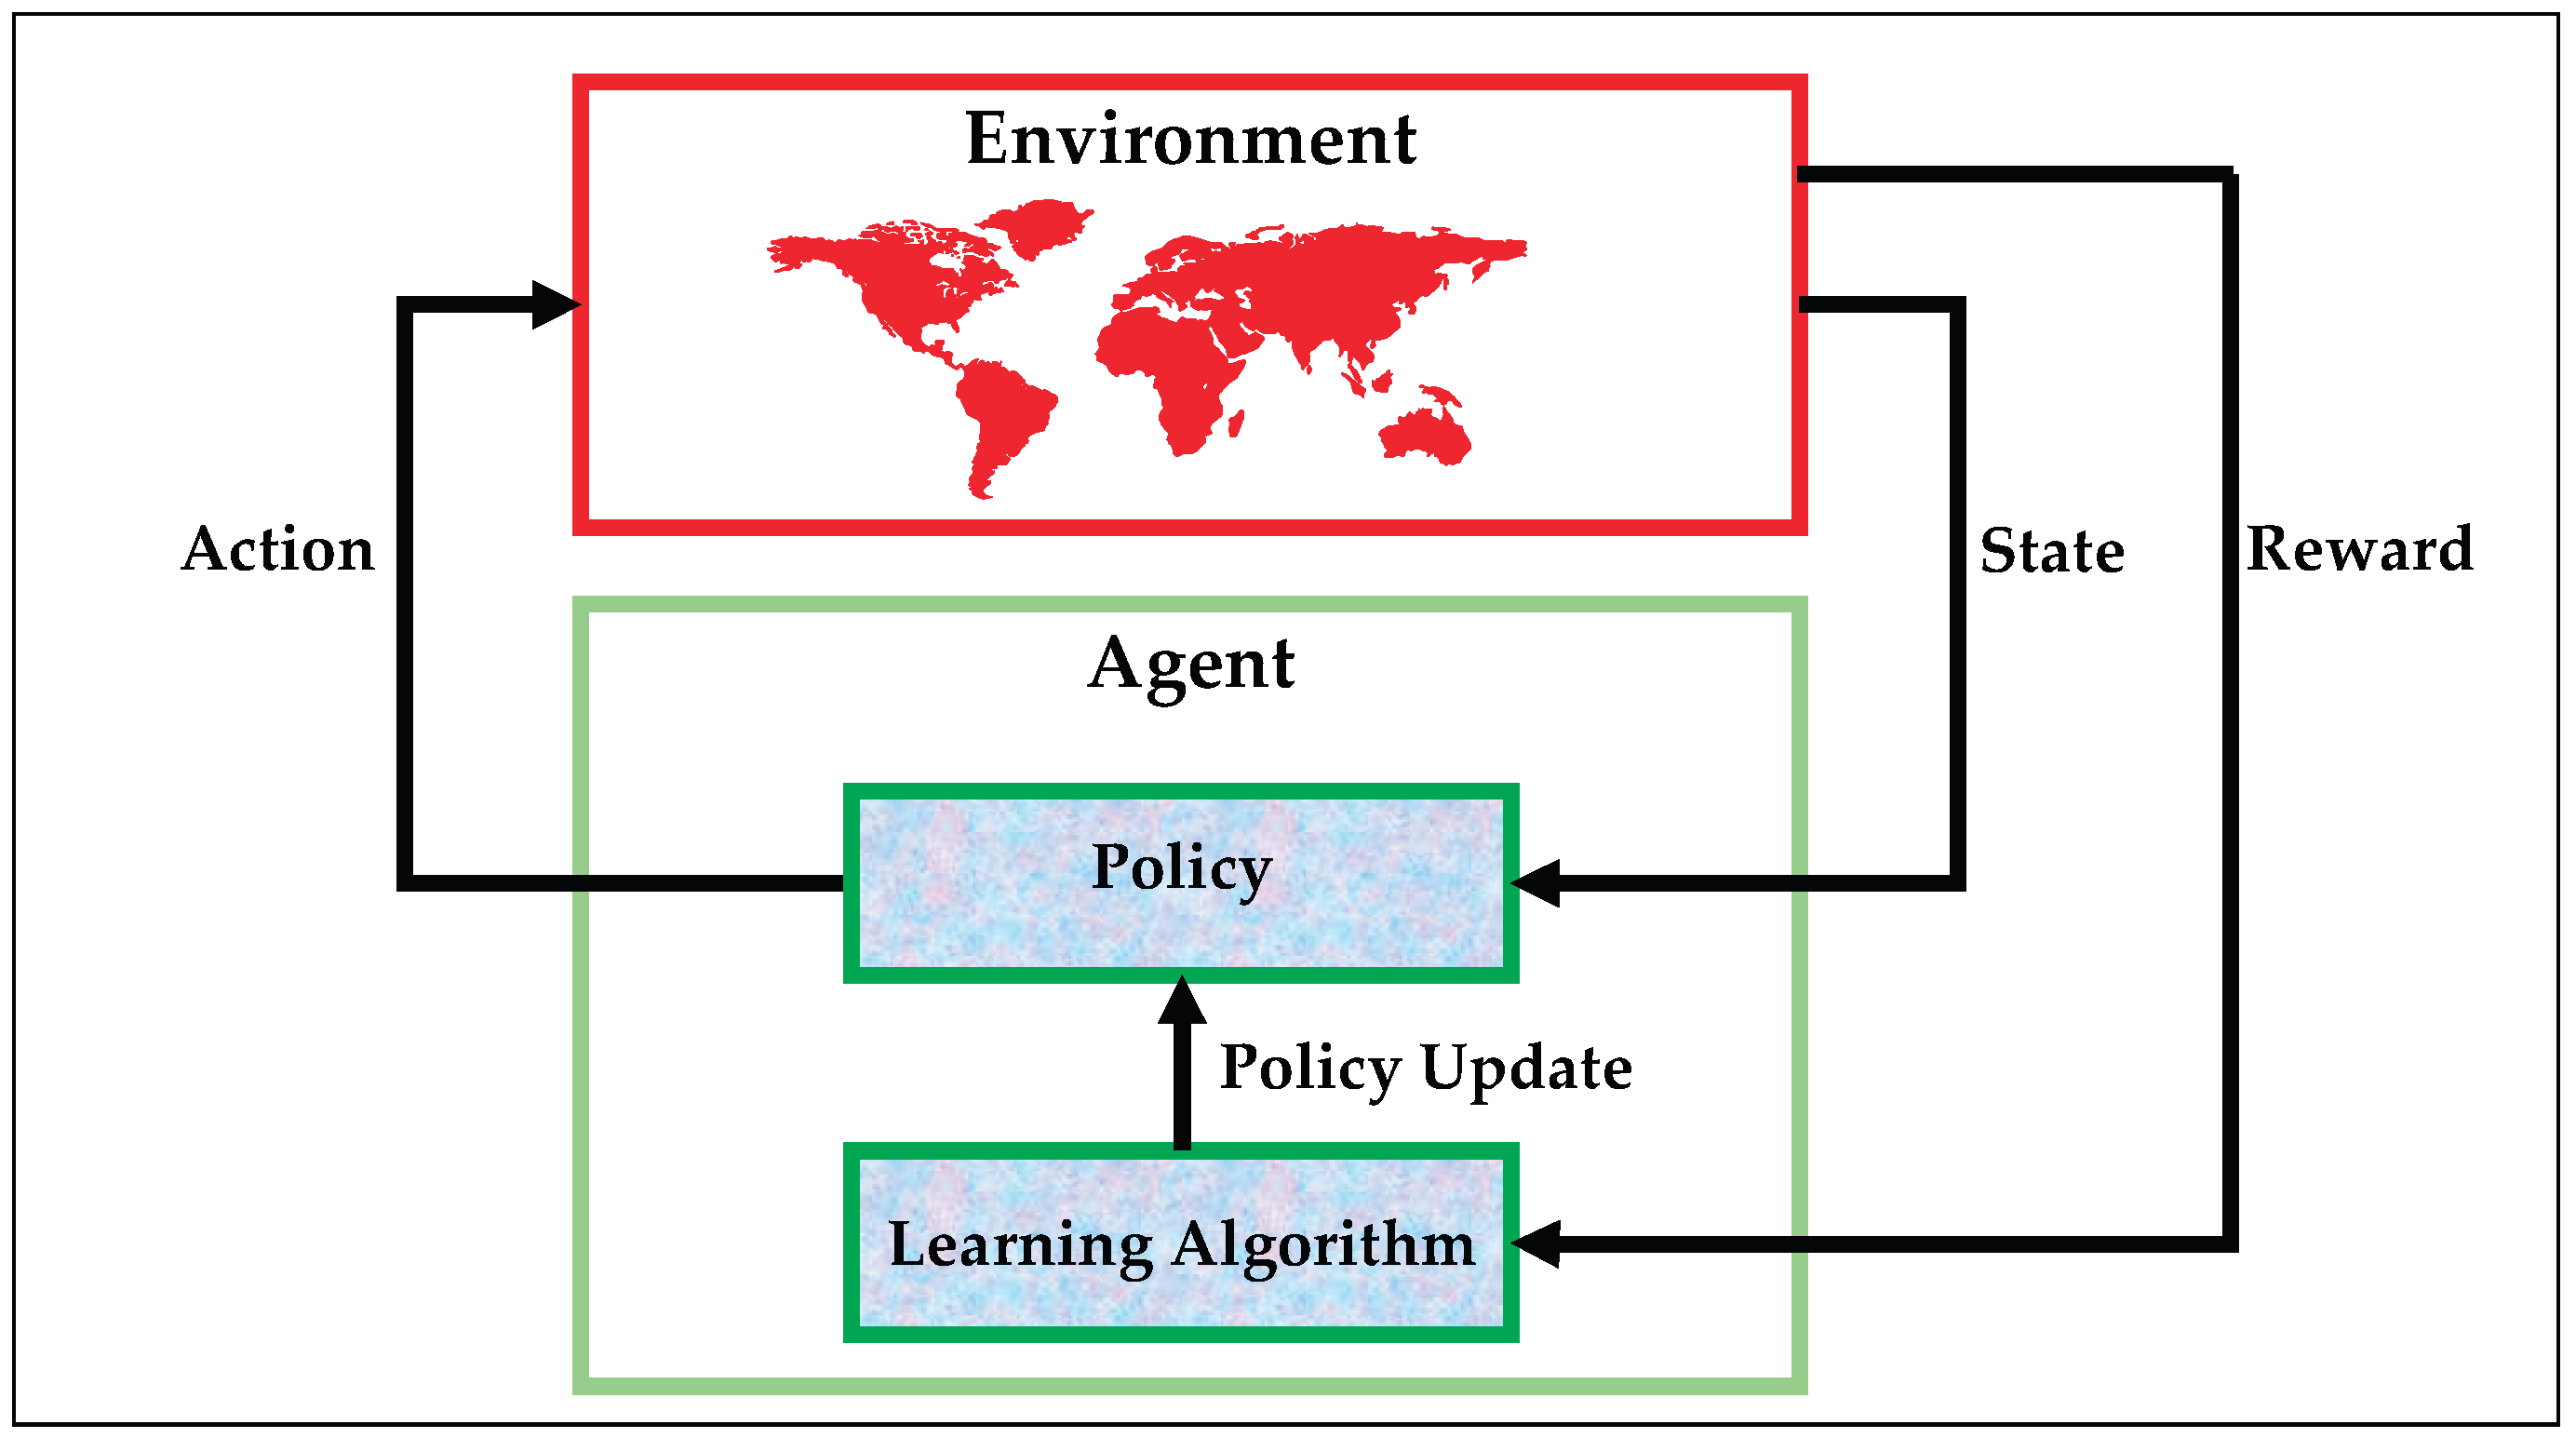
Figure 3.
The architecture of standard GAN.
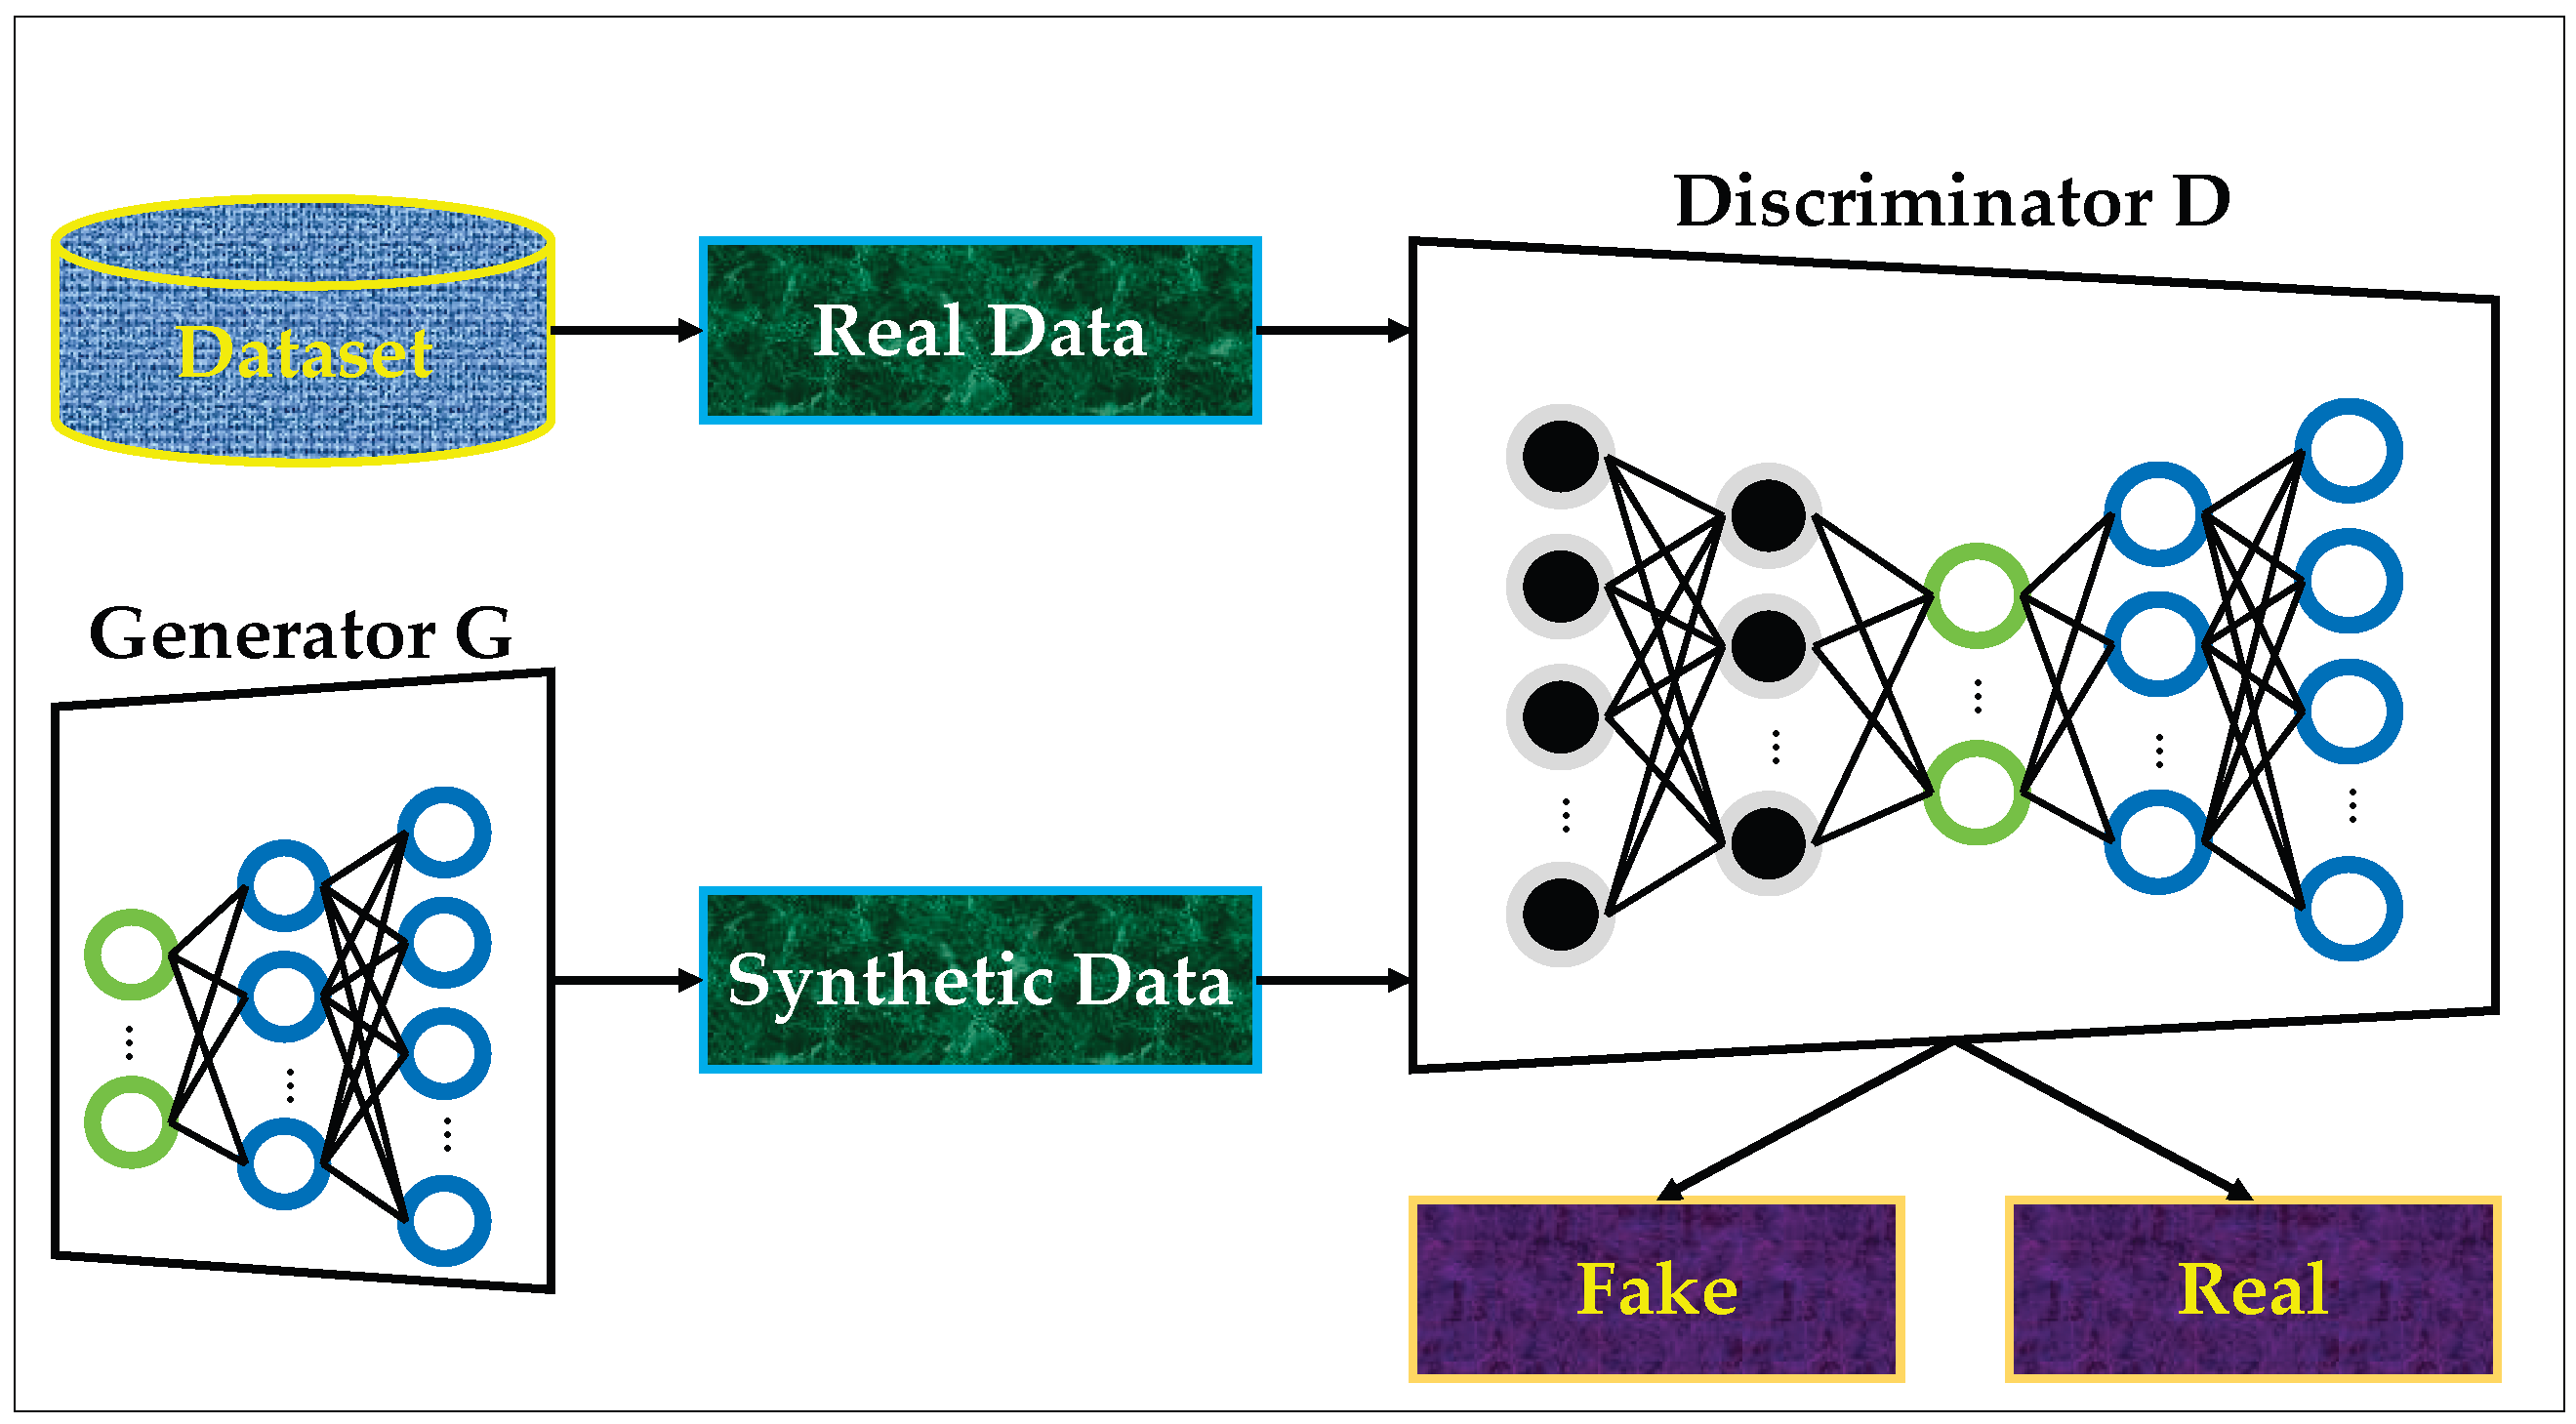
Figure 4.
Position update in the ChOA algorithm.
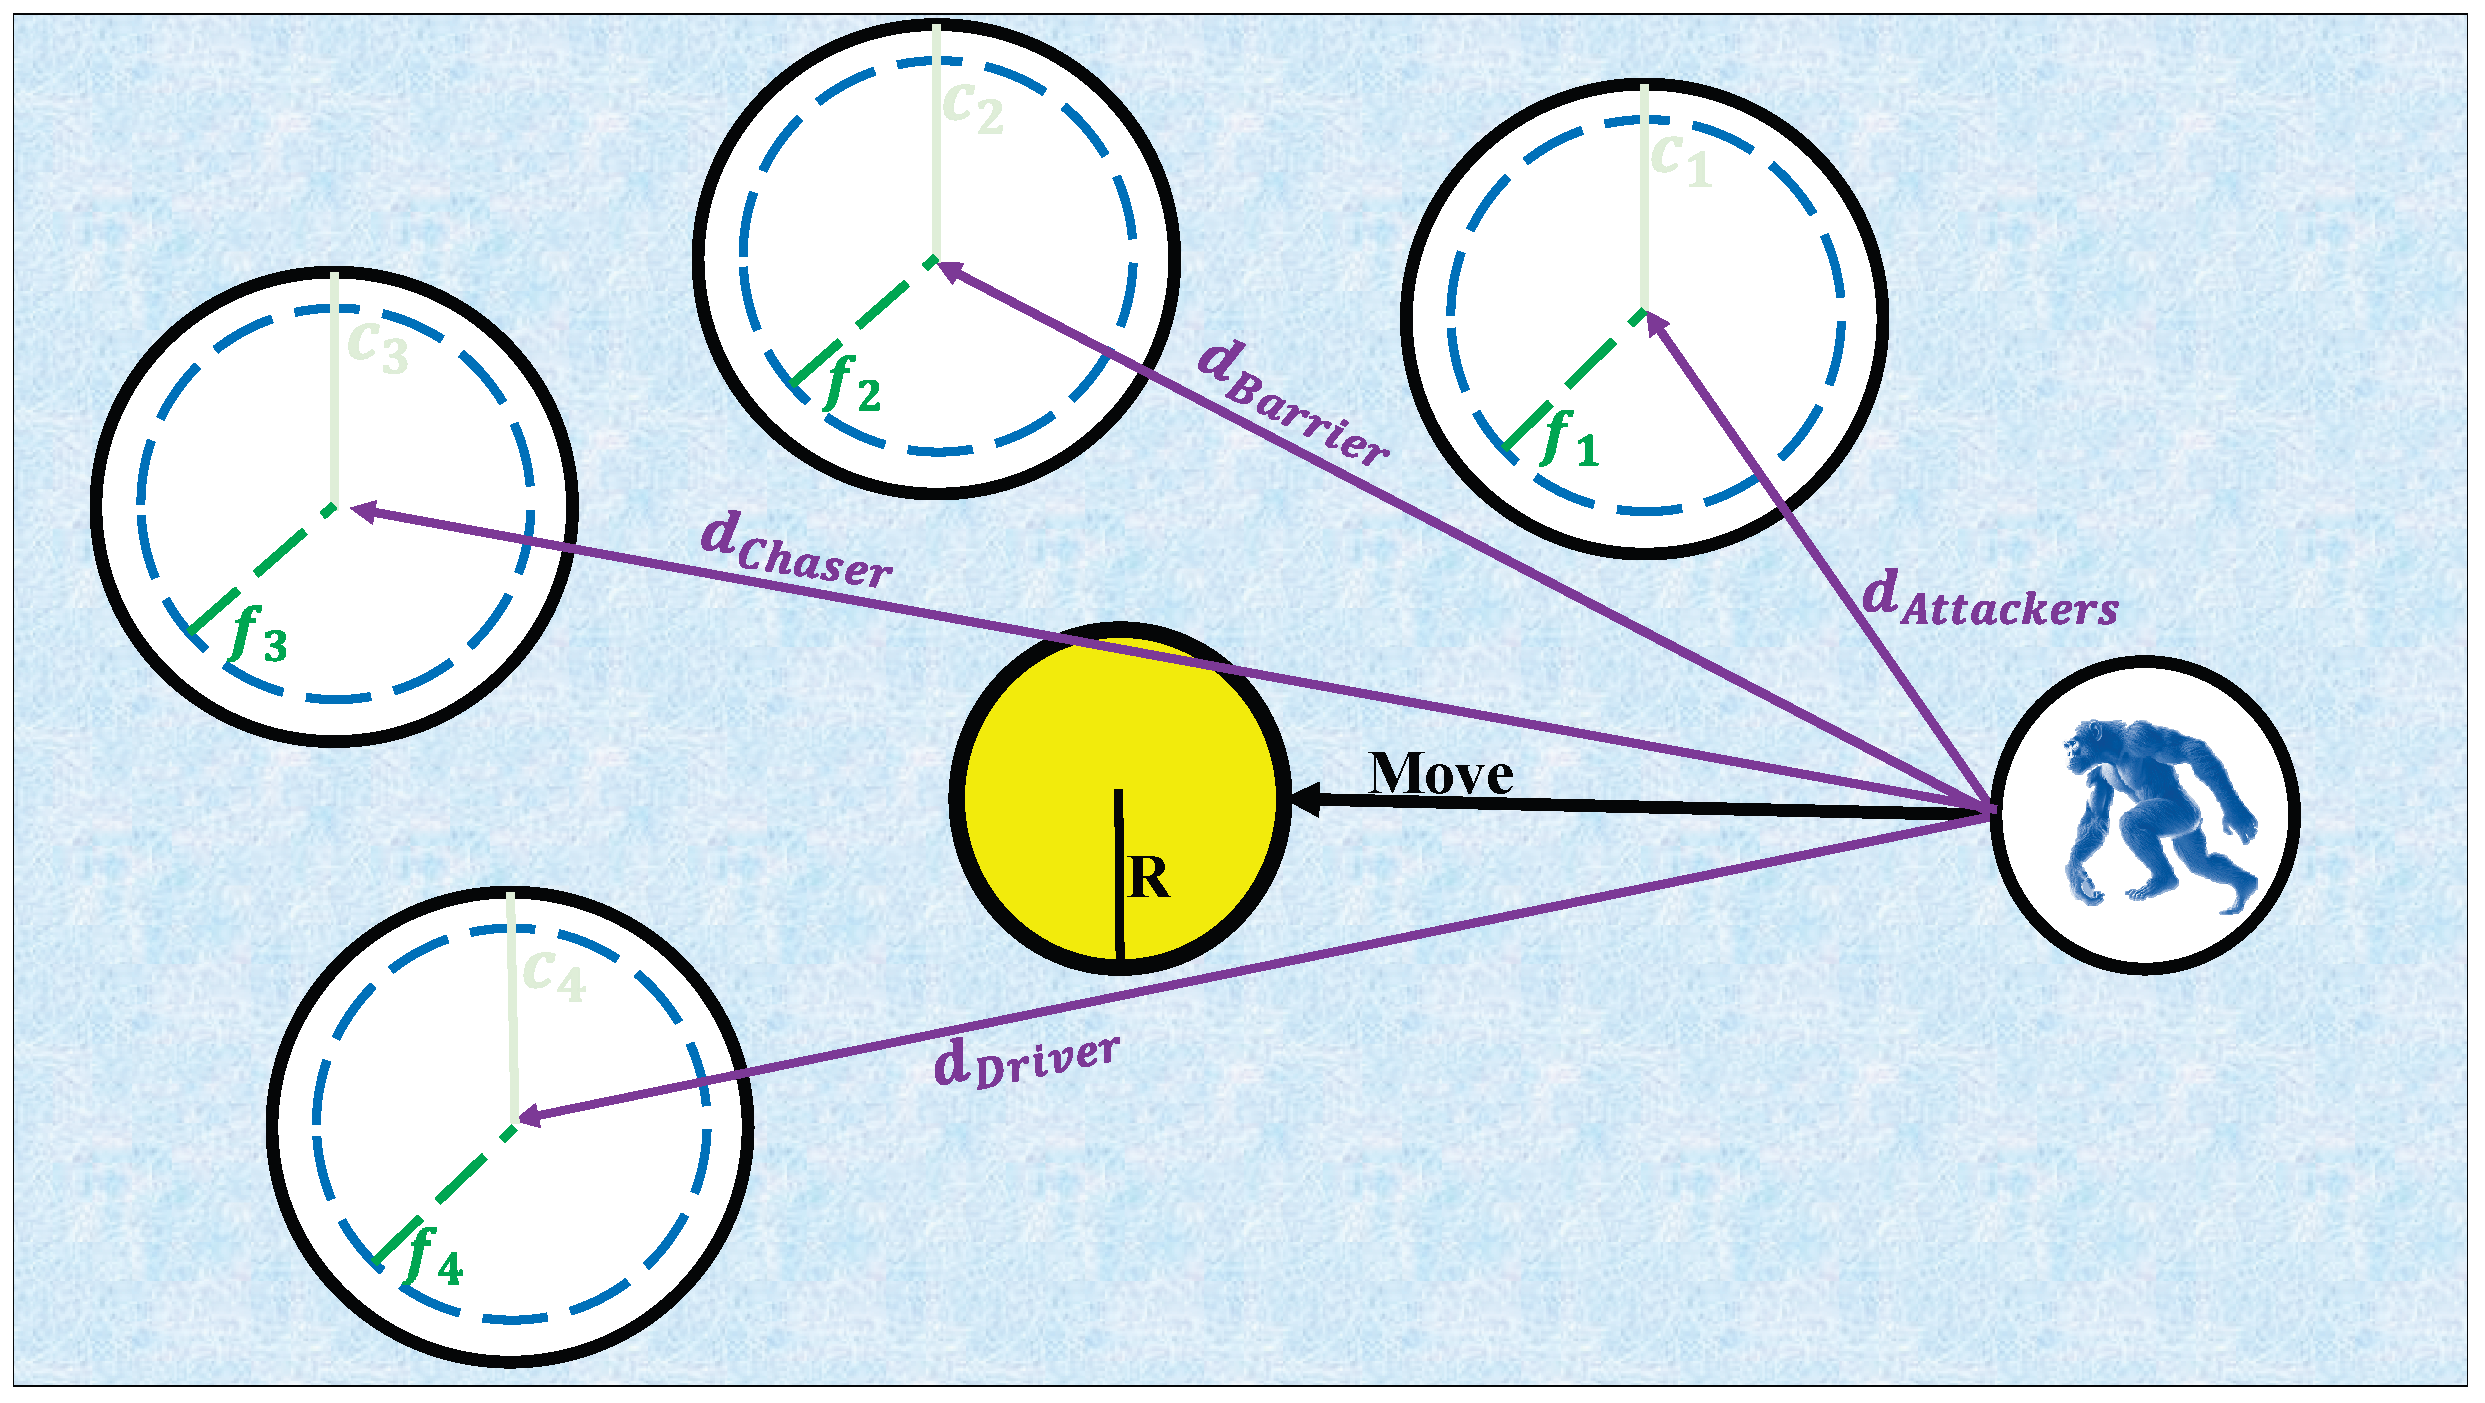
Figure 5.
Position updating of chimps and the effect of on convergence and divergence.
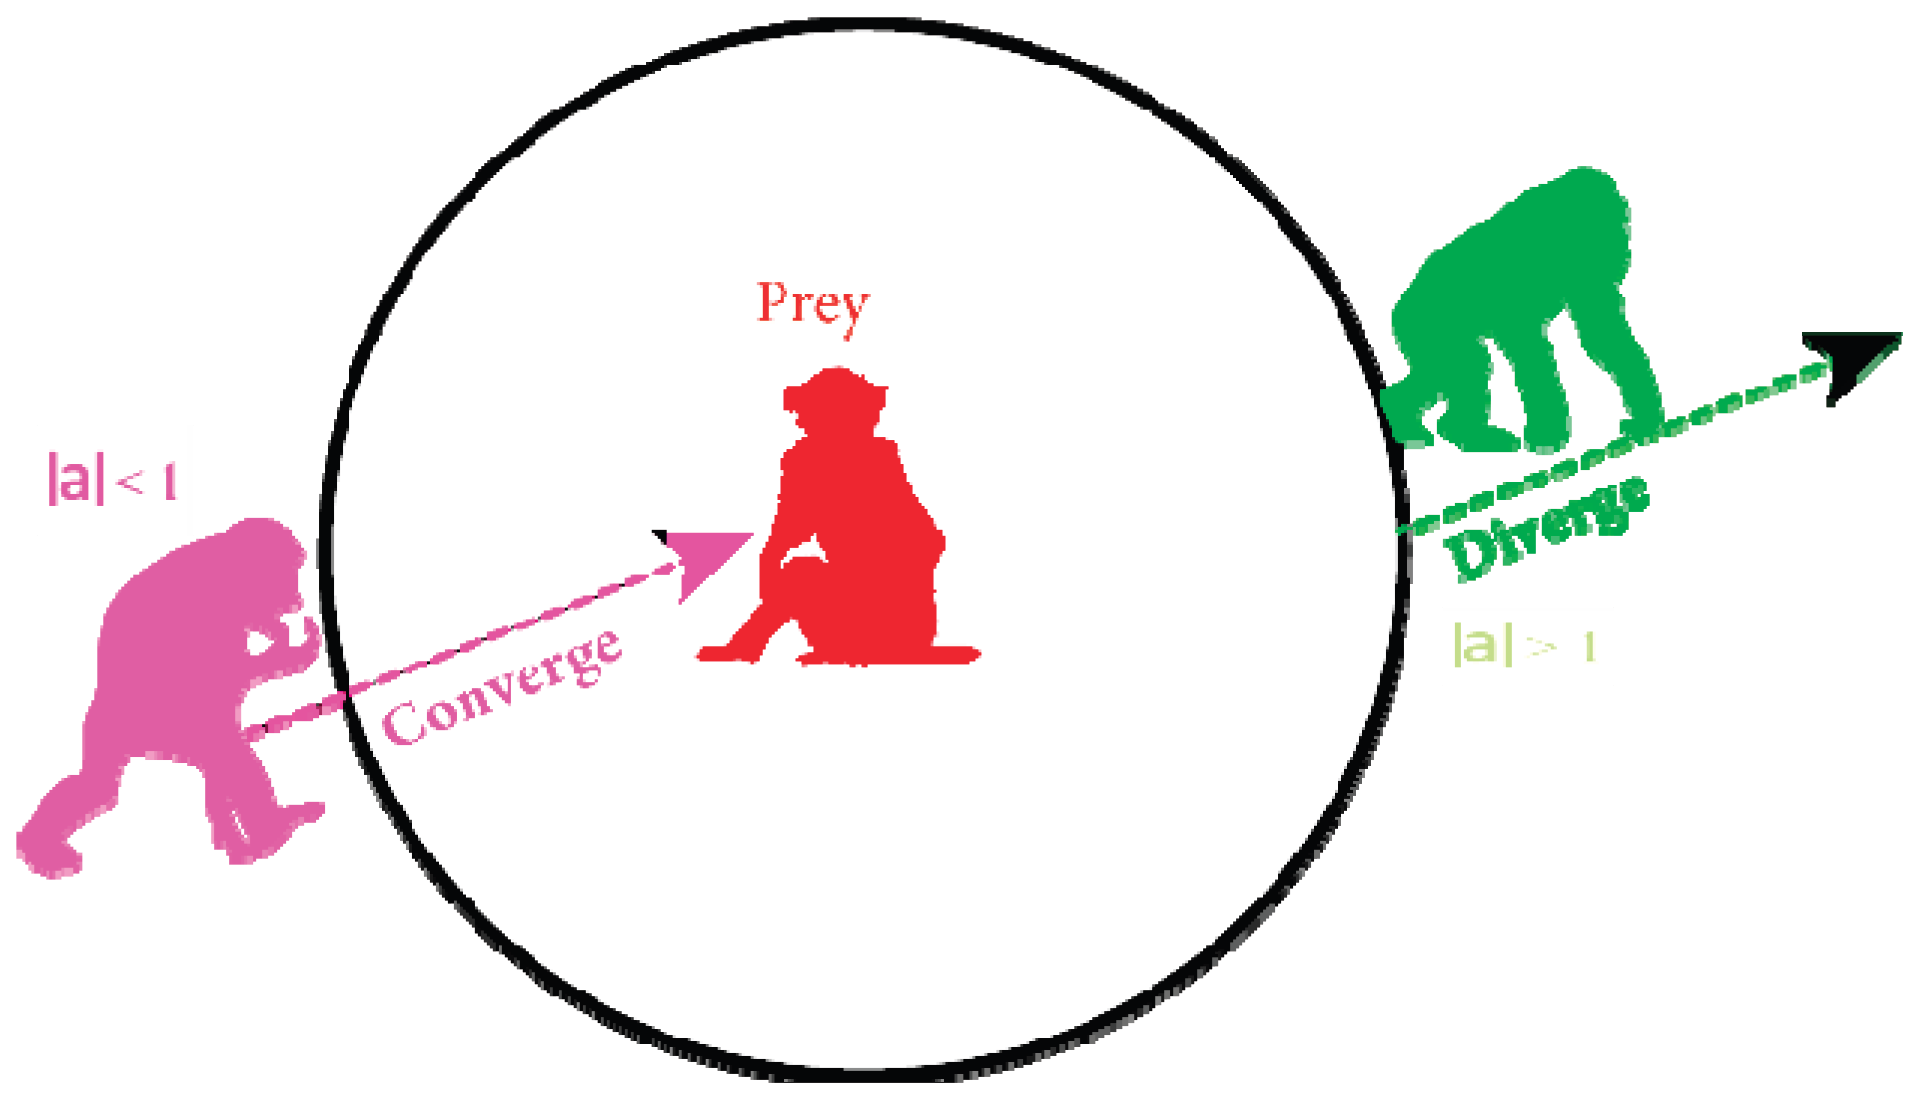
Figure 6.
The proposed ODRL-GAN model.
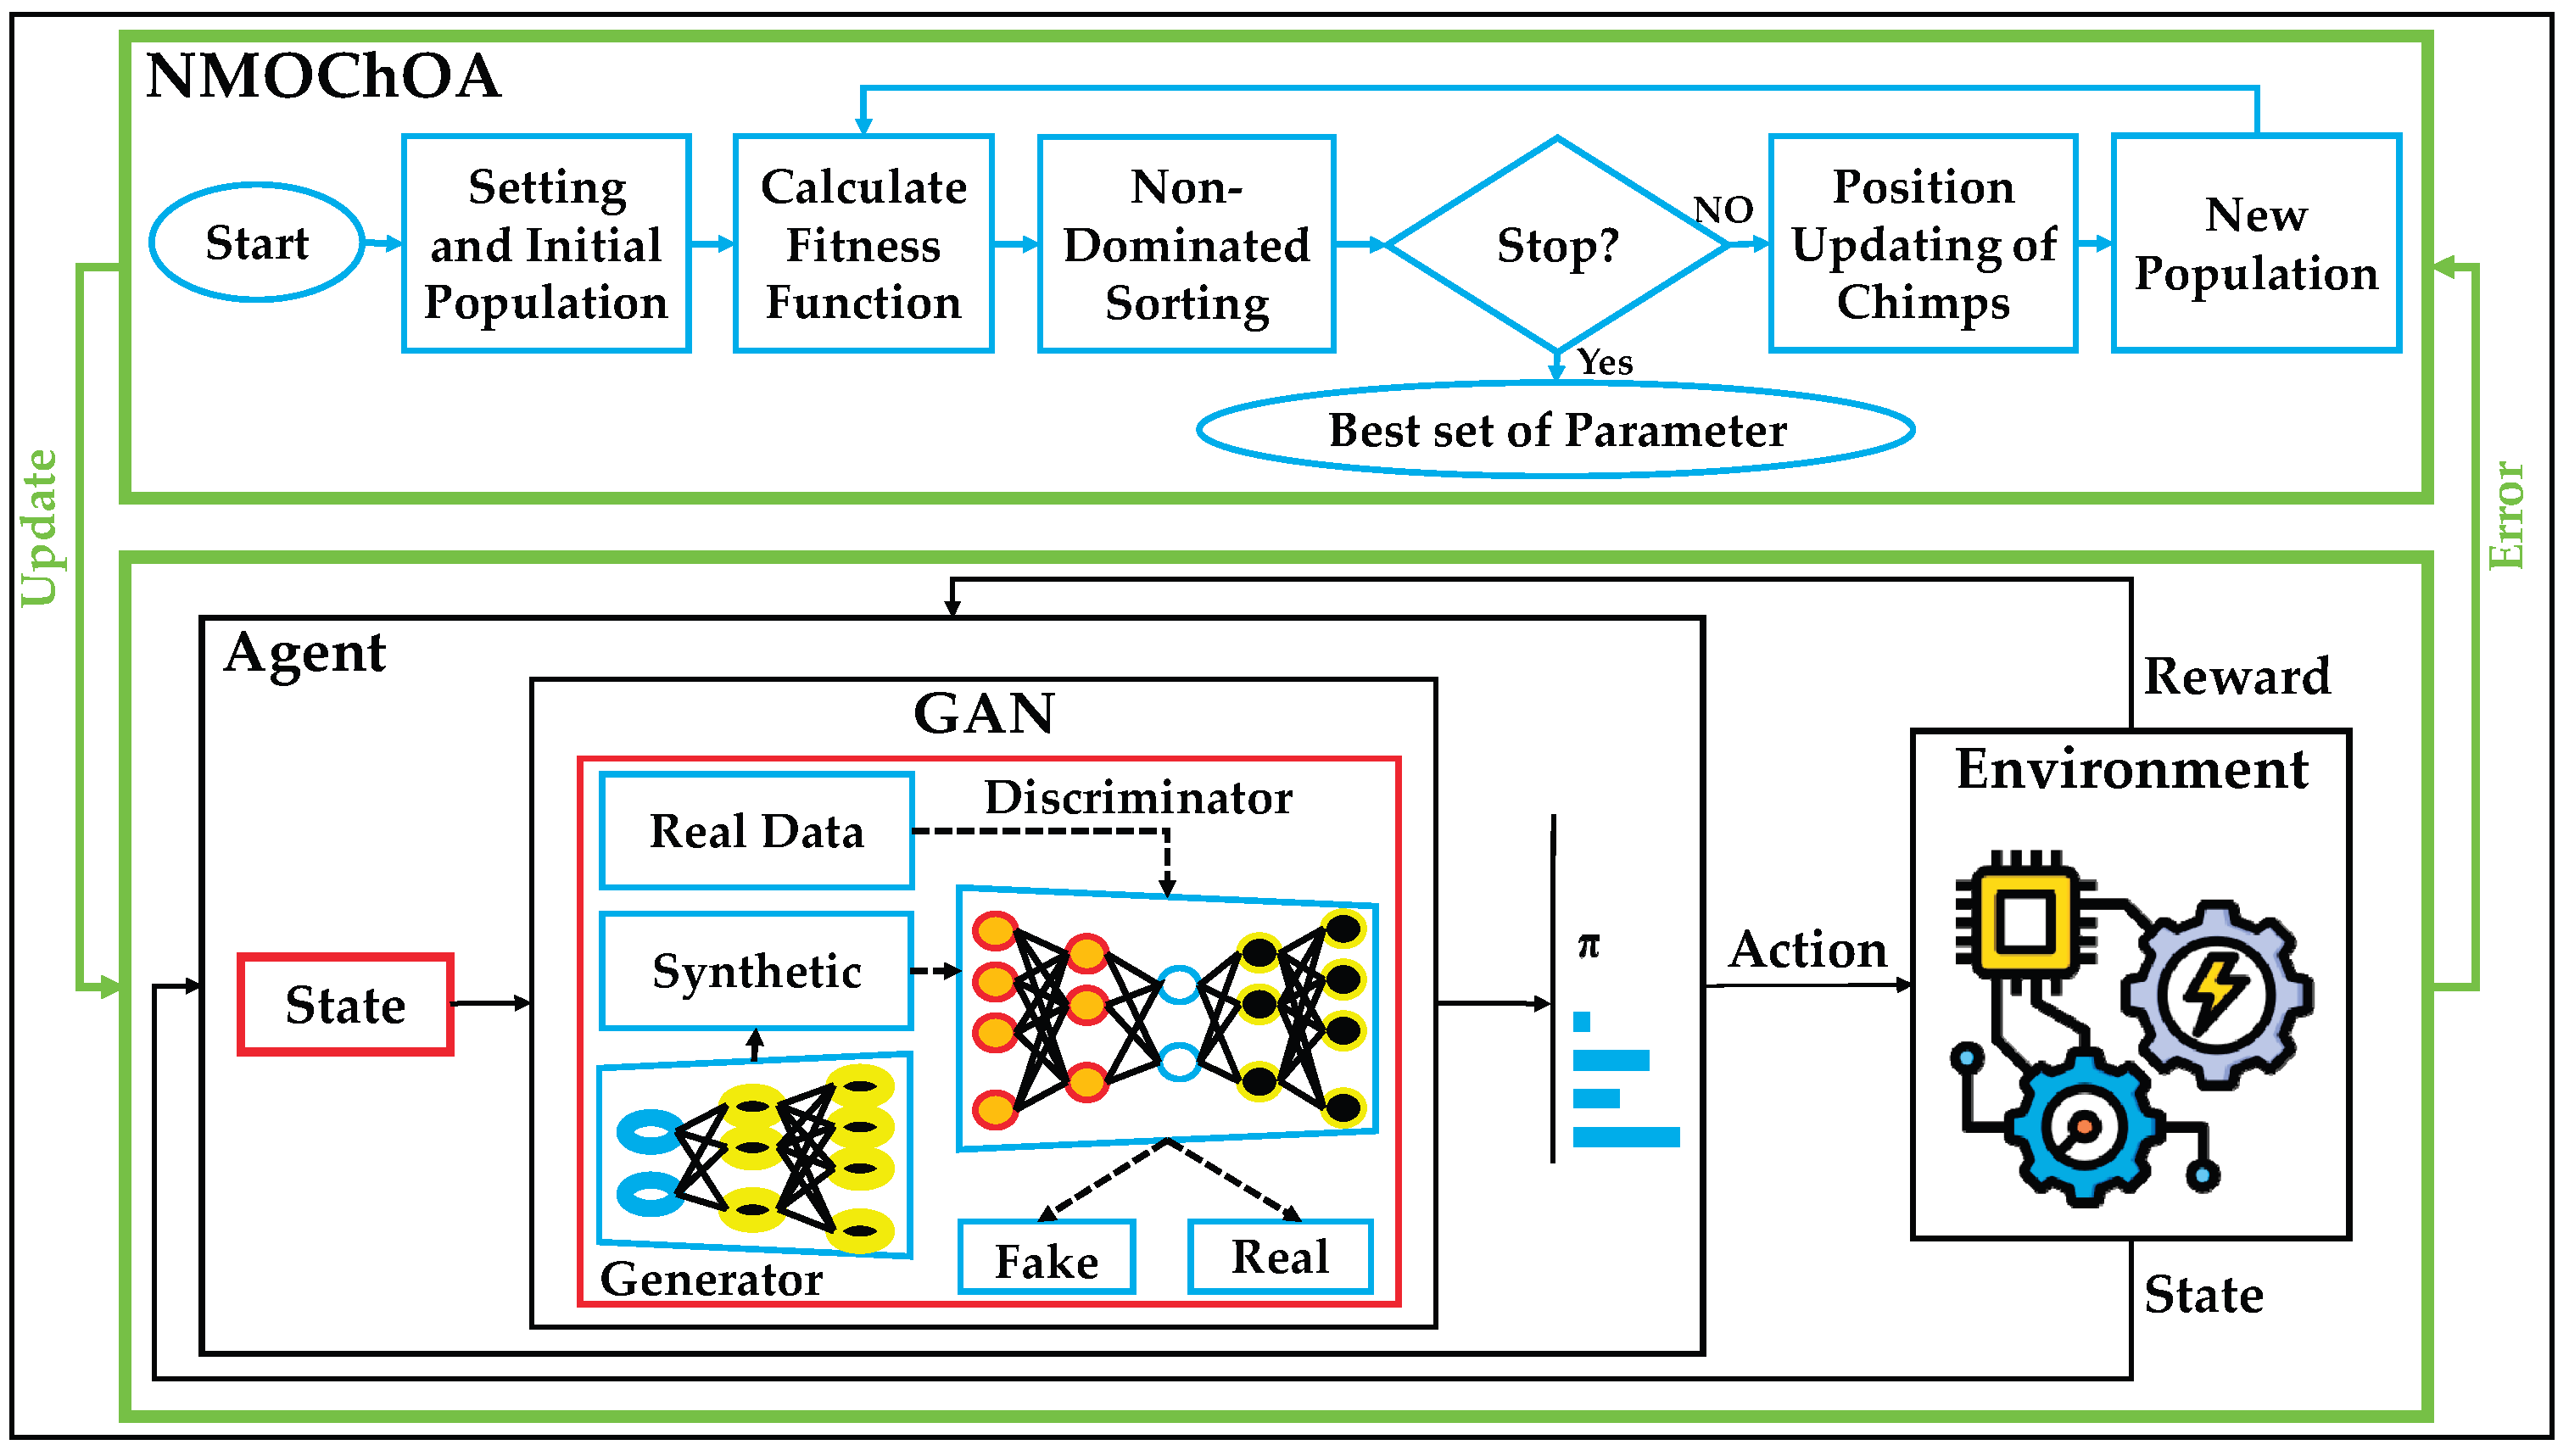
Figure 7.
Bar-chart comparison of accuracy, recall, and AUC on: (a) PSML; (b) LEAD1.0 datasets.
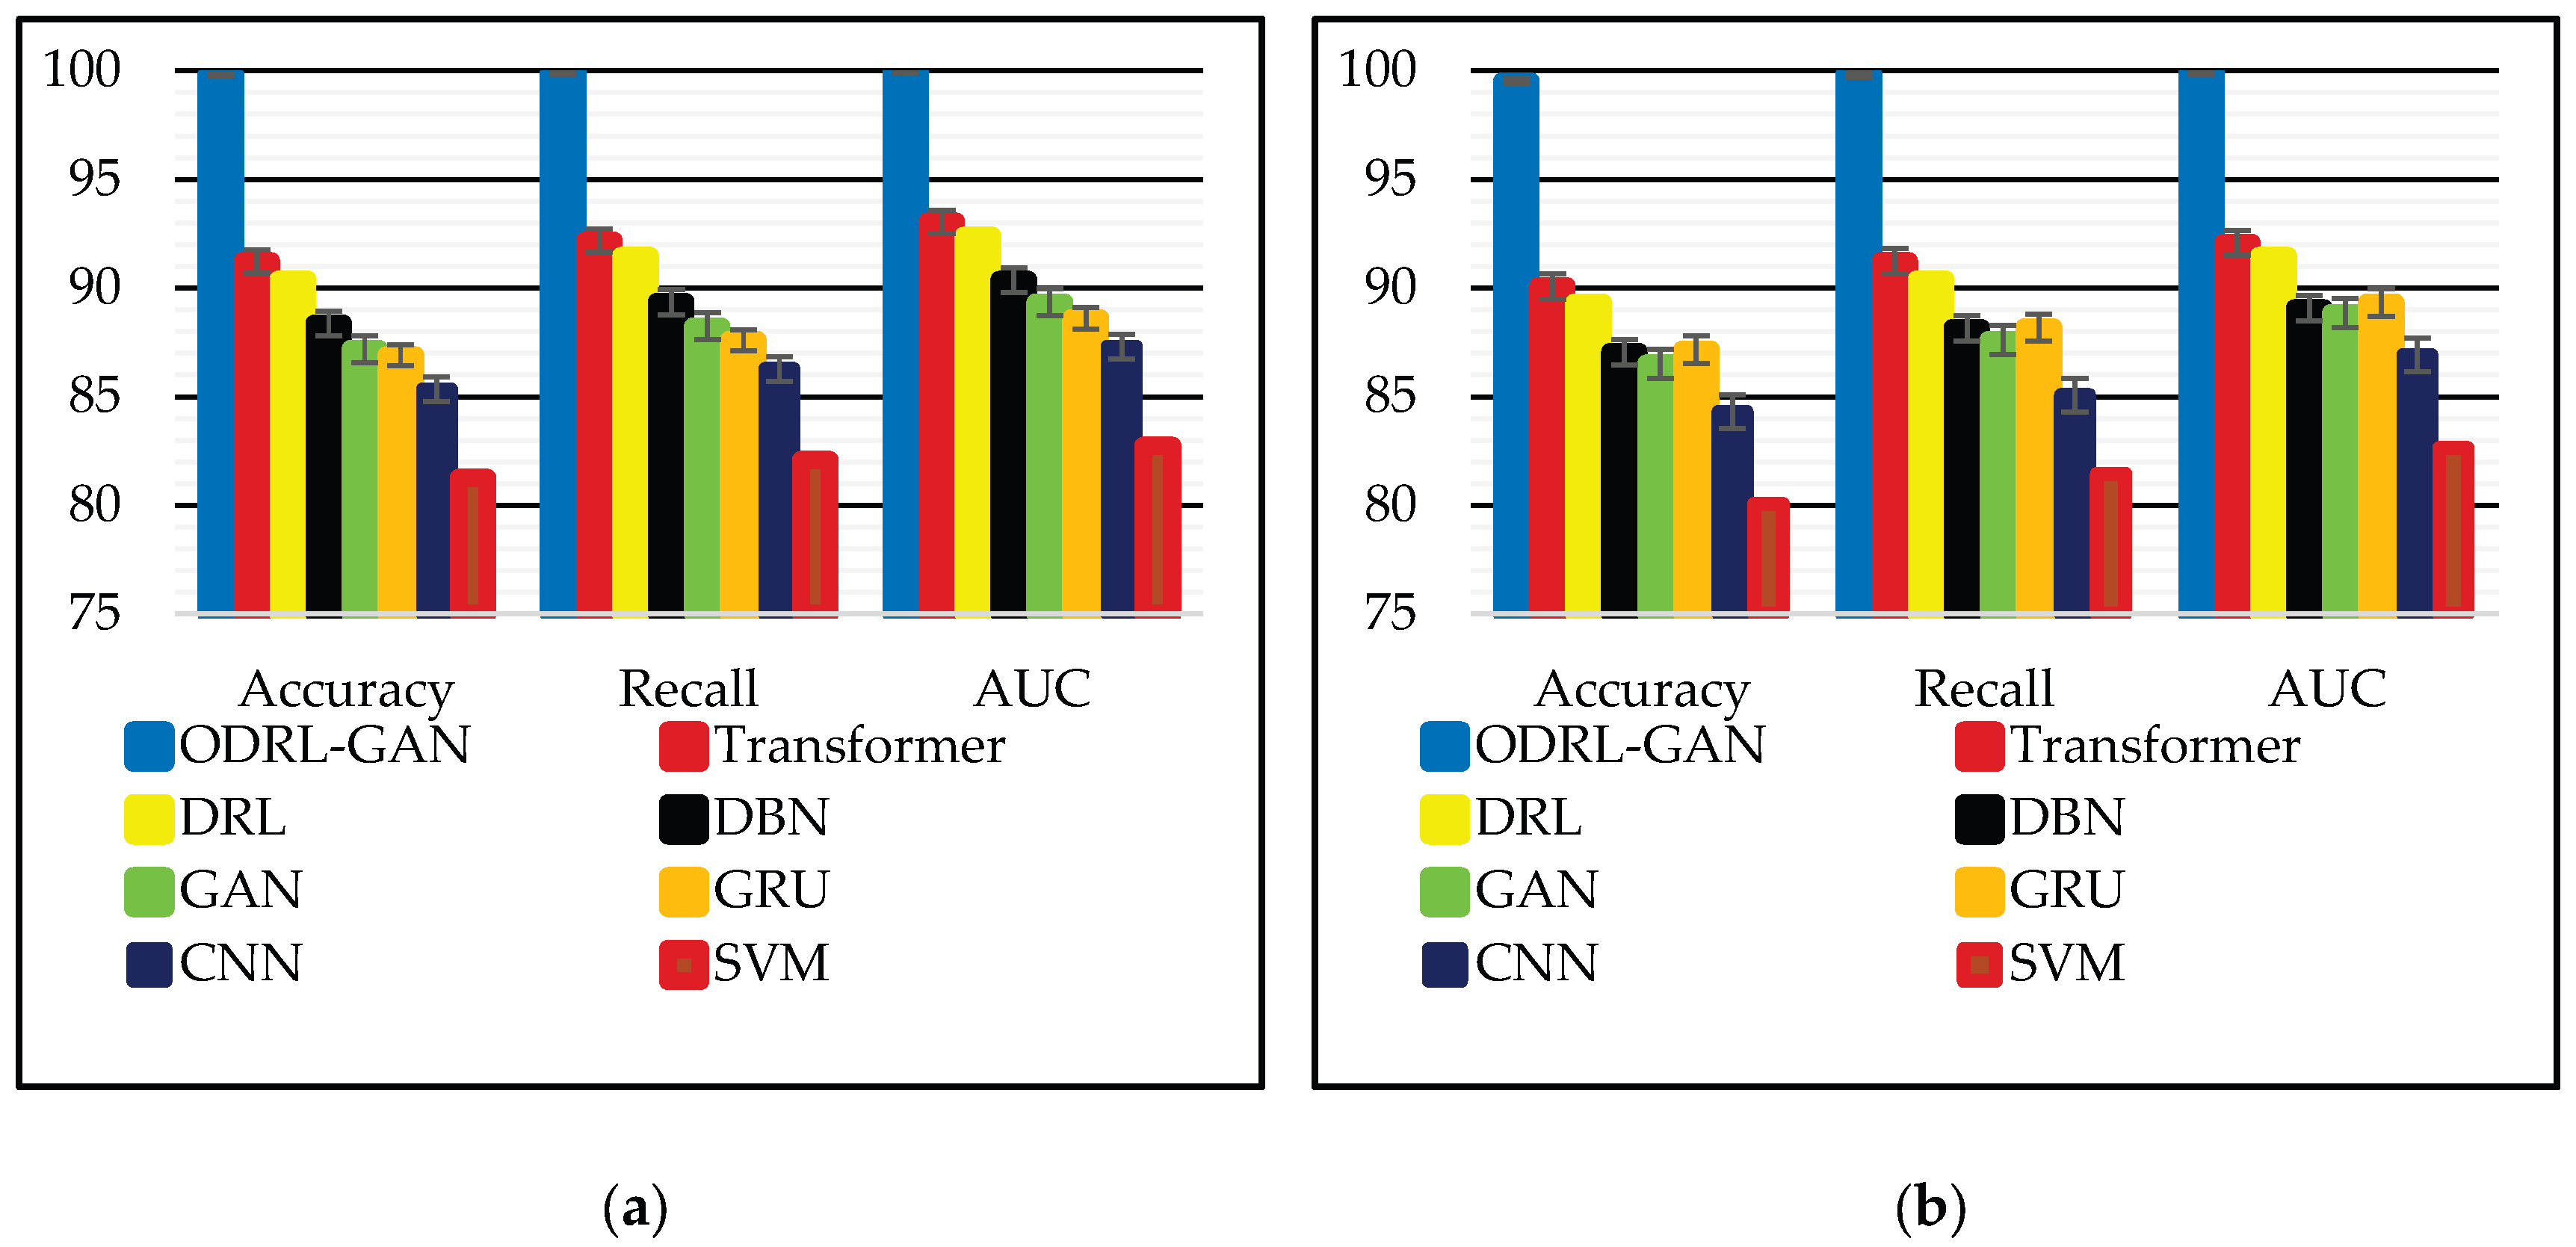
Figure 8.
ROC curves of all models: (a) PSML; (b) LEAD1.0 datasets.
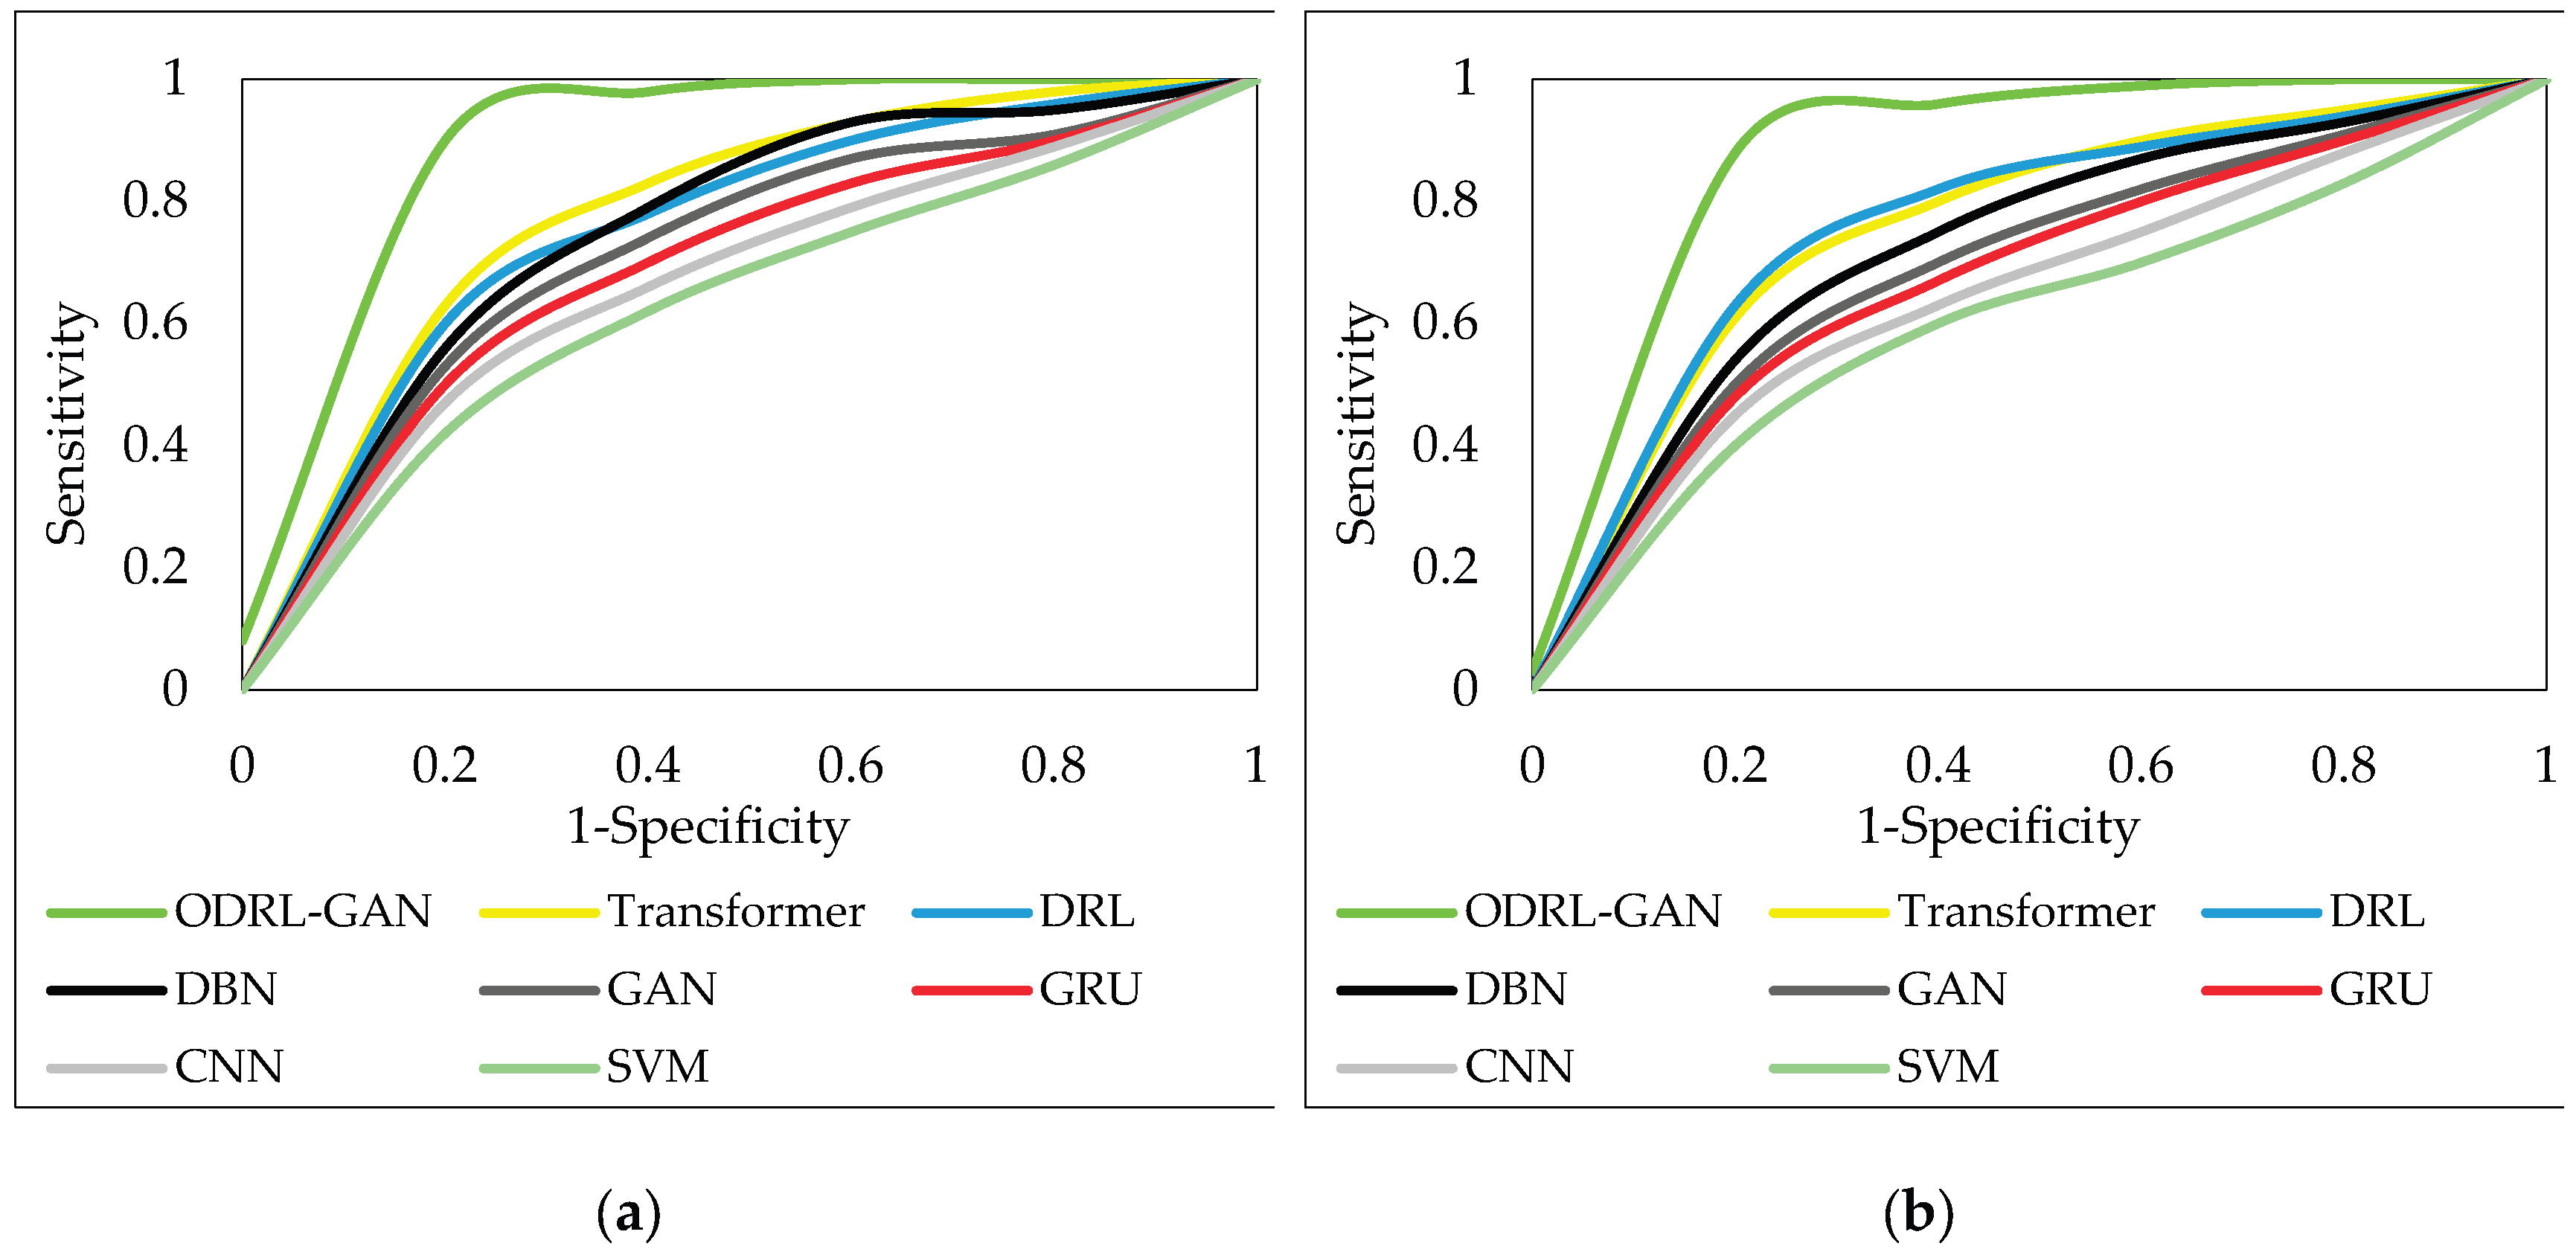
Figure 9.
Training convergence curves of all models across 300 epochs: (a) PSML; (b) LEAD1.0.
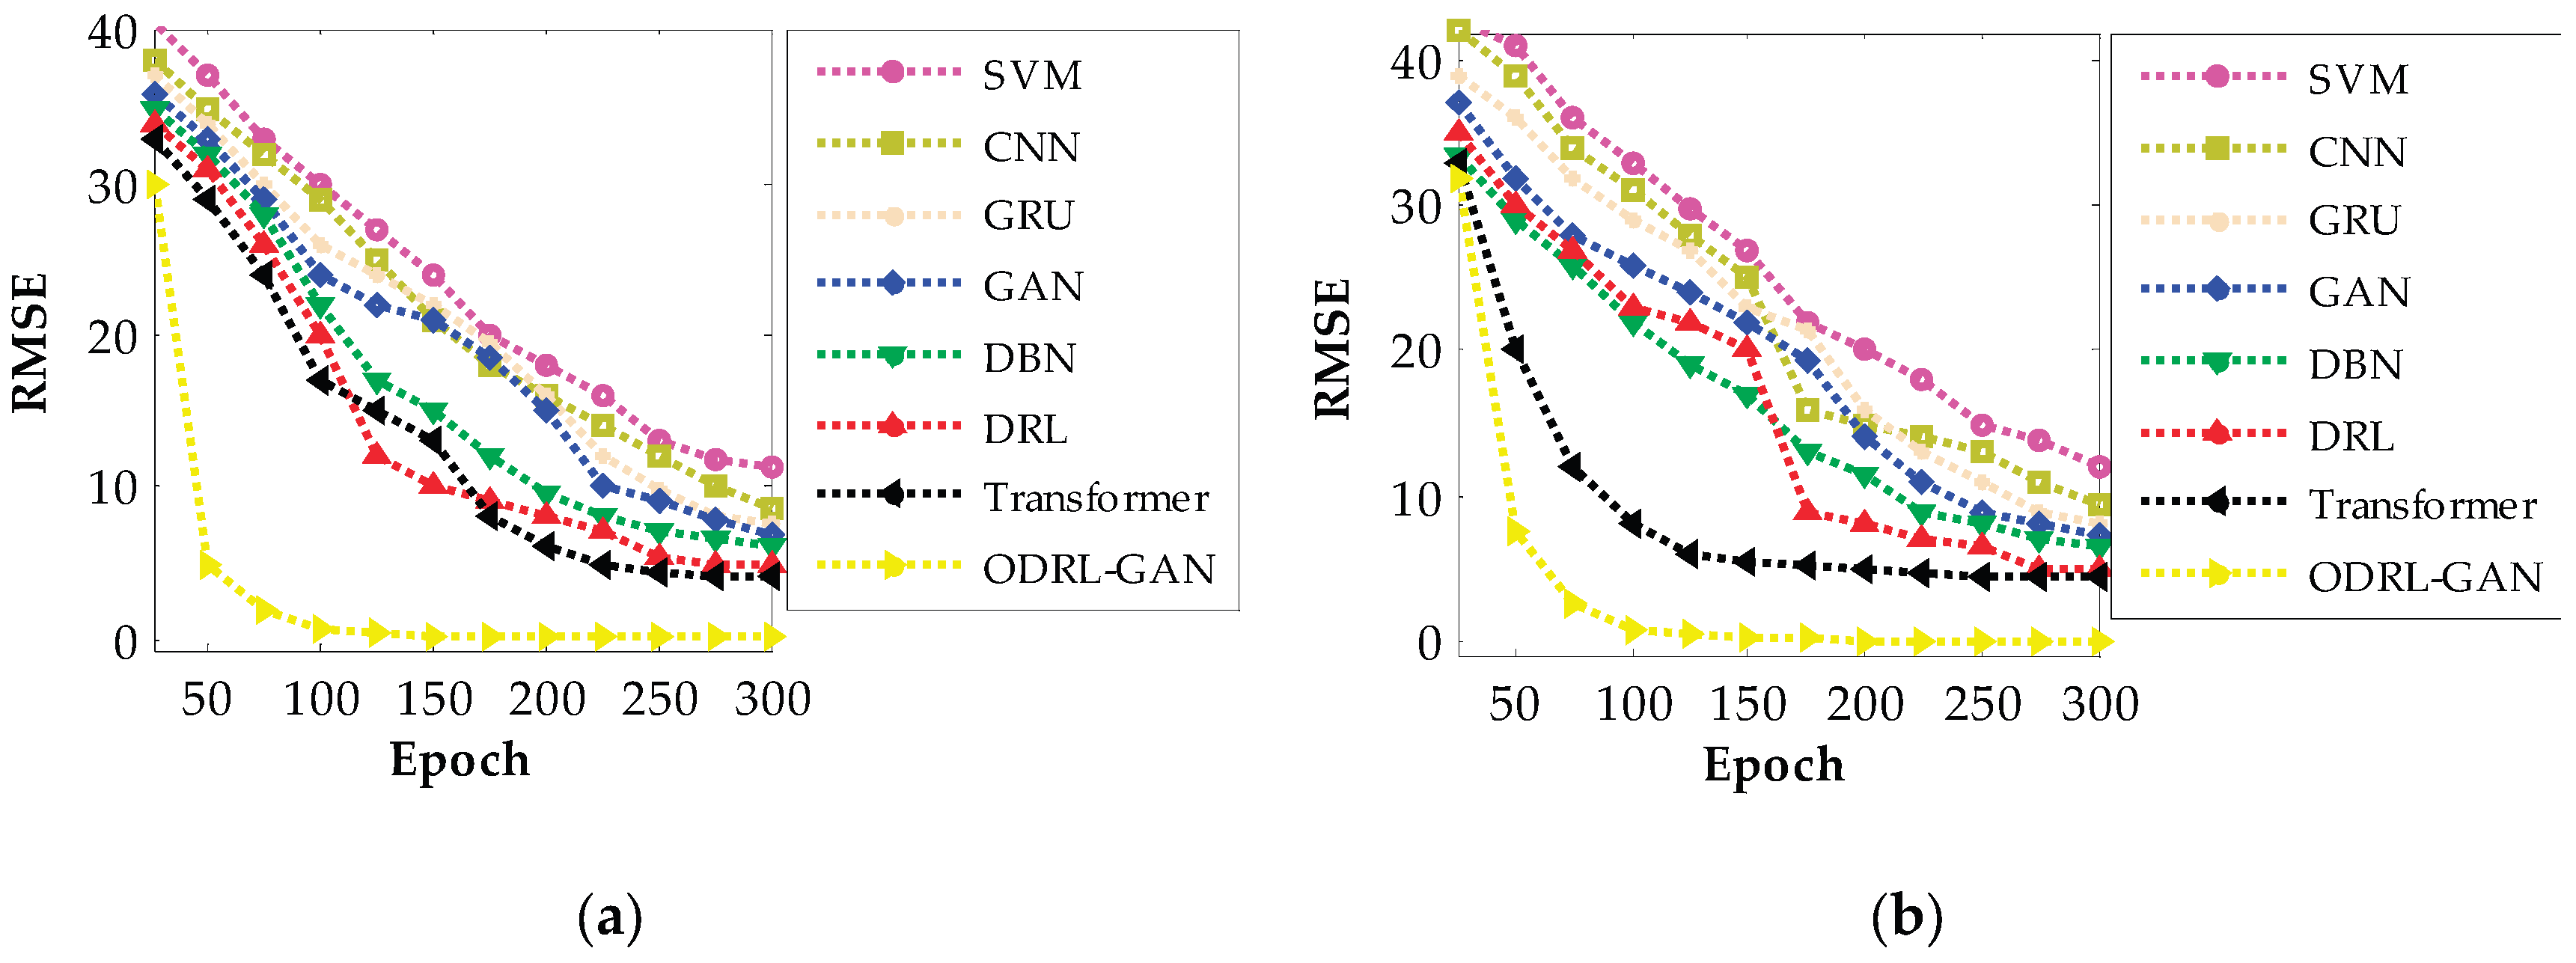

Table 1.
Hyper-parameter settings of the proposed models.
| Model | Parameter | Value |
|---|---|---|
| ODRL-GAN | Learning rate | 0.005 |
| Discount factor (γ) | 0.92 | |
| ε-greedy | 0.46 | |
| Batch size | 64 | |
| Momentum term | 0.05 | |
| Convergence threshold | 0.072 | |
| Activation | Tanh and sigmoid | |
| Optimizer | NMOChOA | |
| a | [−1, 1] | |
| f | Linearly from 2 to 0 | |
| Population size | 80 | |
| Iteration | 300 | |
| DBN | Learning rate | 0.002 |
| Batch size | 64 | |
| Dropout rate | 0.2 | |
| Number of hidden layers | 3 | |
| Number of neurons in hidden layers | 32 | |
| Activation | Tanh and sigmoid | |
| Optimizer | SGD | |
| Transformer | Learning rate | 0.003 |
| Batch size | 64 | |
| Feed forward hidden size | 2048 | |
| Weight decay | 0.02 | |
| Dropout rate | 0.2 | |
| Number of attention heads | 6 | |
| Number of encoder layers | 4 | |
| Activation function | GELU | |
| Optimizer | SGD | |
| GRU | Learning rate | 0.005 |
| Sequence length | 6 | |
| Hidden units per layer | 64 | |
| Number of GRU layers | 6 | |
| Dropout rate | 0.2 | |
| Optimizer | Adam | |
| CNN | Number of convolution layers | 8 |
| Kernel size | 5*5 | |
| Pooling type | Max pooling (2*2) | |
| Number of hidden layers | 4 | |
| Number of neurons | 64 | |
| Activation | Tanh | |
| Optimizer | Adam | |
| SVM | Kernel type | Linear and RBF |
| Gamma | 0.002 | |
| Number of estimators | 300 |
Table 2.
Performance comparison of the proposed ODRL–GAN and baseline models.
| Model | Dataset | |||||
|---|---|---|---|---|---|---|
| PSML | LEAD1.0 | |||||
| Accuracy | Recall | AUC | Accuracy | Recall | AUC | |
| ODRL-GAN | 99.79 | 99.89 | 99.95 | 99.51 | 99.83 | 99.91 |
| Transformer | 91.23 | 92.18 | 93.05 | 90.08 | 91.24 | 92.08 |
| DRL | 90.38 | 91.47 | 92.41 | 89.31 | 90.38 | 91.46 |
| DBN | 88.37 | 89.36 | 90.37 | 87.06 | 88.16 | 89.08 |
| GAN | 87.19 | 88.24 | 89.34 | 86.52 | 87.60 | 88.84 |
| GRU | 86.91 | 87.60 | 88.61 | 87.16 | 88.18 | 89.34 |
| CNN | 85.34 | 86.27 | 87.30 | 84.31 | 85.08 | 86.93 |
| SVM | 81.27 | 82.09 | 82.74 | 80.07 | 81.46 | 82.64 |
Table 3.
Comparative evaluation of ODRL–GAN under different combinations.
| Model | Dataset | |||||
|---|---|---|---|---|---|---|
| PSML | LEAD1.0 | |||||
| Accuracy | Recall | AUC | Accuracy | Recall | AUC | |
| ODRL-GAN (NMOChOA) | 99.79 | 99.89 | 99.95 | 99.51 | 99.83 | 99.91 |
| MOOA-DRL-GAN | 96.08 | 96.75 | 97.28 | 95.08 | 95.79 | 96.24 |
| MOChOA-DRL-GAN | 95.47 | 96.24 | 96.90 | 94.28 | 95.09 | 96.34 |
| MOGWO-DRL-GAN | 95.21 | 96.01 | 96.84 | 94.11 | 95.33 | 96.18 |
| MOPSO-DRL-GAN | 94.19 | 95.39 | 96.05 | 93.19 | 94.66 | 95.46 |
| DRL-GAN | 93.57 | 94.63 | 95.18 | 92.67 | 93.51 | 94.08 |
| NMOChOA-DRL | 92.78 | 93.93 | 94.86 | 91.73 | 92.80 | 93.91 |
| NMOChOA-GAN | 92.34 | 93.29 | 94.45 | 91.12 | 92.53 | 93.67 |
| DRL | 90.38 | 91.47 | 92.41 | 89.31 | 90.38 | 91.46 |
| GAN | 87.19 | 88.24 | 89.34 | 86.52 | 87.60 | 88.84 |
Table 4.
Runtime comparison on PSML dataset across multiple RMSE-based stopping thresholds.
| Proposed Methods | Run Time (s) | |||
|---|---|---|---|---|
| RMSE < 12 | RMSE < 9 | RMSE < 6 | RMSE < 3 | |
| ODRL-GAN | 36 | 68 | 126 | 263 |
| Transformer | 128 | 351 | 749 | - |
| DRL | 109 | 389 | 826 | - |
| DBN | 153 | 429 | - | - |
| GAN | 171 | 486 | - | - |
| GRU | 193 | 593 | - | - |
| CNN | 188 | 608 | - | - |
| SVM | 243 | - | - | - |
Table 5.
Runtime comparison on LEAD1.0 under different RMSE-based stopping conditions.
| Proposed Methods | Run Time (s) | |||
|---|---|---|---|---|
| RMSE < 12 | RMSE < 9 | RMSE < 6 | RMSE < 3 | |
| ODRL-GAN | 45 | 82 | 148 | 274 |
| Transformer | 152 | 371 | 806 | - |
| DRL | 145 | 406 | 953 | - |
| DBN | 176 | 461 | - | - |
| GAN | 193 | 514 | - | - |
| GRU | 215 | 683 | - | - |
| CNN | 205 | - | - | - |
| SVM | 289 | - | - | - |
Table 6.
Comparative inference latency (ms) of all evaluated models.
| Model | Inference Latency (ms) | |
|---|---|---|
| PSML | LEAD1.0 | |
| ODRL-GAN | 7.2 | 7.6 |
| Transformer | 7.3 | 7.9 |
| DRL | 6.9 | 7.2 |
| DBN | 6.3 | 6.5 |
| GAN | 7.1 | 7.4 |
| GRU | 8.1 | 8.2 |
| CNN | 6.8 | 7.1 |
| SVM | 5.6 | 6.1 |
Table 7.
Variance values across 35 independent runs for all evaluated models.
| Model | Variance | |
|---|---|---|
| PSML | LEAD1.0 | |
| ODRL-GAN | 0.00009 | 0.00013 |
| Transformer | 1.42365 | 1.96523 |
| DRL | 2.01756 | 2.74150 |
| DBN | 3.18605 | 3.89652 |
| GAN | 4.02543 | 4.81452 |
| GRU | 5.76325 | 5.92145 |
| CNN | 7.73265 | 8.32058 |
| SVM | 11.05563 | 13.08521 |
Table 8.
Statistical t-test comparison between ODRL-GAN with others at a 0.01 significance level.
| Model | Statistical t-tests | |||
|---|---|---|---|---|
| PSML | LEAD1.0 | |||
| p-value | Results | p-value | Results | |
| ODRL-GAN vs. Transformer | 0.0007 | Significant | 0.0006 | Significant |
| ODRL-GAN vs. DRL | 0.0005 | Significant | 0.0004 | Significant |
| ODRL-GAN vs. DBN | 0.0003 | Significant | 0.0002 | Significant |
| ODRL-GAN vs. GAN | 0.0002 | Significant | 0.0001 | Significant |
| ODRL-GAN vs. GRU | 0.00008 | Significant | 0.00006 | Significant |
| ODRL-GAN vs. CNN | 0.00005 | Significant | 0.00003 | Significant |
| ODRL-GAN vs. SVM | 0.000003 | Significant | 0.000002 | Significant |
Disclaimer/Publisher’s Note: The statements, opinions and data contained in all publications are solely those of the individual author(s) and contributor(s) and not of MDPI and/or the editor(s). MDPI and/or the editor(s) disclaim responsibility for any injury to people or property resulting from any ideas, methods, instructions or products referred to in the content. |
© 2025 by the authors. Licensee MDPI, Basel, Switzerland. This article is an open access article distributed under the terms and conditions of the Creative Commons Attribution (CC BY) license (http://creativecommons.org/licenses/by/4.0/).
Copyright: This open access article is published under a Creative Commons CC BY 4.0 license, which permit the free download, distribution, and reuse, provided that the author and preprint are cited in any reuse.


