Submitted:
03 December 2025
Posted:
04 December 2025
You are already at the latest version
Abstract
Background: Preoperative prediction of mandibular third molar (M3) eruption remains a major challenge in dentistry and oral surgery. Artificial intelligence (AI) offers new opportunities to improve diagnostic accuracy and reduce the subjectivity associated with manual assessment.
Objective: This study aimed to develop and validate PDApp, a machine-learning-based software designed to predict third lower molar eruption status (erupted vs. retained) using panoramic radiographic images, and to compare its diagnostic performance with clinical exploration.
Materials and Methods: A retrospective dataset of 383 mandibular third molars with clinically confirmed eruption status was collected. Panoramic radiographic images were processed and used to train multiple machine learning (ML) algorithms integrated into PDApp for eruption prediction. The software’s performance metrics were analyzed and validated against clinical exploration, considered the diagnostic reference standard.
Results: PDApp achieved the highest performance metrics among the evaluated ML approaches, reaching an accuracy of up to 99.5% in predicting mandibular third molar eruption. The tool showed strong reliability in differentiating erupted from retained M3 using panoramic radiographs.
Conclusions: PDApp represents a robust, accurate, and easy-to-use AI-based tool for predicting third molar eruption potential in adolescent and teenage patients. Its implementation may enhance diagnostic efficiency, reduce common errors associated with manual evaluation, and support clinical decision-making in the management of impacted mandibular third molars. Future work will focus on integrating automatic calculation of radiographic ratios to achieve a fully automated prediction workflow.
Keywords:
artificial intelligence
; oral radiology
; third molar
; panoramic radiography
; machine learning
; software
1. Introduction
The decision of extracting or maintaining lower third molars is usually made at the beginning or end of dental treatment planning for the clinicians based on his or her clinical judgment and radiological follow-up and is not exempted from controversy. Routine oral and radiological examinations are critical for the early detection and management of impacted teeth, helping to mitigate potential complications because between 50% or 80% of the global population are estimated to have at least one impacted tooth during their lifetime[1,2,3,4]. The use of computer-aided diagnosis based on deep learning is emerging in the field of dentistry with the advancement of artificial intelligence (AI) technology[5,6]. An accurate prediction of the eruption/un-eruption (retention) status might allow a clinician to perform a timely extraction/exodontia before it acquires retained position which might increase intra or postoperative complications. The panoramic radiograph is a widely used X-ray imaging technique for diagnosis impacted teeth also it’s the most commonly employed modality for evaluating overall oral health and follow-up of impacted teeth[7].
In order to assess the space for the third molar eruption, different radiographic techniques, using two-dimensional measurements (panoramic or lateral radiographs), were documented in the literature[8,9,10,11,12,13]. However, panoramic radiography yielded one of the most accurate estimation in this field and it´s the most popular dental record for clinicians[8]. Regarding, the impacted lower third molars, determining the retromolar spaces and their mesio-distal diameter mesiodistal angulation/inclinations contributes to the prognosis of M3 eruption at an earlier age. According to Hattab and Alhaija[14] the most significant variable associated with M3 retention is the lack of space for eruption in the retromolar area. This authors measured the distance between the tangent to the distal surface of the second lower molar to the anterior edge of the ramus of mandible and de mesio-distal diameter of third lower molar (the greatest distance between the mesial and distal surface of the M3 crown). Although the retromolar space will be big enough, the eruption of the lower third molar cannot be guaranteed since other factors influence the skeletal growth pattern, the direction of eruption of the dentition, the dental extractions performed, the morphology of the root and the maturation stage of the third molar. It has been reported the retromolar space and mesiodistal angulation of M3 are the most important factors for the eruption of this tooth[15,16].
All the authors studied coincide with our aim of finding a reliable and efficient predictive method. AI applications are highly time-saving in planning of treatments in implantology, orthodontics and orthognatic surgery by automated detection and segmentation of 3Dimages [5,6]. In this context, we developed and validated a software for prediction M3 eruption potential in adolescents patients by linear and angular measurements[17].
The aim of the present study was to evaluate accuracy of Panoramic Dental Application tool (hereinafter PDApp) used to predict the eruption or not eruption of the lower third molar on panoramic radiographs.
2. Material & Methods
PDApp is a desktop application that runs on a general-purpose computer under the Linux and Windows operating systems. It has been written in the C++ programming language using the GTK+ (GIMP Tool Kit) library1 to develop the GUI. Figure 1 shows the GUI of PDApp with a typical radiological image loaded, processed and reviewed by the expert, and with the lateral panel displayed.
The panoramic radiographies analyzed were retrospectively selected from private radiological center (Centro de Radiología Príncipe, Vigo, Spain). The participants consented to the use of their image data in the present study. We retrospectively collet data of 35.415 patients with mandibular third molars retained. All image data are anonymized prior to analysis. In total, 383 panoramic radiographies were included: 94 for training and technical validation and 289 for posterior clinical validation. The study has the approval of the Santiago-Lugo Research Ethics Committee, with registration code 2017/121. Radiographies were acquired with CS 8100 device SN EBXG197 (Carestream Health Inc, France).
PDApp is a modular and extensible application composed by three layers: 1) the GUI layer, that interacts with the user through edition tools, including modules to draw and manage objects, set preferences or interact with the software; 2) the logic application layer, that contains modules to measure distances and angles, predict the third molar potential, train the classifier and calculate the statistical results; and 3) the persistence layer, that stores all the data needed and calculated by the software, including modules to save the overlays on the image and the statistical results. The image overlays, which contain the analysis supervised by the experts, are stored in the popular text format XML (Extensible Markup Language). The statistical results, calculated from the overlays, are stored in the known text format CSV (Comma-Separated Values), which is portable and can be imported from other spreadsheet software for further use.
Figure 2 shows a flowchart with the main functionality of PDApp, which is accessible from its GUI. A typical working session for an user should have the following actions: 1) open a radiological image; 2) draw manually the retromolar space, the third molar diameter and the angle for each third molar; 3) measure automatically the distances and angles; 4) classify automatically the third molar; 5) go to expert’s supervision, as described below; 6) save the overlays drawn on the image into the XML file; 7) export the statistical measures to the CSV file; and 8) at any time the user can do the following optional functionality: set preferences, save joined results of a set of patients, and train the classifier.
Once the image is loaded, the user must manually draw the retromolar space, the third molar diameter and the angle using the edition tools. Next, the classifier can be run in order to label each third molar as “erupted” or “non-erupted/retained”.
As mentioned in introduction section, our previous studies [16,17] and other published research[15], the retromolar space, the third molar diameter and the angulation of third molar are key parameters to predict the third molar eruption/retention. Specifically, we use the angle and the RRC (Radiological Retention Coefficient), defined as the rate of retromolar space and third molar diameter, because both measures are independent of the spatial resolution at which the radiological image is acquired[21].
Another objective of this work is to examine the ability to the PDApp tool in ither populations to classify between erupted and nonerupted or retained molars. For this purpose we had considered three groups of patients: RSO group formed by patients with retained M3 who had not undergone orthodontic procedures (n= 47 M3); RCO group formed by patients with retained M3 who had undergone orthodontic procedures (n= 51 M3) and E group formed by patients with erupted M3 (N=50 M3). It is noteworthy that, for the sample considered, the PDApp tool correctly classified 100% of the M3 studied.
3. Results
The prediction of third molar eruption is a topic of great interest for clinicians (oral surgeons, orthodontist, and general dentists) since this date can improve patient care. The present study used a semi-automated AI tool for predicting the Third Molar Eruption Potential, PDApp that has been technically and clinically validated in a prior study [17].
Now, we evaluated the ability to classify between erupted or retained M3s for both variables of interest employed in PDApp: radiological retention coefficient (RRC) and the cosine of the eruption angle (Cos erupθ) to classify correctly M3s. For this purpose, ROC curves have been fitted (Figure 3 and 4) [18,19]. The area under the associated curve is 1 (the maximum value reflecting perfect classification) for the RRC variable. These results highlight the extremely high discriminatory power of the RRC. Additionally, the point of maximum sensitivity and specificity is reached with values of 1 in both cases.
It is shown that the RRC is more useful for discriminating between eruption status. It is important to highlight that the cutoff point where maximum sensitivity and specificity are achieved would be 0.722. That is, M3s with a retention coefficient lower than 0.722 would be classified as “retained,” while those with retention coefficients higher than 0.722 would be classified as “erupted.”
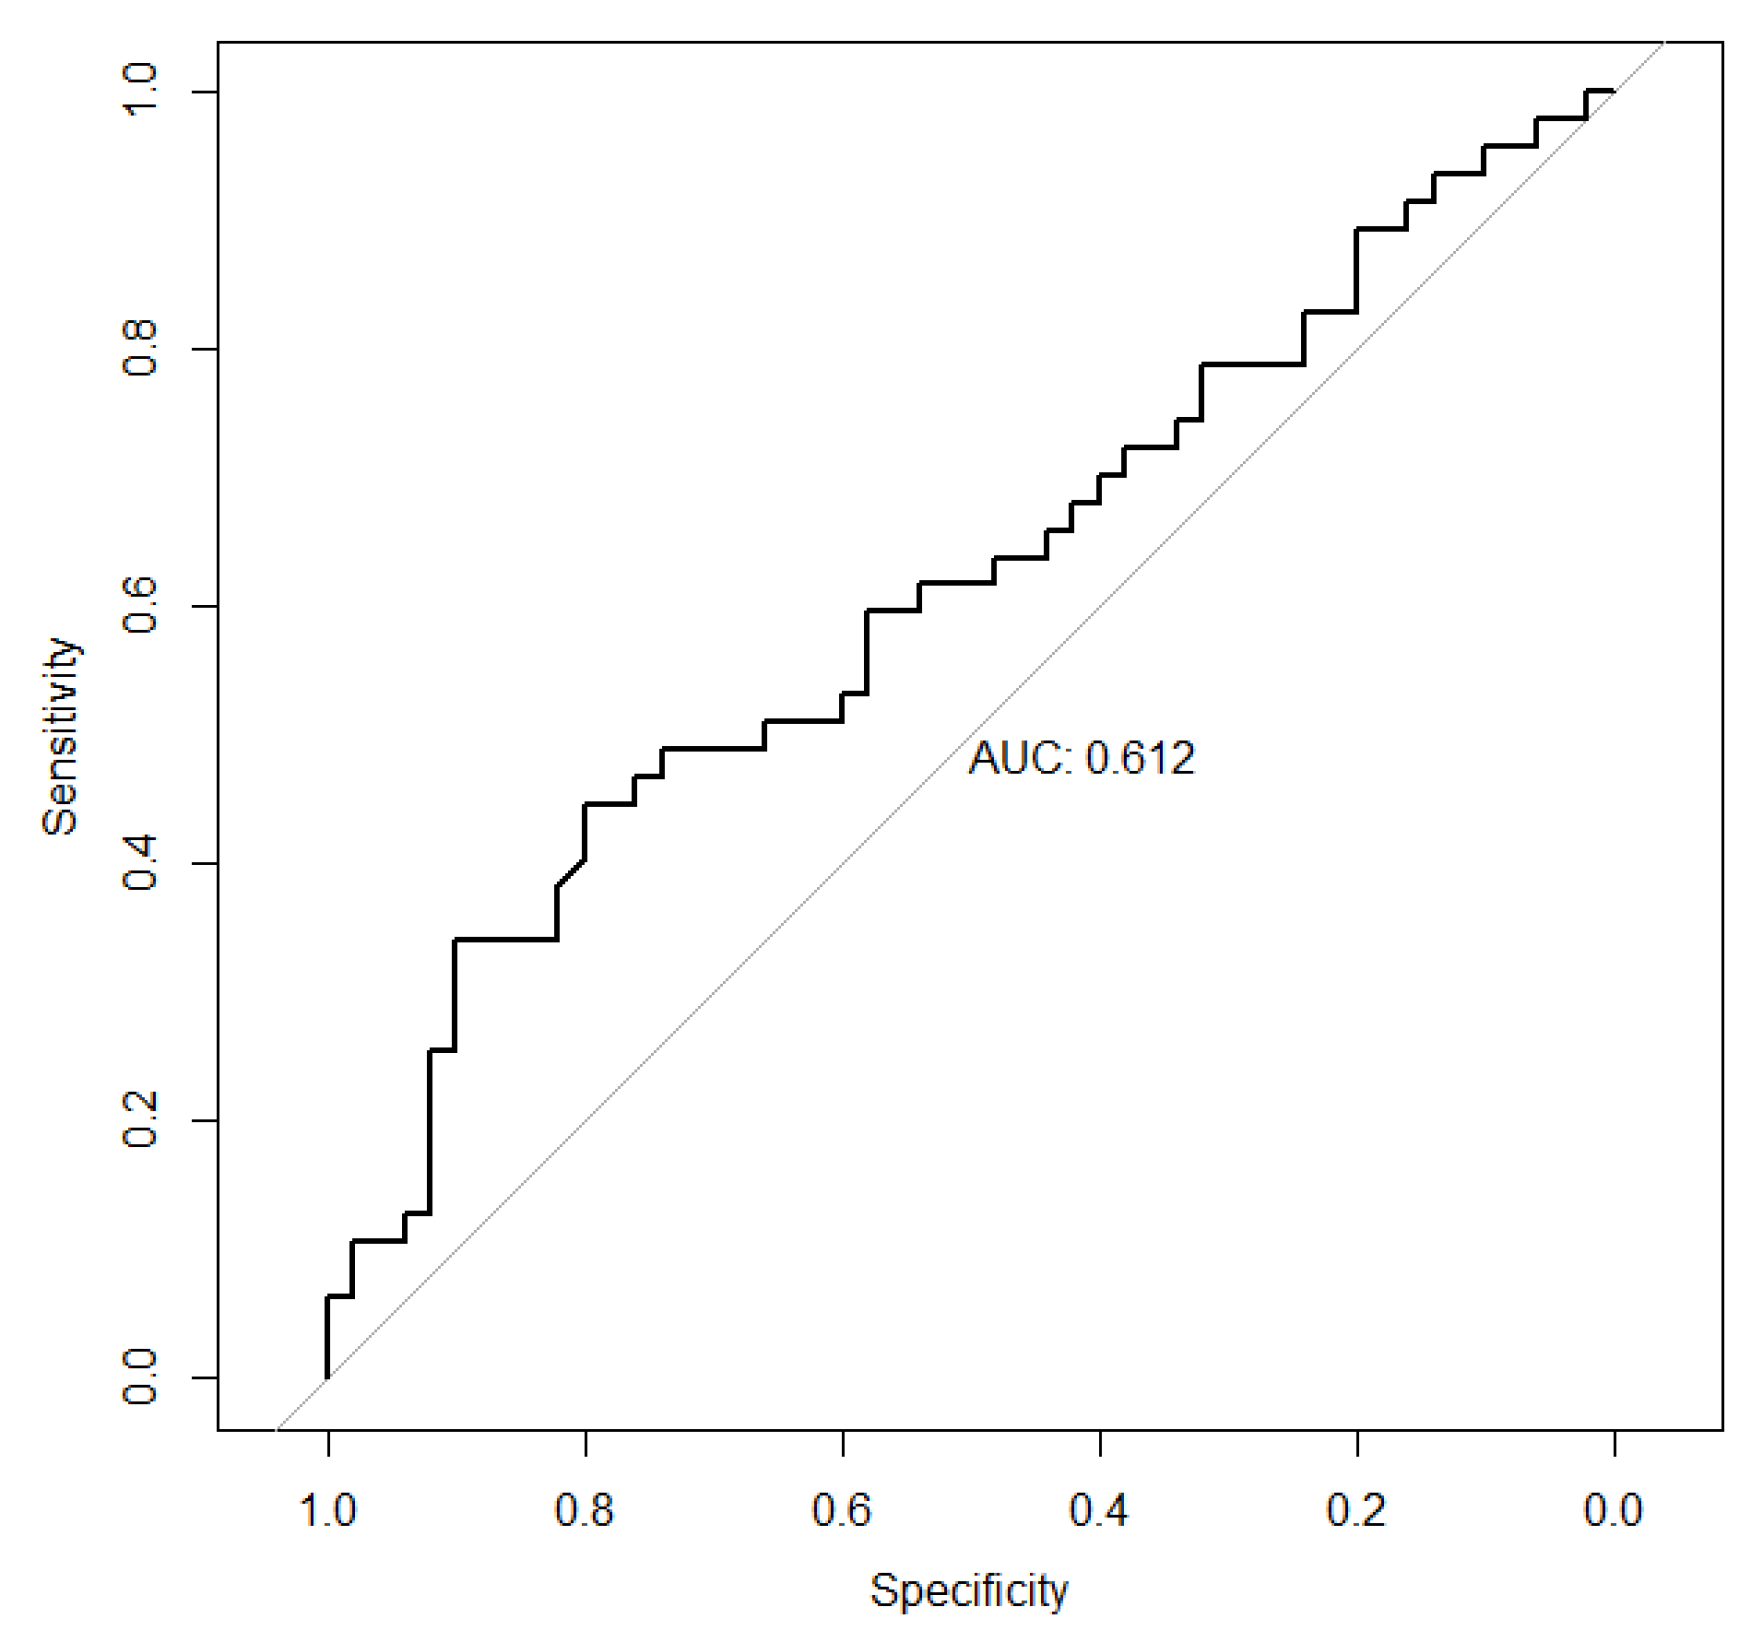
On the other hand, for the variable cosine of the eruption angle, we observed that the associated ROC curve is very close to the diagonal of the first quadrant. Thus, the area under the associated curve is 0.612, with a 95% confidence interval (CI) of (0.4986-0.7257) for this value. These results illustrate the low discriminatory power of the considered variable. Furthermore, the point of maximum sensitivity and specificity is reached for values of 0.446 (95% CI: 0.234 - 0.5957) and 0.80 (95% CI: 0.50 - 0.927), respectively.
Figure 4.
Curva ROC associated to Cos erupθ.
Subsequently, a descriptive analysis of the three study groups is performed. Table 1 shows the main characteristic measures associated with the RRC and the cosine of the eruption angle in the groups (RSO, E and RCO).
A clearly different behavior of the retention coefficient is observed in group E, compared with groups RSO and RCO. For example, while the range of dispersion of this variable in the group E is 0,7313-2.2047 in groups RSO and RCO it would be 0.1620-0.7135 and 0.1352-0.7109 respectively. That its, there is no overlap between the results of group E and those of groups RSO and RCO. Similarly, central tendency measures such as mean and median 0.3939 and 0.3845 in group RSO or 0.3251 and 0.3032 in group RCO, and 1.3319 and 1.2835 in group E, respectively. Analogous results are drawn from the calculation of the first or third quartile.
On the other hand, the characteristic measurements associated with the RRC in groups RSO and RCO are very similar in groups RSO and RCO and very different in group E.
Table 2 and setting a significance level of 5%, we can assert that there is statistically significant evidence that the behavior of the RRC in the group E is not the same as in group RSO, nor in the group RCO. There is also evidence that allows us to state that the behavior of the RRC in groups RSO and RCO is different.
4. Discussion
In dentistry, impacted lower third molars (M3s) can lead to complications if left untreated or surgical extraction delayed, highlighting the significance of early detection and appropriate treatment planning. Dentists typically utilize panoramic radiography to identify the presence of M3 and perform radiological follow-up of its progression, underscoring the importance of accurate detection. Preoperative prediction of third molar eruption has been a challenge in dentistry with artificial intelligence (AI) [20,21].
In this study, an Explainable Mandibular Third Molar Convolutional Neural Network (E-mTMCNN) architecture, which incorporates Transfer Learning (TL), image preprocessing methods, and Local Interpretable Model-Agnostic Explanations (LIME), an explainable artificial intelligence (XAI) approach, was proposed for detecting the presence of mandibular M3. Initially, a novel m-TM dataset was created for this problem and made publicly available. Various image preprocessing methods, such as Gaussian filter, gamma correction, and data augmentation, were applied to enhance the performance of the proposed method on the m-TM dataset. Afterward, these preprocessed datasets were trained and tested with the CNN architectures employed in the TL method. Among these, the mTMCNN architecture based on GoogLeNet demonstrated the highest performance on the preprocessed m-TM dataset, achieving 87.02% accuracy, 75% sensitivity, 94.73% specificity, 77.68% precision, 75.51% F1 score, and 87.01% AUC. Additionally, XAI results were obtained using LIME on test PRs, demonstrating the proposed method's robust decision-making capability regarding the presence of mandibular M3.
Decision support system software was developed using the proposed method and used in an expert survey prepared for doctor evaluation. The survey results indicated positive feedback from expert dentists, supporting the method's performance. According to the performance comparison with the state-of-the-art methods in the literature, PDApp revealed superior performance in terms of the performance metrics used. As a result, it has been observed that this software is a computer-aided diagnostic tool for the early diagnosis of eruption status of M3 and the complications related to M3 in dentistry and the appropriate planning.
The value of this tool developed by us is that it can be easily and quickly used in clinical practice on panoramic images. Throughout this work, it has been demonstrated, using Kolmogorov-Smirnov test, that the distribution of the RRC is different in the group of erupted M3s, group E (whether or not they have undergone an orthodontic procedure) and in the group of retained M3s. This implies that this variable (RRC) will be of interest for classifying molars into these groups, since its behavior depending on the group. This result is reinforced by analysis of the ROC curves associated with RRC, which have an associated AUC equal to 1 (the maximum possible value), demonstrating the excellent discriminatory power of this variable. In other words, the RRC is the most effective and efficient variable for distinguishing between erupted and retained molars. The behavior of the Cos erupθ in the three groups has also been analyzed and unlike what happens with RRG, there is no evidence that the behavior of the Cos erupθ is different in the group of retained molars compared to the group of erupted molars. In fact, the analysis of the ROC curve associated with the Cos erupθ to compare erupted and retained molars that have not undergone an orthodontic procedure has an associated AUC of 0.612, very close to 0.50, which represents a classification based solely on chance. In summary, the high discriminatory power of RRC stands out compared to the almost negligible discriminative ability of the Cos erupθ. Therefore, when classifying between impacted and erupted M3s, the good performance of the PDApp application is justified by the positive results associated with the RRC. Furthermore, goods results are obtained both in patients who are not undergone orthodontic procedures and in those who have. The analyses conducted have not been satisfactory in the case of Cos erupθ, so it would make sense to stop using this variable to classify between erupted and retained M3s using PDApp application. In other words, the data collection required to use the PDApp could be simplified while maintaining its good results. In conclusion, the universal behavior of the PDApp is demonstrated, which is not influenced by the patient´s race, patient´s sex or whether the patient may or may not need orthodontic procedures.
5. Conclusions and Future Work
This paper confirmed PDApp for identifying the Third Molar Eruption Potential (erupted status or retained status) in panoramic radiological images, achieving a final accuracy of up to 99, 5%. The PDApp is a reliable and easy-to-use software tool to estimate the Third Molar Eruption Potential from the panoramic radiological images of adolescent/teenager patients. This contribution has the potential to improve the effectiveness and efficiency of dental image analysis and rapid managing impacted mandibular third molar because PDApp reduces the problem of under- or over-estimation, which is fairly common in the manual or visual methods.
Nevertheless, certain limitations remain and future work aims to incorporate automatic calculation of RRC on panoramic radiograph in order to build a fully automatic tool to predict eruption diagnosis.
Acknowledments: This work has received financial support from the Xunta de Galicia (Centro Singular de Investigación de Galicia (CiTIUS), accreditation 2020–2023) and the European Union (European Regional Development Fund—ERDF). This work was also supported by the Valorization and Transfer Accelerator Program from the USC financed by Santander Bank.
Author Contributions
S.S-H., P.O-C., and M.G-T, conceptualization; M. G-T., M.F-D. and E.C., methodology; M. F-D. and E.C., software; S.S-H., E.C., M.F-D. and M.G-T., validation and formal analysis; S. S-H. and M.G-T., investigation; S. S-H., resources; S. S-H. and M. G-T. data curation. Writing—original draft preparation, S.S-H.. writing—review and editing, M. G-T. and P. O-C; supervision, S.S-H.; project administration, M.G-T.; funding acquisition, M.G-T. All authors have read and agreed to the published version of the manuscript.
Data Availability Statement
The data presented in this study are available on request from the corresponding author.
Conflicts of interest
The authors declared no conflict of interest.
References
- Carter, K. and Worthington, S. Predictors of third molar impaction: a systematic review and meta-analysis. J Dent Res. 2016, 95,267-76.
- Ghaeminia, H.; Nienhuijs, M.E.; Toedtling, V.; Perry, J.; Tummers, M.; Hoppenreijs, T.J.; Van der Sanden, W.J.; Mettes, T.G. Surgical removal versus retention for the management of asymptomatic disease-free impacted wisdom teeth. Cochrane Database Syst Rev. 2020, 5,CD003879.
- Richardson, M.E. and Dent, M. Some aspects of lower third molar eruption. Angle Orthod. 1974, 44,141-5. [CrossRef]
- Richardson, M.E. The etiology and prediction of mandibular third molar impaction. Angle Orthod. 1977, 47,165-72. [CrossRef]
- Putra, R.H.; Doi, C.; Yoda, N.; Astuti, E.R.; Sasaki, K. Current applications and development of artificial intelligence for digital dental radiography. Dentomaxillofac Radiol. 2022,51, 20210197. [CrossRef]
- Heo, M.S.; Kim, J.E.; Hwang, J.J.;Han, S.S.; Kim, J.S.; Yi, W.J.; Park, I.W. Artificial intelligence in oral and maxillofacial radiology: what is currently possible? Dentomaxillofac Radiol.2021, 50,20200375. [CrossRef]
- Housome, J.; Pilkington, G.; Mahon, J.; Boland, A.; Beale, S.; Kotas, E.; Renton, T.; Dickson, R. Prophylactic removal of impacted mandibular third molars: a systematic review and economic evaluation. Health Technol Assess. 2020, 24,1-116. [CrossRef]
- Ventä, I.; Murtomaa, H.; Ylipaavalniemi, P. A device to predict lower third molar eruption. Oral Surg Oral Med Oral Pathol Oral Radiol Endod. 1997,84,589-603. [CrossRef]
- Castella, P.; Albright, R.H.Jr.; Straja, S.; Tuncay, OC. Prediction of mandibular third molar impaction in the orthodontic patient from a panoramic radiograph. Clin Orthod Res. 1998, 1, 37-43. [CrossRef]
- Vranckx, M.; Ockerman, A.; Coucke, W.; Claerhout, E.; Grommen, B.; Miclotte, A.; Van Vlierberghe, M.; Politis, C.; Jacobs, R. Radiographic prediction of mandibular eruption and mandibular canal involvement based on angulation. Orthod Craniofac Res. 2019, 22, 118-123. [CrossRef]
- Begtrup, A.; Gronastoo, H.A.; Christensen, I.J.; Kjaer, I. Predicting lower third molar eruption on panoramic radiographs after cephalometric comparison of profile and panoramic radiographs. Eur J Orthod. 2013, 35, 460-6. [CrossRef]
- Lucchese, A. and Manuelli, M. Prognosis of the third molar eruption: a comparison of three predictive methods. Progress in Orthodontics. 2003, 4,4-19.
- Gallas-Torreira, M.; Valladares-Durán, M. and López-Ratón, M. Comparison between two radiographic methods used for the prediction of mandibular third molar impaction. Rev Port Estom Med Dent Cir Dent. 2014, 55, 207-13. [CrossRef]
- Hattab, F.N.; Alhaija, E.S. Radiographic evaluation of mandibular third molar eruption space. Oral Surg Oral Med Oral Pathol Oral Radiol Endod. 1999,88,285-91.
- Ghougassian S.S. and Ghafari J.G. Association between mandibular third molar formation and retromolar space. Angle Orthod. 2014, 84,946-50. [CrossRef]
- Santeiro-Hermida, S.; Gallas-Torreira, M. Radiographic prediction of the retention of the lower third molars. Rev Port Estom Med Dent Cir Dent. 2018, 59,140-144. [CrossRef]
- Santeiro-Hermida, S.; Fernández-Delgado, M.; Cernadas, E.; Gallas-Torreira, M. Validation analysis of Panoramic Dental Application (PDApp) Software as a tool for predicting third molar eruption based on panoramic radiograph images. Appl. Sci. 2023,13,2848. [CrossRef]
- Pepe, M.S. The statistical evaluation of medical tests for classification and prediction. Oxford University Press, 2003.
- Robin, X.T. Proc: an open-source package for R and S+ to analyze and compare ROC curves. BMC Bioinformatics 2011,12, 1-8. [CrossRef]
- Chopra, S.; Vranckx, M.; Ockerman, A.; Östgren, P.; Krüger-Weiner, C.; Benchimol, D.; Shujaat, S.; Jacobs, R. A retrospective longitudinal assessment of artificial intelligence-assisted radiographic prediction of lower third molar eruption. Sci Rep. 2024,10,994. [CrossRef]
- Vranckx, M.; Van Gerven, A.; Willems, H.; Vandemeulebroucke, A.; Ferreira, A.; Politis, C.; Jacobs R. Artificial Intelligence (AI)-driven molar angulation measurements to predict third molar eruption on panoramic radiographs. Int J Environ Res Public Health. 2020,17,3716. [CrossRef]
Figure 1.
Screenshot of the software PDApp with a panoramic radiography analyzed and the lateral panel opened. In the left molar, the red line represents the third molar diameter, the yellow line the retromolar space and the green lines the angle. The measures of the right molar are shown in the lateral panel.
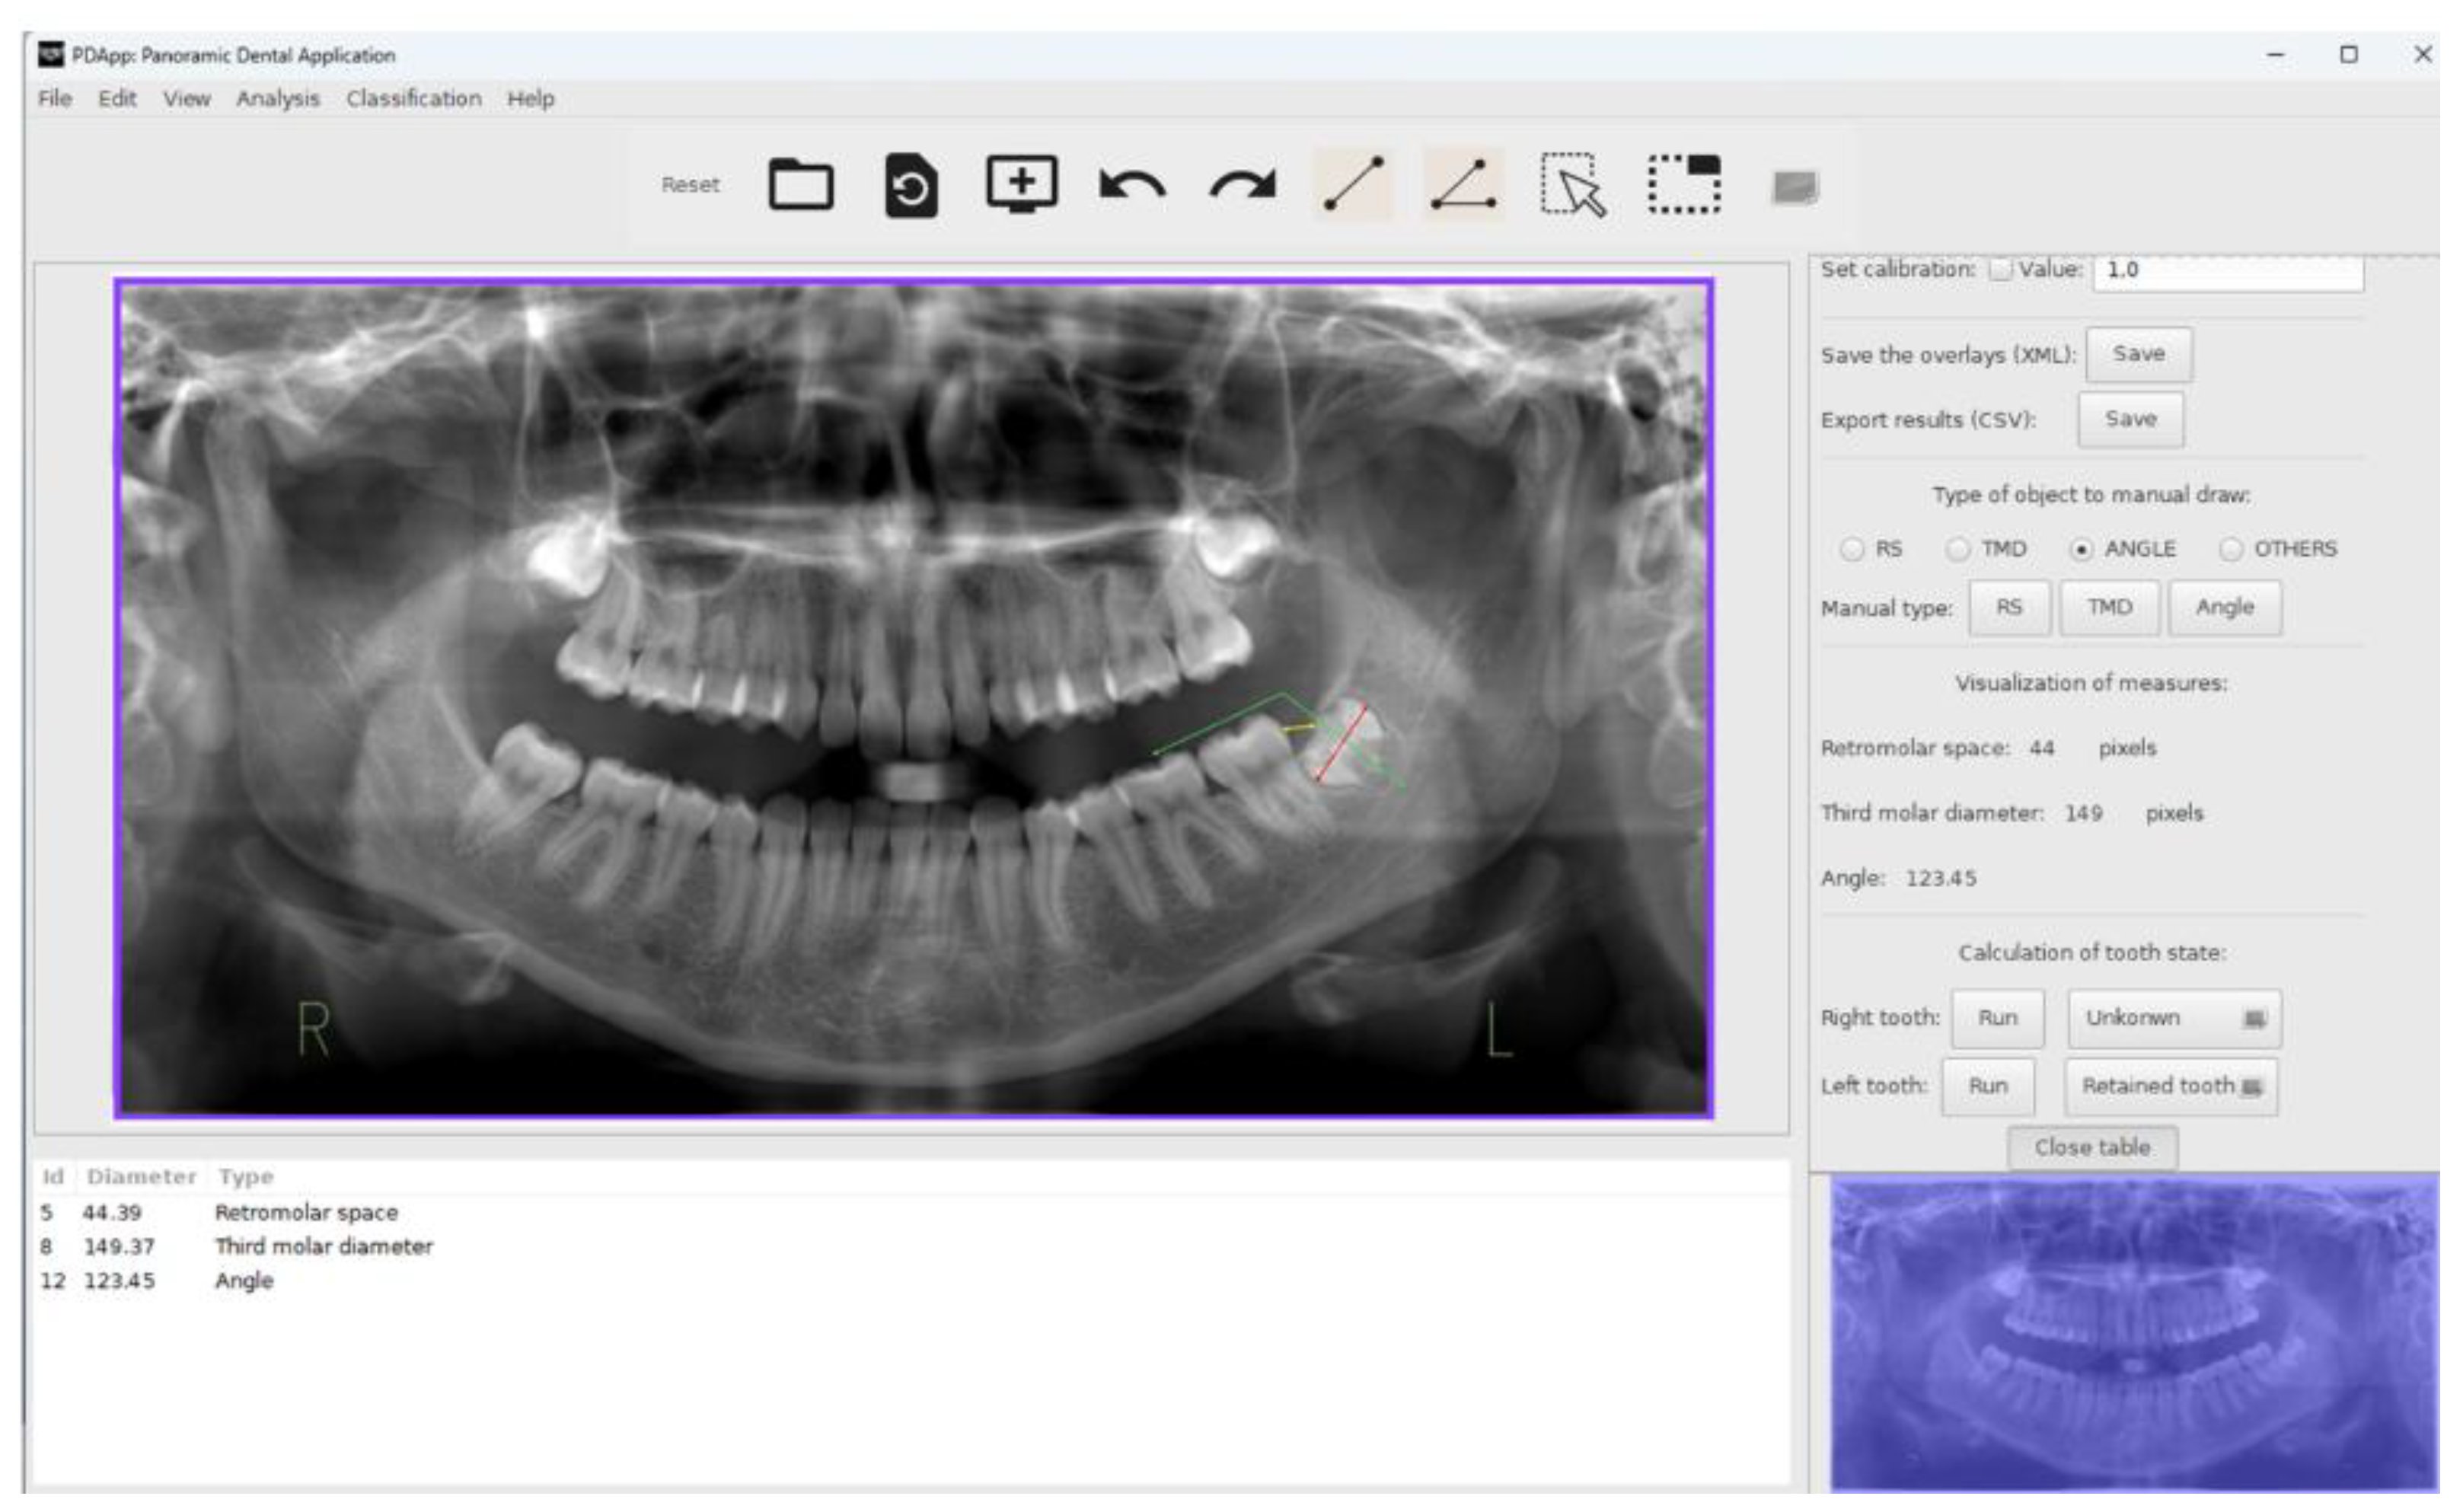
Figure 2.
Flowchart functionality of PDApp.
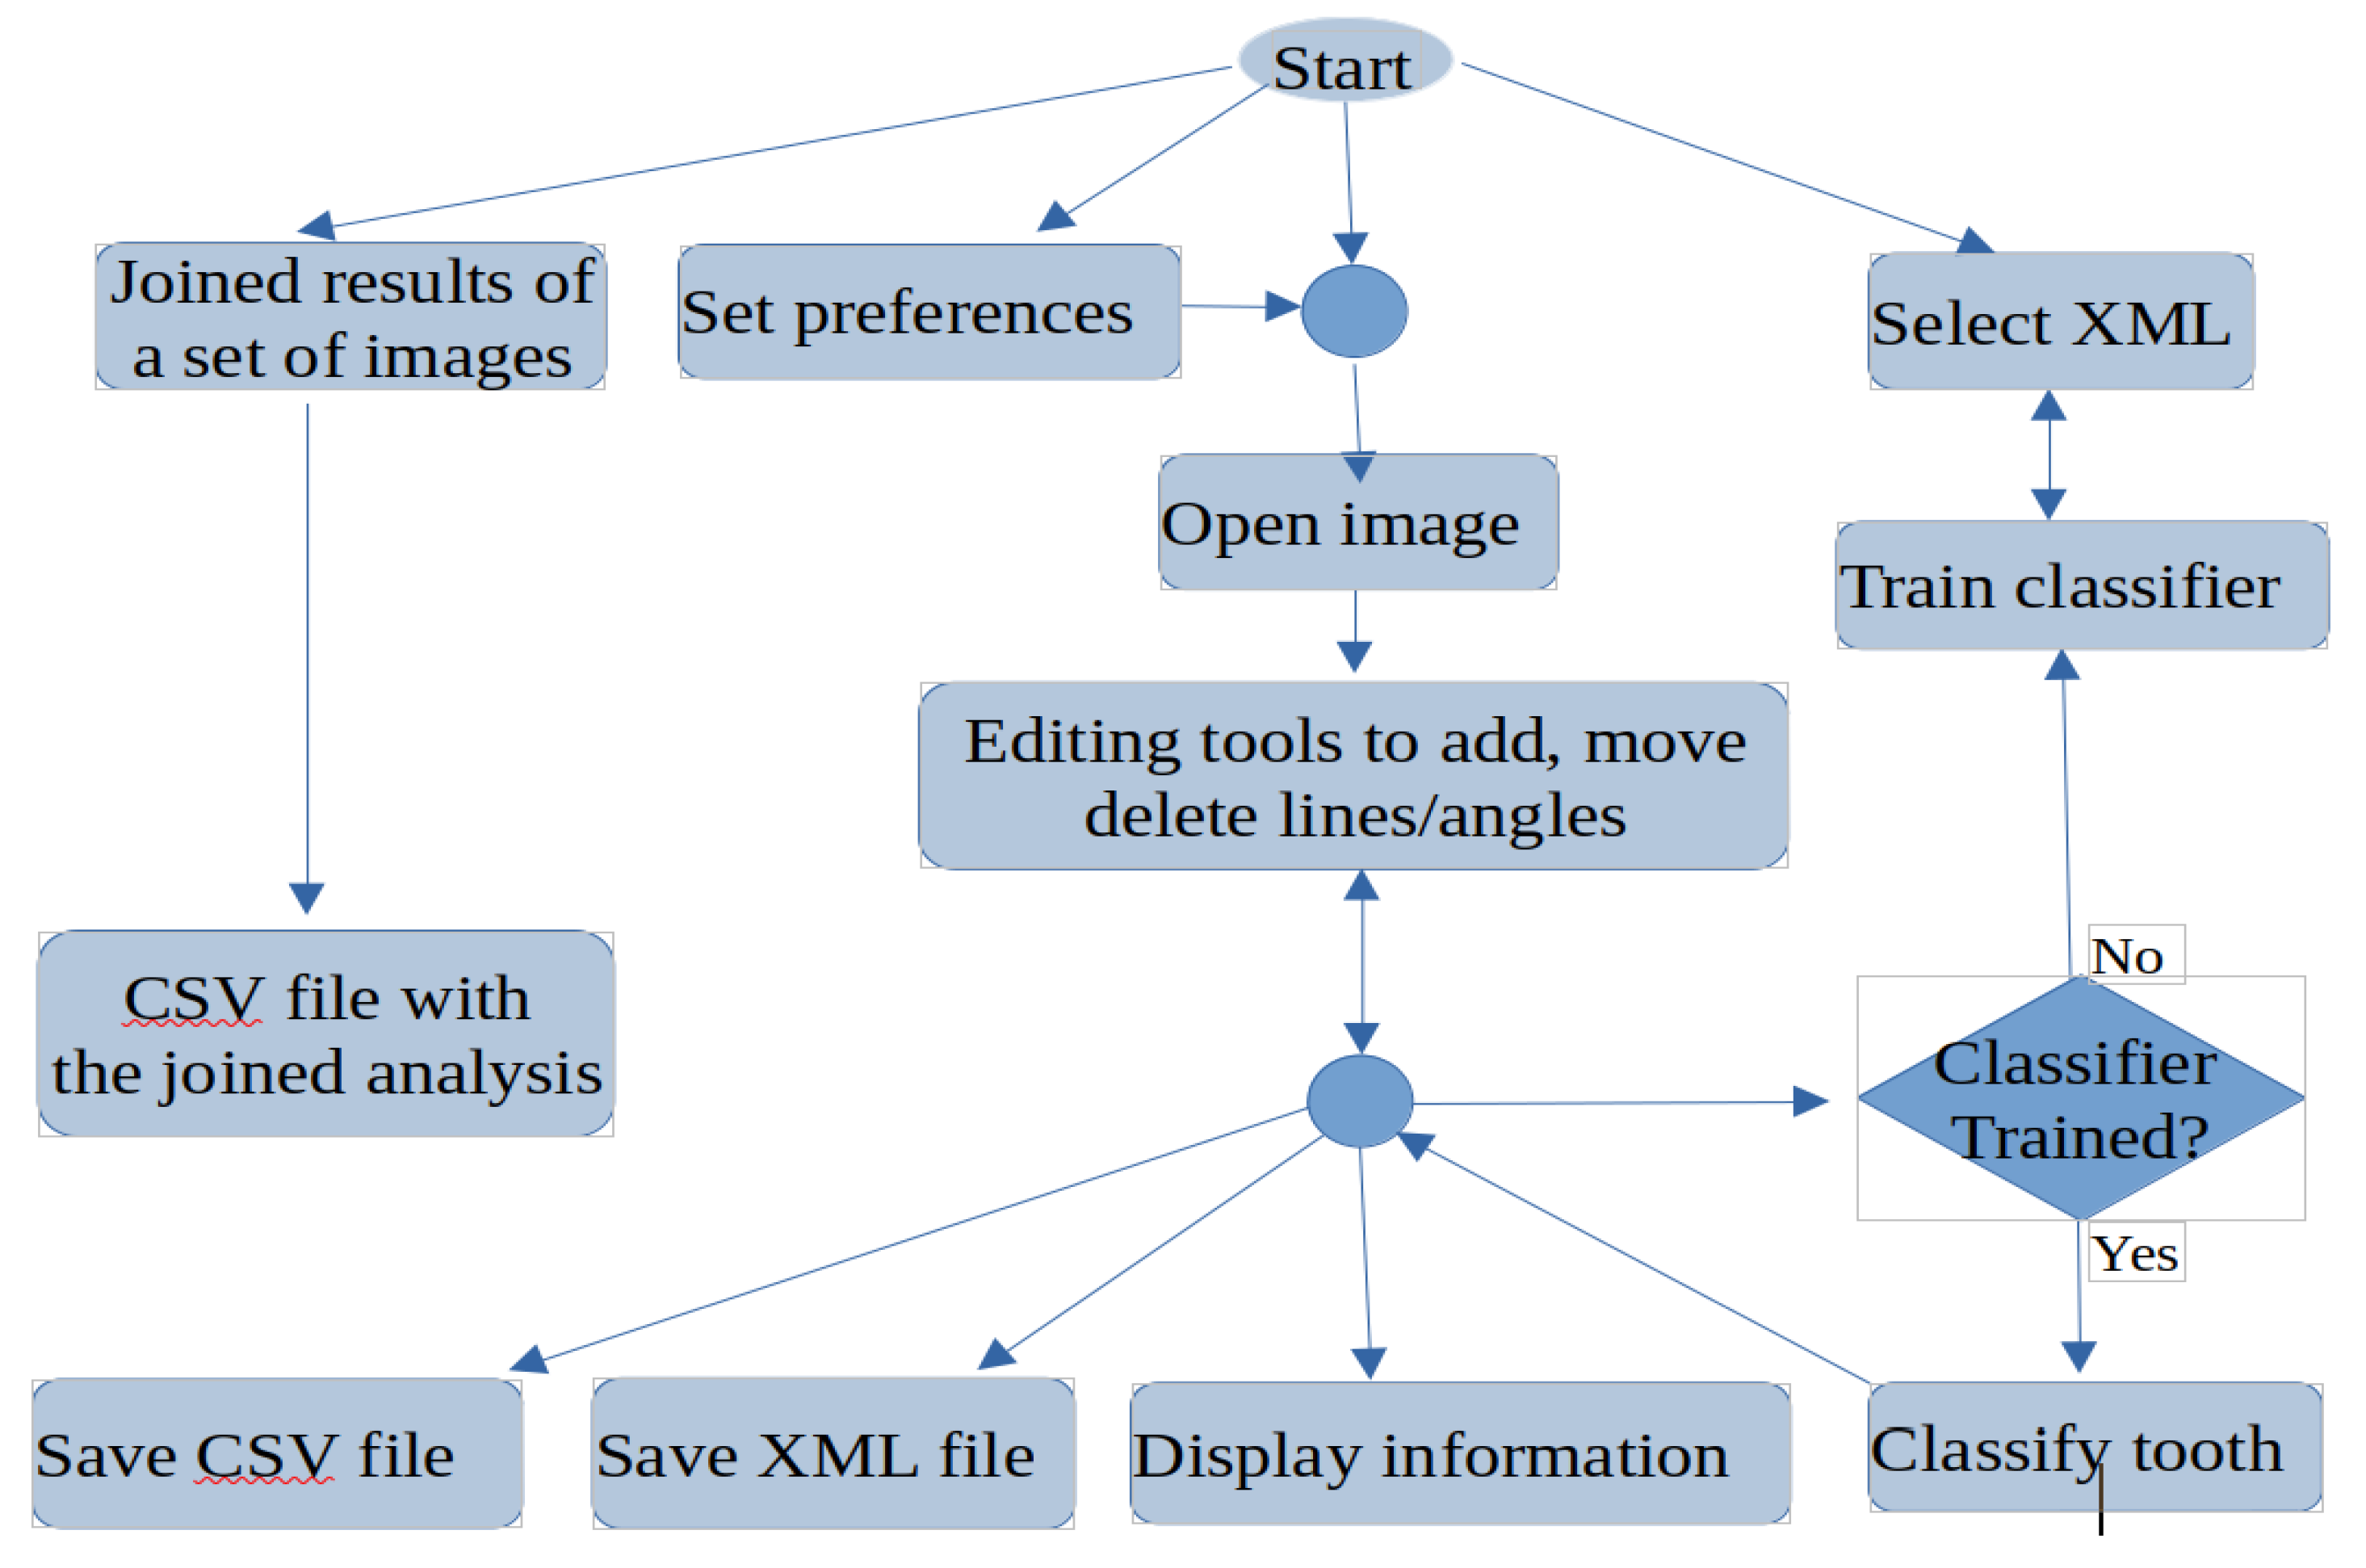
Figure 3.
Curva ROC associated to the RRC.
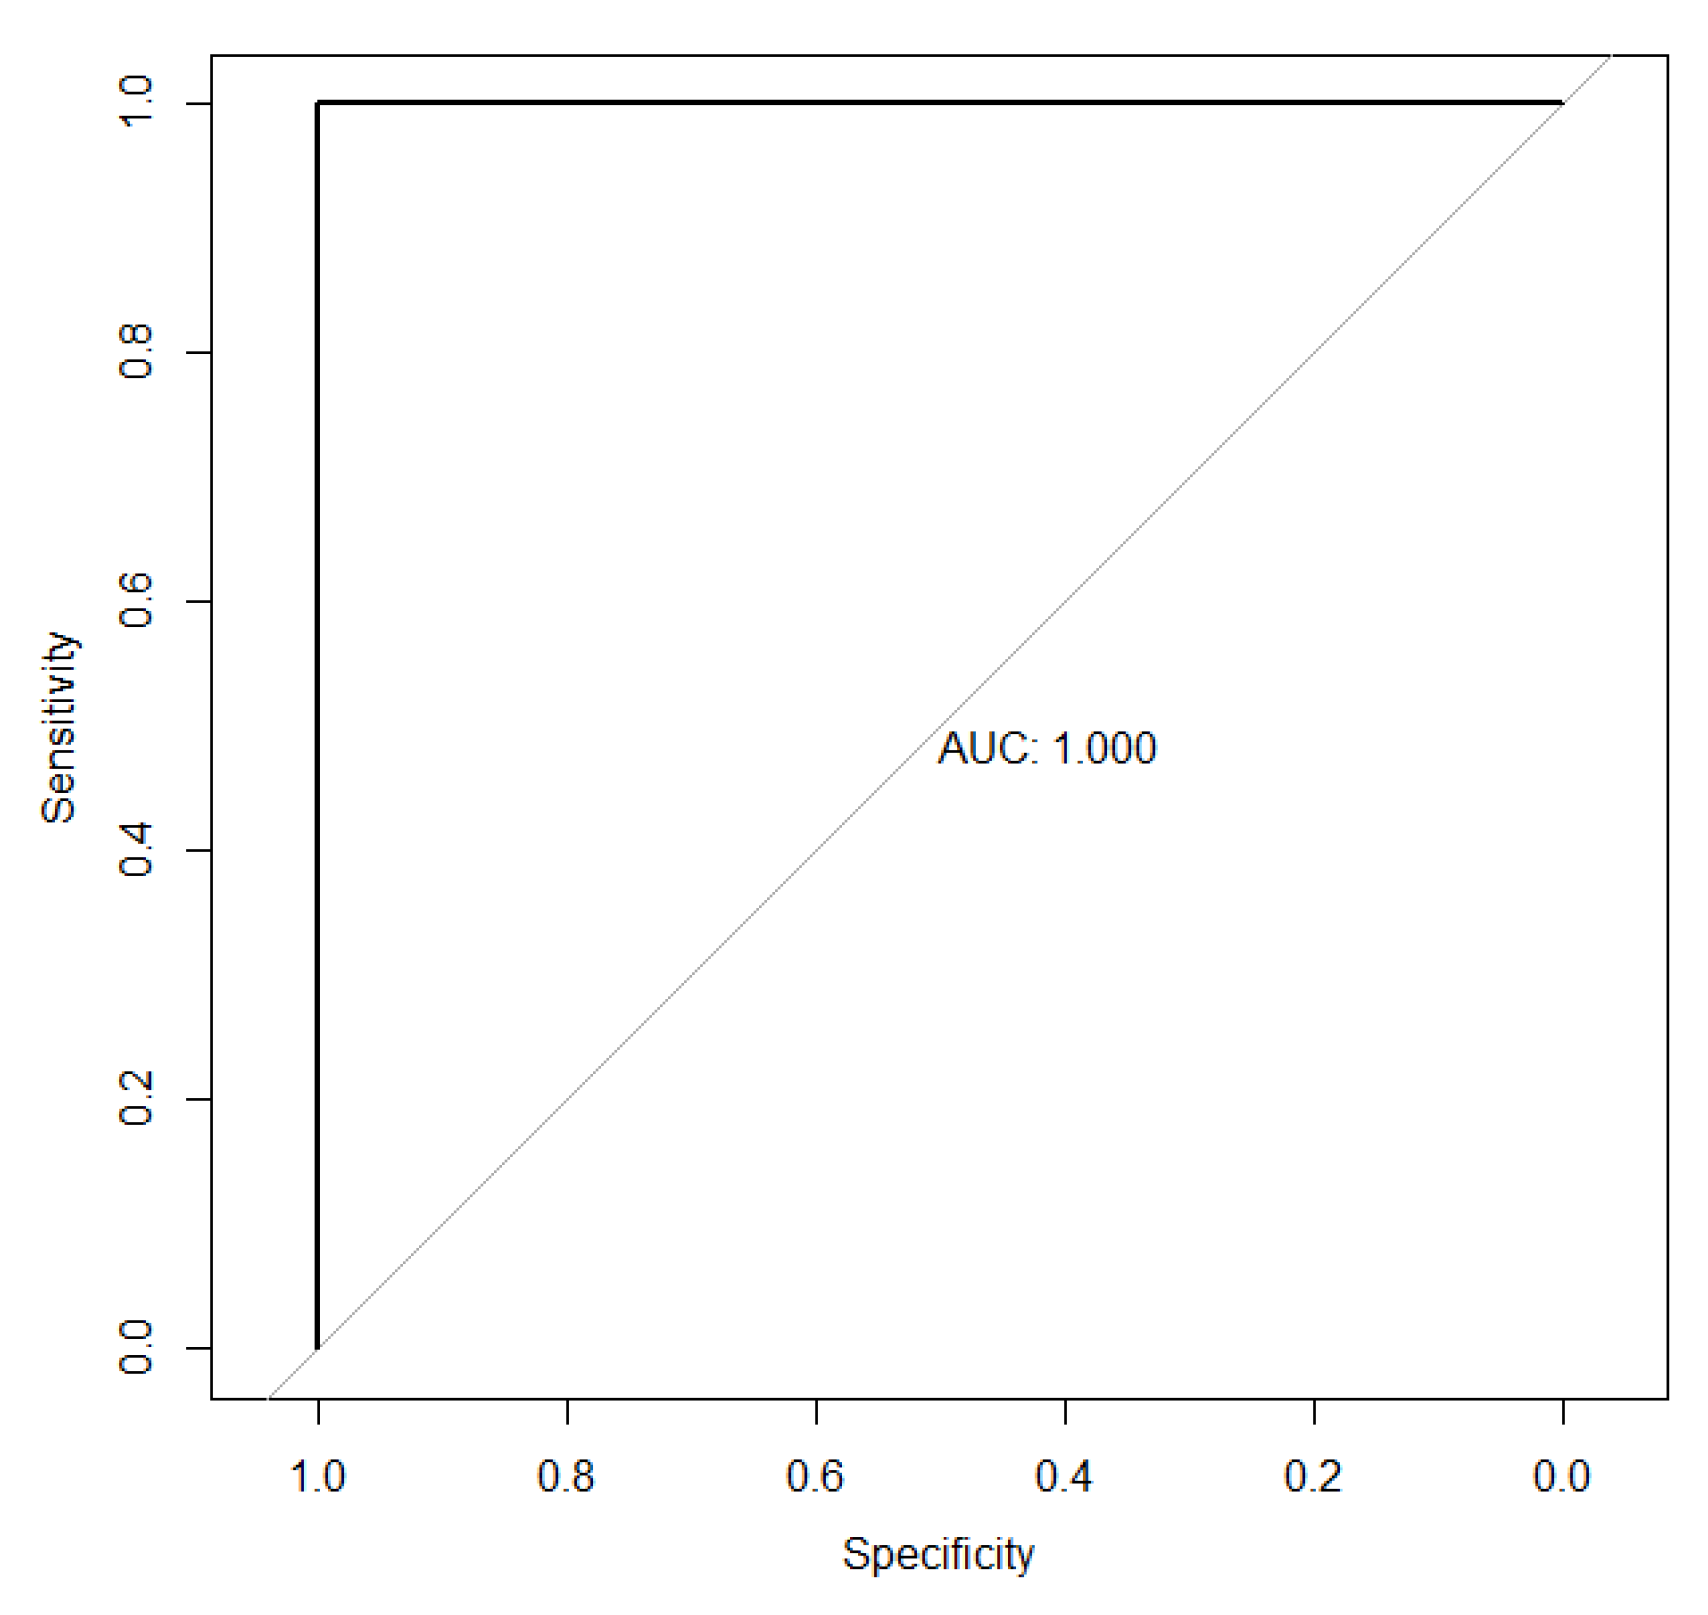

Table 1.
Main characteristic measures associated with the retention coefficient and the cosine of the eruption angle in three groups.
Table 1.
Main characteristic measures associated with the retention coefficient and the cosine of the eruption angle in three groups.
| RSO Group | E Group | RCO Group | ||||
|---|---|---|---|---|---|---|
| RRC | Cos erupθ | RRC | Cos erupθ | RRC | Cos erupθ | |
| Mínimum | 0.1620 | -0.9998 | 0.7313 | -0.9937 | 0.1352 | -0.9998 |
| First quartile | 0.3114 | -0.8961 | 1.0944 | -0.4626 | 0.2234 | -0.6070 |
| Median | 0.3845 | -0.3133 | 1.2835 | 0.0691 | 0.3032 | 0.0979 |
| Average | 0.3939 | -0.1858 | 1.3319 | 0.0659 | 0.3251 | 0.0705 |
| Third quartile | 0.4806 | 0.4202 | 1.5576 | 0.6669 | 0.4157 | 0.8592 |
| Maximum | 0.7135 | 0.9897 | 2.2047 | 0.9971 | 0.7109 | 0.9985 |
Table 2.
P-values associated with Kolmogorov-Smirnov type tests for pairwise comparative analysis of the RRC.
Table 2.
P-values associated with Kolmogorov-Smirnov type tests for pairwise comparative analysis of the RRC.
| RSO Group | RCO Grouo | E Group | |
|---|---|---|---|
| RSO Group | -- | ||
| RCO Group | -- | ||
| E Group | -- |
Disclaimer/Publisher’s Note: The statements, opinions and data contained in all publications are solely those of the individual author(s) and contributor(s) and not of MDPI and/or the editor(s). MDPI and/or the editor(s) disclaim responsibility for any injury to people or property resulting from any ideas, methods, instructions or products referred to in the content. |
© 2025 by the authors. Licensee MDPI, Basel, Switzerland. This article is an open access article distributed under the terms and conditions of the Creative Commons Attribution (CC BY) license (https://creativecommons.org/licenses/by/4.0/).
Copyright: This open access article is published under a Creative Commons CC BY 4.0 license, which permit the free download, distribution, and reuse, provided that the author and preprint are cited in any reuse.


