
Submitted:
01 December 2025
Posted:
05 December 2025
You are already at the latest version
Abstract
The paper presents a solution to the limited accuracy of automated diagnostics for retinal pathologies, such as diabetic retinopathy and age-related macular degeneration. These challenges arise from difficulties in modeling comorbidities, a reliance on paired multimodal data, and issues related to class imbalance. The proposed solution features a novel hierarchical deep learning architecture designed for multi-label classification of optical coherence tomography (OCT) data. This architecture facilitates cross-modal knowledge transfer from fundus images without the need for paired fundus images. It was accomplished through the modular specialization of the architecture and the application of contrast equalization, which creates a latent “bridge” between the OCT and fundus data. The results demonstrate that the proposed approach achieves high accuracy (macro-F1 score of 0.989) and good calibration (Expected Calibration Error of 2.1%) in classification and staging tasks. Notably, it eliminates the need for fundus images for diabetic retinopathy staging in 96.1% of cases and surpasses traditional monolithic architectures on the macro-AUROC metric.
Keywords:
optical coherence tomography
; diabetic retinopathy
; age-related macular degeneration
; diabetic macular edema
; deep learning
; hierarchical neural networks
; cross-modal learning
; multilabel classification
; contrastive learning
; medical imaging
; ophthalmology
; computer-aided diagnosis
; probability calibration
; domain adaptation
1. Introduction
Diabetic retinopathy (DR), including diabetic macular edema (DME), and age-related macular degeneration (AMD) are the leading causes of blindness and irreversible vision loss worldwide [1,2,3,4,5]. DR currently affects over 100 million people globally, with DME developing in 6–7% of individuals with diabetes mellitus (DM) [6,7]. As of 2021, the global prevalence of DR among patients with DM is 22.27% [6].
In turn, AMD is the leading cause of central vision loss in individuals aged 50 and older in developed countries [8,9]. Additionally, clinical observations reveal a high incidence of co-occurring diseases; for instance, the presence of DR significantly increases the risk of developing AMD [10]. DME can occur at any stage of diabetic retinopathy, including the proliferative stage (PDR). In specialized tertiary-level clinical cohorts, the prevalence of DME can reach approximately 20–30% [11,12].
In modern ophthalmology, Optical Coherence Tomography (OCT) is a crucial method for the morphological assessment of macular structures, providing micrometer resolution and enabling visualization of intraretinal architecture [13,14,15,16]. Meanwhile, color fundus photography remains the “gold standard” for staging DR according to the international classifications, such as the Early Treatment Diabetic Retinopathy Study (ETDRS) and the International Clinical Classification of Diabetic Retinopathy (ICDR) [17,18,19,20]. However, this specialization presents a practical challenge: for a comprehensive diagnosis, both OCT and fundus images of the same eye are necessary. In real clinical practice, obtaining both can be difficult due to technical, logistical, and economic limitations [20,21].
Current methods for automatically diagnosing retinal diseases using various imaging modalities encounter several significant limitations. For instance, traditional classification techniques that rely on the softmax function impose an artificial mutual exclusivity among classes, which is insufficient for accurately representing the comorbidity of DR, including DME and its combinations with AMD [22,23]. An alternative approach is to use a multi-target or multi-label formulation with independent sigmoid activations, which allows for the accurate representation of multiple diseases occurring simultaneously. However, this approach necessitates specialized loss functions and calibration [24,25,26,27]. Moreover, most modern methods depend on the availability of strictly paired OCT and fundus images for both training and testing [28,29,30]. Existing cross-modal methods exhibit significant performance degradation when the corresponding images are unavailable [31,32,33,34,35].
One additional limitation is the class imbalance and domain shifts present in medical data, which result in the systematic underrepresentation of rare but clinically significant conditions [36,37,38]. At the same time, variations in scanning parameters across different equipment manufacturers, such as Optovue, Zeiss, and Heidelberg, lead to domain shifts that can degrade algorithm performance when switching between scanners [39,40,41,42].
Monolithic Convolutional Neural Network (CNN) architectures often show inadequate probability calibration [43,44]. It implies that, even when the overall accuracy, measured by the Brier Score, reaches clinically significant levels due to specific calibration efforts, the Expected Calibration Error—a metric that assesses how well probabilities align with actual outcomes—can still be high. In fact, it may fluctuate by as much as 4–6% or more [43,44,45].
Existing solutions struggle to address the complex and interconnected challenges of ophthalmological diagnostics. Traditional architectures that rely on single modalities, such as convolutional neural networks (e.g., ResNet, EfficientNet, ConvNeXt) and Vision Transformers (e.g., ViT, Swin Transformer) [46,47,48,49], are limited because they cannot utilize complementary information from other modalities. They also tend to exhibit unstable performance when faced with domain shifts [50,51,52,53,54,55]. Current cross-modal approaches typically use encoder-decoder architectures for direct image transformation between modalities or rely on joint learning with shared representations [56,57]. However, these methods heavily depend on the availability of strictly paired data [58,59,60]. Contrastive learning techniques, such as SimCLR, CLIP, and MoCo, have proven effective for cross-modal representation learning [61,62,63]. Nonetheless, standard implementations of SimCLR require large batch sizes (ranging from 512 to 4096 examples), leading to significant computational demands [63,64,65]. Although momentum-based methods that utilize queues of negatives partially mitigate this issue, the challenge of adapting these approaches to medical data with limited pairing remains unresolved [66,67].
Thus, there are no systems capable of: correctly modeling disease comorbidity through multi-label staging with suitable regularizations; performing consistent staging of DR using OCT data when fundus images are unavailable; and maintaining high performance in the face of domain shifts and significant class imbalances that are typical of real clinical data.
To address the identified issues, the paper proposes a new approach to automated diagnosis of retinal diseases that leverages a hierarchical modular architecture with a cross-modal latent bridge. The solution combines a multi-label parent model with clinical-logical regularizers and specialized child models to stage the identified diseases. To handle the challenge of joint data analysis (pairing) between OCT and fundus images, cross-modal knowledge transfer is implemented through a two-stage scheme. The first stage involves preliminary contrastive alignment of latent spaces using a moment encoder and negative example queues. The second stage focuses on training a latent bridge using a multi-component loss function that includes both geometric and informational components.
Additionally, during development, we introduced prototypical regularization into the child modules to enhance the geometry of the latent space and improve robustness to class imbalance. We also implemented a comprehensive calibration and post-processing system that includes optimizing class-specific thresholds and applying clinical-logical rules.
2. Methods
The study implements a hierarchical modular system (HMS). After analyzing clinical needs and the limitations of existing approaches, we propose the following testable hypotheses:
Hypothesis 1: A hierarchical architecture with specialized child staging models will achieve higher accuracy in classifying AMD and DR stages by decomposition of a complex task into more manageable subtasks.
Hypothesis 2: A loss function that employs class-balanced weighting is more effective than the standard Binary Cross-Entropy (BCE) for a multi-label task with class imbalance in OCT images.
Hypothesis 3: Using a contrastive loss function allows for the training of a cross-modal OCT to fundus image bridge under conditions where strictly paired data is limited, and it will outperform alternative loss functions in terms of cross-modal alignment quality.
Hypothesis 4: Calibrating decision thresholds using the F1-optimization method across classes will reduce the expected model calibration error and enhance clinical applicability compared to using a fixed threshold of 0.5.
Hypothesis 5: The HMS system exhibits high stability across different scanners.
2.1. Overview of the System Architecture
The HMS system features a three-level hierarchical architecture that decomposes complex diagnostic tasks into specialized subtasks and merges their results through cross-modal representation alignment [68,69].
The problem is formulated as a multi-label classification task: for each class, an independent probability is predicted using a sigmoid model and binary cross-entropy. This approach allows for the simultaneous presence or absence of multiple diseases to be expressed [70,71,72].
After establishing a general diagnosis, the algorithm proceeds through a series of more detailed decision-making stages for the identified diseases. The basic (parent) multi-objective model is responsible for the initial classification of pathologies as either absent or present. Following this, specialized components perform their specific tasks within a narrower context, based on the outputs of the parent model. This approach enhances the system’s interpretability, aids in debugging, and improves its tolerance for errors [73,74].
Since OCT is widely regarded as the “gold standard” for diagnosing AMD and is essential for quantitatively assessing retinal thickness and DME [75,76], the AMD staging according to the AREDS is utilized in this work. In contrast, for staging DR, the most commonly used imaging modality is fundus photography, as the ETDRS and ICDR scales were developed explicitly for color retinography [77,78].
Following this, the architecture incorporates a fundus model for classifying DR stages. It also features a trainable latent “bridge” that translates characteristics from the OCT space into the fundus encoder’s latent space. This setup enables DR assessments even when a fundus image is unavailable. Thus, the architectural structure of the HMS system comprises four key components: a parent model for multi-target classification of OCT scans, an AMD model for staging, a fundus classification model that determines DR stages based on fundus images, and a cross-modal OCT-to-Fundus bridge [79].
To ensure the proper functioning of the latent bridge, a contrastive alignment of the OCT and fundus latent spaces is performed in advance. This process maximizes the similarity of positive pairs while dispersing negative pairs, thereby reducing the “modal gap” between the encoders. Contrastive learning formalizes this objective using the InfoNCE loss function. Simultaneously, the moment encoder and negative queue (MoCo) variants build a comprehensive, consistent dynamic dictionary of negative examples [79,80].
By using alignment and a trained bridge, the system can perform DR staging without fundus images. It achieves this by projecting the OCT embedding into the fundus space and then applying the fundus classifier head, which ensures alignment with the gold standard.
The diagram in Figure 1 illustrates the structure and data flow between the components of the HMS system.
2.2. Operation of HMS Components
For multi-label or multi-objective classification, BCE with focal boosting is used. In the multi-objective setting, each label is treated as an independent binary problem with logits and a sigmoid activation function [81].
The focal loss function reduces the contribution of well-classified examples and puts greater emphasis on complex and rare cases. It does this through the modifying factor , which effectively shifts the learning focus towards the less-frequent instances in the distribution. This approach enhances the model’s robustness to class imbalance [82]. In practical situations, imbalance can also be addressed by using class weights [83].
For a batch of N examples and labels {No diseases (NORM), AMD, DR, DME}, with logits and probabilities , where is the sigmoid function, the focal-weighted BCE is expressed as:
which is the standard form for multi-objective problems and naturally generalizes BCE to the case with a focusing factor [82].
To identify the most effective backbone architecture, a thorough study was conducted involving ResNet18, ResNet34, EfficientNet-B0, and ConvNeXt-Tiny. The findings are detailed in the Results section. All architectures were pretrained on ImageNet, facilitating the transfer of essential low- and mid-level features and thereby enhancing convergence on medical images [84]. The pretrained weights for grayscale input were obtained by averaging the first convolutional layer’s weights across the RGB channels.
2.2.1. The Parent Model
The parent model is designed as a multi-label classifier. In this approach, the softmax function is replaced with independent sigmoid activations, using binary cross-entropy for each label. The sigmoid function, defined as , converts the logit (the neural network’s raw output) into a probability ranging from 0 to 1 for each class independently. This method effectively models disease comorbidity while avoiding the artificial exclusivity characteristic of softmax approaches [68,69,70,71,72].
The penalty, , is designed to reduce the co-activation of AMD and DR. This measure was introduced as a heuristic specific to the dataset because there are few or no clear examples of cases where AMD and DR are co-labeled in the original sample. Its purpose is to avoid inconsistent decisions during the deployment phase of the current version of the system.
This setup facilitates the joint modeling of multiple states while implementing clinical-logical regularizations that ensure consistency between predictions of “normal” and “pathological” conditions. To leverage the benefits of binary cross-entropy for multi-objective problems, we use Focal-BCE with label smoothing. This approach includes a focusing factor that enhances the contribution of “difficult” examples, addressing issues related to class imbalance.
To enhance clinical reliability, decision threshold calibration based on per-class F1-optimization was implemented [85]. This approach yielded a set of asymmetric thresholds that achieved an optimal balance between precision and recall for each diagnosis.
The detailed operating principle, routing logic to specialized modules, and interpretability requirements are outlined in the Supplementary Materials (SM Section 4.1). Detailed class metrics, confidence intervals, and the evaluation protocol are provided in Table SM-5.
2.2.2. The Child Model
To refine the diagnosis of AMD into five stages, a hybrid feature fusion approach is employed. This method combines local features extracted from a CNN with global context from the parent model and the prototypical geometry of the latent space. This approach aligns with multi-modal and multi-source feature-fusion practices, which consistently enhance quality by effectively integrating diverse features [86].
The central innovation involves transferring knowledge of DR stages from fundus images to OCT. Initially, the feature-extraction models, referred to as the parent model and the Fundus model, are trained separately. The Fundus model classifies DR stages according to international standards into four categories: MILD_NPDR, MODERATE_NPDR, SEVERE_NPDR, and PDR. Its architecture uses a convolutional encoder similar to that of the parent model, but is specifically adapted for grayscale images.
The cross-modal bridge from OCT to Fundus is trained in two stages. First, a contrastive alignment of the latent spaces is performed to narrow the modal gap. It is followed by a small regression projector that ensures a consistent projection into the fundus space, allowing for staging of DR even when paired data is not available. This modular approach enhances the solution’s clinical explainability, manageability, and scalability, enabling independent improvements to individual components without disrupting the overall architecture.
The detailed operating principles of the child modules and the bridge are outlined in the Supplementary Material (SM Section 4.2). Additionally, the staging metrics, an analysis of common errors, and the impact of prototypal regularization are presented in Tables SM 6 and 7.
3. Results
This chapter outlines the experimental program established to assess the HMS system. It encompasses the development of a multimodal dataset simulating clinical conditions, a comparison of baseline convolutional architectures, threshold calibration, and an evaluation of the parent model and specialized staging modules. Additionally, it includes a cross-modal bridge analysis that investigates probability calibration, computational efficiency, and verification across different scanners.
3.1. Creating a Data Set
The experimental dataset is a comprehensive multimodal collection of medical images comprising 8,159 images across two primary ophthalmic imaging modalities. The dataset mirrors clinical practice, featuring 4,047 OCT images with detailed multi-label annotations and 4,112 fundus images. A significant aspect of this dataset is the limited yet crucial component of paired OCT and fundus images: there are only 128 pairs, representing 3.1% of the total dataset.
To ensure comprehensive coverage of various pathological conditions, the dataset was compiled from three distinct sources. The first source is an in-house clinical dataset obtained from the Optimed Laser Vision Restoration Center in Ufa, Russia, which constitutes the majority of the OCT images, totaling 2,185 images. The second source is the publicly available Optical Coherence Tomography Image Database (OCTID), developed by the University of Waterloo [87]. The third source is the OCT-AND-EYE-FUNDUS-DATASET, created specifically for the study of DME and DR. This collection includes 1,548 fundus images and 1,113 macular OCT images [88].
The final dataset, including class distribution across modalities, imbalance metrics, source descriptions, and a five-fold cross-validation strategy among patients, is presented in the Supplementary Materials (SM Section 4.3, Tables SM-1 and SM-2).
A methodologically key feature is the use of strict patient-identifier separation, which prevents information leakage between the training and test sets and ensures a fair assessment of the system’s generalization ability on new patient data.
3.2. A Comparison of Backbone Architectures for Choosing a Base Classifier Model
To systematically evaluate and justify the selection of a backbone convolutional architecture, a comprehensive comparative study was conducted on four modern architectures: ResNet18, ResNet34, EfficientNet-B0, and ConvNeXt-Tiny. These architectures were chosen for their common use in medical imaging and for the balance they offer among accuracy, computational efficiency, and the number of trainable parameters [89,90].
To maintain methodological rigor, all models were trained using a uniform experimental protocol, with the same optimization hyperparameters and data augmentation strategies applied consistently across all models. The optimizer used was AdamW, set with a learning rate of and a cosine annealing scheduler [91,92].
The mini-batch size consisted of 64 images. To enhance the model’s robustness, augmentation techniques were applied, including random horizontal flips, rotations, and brightness and contrast adjustments within [93,94,95].
For comparison, we utilized unified macro-F1 and micro-F1 metrics, which are standard aggregates for multi-class classification. These metrics are calculated using micro- and macro-averaging of Precision, Recall, and F1 scores across different classes [96]. Additionally, we employed multi-class ROC-AUC with binarization (where p > 0.5) [97]. The dataset was split into training, validation, and test sets at 80/10/10. We selected BCEWithLogitsLoss (binary cross-entropy with logits) as the loss function [98,99]. The details, which include Macro/Micro-F1 metrics, Hamming loss, Jaccard index, and computational efficiency metrics, are provided in the Supplementary Materials (SM Section 4.4, Table SM-3).
As a result, architectures designed for compactness and efficient scaling, specifically the EfficientNet family, outperformed deep residual networks in terms of discrimination performance while using significantly fewer parameters. In clinical applications, it is crucial to balance classification accuracy with computational demands, as the selected architecture impacts inference latency. A methodologically significant finding is that the advantages of compact architectures were consistent across both the validation set and cross-validation, demonstrating their stability in generalization. The chosen backbone architecture served as the foundation for developing all subsequent components of the hierarchical system.
3.3. Calibrating Thresholds to Compensate for Class Imbalance
To address class imbalance in a multi-label classification setting, it is crucial to optimize class-specific thresholds [100]. The standard threshold of 0.5 is often inadequate, particularly in cases of severe class imbalance. To tackle this limitation, a systematic comparison of four adaptive threshold calibration methods was conducted. Details can be found in the Supplementary Materials, specifically in Section 4.5, Table SM-4.
The F1-optimization methodology, applied independently to each class, demonstrated superior performance to other approaches, providing an optimal balance between sensitivity and specificity across disease prevalences. This strategy employs an aggressive detection threshold of 0.15 for AMD to minimize the risk of missing cases in the late stages of the disease, when the possibility of vision loss is exceptionally high. In contrast, a more conservative approach for DME is used, with a threshold of 0.78, to prevent unnecessary interventions in patients with significant comorbidities [101]. The optimal thresholds obtained were as follows: NORM = 0.29, AMD = 0.15, DR = 0.67, and DME = 0.78. These thresholds reflect adjustments for class imbalance in the dataset, where AMD accounts for over 50% of the OCT samples, while DME accounts for only 8.6% of the cases.
Methodologically, this approach utilizes the principle of cost-sensitive learning. The implementation of individually calibrated thresholds resulted in a notable performance improvement compared to the baseline threshold of 0.5.
3.4. Outcomes of the Parent Model Operation
The parent multi-label classification model demonstrated high performance on the stratified test set, effectively identifying multiple comorbid pathologies within a single diagnostic cycle. Detailed metrics are available in the Supplementary Materials, specifically in Section 4.6, Table SM-5.
The AMD class exhibited ideal performance, with precision, recall, and F1-score values of 1.00. It is primarily attributed to its prevalence in the dataset and the prominent morphological features visible on OCT. The Normal class (NORM) achieved a recall of 1.00 and a precision of 0.993, indicating only one false-positive result out of 136 cases. It aligns with a conservative screening strategy that emphasizes minimizing the risk of overdiagnosis. The DME class recorded a recall of 0.978, corresponding to one missed case out of 50. It may be due to borderline cases involving minimal intraretinal fluid that are on the threshold of the clinical criteria for DME with central involvement [102]. Meanwhile, the DR class achieved a recall of 0.990, with two false-negative results, both associated with MILD_NPDR and presenting a single microaneurysm. It reflects the limited information value of OCT for staging DR [103,104].
The performance distribution emphasizes the importance of adaptive calibration tailored to each specific diagnosis.
3.5. Results from the Specialized AMD Staging Module
The specialized module developed for diagnosing AMD showed impressive diagnostic performance, achieving an overall accuracy of . Detailed results can be found in the Supplementary Materials, specifically in SM Section 4.7, Table SM-6. A significant observation is that late-stage AMD, characterized by clear morphological changes such as atrophy, subretinal neovascularization, and fibrosis, is classified with nearly perfect accuracy. However, distinguishing between the early and intermediate stages poses a systematic challenge due to the continuous nature of disease progression and the subjective boundaries between these stages, even among experts. This challenge highlights the inherent uncertainty of the AREDS clinical classification scheme.
A key finding of this study is that the model shows high Precision at all stages, which is crucial for reducing false-positive diagnoses of late-stage conditions that require aggressive treatment. The performance achieved surpasses previously published results for five-class AMD staging using OCT images.
3.6. The Results from the Specialized Module for Staging DR
The developed model for classifying DR stages using fundus images achieved an overall accuracy of . A significant methodological advancement is that the model can stage DR according to the international ICDR classification based solely on synthesized fundus representations derived from OCT scans. It demonstrates a successful cross-modal transfer of diagnostically significant features.
The performance distribution by stage reveals a distinct pattern: intermediate stages of nonproliferative retinopathy can be classified with high accuracy, driven by clear morphological features such as microaneurysms and hemorrhages. However, borderline cases between stages require expert verification because they rely on subjective clinical criteria. Importantly, the performance achieved is comparable to that of models trained directly on real fundus images. For detailed metrics, please refer to the Supplementary Materials, specifically Section 4.8, Table SM-7.
3.7. The Cross-Modal Bridge and Analysis of Cross-Modal Inconsistencies
The contrastive alignment of OCT and fundus images was achieved using the NT-Xent (Normalized Temperature-scaled Cross-Entropy) loss function, along with a pulse encoder set to m=0.999 and a negative queue containing 512 samples [105]. The training process exhibited a two-phase dynamic typical of contrastive learning. During the first 20 epochs, the loss function decreased rapidly on the training set. Subsequently, the Recall@1 metric, which measures the accuracy of retrieving the first nearest neighbor, gradually improved, reaching its highest value at the 54th epoch. The peak value of Recall@1=0.411 indicates a successful alignment of the latent-space geometries of the two modalities, facilitating reliable cross-modal image retrieval [106].
The cross-modal bridge between OCT and fundus images was trained using a multi-component loss function that combined seven regularization components: mean squared error (MSE), cosine closeness (Cosine), Kullback-Leibler divergence (KL-divergence), InfoNCE contrastive loss, prototype loss (Prototype), maximum mean discrepancy (MMD), and correlation alignment (CORAL) [107,108,109]. The training process is described in detail in the Supplementary Material, specifically in SM Section 4.9, Table SM-10. A significant improvement in the fundus consistency score, which increased from 0.815 to 0.984, occurred between epochs 18 and 30. It indicates a qualitative shift in the bridge’s ability to generate semantically consistent representations. These results demonstrate that the multi-component learning strategy not only facilitates geometric alignment of feature spaces but also achieves a high degree of semantic correspondence between OCT and fundus imaging modalities, which is crucial for subsequent cross-modal diagnostic tasks related to retinal diseases [110].
An ablative study (with detailed results available in the Supplementary Materials, SM Section 4.9, Table SM-10) highlights the importance of contrastive alignment. The main methodological finding is that information-theoretic components, such as InfoNCE and KL-divergence, significantly improve the quality of representation alignment. In contrast, geometric components such as MSE and Cosine play a vital yet less prominent role in maintaining metric consistency. Removing any of these components results in a statistically significant decline in performance, demonstrating the synergistic effect of optimizing multiple components and underscoring the need to balance the various aspects of representation alignment.
To evaluate the quality of cross-modality transfer between OCT and fundus representations, it is essential to identify cases in which the bridge model struggles to project OCT into the fundus representation space accurately. The main challenges include image quality artifacts, physiological variations at the boundaries of clinical staging criteria, and the anatomical limitations of each modality’s field of view. It is important to understand that these discrepancies do not indicate algorithm failures; instead, they highlight a fundamental incompleteness in the information provided by one modality compared to the other.
Quantitative analysis shows that the proportion of cases with significant discrepancies is less than 4% of the paired data, indicating the method’s overall stability. However, the identified issues highlight several critical categories of clinical situations that require additional expert verification. Further information regarding this research step can be found in the Supplementary Materials, specifically in SM Section 4.9, Table SM-11, and Figure SM-1.
3.8. Calibration Assessment, Risk Interpretation in Clinical Scenarios, and Computational Efficiency
The calibration evaluation of the HMS system shows it has high reliability for probabilistic predictions in clinical use. The Expected Calibration Error is significantly below the 5% threshold commonly accepted in medical literature, which distinguishes between well-calibrated and poorly calibrated models. Importantly, the calibration is consistent across a wide range of predicted probabilities, ensuring that the results are interpretable for both highly sensitive cases and borderline situations.
Experiments to assess computational efficiency were conducted on a hardware configuration comprising an NVIDIA RTX 3060 GPU and a Ryzen 7 3700X CPU. The modular organization allows tasks to be separated by specialization and executed independently or in a pipeline, thereby improving portability, interpretability, and scalability across different clinical scenarios. The full pipeline processes an OCT volume of 128 B-scans in 3.15 s on the GPU, with an average latency of 24.6 ms per image, meeting real-time requirements for visualization and not limiting the clinical workflow throughput [113]. A description of the tests is provided in the Supplementary Materials, SM Section 4.10, Figure SM-2, Table SM-12.
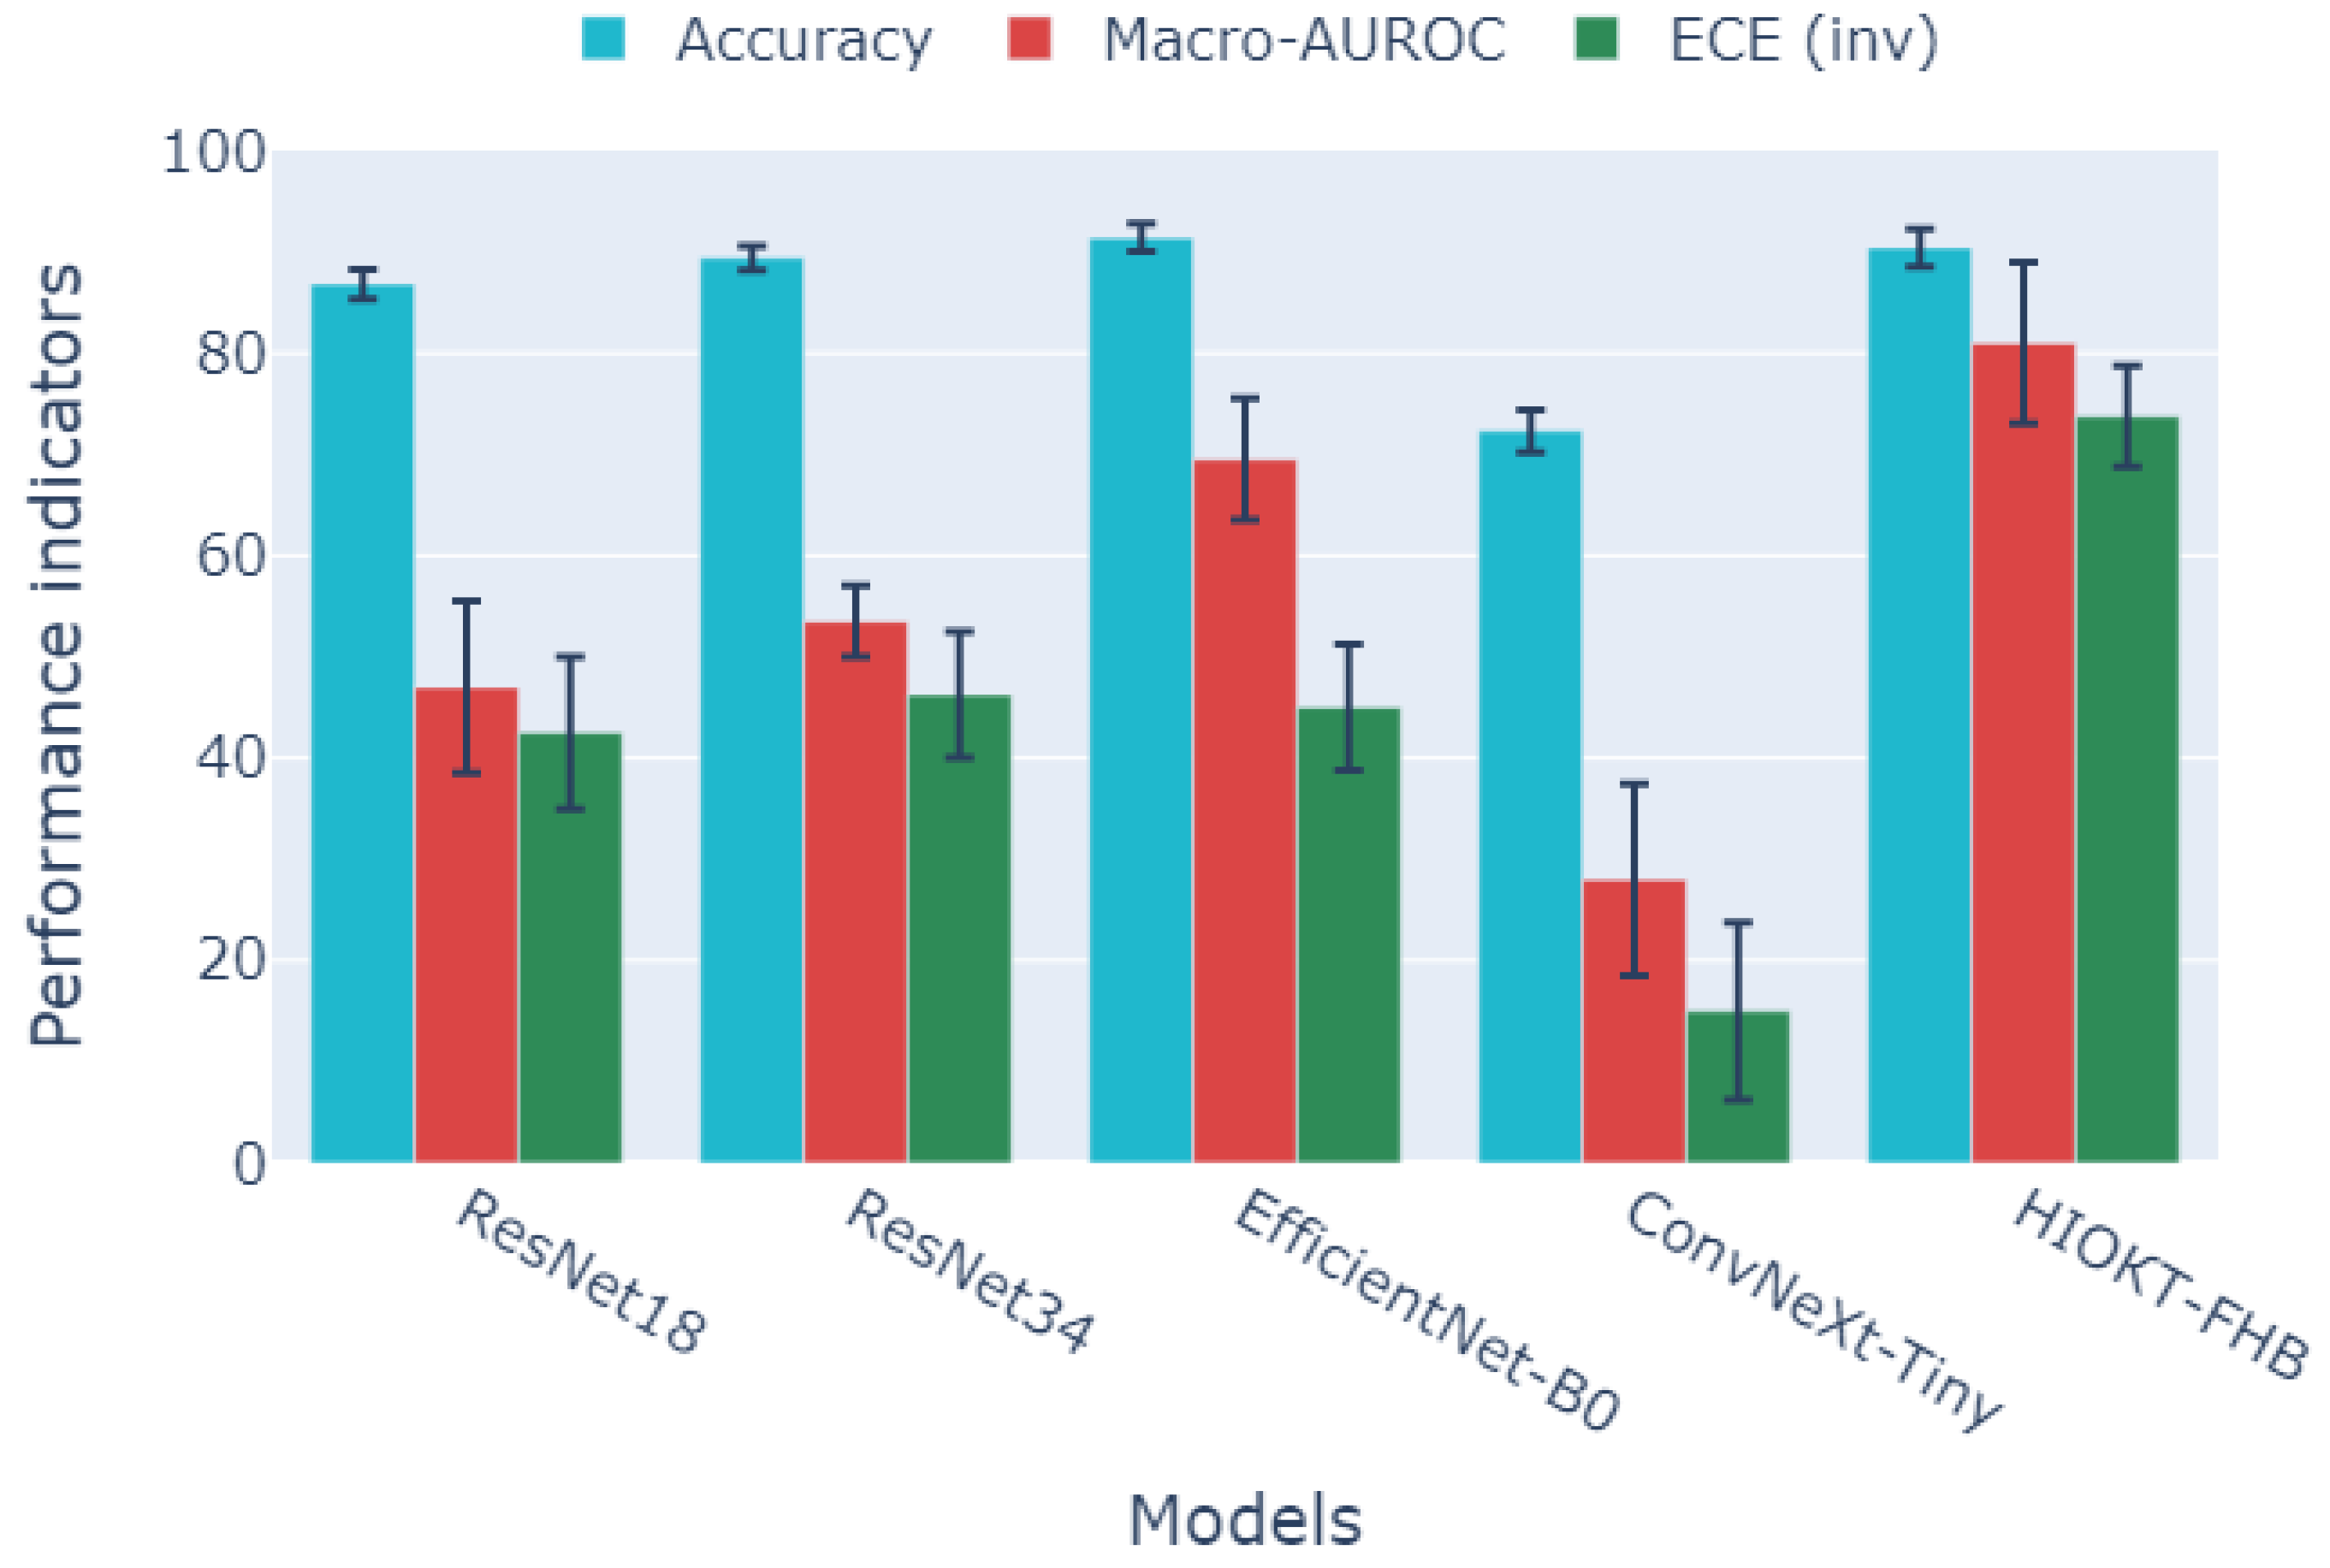
3.9. Comparative Analysis of Model Effectiveness in Diagnosis and Staging
To present the different metrics in Figure 2, they have been scaled to 0–100, with higher values indicating better performance.
Models from the ResNet, ConvNeXt, and EfficientNet families were compared to HMS in a two-stage diagnostic and staging task. The finding that EfficientNet-B0 achieves the highest peak accuracy but does not perform as well as HMS on macro-AUROC and ECE highlights the well-documented issue of overconfidence in modern CNNs. This distinction emphasizes the difference between optimizing for accuracy and achieving high-quality probabilistic calibration [111].
The HMS model demonstrates superior performance compared to other variants in macro-AUROC and calibration, while maintaining similar accuracy. It indicates a trade-off between probabilistic reliability and peak accuracy, favoring the hierarchical approach. Macro-AUROC averages across all classes and is more resilient to class imbalance. The HMS’s advantage in this metric suggests that it offers better overall class separability in a multi-class setting. Additionally, a low ECE indicates a closer alignment between predicted confidence and the actual rates of correct predictions, which is essential for clinical decision-making under uncertainty. The application of the HMS system surpasses the direct use of standard CNNs for the multi-class classification and staging of AMD, DR, and DME. In contrast, CNNs exhibit an ECE of 4.3–5.3%, a finding corroborated by studies on the calibration of deep neural networks in medical imaging [100,112].
3.10. Cross-Scan Validation and Robustness to Domain Shifts
To evaluate the generalizability of the HMS system across various hardware configurations, cross-scanner validation was performed using a clinical dataset from the Optimed Laser Vision Restoration Center in Ufa, Russia. This dataset consisted of 2,185 OCT images. The cross-domain validation studies, summarized in the Supplementary Materials, specifically in SM Section 4.11, Table SM-13.
The results reveal an asymmetric pattern of cross-scan generalization. Transferring from Avanti XR to REVO NX achieves significantly higher accuracy (86.1%) and discriminatory power (AUROC 0.896). In contrast, the reverse transfer shows a noticeable decline in performance, with accuracy at 74.7% and AUROC at 0.769. The systematic advantage of HMS over the best-performing baseline method, EfficientNet-B0, by 7.2 to 7.3 percentage points in both directions highlights the hierarchical architecture’s improved robustness to domain variations. This finding aligns with existing evidence supporting the effectiveness of multi-stage and adaptive approaches for cross-domain generalization. While performance degradation during transfers between scanners is inevitable due to differences in optical characteristics, resolution, noise patterns, and image-acquisition parameters, the hierarchical approach significantly reduces this degradation. It achieves this by allowing for modular specialization and contrast alignment.
Essential for clinical application, the system’s performance on external source data remains clinically acceptable without retraining or fine-tuning, demonstrating sufficient generalization for deployment in multi-center scenarios.
4. Discussion
The performance of the HMS hierarchical modular architecture demonstrates its superiority over traditional monolithic approaches. This architecture combines a multi-target parent model, specialized staging modules, and a cross-modality bridge, effectively modeling comorbidity through independent sigmoid outputs and focal-weighted BCE with class-balanced coefficients. Compared with a strong single-stage baseline model, HMS achieves comparable peak accuracy, improved global separability (macro-AUROC), and enhanced probability calibration. These factors are crucial for ensuring the clinical reliability of decisions made under uncertainty (for detailed metrics and tables, refer to SM Section 4.4–4.6). A significant distinction between HMS and studies such as VisionTrack is its ability to perform DR staging using OCT rather than relying on fundus imaging. It is made possible through a two-stage cross-modality alignment and a latent bridge, thus removing the impractical need for strictly paired multimodal data in clinical settings. It supports the validity of the first hypothesis outlined in the Methods chapter.
Using class-balanced weights and focal BCE enhances sensitivity to rare pathologies in multi-label settings. This improvement is demonstrated by higher overall metrics and increased robustness to class imbalance (as detailed in SM Section 4.5–4.6). When combined with modular decomposition, these methods produce significantly better performance across various classes. This approach accounts for epidemiological factors and the expression of visual features, reflecting real clinical frequencies and helping reduce the omission of rare conditions. Additionally, the representation geometry generated in child modules, along with prototypal regularization, further enhances interclass separability and robustness against the “long tail” of distributions. This outcome confirms the validity of the second hypothesis presented in the Methods chapter.
The third hypothesis suggests that a contrastive loss function can facilitate the training of a cross-modality bridge between OCT and fundus images without requiring strictly paired data. It is supported by evidence demonstrating the staging of DR via projection into a latent fundus space and subsequent classification according to the ICDR standards (for additional information, refer to SM Section 4.9). The two-stage approach employed—comprising NT-Xent with a momentum encoder and a queue of negative samples, alongside a regression projector with a multi-component loss function—ensures robust spatial alignment and effective transfer of diagnostically significant features across modalities. For clinical safety, a cosine similarity threshold of 0.8 was established. This results in 3.9% of cases being flagged for manual verification due to artifacts and borderline manifestations, thereby minimizing the risk of false positives while allowing for automation in 96.1% of cases (illustrations of inconsistencies can be found in SM Section 4.9).
Class-specific F1 threshold calibration significantly reduces calibration error and enhances clinical applicability compared to a fixed threshold of 0.5. This improvement is evidenced by a higher macro-F1 score of 0.989, compared to 0.923 at the 0.5 threshold, and a lower ECE of , in contrast to the typical 4–6% seen with uncalibrated CNNs. Calibration curves and summaries are available in Section 4.10 of the Supplementary Materials. Furthermore, the improved calibration remains effective across a wide range of probabilities, which enhances the interpretability of risk in both high-sensitivity and borderline cases. It is crucial for making clinical decisions under uncertainty. Overall, these findings confirm the validity of the cost-sensitive postprocessing approach for tasks characterized by pronounced class imbalance and unequal error costs, thereby supporting the fourth hypothesis outlined in the Methods chapter.
The fifth hypothesis regarding the robustness of transfers between OCT scanners is partially confirmed: the system maintains a clinically acceptable level of accuracy during transfers, although asymmetric degradation is observed (86.1% when transferring from Avanti XR to REVO NX, and 74.7% from REVO NX to Avanti XR). HMS consistently outperforms EfficientNet-B0 by 7.2–7.3 percentage points in both directions, highlighting the benefits of hierarchy and prototypical regularization for cross-domain generalization (see SM Section 4.11 for full tables). The remaining decrease in within-domain performance can be attributed to differences in optical parameters, noise-reduction algorithms, and resolution across manufacturers (Optovue vs. Optopol), necessitating further domain adaptation.
Compared to systems focused on single-modality scenarios and metadata integration (e.g., VisionTrack), HMS addresses more general cross-modality transfer without paired data and explicitly evaluates calibration and robustness to domain shifts, thereby improving clinical validity and the transferability of results. The presented integral indices (macro-F1=; micro-F1=; Jaccard index=) should be interpreted with caution due to differences in datasets and protocols, but they confirm the competitiveness of the proposed architecture for multi-target OCT classification. Links to detailed protocols and partitions are provided in the Supplementary Materials for reproducibility and independent verification.
The system combines high accuracy, calibrated probabilities, and modular explainability to support a range of scenarios, including screening for primary AMD, DR, and DME. It also aids in AMD staging according to the AREDS guidelines, enables cross-modality DR staging without fundus images, and facilitates DME monitoring through interpretable risk scores. The entire processing pipeline can analyze 128 B-scans in approximately 3.15 seconds on a GPU, yielding about 24.6 milliseconds per image. Each module can operate independently or in tandem within the pipeline. The system delivers a combined performance of 7.72 GFLOPs and uses 37.0 million parameters, making it suitable for real-time applications. However, CPU performance may limit functionality in scenarios without specialized hardware (refer to SM Section 4.10 for exact profiles). These performance characteristics make the system practical for integration into a clinical workflow, with the flexibility to adapt to different resource availability.
Key limitations of the study include the limited availability of paired OCT-Fundus data, with only 128 pairs for bridge training. There is also a severe class imbalance and the need for an penalty due to the lack of clear examples of comorbidity between AMD and DR. Additionally, the limited field of view in OCT scans limits the detection of peripheral lesions, and the labeling was conducted within a single center without multicenter consensus. These factors contribute to the observed inconsistencies and uneven transfer between scanners, underscoring the need for further validation and retraining across larger, more diverse patient cohorts. The accompanying materials include an analysis of common failures and criteria for flagging cases that require expert verification (see SM Section 4.9).
Future steps will involve multi-domain contrastive learning with adversarial alignment, the accumulation of paired data addressing real-world AMD and DR comorbidity to eliminate the penalty, the implementation of uncertainty assessment methods (such as ensembles, Monte Carlo dropout, and Bayesian approaches), and the development of attention mechanisms to enable visually explainable decisions. This program aims to enhance the system’s transferability, trustworthiness, and usability in multi-center and resource-constrained environments.
5. Conclusions
The HMS system demonstrates that a hierarchical modular architecture with a cross-modality latent bridge achieves high accuracy (macro-F1=, micro-F1=) and calibration (ECE=) for multi-target classification and staging of AMD, DR, and DME, even without paired OCT and fundus data. A significant contribution of this system is its ability to perform OCT-based DR staging using a contrast-aligned latent bridge, thereby eliminating reliance on fundus images in 96.1% of cases. Additionally, class-specific F1-threshold optimization addresses class imbalance, outperforming monolithic CNNs in macro-AUROC and calibration, while maintaining comparable accuracy. Cross-scan validation revealed moderate robustness (86.1% accuracy for Avanti XR→REVO NX, 74.7% for the reverse direction), with a systematic 7.2–7.3 p.p. outperformance over EfficientNet-B0. However, an absolute performance drop of 15.7 p.p. indicates the need for further adaptation to domain shifts.
Supplementary Materials
The following supporting information can be downloaded at the website of this paper posted on Preprints.org, Figure SM-1: Scatterplot of cosine similarity versus Fundus consistency for the cross-modal bridge for determining DR stages; Figure SM-2: Calibration curve and contributions to Expected Calibration Error (ECE); Table SM-1: Dataset Parameters; Table SM-2: Characteristics of the experimental dataset with class distribution and statistical parameters; Table SM-3: Comparison of backbone architectures for the parent model (multi-label classification on OCT); Table SM-4: Comparison of threshold calibration methods; Table SM-5: Multi-objective performance metrics of the parent model on the test sample; Table SM-6: Multi-objective metrics of the AMD model on the test sample; Table SM-7: Multi-objective metrics of the Fundus model on the test sample; Table SM-8: Progress of Contrastive Learning; Table SM-9: Cross-modal Bridge Learning Progress; Table SM-10: Ablative Study of Loss Function Components; Table SM-11: Cross-modal Discrepancy Analysis; Table SM-12: Computational efficiency of system components; Table SM-13: Cross-scan validation
Author Contributions
Conceptualization, E.A.L.; methodology, E.A.L.; software, E.A.L.; validation, G.M.I. and T.R.M.; formal analysis, G.M.I.; investigation, E.A.L. and G.M.I.; resources, T.R.M. and G.M.I.; data curation, G.M.I.; writing—original draft preparation, E.A.L.; writing—review and editing, E.A.L., G.S.V., E.P.T. and R.V.K.; visualization, E.A.L.; supervision, E.P.T. and G.M.I.; project administration, T.R.M. and R.V.K.; funding acquisition, E.P.T. and R.V.K. All authors have read and agreed to the published version of the manuscript.
Funding
This work was supported by the Ministry of Science and Higher Education of the Russian Federation
within the state assignment for UUST (agreement № 075-03-2024-123/1 dated 15 February 2024) and conducted in
the research laboratory "Sensor systems based on integrated photonics devices" of the Eurasian Scientific and
Educational Center
Institutional Review Board Statement
Not applicable.
Informed Consent Statement
Not applicable.
References
- Bhatwadekar, A. D.; Shughoury, A.; Belamkar, A.; Ciulla, T. A. Genetics of Diabetic Retinopathy, a Leading Cause of Irreversible Blindness in the Industrialized World. Genes 2021, vol. 12(no. 8), 1200. [Google Scholar] [CrossRef]
- Benhamza, M.; Dahlui, M.; Said, M. A. Determining direct, indirect healthcare and social costs for diabetic retinopathy management: a systematic review. BMC Ophthalmol 2024, vol. 24(no. 1), 424. [Google Scholar] [CrossRef]
- Cao, H.; Zhang, Y.; Zhang, N.; Ma, X. Clinical trial landscape of diabetic retinopathy: global advancements and future directions. International Journal of Surgery 2025. [Google Scholar] [CrossRef]
- Sakini, A. S. A. Diabetic macular edema (DME): dissecting pathogenesis, prognostication, diagnostic modalities along with current and futuristic therapeutic insights. Int J Retina Vitreous 2024, vol. 10, 83. [Google Scholar] [CrossRef]
- Stahl, A. The Diagnosis and Treatment of Age-Related Macular Degeneration. Dtsch Arztebl Int 2020, vol. 117(no. 29–30), 513–520. [Google Scholar] [CrossRef]
- Teo, Z. L. Global Prevalence of Diabetic Retinopathy and Projection of Burden through 2045: Systematic Review and Meta-analysis. Ophthalmology 2021, vol. 128(no. 11), 1580–1591. [Google Scholar] [CrossRef]
- Cheung, N.; Cheung, C. M. G.; Talks, S. J.; Wong, T. Y. Management of diabetic macular oedema: new insights and global implications of DRCR protocol V. Eye 2020, vol. 34(no. 6), 999–1002. [Google Scholar] [CrossRef]
- Ratnapriya, R.; Chew, E. Y. Age-related macular degeneration – clinical review and genetics update. Clin Genet 2013, vol. 84(no. 2), 160–166. [Google Scholar] [CrossRef]
- Wong, W. L. Global prevalence of age-related macular degeneration and disease burden projection for 2020 and 2040: a systematic review and meta-analysis. The Lancet Global Health 2014, vol. 2(no. 2), e106–e116. [Google Scholar] [CrossRef]
- Lin, H.-T. The Association between Diabetic Retinopathy and Macular Degeneration: A Nationwide Population-Based Study. Biomedicines 2024, vol. 12(no. 4), 727. [Google Scholar] [CrossRef]
- Patel, A. J.; Downes, K.; Davis, A.; Das, A. Are Proliferative Diabetic Retinopathy and Diabetic Macular Edema two different disease processes? A Retrospective Cross-sectional Study. Invest. Ophthalmol. Vis. Sci. 2012, vol. 53(no. 14), 377. [Google Scholar]
- Wang, W.; Sun, G.; Xu, A.; Chen, C. Proliferative diabetic retinopathy and diabetic macular edema are two factors that increase macrophage-like cell density characterized by en face optical coherence tomography. BMC Ophthalmology 2023, vol. 23, 46. [Google Scholar] [CrossRef]
- Flaxel, C. J. Age-Related Macular Degeneration Preferred Practice Pattern®. Ophthalmology 2020, vol. 127(no. 1), P1–P65. [Google Scholar] [CrossRef]
- Bouma, B. E. Optical coherence tomography. Nat Rev Methods Primers 2022, vol. 2, 79. [Google Scholar] [CrossRef]
- Metrangolo, C. OCT Biomarkers in Neovascular Age-Related Macular Degeneration: A Narrative Review. J Ophthalmol 2021, vol. 2021, 9994098. [Google Scholar] [CrossRef] [PubMed]
- Virgili, G. Optical coherence tomography (OCT) for detection of macular oedema in patients with diabetic retinopathy. Cochrane Database Syst Rev 2015, vol. 2015(no. 1), CD008081. [Google Scholar] [CrossRef] [PubMed]
- Attiku, Y. Comparison of diabetic retinopathy severity grading on ETDRS 7-field versus ultrawide-field assessment. Eye (Lond) 2023, vol. 37(no. 14), 2946–2949. [Google Scholar] [CrossRef] [PubMed]
- Xiao, Y. Assessment of early diabetic retinopathy severity using ultra-widefield Clarus versus conventional five-field and ultra-widefield Optos fundus imaging. Sci Rep 2023, vol. 13(no. 1), 17131. [Google Scholar] [CrossRef]
- Wilkinson, C. P. Proposed international clinical diabetic retinopathy and diabetic macular edema disease severity scales. Ophthalmology 2003, vol. 110(no. 9), 1677–1682. [Google Scholar] [CrossRef]
- Kumari, S.; Venkatesh, P.; Tandon, N.; Chawla, R.; Takkar, B.; Kumar, A. Selfie fundus imaging for diabetic retinopathy screening. Eye 2022, vol. 36(no. 10), 1988–1993. [Google Scholar] [CrossRef]
- Fenner, B. J.; Wong, R. L. M.; Lam, W.-C.; Tan, G. S. W.; Cheung, G. C. M. Advances in Retinal Imaging and Applications in Diabetic Retinopathy Screening: A Review. Ophthalmol Ther 2018, vol. 7(no. 2), 333–346. [Google Scholar] [CrossRef] [PubMed]
- Prawira, R.; Bustamam, A.; Anki, P. Multi Label Classification Of Retinal Disease On Fundus Images Using AlexNet And VGG16 Architectures. 2021 4th International Seminar on Research of Information Technology and Intelligent Systems (ISRITI), Dec. 2021; pp. 464–468. [Google Scholar] [CrossRef]
- Ju, L. Synergic Adversarial Label Learning for Grading Retinal Diseases via Knowledge Distillation and Multi-Task Learning. IEEE Journal of Biomedical and Health Informatics 2021, vol. 25(no. 10), 3709–3720. [Google Scholar] [CrossRef] [PubMed]
- Nair, A. T.; A. K. M., N. Disease Grading of Diabetic Retinopathy using Deep Learning Techniques. 2022 6th International Conference on Computing Methodologies and Communication (ICCMC), Mar. 2022; pp. 1019–1024. [Google Scholar] [CrossRef]
- Zang, P. DcardNet: Diabetic Retinopathy Classification at Multiple Levels Based on Structural and Angiographic Optical Coherence Tomography. IEEE Trans Biomed Eng 2021, vol. 68(no. 6), 1859–1870. [Google Scholar] [CrossRef] [PubMed]
- Nakayama, L. F. BRSET: A Brazilian Multilabel Ophthalmological Dataset of Retina Fundus Photos. PLOS Digital Health 2024, vol. 3(no. 7), e0000454. [Google Scholar] [CrossRef]
- Sarki, R.; Ahmed, K.; Wang, H.; Zhang, Y. Automated detection of mild and multi-class diabetic eye diseases using deep learning. Health Inf Sci Syst 2020, vol. 8(no. 1), 32. [Google Scholar] [CrossRef]
- Sükei, E. Multi-modal representation learning in retinal imaging using self-supervised learning for enhanced clinical predictions. Sci Rep 2024, vol. 14(no. 1), 26802. [Google Scholar] [CrossRef]
- Xu, Z. Enhancing pathological myopia diagnosis: a bimodal artificial intelligence approach integrating fundus and optical coherence tomography imaging for precise atrophy, traction and neovascularisation grading. British Journal of Ophthalmology 2025. [Google Scholar] [CrossRef]
- GAMMA challenge: Glaucoma grAding from Multi-Modality imAges. Medical Image Analysis 2023, vol. 90, 102938. [CrossRef]
- Hirsch, E.; Dawidowicz, G.; Tal, A. MedCycle: Unpaired Medical Report Generation via Cycle-Consistency. In Findings of the Association for Computational Linguistics: NAACL; Association for Computational Linguistics: Mexico City, Mexico, 2024; Volume 2024, pp. 1929–1944. [Google Scholar] [CrossRef]
- Sükei, E. Multi-modal representation learning in retinal imaging using self-supervised learning for enhanced clinical predictions. Sci Rep 2024, vol. 14(no. 1), 26802. [Google Scholar] [CrossRef]
- DDA-Net: Unsupervised cross-modality medical image segmentation via dual domain adaptation. Computer Methods and Programs in Biomedicine 2022, vol. 213, 106531. [CrossRef]
- Zhao, Z. “UOPSL: Unpaired OCT Predilection Sites Learning for Fundus Image Diagnosis Augmentation,” Sept. 2025. Accessed: Sept. 16, 2025. Available online: https://www.semanticscholar.org/paper/UOPSL%3A-Unpaired-OCT-Predilection-Sites-Learning-for-Zhao-Zhao/965bc2638a8df8abd665a7106b50d4d6fd5181a6.
- Chen, W.; Liu, M. I. Y.; Wang, C.; Zhu, J.; Li, M. I. G.; Lin, S. M. I. L. “Cross-Modal Causal Intervention for Medical Report Generation,” 2023. 2025. Available online: https://www.semanticscholar.org/paper/Cross-Modal-Causal-Intervention-for-Medical-Report-Chen-Liu/f818e71f883aa8eb515331b01e24ba3530968664.
- Ishwaran, H.; O’Brien, R. Commentary: The Problem of Class Imbalance in Biomedical Data. J Thorac Cardiovasc Surg 2021, vol. 161(no. 6), 1940–1941. [Google Scholar] [CrossRef]
- Zhao, Y.; Wong, Z. S.-Y.; Tsui, K. L. A Framework of Rebalancing Imbalanced Healthcare Data for Rare Events’ Classification: A Case of Look-Alike Sound-Alike Mix-Up Incident Detection. J Healthc Eng 2018, vol. 2018, 6275435. [Google Scholar] [CrossRef] [PubMed]
- Kumar, V. Addressing Binary Classification over Class Imbalanced Clinical Datasets Using Computationally Intelligent Techniques. Healthcare (Basel) 2022, vol. 10(no. 7), 1293. [Google Scholar] [CrossRef] [PubMed]
- Koch, V. “Noise Transfer for Unsupervised Domain Adaptation of Retinal OCT Images,” in Medical Image Computing and Computer Assisted Intervention – MICCAI 2022, vol. 13432. In Lecture Notes in Computer Science; Wang, L., Dou, Q., Fletcher, P. T., Speidel, S., Li, S., Eds.; Springer Nature Switzerland: Cham, 2022; vol. 13432, pp. 699–708. [Google Scholar] [CrossRef]
- Heinke, A. Cross-instrument optical coherence tomography-angiography (OCTA)-based prediction of age-related macular degeneration (AMD) disease activity using artificial intelligence. Sci Rep 2024, vol. 14, 27085. [Google Scholar] [CrossRef] [PubMed]
- Munk, M. R. OCT-angiography: A qualitative and quantitative comparison of 4 OCT-A devices. PLoS One 2017, vol. 12(no. 5), e0177059. [Google Scholar] [CrossRef] [PubMed]
- Guan, H.; Liu, M. Domain Adaptation for Medical Image Analysis: A Survey. IEEE Trans Biomed Eng 2022, vol. 69(no. 3), 1173–1185. [Google Scholar] [CrossRef] [PubMed]
- Vijayan, M.; Prasad, D. K.; Srinivasan, V. Advancing Glaucoma Diagnosis: Employing Confidence-Calibrated Label Smoothing Loss for Model Calibration. Ophthalmol Sci 2024, vol. 4(no. 6), 100555. [Google Scholar] [CrossRef]
- Dawood, T. Uncertainty aware training to improve deep learning model calibration for classification of cardiac MR images. Med Image Anal 2023, vol. 88, 102861. [Google Scholar] [CrossRef]
- Guo, Y.; Liu, A.; Zhu, X.; Wang, Y. Calibration of Machine Learning Models for Medical Imaging: A Comprehensive Survey. IEEE Access 2023, vol. 11, 45789–45803. [Google Scholar] [CrossRef]
- He, K.; Zhang, X.; Ren, S.; Sun, J. Deep Residual Learning for Image Recognition. 2016 IEEE Conference on Computer Vision and Pattern Recognition (CVPR), June 2016; pp. 770–778. [Google Scholar] [CrossRef]
- Tan, M.; Le, Q. V. EfficientNet: Rethinking Model Scaling for Convolutional Neural Networks. In Proceedings of the 36th International Conference on Machine Learning, PMLR, 2019; pp. 6105–6114. [Google Scholar]
- Liu, Z. A ConvNet for the 2020s. 2022 IEEE/CVF Conference on Computer Vision and Pattern Recognition (CVPR), June 2022; pp. 11966–11976. [Google Scholar] [CrossRef]
- Dosovitskiy, A. An Image is Worth 16x16 Words: Transformers for Image Recognition at Scale. International Conference on Learning Representations, 2021. [Google Scholar]
- Deng, J. ImageNet: A large-scale hierarchical image database. 2009 IEEE Conference on Computer Vision and Pattern Recognition, June 2009; pp. 248–255. [Google Scholar] [CrossRef]
- Denouden, T. Improving Transfer Learning Through Deep Convolutional Neural Network Ensembles. 2019 International Joint Conference on Neural Networks (IJCNN), July 2019; pp. 1–8. [Google Scholar] [CrossRef]
- Raghu, M. Transfusion: Understanding Transfer Learning for Medical Imaging. Advances in Neural Information Processing Systems 2019, vol. 32. [Google Scholar]
- Morais, A. S. Optimizing Deep Learning for Image Sequence Recognition. IEEE Trans Pattern Anal Mach Intell 2021, vol. 43(no. 9), 3228–3242. [Google Scholar] [CrossRef]
- Kornblith, S. Do Better ImageNet Models Transfer Better? 2019 IEEE/CVF Conference on Computer Vision and Pattern Recognition (CVPR), June 2019; pp. 2656–2666. [Google Scholar] [CrossRef]
- Tan, C. “A Survey on Deep Transfer Learning,” in Artificial Neural Networks and Machine Learning – ICANN 2018, vol. 11141. In Lecture Notes in Computer Science; Kůrková, V., Manolopoulos, Y., Hammer, B., Iliadis, L., Maglogiannis, I., Eds.; Springer International Publishing: Cham, 2018; vol. 11141, pp. 270–279. [Google Scholar] [CrossRef]
- Ronneberger, O.; Fischer, P.; Brox, T. “U-Net: Convolutional Networks for Biomedical Image Segmentation,” in Medical Image Computing and Computer-Assisted Intervention – MICCAI 2015, vol. 9351. In Lecture Notes in Computer Science; Navab, N., Hornegger, J., Wells, W. M., Frangi, A. F., Eds.; Springer International Publishing: Cham, 2015; vol. 9351, pp. 234–241. [Google Scholar] [CrossRef]
- Zhu, J.-Y.; Park, T.; Isola, P.; Efros, A. A. Unpaired Image-to-Image Translation using Cycle-Consistent Adversarial Networks. 2017 IEEE International Conference on Computer Vision (ICCV), Oct. 2017; pp. 2242–2251. [Google Scholar] [CrossRef]
- Zhang, L. Multi-modal Deep Learning for Medical Image Analysis: A Comprehensive Survey. IEEE Reviews in Biomedical Engineering 2022, vol. 15, 157–179. [Google Scholar] [CrossRef]
- Twinanda, A. P. EndoNet: A Deep Architecture for Recognition Tasks on Laparoscopic Videos. IEEE Trans Med Imaging 2017, vol. 36(no. 1), 86–97. [Google Scholar] [CrossRef] [PubMed]
- Plis, S. M. Deep learning for neuroimaging: a validation study. Front Neurosci 2014, vol. 8, 229. [Google Scholar] [CrossRef]
- Radford, A. Learning Transferable Visual Models From Natural Language Supervision. In Proceedings of the 38th International Conference on Machine Learning, PMLR, 2021; pp. 8748–8763. [Google Scholar]
- He, K. Momentum Contrast for Unsupervised Visual Representation Learning. 2020 IEEE/CVF Conference on Computer Vision and Pattern Recognition (CVPR), June 2020; pp. 9726–9735. [Google Scholar] [CrossRef]
- Chen, T.; Kornblith, S.; Norouzi, M.; Hinton, G. A Simple Framework for Contrastive Learning of Visual Representations. In Proceedings of the 37th International Conference on Machine Learning, PMLR, 2020; pp. 1597–1607. [Google Scholar]
- Asano, Y. M.; Rupprecht, C.; Vedaldi, A. Self-labelling via simultaneous clustering and representation learning. International Conference on Learning Representations, 2020. [Google Scholar]
- Caron, M. Unsupervised Learning of Visual Features by Contrasting Cluster Assignments. Advances in Neural Information Processing Systems 2020, vol. 33, 9912–9924. [Google Scholar]
- Chen, X.; He, K. Exploring Simple Siamese Representation Learning. 2021 IEEE/CVF Conference on Computer Vision and Pattern Recognition (CVPR), June 2021; pp. 15745–15753. [Google Scholar] [CrossRef]
- Grill, J.-B. Bootstrap Your Own Latent: A New Approach to Self-Supervised Learning. Advances in Neural Information Processing Systems 2020, vol. 33, 21271–21284. [Google Scholar]
- Diakou, I. Multi-label classification of biomedical data. Med Int (Lond) 2024, vol. 4(no. 6), 68. [Google Scholar] [CrossRef]
- Priyadharshini, M.; Banu, A. F.; Sharma, B.; Chowdhury, S.; Rabie, K.; Shongwe, T. Hybrid Multi-Label Classification Model for Medical Applications Based on Adaptive Synthetic Data and Ensemble Learning. Sensors (Basel) 2023, vol. 23(no. 15), 6836. [Google Scholar] [CrossRef]
- Yuan, S.; Chen, Y.; Ye, C.; Bhatt, M. W.; Saradeshmukh, M.; Hossain, M. S. Cross-modal multi-label image classification modeling and recognition based on nonlinear. Nonlinear Engineering 2023, vol. 12(no. 1). [Google Scholar] [CrossRef]
- Lemay, A.; Gros, C.; Naga Karthik, E.; Cohen-Adad, J. Label fusion and training methods for reliable representation of inter-rater uncertainty. MELBA journal 2023, vol. 1, no. January 2023 issue, 1–27. [Google Scholar] [CrossRef]
- Neyestanak, M. S. A Quantitative Comparison Between Focal Loss and Binary Cross-Entropy Loss in Brain Tumor Auto-Segmentation Using U-Net. Journal of Biostatistics and Epidemiology 2025. [Google Scholar] [CrossRef]
- Watanabe, C. Interpreting Layered Neural Networks via Hierarchical Modular Representation. In Neural Information Processing;Communications in Computer and Information Science; Gedeon, T., Wong, K. W., Lee, M., Eds.; Springer International Publishing: Cham, 2019; vol. 1143, pp. 376–388. [Google Scholar] [CrossRef]
- Iduh, B. N.; Egba, P. Anwaitu Fraser. An Enhanced Modular-Based Neural Network Framework for Effective Medical Diagnosis. Journal of Computational Mechanics, Power System and Control 2024. [Google Scholar] [CrossRef]
- Waugh, N. “Introduction to age-related macular degeneration,” in Treatments for dry age-related macular degeneration and Stargardt disease: a systematic review. In NIHR Journals Library; 2018. [Google Scholar]
- Sasaki, M.; Kawasaki, R.; Yanagi, Y. Early Stages of Age-Related Macular Degeneration: Racial/Ethnic Differences and Proposal of a New Classification Incorporating Emerging Concept of Choroidal Pathology. J Clin Med 2022, vol. 11(no. 21), 6274. [Google Scholar] [CrossRef] [PubMed]
- Davis, M. D. Comparison of Time-Domain OCT and Fundus Photographic Assessments of Retinal Thickening in Eyes with Diabetic Macular Edema. Invest Ophthalmol Vis Sci 2008, vol. 49(no. 5), 1745–1752. [Google Scholar] [CrossRef]
- Sikorski, B. L.; Malukiewicz, G.; Stafiej, J.; Lesiewska-Junk, H.; Raczynska, D. The Diagnostic Function of OCT in Diabetic Maculopathy. Mediators Inflamm 2013, vol. 2013, 434560. [Google Scholar] [CrossRef]
- Chen, T.; Kornblith, S.; Norouzi, M.; Hinton, G. A simple framework for contrastive learning of visual representations. In Proceedings of the 37th International Conference on Machine Learning, in ICML’20, JMLR.org, July 2020; vol. 119, pp. 1597–1607. [Google Scholar]
- He, K.; Fan, H.; Wu, Y.; Xie, S.; Girshick, R. Momentum Contrast for Unsupervised Visual Representation Learning. 2020 IEEE/CVF Conference on Computer Vision and Pattern Recognition (CVPR), Seattle, WA, USA, June 2020; IEEE; pp. 9726–9735. [Google Scholar] [CrossRef]
- Zhang, M.-L.; Zhou, Z.-H. A Review on Multi-Label Learning Algorithms. IEEE Trans. Knowl. Data Eng. 2014, vol. 26(no. 8), 1819–1837. [Google Scholar] [CrossRef]
- Lin, T.-Y.; Goyal, P.; Girshick, R.; He, K.; Dollár, P. Focal Loss for Dense Object Detection. 2017 IEEE International Conference on Computer Vision (ICCV), Oct. 2017; pp. 2999–3007. [Google Scholar] [CrossRef]
- Cui, Y.; Jia, M.; Lin, T.-Y.; Song, Y.; Belongie, S. Class-Balanced Loss Based on Effective Number of Samples. 2019 IEEE/CVF Conference on Computer Vision and Pattern Recognition (CVPR), Long Beach, CA, USA, June 2019; IEEE; pp. 9260–9269. [Google Scholar] [CrossRef]
- Russakovsky, O. ImageNet Large Scale Visual Recognition Challenge. Int J Comput Vis 2015, vol. 115(no. 3), 211–252. [Google Scholar] [CrossRef]
- Lipton, Z. C.; Elkan, C.; Naryanaswamy, B. Optimal Thresholding of Classifiers to Maximize F1 Measure. Mach Learn Knowl Discov Databases 2014, vol. 8725, 225–239. [Google Scholar] [CrossRef]
- Stahlschmidt, S. R.; Ulfenborg, B.; Synnergren, J. Multimodal deep learning for biomedical data fusion: a review. Briefings in Bioinformatics 2022, vol. 23(no. 2), bbab569. [Google Scholar] [CrossRef]
- OCTID: Optical coherence tomography image database. Computers & Electrical Engineering 2020, vol. 81, 106532. [CrossRef]
- Traslational-Visual-Health-Laboratory, Traslational-Visual-Health-Laboratory/OCT-AND-EYE-FUNDUS-DATASET. 2025. Available online: https://github.com/Traslational-Visual-Health-Laboratory/OCT-AND-EYE-FUNDUS-DATASET.
- ResNet and its application to medical image processing: Research progress and challenges. Computer Methods and Programs in Biomedicine 2023, vol. 240, 107660. [CrossRef] [PubMed]
- Tan, M.; Le, Q. EfficientNet: Rethinking Model Scaling for Convolutional Neural Networks. In Proceedings of the 36th International Conference on Machine Learning, PMLR, May 2019; pp. 6105–6114. [Google Scholar]
- Agastya, N.; Novamizanti, L.; Budiman, G. Tuna Loin Quality Grading Using Image Processing and EfficientNetV2. 2025 IEEE International Conference on Industry 4.0, Artificial Intelligence, and Communications Technology (IAICT), July 2025; IEEE: Bali, Indonesia; pp. 833–840. [Google Scholar] [CrossRef]
- Loshchilov, I.; Hutter, F. Decoupled weight decay regularization. International conference on learning representations, 2017. [Google Scholar]
- Alomar, K.; Aysel, H. I.; Cai, X. Data Augmentation in Classification and Segmentation: A Survey and New Strategies. J Imaging 2023, vol. 9(no. 2), 46. [Google Scholar] [CrossRef]
- Natarajan, S.; Jain, A.; Krishnan, R.; Rogye, A.; Sivaprasad, S. Diagnostic Accuracy of Community-Based Diabetic Retinopathy Screening With an Offline Artificial Intelligence System on a Smartphone. JAMA Ophthalmol 2019, vol. 137(no. 10), 1182–1188. [Google Scholar] [CrossRef] [PubMed]
- Hao, R.; Namdar, K.; Liu, L.; Haider, M. A.; Khalvati, F. A Comprehensive Study of Data Augmentation Strategies for Prostate Cancer Detection in Diffusion-Weighted MRI Using Convolutional Neural Networks. J Digit Imaging 2021, vol. 34(no. 4), 862–876. [Google Scholar] [CrossRef] [PubMed]
- Sokolova, M.; Lapalme, G. A systematic analysis of performance measures for classification tasks. Inf. Process. Manage. 2009, vol. 45(no. 4), 427–437. [Google Scholar] [CrossRef]
- An introduction to ROC analysis. Pattern Recognition Letters 2006, vol. 27(no. 8), 861–874. [CrossRef]
- Kulyabin, M. OCTDL: Optical Coherence Tomography Dataset for Image-Based Deep Learning Methods. Sci Data 2024, vol. 11, 365. [Google Scholar] [CrossRef]
- Bizaki, M. K. Deep Neural Networks-based Malignant Breast Lesions Detection and Segmentation from Mammography. 2022 IEEE Nuclear Science Symposium and Medical Imaging Conference (NSS/MIC), Nov. 2022; IEEE: Italy; pp. 1–3. [Google Scholar] [CrossRef]
- Rajaraman, S.; Ganesan, P.; Antani, S. Deep learning model calibration for improving performance in class-imbalanced medical image classification tasks. PLoS ONE 2022, vol. 17(no. 1), e0262838. [Google Scholar] [CrossRef]
- Kiss, S.; Chandwani, H. S.; Cole, A. L.; Patel, V. D.; Lunacsek, O. E.; Dugel, P. U. Comorbidity and health care visit burden in working-age commercially insured patients with diabetic macular edema. Clin Ophthalmol 2016, vol. 10, 2443–2453. [Google Scholar] [CrossRef]
- Lobo, C. Characterisation of progression of macular oedema in the initial stages of diabetic retinopathy: a 3-year longitudinal study. Eye (Lond) 2023, vol. 37(no. 2), 313–319. [Google Scholar] [CrossRef]
- Lipton, Z. C.; Elkan, C.; Naryanaswamy, B. Optimal Thresholding of Classifiers to Maximize F1 Measure. Mach Learn Knowl Discov Databases 2014, vol. 8725, 225–239. [Google Scholar] [CrossRef]
- Toma, C. Microvascular changes in eyes with non-proliferative diabetic retinopathy with or without macular microaneurysms: an OCT-angiography study. Acta Diabetol 2025, vol. 62(no. 5), 753–761. [Google Scholar] [CrossRef]
- Chen, T.; Kornblith, S.; Norouzi, M.; Hinton, G. A simple framework for contrastive learning of visual representations. International conference on machine learning, PMLR, 2020; pp. 1597–1607. [Google Scholar]
- Bi, Y.; Xie, J.; Wang, H. Contrastive Learning-Based Feature Modulation Strategy for Test-Time Adaptation in Medical Image Segmentation. 2025 28th International Conference on Computer Supported Cooperative Work in Design (CSCWD), May 2025; pp. 916–921. [Google Scholar] [CrossRef]
- Rajaraman, S.; Zamzmi, G.; Antani, S. K. Novel loss functions for ensemble-based medical image classification. PLoS One 2021, vol. 16(no. 12), e0261307. [Google Scholar] [CrossRef]
- Viñals, R.; Thiran, J.-P. A KL Divergence-Based Loss for In Vivo Ultrafast Ultrasound Image Enhancement with Deep Learning. J. Imaging 2023, vol. 9(no. 12), 256. [Google Scholar] [CrossRef]
- Lei, X. A Cross-Modal Feature Fusion Method to Diagnose Macular Fibrosis in Neovascular Age-Related Macular Degeneration. In 2024 IEEE International Symposium on Biomedical Imaging (ISBI); IEEE: Athens, Greece, May 2024; pp. 1–5. [Google Scholar] [CrossRef]
- Zedadra, A.; Salah-Salah, M. Y.; Zedadra, O.; Guerrieri, A. Multi-Modal AI for Multi-Label Retinal Disease Prediction Using OCT and Fundus Images: A Hybrid Approach. Sensors 2025, vol. 25(no. 14), 4492. [Google Scholar] [CrossRef]
- He, K.; Zhang, X.; Ren, S.; Sun, J. Deep residual learning for image recognition. In Proceedings of the IEEE conference on computer vision and pattern recognition (CVPR), June 2016. [Google Scholar]
- Carse, J.; Alvarez Olmo, A.; McKenna, S. Calibration of deep medical image classifiers: an empirical comparison using dermatology and histopathology datasets. In International workshop on uncertainty for safe utilization of machine learning in medical imaging; Springer, 2022; pp. 89–99. [Google Scholar]
- Chen, W.; Wang, H. OCTSharp: an open-source and real-time OCT imaging software based on C#. Biomed Opt Express 2023, vol. 14(no. 11), 6060–6071. [Google Scholar] [CrossRef]
Figure 1.
An overview of the general architecture of the HMS system, highlighting data flows and specialized modules.
Figure 1.
An overview of the general architecture of the HMS system, highlighting data flows and specialized modules.
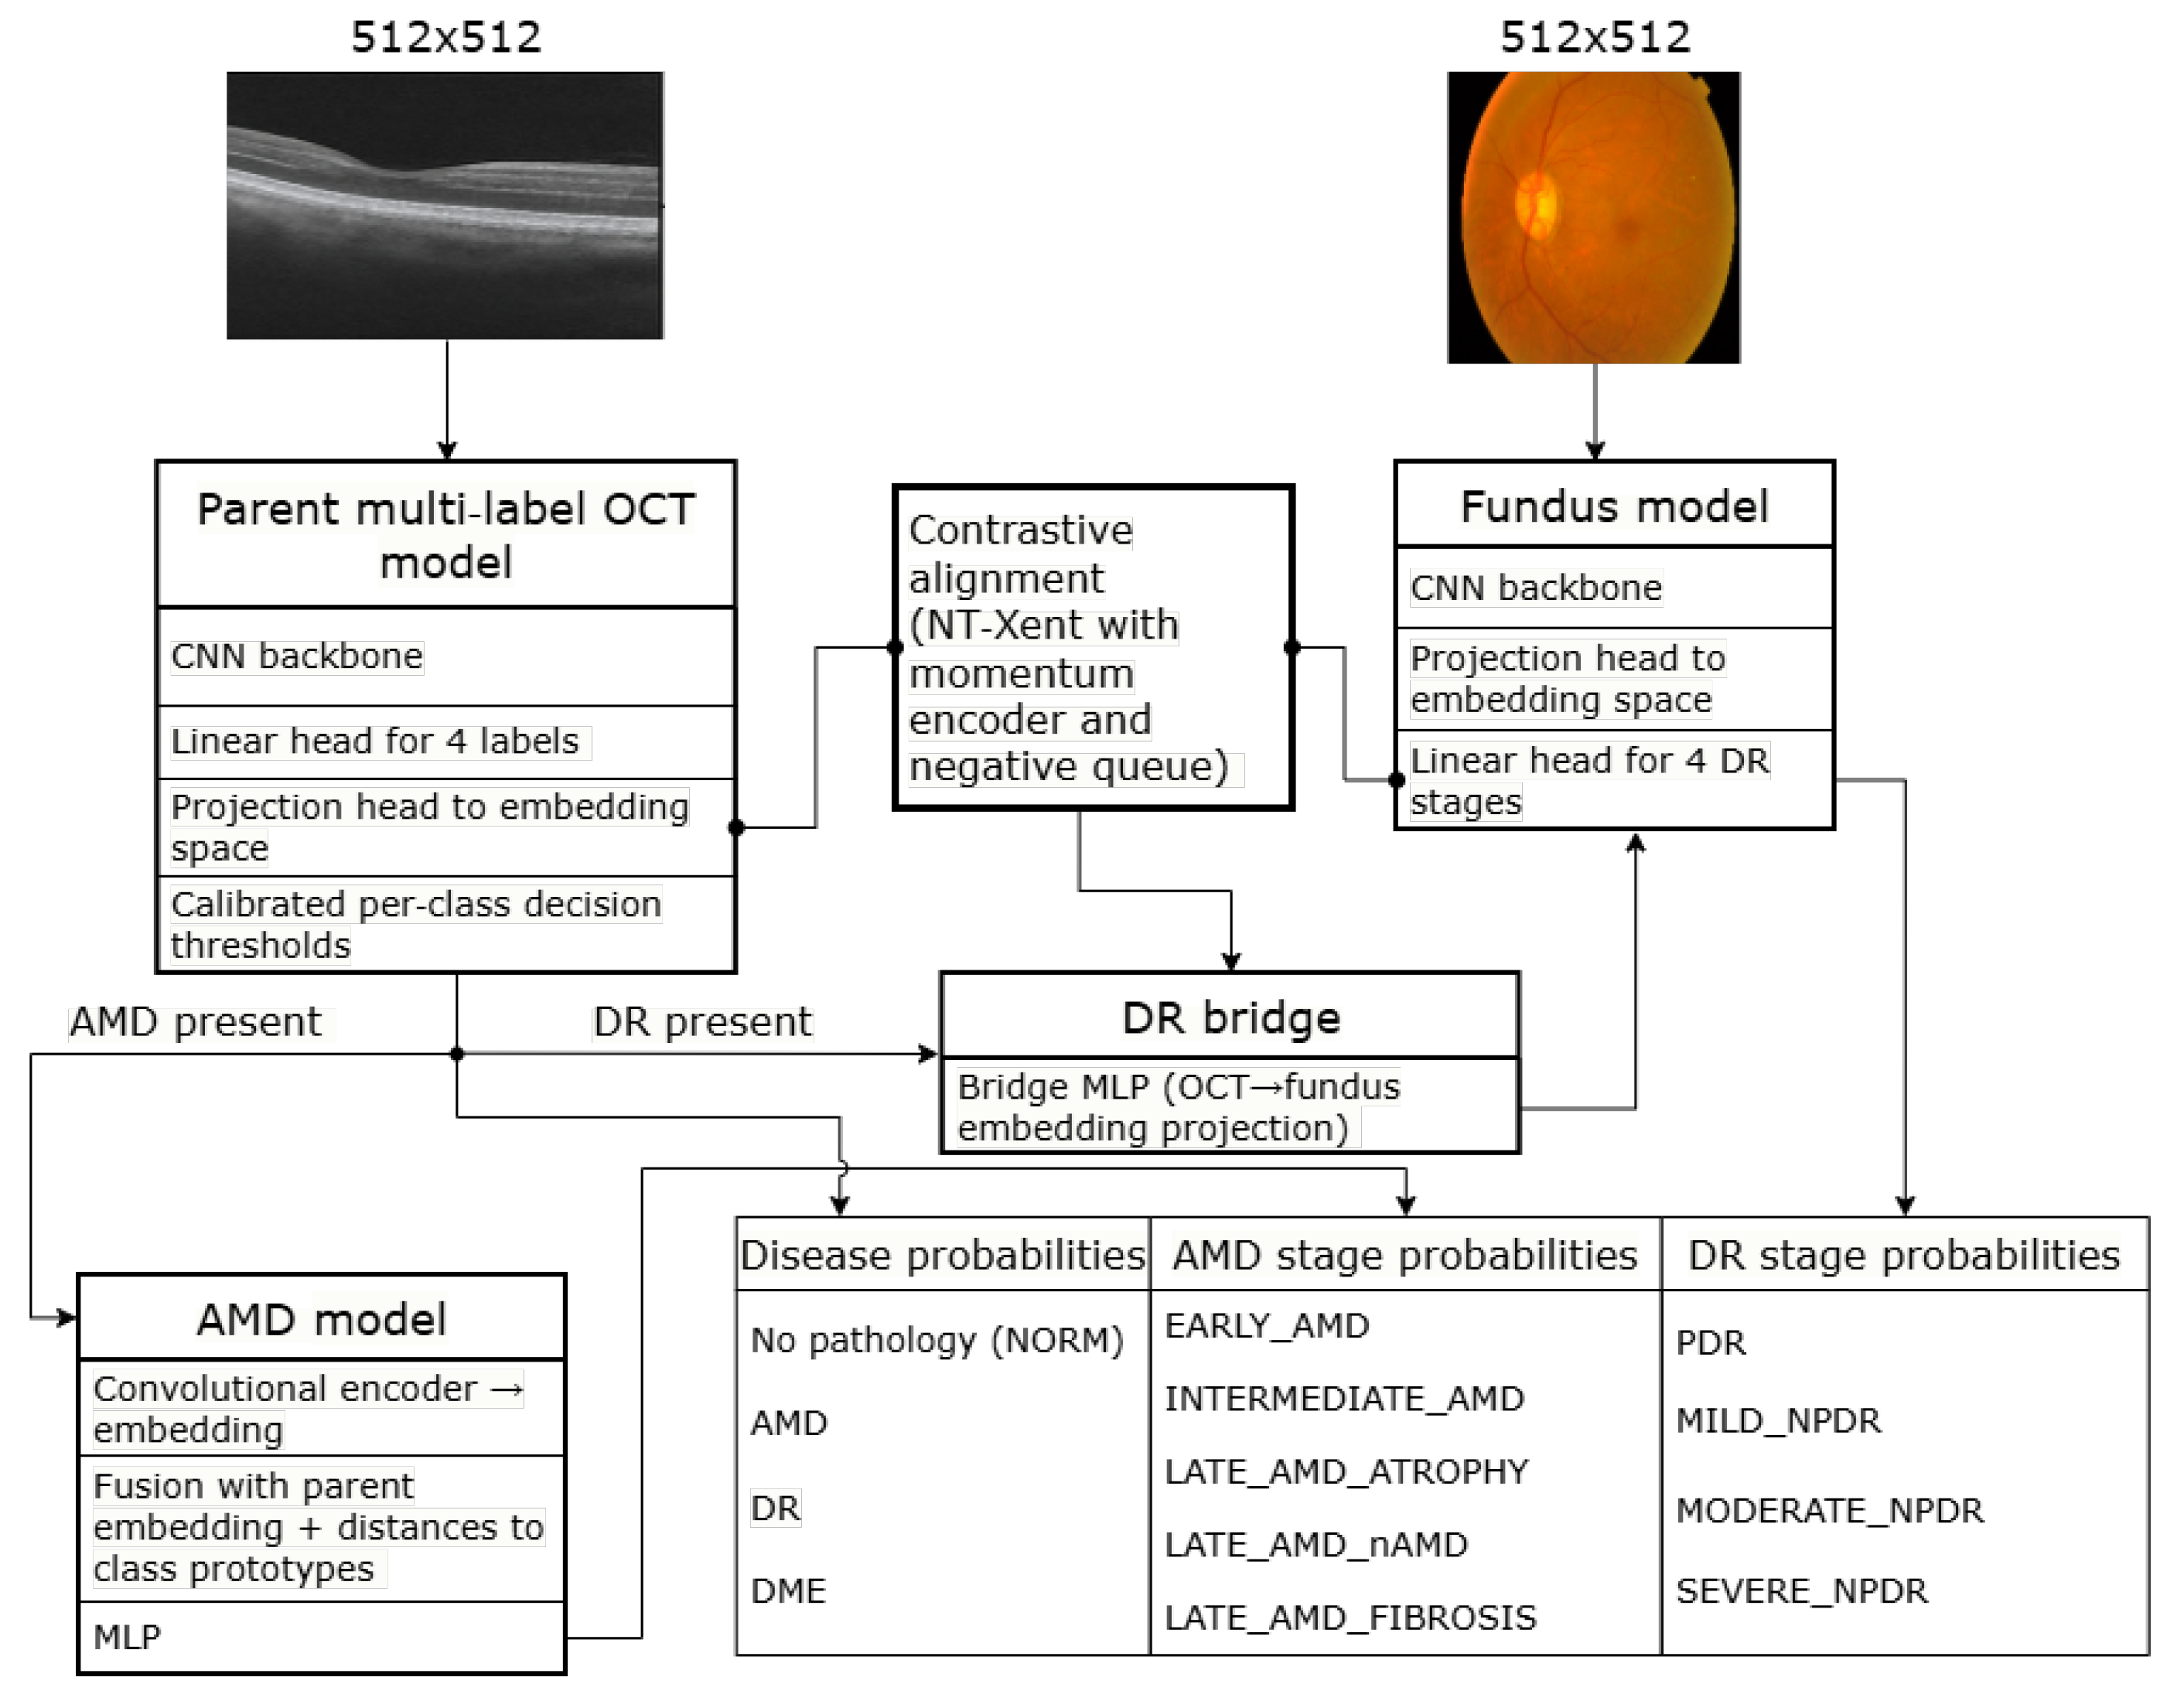
Figure 2.
A comparison of the performance of the HMS system with contemporary baseline methods.
Disclaimer/Publisher’s Note: The statements, opinions and data contained in all publications are solely those of the individual author(s) and contributor(s) and not of MDPI and/or the editor(s). MDPI and/or the editor(s) disclaim responsibility for any injury to people or property resulting from any ideas, methods, instructions or products referred to in the content. |
© 2025 by the authors. Licensee MDPI, Basel, Switzerland. This article is an open access article distributed under the terms and conditions of the Creative Commons Attribution (CC BY) license (http://creativecommons.org/licenses/by/4.0/).
Copyright: This open access article is published under a Creative Commons CC BY 4.0 license, which permit the free download, distribution, and reuse, provided that the author and preprint are cited in any reuse.


