Submitted:
03 December 2025
Posted:
04 December 2025
You are already at the latest version
Abstract
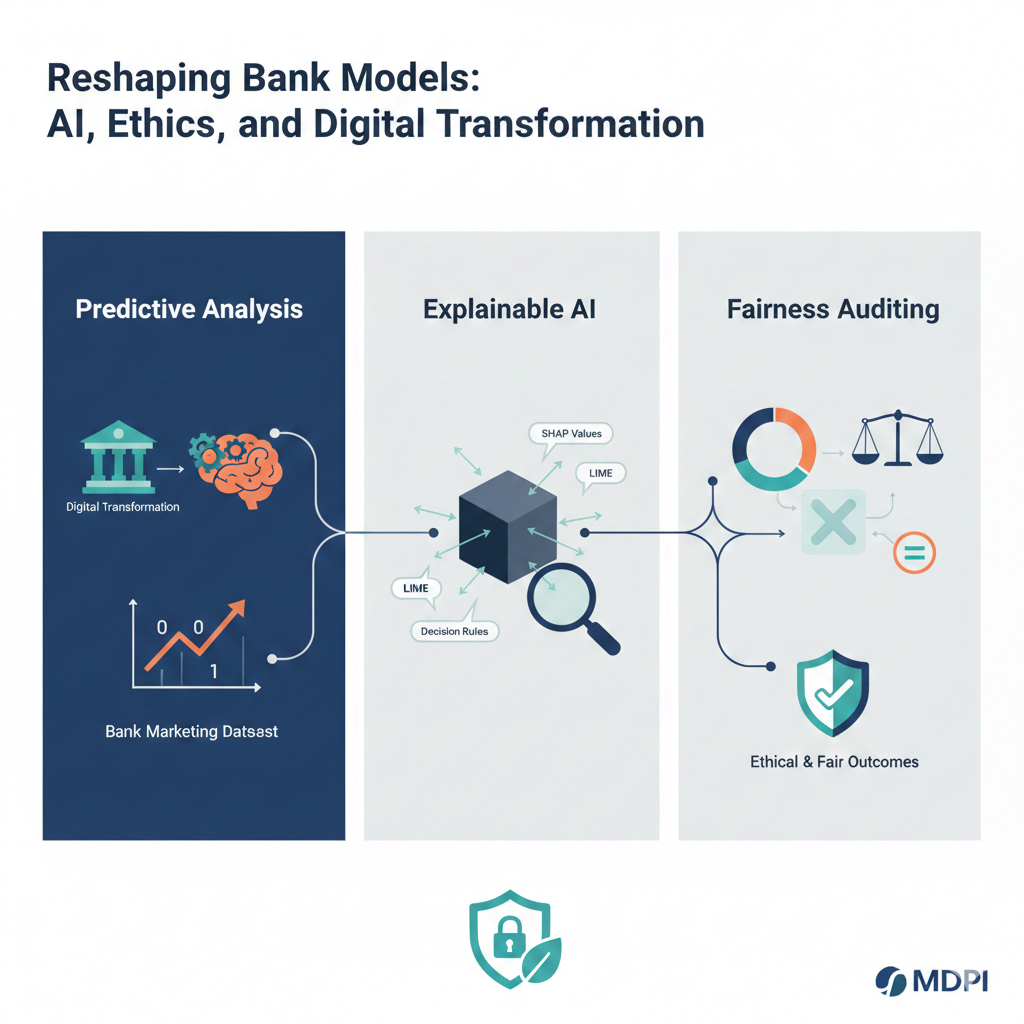
The current research delves into the effects of predictive modeling and explainable artificial intelligence (XAI) as a transformation agent in banking decision making, emphasizing the aspects of fairness and transparency. The Bank Marketing Dataset, acquired from UCI Machine Learning Repository, is the basis of the development of predictive models for the purpose of forecasting term deposit subscriptions. We have not only performed a comparison of linear, tree-based and ensemble methods but also utilized SHAP (SHapley Additive exPlanations) for the interpretation of model predictions. Moreover, a fairness audit has taken place among the demographic groups so as to pinpoint any biases that may be present. Among the results is the discovery that ensemble models, with XGBoost being particularly singled out, have the highest accuracy in prediction; conversely, XAI tools have been the ones that have provided insulin through the insights on feature contributions. The fairness analysis has uncoved the aggregation of model outcomes disparity in relation to age, job, and marital status groups. This is where the exemplification of the digital transformation potential comes in as the banking industry would be able to not only enhance its predictability but also expertly control ethical dilemmas using technological means.
Keywords:
Introduction
Literature Review
Research Questions and Hypotheses
Data
Constructs and Predictors
- -
- Demographic and Financial Attributes: Age, job type, marital status, education, balance, housing loan, and personal loan.
- -
- Campaign Attributes: type, day and month of contact, duration of contact, number of contacts in the current campaign, and outcomes of previous campaigns.
- -
- Target Variable: Subscription to a term deposit, encoded as a binary outcome (y = 1 for “yes”, y = 0 for “no”).
Data Analytic Plan
Results
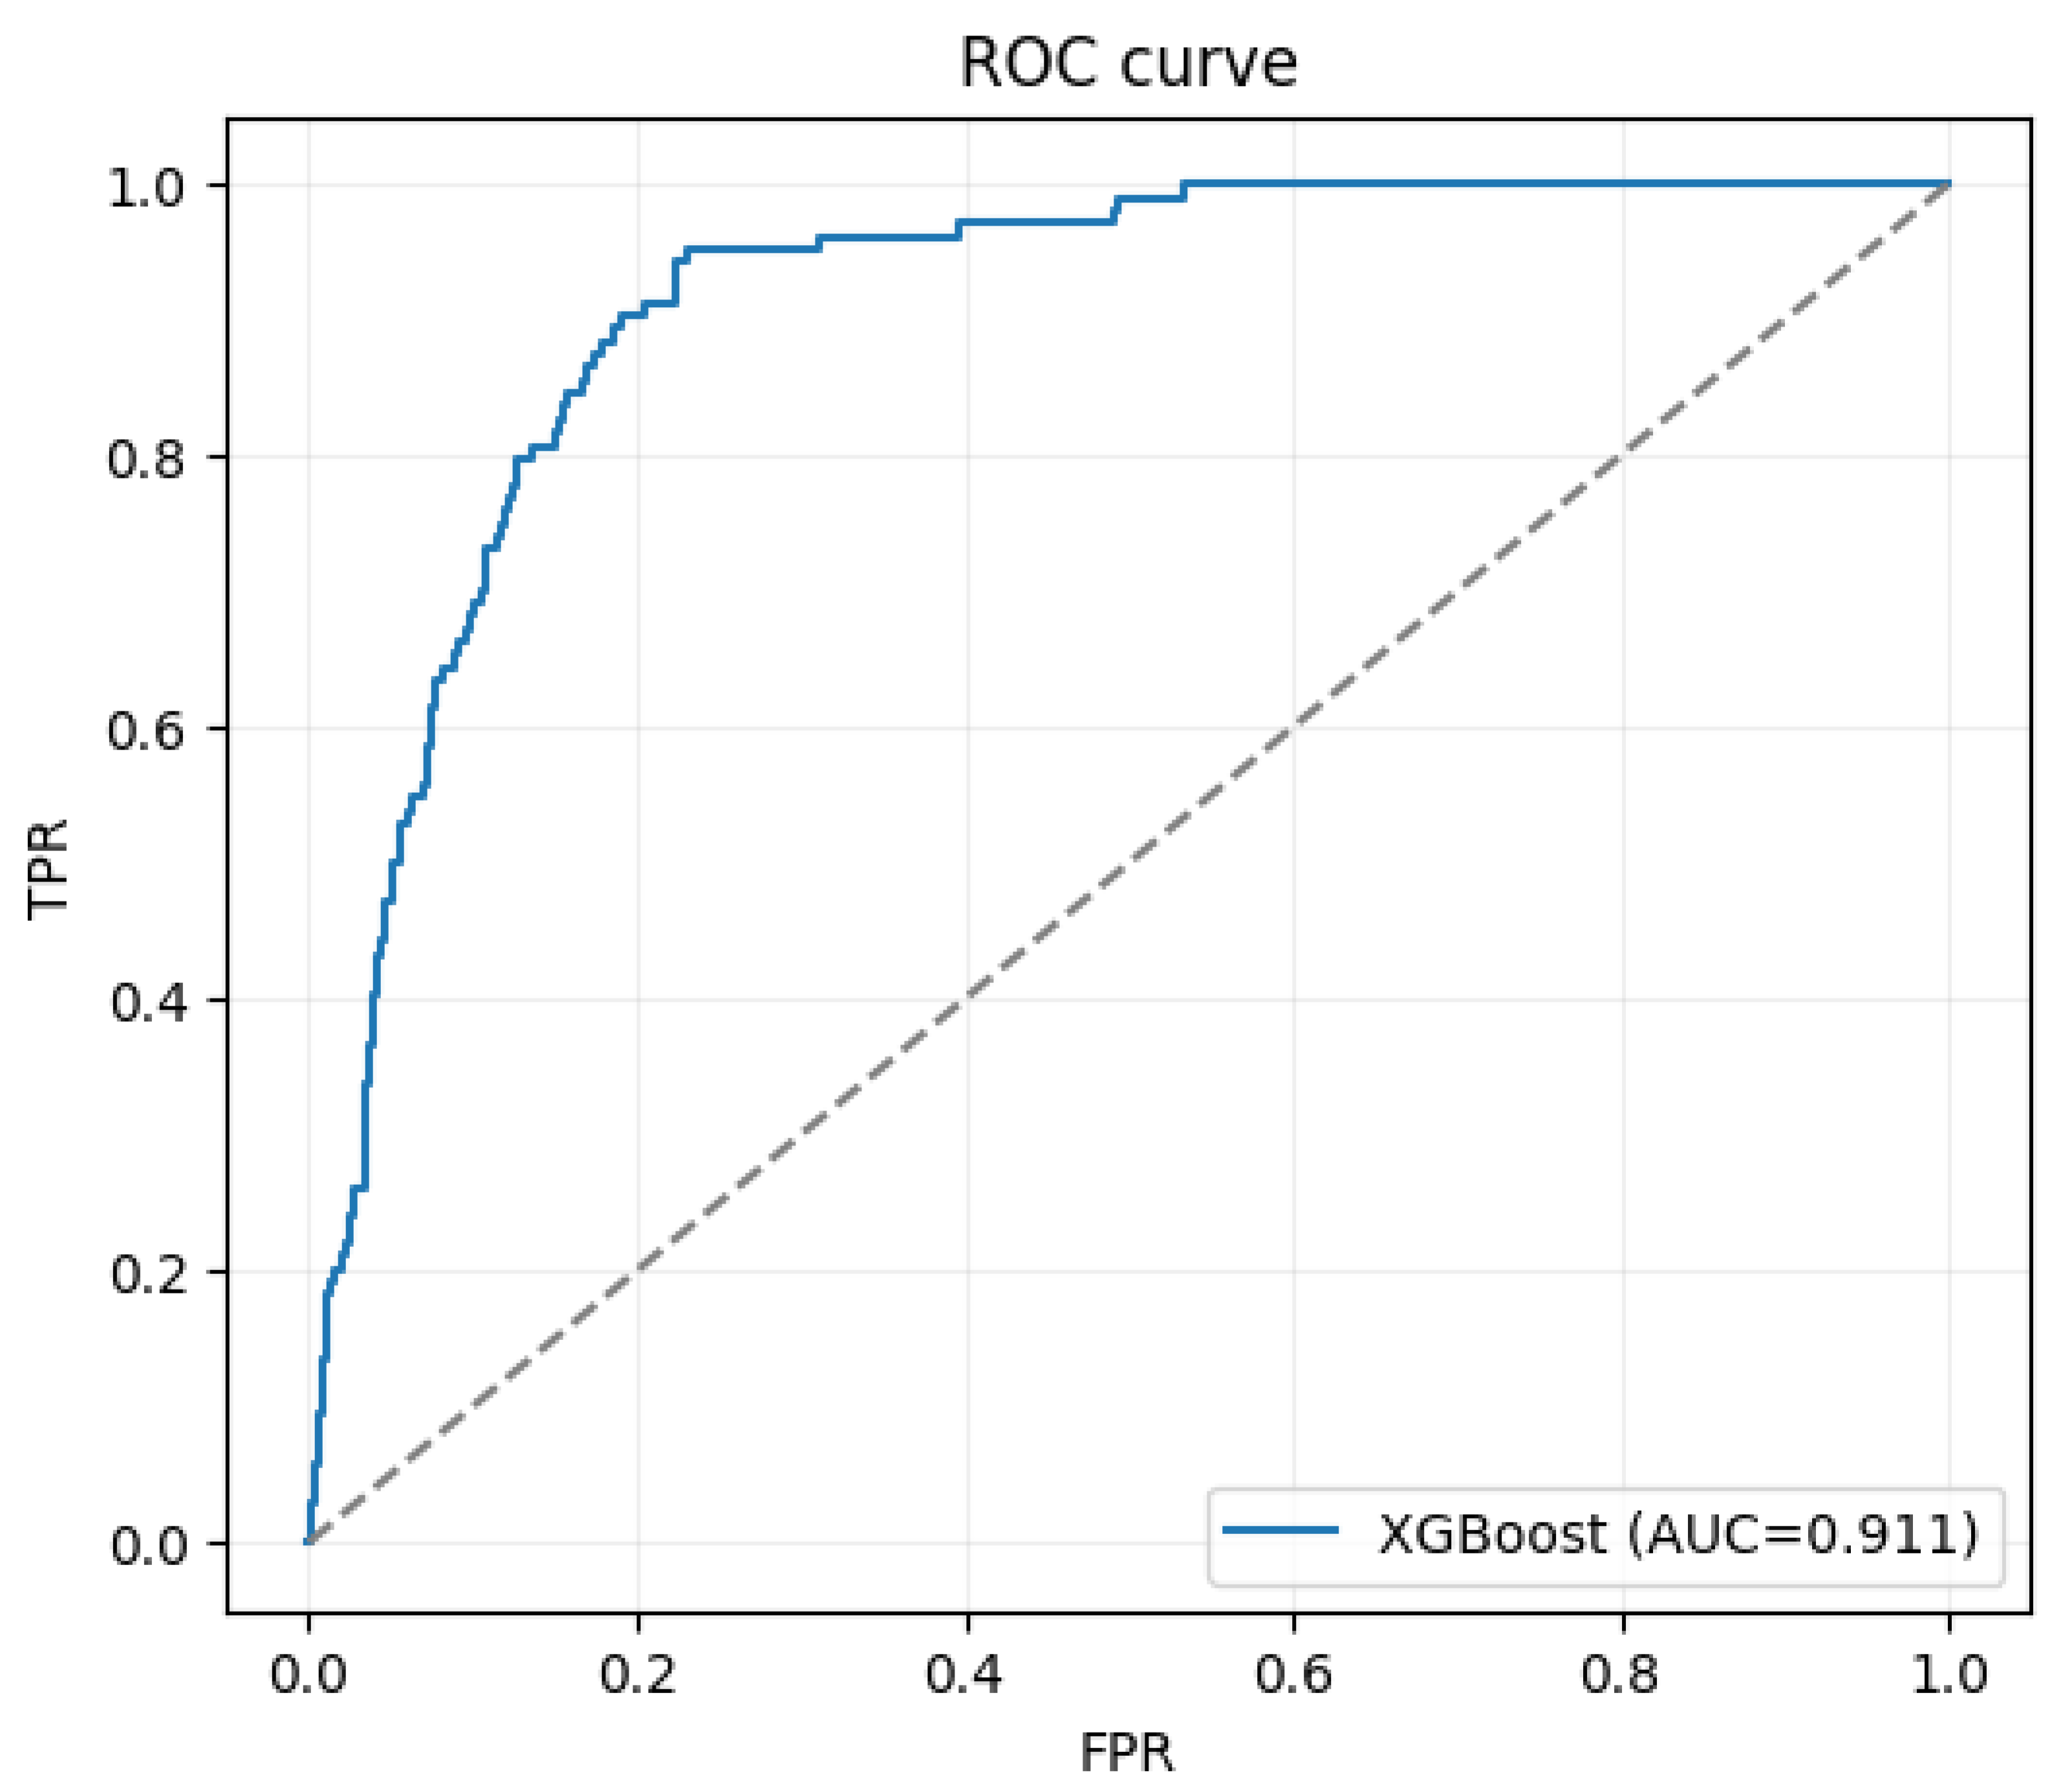
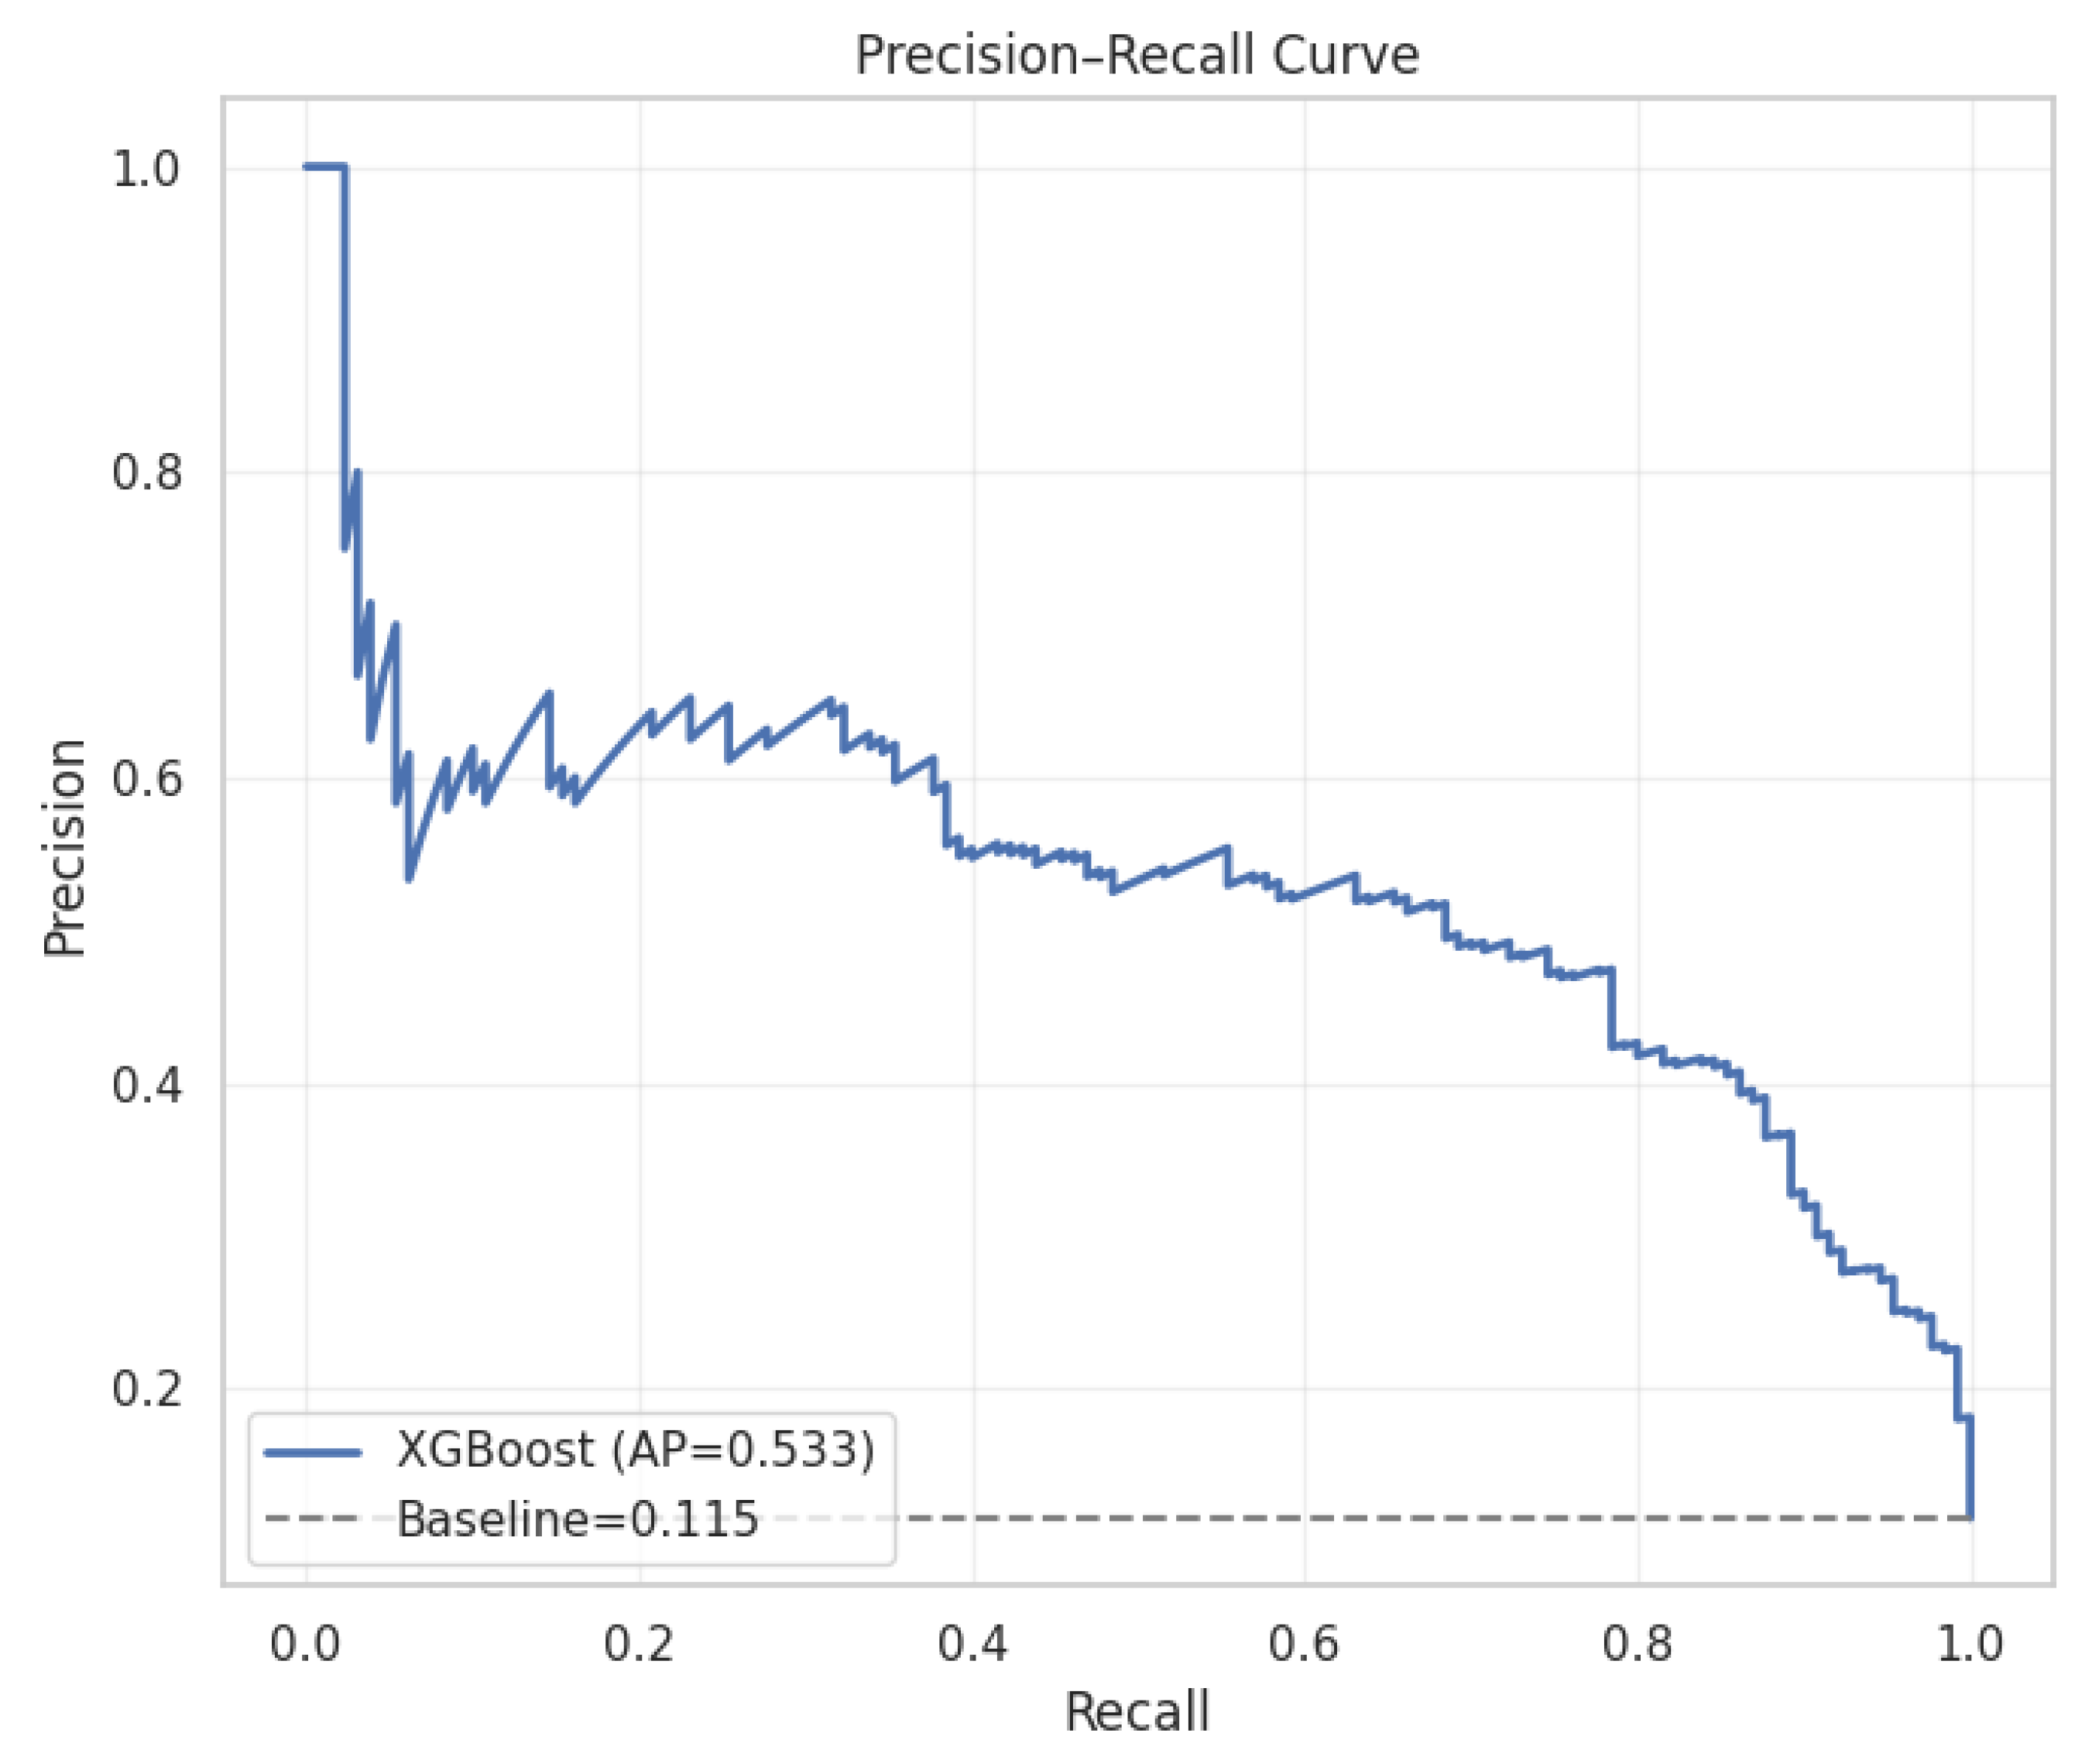
ROC Curve
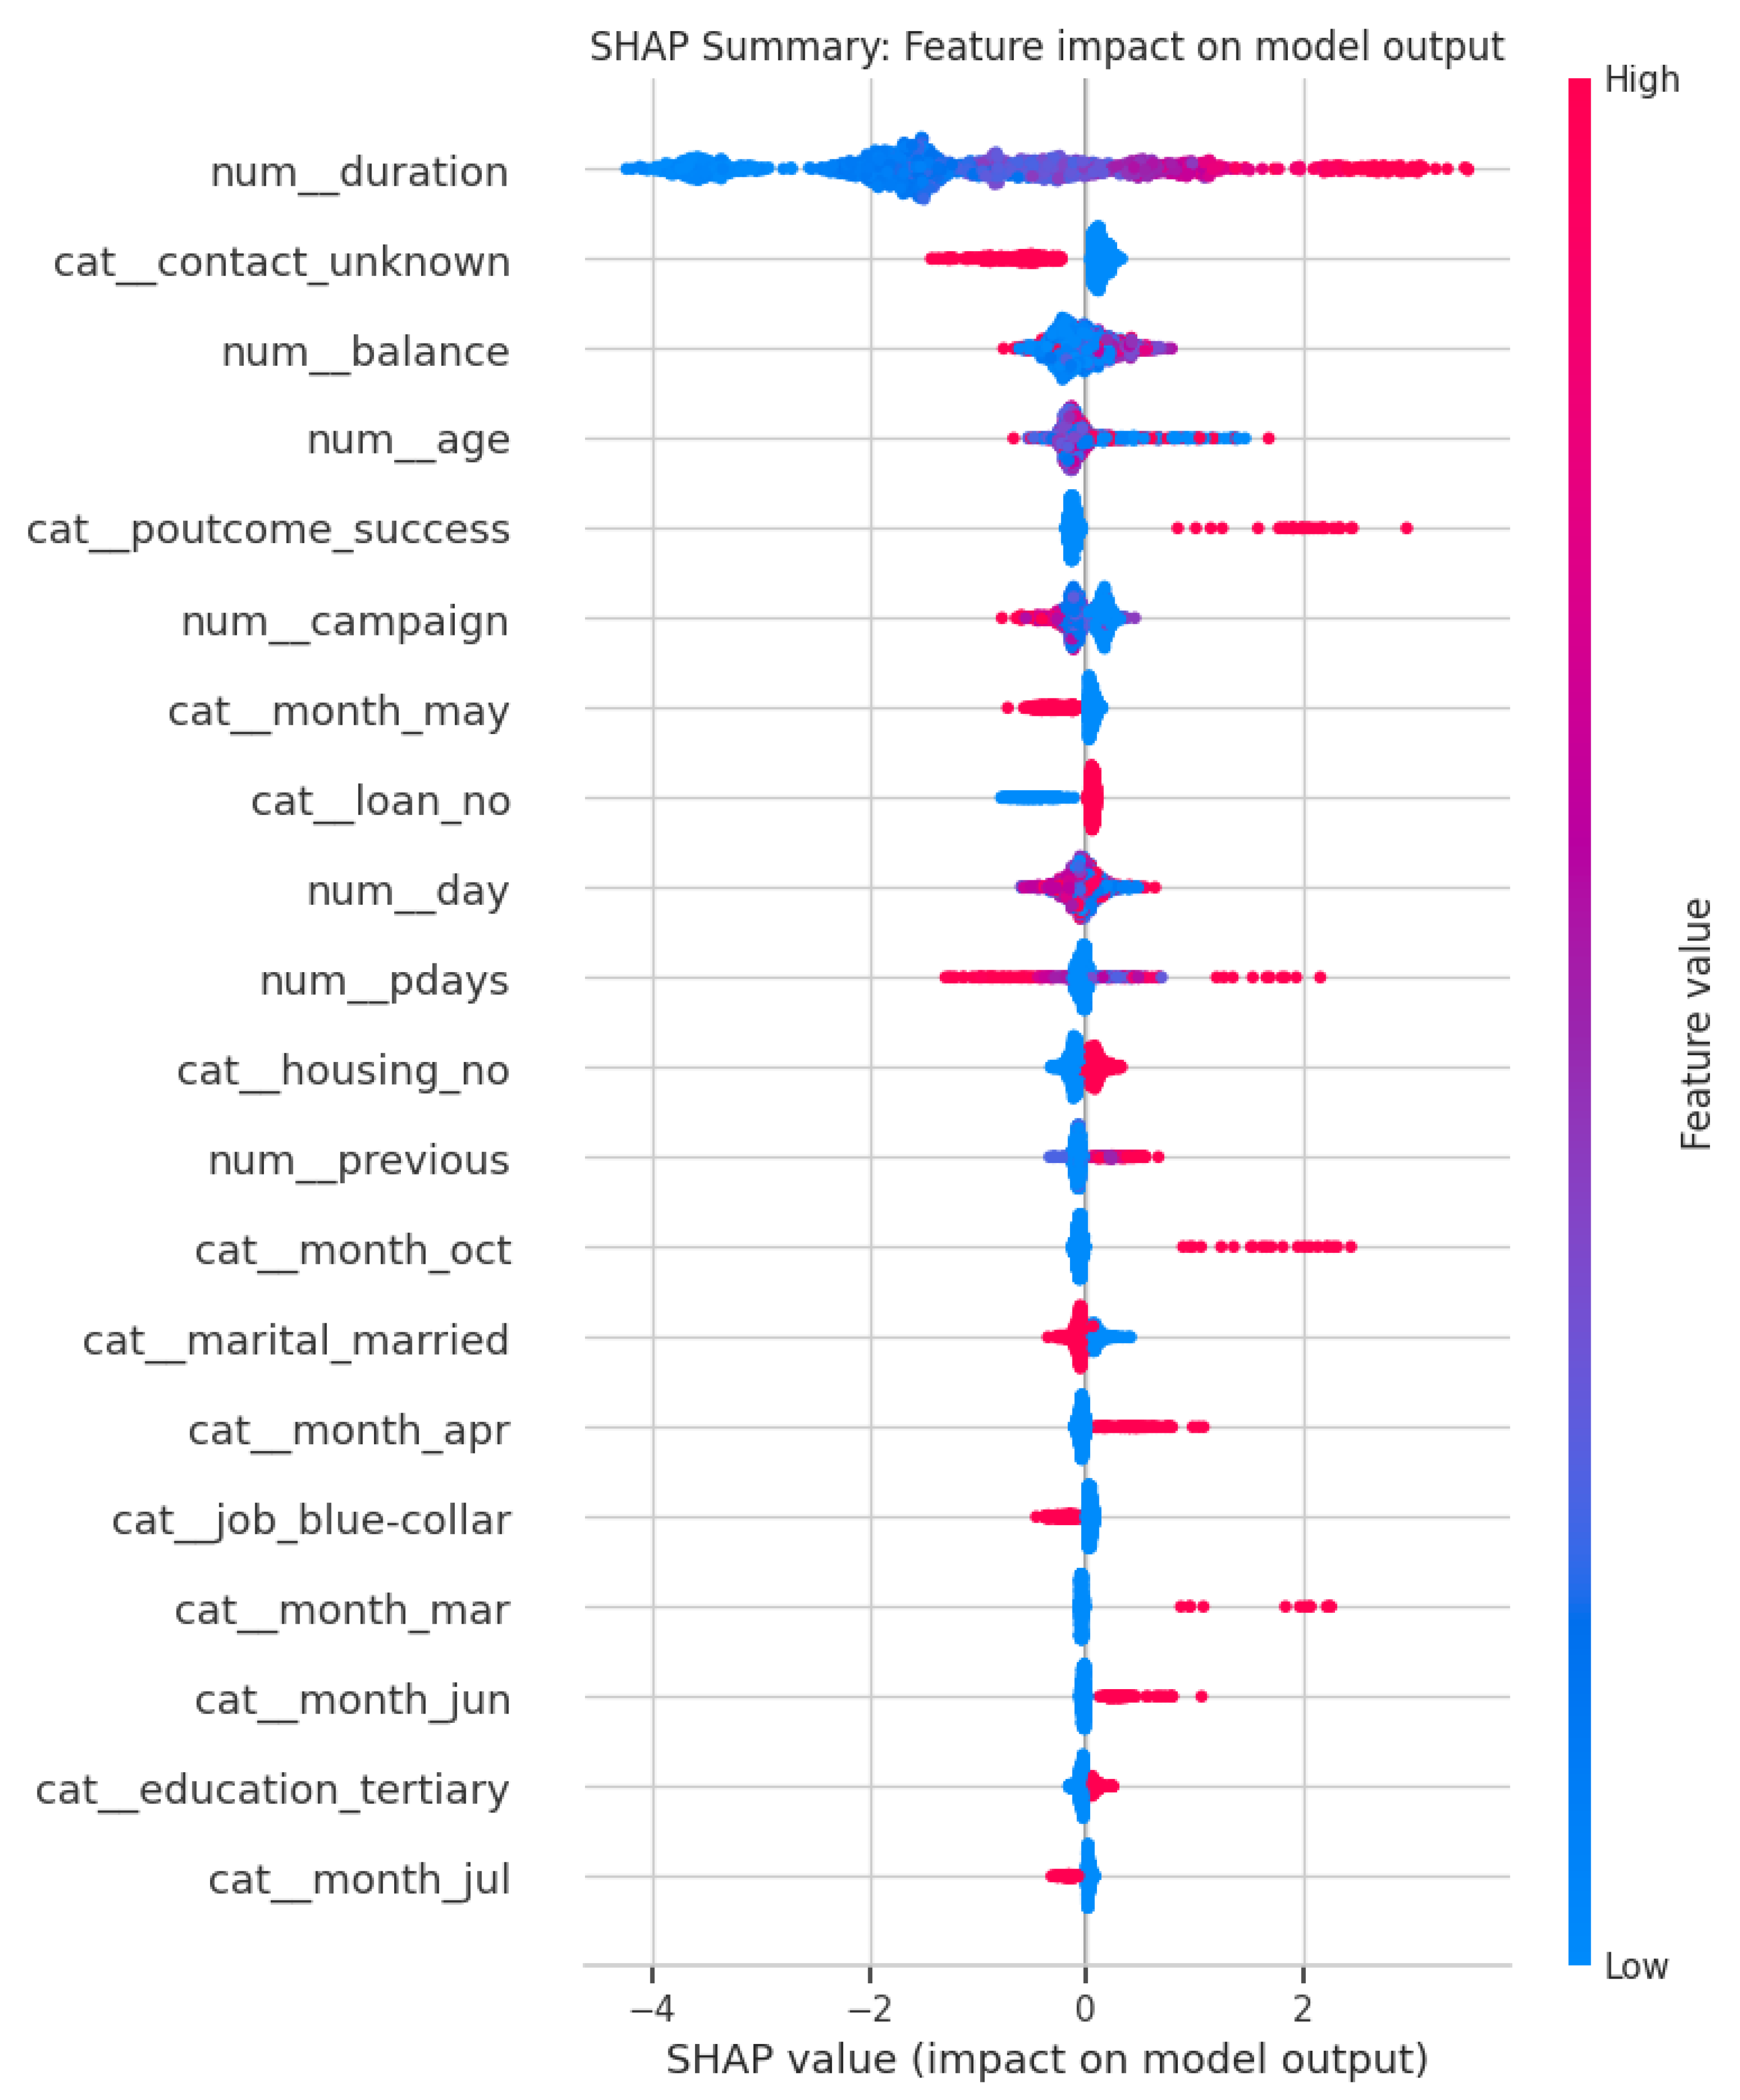
Explainable AI (XAI) Analysis
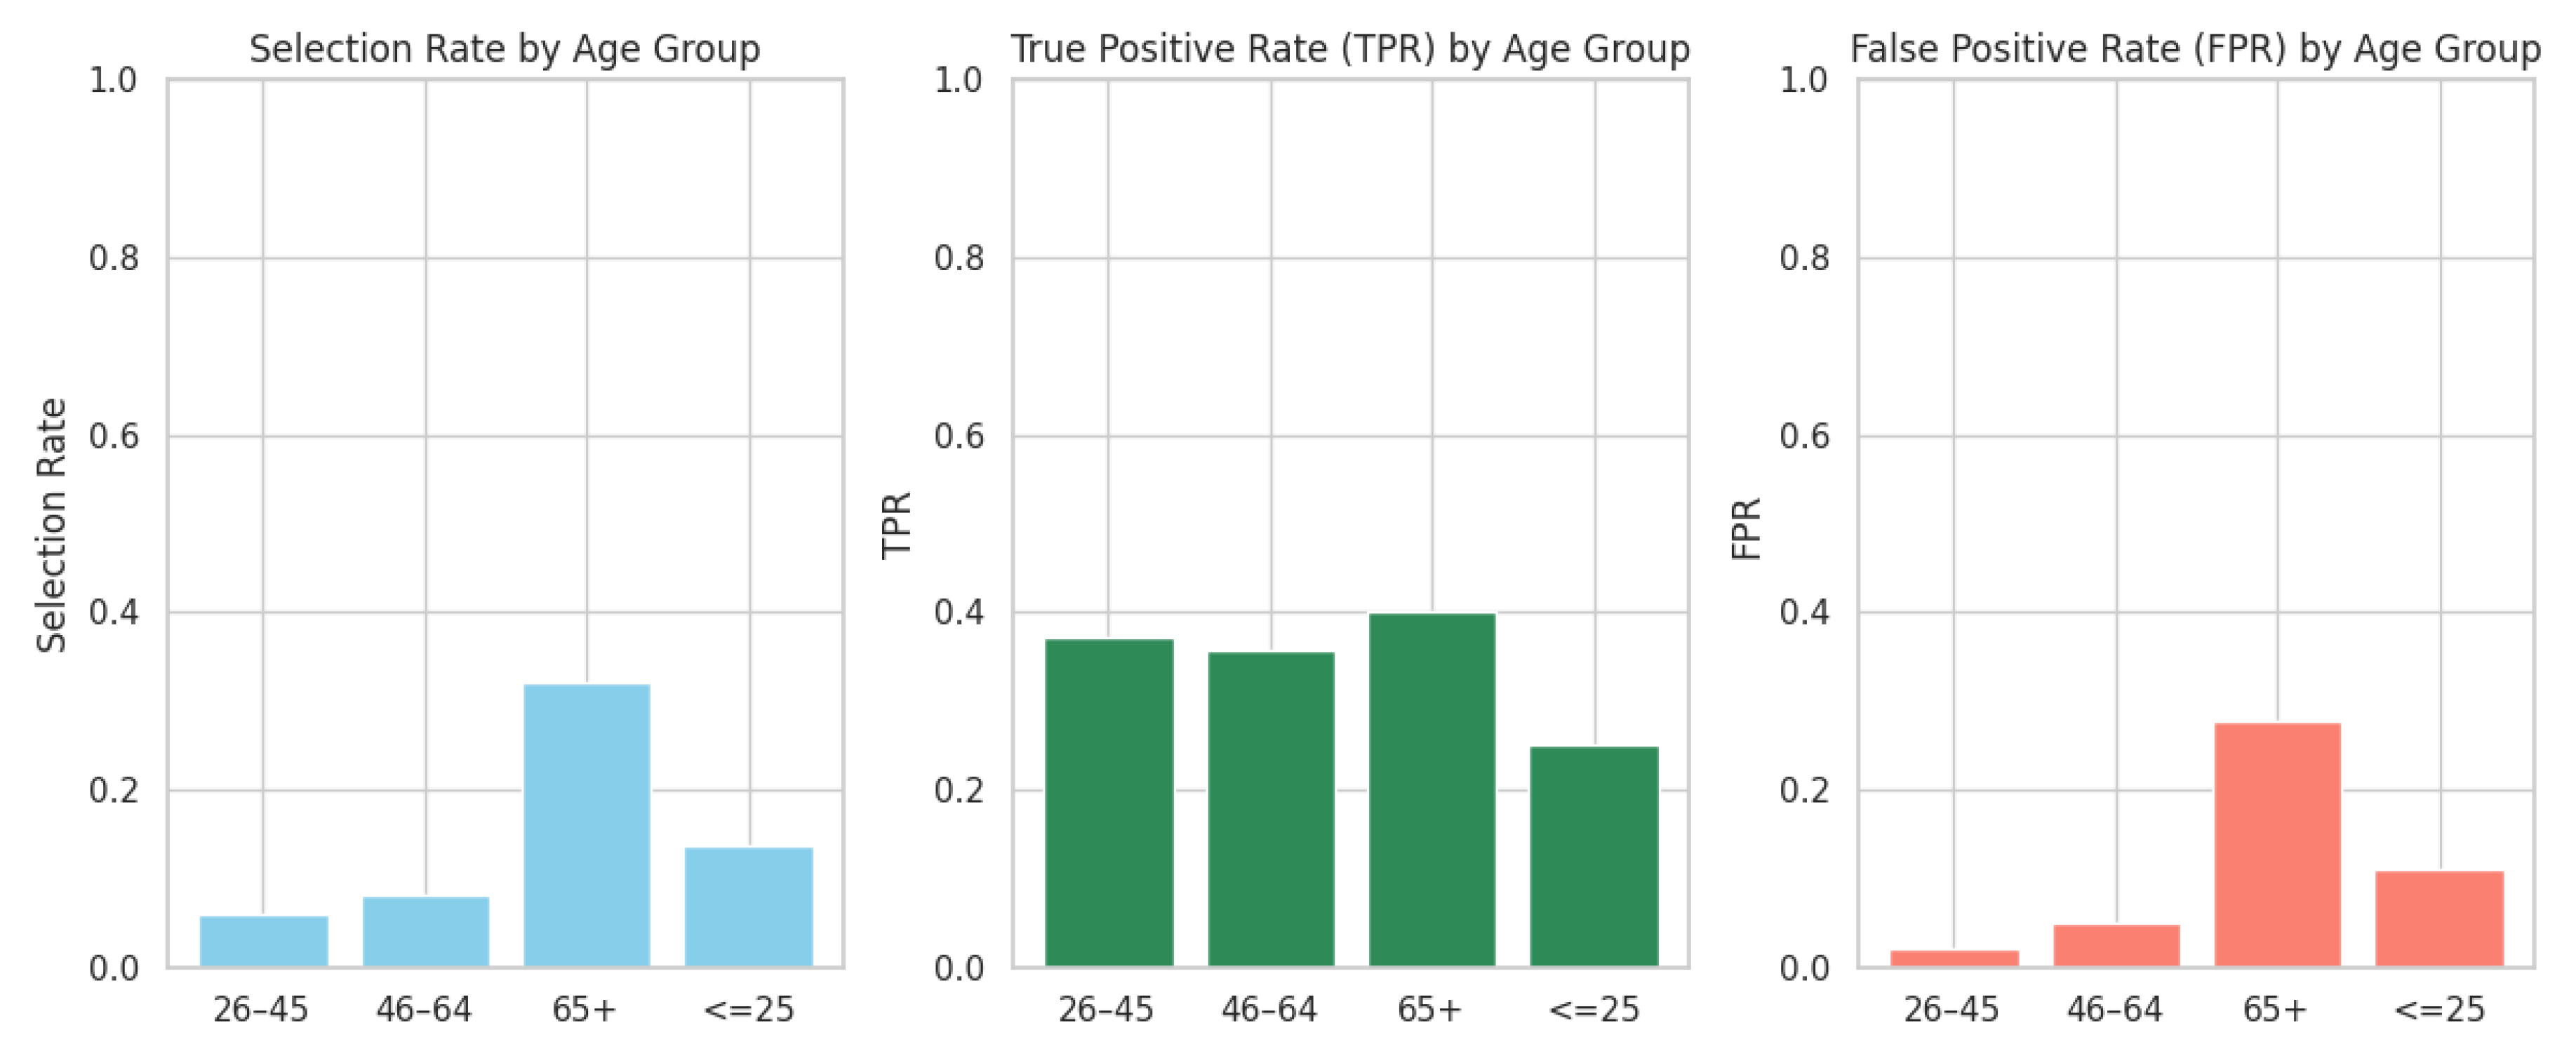
Fairness Auditing: Age-Group Bias Evaluation
| Model | Accuracy | Precision (Class 0) | Precision (Class 1) | Recall (Class 0) | Recall (Class 1) | F1-Score (Class 0) | F1-Score (Class 1) |
| Logistic Regression | 78.9% | 96% | 32% | 80% | 72% | 87% | 44% |
| Random Forest | 88.7% | 91% | 52% | 97% | 25% | 94% | 34% |
| XGBoost | 98.5% | 100% | 88% | 98% | 100% | 99% | 94% |
- XGBoost clearly outperforms the other two models, especially for class 1 (the minority class).
- Logistic Regression shows a high recall for class 1 but low precision, indicating many false positives.
- Random Forest performs well with class 0 but struggles significantly with class 1, especially with recall.
Discussion
Conclusions
Code Availability Statement
Data Availability Statement
Conflicts of Interest
References
- Aas, K., Jullum, M., & Løland, A. (2021). Explaining individual predictions when features are dependent: More accurate approximations to Shapley values. Artificial Intelligence, 298, 103502. [CrossRef]
- Bank Marketing Dataset. (2020). UCI Machine Learning Repository. University of California, Irvine. https://archive.ics.uci.edu/dataset/222/bank+marketing.
- Chen, T., & Guestrin, C. (2016). XGBoost: A scalable tree boosting system. Proceedings of the 22nd ACM SIGKDD International Conference on Knowledge Discovery and Data Mining, 785–794. [CrossRef]
- Doshi-Velez, F., & Kim, B. (2017). Towards a rigorous science of interpretable machine learning. arXiv. https://arxiv.org/abs/1702.08608.
- Friedman, J. H. (2001). Greedy function approximation: A gradient boosting machine. Annals of Statistics, 29(5), 1189–1232. [CrossRef]
- Molnar, C. (2022). Interpretable machine learning: A guide for making black box models explainable (2nd ed.). https://christophm.github.io/interpretable-ml-book/.
- Pedreshi, D., Ruggieri, S., & Turini, F. (2008). Discrimination-aware data mining. Proceedings of the 14th ACM SIGKDD International Conference on Knowledge Discovery and Data Mining, 560–568. [CrossRef]
- Ribeiro, M. T., Singh, S., & Guestrin, C. (2016). “Why should I trust you?” Explaining the predictions of any classifier. Proceedings of the 22nd ACM SIGKDD Conference on Knowledge Discovery and Data Mining, 1135–1144. [CrossRef]
Disclaimer/Publisher’s Note: The statements, opinions and data contained in all publications are solely those of the individual author(s) and contributor(s) and not of MDPI and/or the editor(s). MDPI and/or the editor(s) disclaim responsibility for any injury to people or property resulting from any ideas, methods, instructions or products referred to in the content. |
© 2025 by the authors. Licensee MDPI, Basel, Switzerland. This article is an open access article distributed under the terms and conditions of the Creative Commons Attribution (CC BY) license (http://creativecommons.org/licenses/by/4.0/).


