
Submitted:
03 December 2025
Posted:
03 December 2025
You are already at the latest version
Abstract
Despite the closure of the Semipalatinsk nuclear test site (STS) more than 30 years ago, the removal of radioactive contamination beyond the “Degelen” test site by water continues. Therefore, assessing the water resources formation at this test site is highly relevant, including for predicting the development of the radiation situation at the STS. In this case, isotope hydrology is the most promising method for understanding these processes. The aquatic environment at the “Degelen” test site consists of radioactively contaminated tunnel water, streams, and groundwater. The article presents the research results of the aquatic environment of the “Degelen” test site using the method of isotope hydrology with determination of stable isotopes of hydrogen and oxygen. The determination of the 3H concentration and the chemical composition of water were also determined. The analysis of the isotopic composition (δ2H, δ18O) of water showed that the tunnel and stream water are formed by precipitation (snow and rain). In summer, when precipitation is low, the condensation water significantly contributes to the recharge of “Degelen” test site water. The high radionuclide content of tunnel water leads to contamination to a greater extent of stream water, and, to the lesser extent, and groundwater. The 3H content in tunnel water can reach 260 kBq/L, in stream water – 58 kBq/L, which exceeds the standards established in the Republic of Kazakhstan.
Keywords:
Semipalatinsk test site
; “Degelen” test site
; tunnel water
; isotope hydrology
1. Introduction
The method of isotope hydrology, based on the distribution of stable isotopes of hydrogen (2H) and oxygen (18O) in water, has found wide application in assessing the quality of water resources, and for predicting the development of the radioecological situation under conditions of increasing anthropogenic impact [1].
Although the method for determining stable isotopes of hydrogen and oxygen was discovered and applied in paleoclimatology in the last century [2], it has received its greatest application in recent times. Scientists have conducted numerous studies using stable isotopes, including studies of the natural hydrological cycle [3,4], determination of the stable isotope’s characteristics in precipitation for different geographical areas [5,6,7,8], as well as the interaction of surface and groundwater [9,10,11,12]. The study of surface water is associated with the identification of their origin and dynamics [13,14], the study of complex hydrological processes of large catchments of river [15,16,17] and lakes [18,19,20]. The study of groundwater involves determining the characteristics of stable isotopes, identifying the sources of recharge [21], and estimating the elevation of recharge zones [22,23], including high-salinity [24], karst [25,26], and thermal [27] water.
Stable isotopes of hydrogen (δ2H) and oxygen (δ18O) are constituents of water molecules. They are chemically stable at low temperatures, and their concentrations do not vary with geological conditions. They are natural indicators for understanding the water cycle and associated hydrological processes, such as mixing and evaporation. Deuterium excess (d-excess) is a second-order isotopic parameter that is a function of the isotopic composition of oxygen and hydrogen in water. It is calculated according to the formula: d-excess = δ2H − 8×δ18O [2]. This parameter is sensitive to the evaporation and condensation conditions preceding the formation of waters. During evaporation, isotope fractionation occurs, and the isotopic composition of the water changes. Waters that have undergone intense evaporation are enriched in heavy isotopes and are characterized by negative d-excess values (residual «heavier water»). Conversely, waters that have not experienced significant evaporation have a «lighter» isotopic composition and positive d-excess values [28].
In general, the analysis of stable hydrogen and oxygen isotopes has become an essential tool for studying complex hydrological, ecological and climatic processes. For environmental studies, the isotope hydrology method is used to determine the sources and migration pathways of contamination in the aquatic environment [29,30].
The Semipalatinsk Test Site (STS) was one of the largest nuclear test sites. The STS aquatic environment, like other environmental components, was exposed to radioactive contamination as a result of nuclear test. There are various types of surface water bodies on the STS territory: reservoirs and watercourses. Radionuclide contamination of reservoirs is localized nature [31]. The main watercourses of the STS territory are the Shagan River and the streams of the “Degelen” test site.
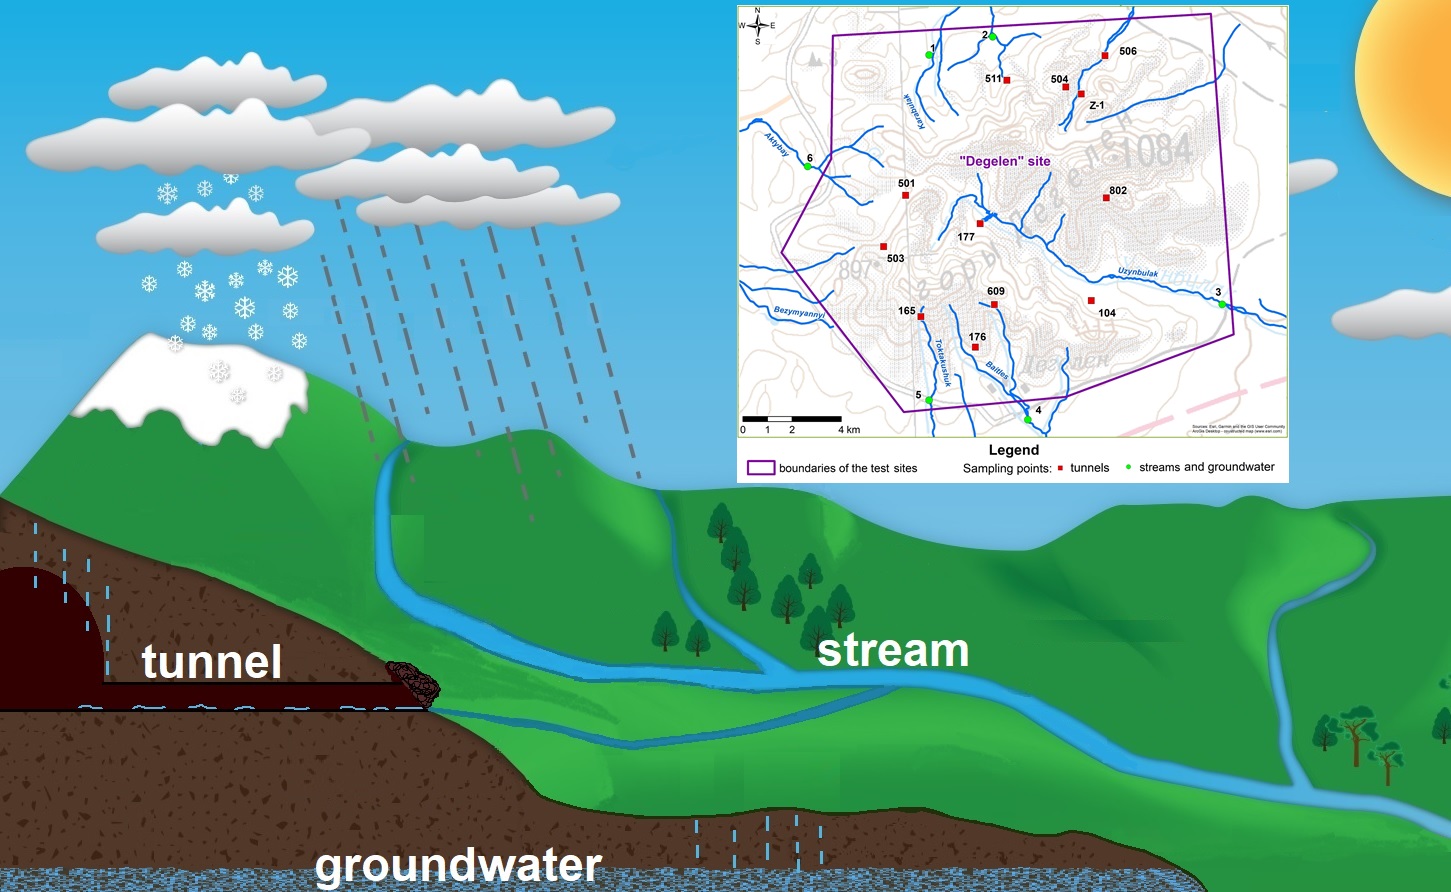
Geographically, the “Degelen” test site is located within the boundaries of the mountain massif of the same name, consisting of ridges with individual peaks. The maximum height of the mountain peaks is slightly over 1000 m, the area of the massif is about 300 km2. Degelen mountain massif is part of the regional hydrogeological system of the left bank of the Irtysh River and is groundwater recharge and transit area. The former “Degelen” test site was used for conducting underground nuclear tests of medium and low yield. Between 1961 and 1989, more than 200 nuclear tests were carried out in 181 tunnel located within the mountain massif. The tunnel are horizontal excavations in the granite massif of the mountain, with lengths ranging from several hundred meters to 2 km. The diameter of the tunnel openings is approximately 3 m [32]. Some tunnels contain watercourses that reach the ground surface at their portals. Hydrologically, these watercourses are connected to the main streams originating within the Degelen mountain range.
Since the closure of the STS, a large amount of information has been obtained regarding the current radiation situation at the “Degelen” test site, including studies of the aquatic environment [33,34] and atmospheric precipitation [35]. Despite the closure of the “Degelen” test site tunnels more than 30 years ago, the radioactivity transport from the tunnel cavities via water continues [36]. The results of previously conducted radioecological studies indicate significant contamination of the aquatic environment of the “Degelen” test site with tritium (3Н), a radionuclide capable of being incorporated into various components of aquatic ecosystems and migrating over significant distances [37]. Despite the fact that 3H has a half-life T1/2 = 12.5 years, during the nuclear tests a huge amount of it was formed, and at the present time 3H remains one of the main contaminating and dose-forming radionuclides. According to the results of previous studies, the 3H concentration in stream water reached 90±9 kBq/kg, and in tunnel water – 220±20 kBq/kg. Also, other anthropogenic radionuclides (90Sr, 137Cs, 239+240Pu and U isotopes) are present in significant quantities in the waters of the “Degelen” test site [38].
The high anthropogenic radionuclides content in water flowing out beyond the test site boundaries necessitates predicting its further migration. Solving this problem requires a detailed study of the hydrological processes and formation sources of the aquatic environment of the test site. In this regard, the use of isotope hydrology method based on the analysis of variations in the isotopic composition of water seems to be a promising approach to solving this problem.
The aim of this study is to determine the formation and the radionuclide contamination sources in the water of the “Degelen” test site in order to predict the migration of anthropogenic radionuclides beyond its boundaries. These researches are highly relevant from the perspective of ensuring radiation safety for the population engaged in agricultural activities at the adjacent territory.
2. Materials and Methods
2.1. Research Area
The hydrographic network of the “Degelen” test site is formed by streams, the formation of which is also influenced by the hydrologically connected watercourses of the tunnels. The main streams of the “Degelen” test site are the Karabulak, Uzynbulak, Baitles, Toktakushuk, and Aktybay. The valley of the Uzynbulak stream, which divides the mountain massif along a northwest–southeast axis, is characterized by the largest catchment area. Water from tunnels 177, 104 and 802 flows into the Uzynbulak stream. The Baitles and Toktakushik streams flow along the southern and southeastern slopes of the massif. Water from tunnels 176 and 609 flows into the Baitles stream and the water of tunnel 165 – into the Toktakushuk stream. The Karabulak stream is oriented mainly to the north and northeast and consists of three tributaries that merge into a single channel beyond the site boundary. The water of tunnel 511 flow into the second tributary, while those of tunnels Z-1, 504, and 506 flow into the third tributary of the Karabulak stream. The Aktybai stream flows along the western slopes of the massif. The water of tunnels 501 and 503 flows into the Aktybay stream. Outside the “Degelen” test site the streams are divided into separate reservoirs - stretches, which can disappear due to infiltration and evaporation.
2.2. Sampling
Since the analysis of stable isotope distribution in atmospheric precipitation in the research region is an important tool for understanding hydrological processes, preliminary work was carried out to collect samples and process the baseline data. For this purpose, precipitation samples in the form of snow, rain, or mixed type were collected over the course of two years using the cumulative method. A “Rain Sampler 1C” (RS-1C) sampler was used to collect precipitation samples. Sampling was performed daily in the case of precipitation. This allowed to remove the influence of evaporation. During sample collection, the total volume of collected precipitation in the sampler was measured. A 20-mL aliquot was then collected into a vial. The vial was filled with sample to the brim to prevent oxygen ingress. Samples were stored refrigerated without fluctuating temperatures. During the cold period of the year, when solid atmospheric precipitation (snow) fell, snow samples were melted in closed plastic bags, and then placed in sealed vials, which were also stored in the refrigerator until the beginning of the analysis. Each sample was labeled with the collection date. Initially, each sample was analyzed for isotopic analysis. Then, samples collected over the course of a month were pooled, and stable isotope ratios were measured again.
As part of the study of the water formation conditions at the “Degelen” test site, water samples were collected from tunnel watercourses, streams (surface water), and groundwater. Samples were collected in duplicate; the results below show the average values for two samples measured from one sampling point. Tunnel water samples were collected at the points of their natural discharge to the surface. A total of 30 tunnel water samples were collected. Stream water samples were taken directly from the channels at the points where the streams flow beyond the boundaries of the “Degelen” test site, in order to monitor the migration of anthropogenic radionuclides. Stream (surface) water samples were collected three times a year (in spring, summer, and autumn) in order to track the dynamics of changes by seasons. A total of 34 stream water samples were collected. At these same sites (at the points where surface water samples were taken from the streams), boreholes were drilled near the stream channels to collect groundwater samples. Groundwater samples were collected during the summer period. A total of 12 groundwater samples were collected. The spatial distribution of the sampling points is shown in Figure 1.
2.3. Laboratory Work
In the collected water samples, the ratio of stable isotopes 2H/1H and 18O/16O, as well as the 3H concentration and the chemical composition of the water were determined. The 3H content in various types of water at the “Degelen” test site and the chemical composition of the water are an indirect tool for determining the sources of water formation. Also, the 3H concentration can help in understanding the processes of radionuclide contamination formation and possible water exchange between surface and groundwater.
The ratio of stable isotopes 2H/1H and 18O/16O was measured using an “LGR 912-0008” laser spectrometer (by “Los Gatos Research, Inc”). The international standard “VSMOW-2” (Vienna Standard Mean Ocean Water, IAEA) was used as calibration standards. The precision of the 2H/1H and 18O/16O measurements were ±1 ‰ and ±0.5 ‰, respectively.
To determine 3Н concentration, preliminary preparation of selected water samples was carried out, namely filtration and subsequent mixing of 5 ml of distillate sample aliquot with scintillation cocktail in 1:4 proportion. The 3Н concentration was determined by liquid scintillation spectrometry on ‘TRI-CARB 2900 TR’ (‘PerkinElmer’, USA) β-spectrometer. The error in determining the specific activity of tritium in water samples was ±10%. The detection limit for minimally detectable 3Н activity was <6 Bq/l.
Laboratory work to determine the chemical composition of water (pH, salinity, hardness, and macronutrients – Na++K+, Ca2+, Mg2+, Cl-, SO42-, HCO3-) was conducted in accordance with standards for water sample preparation and analysis. pH values were determined in the field. The salinity (total dissolved solids – TDS) was determined using a “Mettler Toledo” conductivity meter. The content of macronutrients in the water was determined using laboratory gravimetric and titrimetric analysis methods.
2.4. The Isotope Analysis Data Processing
The isotopic composition of water is expressed in relative values δ2Н and δ18О in ‰:
where Rsample and Rstandard relations 2H/1H and 18O/16О in the measured sample and the standard. To analyse the conditions for water formation, the measurement results are plotted on the δ18О – δ2Н diagram with the Local Meteoric Water Line (LMWL), which is built on the basis of the Global Meteoric Water Line (GMWL), taking into account stable isotopes in the atmospheric precipitation of the research region.
To determine the formation of waters at the “Degelen” test site, the deuterium excess (d-excess) was calculated.
3. Results
3.1. Construction of the Local Meteoric Water Line (LMWL)
The results analysis of the stable isotope ratios 2H/1H and 18O/16O in atmospheric precipitation analysis were superimposed on the GMWL graph. Based on the obtained data, the LMWL was constructed (Figure 2). The line was determined using linear regression, which best describes the obtained data.
Isotope analysis of precipitation collected over two years showed significant variations for both δ18O from -5.8‰ to -21.4‰ and δ2H from -39.9‰ to -154.8‰. The “heaviest” values of stable isotopes are recorded from April to September. “Light” isotope composition of precipitation is typical for the period from October to March. These fluctuations are due to seasonal changes in air temperature. The results obtained suggest a significant influence of cryogenic (in the cold season) and evaporative (more often in the warm season) fractionation on the formation of the isotope composition of precipitation, as well as a change in the main sources of atmospheric moisture falling as precipitation.
The equation for the LMWL is as follows: δ2H = 7.44δ18O + 1.9 (R2 = 0.99). For the obtained equation, the slope coefficient remains close to 8. Moreover, the obtained values of the tilt angle are less than the value for the GMWL, which allows us to speak about the significant influence of evaporative fractionation on the isotopic composition of atmospheric precipitation in the research region.
3.2. Determination of the Isotopic Composition of Tunnel Water
The Table 1 presents the obtained values of the isotopic composition of tunnel water.
According to the obtained data, isotopic analysis of tunnel water of the “Degelen” test site revealed variations in the values of the 2H/1H and 18O/16О isotopic ratios. The δ18O values ranged from -8.7‰ to –13.1‰, while δ2H values varied from –75.2‰ to –92.4‰.
To study the formation of tunnel water, the obtained isotopic composition values were plotted on the LMLW (Figure 3).
According to the results of the comparative analysis, the waters sampled in June and August have similar values δ18O and δ2H, which indicates their formation under the influence of similar factors. According to theoretical concepts, during the summer period the waters should undergo intensive evaporation, which leads to a “heavier” isotopic composition (enrichment in heavy isotopes). However, the isotopic data plotted on the LMWL show that the tunnel water are not expose to significant evaporation and have the “lighter” isotopic composition. An exception is represented by the waters of tunnel 504, whose isotopic composition differs significantly from the water of other tunnels.
Calculated d-excess values for the tunnel water ranged from -14.3 to 11. The d-excess data are presented as histograms in Figure 4.
The presented histograms show that for some tunnels, d-excess takes positive values, indicating that the water is not expose to evaporation. For the remaining tunnels (except for tunnel 504), d-excess has slightly negative values, indicating that evaporation is present, but not significant. This is understandable, as the samples were collected from the surface, albeit near the point where the water emerged from underground. All this indicates that the main formation source of tunnel water is water that is not expose to evaporation.
The tunnel 504 water has the “heavy” isotopic composition and the lowest negative d-excess. This indicates that the tunnel 504 water are largely expose to evaporation and the contribution of water not expose to evaporation is insignificant.
3.3. Determination of the Isotopic Composition of Surface (Stream) Water and Groundwater
The results of the isotopic composition of the stream (surface) water of the “Degelen” test site are presented in the Table 2.
According to the obtained data, isotopic analysis of stream water revealed variations in δ18O values ranging from −11.1‰ to −15.6‰ and in δ2H from −86.2‰ to −99.3‰ over the observation period. The calculated d-excess values ranged from −10.3 to 13.9. To interpret the obtained results, the isotopic analysis data were plotted on the LMWL (Figure 5).
The graph clearly demonstrates that samples collected in spring and summer are characterized by a “lighter” isotopic composition compared to samples collected in autumn (located to the right of the LMWL line). This may also be due to the fact that more water with a “lighter” isotopic composition enters the stream in spring and summer than in autumn. At the same time, waters collected in autumn have a “heavier” isotopic composition than those collected in spring and summer. The “heavier” isotopic composition in autumn is due to evaporation processes, leading to isotope fractionation and recharge of the water with “heavy” isotopes, as also evidenced by the d-excess (Figure 6).
These results are easily explained by the formation source of stream water and the climatic conditions of the research region. Spring is characterized by snowmelt and heavy atmospheric precipitation. Summer and early autumn are considered dry periods. In spring, when atmospheric precipitation is high, stream water is formed by a large amount of water that is not expose to evaporation, and d-excess has maximum values. In summer, atmospheric precipitation decreases, the volume of water that is not expose to evaporation also decreases, and d-excess values are close to zero. In autumn, water that is not expose to evaporation practically does not enter the surface waters of streams. This stream water is expose to evaporation, resulting in negative d-excess values.
The results of the isotopic composition of groundwater at the “Degelen” test site are presented in Table 3.
Isotope analysis of groundwater showed that δ18O values varied in the range from -11.3‰ to -14.9‰ and δ2H from -85.1‰ to -106.9‰. To identify the relationship between surface (stream water) and groundwater at the “Degelen” test site, the comparative analysis of the isotopic compositions of water sampled at the same time (in summer) was carried out (Figure 7).
The results of the isotopic analysis of surface and groundwater show that the isotopic composition of the studied samples generally lies near the LMWL, indicating their common atmospheric origin. A partial shift toward more enriched δ¹⁸O and δ²H values is noted for some groundwater samples, likely due to evaporation or mixing with surface water. Furthermore, the results from the groundwater sample of Aktybay stream (p. 6) stand out on the graph for its “heavier” isotopic composition compared to the others, which may indicate a greater degree of evaporation or differences in the source. The isotopic composition of the remaining samples confirms the presence of a hydrological connection between the surface and groundwater in the research area and indicates the same formation source of these waters.
3.4. Determination of 3H Concentration in Water of the “Degelen” Test Site
The results of 3H concentration in water of the “Degelen” test site are presented in the Table 4.
According to the obtained data, the 3H content in the water of the “Degelen” test site varies widely from below the detection limit (<0.006 kBq/L) to 260±25 kBq/L. The maximum values of 3H content is typical for tunnel water, which vary within the range from 6.4 to 260 kBq/L. The stream water is of average contamination level, in which the 3H concentration is from 7 to 58 kBq/L. The least contaminated are groundwater, in which the 3H concentration varies from below the detection limit (<0.006 kBq/L) to 28 kBq/L.
Most of the obtained data of 3H concentrations exceed the water intervention level of 7.6 kBq/L, in accordance with the standard established in the Republic of Kazakhstan. Such high 3H concentrations in the water of the “Degelen” test site, including areas beyond the test site boundaries, indicate a high radiation hazard for the population engaged in cattle breeding at the territories adjacent to the STS and can use the stream water for watering.
Radionuclide 3H is a β-emitter with a half-life of T1/2 = 12.3 years. Although approximately 3 half-lives of 3H have passed since the closure of the STS, such a large amount of it was formed during nuclear tests that its presence in the water at the “Degelen” test site still poses a radiation hazard. Due to its nuclear and physical characteristics, it is a less dangerous isotope in terms of external exposure. However, since 3H is an isotope of hydrogen that is part of the water molecule and many organic compounds, it can be a source of internal human irradiation when inhaled or ingested. Thus, these studies are an important step in taking measures to ensure radiation safety.
3.5. Hydrochemical Parameters of the Water of the “Degelen” Test Site
The major ion concentrations and chemical characteristics of the analyzed water samples of the “Degelen” test site are presented in Table 5.
According to the obtained data, the tunnel water is fresh in terms of mineralization, soft and medium-hard in terms of hardness, and vary from slightly acidic to slightly alkaline in terms of pH. The surface and groundwater of the streams are also fresh in terms of mineralization, with the exception of the Aktybay stream. The groundwater of this stream is brackish, and although the surface water is fresh, its value is very close to the upper limit of the fresh water range. In terms of hardness, all water is soft and medium-hard. The exceptions are the surface water of the Karabulak stream in p. 2, which is hard, and the groundwater of the Karabulak stream p. 2 and the Aktybay stream, which are classified as very hard. In terms of pH, the water is slightly alkaline and alkaline. According to the requirements of the Republic of Kazakhstan, only the groundwater of the Aktybay stream exceed the standards for SO42- content and are not recommended for use in household and drinking purposes.
The hydrochemical facies of the groundwater were studied by plotting the concentrations of the major cations and anions as a Piper trilinear diagram (Figure 8).
Based on the dominance of the major cationic and anionic species in the research area, several hydrochemical facies were identified. The tunnel water is characterized by Ca2+ – Mg2+ – HCO3- and Ca2+ – Mg2+ – SO42- types. Stream water also is predominantly Ca2+ – Mg2+ – HCO3- and Ca2+ – Mg2+ – SO42- types. The groundwater is distinguished by the greatest diversity and include Ca2+ – Mg2+ – HCO3-, Ca2+ – SO42- and Ca2+ – Na+ – SO42- – Cl- types.
4. Discussion
The conducted researches show that:
1) The main recharge source of tunnel water is water coming from the tunnel cavities, which have a "lighter" isotopic composition and are not expose to intense evaporation. These are the so-called condensation waters. The mechanism of their formation can be as follows: moisture that has entered through the infiltration of atmospheric precipitation, including melted snow in the spring, is retained in the pores and microcracks of rocks. The warm air of the tunnels, contacting the rocks surface, heats them, which leads to the evaporation of moisture and its transition to a vaporous state. Water vapor, moving through the air space of the tunnels, reaches colder areas, condenses on the tunnels surface, forming condensation water. These condensation waters form tunnel waters.
Indirect evidence of this conclusion is that tunnel water has higher levels of radionuclide contamination (3H) compared to stream water and groundwater. Condensation water, when in contact with the tunnels walls where nuclear tests were conducted, leach technogenic radionuclides into the water. Thus, contaminated condensation waters are a source of radioactive contamination of tunnel water.
2) The main source of stream water recharge is tunnel water. In spring, the volume of tunnel water is significantly higher than in summer and autumn due not only to atmospheric precipitation, but also due to abundant snowmelt. Accordingly, the contribution of tunnel water to stream water is significantly higher. Due to the arid climate, where the STS and the “Degelen” test site are located, the amount of atmospheric precipitation in summer and autumn is low. The volume of tunnel water decreases, and therefore the contribution to the stream water decreases.
3) Despite the fact that surface and ground waters have similar isotopic composition, higher concentrations of radionuclide contamination are observed in surface waters compared to ground waters. Thus, the main source of radionuclide contamination of surface waters is tunnel water, not groundwater.
The Aktybay stream is of special interest. It can also be assumed that in this case, the main direction of water exchange is the recharge of groundwater due to the infiltration of surface water. The negative d-excess for groundwater of the Aktybay stream can serve as evidence. In nature, groundwater cannot evaporate. The presence of waters expose to evaporation underground indicates the inflow (infiltration) of surface water into groundwater. This can also be confirmed by the 3H content in the surface and groundwater of the stream. While the 3H content in surface water is generally higher than in groundwater for all streams on this test site, this difference is minimal for the Aktybay stream among all the streams.
5. Conclusions
During the research, based on the analysis of atmospheric precipitation, the LMWL was constructed, described by the equation δ2Н = 7.44 δ18О+1.9, and the regression coefficient was R2=0.99. The “heaviest” values of stable isotopes in atmospheric precipitation are recorded from April to September. The “lighter” isotopic composition of precipitation is characteristic of the period from October to March. These fluctuations are due to seasonal changes in air temperature.
The application of the isotope hydrology method, based on the study of the distribution of stable hydrogen (2H) and oxygen (18O) isotopes in water, has made it possible to study in detail the formation processes and recharge of water resources at the “Degelen” test site. The main source of water formation is atmospheric precipitation, including the spring period of intensive snowmelt. It was found that in the summer and autumn periods, in the absence of a significant amount of atmospheric precipitation, tunnel water is replenished mainly by condensation water formed in tunnel cavities. These waters, characterized by an increased radionuclides content, recharge the stream water, which leads to contamination to a greater extent of surface water and, to a lesser extent, groundwater.
Results of isotope hydrology studies show that surface water – the streams of the “Degelen” test site, as well as groundwater – are formed by atmospheric precipitation and condensation water. Since precipitation and condensation water come into contact with the surfaces of the tunnel cavities and, due to leaching, the removal of radionuclides with the water beyond the “Degelen” test site continues. At the same time, the STS was closed more than 30 years ago, and the radionuclide content in the water flowing out beyond the “Degelen” test site, although decreasing, is not due to the law of radioactive decay, but to a much lesser extent. Therefore, radioecological monitoring of surface water at the STS territory to monitor the migration of radionuclide contamination will need to be continued for many years to come.
Author Contributions
Conceptualization, Al.A. and A.M.; methodology, Al.A.; software, A.N.; validation, A.I. and R.Y.; formal analysis, A.N.; investigation, Al.A. and A.N; resources, R.Y.; data curation, A.I. and A.M.; writing—original draft preparation, Al.A.; writing—review and editing, Al.A.; visualization, A.M.; supervision, As.A.; project administration, N.L.; funding acquisition, N.L. All authors have read and agreed to the published version of the manuscript.
Funding
This research was funded by the Ministry of Science and Higher Education of the Republic of Kazakhstan, grant number BR21881915.
Data Availability Statement
Data is contained within the article. Further inquiries can be directed to the corresponding author.
Conflicts of Interest
The authors declare no conflicts of interest.
Abbreviations
The following abbreviations are used in this manuscript:
| STS | Semipalatinsk Test Site |
| GMWL | Global Meteoric Water Line |
| LMWL | Local Meteoric Water Line |
| VSMOW | Vienna Standard Mean Ocean Water |
| IAEA | International Atomic Energy Agency |
References
- Peralta Vital, J.L.; Calvo Gobbetti, L.E.; Llerena Padrón, Y.; Martínez Luzardo, F.H.; Díaz Rizo, O.; Gil Castillo, R. Integration of Isotopic and Nuclear Techniques to Assess Water and Soil Resources’ Degradation: A Critical Review. Appl. Sci. 2024, 14, 9189. [Google Scholar] [CrossRef]
- Dansgaard, W. Stable isotopes in precipitation. Tellus 1964, 16(4), 436–468. [Google Scholar] [CrossRef]
- Van Geldern, R.; Barth, J.A.C. Oxygen and hydrogen stable isotopes in earth’s hydrologic cycle. In book: Isotopic Landscapes in Bioarchaeology; Grupe, G., McGlynn, G., Eds.; Springer: Berlin, Germany, 2016; pp. 173–187. [Google Scholar] [CrossRef]
- Che, C.; Zhang, M.; Argiriou, A.A.; Wang, S.; Du, Q.; Zhao, P.; Ma, Z. The Stable Isotopic Composition of Different Water Bodies at the Soil-Plant-Atmosphere Continuum (SPAC) of the Western Loess Plateau, China. Water 2019, 11, 1742. [Google Scholar] [CrossRef]
- Vodila, G.; Palcsu, L.; Futó, I.; Szanto, Zs. A 9-year record of stable isotope ratios of precipitation in Eastern Hungary: Implications on isotope hydrology and regional palaeoclimatology. Journal of Hydrology 2011, 400(1-2), 144–153. [Google Scholar] [CrossRef]
- Hollins, S.E.; Hughes, C.E.; Crawford, J.; Cendón, D.I.; Meredith, K.T. Rainfall isotope variations over the Australian continent – Implications for hydrology and isoscape applications. Science of The Total Environment 2018, 645, 630–645. [Google Scholar] [CrossRef]
- Li, J.; Pang, Z.; Tian, L.; Zhao, H.; Bai, G. Variations of Stable Isotopes in Daily Precipitation in a Monsoon Region. Water 2022, 14, 2891. [Google Scholar] [CrossRef]
- Pershin, D.; Malygina, N.; Chernykh, D.; Biryukov, R.; Zolotov, D.; Lubenets, L. Variability in Snowpack Isotopic Composition between Open and Forested Areas in the West Siberian Forest Steppe. Forests 2023, 14, 160. [Google Scholar] [CrossRef]
- Wassenaar, L.I.; Athanasopoulos, P.; Hendry, M.J. Isotope hydrology of precipitation, surface and ground waters in the Okanagan Valley, British Columbia, Canada. Journal of Hydrology 2011, 411(1-2), 37–48. [Google Scholar] [CrossRef]
- Jin, J.; Liu, T.; Wang, M.; Liao, Z.; Zhang, J. Hydrochemical and Isotopic Explanations of the Interaction between Surface Water and Groundwater in a Typical-Desertified Steppe of Northern China. Sustainability 2023, 15, 11034. [Google Scholar] [CrossRef]
- Alrehaili, A.M.; Keller, C.K.; Moore, B.C.; Boll, J. Stable isotope hydrology of a polymictic lake: Capturing transience of groundwater interactions. Journal of Hydrology 2024, 639, 131551. [Google Scholar] [CrossRef]
- Li, J.; Liu, H.; Sheng, Y.; Han, D.; Shan, K.; Zhu, Z.; Dai, X. Investigating Groundwater-Surface Water Interactions and Transformations in a Typical Dry-Hot Valley Through Environmental Isotopes Analysis. Water 2025, 17, 775. [Google Scholar] [CrossRef]
- Gana, B.; Rodes, J.M.A.; Díaz, P.; Balboa, A.; Frías, S.; Ávila, A.; Rivera, C.; Sáez, C.A.; Lavergne, C. Geoenvironmental Effects of the Hydric Relationship Between the Del Sauce Wetland and the Laguna Verde Detritic Coastal Aquifer, Central Chile. Hydrology 2024, 11, 174. [Google Scholar] [CrossRef]
- Zhan, Y.; Li, C.; Ning, Y.; Rong, G.; Zhou, Y.; Liu, K.; Li, J.; Wang, H. Stable Water Isotopes Across Marsh, River, and Lake Environments in the Zoige Alpine Wetland on the Tibetan Plateau. Water 2025, 17, 820. [Google Scholar] [CrossRef]
- Lambs, L.; Labiod, M. Climate change and water availability in north-west Algeria: investigation by stable water isotopes and dendrochronology. Water International 2009, 34, 280–286. [Google Scholar] [CrossRef]
- Tetzlaff, D.; Soulsby, C.; Hrachowitz, M.; Speed, M. Relative influence of upland and lowland headwaters on the isotope hydrology and transit times of larger catchments. Journal of Hydrology 2011, 400(3–4), 438–447. [Google Scholar] [CrossRef]
- Chen, K.; Tetzlaff, D.; Goldhammer, T.; Freymueller, J.; Wu, S.; Smith, A.A.; Schmidt, A.; Liu, G.; Venohr, M.; Soulsby, C. Synoptic water isotope surveys to understand the hydrology of large intensively managed catchments. Journal of Hydrology 2023, 623, 129817. [Google Scholar] [CrossRef]
- Mustonen, K.-R.; Marttila, H.; Lehosmaa, K.; Chapman, J.; Juutinen, S.; Koivunen, I.; Korkiakoski, M.; Lohila, A.; Welker, J.; Jyvasjarvi, J. From thaw till fall: Interacting hydrology, carbon cycle, and greenhouse gas dynamics in a subarctic stream-lake continuum. Science of The Total Environment 2024, 957, 177434. [Google Scholar] [CrossRef]
- Rex, C.L.; Tyler, J.J.; Nagaya, K.; Staff, R.A.; Leng, M.J.; Yamada, K.; Kitaba, I.; Kitagawa, J.; Kojima, H.; Nakagawa, T. The contemporary stable isotope hydrology of Lake Suigetsu and surrounding catchment (Japan) and its implications for sediment-derived palaeoclimate records. Quaternary Science Advances 2024, 13, 100145. [Google Scholar] [CrossRef]
- Smerdon, B.; Maccagno, J.B.T.; Peter, B.; Neilson, W.; Mussell, D.; Trew, D. A Community-Led Assessment to Identify Groundwater-Dependent Lakes in Parkland County (Alberta, Canada). Water 2025, 17, 440. [Google Scholar] [CrossRef]
- Noble, J.; Ansari, M.A. Isotope hydrology and geophysical techniques for reviving a part of the drought prone areas of Vidarbha, Maharashtra, India. Journal of Hydrology 2019, 570, 495–507. [Google Scholar] [CrossRef]
- Stadler, S.; Osenbrück, K.; Suckow, A.O.; Himmelsbach, T.; Hötzl, H. Groundwater flow regime, recharge and regional-scale solute transport in the semi-arid Kalahari of Botswana derived from isotope hydrology and hydrochemistry. Journal of Hydrology 2010, 388(3-4), 291–303. [Google Scholar] [CrossRef]
- Yang, Z.; Hu, L.; Ma, H.; Zhang, W. Hydrochemical Characteristics of Groundwater and Their Significance in Arid Inland Hydrology. Water 2023, 15, 1641. [Google Scholar] [CrossRef]
- Han, Y.; Zhao, H.; Ji, Y.; Wang, Y.; Zhang, L. The Hydrogeochemical Characteristics and Formation Mechanisms of the High-Salinity Groundwater in Yuheng Mining Area of the Jurassic Coalfield, Northern Shaanxi, China. Water 2025, 17, 1459. [Google Scholar] [CrossRef]
- Narancic, B.; Wolfe, B.B.; Pienitz, R.; Meyer, H.; Lamhonwah, D. Landscape-gradient assessment of thermokarst lake hydrology using water isotope tracers. Journal of Hydrology 2017, 545, 327–338. [Google Scholar] [CrossRef]
- Feher, R.; Bădăluță, C.-A.; Brad, T.; Drăgan, C.; Drăgușin, V.; Măntoiu, D.Ș.; Perșoiu, A.; Tîrlă, M.-L. Stable Isotope Hydrology of Karst Groundwaters in Romania. Water 2024, 16, 1489. [Google Scholar] [CrossRef]
- Bagheri, R.; Karami, G.H.; Jafari, H.; Eggenkamp, H.; Shamsi, A. Isotope hydrology and geothermometry of the thermal springs, Damavand volcanic region, Iran. Journal of Volcanology and Geothermal Research 2020, 389, 106745. [Google Scholar] [CrossRef]
- Clark, I.; Fritz, I. Deuterium excess “d” in meteoric waters. In Environmental isotopes in hydrogeology; Lewis Publishers: NY, 1997; pp. 43–45. [Google Scholar]
- Erostate, M.; Huneau, F.; Garel, E.; Vystavna, Y.; Santoni, S.; Pasqualini, V. Coupling isotope hydrology, geochemical tracers and emerging compounds to evaluate mixing processes and groundwater dependence of a highly anthropized coastal hydrosystem. Journal of Hydrology 2019, 578, 123979. [Google Scholar] [CrossRef]
- Ansari, Md.A.; Kumar, U.S.; Noble, J.; Akhtar, N.; Akhtar, M.A.; Deodhar, A. Isotope hydrology tools in the assessment of arsenic contamination in groundwater: An overview. Chemosphere 2023, 340, 139898. [Google Scholar] [CrossRef]
- Aidarkhanova, А.K.; Lukashenko, S.N.; Larionova, N.V.; Polevik, V.V. Radionuclide transport in the “sediments – water – plants” system of the water bodies at the Semipalatinsk test site. Journal of Environmental Radioactivity 2018, 184-185, 122–126. [Google Scholar] [CrossRef]
- Batyrbekov, E.G.; Aidarkhanov, A.O.; Vityuk, V.A.; Larionova, N.V.; Umarov, M.A. Comprehensive radioecological survey of the Semipalatinsk test site: monograph, 1rd ed.; Kurchatov, Kazakhstan, 2021; pp. 24–28. (in Russian) [Google Scholar]
- Subbotin, S.B.; Dubasov, Yu.V. Radioactive Contamination of Water of the Degelen Mountain Massif. Radiochemistry 2013, 55(6), 647–654. [Google Scholar] [CrossRef]
- Panitskiy, A.V.; Lukashenko, S.N. Nature of radioactive contamination of components of ecosystems of streamflows from tunnels of Degelen massif. Journal of Environmental Radioactivity 2015, 144, 32–40. [Google Scholar] [CrossRef] [PubMed]
- Turchenko, D.V.; Lukashenko, S.N.; Aidarkhanov, A.O.; Lyakhova, O.N. Studying of tritium content in snowpack of Degelen mountain range. Journal of Environmental Radioactivity 2014, 132, 115–120. [Google Scholar] [CrossRef] [PubMed]
- Subbotin, S.B.; Lukashenko, S.N.; Kashirsky, V.M.; Yakovenko, Yu.Yu.; Bakhtin, L.V. Underground migration of artificial radionuclides beyond the Degelen mountain range. In book: Topical issues of Kazakhstan radioecology; Lukashenko, S.N., Ed.; Printing House: Pavlodar, Kazakhstan, 2010; Volume 2, pp. 103–156. (in Russian) [Google Scholar]
- Lyakhova, O.N.; Lukashenko, S.N.; Umarov, M.A.; Aidarkhanov, A.O. Research of tritium content in environmental objects at the territory of the “Degelen” test site. Bulletin NNC RK 2007, 4, 80–86. (in Russian). [Google Scholar]
- Knatova, M.K.; Umarov, M.A.; Burkitbaev, M.M.; Vintro, L.L.; Mitchell, P.I.; Priest, N. Radionuclide analysis of water samples from the former Semipalatinsk test site. News of the National Sciences Academy of the Republic of Kazakhstan 2006, 6, 41–46. (in Russian). [Google Scholar]
- Nadeyeva, A.M.; Mamyrbayeva, A.C.; Aidarkhanova, A.K.; Larionova, N.V.; Aidarkhanov, A.O.; Maden, B.E. Reconnaissance survey of water resources to assess the impact of atmospheric precipitation on their qualitative and quantitative composition (Beskaragay village, Abay region). Bulletin NNC RK 2024, 99(3), 153–159. (in Russian). [Google Scholar] [CrossRef]
Figure 1.
Location of the “Degelen” test site with sampling points at the STS territory.
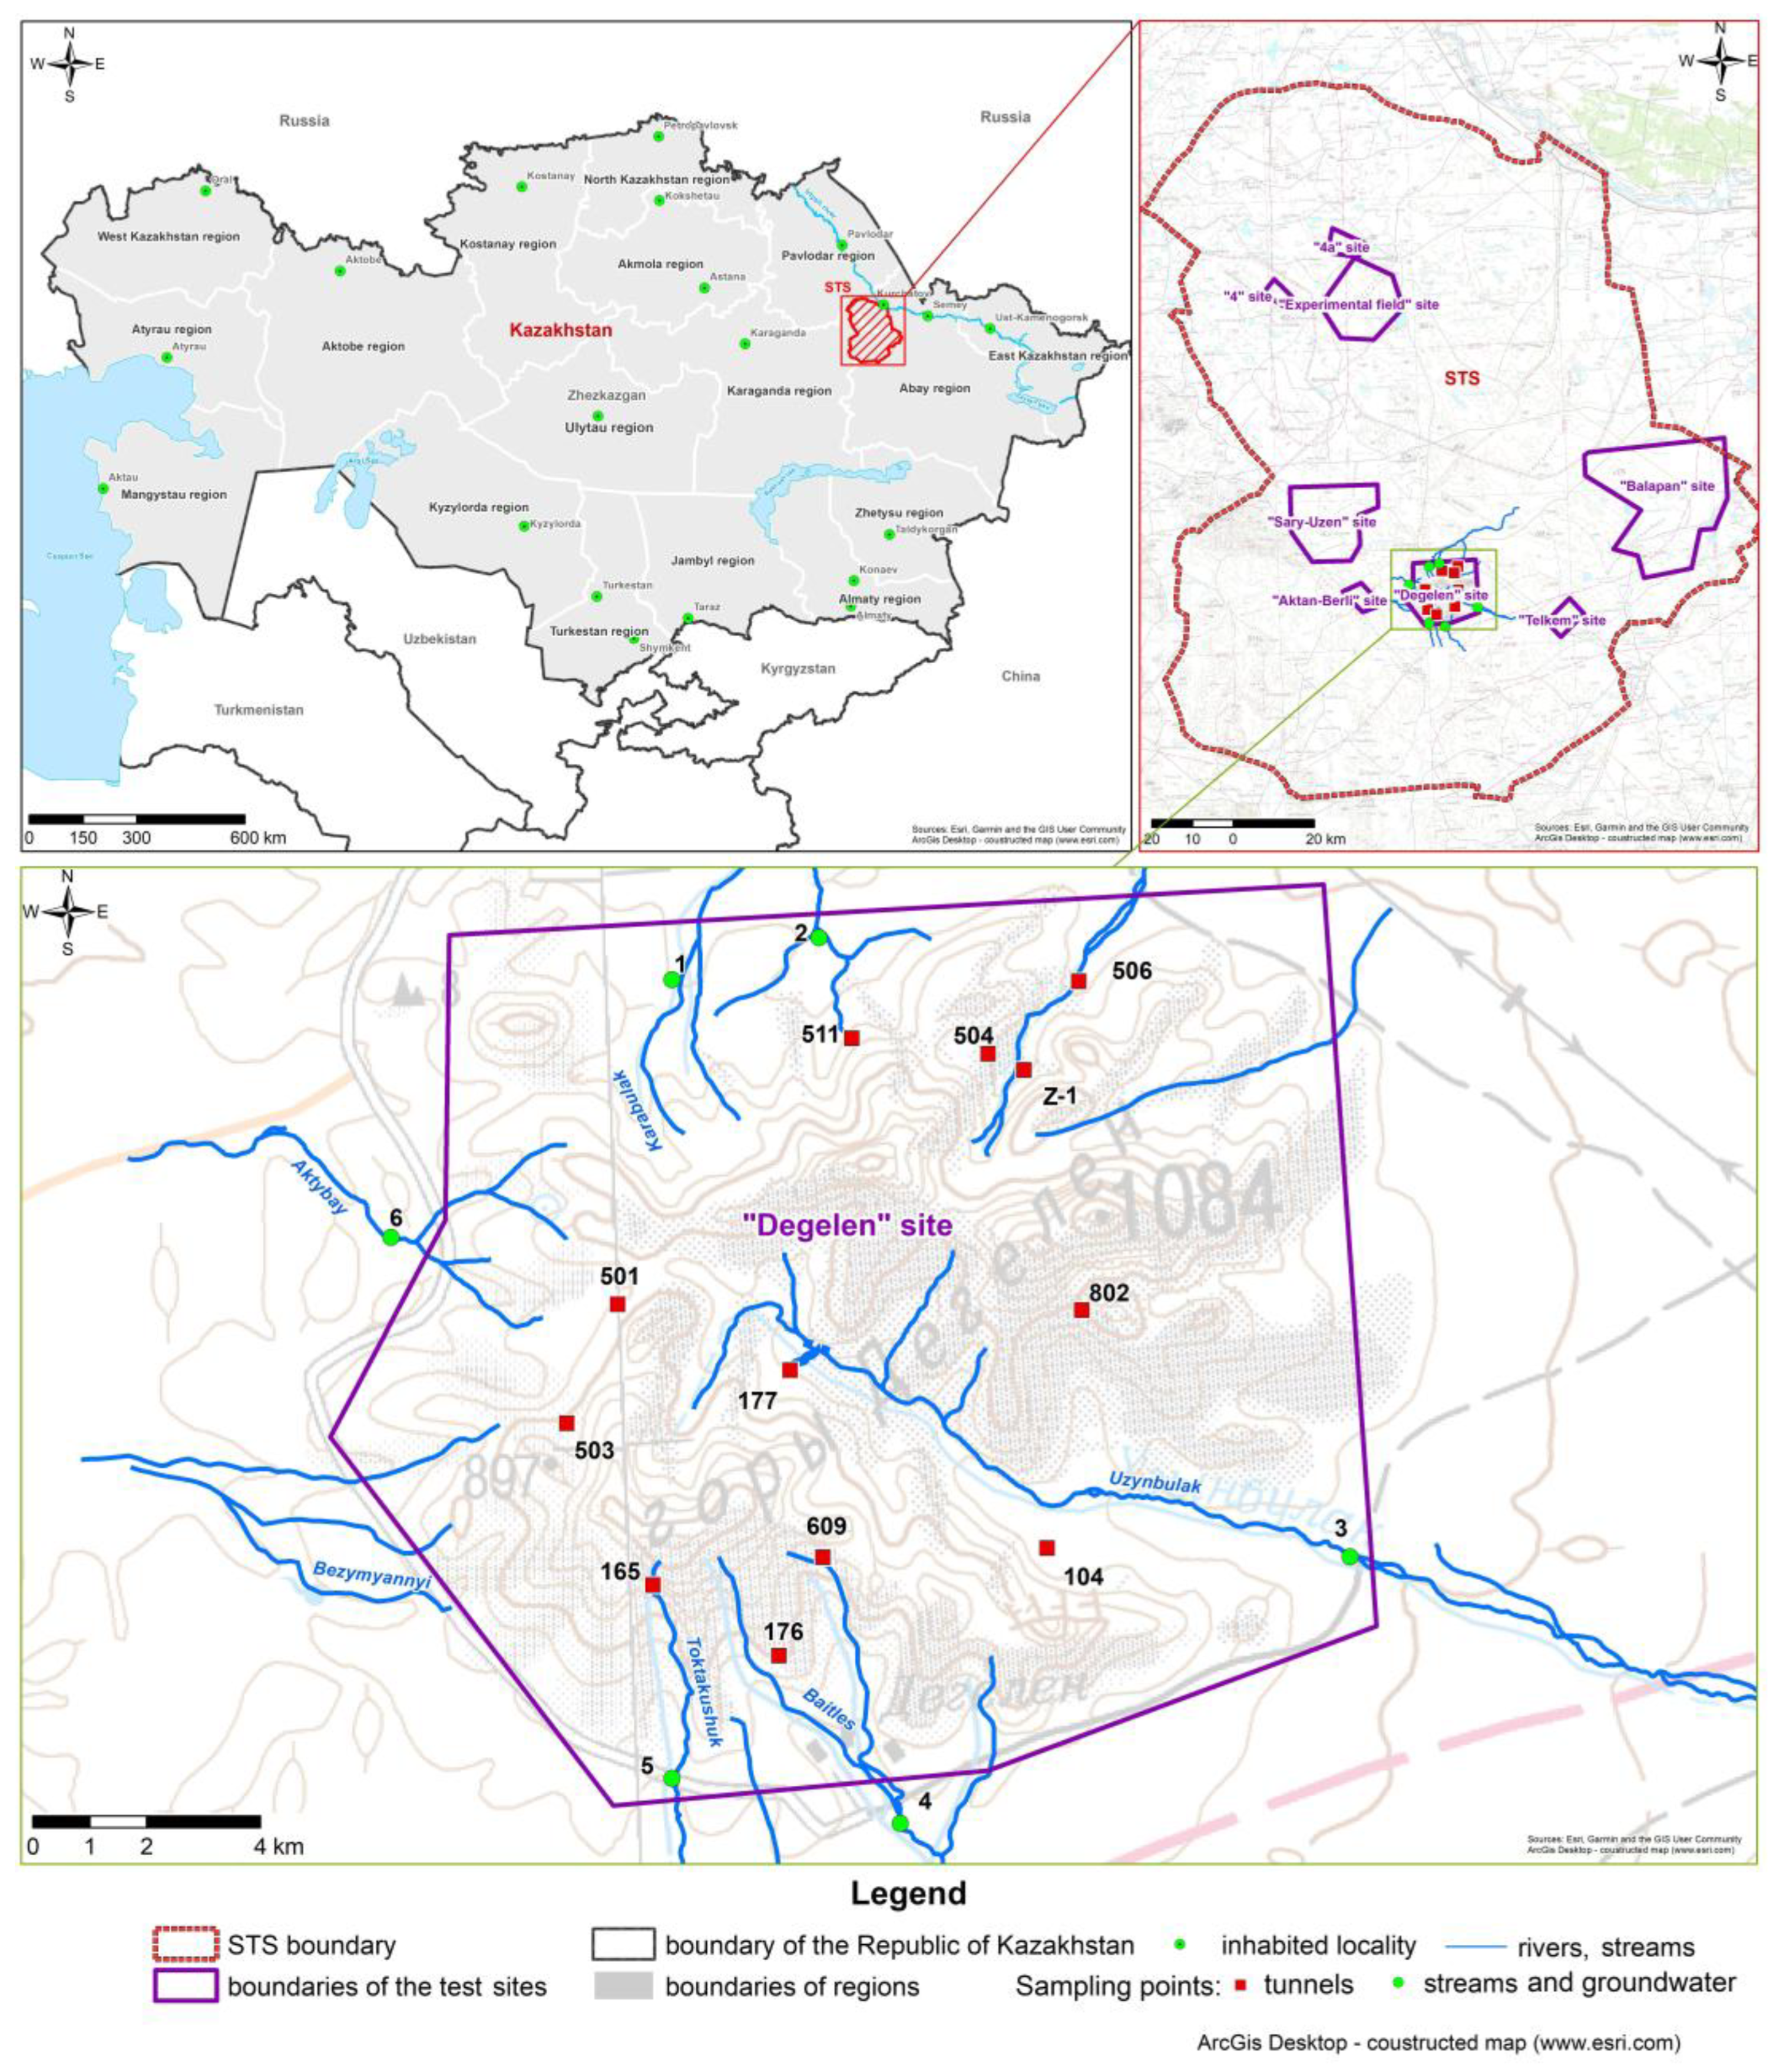
Figure 2.
Local meteoric water line (LMWL).
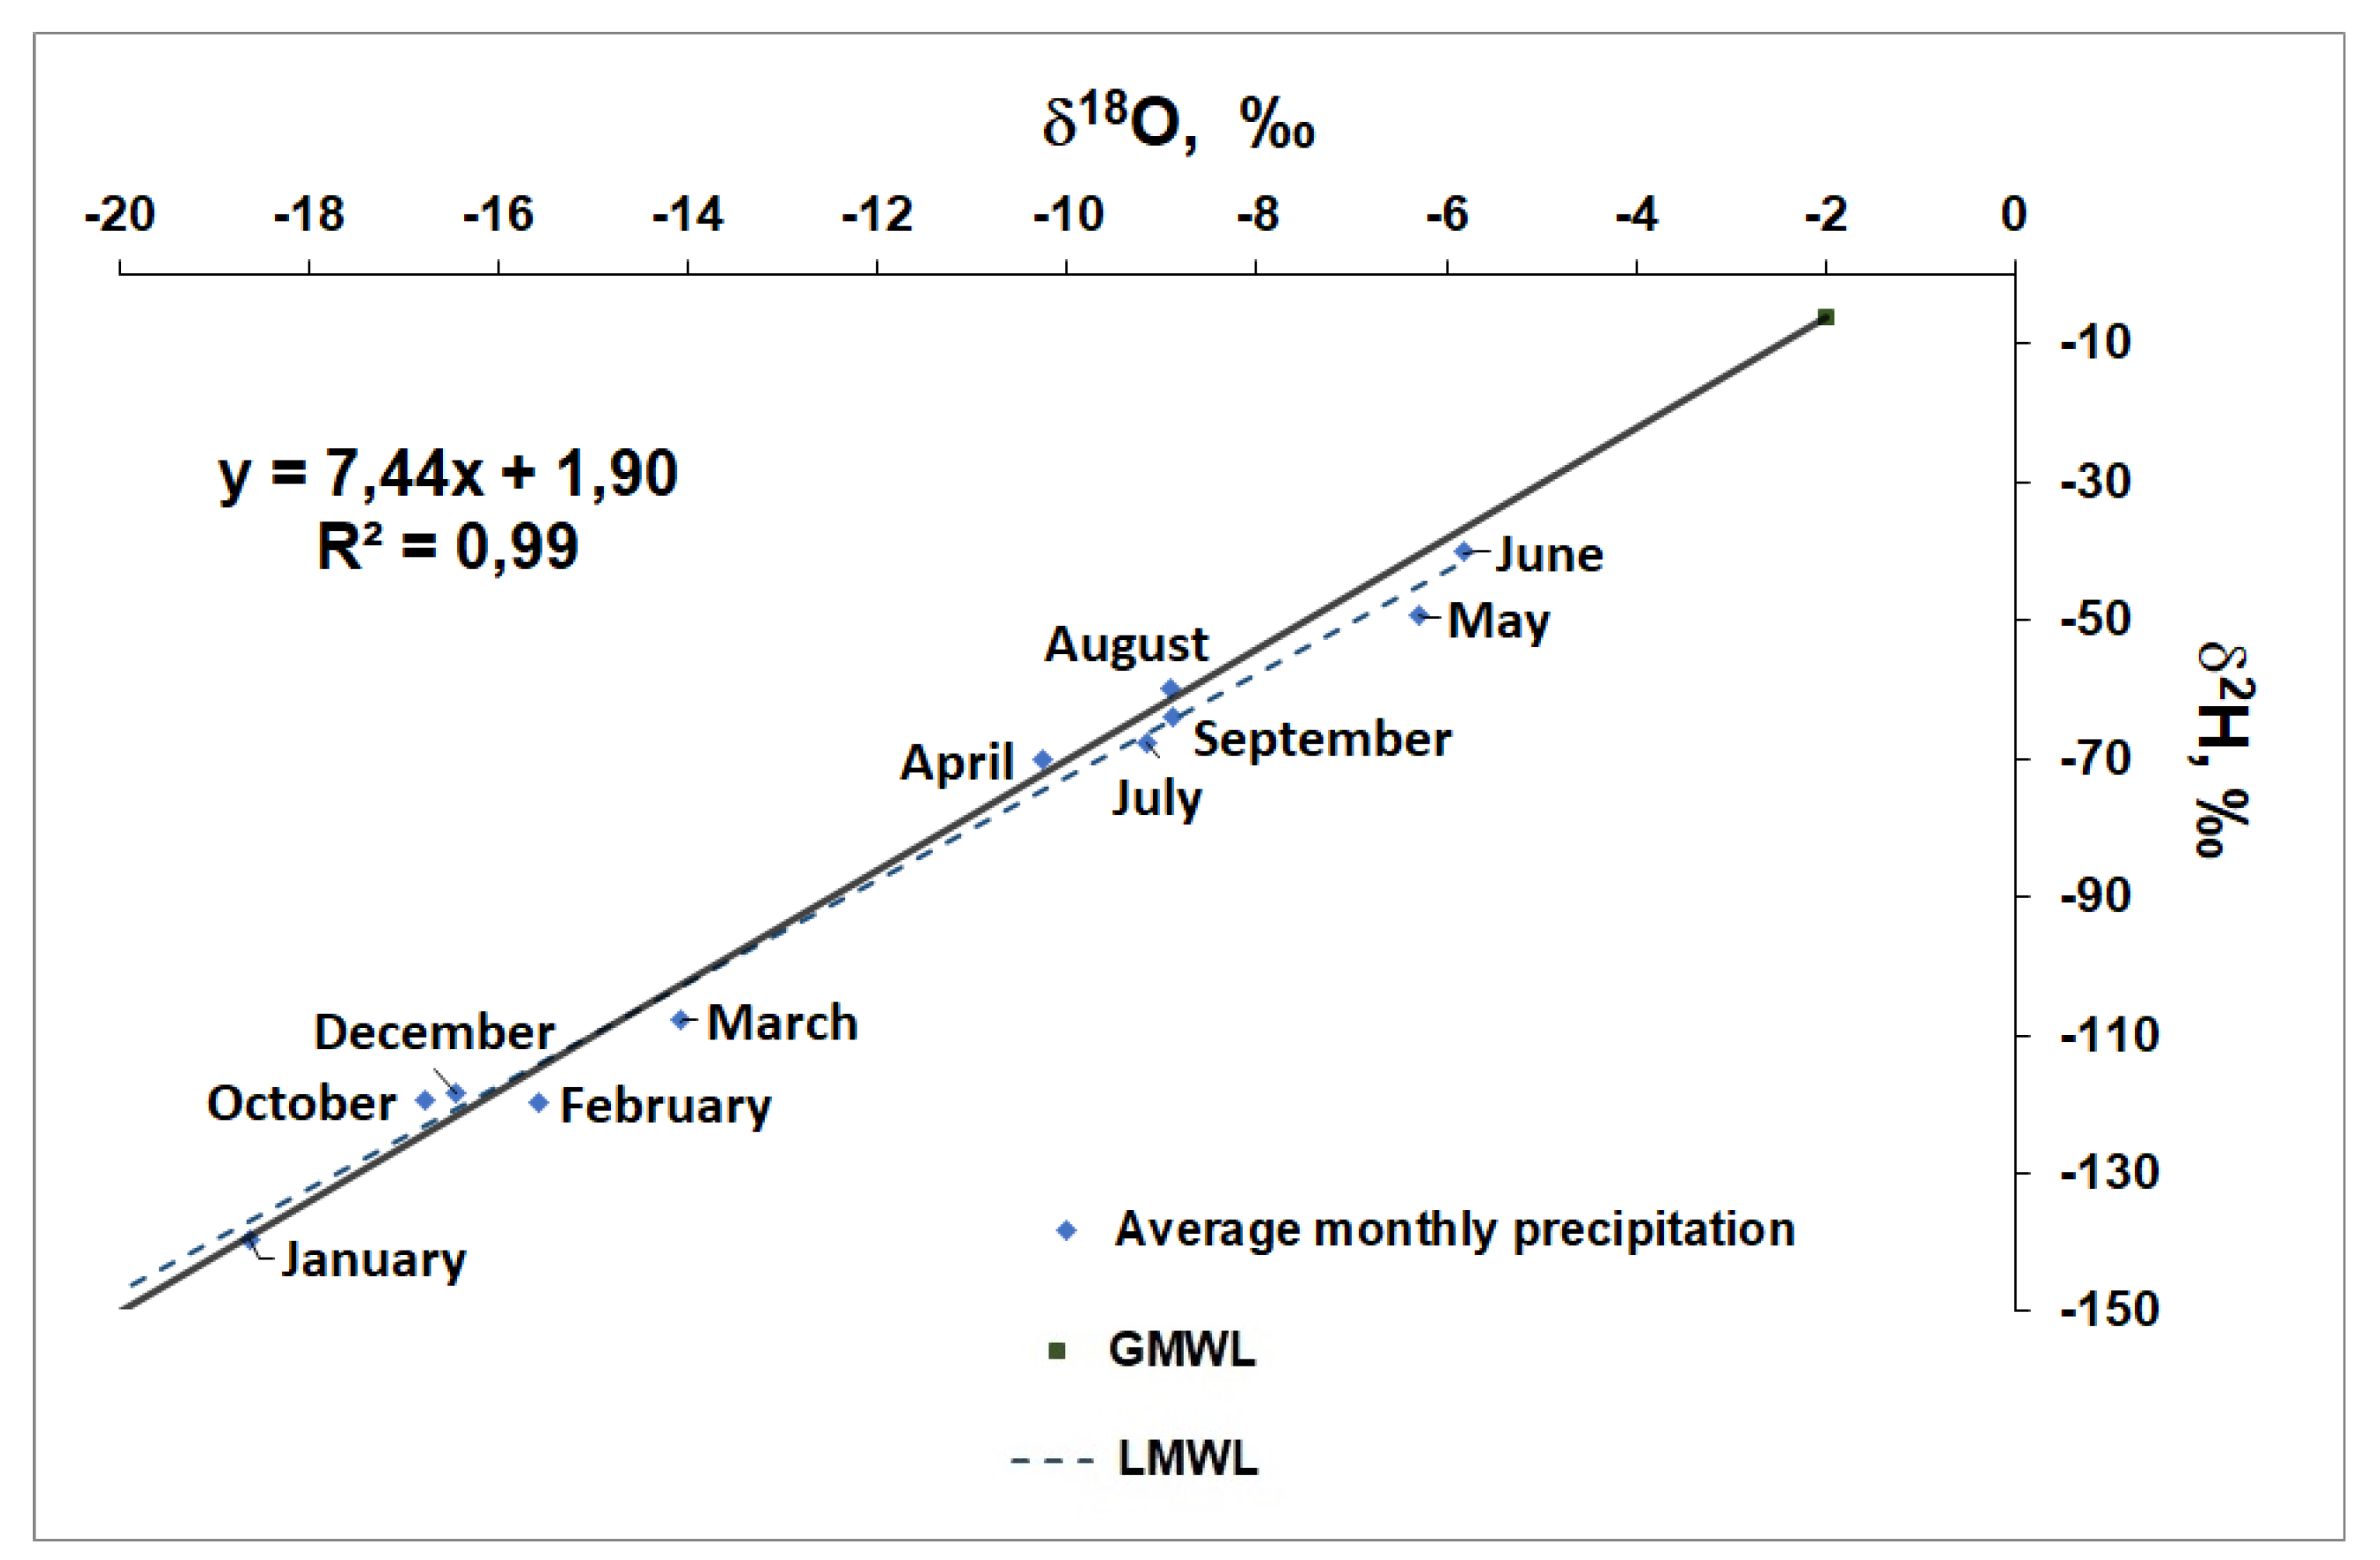
Figure 3.
Analysis of the tunnel water isotopic composition.
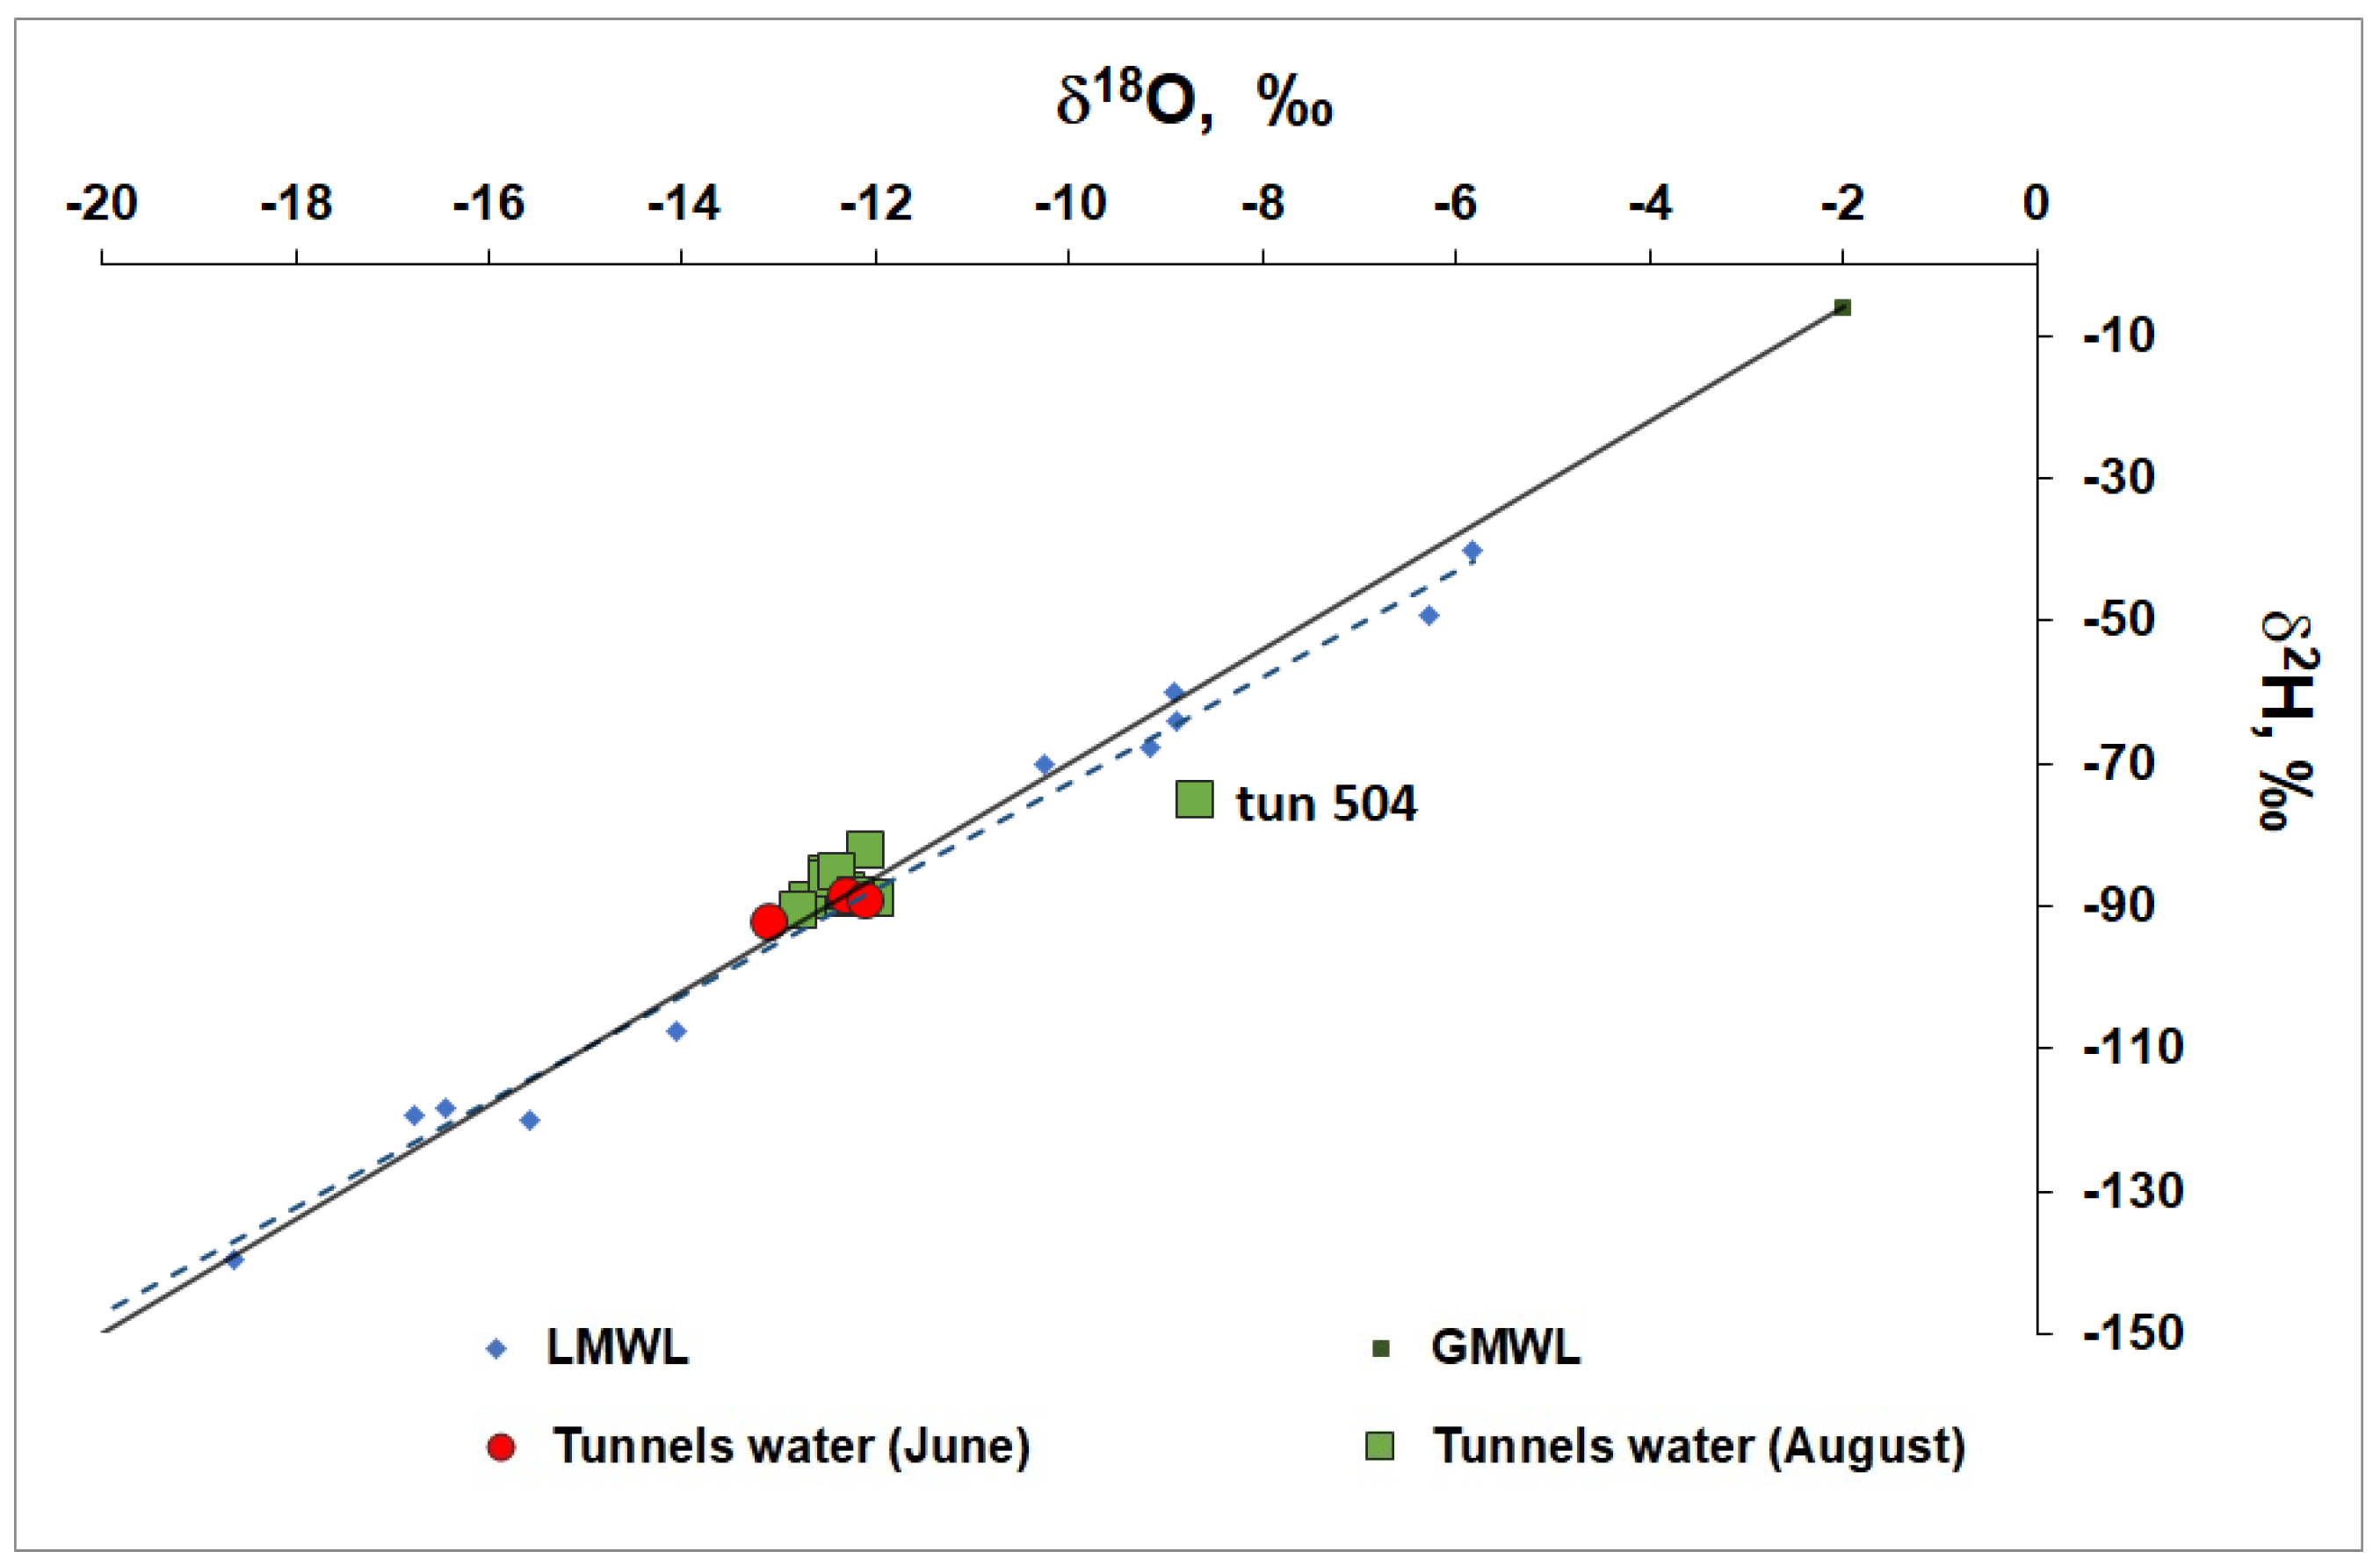
Figure 4.
The d-excess values in tunnel water: (a) in June; (b) in August.
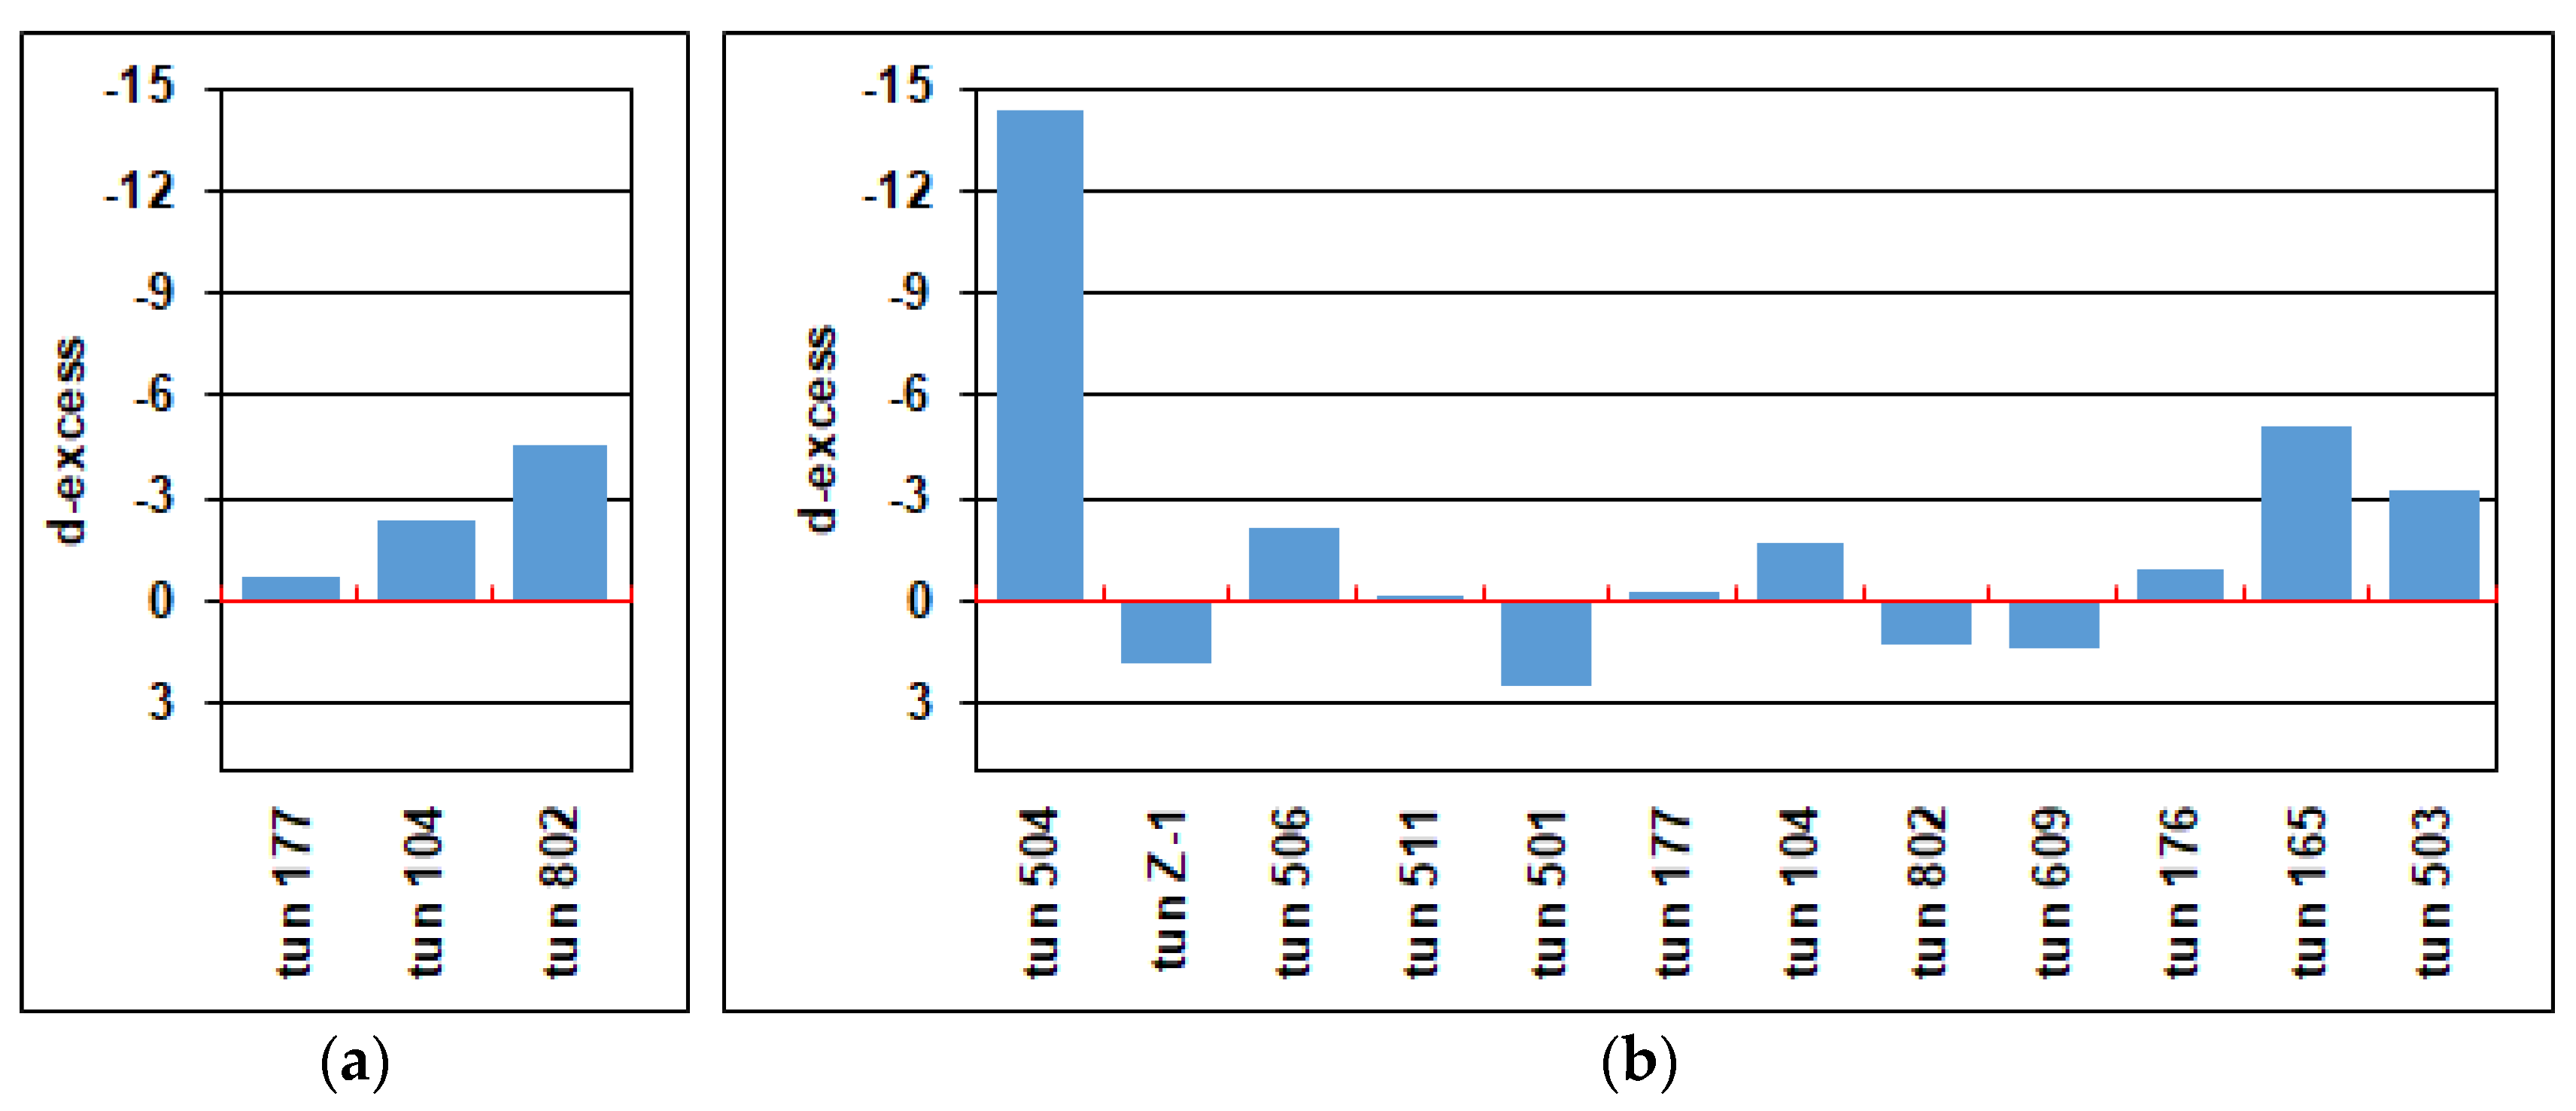
Figure 5.
Analysis of the surface water isotopic composition.
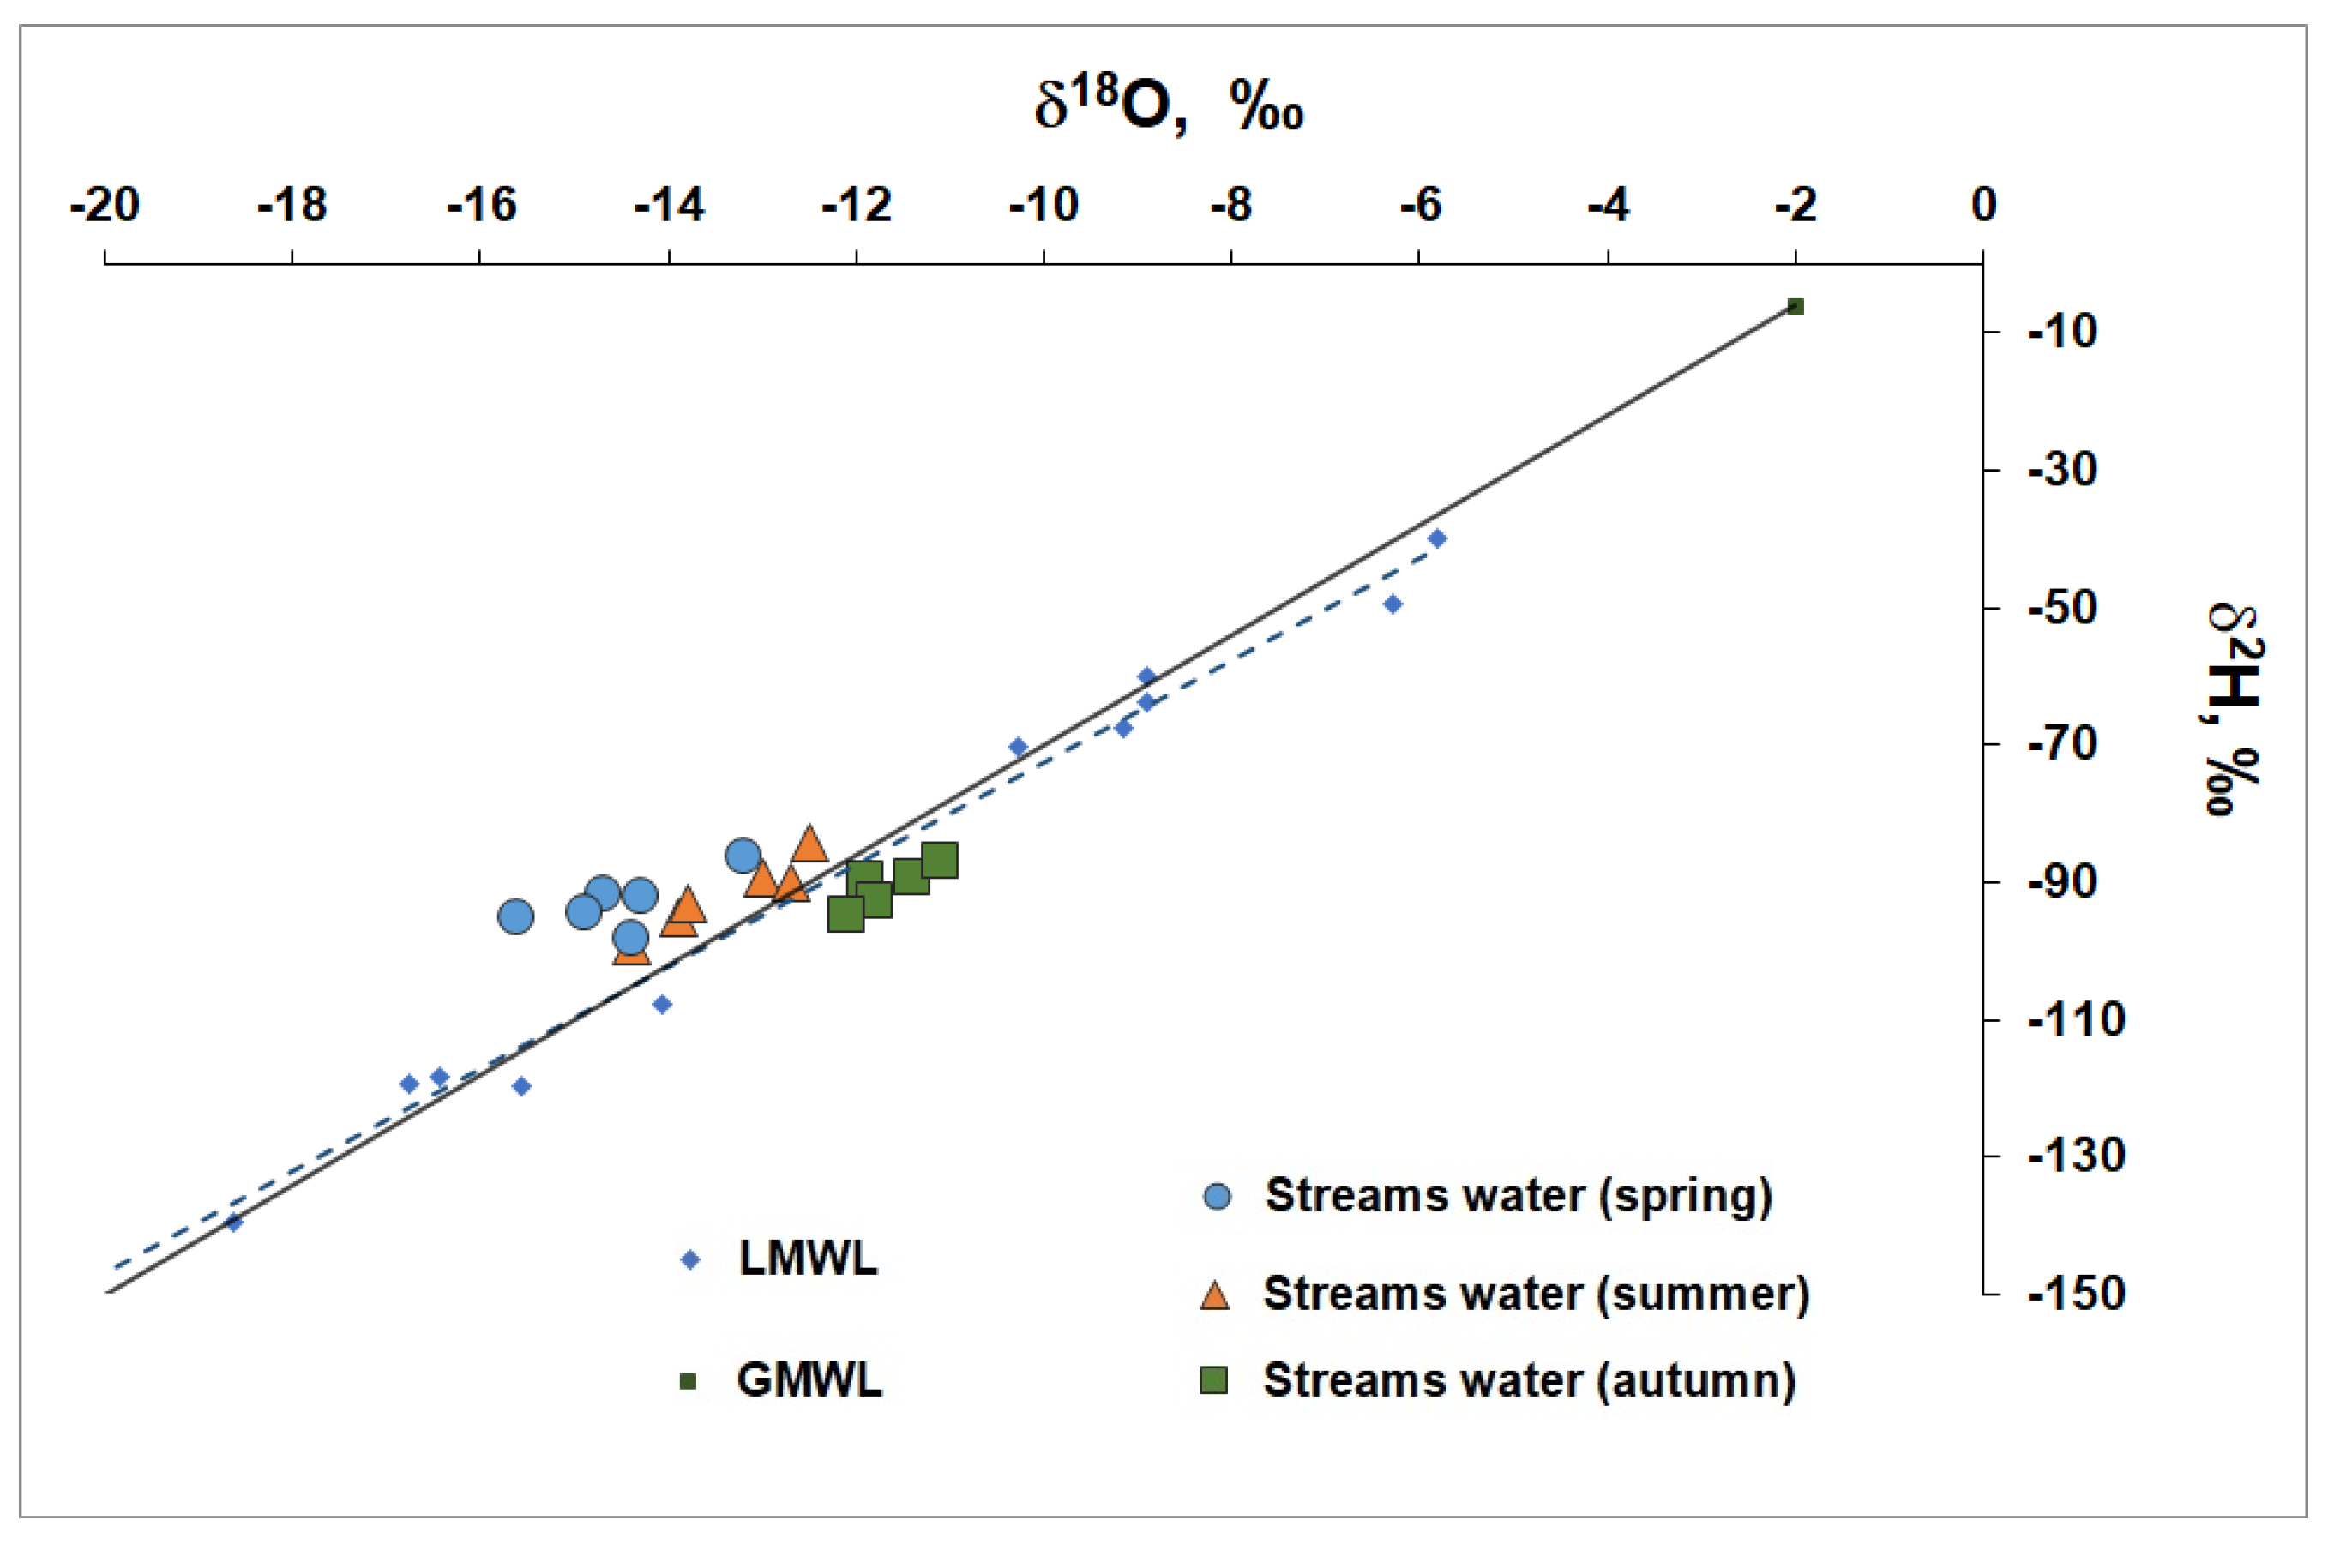
Figure 6.
The d-excess values in stream water.
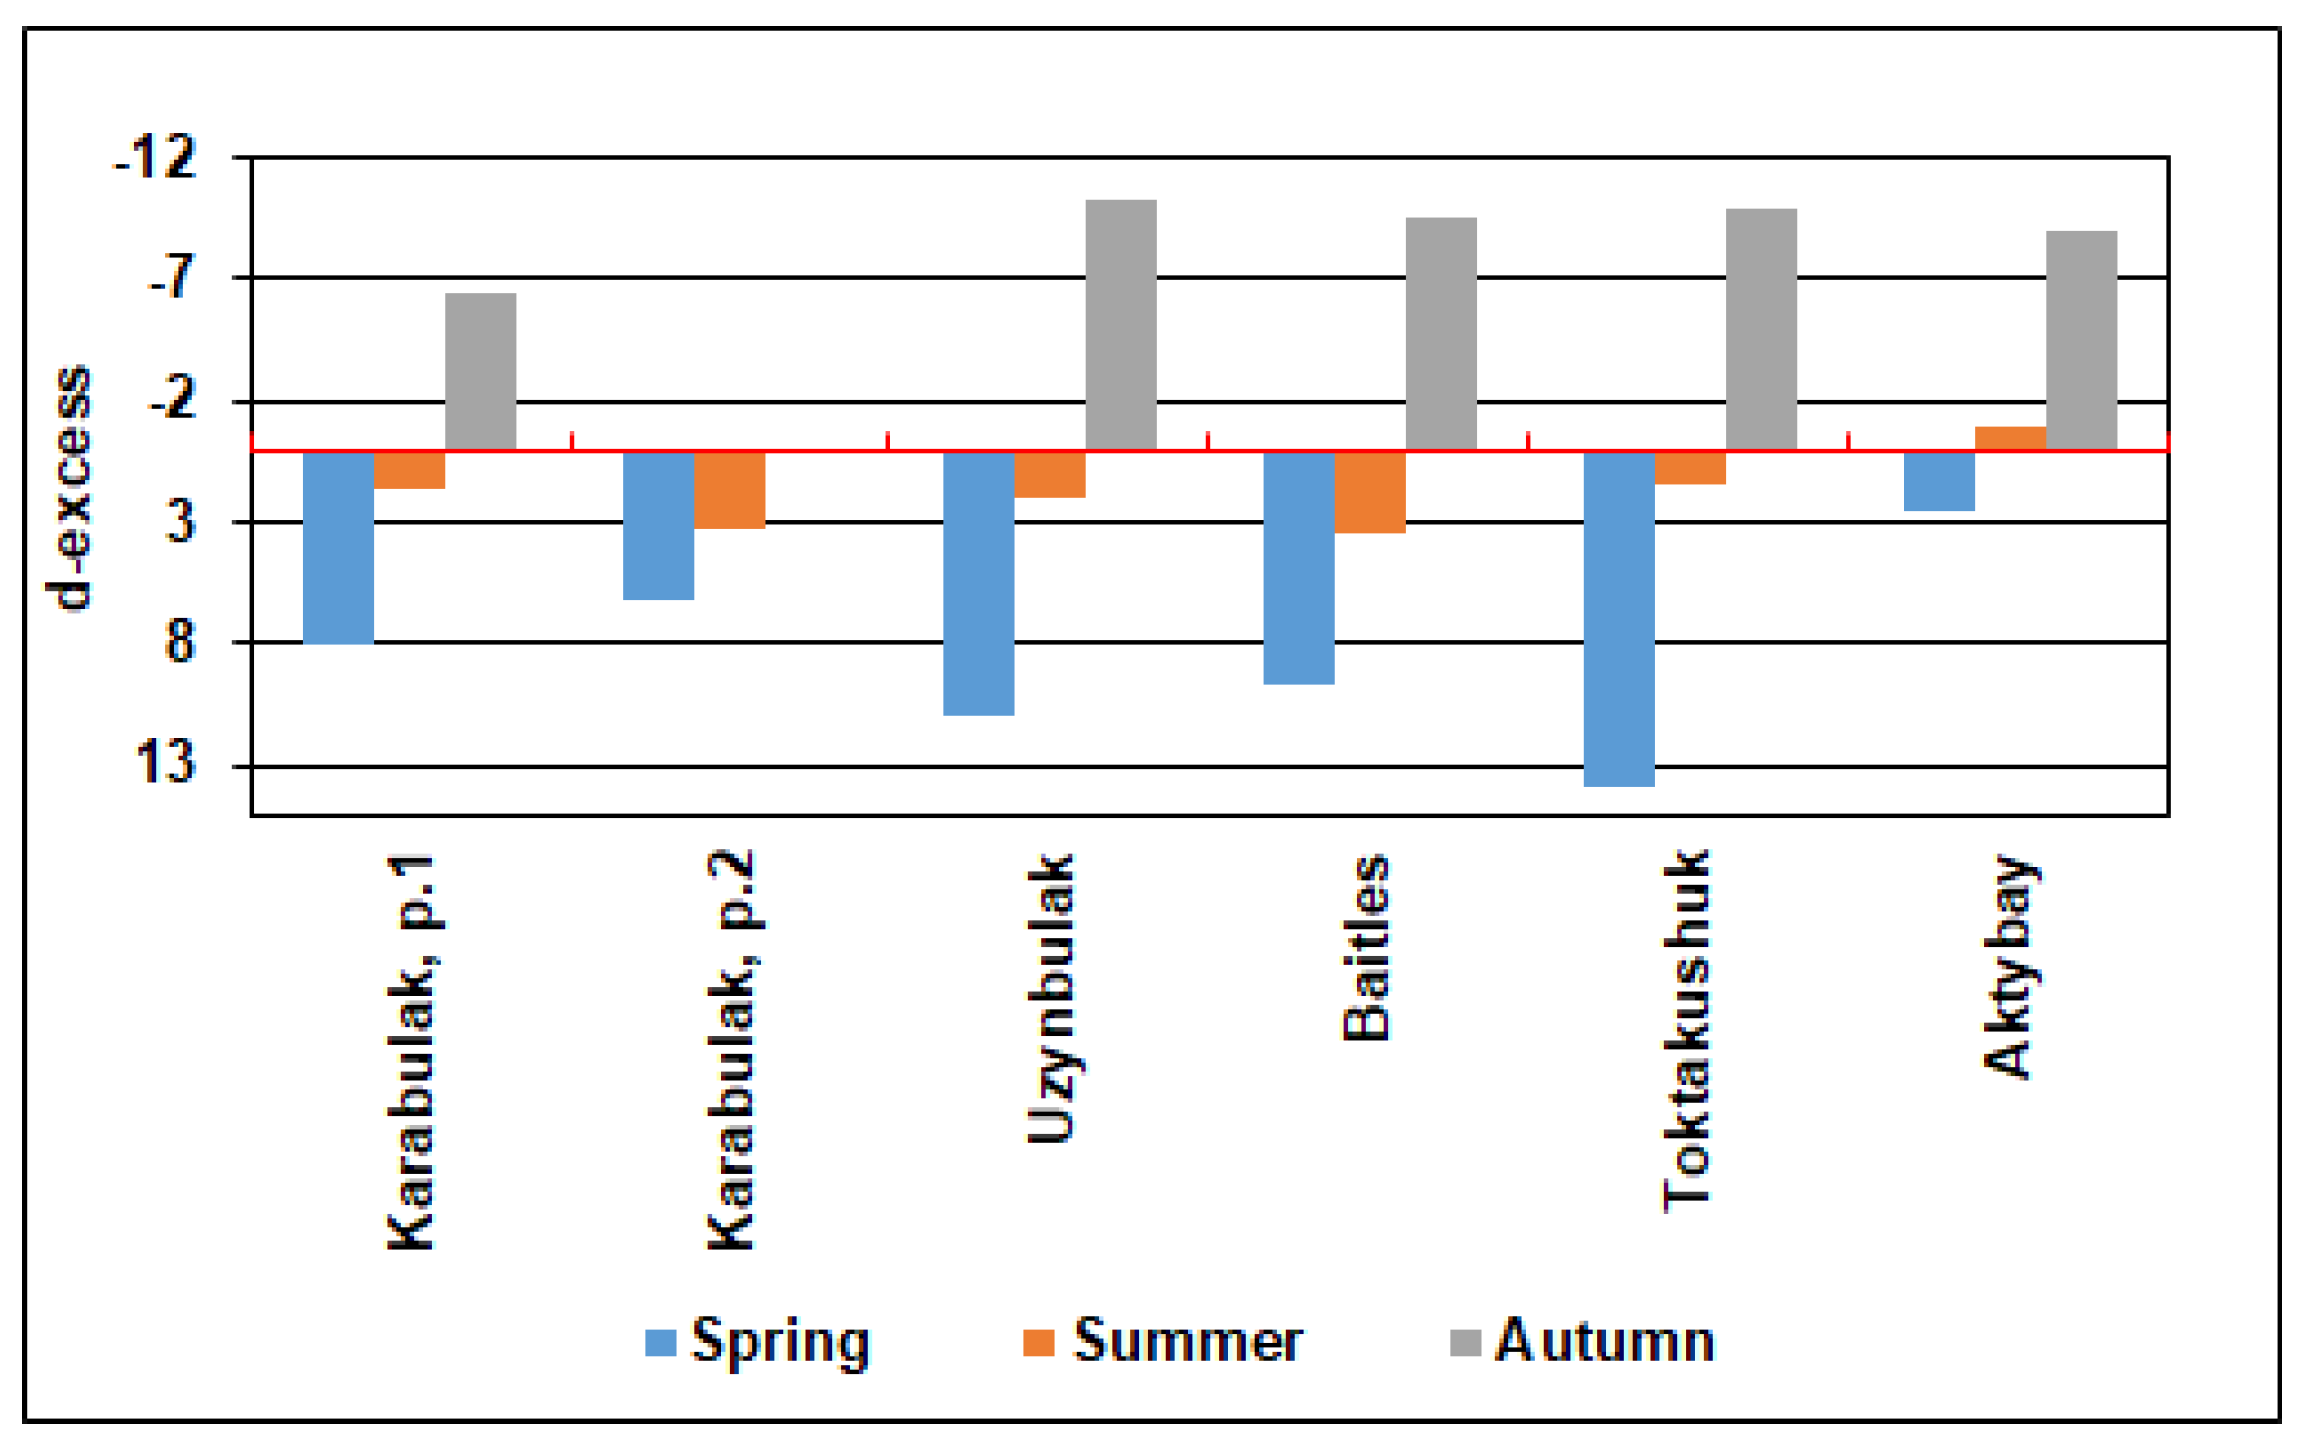
Figure 7.
Analysis of the isotopic composition of surface and groundwater in summer.
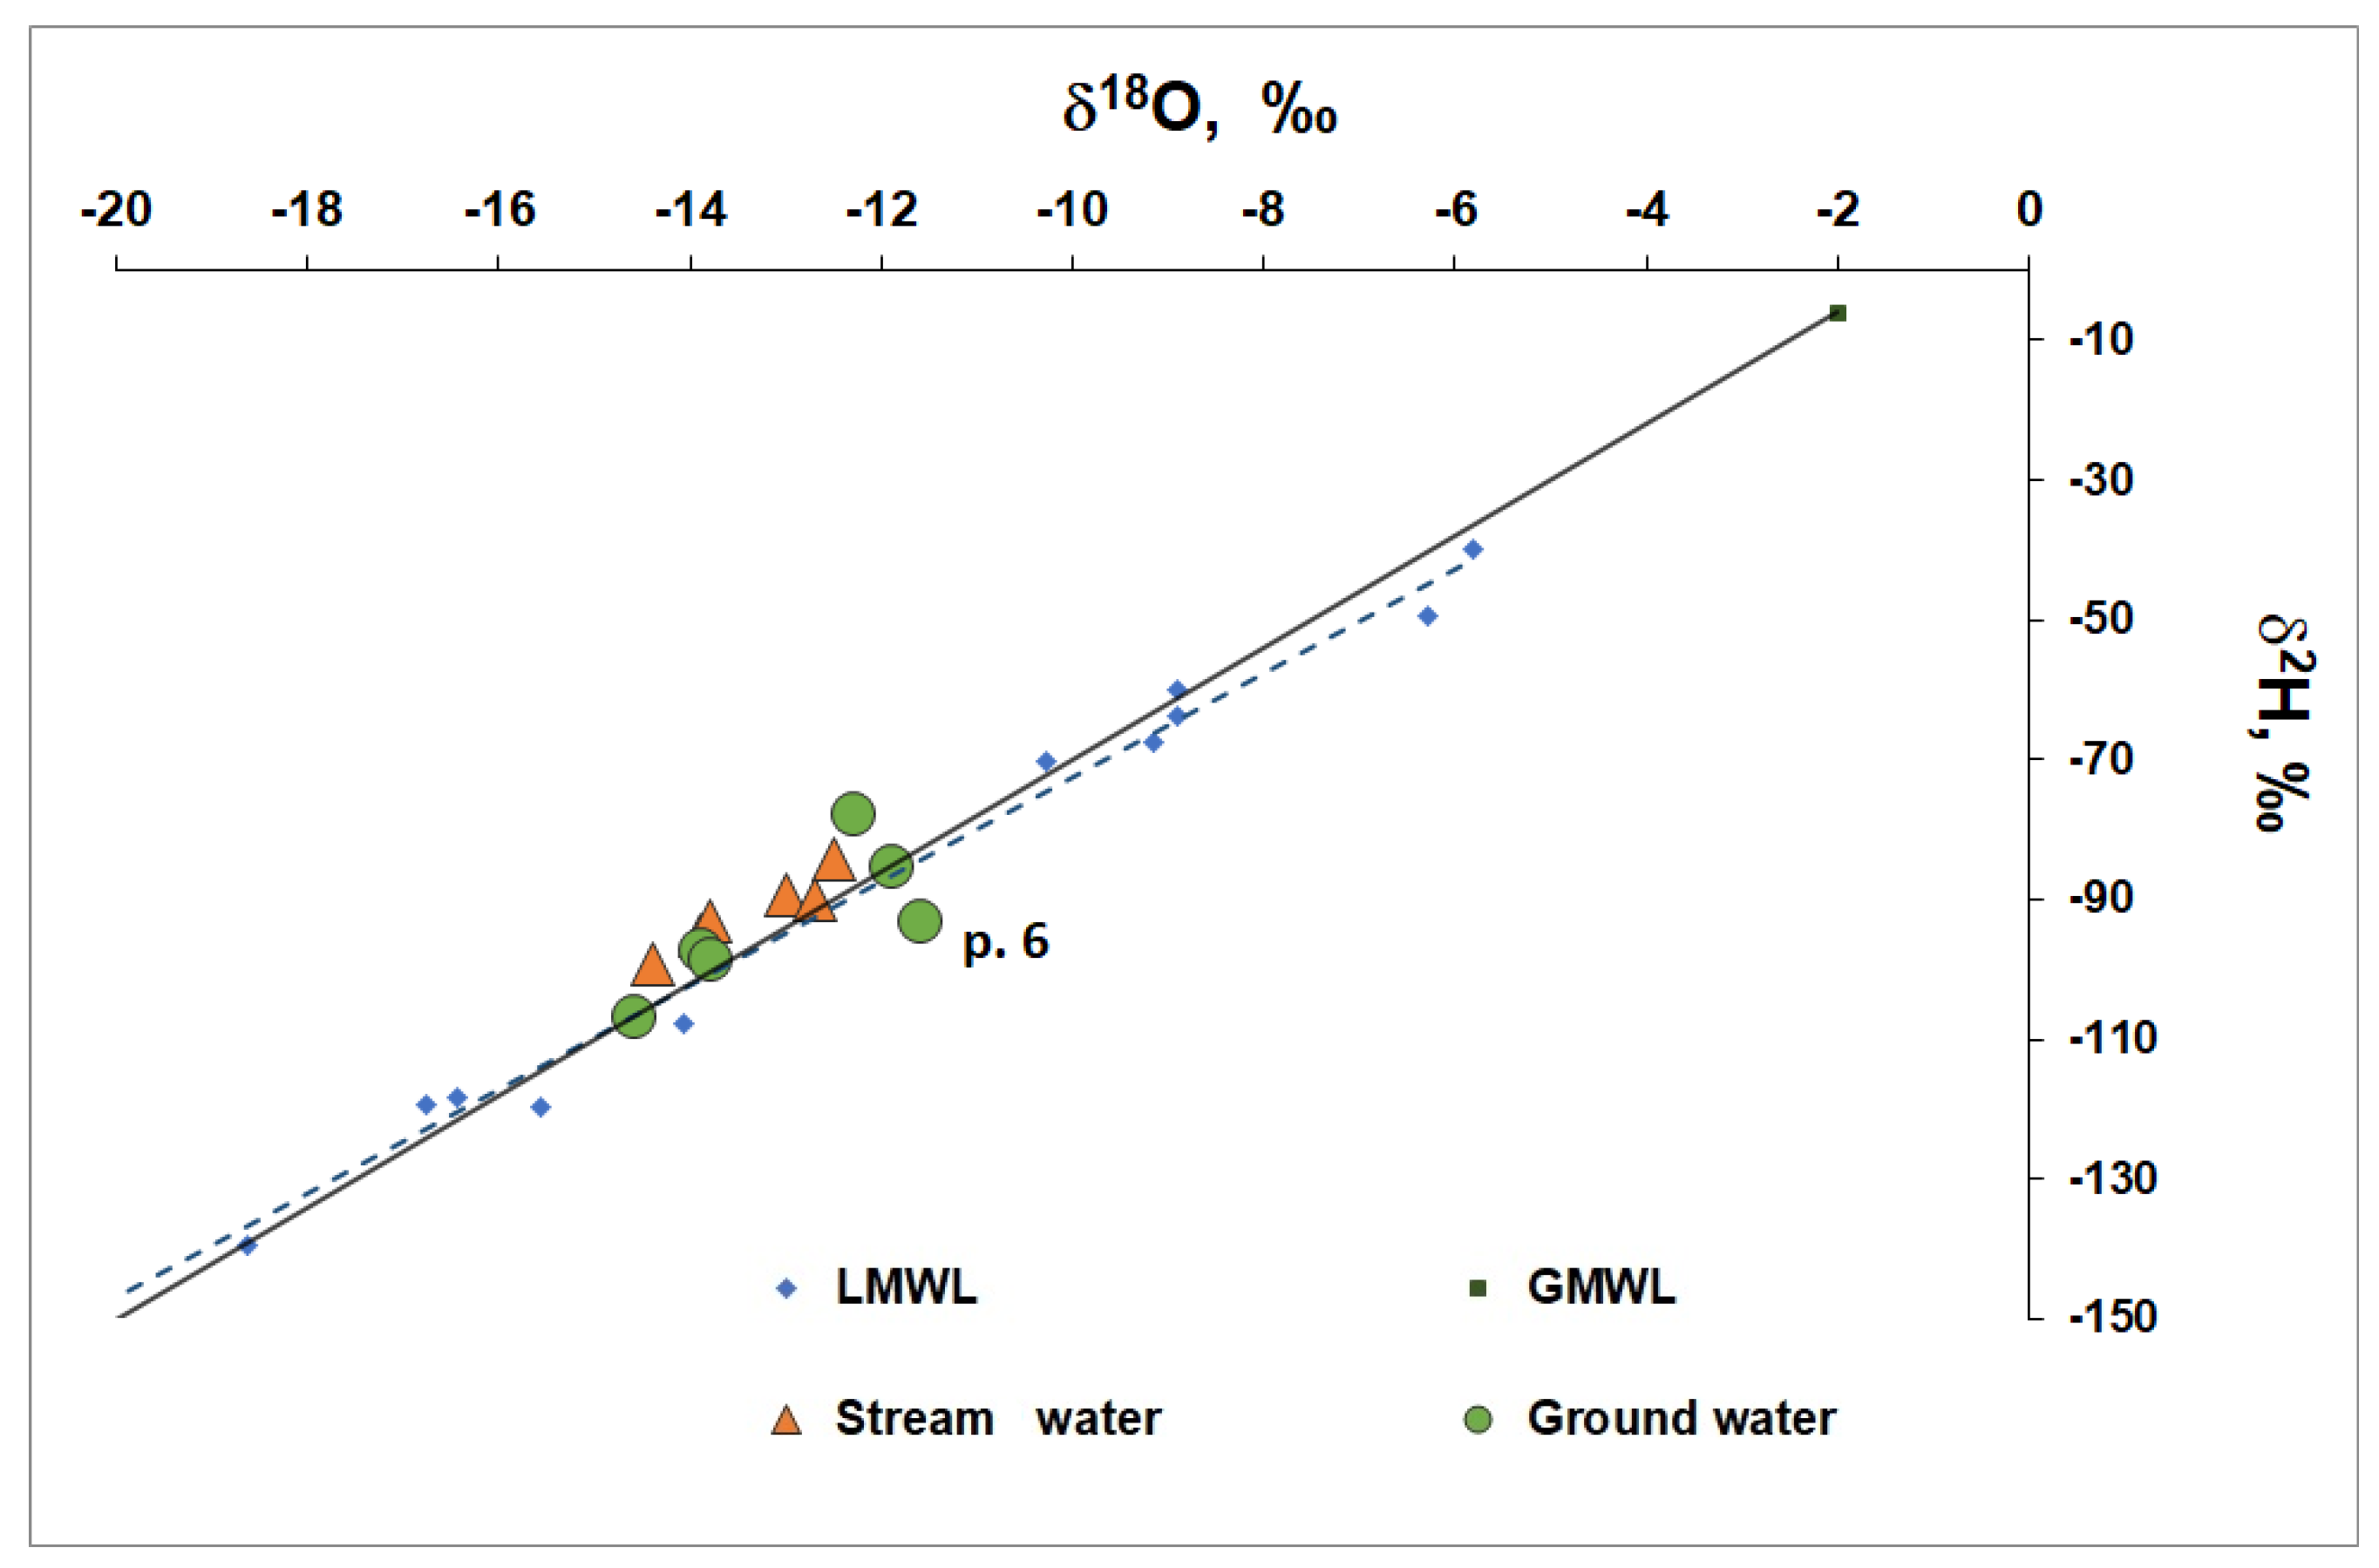
Figure 8.
Piper diagram of the analyzed water.
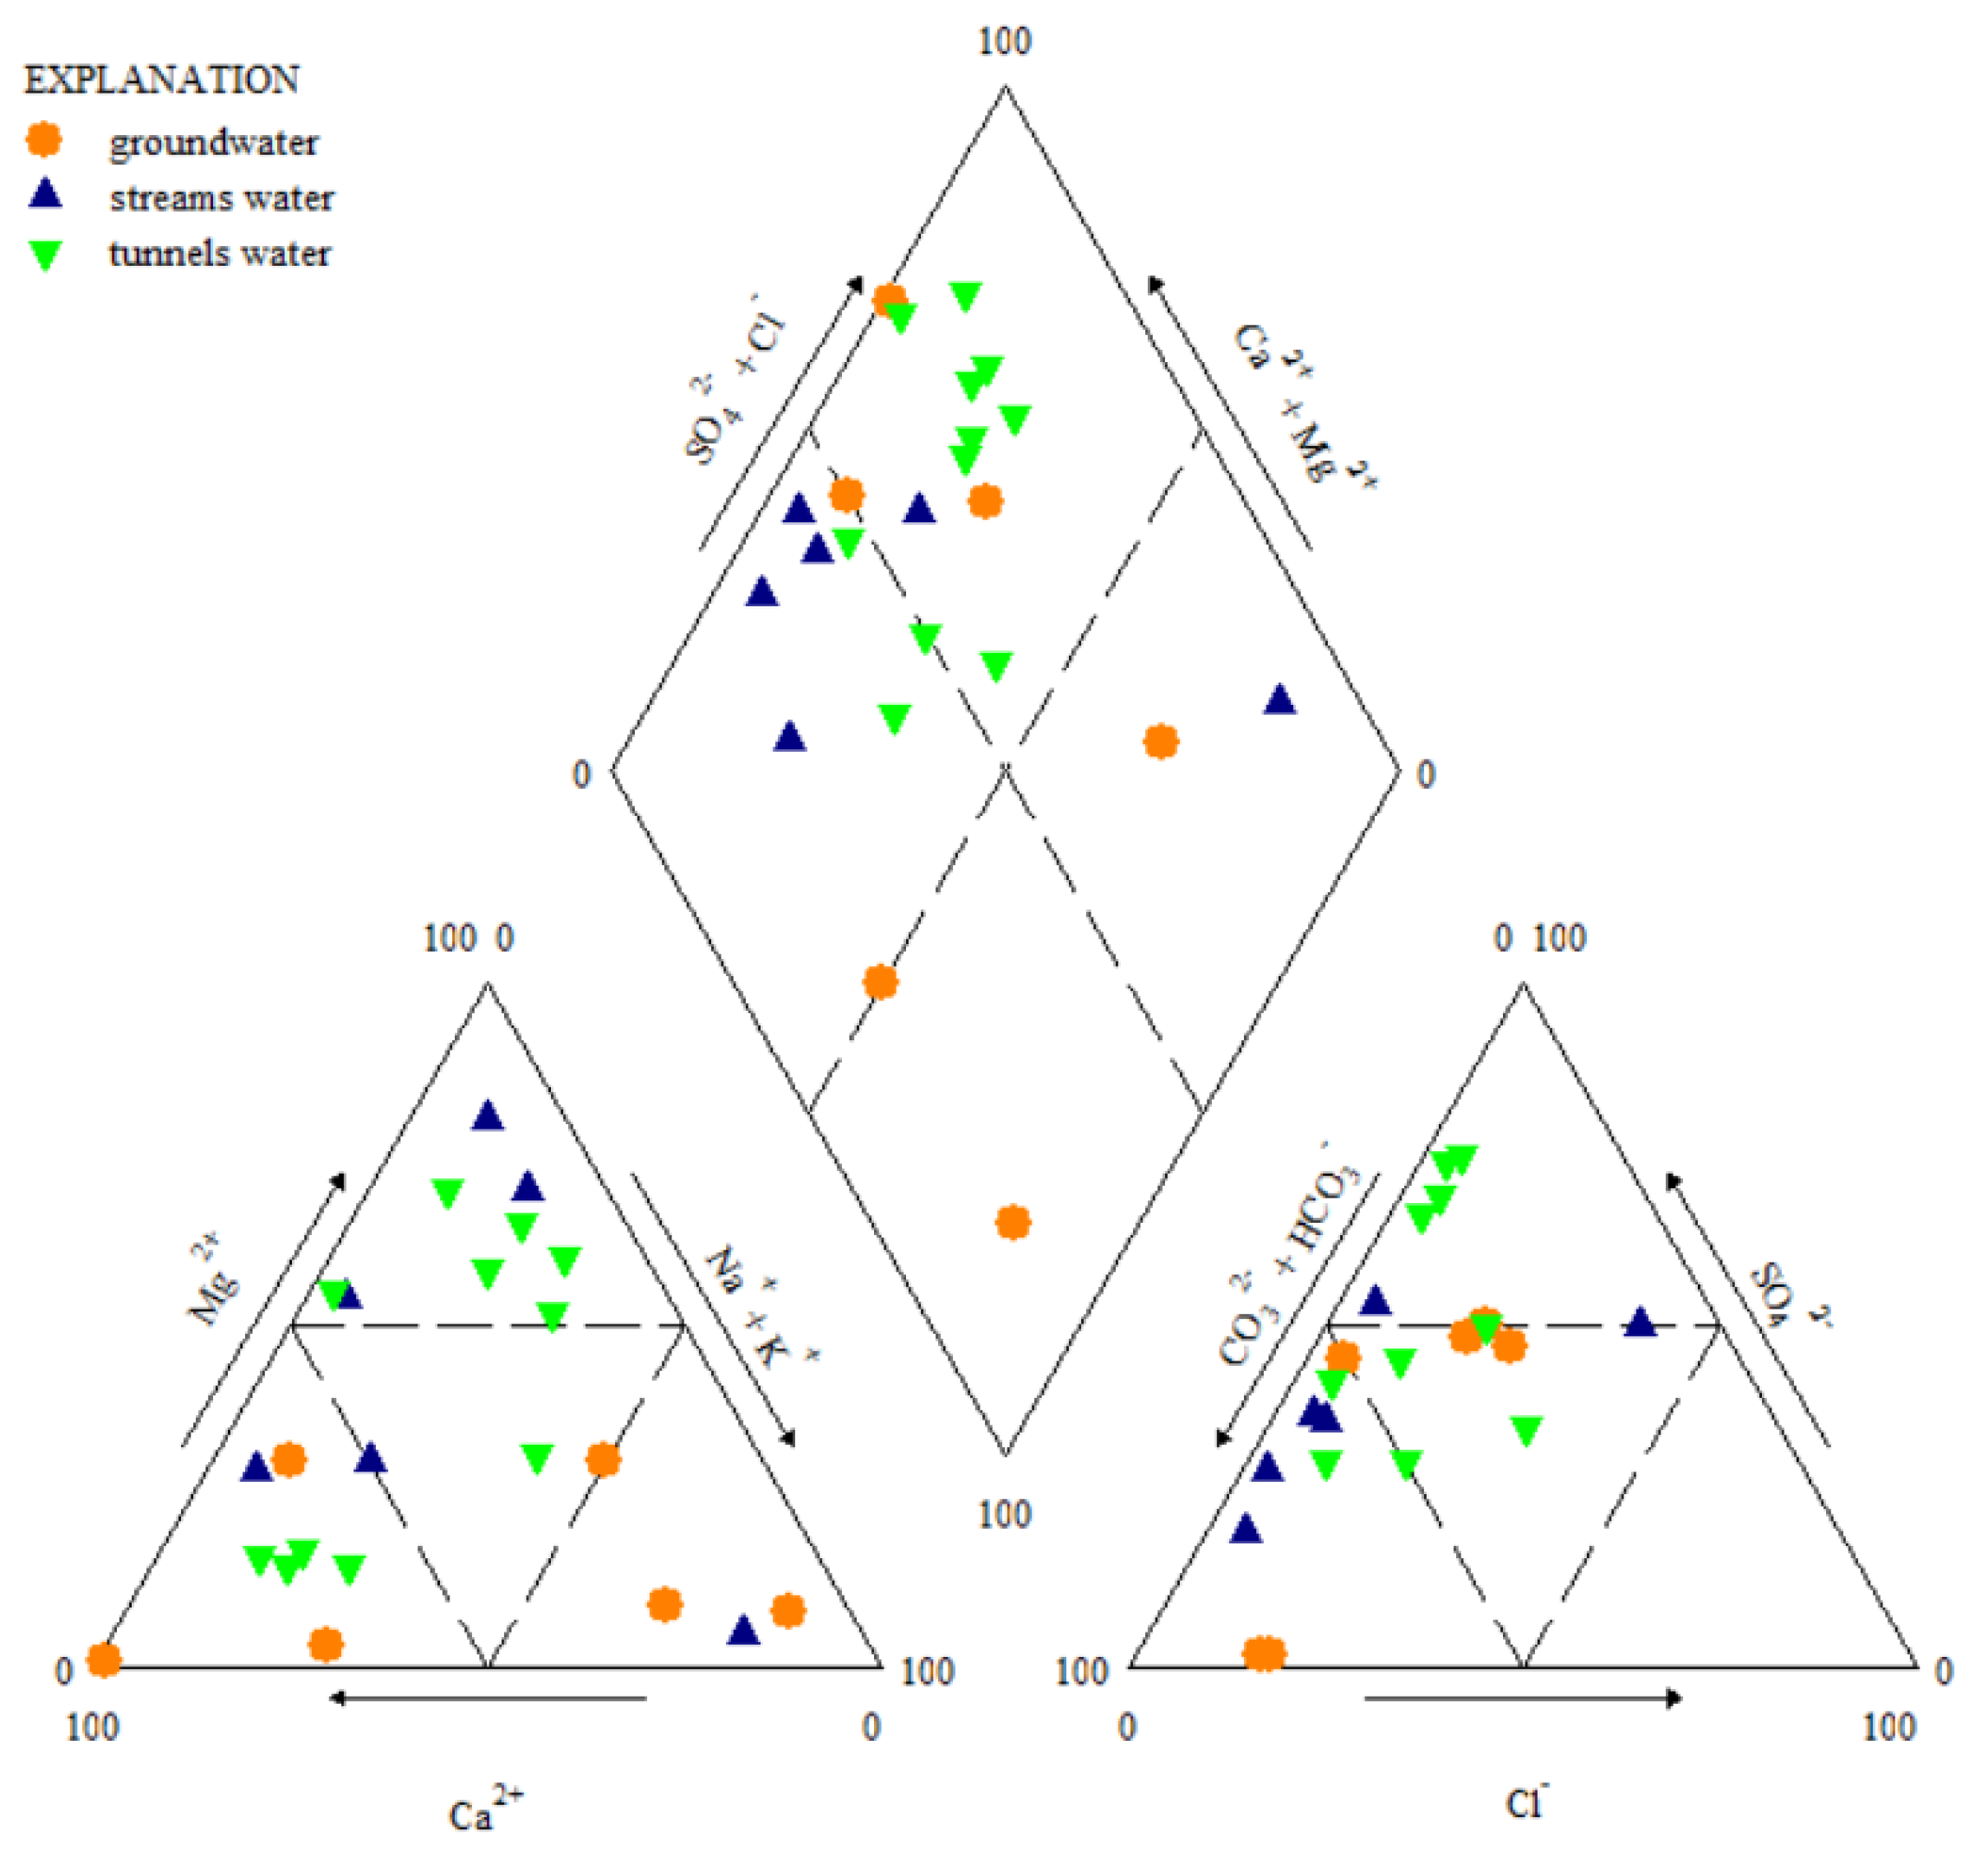

Table 1.
Results of isotope analysis of tunnel water.
| Sampling point | Sampling time | δ2Н, ‰ | δ18О, ‰ | d-excess |
|---|---|---|---|---|
| tun 177 | June | -92.4 | -13.1 | -0.7 |
| tun 104 | June | -88.5 | -12.3 | -2.4 |
| tun 802 | June | -89.3 | -12.1 | -4.6 |
| tun 504 | August | -75.2 | -8.7 | -14.3 |
| tun Z-1 | August | -85.7 | -12.5 | 1.8 |
| tun 506 | August | -88.9 | -12.4 | -2.1 |
| tun 511 | August | -87 | -12.4 | -0.2 |
| tun 501 | August | -82.2 | -12.1 | 2.5 |
| tun 177 | August | -89.2 | -12.7 | -0.3 |
| tun 104 | August | -87.8 | -12.3 | -1.7 |
| tun 802 | August | -86.2 | -12.5 | 1.3 |
| tun 609 | August | -85.4 | -12.4 | 1.4 |
| tun 176 | August | -90.5 | -12.8 | -0.9 |
| tun 165 | August | -89.1 | -12 | -5.1 |
| tun 503 | August | -88.6 | -12.2 | -3.2 |
Table 2.
Results of isotope analysis of surface water.
| Stream | Sampling point | Sampling time | δ2Н, ‰ | δ18О, ‰ | d-excess |
|---|---|---|---|---|---|
| Karabulak | p. 1 | spring | -92.1 | -14.3 | 8.0 |
| summer | -89.4 | -13.0 | 1.6 | ||
| autumn | -89.8 | -11.9 | -6.5 | ||
| p. 2 | spring | -86.2 | -13.2 | 6.0 | |
| summer | -84.2 | -12.5 | 3.3 | ||
| Uzynbulak | p. 3 | spring | -91.9 | -14.7 | 11.0 |
| summer | -95.3 | -13.9 | 2.0 | ||
| autumn | -92.9 | -11.8 | -10.3 | ||
| Baitles | p. 4 | spring | -94.6 | -14.9 | 9.7 |
| summer | -93.2 | -13.8 | 3.4 | ||
| autumn | -89.3 | -11.4 | -9.5 | ||
| Toktakushuk | p. 5 | spring | -95.3 | -15.6 | 13.9 |
| summer | -99.3 | -14.4 | 1.5 | ||
| autumn | -94.7 | -12.1 | -10.0 | ||
| Aktybay | p. 6 | spring | -98.2 | -14.4 | 2.6 |
| summer | -89.9 | -12.7 | -1.0 | ||
| autumn | -86.8 | -11.1 | -9.1 |
Table 3.
Results of isotope analysis of groundwater.
| Stream | Sampling point | δ2Н, ‰ | δ18О, ‰ | d-excess |
|---|---|---|---|---|
| Karabulak | p. 1 | -85,1 | -11,9 | 10,1 |
| p. 2 | -77,9 | -12,3 | 20,5 | |
| Uzynbulak | p. 3 | -97,1 | -13,9 | 14,1 |
| Baitles | p. 4 | -98,5 | -13,8 | 11,9 |
| Toktakushuk | p. 5 | -106,9 | -14,6 | 9,9 |
| Aktybay | p. 6 | -93,2 | -11,6 | -0,4 |
Table 4.
Results of 3H content in water.
| Tunnels | Streams | |||
|---|---|---|---|---|
| Name | 3Н, kBq/L | Name | 3Н, kBq/L | |
| surface water | groundwater | |||
| tun 511 | 23.0±2.5 | Karabulak, p. 1 | 7.0±0.7 | <0.006 |
| tun Z-1 | 57±6 | Karabulak, p. 2 | 40±4 | 25±3 |
| tun 504 | 72±7 | |||
| tun 506 | 17±2 | |||
| tun 177 | 165±15 | Uzynbulak, p. 3 | 39 ± 4 | 28±3 |
| tun 104 | 153±15 | |||
| tun 802 | 74±7 | |||
| tun 176 | 260±25 | Baitles, p. 4 | 47±5 | 10±1 |
| tun 609 | 6.4±0.7 | |||
| tun 165 | 125±13 | Toktakushuk, p. 5 | 58±6 | 6.0±0.6 |
| tun 501 | 14.0±1.5 | Aktybay, p. 6 | 25±3 | 20±2 |
| tun 503 | 67±7 | |||
Table 5.
Results of the water chemical composition.
| Name | рН | Hardness, mmol/L | TDS, mg/L | Cation content, mg/L | Anion content, mg/L | ||||
|---|---|---|---|---|---|---|---|---|---|
| Na++K+ | Ca2+ | Mg2+ | Cl- | HCO3- | SO42- | ||||
| Tunnels | |||||||||
| tun 511 | 8,3 | 5,0 | 350 | 15 | 20 | 50 | 10 | 70 | 200 |
| tun Z-1 | 6,1 | 4,9 | 380 | 25 | 78 | 13 | 6,0 | 85 | 210 |
| tun 504 | 6,3 | 2,8 | 190 | 9,9 | 46 | 6,1 | 6,0 | 100 | 65 |
| tun 506 | 8,2 | 3,5 | 233 | 25 | 15 | 10 | 20 | 120 | 100 |
| tun 177 | 6,4 | 5,2 | 400 | 31 | 76 | 17 | 9,8 | 120 | 210 |
| tun 104 | 7,0 | 5,8 | 440 | 28 | 95 | 13 | 11 | 110 | 240 |
| tun 802 | 6,3 | 6,8 | 570 | 53 | 110 | 16 | 9,3 | 130 | 330 |
| tun 176 | 8,6 | 2,5 | 250 | 40 | 50 | 10 | 85 | 35 | 55 |
| tun 609 | 8,3 | 3,5 | 254 | 35 | 15 | 30 | 20 | 170 | 80 |
| tun 165 | 8,5 | 6,0 | 430 | 50 | 15 | 65 | 50 | 250 | 130 |
| tun 501 | 8,0 | 6,0 | 345 | 4,0 | 50 | 40 | 50 | 100 | 150 |
| tun 503 | 8,5 | 6,0 | 430 | 40 | 20 | 60 | 90 | 150 | 130 |
| Streams (surface water) | |||||||||
| Karabulak, p. 1 | 8,0 | 4,0 | 270 | 50 | 50 | 10 | 10 | 250 | 50 |
| Karabulak, p. 2 | 8,3 | 10 | 575 | 15 | 150 | 40 | 10 | 450 | 150 |
| Uzynbulak, p. 3 | 8,3 | 5,0 | 350 | 30 | 15 | 50 | 10 | 160 | 160 |
| Baitles, p. 4 | 8,0 | 5,0 | 310 | 15 | 15 | 50 | 10 | 200 | 100 |
| Toktakushuk, p. 4 | 7,7 | 5,5 | 330 | 7,0 | 50 | 40 | 15 | 200 | 100 |
| Aktybay, p. 6 | 7,5 | 3,0 | 950 | 260 | 45 | 10 | 200 | 100 | 350 |
| Groundwater | |||||||||
| Karabulak, p. 1 | 9,0 | 1,1 | 270 | 100 | 10 | 10 | 30 | 260 | 5,0 |
| Karabulak, p. 2 | 8,0 | 15 | 850 | 30 | 200 | 60 | 30 | 500 | 350 |
| Uzynbulak, p. 3 | 7,6 | 0,7 | 176 | 50 | 10 | 1,0 | 20 | 50 | 70 |
| Baitles, p. 4 | 8,3 | 1,7 | 184 | 40 | 15 | 10 | 25 | 200 | 2,0 |
| Toktakushuk, p. 4 | 8,6 | 2,5 | 570 | 140 | 40 | 10 | 80 | 150 | 200 |
| Aktybay, p. 6 | 8,5 | 20 | 1800 | 200 | 420 | 10 | 200 | 600 | 700 |
Disclaimer/Publisher’s Note: The statements, opinions and data contained in all publications are solely those of the individual author(s) and contributor(s) and not of MDPI and/or the editor(s). MDPI and/or the editor(s) disclaim responsibility for any injury to people or property resulting from any ideas, methods, instructions or products referred to in the content. |
© 2025 by the authors. Licensee MDPI, Basel, Switzerland. This article is an open access article distributed under the terms and conditions of the Creative Commons Attribution (CC BY) license (http://creativecommons.org/licenses/by/4.0/).
Copyright: This open access article is published under a Creative Commons CC BY 4.0 license, which permit the free download, distribution, and reuse, provided that the author and preprint are cited in any reuse.


