
Submitted:
02 December 2025
Posted:
03 December 2025
You are already at the latest version
Abstract
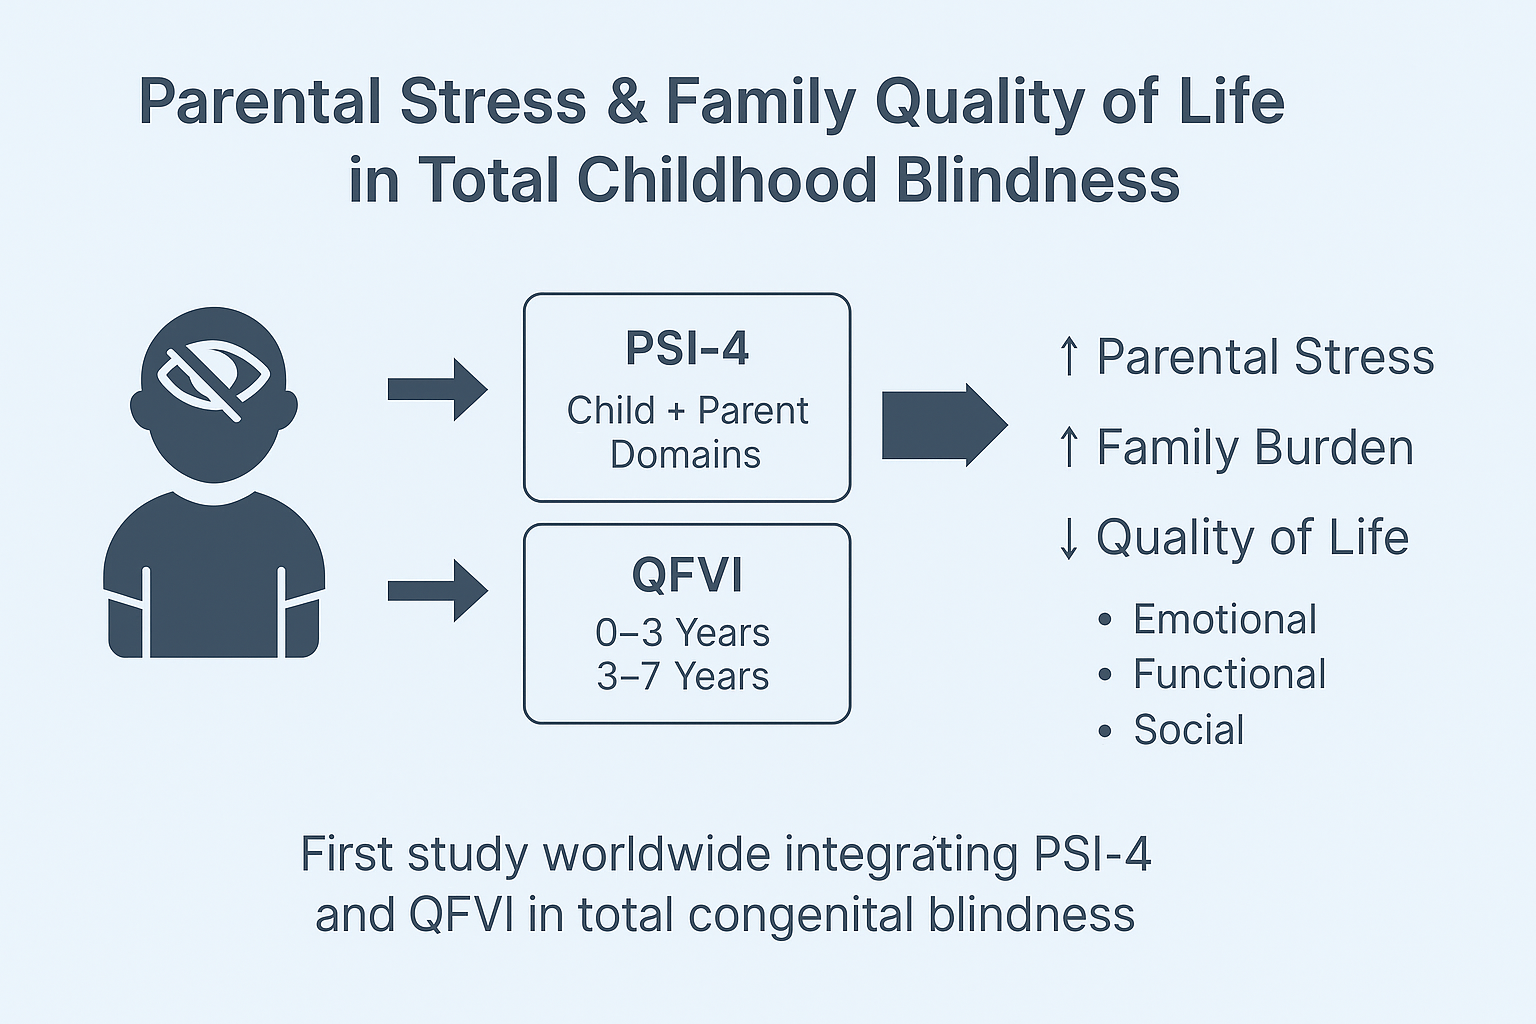
Parental stress is a critical yet understudied dimension of childhood total blindness, a condition that imposes substantial developmental, emotional, and functional challenges on families. This cross-sectional study assessed parenting stress, maternal health symp-toms, and children’s functional vision-related quality of life in 81 mothers of children aged 3 months to 7 years with complete congenital blindness. Mothers completed the Parenting Stress Index-Fourth Edition (PSI-4), the age-appropriate versions of the Quality of Functional Vision Questionnaire (QFVI-3 or QFVI-7), and a sociodemographic and ma-ternal health survey.
Total Parent Stress showed moderately elevated percentile scores (mean ≈ 67), with the highest PSI-4 subdomains in Adaptability, Depression, and Health. Approximately 21% of mothers scored within the clinical range for high stress. Maternal symptomsincluding sadness, insomnia, headaches, forgetfulness, and musculoskeletal painwere significant (all p < 0.01). QFVI global scores indicated moderate impairments in functional vi-sion-related quality of life across age groups. Life Stress demonstrated a small-to-moderate negative correlation with QFVI-7, suggesting that cumulative environmental stressors may adversely affect children’s functional outcomes.
Several protective factors were identified. Among children under age three, maternal en-gagement in physical activity was associated with better QFVI scores, whereas for chil-dren aged 3-7, school attendance correlated with improved functional functioning. Socio-demographic disadvantages, limited access to educational adaptations, and reduced ma-ternal participation in work or leisure activities were linked to higher stress and poorer child functioning.
These findings highlight the importance of multidisciplinary, family-centered care incor-porating psychosocial assessment, early stimulation, orientation and mobility support, and maternal mental health interventions in pediatric ophthalmology.
Keywords:
parental stress
; childhood blindness
; congenital blindness
; functional vision
; pediatric ophthalmology
; maternal health
; caregivers
; early intervention
1. Introduction
Childhood blindness is a rare but severe condition with lifelong developmental, social, emotional, and functional consequences for affected children and their families. Global estimates indicate that approximately 500,000 children become blind each year, with a prevalence ranging from 0.3 to 1.5 per 1,000 depending on socioeconomic context.[1] In Brazil, childhood blindness affects an estimated 0.5-0.6 per 1,000 children, corresponding to approximately 22,000 to 26,000 individuals living with severe visual impairment.[2] Total blindness-defined as the absence of light perception and classified as WHO Category 5-results in profound limitations in motor development, communication, mobility, learning, and psychosocial functioning[1]. Because childhood blindness affects many decades of life, and nearly half of cases worldwide are considered preventable, it is recognized as a global public health priority [1,2].
Mothers are typically the primary caregivers for children with total blindness and face complex demands involving daily care, environmental adaptation, coordination of medical and rehabilitation services, and support for social and educational inclusion. These responsibilities often occur within contexts marked by socioeconomic vulnerability and limited access to specialized services. Stress, as first described by Selye as a nonspecific physiological response to internal or external demands,[3] becomes chronic when caregiving demands exceed available emotional, social, or material resources. Chronic parental stress is associated with emotional exhaustion, depressive symptoms, sleep disturbances, impaired self-care, decreased treatment adherence, and increased risk of physical and psychological morbidity[4,5]. Among children, high parental stress is linked to maladaptive behavior, delayed development, and poorer psychosocial outcomes[5].
The Parenting Stress Index-Fourth Edition (PSI-4) is one of the most widely used instruments for evaluating parental stress, distinguishing between child-related factors (Child Domain) and caregiver-related factors (Parent Domain) [6]. Elevated percentile scores in subscales such as Health, Depression, Role Restriction, and Spouse/Partner Relationship reflect clinically significant stress. Despite its broad application across pediatric populations, few studies have investigated parental stress among mothers of children with total blindness, a condition associated with unique developmental and psychosocial challenges not observed in partial visual impairment.
Understanding children’s functional outcomes is equally important. The Children’s Visual Function Questionnaire (CVFQ)[7] and its Brazilian versions, QFVI-3 and QFVI-7,[8] assess functional vision-related quality of life across domains such as general vision concerns, functional competence, behavior, family impact, and treatment burden. Lower scores indicate greater impairment and have been associated with increased stress and decreased well-being within families of visually impaired children[7].
However, the simultaneous assessment of parental stress (PSI-4) and children’s vision-related functional quality of life (QFVI) in cases of total blindness remains a major gap in the literature. No Brazilian study to date has examined these constructs together, limiting the development of evidence-based interventions and public health strategies targeted to this population[9]. Considering the interplay between maternal psychological burden, child functional limitations, and socioeconomic determinants, research focusing on families of children with complete blindness is essential.
Therefore, this study aims to evaluate parenting stress among mothers of children with total congenital blindness and to examine its associations with maternal health symptoms, socioeconomic conditions, and children’s functional vision-related quality of life measured through QFVI-3 and QFVI-7. By integrating standardized psychological and functional measures, this study seeks to fill a critical gap in pediatric ophthalmology and contribute to the development of family-centered clinical and psychosocial interventions.
2. Materials and Methods
2.1. Study Design
This was a cross-sectional, observational, and analytical study designed to evaluate parental stress, maternal health symptoms, and children’s functional vision-related quality of life in cases of total congenital blindness. The study followed the STROBE (Strengthening the Reporting of Observational Studies in Epidemiology) recommendations for observational research reporting [10] and complied with the ethical principles of the Declaration of Helsinki [11].
2.2. Setting
Data collection took place in four public ophthalmology and rehabilitation centers in Goiania, Brazil. These centers provide specialized care for children with severe visual impairment, including pediatric ophthalmology, early stimulation, low-vision rehabilitation, orientation and mobility training, and multidisciplinary support.
2.3. Participants
2.3.1. Inclusion Criteria
Eligible participants were biological mothers who were the primary caregivers of a child with total bilateral congenital blindness (no light perception). Additional criteria included having a child aged 0 to 12 years for PSI-4 analyses or 0 to 7 years for QFVI applicability, being literate in Portuguese (self-reported or interviewer-assisted), and providing written informed consent.
2.3.2. Exclusion Criteria
Mothers were excluded if the child had additional neurological or systemic disabilities that could interfere with PSI-4 or QFVI responses, if the mother had untreated psychiatric conditions that impaired participation, or if the child’s blindness was acquired rather than congenital.
2.3.3. Sampling Strategy
Because total congenital blindness is a rare condition, a consecutive convenience sampling strategy was used, following approaches commonly adopted in similar populations [12].
2.4. Measures
2.4.1. Parenting Stress Index, Fourth Edition, Full Form (PSI-4-FF)
Parental stress was assessed using the PSI-4-FF, a 120-item standardized instrument with excellent internal consistency (Cronbach alpha approximately 0.98) [6]. The PSI-4-FF includes:
- Child Domain (CD): Distractibility/Hyperactivity, Adaptability, Reinforces Parent, Demandingness, Mood, Acceptability
- Parent Domain (PD): Competence, Isolation, Attachment, Role Restriction, De-pression, Spouse or Partner Relationship, Health
- Life Stress Scale: 19 items assessing stressful events in the previous 12 months
Scores were converted to standardized percentiles according to the instrument manual. Percentiles of 85 or above were classified as clinically elevated stress. The Defensive Responding Index was applied to evaluate response reliability.
2.4.2. Quality of Functional Vision Questionnaire (QFVI-3 and QFVI-7)
Children’s functional vision and vision-related quality of life were evaluated using the Brazilian adaptations of QFVI-3 (ages 0 to 3 years) and QFVI-7 (ages 3 to 7 years), both derived from the Children’s Visual Function Questionnaire (CVFQ) [7, 8].
These instruments assess six domains: general health, general vision, competence, personality, family impact, and treatment burden. Scores range from 0 (worst quality of life) to 100 (best). Non-applicable items were excluded from domain and total score calculations, following standard scoring procedures.
2.4.3. Sociodemographic and Clinical Questionnaire
A structured questionnaire collected information on maternal age, education, marital status, occupation, and income. It also included psychosomatic symptoms such as fatigue, insomnia, headaches, and body pain based on DSM-5 descriptors. Additional variables included child school attendance, availability of educational adaptations, and access to rehabilitation and healthcare services. These variables were included as covariates in the analyses.
2.5. Procedures
Participants were recruited consecutively during routine appointments at the participating centers. Questionnaires were self-administered or completed with interviewer assistance when required. A pilot test with 10 mothers confirmed clarity and feasibility. Each assessment lasted approximately 45 to 60 minutes.
2.6. Bias Control
Several procedures were implemented to reduce bias. These included standardized administration protocols, interviewer training, verification of incomplete answers, and the use of validated psychometric instruments tailored to the Brazilian population. Interviewer assistance was provided only when needed to avoid misinterpretation while minimizing influence on responses.
2.7. Statistical Analysis
Statistical analyses followed the methodological standards recommended by the STROBE guidelines for observational studies [10]. Descriptive statistics summarized the characteristics of the sample. Categorical variables were expressed as frequencies and percentages. Continuous variables were described using means, medians, standard deviations, ranges, and 95 percent confidence intervals.
Normality of continuous variables was assessed using the Shapiro-Wilk test [13] and visual inspection of histograms and boxplots. Because most distributions did not meet normality assumptions, non-parametric methods were applied.
Group differences were examined using the Mann-Whitney U test and the Kruskal-Wallis test [14], with post-hoc corrections for multiple comparisons when appropriate [15].
Associations between PSI-4 domains, Life Stress scores, QFVI-3 and QFVI-7 scores, and sociodemographic or clinical variables were evaluated using Spearman rank correlation coefficients [15]. Effect sizes were reported when applicable.
A two-tailed significance level of p < 0.05 was adopted. All analyses were performed using R statistical software, version 4.3 [16].
2.8. Ethical Approval
The study was approved by the Research Ethics Committee of the Federal University of Goiás (CAAE 90833718.2.0000.5078; approval number 2.746.572). All mothers signed informed consent prior to participation. The study complied with Brazilian National Health Council Resolution 466/12 and with the Declaration of Helsinki [11].
3. Results
3.1. Child Characteristics
A total of 81 children with total congenital blindness participated in the study. The mean age was 6.07 ± 3.60 years (range: 0-12 years). The sample included 52 boys (64.2%) and 29 girls (35.8%).
Among the 58 children who were enrolled in school (71.6%), the majority attended regular schools (n = 50; 86.2% of students, or 61.7% of the total sample), whereas a smaller proportion were enrolled in specialized institutions for visually impaired students (n = 8; 9.9%).
Regarding educational support, most participants (64.2%) reported that their school offered no specific adaptations. Among those who did receive accommodations, the most common resources included the presence of an educational assistant (23.5%), the use of computer-based tools (14.8%), and accessibility adaptations such as enlarged print or tactile materials (13.6%). Because these items allow multiple responses, percentages are not mutually exclusive.
Participation in physical activity was reported by 26 children (32.1%), whereas 55 (67.9%) did not engage in structured exercise. Leisure activities were present in 36 children (44.4%), while 45 (55.6%) reported no regular leisure involvement.
3.2. Family and Socioeconomic Characteristics
Family and socioeconomic data were obtained from all 81 mothers participating in the study. Most families belonged to lower socioeconomic strata, with 40.74% classified as class D according to ABEP criteria, 22.22% as class C2, 12.35% as class B2/C1, and 3.70% as class E, while 20.99% did not report income.
Maternal marital status also reflected a socioeconomic profile of high vulnerability: 58.02% of mothers were married, 18.52% were in a stable union, 11.11% were single, 7.41% divorced, and 4.94% widowed. Regarding employment, the majority of mothers (79.01%) did not work outside the home, and more than half of the families (54.32%) received social benefits. Only 29.63% of mothers reported having private health insurance.
In terms of family structure, 59 children (72.84%) lived with their father, whereas 21 (25.93%) did not; one mother did not provide this information (1.23%).
3.3. Maternal Characteristics
Maternal characteristics were collected from all 81 participating mothers. The mean maternal age was 36.90 ± 7.89 years (range: 25-58 years). The mean body mass index (BMI) was 26.98 ± 4.76 kg/m² (range: 18.73-39.54). Among mothers who were employed, the mean weekly workload was 37.00 ± 4.54 hours.
Clinical indicators revealed hypertension in 16.05% of mothers and elevated blood glucose levels in 9.88%. Somatic symptoms were also highly frequent, including headache (62.96%), dizziness (25.93%), nausea (18.52%), and photophobia (40.74%). Emotional and psychological symptoms were similarly prominent, with high frequencies of sadness (70.37%), forgetfulness (76.54%), fatigue (82.72%), and insomnia (50.62%).
3.4. PSI-4 Child Domain Scores
3.4.1. Subscale Percentile Distribution - PSI-4 Child Domain
The PSI-4 Child Domain comprises seven subscales that assess behavioral, emotional, and adaptive characteristics of the child as perceived by the caregiver. These subscales-Distractibility/Hyperactivity, Reinforces Parent, Mood, Acceptability, Adaptability, Demandingness, and the Total Child Domain score-form the core structure of the instrument. Percentile values reported here follow standardized scoring procedures based on the PSI-4 international normative dataset. This subsection presents descriptive statistics for each subscale, including mean percentile, standard deviation, and 95% confidence intervals.
The subscales demonstrated notable variation in mean percentile values. Higher means were observed for Adaptability (71.62), Demandingness (69.17), and Distractibility/Hyperactivity (68.47). Intermediate means appeared in Acceptability (67.80) and the Total Child Domain score (66.70). In contrast, Reinforces Parent (49.89) and Mood (55.84) displayed comparatively lower mean percentiles. These findings offer a descriptive summary of the relative distribution of scores among the seven subscales.
Standard deviations ranged from approximately 21 to 27 percentile points, indicating moderate variability within the sample. Confidence interval widths also varied, reflecting heterogeneous dispersion across subscales: narrower intervals denote greater score concentration, whereas wider intervals suggest broader variability. Together, these descriptive measures illustrate the distributional characteristics of the PSI-4 Child Domain within this cohort.
Figure 10 provides a radar chart representation of the mean percentiles across the seven PSI-4 Child Domain subscales. This visualization enables immediate recognition of differences in subscale magnitudes: subscales with higher mean values extend farther outward, whereas those with lower means remain closer to the center. The figure serves as an objective graphical summary without offering inferential interpretation. A detailed numerical distribution of these percentile scores is presented in Table 4.
3.4.2. Group Comparisons for Child Domain
Non-parametric group comparisons using Mann-Whitney U and Kruskal-Wallis tests were conducted to evaluate differences in PSI-4 Child Domain percentile scores across clinical, sociodemographic, and maternal health factors. Independent variables examined included ophthalmologic diagnosis, child age, parental education, socioeconomic class (ABEP), time since diagnosis, family composition (living with the father or not), and several maternal symptoms such as headache, intolerance to light or noise, sadness, fatigue, body pain, insomnia, difficulty falling asleep, and early morning awakenings.
The statistical report indicated that child age, time since diagnosis, parental education and socioeconomic class did not show significant group differences. However, multiple maternal symptoms and family structure variables were significantly associated with higher Child Domain percentile scores. Children who did not live with their father exhibited higher scores (p = 0.039). Elevated percentile scores were also observed among children whose mothers reported headache (p = 0.003), intolerance to light or noise (p = 0.003), sadness or emotional distress (p = 0.036), fatigue (p = 0.011), body pain (p = 0.037), insomnia (p = 0.023), difficulty falling asleep (p =0.038), and early morning awakenings (p=0.013).
Table 5 summarizes the significant associations between PSI-4 Child Domain scores and maternal or family variables. Figure 11, Figure 12, Figure 13, Figure 14 and Figure 15 present boxplot visualizations of the variables showing statistically significant group differences, using the total Child Domain percentile score as the dependent measure.
3.5. PSI-4 Parent Domain Scores
3.5.1. Subscale Percentile Distribution PSI-4 Parent Domain
The PSI-4 Parent Domain is composed of eight subscales that evaluate perceived parental functioning across emotional, physical, relational, and role-related dimensions. These subscales include: Competence, Isolation, Attachment, Health, Role Restriction, Depression, Spouse/Partner Relationship, and the Total Parent Domain score. Percentile values used in this analysis were derived from the standardized scoring procedures of the PSI-4 normative system.
Mean percentile scores varied across the eight subscales. Higher mean values were observed for Health (74.31), Depression (73.02), Competence (66.46), Role Restriction (66.54), and the Total Parent Domain score (66.09). Moderate values were found for Isolation (65.89) and Attachment (59.07), whereas the lowest percentile was observed for Spouse/Partner Relationship (47.59). These descriptive values summarize the distributional profile of the parent-related stress indicators.
Standard deviations ranged from approximately 22 to 31 percentile points, indicating variable dispersion across subscales. Confidence intervals also differed, with narrower intervals showing greater clustering of participant scores and wider intervals reflecting higher heterogeneity. Together, these indicators provide a distributional overview of variability within the Parent Domain.
Figure 16 displays a radar chart summarizing the mean percentile scores for the eight Parent Domain subscales. The visualization allows for immediate inspection of the relative magnitude of each subscale while maintaining an objective, non-interpretative representation.

Table 6.
Parent Domain Percentile Scores.
| Subscale | Mean Percentile | SD | 95% CI (Lower) | 95% CI (Upper) |
|---|---|---|---|---|
| Competence | 66.46 | 23.90 | 61.40 | 71.03 |
| Isolation | 65.89 | 25.98 | 60.75 | 71.16 |
| Attachment | 59.07 | 22.81 | 54.12 | 64.16 |
| Role Restriction | 66.54 | 29.36 | 60.19 | 73.15 |
| Depression | 73.02 | 22.98 | 68.01 | 78.08 |
| Spouse/Partner | 47.59 | 31.31 | 41.16 | 54.54 |
| Health | 74.31 | 24.49 | 69.01 | 79.48 |
| Total Parent Domain | 66.09 | 24.03 | 60.95 | 71.22 |
3.5.2. Group Comparisons - PSI-4 Parent Domain
Non-parametric group comparisons (Mann-Whitney U and Kruskal-Wallis tests) were performed to examine differences in PSI-4 Parent Domain percentile scores across clinical, socioeconomic, and maternal health variables. Independent variables included family income (ABEP classification), parental education, maternal age, ophthalmologic diagnosis, time since diagnosis, family composition (living with the father), and multiple maternal symptoms.
Family income, parental education, maternal age, and ophthalmologic diagnosis did not produce statistically significant group differences in Parent Domain scores.
In contrast, several maternal symptoms and one family structure variable demonstrated statistically significant associations with higher Parent Domain percentile scores. Mothers reporting sadness (p < 0.001), fatigue (p = 0.027), body pain (p = 0.001), insomnia (p = 0.001), difficulty falling asleep (p = 0.001), or early morning awakenings (p = 0.040) exhibited higher Parent Domain scores. Additionally, intolerance to light or noise showed a strong association with elevated stress levels (p < 0.001). Children who did not live with their father also presented higher Parent Domain scores (p = 0.015).
Table 7 summarizes all significant associations between Parent Domain scores and maternal or family variables.
3.6. Quality of Family Vision Impact (QFVI)
The Quality of Family Vision Impact (QFVI) instrument was used to assess the functional, emotional, and social effects of pediatric visual impairment on family dynamics. Two age-specific versions were applied to ensure developmental appropriateness: QFVI-3 for children aged 0-3 years and QFVI-7 for children aged 3-7 years. Both instruments evaluate the extent to which the child’s visual condition influences family routines, parental well-being, and overall household functioning.
3.6.1. QFVI 3 (0-3 years)
The QFVI-3 was administered to caregivers of children aged 0-3 years. Its domains focus on early-childhood needs, including emotional impact on parents, disruption of daily routines, functional limitations related to early development, and broader effects on family functioning. Scores were converted to standardized percentages (0-100) according to instrument guidelines.
Descriptive analysis showed moderate variability across domains, reflecting heterogeneity in how families experience the consequences of severe visual impairment or blindness during early developmental stages, as shown in Table 8. A radar-chart visualization of domain percentile profiles is shown in Figure 17.
3.6.2. QFVI 7 (3-7 years)
The QFVI-7 evaluates similar constructs but expands them to reflect preschool and early-school developmental demands, including autonomy, peer interaction, social participation, and school-related functioning. The domains maintain the same conceptual framework while incorporating age-appropriate indicators.
3.6.3. Group Comparisons for QFVI
Group comparisons were conducted to examine whether QFVI-3 and QFVI-7 scores varied according to socioeconomic, demographic, educational, and maternal health variables. Because the data did not meet normality assumptions, non-parametric tests (Mann-Whitney U and Kruskal-Wallis) were applied. Only variables with statistically significant differences (p < 0.05) are reported.
Significant Findings for QFVI-3 (0-3 years) are summarized in Table 10, four variables demonstrated significant group differences in QFVI-3 scores:
- Physical activity (p = 0.038): Mothers who engaged in regular physical activity had higher QFVI-3 scores compared with those who did not.
- Nausea (p = 0.044): Mothers reporting nausea had lower QFVI-3 scores than those without nausea.
- Fatigue (p = 0.038): Mothers reporting fatigue had lower QFVI-3 scores.
- Body pain (p = 0.006): Mothers reporting body pain had lower QFVI-3 scores.
Table 10.
Significant Group Comparisons for QFVI-3.
| Variable | Groups Compared | N (G1 / G2) |
Mean (G1 / G2) |
p-value |
Interpretation |
| Physical activity | No vs Yes | 14 / 4 | 51.37 / 65.62 | 0.038 | Higher QFVI-3 among mothers who exercise |
| Nausea | No vs Yes | 15 / 3 | 56.61 / 44.19 | 0.044 | Lower QFVI-3 among mothers with nausea |
| Fatigue | No vs Yes | 4 / 14 | 64.58 / 51.67 | 0.038 | Lower QFVI-3 among mothers with fatigue |
| Body pain | No vs Yes | 6 / 12 | 63.65 / 49.98 | 0.006 | Lower QFVI-3 among mothers with body pain |
G1 = Group 1; G2=Group 2.
Significant Findings for QFVI-7 (3-7 years) are summarized in Table 11, four variables demonstrated significant group differences in QFVI-7 scores:
- 5.
- Child attends school (p = 0.003): Caregivers of children who attended school had higher QFVI-7 scores compared with those whose children did not attend school.
- 6.
- Nausea (p = 0.026): Mothers reporting nausea had lower QFVI-7 scores than those without nausea.
- 7.
- Light intolerance (p = 0.034): Caregivers reporting light intolerance had lower QFVI-7 scores.
- 8.
- Difficulty falling asleep (p = 0.002): Mothers reporting difficulty falling asleep had lower QFVI-7 scores.
Table 11.
Significant Group Comparisons for QFVI-7.
| Variable | Groups Compared | N (G1 / G2) |
Mean (G1 / G2) |
p-value |
Interpretation |
|---|---|---|---|---|---|
| Child attends school | No vs Yes | 6 / 28 | 41.87 / 54.12 | 0.003 | Higher QFVI-7 when the child attends school |
| Nausea | No vs Yes | 25 / 9 | 53.99 / 46.32 | 0.026 | Lower QFVI-7 among mothers with nausea |
| Light intolerance | No vs Yes | 20 / 14 | 54.86 / 47.82 | 0.034 | Lower QFVI-7 among mothers with light intolerance |
| Difficulty falling asleep | No vs Yes | 19 / 15 | 56.01 / 46.83 | 0.002 | Lower QFVI-7 among mothers with difficulty falling asleep |
G1 = Group 1; G2=Group 2.
3.7. Bivariate Associations Between PSI-4, Life Stress, and QFVI
Spearman’s rank correlations were performed to examine associations among PSI-4 domains, life stress indicators, and family impact scores measured by QFVI-3 and QFVI-7. A strong and statistically significant correlation was observed between the PSI-4 Child Domain and the PSI-4 Parent Domain (ρ = 0.59, p < 0.001), indicating concordance between stress related to child characteristics and stress related to parental functioning. No additional significant correlations were found between PSI-4 domains and other variables.
Associations between PSI-4 and life stress indicators were also evaluated. Neither the Child Domain nor the Parent Domain demonstrated significant correlations with the Life Stress indicator (all p > 0.05). However, Life Stress Score and Life Stress Percentile were strongly correlated with each other (ρ = 0.94, p < 0.001), reflecting internal consistency within the life stress construct.
Correlations between PSI-4 domains and family impact (QFVI-3 and QFVI-7) were examined next. No significant correlations were observed between PSI-4 Child or Parent domains and QFVI-3 or QFVI-7 (all p > 0.30). In contrast, age-specific patterns emerged when evaluating Life Stress and QFVI. For families of younger children (QFVI-3), no significant associations were found. Among families of children aged 3-7 years, Life Stress Score (ρ = -0.28, p = 0.013) and Life Stress Percentile (ρ = -0.26, p = 0.017) showed significant negative correlations with QFVI-7, indicating greater family impact in the presence of higher contextual stress.
3.8. Summary of Exploratory Modeling Results
Exploratory regression models were conducted to examine potential associations between child- and caregiver-related variables and overall parental stress (PSI-4 Total Stress percentile). The analyses were limited by sample size and should be interpreted as preliminary. In these models, higher PSI-4 Total Stress percentiles showed positive associations with maternal depressive symptom scores, lower socioeconomic class, and not living with the child’s father. QFVI total scores also demonstrated a negative association with Total Stress percentiles.
Variables that did not retain statistical significance after adjustment included maternal age, child age, and regular physical activity. These findings indicate that only a subset of demographic and clinical variables remained statistically significant in the adjusted model.
A summary of the regression coefficients and statistical outputs is presented in Table 12, which provides an overview of the variables included, parameter estimates, and model fit indices.
3.9. Summary of Key Quantitative Results (Descriptive Summary)
Across all analyses, the PSI-4 Parent Domain showed higher percentile scores than the Child Domain, with the highest values observed in the Depression and Health subscales. Within the Child Domain, Adaptability and Demandingness presented the highest mean percentiles.
For visual functioning, both QFVI-3 and QFVI-7 demonstrated lower scores in domains related to general functioning and family impact, indicating greater reported challenges in these areas compared with other QFVI domains.
In the bivariate analyses, the only strong internal association within PSI-4 was the positive correlation between the Child and Parent Domains. No significant correlations were found between PSI-4 domains and Life Stress or between PSI-4 domains and QFVI-3/QFVI-7. Among families of children aged 3-7 years, Life Stress indicators showed significant negative correlations with QFVI-7, whereas no such associations were observed for QFVI-3.
Exploratory regression models identified maternal depressive symptoms, lower socioeconomic class, not living with the child’s father, and lower QFVI total scores as variables that remained significantly associated with higher PSI-4 Total Stress percentiles, while maternal age, child age, and physical activity were not significant after adjustment.
4. Discussion
This study evaluated parental stress, maternal mental health, and vision-related quality of life in families of children with total congenital blindness. Overall, the findings demonstrated elevated parental burden across several dimensions of the PSI-4, particularly within the Parent Domain, where the highest percentile scores were observed in the Depression and Health subscales. These domains reflect somatic symptoms, emotional exhaustion, and decreased perceived competence-core components of caregiver overload described in the PSI-4 manual [6]. Although most mothers remained within normative stress levels, approximately 21% fell into the clinically significant or pathological range, aligning with previous studies documenting substantial psychological demands among caregivers of children with sensory disabilities [17].
In contrast to profiles commonly observed in neurological or genetic disorders, children in this study did not display globally maladaptive behavioral patterns. PSI-4 Child Domain scores indicated elevated demands primarily in Adaptability, Demandingness, and Distractibility/Hyperactivity-findings consistent with literature describing attentional and regulatory challenges in blind children [18]. At the same time, preserved scores in Reinforces Parent and Humor suggest strong affective bonding, echoing prior research reporting robust emotional reciprocity between blind children and caregivers [19]. Taken together, these patterns indicate that maternal stress is driven less by severely disruptive child behavior and more by the cumulative caregiving workload, environmental barriers, and maternal emotional depletion.
Quality-of-life findings from QFVI-3 and QFVI-7 showed moderate impairments in domains related to general functioning, daily activities, family burden, and parental concerns-dimensions previously highlighted in the original CVFQ/QFVI studies by Felius et al. [7] and supported by Brazilian validation data [8]. Across both age groups, the most consistent predictors of lower QFVI scores were maternal physical symptoms, including nausea, fatigue, pain, and sleep disturbances. This pattern reinforces a reciprocal relationship between caregiver well-being and the perceived impact of childhood blindness on family functioning. For QFVI-7, the child’s school attendance emerged as a protective factor, being associated with better functional and emotional outcomes. This is consistent with evidence that structured educational environments and peer interaction facilitate adaptation in visually impaired children [12,20]. Among younger children, maternal physical activity was associated with higher QFVI-3 scores, in line with broader evidence that exercise mitigates stress and depressive symptoms in caregivers [21].
A central finding of this study is that maternal psychological health, socioeconomic vulnerability, and family structure were more strongly associated with parental stress than the child’s functional profile alone. Maternal symptoms consistent with depressive syndromes-including insomnia, sadness, low energy, headaches, and bodily pain-were strongly associated with elevated Parent Domain scores, paralleling previous studies linking parental stress and depressive symptoms in families of blind children [17] and theoretical models suggesting that chronic parenting stress may evolve into clinically relevant depressive states [23]. Mothers not living with the child’s father also exhibited significantly higher stress, which is coherent with robust evidence on the protective role of partner support in families of children with disabilities [24].
Socioeconomic vulnerability (ABEP classes C2-D-E) was likewise associated with higher PSI-4 scores, mirroring international literature that links financial strain to heightened caregiver stress, reduced access to rehabilitation services, and disruption of family routines [25]. Furthermore, the observed associations between Life Stress indicators and QFVI-7 underscore how contextual pressures-such as transportation difficulties, limited environmental accessibility, and inconsistent inclusion practices-can amplify both functional and psychosocial challenges, particularly during the preschool and early school years.
Despite these burdens, indicators of resilience were evident. The majority of mothers (approximately 79%) remained within normal stress ranges, and patterns of strong affective bonding and relatively low scores in Spouse/Partner Relationship stress are compatible with previous descriptions of family cohesion as a protective factor in childhood blindness. Similar resilience profiles have been reported in pediatric oncology, where mothers of children with retinoblastoma exhibit substantial adaptive capacity despite intense treatment demands [26]. These converging findings suggest that many families develop meaningful coping strategies, even under conditions of chronic strain.
Taken together, the results support a multifactorial explanatory model: although total childhood blindness imposes substantial functional and caregiving demands, maternal psychological vulnerability, socioeconomic hardship, and broader contextual stressors appear to play dominant roles in determining parental stress. Importantly, several modifiable variables were identified-such as maternal physical activity, school inclusion, and family cohesion-indicating tangible pathways for intervention. These findings strengthen the argument for structured, family-centered care, systematic screening for maternal depressive symptoms, clear referral pathways, multidisciplinary rehabilitation, and public policies that improve accessibility, transportation, and social inclusion for children with total blindness, in accordance with the ethical principles outlined in the PSI-4 Manual and the Declaration of Helsinki [11].
5. Conclusions
This study offers a comprehensive characterization of parental stress, maternal psychological functioning, and vision-related quality of life in families of children with total blindness, regardless of etiology. Mothers frequently reported depressive symptoms, somatic complaints, sleep disturbances, and reduced psychological energy. Although most remained within normative stress levels, approximately 21% fell within clinically significant or pathological ranges, indicating substantial emotional burden. At the same time, many families demonstrated resilience-based coping strategies supported by family cohesion and strong affective bonding.
Despite the severity of visual impairment, children did not exhibit globally maladaptive behavioral profiles. Instead, parental stress appeared to be shaped primarily by maternal emotional vulnerability, socioeconomic hardship, and environmental barriers rather than by child temperament or the underlying etiology of blindness. Vision-related quality-of-life scores showed moderate impairments across domains. Age-specific patterns emerged: among children aged 0-3 years, higher QFVI-3 scores were associated with maternal physical activity, whereas among children aged 3-7 years, school attendance functioned as a protective factor linked to better emotional and functional outcomes. These findings underscore the importance of caregiver well-being, structured routines, and enriched environments in supporting developmental adaptation.
Although the PSI-4 Child and Parent Domains were not significantly associated with QFVI-3 or QFVI-7, Life Stress indicators demonstrated a significant negative correlation with QFVI-7. This suggests that contextual pressures-rather than parent-child relational stress alone-exert a stronger influence on family functioning during the preschool and early school years.
Taken together, these findings highlight the need for family-centered, multidisciplinary, and psychosocially informed clinical care for children with total blindness of any etiology. Integrating maternal mental-health screening, supportive psychological interventions, early vision rehabilitation, orientation and mobility training, and strategies to promote school inclusion is essential. Future longitudinal and interventional studies are needed to clarify causal pathways, evaluate targeted support strategies, and inform public policies aimed at reducing parental burden and improving both caregiver and child outcomes in the context of severe visual impairment.
Author Contributions
Conceptualization: Julio Cesar Souza-Silva; Methodology: Julio Cesar Souza-Silva, Maria Alves Barbosa, Cleusa Alves Martins, Thallita de Freitas Ramos, Edinamar Aparecida Santos da Silva; Formal Analysis: Julio Cesar Souza-Silva, Milton Ruiz Alves, Marco Túlio Antônio Garciazapata; Investigation: Julio Cesar Souza-Silva, Viviane Matias da Costa Souza; Data Curation: Julio Cesar Souza-Silva; Writing—Original Draft Preparation: Julio Cesar Souza-Silva; Writing—Review & Editing: Viviane Matias da Costa Souza, Maria Alves Barbosa, Cleusa Alves Martins, Marco Túlio Antônio Garciazapata, Edinamar Aparecida Santos da Silva, Thallita de Freitas Ramos; Supervision: Maria Alves Barbosa, Cleusa Alves Martins, Milton Ruiz Alves, Marco Túlio Antônio Garciazapata; Project Administration: Julio Cesar Souza-Silva.
Funding
This research received no external funding.
Institutional Review Board Statement
The study was conducted in accordance with the Declaration of Helsinki and approved by the Research Ethics Committee of the Federal University of Goiás (protocol code CAAE 90833718.2.0000.5078, approval number 2.746.572). All mothers provided written informed consent prior to participation. The study also complied with the ethical principles established by the Brazilian National Health Council Resolution 466/12.
Informed Consent Statement
Written informed consent was obtained from all mothers involved in the study, in accordance with the ethical standards approved by the Research Ethics Committee of the Federal University of Goiás.
Data Availability Statement
The datasets generated and analyzed during the current study have been deposited in the Harvard Dataverse repository and will be made publicly available upon acceptance of this manuscript. After publication, all dataset files will be accessible under a CC0 1.0 Universal Public Domain Dedication. Access to identifiable or sensitive raw data remains restricted in accordance with ethical regulations and with the approval granted by the Research Ethics Committee of the Federal University of Goiás (CAAE 90833718.2.0000.5078).
Acknowledgments
The authors express their gratitude to the participating families for their time, trust, and collaboration throughout the study. The authors also thank biomedical scientist Pollyanna Moreira, who served as the research assistant responsible for data collection with the participating mothers, for her invaluable contribution to the fieldwork phase of this project. We further acknowledge the administrative and logistical support provided by the clinical and rehabilitation teams of the Federal University of Goiás and partnering institutions involved in participant recruitment and data organization. During the preparation of this manuscript, the authors used ChatGPT (OpenAI, GPT-5 family) to support language refinement, content organization, and improvement of readability. All AI-assisted output was reviewed, verified, and edited by the authors, who take full responsibility for the final content of this publication.
Conflicts of Interest
The authors declare no conflicts of interest. The funders had no role in the design of the study; in the collection, analyses, or interpretation of data; in the writing of the manuscript; or in the decision to publish the results.
Abbreviations
The following abbreviations are used in this manuscript:
| PSI-4 | Parenting Stress Index, Fourth Edition |
| CD | Child Domain (PSI-4) |
| PD | Parent Domain (PSI-4) |
| LS | Life Stress (PSI-4) |
| QFVI-3 | Quality of Family Vision Impact, version for ages 0–3 years |
| QFVI-7 | Quality of Family Vision Impact, version for ages 3–7 years |
| CVFQ | Children's Visual Function Questionnaire |
| ABEP | Brazilian Association of Research Companies (Socioeconomic Classification) |
| DP | Depression Subscale (PSI-4 Parent Domain) |
| HE | Health Subscale (PSI-4 Parent Domain) |
| AD | Adaptability Subscale (PSI-4 Child Domain) |
| DE | Demandingness Subscale (PSI-4 Child Domain) |
| UFG | Federal University of Goiás |
| IRB | Institutional Review Board |
Appendix A. STROBE Checklist
This appendix contains the complete STROBE (Strengthening the Reporting of Observational Studies in Epidemiology) checklist for cross-sectional studies. The checklist summarizes how each reporting item was addressed in the present study, ensuring transparency, methodological rigor, and adherence to international standards for observational research reporting.
References
- Organization, WH. Global data on visual impairments. Geneva: World Health Organization; 2007.
- Ottaiano J, Ávila M, Umbelino C, Taleb A. As condições de saúde ocular no Brasil – 2019. São Paulo: Conselho Brasileiro de Oftalmologia (CBO); 2019.
- Selye H. Stress in health and disease. American Journal of Nursing. 1973;73(4):760–1.
- Cohen S, Janicki-Deverts D, Miller GE. Psychological stress and disease. JAMA. 2007;298(14):1685–7. [CrossRef]
- Vismara L, Rollè L, Agostini F, Sechi C, Fenaroli V, Molgora S, et al. Perinatal parenting stress, anxiety, and depression outcomes in first-time mothers and fathers: a 3- to 6-months postpartum follow-up study. Front Psychol. 2016;7:938. [CrossRef]
- Abidin, RR. Parenting Stress Index, Fourth Edition: Professional Manual. PAR, editor. Lutz, FL: Psychological Assessment Resources; 2012.
- Felius J, Stager DR, Berry PM. Development of a children’s visual function questionnaire (CVFQ). Am J Ophthalmol. 2004;138(3):362–72. [CrossRef]
- Lopes, MC. Tradução, adaptação cultural e validação do questionário de função visual infantil (QFVI). São Paulo: Universidade Federal de São Paulo; 2009.
- Souza-Silva, JC. Avaliação do estresse parental e qualidade de vida de crianças com cegueira total. Goiânia: Universidade Federal de Goiás; 2020.
- von Elm E, Altman DG, Egger M, Pocock SJ, Gøtzsche PC, Vandenbroucke JP. The Strengthening the Reporting of Observational Studies in Epidemiology (STROBE) Statement: guidelines for reporting observational studies. Int J Surg. 2014;12(12):1495–9. [CrossRef]
- Association, WM. Declaration of Helsinki: Ethical principles for medical research involving human subjects. JAMA. 2013;310(20):2191–4. [CrossRef]
- Speedwell L, Stanton F, Nischal KK. Ophthalmic workload and low-vision services for children. Eye. 2003;17(7):744–8. [CrossRef]
- Shapiro SS, Wilk MB. An analysis of variance test for normality (complete samples). Biometrika. 1965;52(3-4):591–611. [CrossRef]
- Hollander M, Wolfe DA, Chicken E. Nonparametric Statistical Methods. Hoboken, NJ: Wiley; 2013.
- Spearman, C. The proof and measurement of association between two things. Am J Psychol. 1904;15(1):72–101. [CrossRef]
- Team, RC. R: A Language and Environment for Statistical Computing. Vienna: R Foundation for Statistical Computing; 2023.
- Sakkalou E, Sakki H, O'reilly M, Salt A, Dale N. Parenting stress, anxiety, and depression in mothers with visually impaired infants: a cross-sectional and longitudinal cohort analysis. Dev Med Child Neurol. 2018;60(3):290–8. [CrossRef]
- DeCarlo D, Bowman E, Monroe C, Kline R, McGwin GJ, Owsley C. Prevalence of attention-deficit/hyperactivity disorder among children with vision impairment. J AAPOS. 2014;18(1):10–4. [CrossRef]
- Schappin R, Wijnroks L, Uniken Venema M. Rethinking stress in parents of preterm infants: a meta-analysis. PLoS One. 2013;8(2):e54992. [CrossRef]
- Celeste M. Play behaviors in visually impaired children. J Vis Impair Blind. 2006;100(2):75–85.
- Stults-Kolehmainen MA, Sinha R. Physical activity and stress. Sports Med. 2014;44(1):81–121. [CrossRef]
- American Psychiatric, A. Diagnostic and Statistical Manual of Mental Disorders (DSM-5): APA; 2014.
- Ross CE. Overweight and depression. J Health Soc Behav. 1994;35(3):353–78.
- Taanila, A. Parenting stress. Child Care Health Dev. 2002;32(2):136–44. [CrossRef]
- Brezin, A. Socioeconomic aspects of visual loss. Acta Ophthalmol Scand. 2004;82(2):209–16. [CrossRef]
- Wang Y, Zhang J, Gong X, Li C. Depression, caregiver burden and social support among caregivers of retinoblastoma patients in China. Int J Nurs Pract. 2016;22(5):478–85. [CrossRef]
Figure 1.
Distribution of Educational Resources.
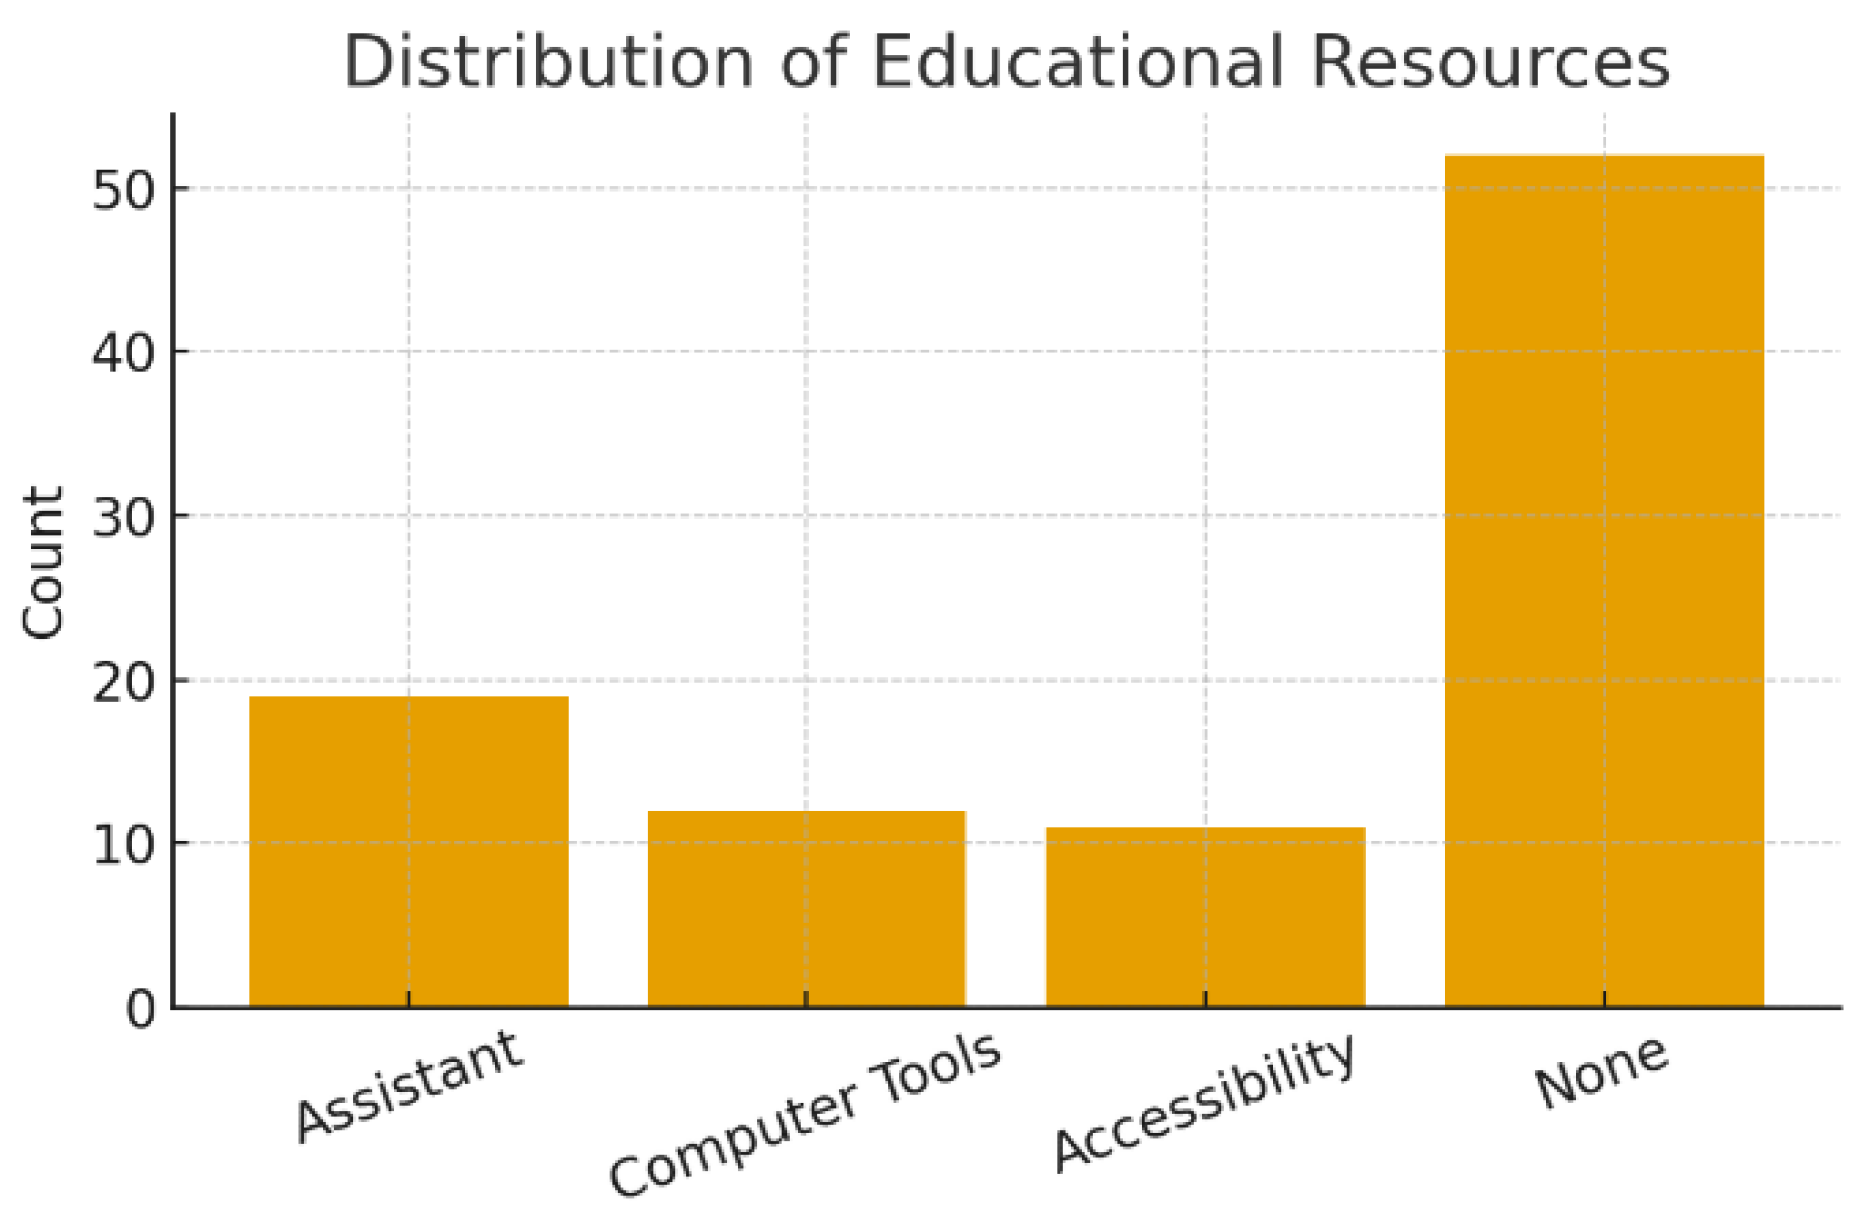
Figure 2.
School Type Distribution.
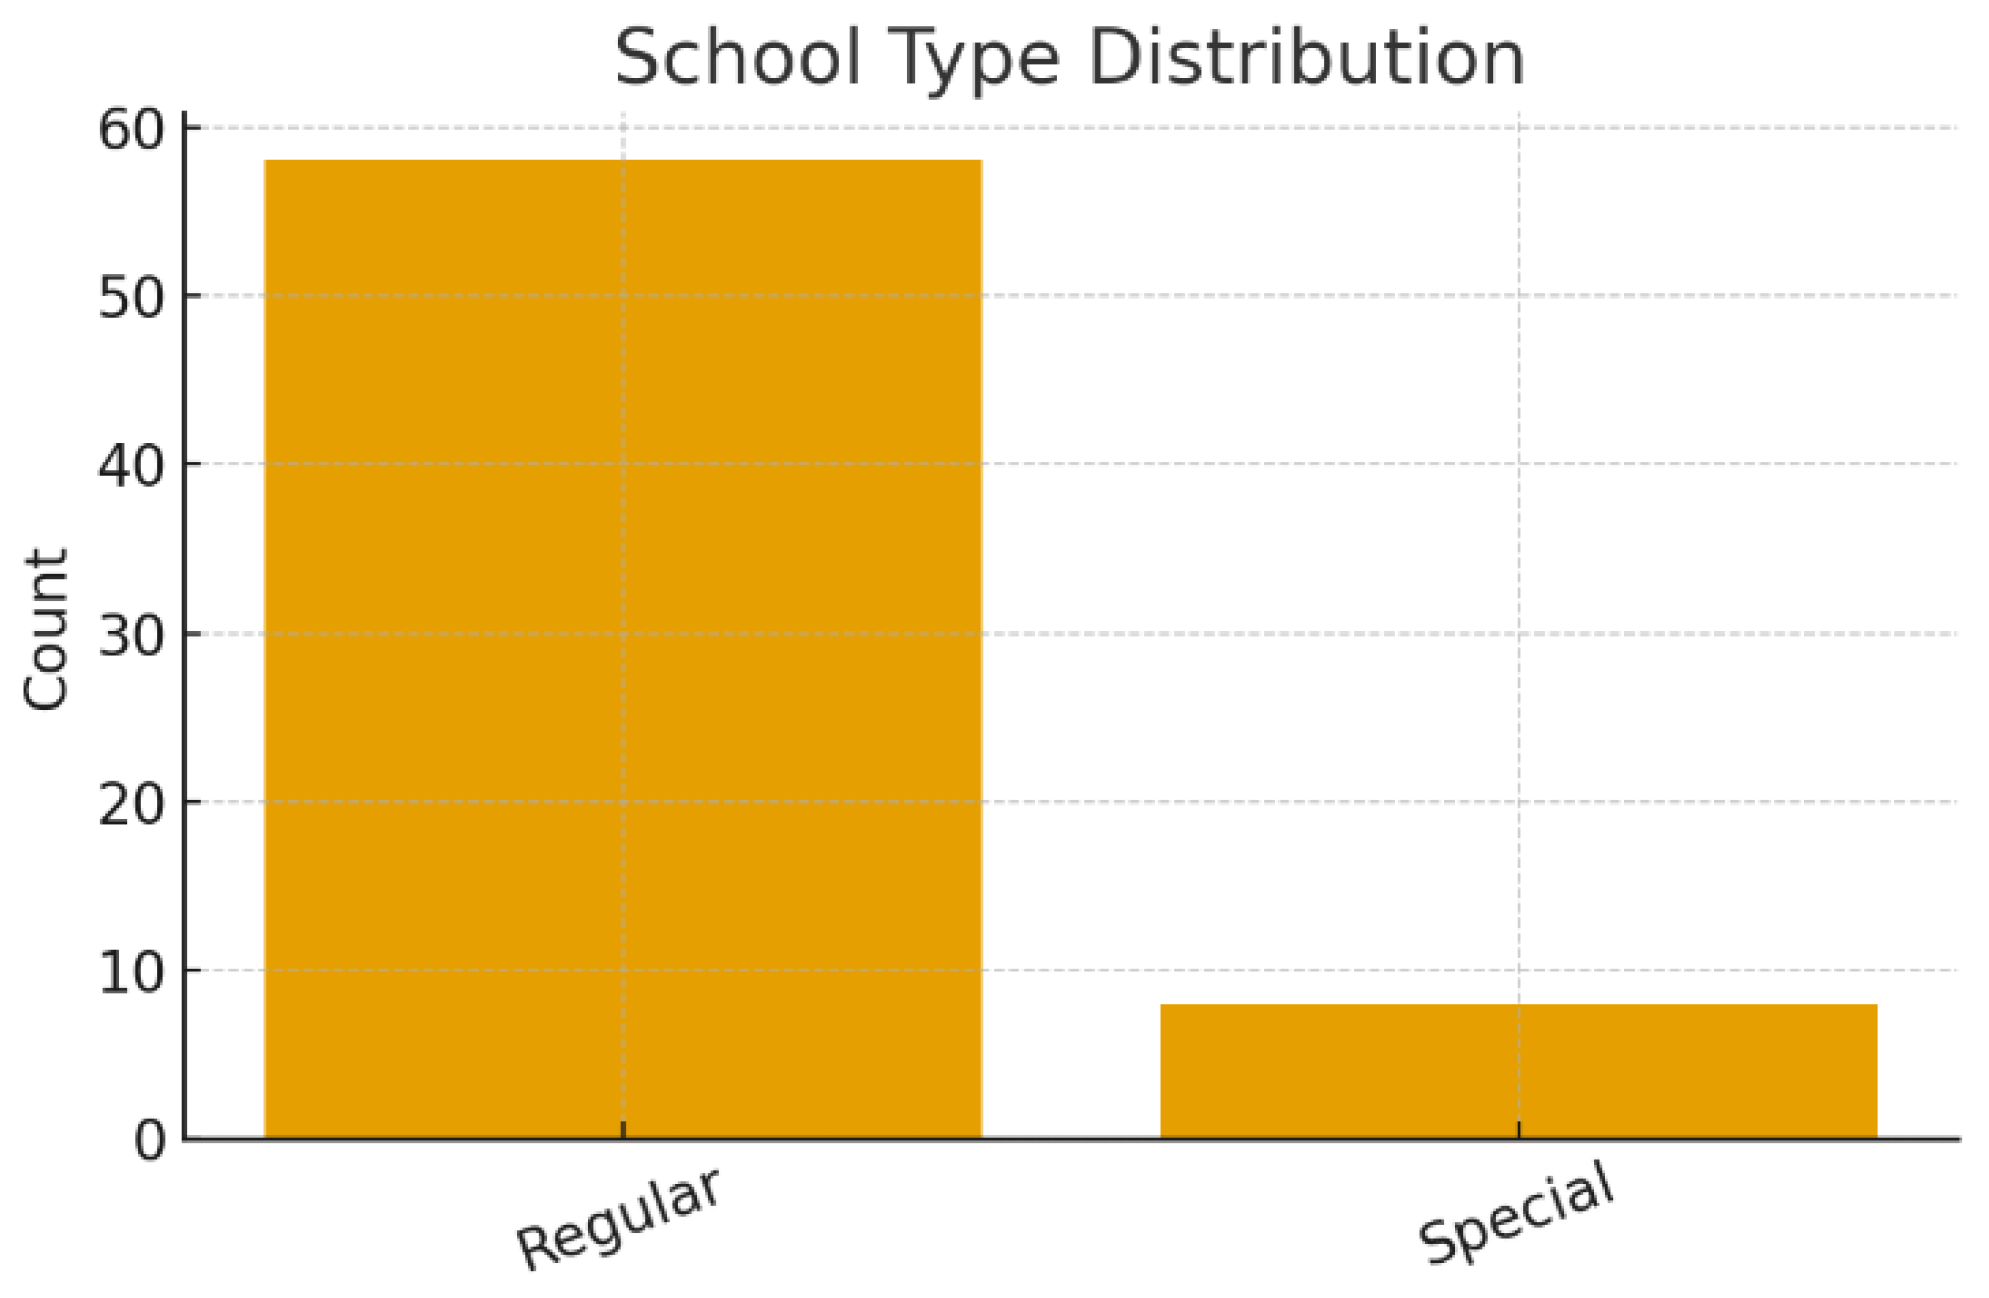
Figure 3.
Physical Activity and Leisure Participation.
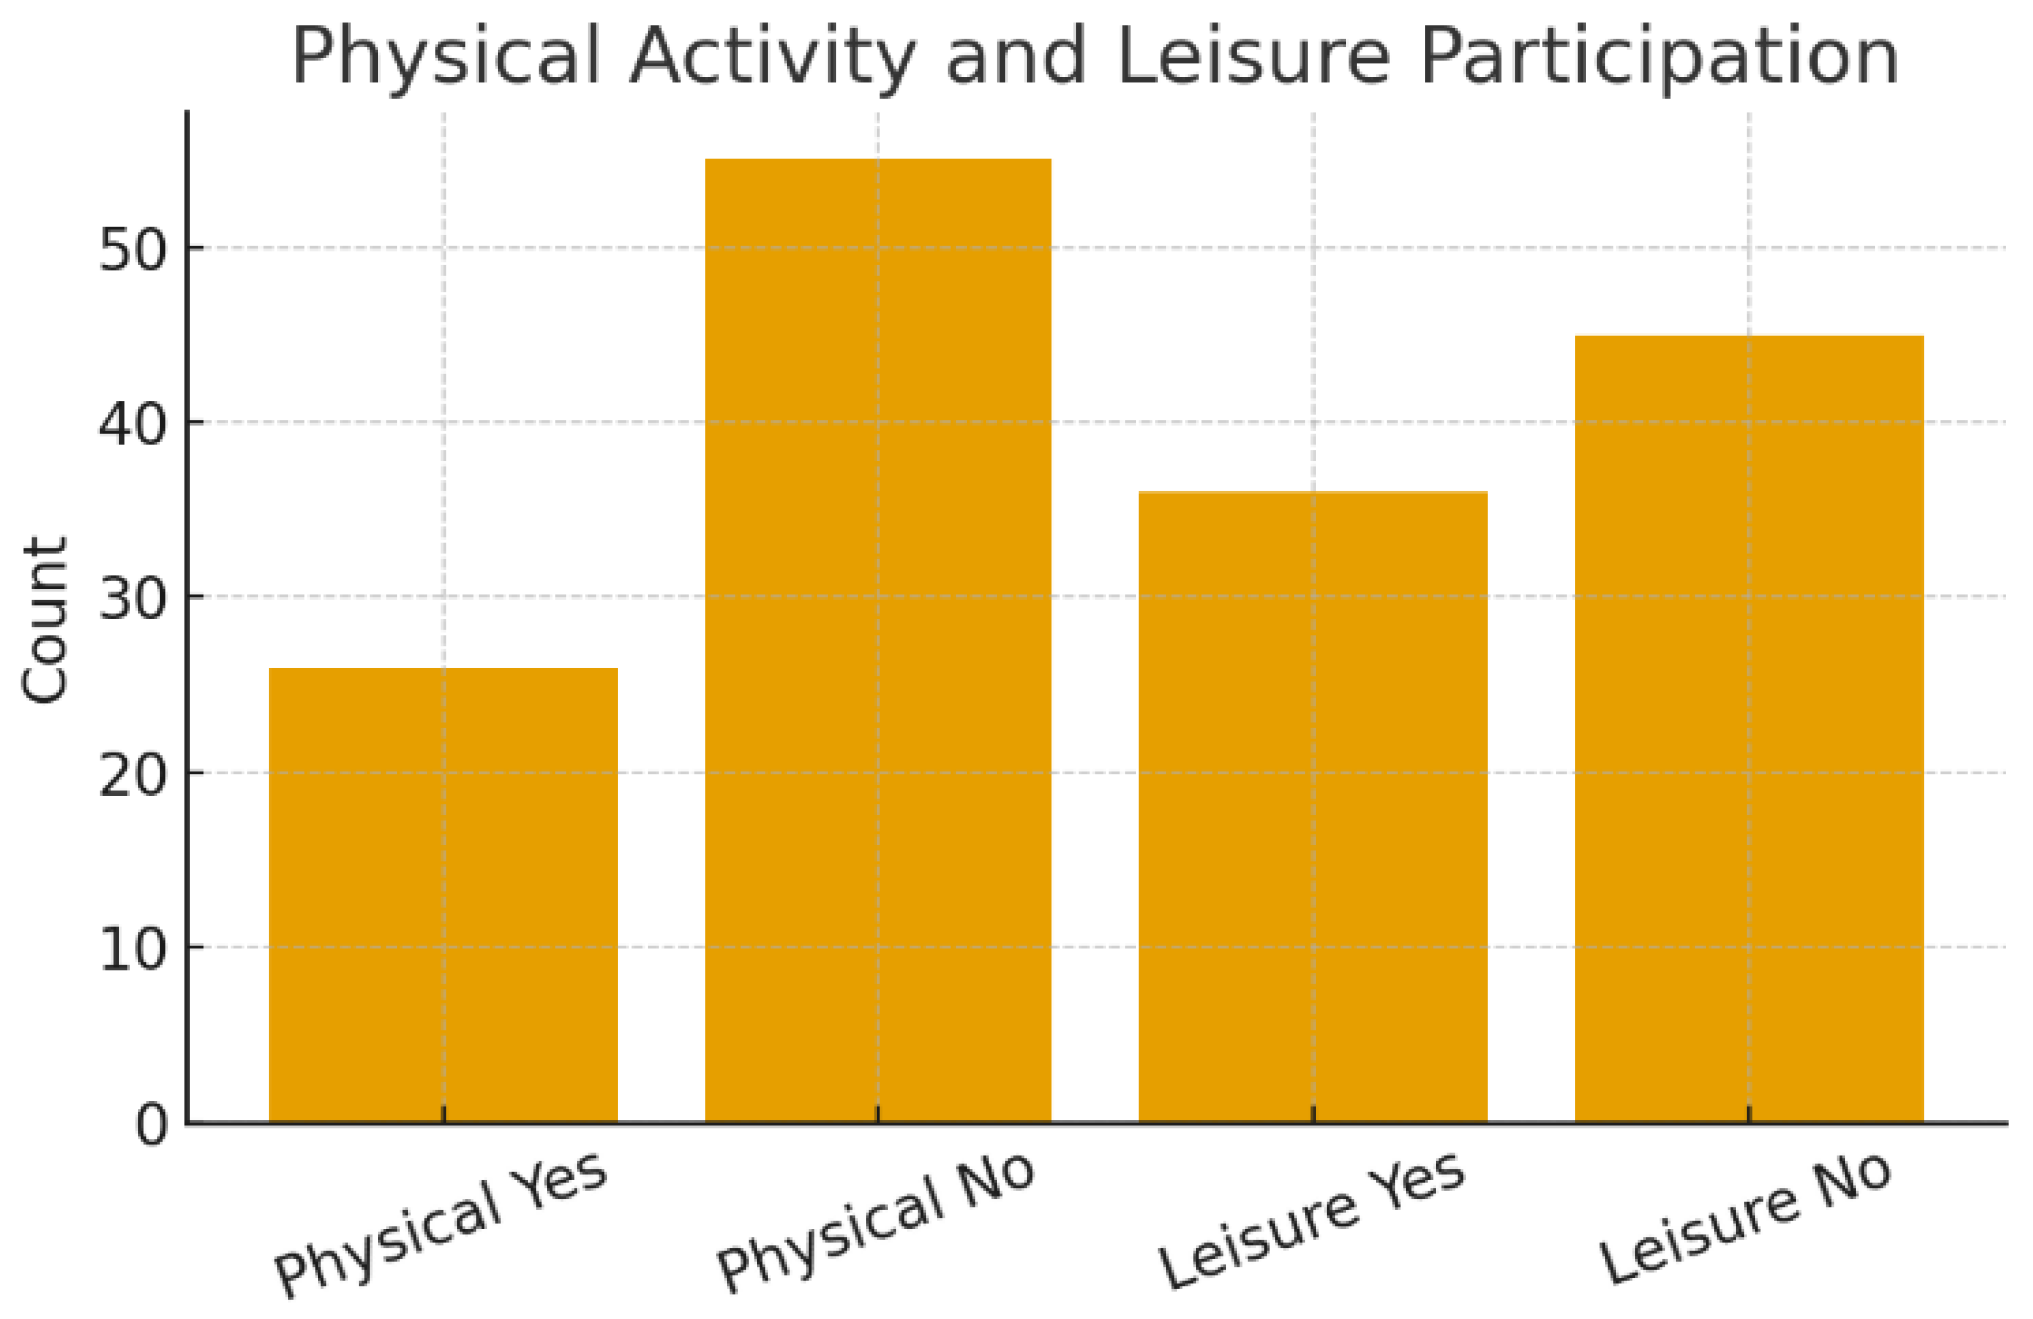
Figure 4.
Socioeconomic Class Distribution (ABEP).
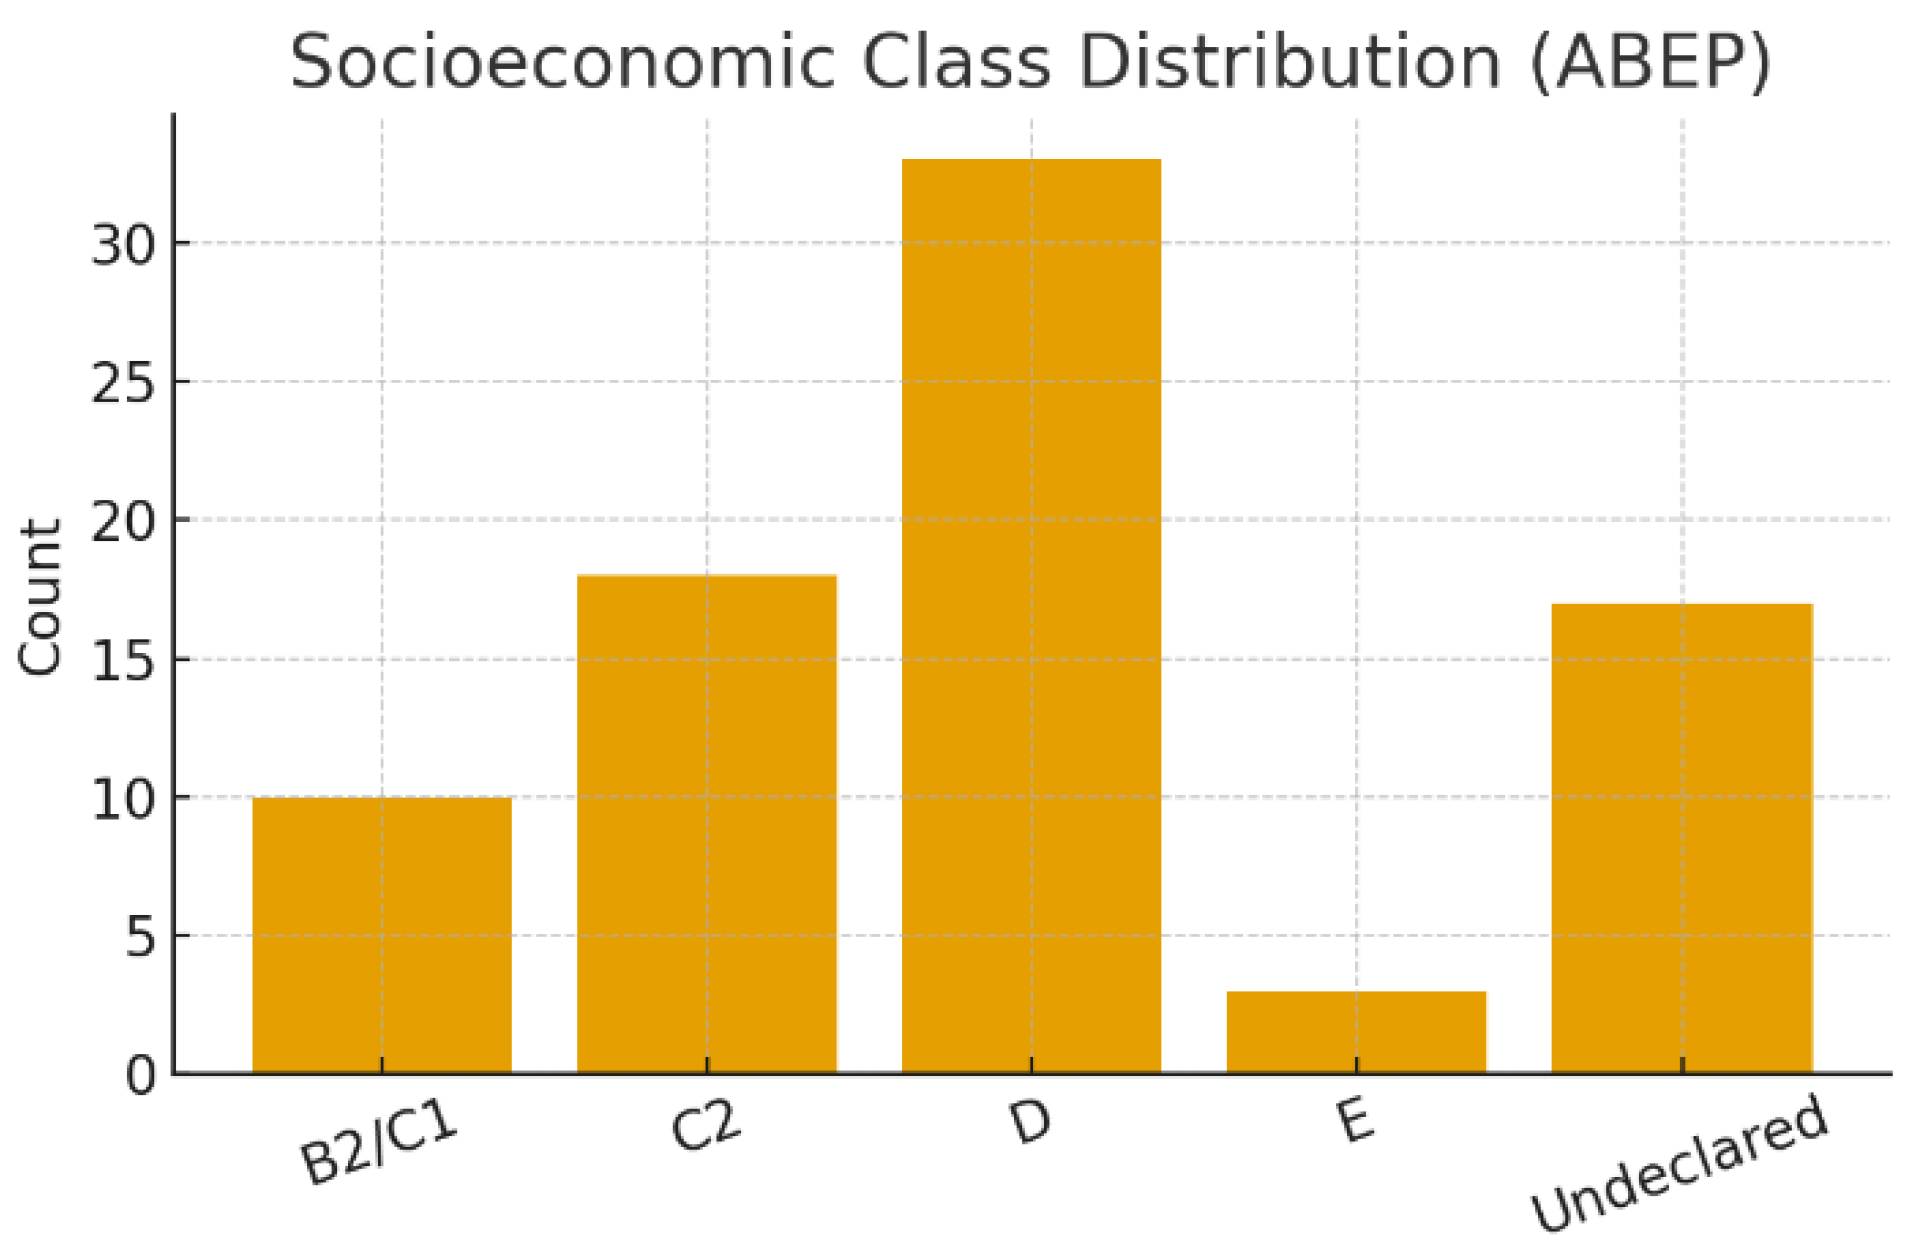
Figure 5.
Maternal Employment and Social Benefits.
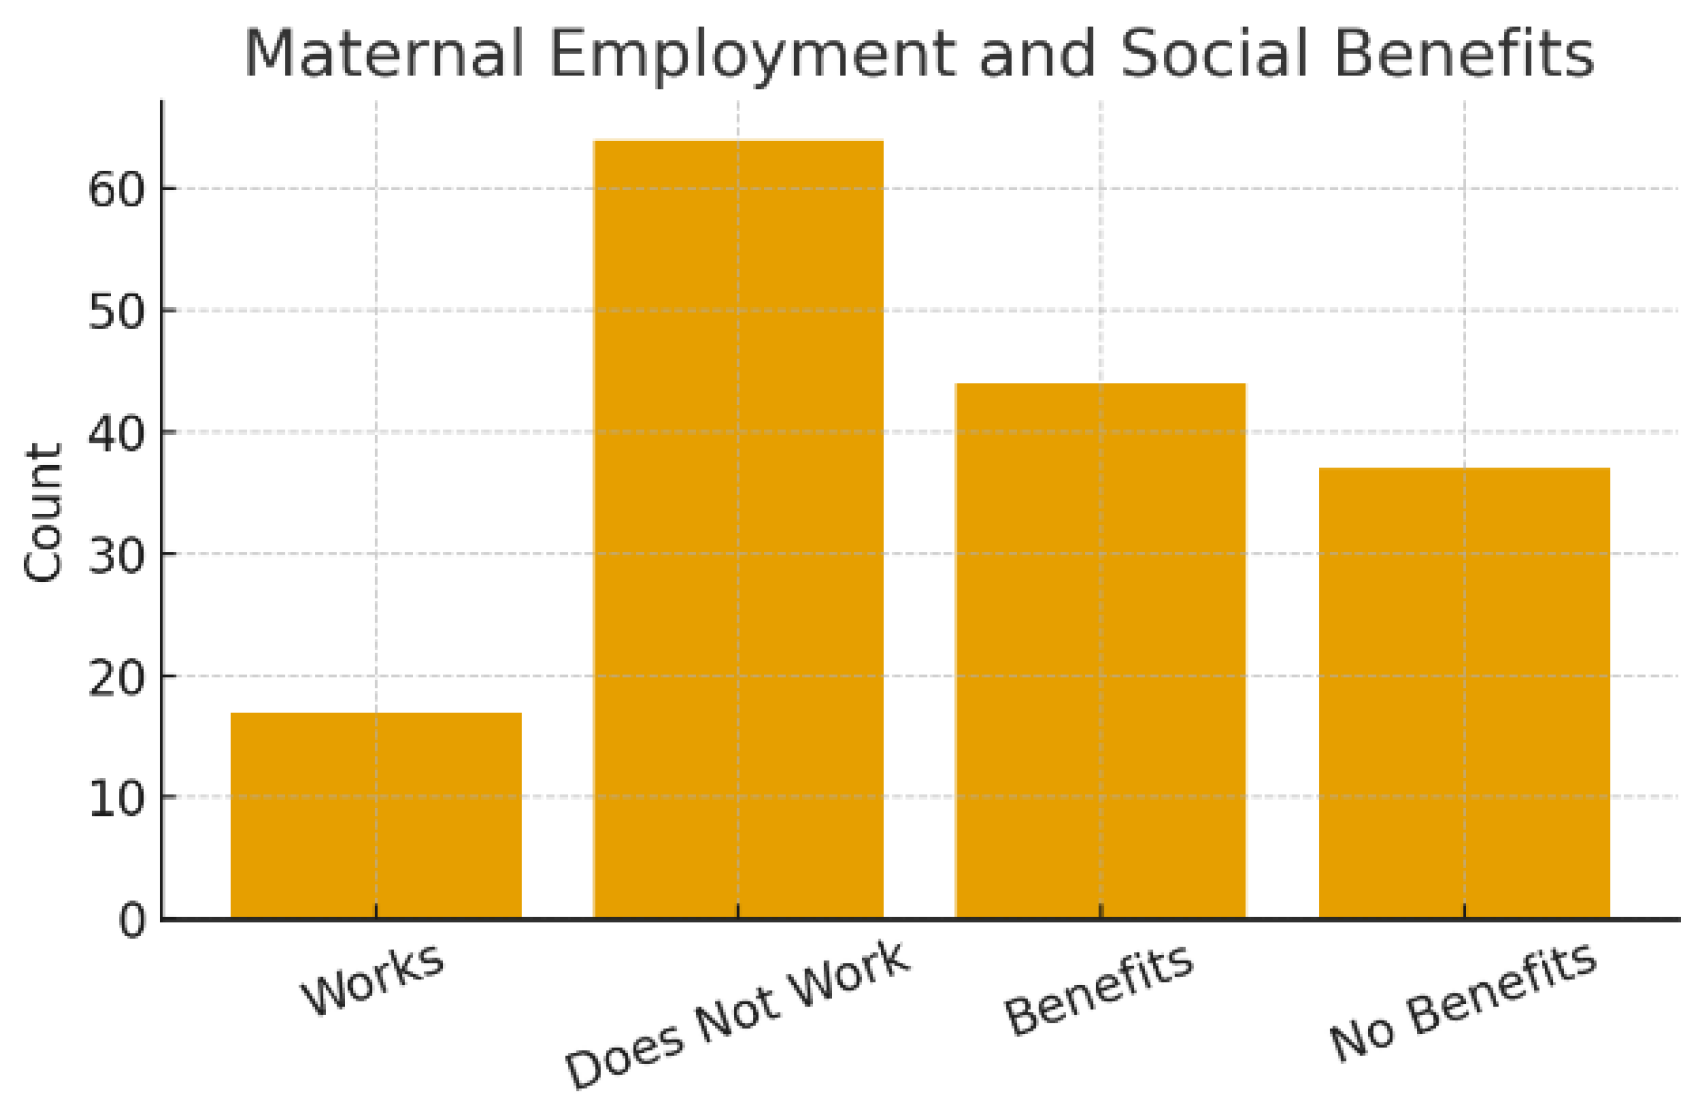
Figure 6.
Maternal Marital Status Distribution.
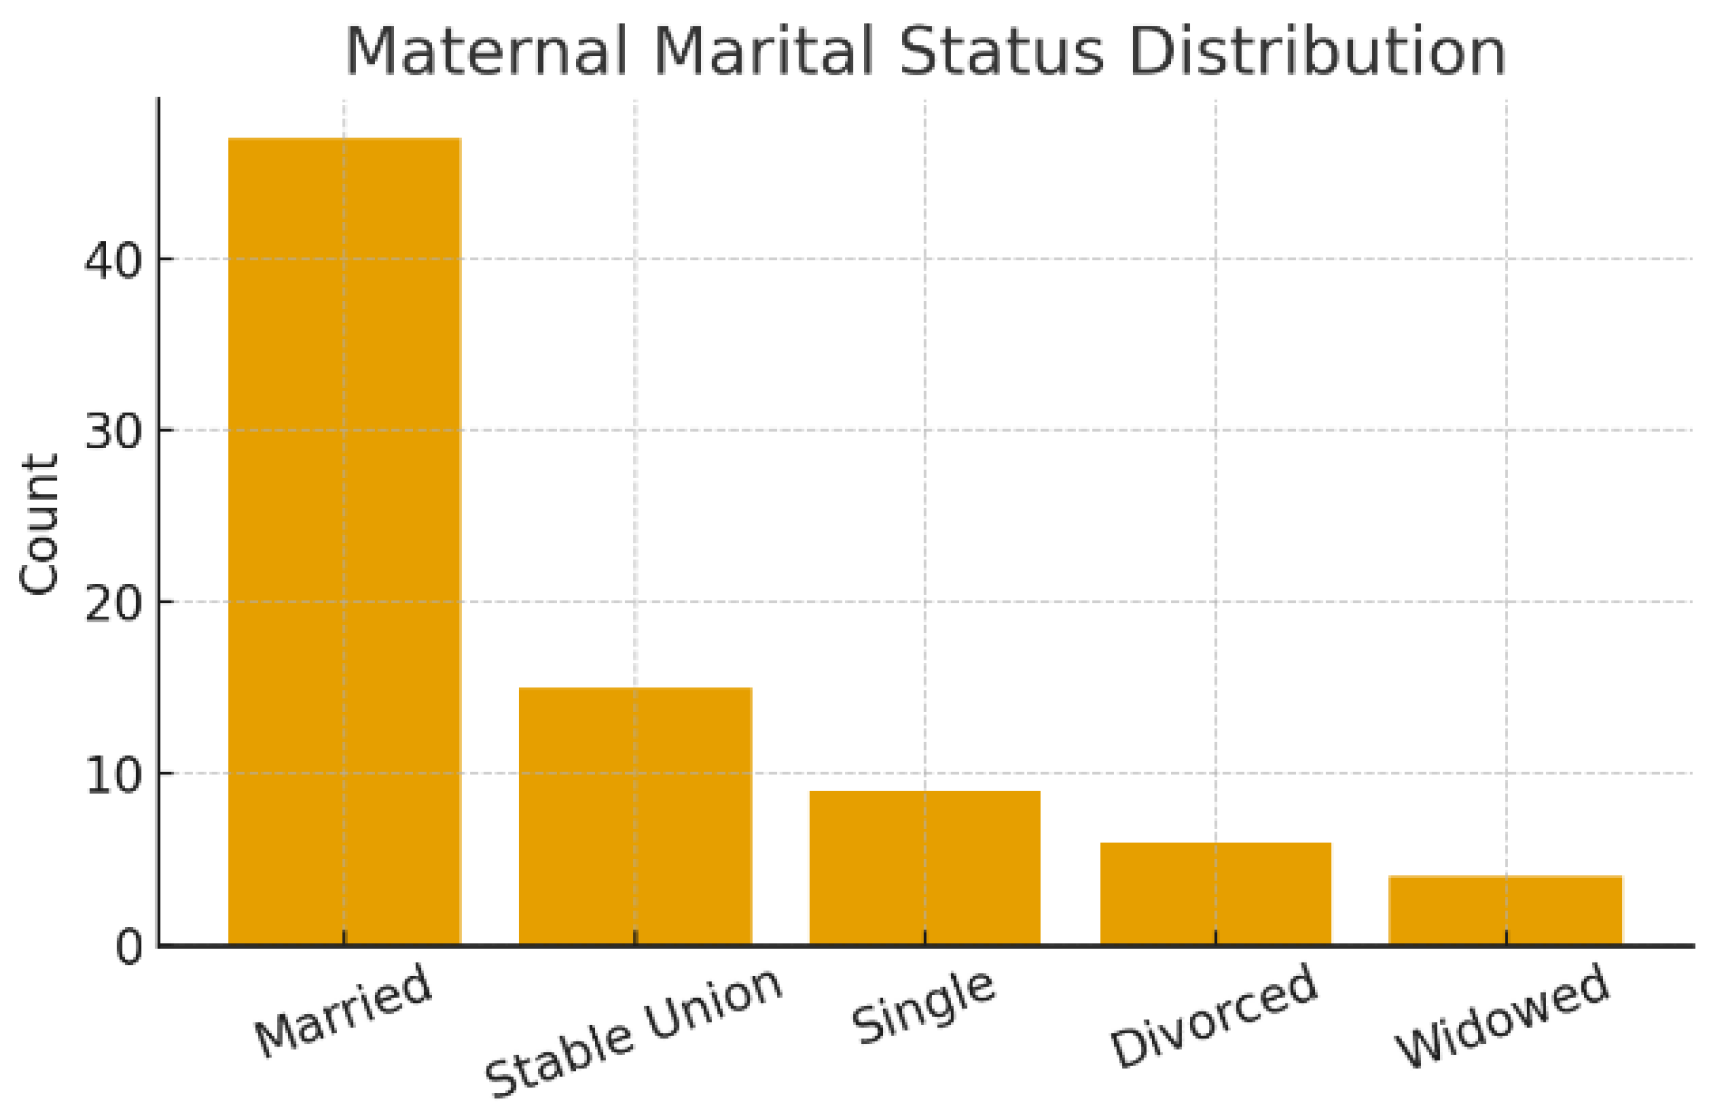
Figure 7.
Maternal Clinical Conditions.
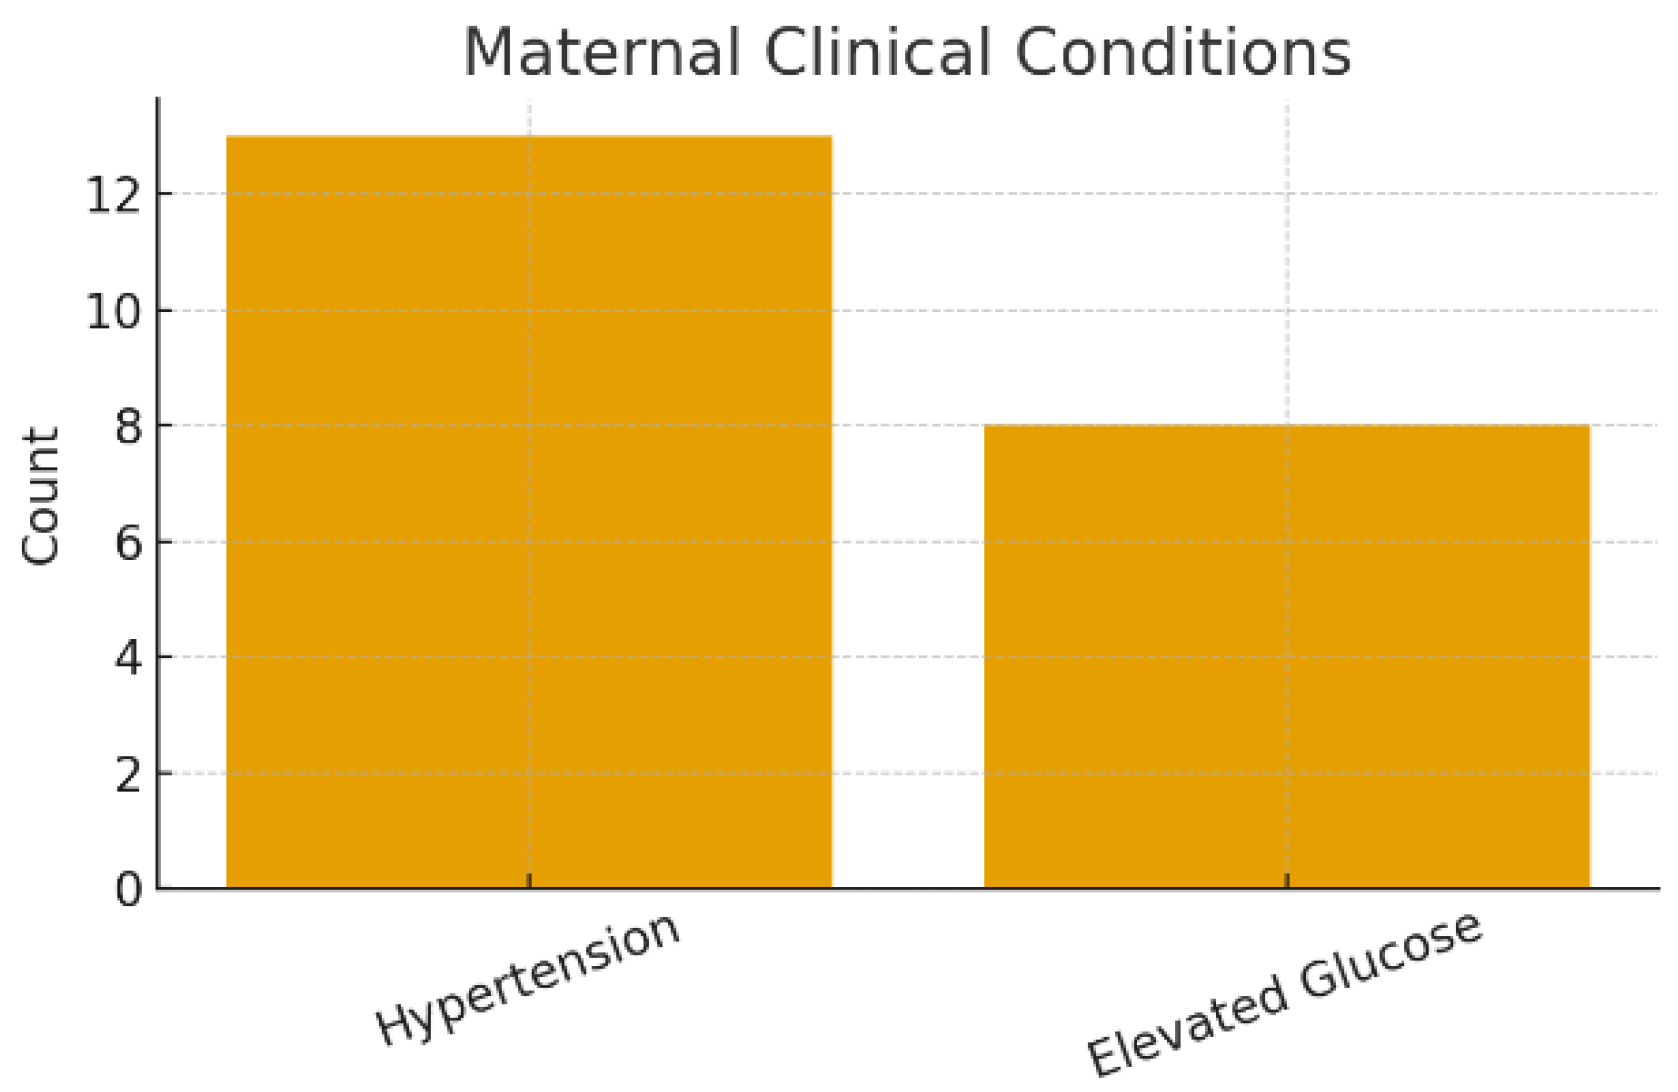
Figure 8.
Maternal Somatic Symptoms.
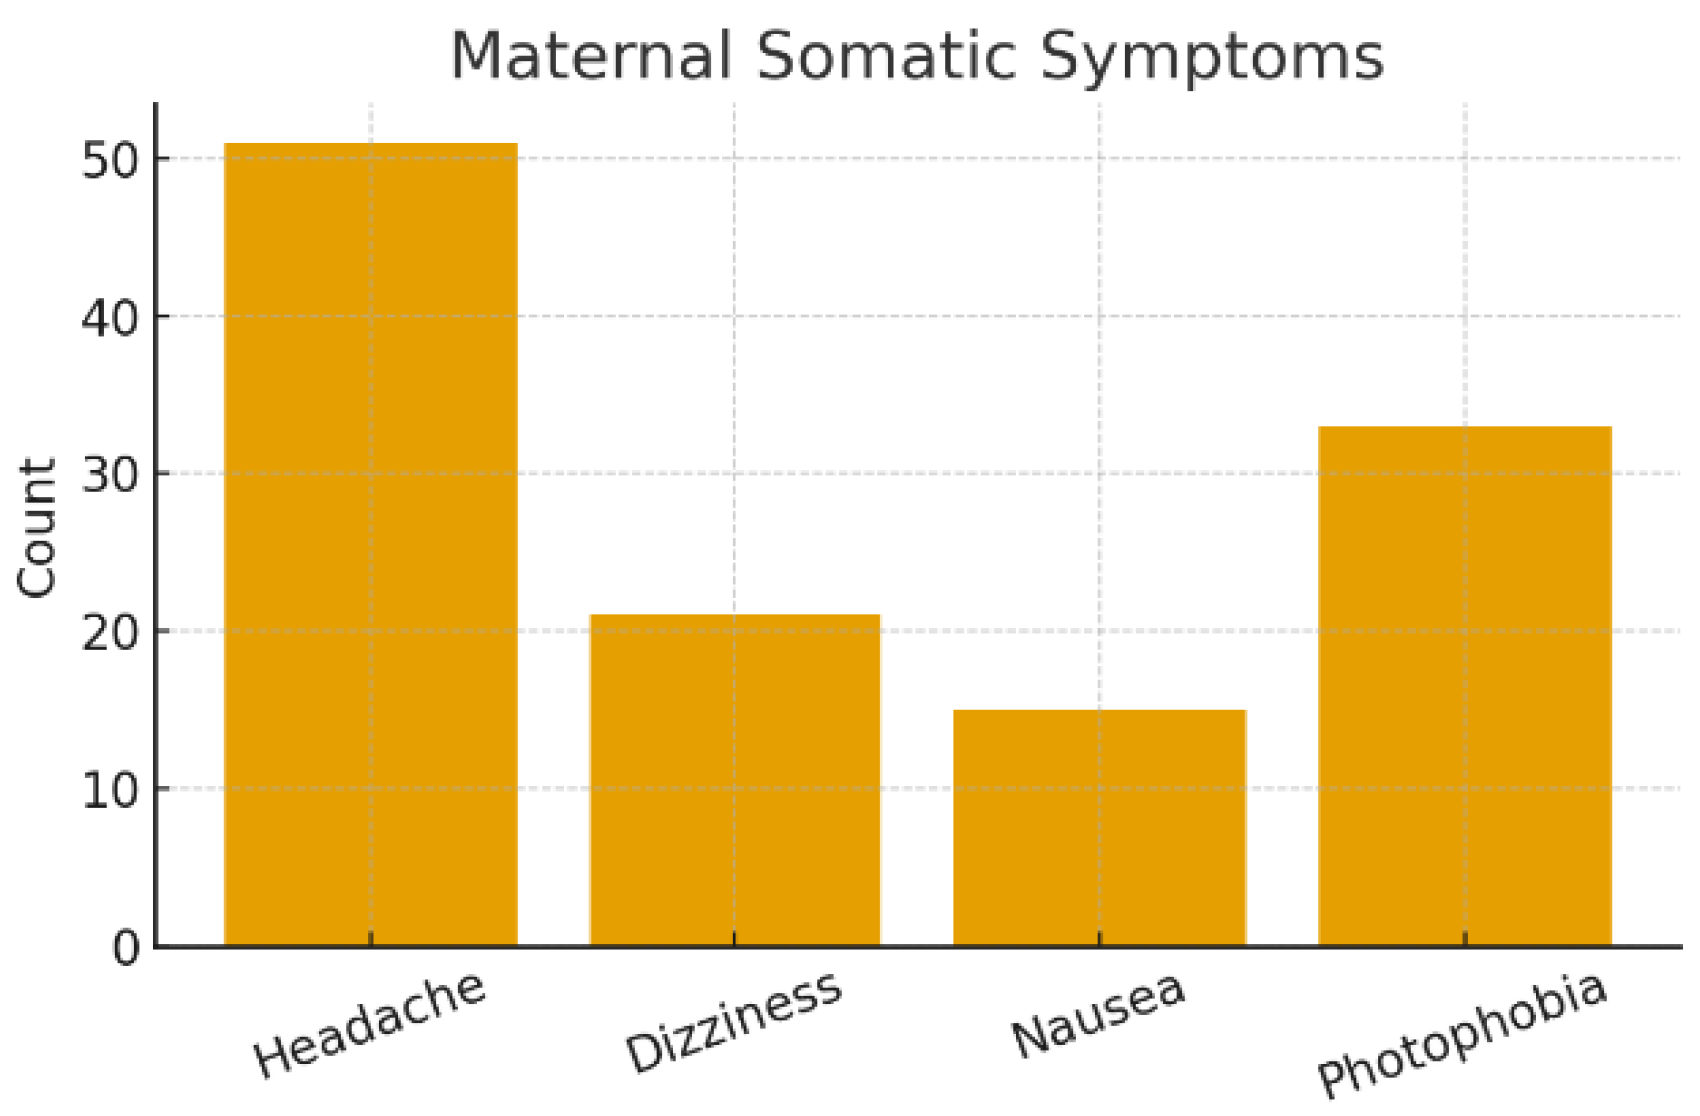
Figure 9.
Maternal Emotional and Sleep Symptoms.
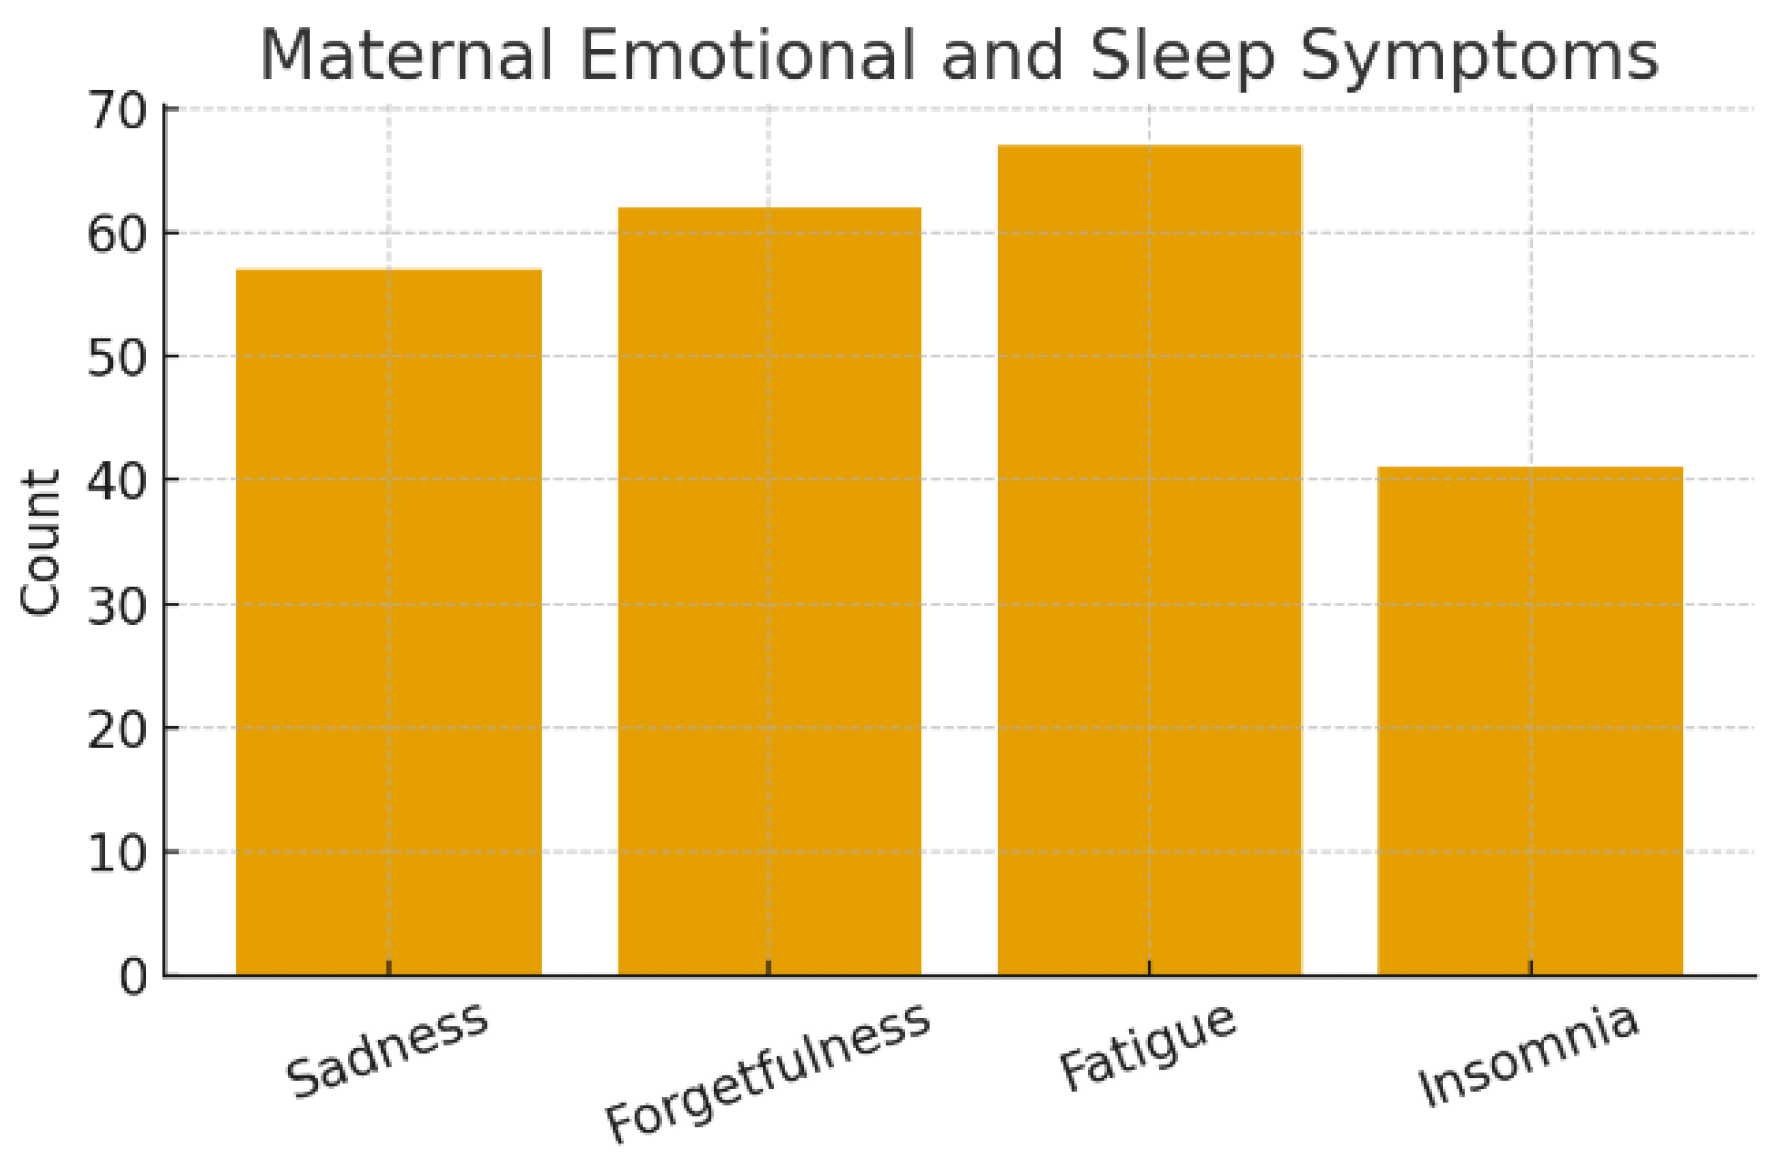
Figure 10.
Radar Chart PSI-4 Child Domain.
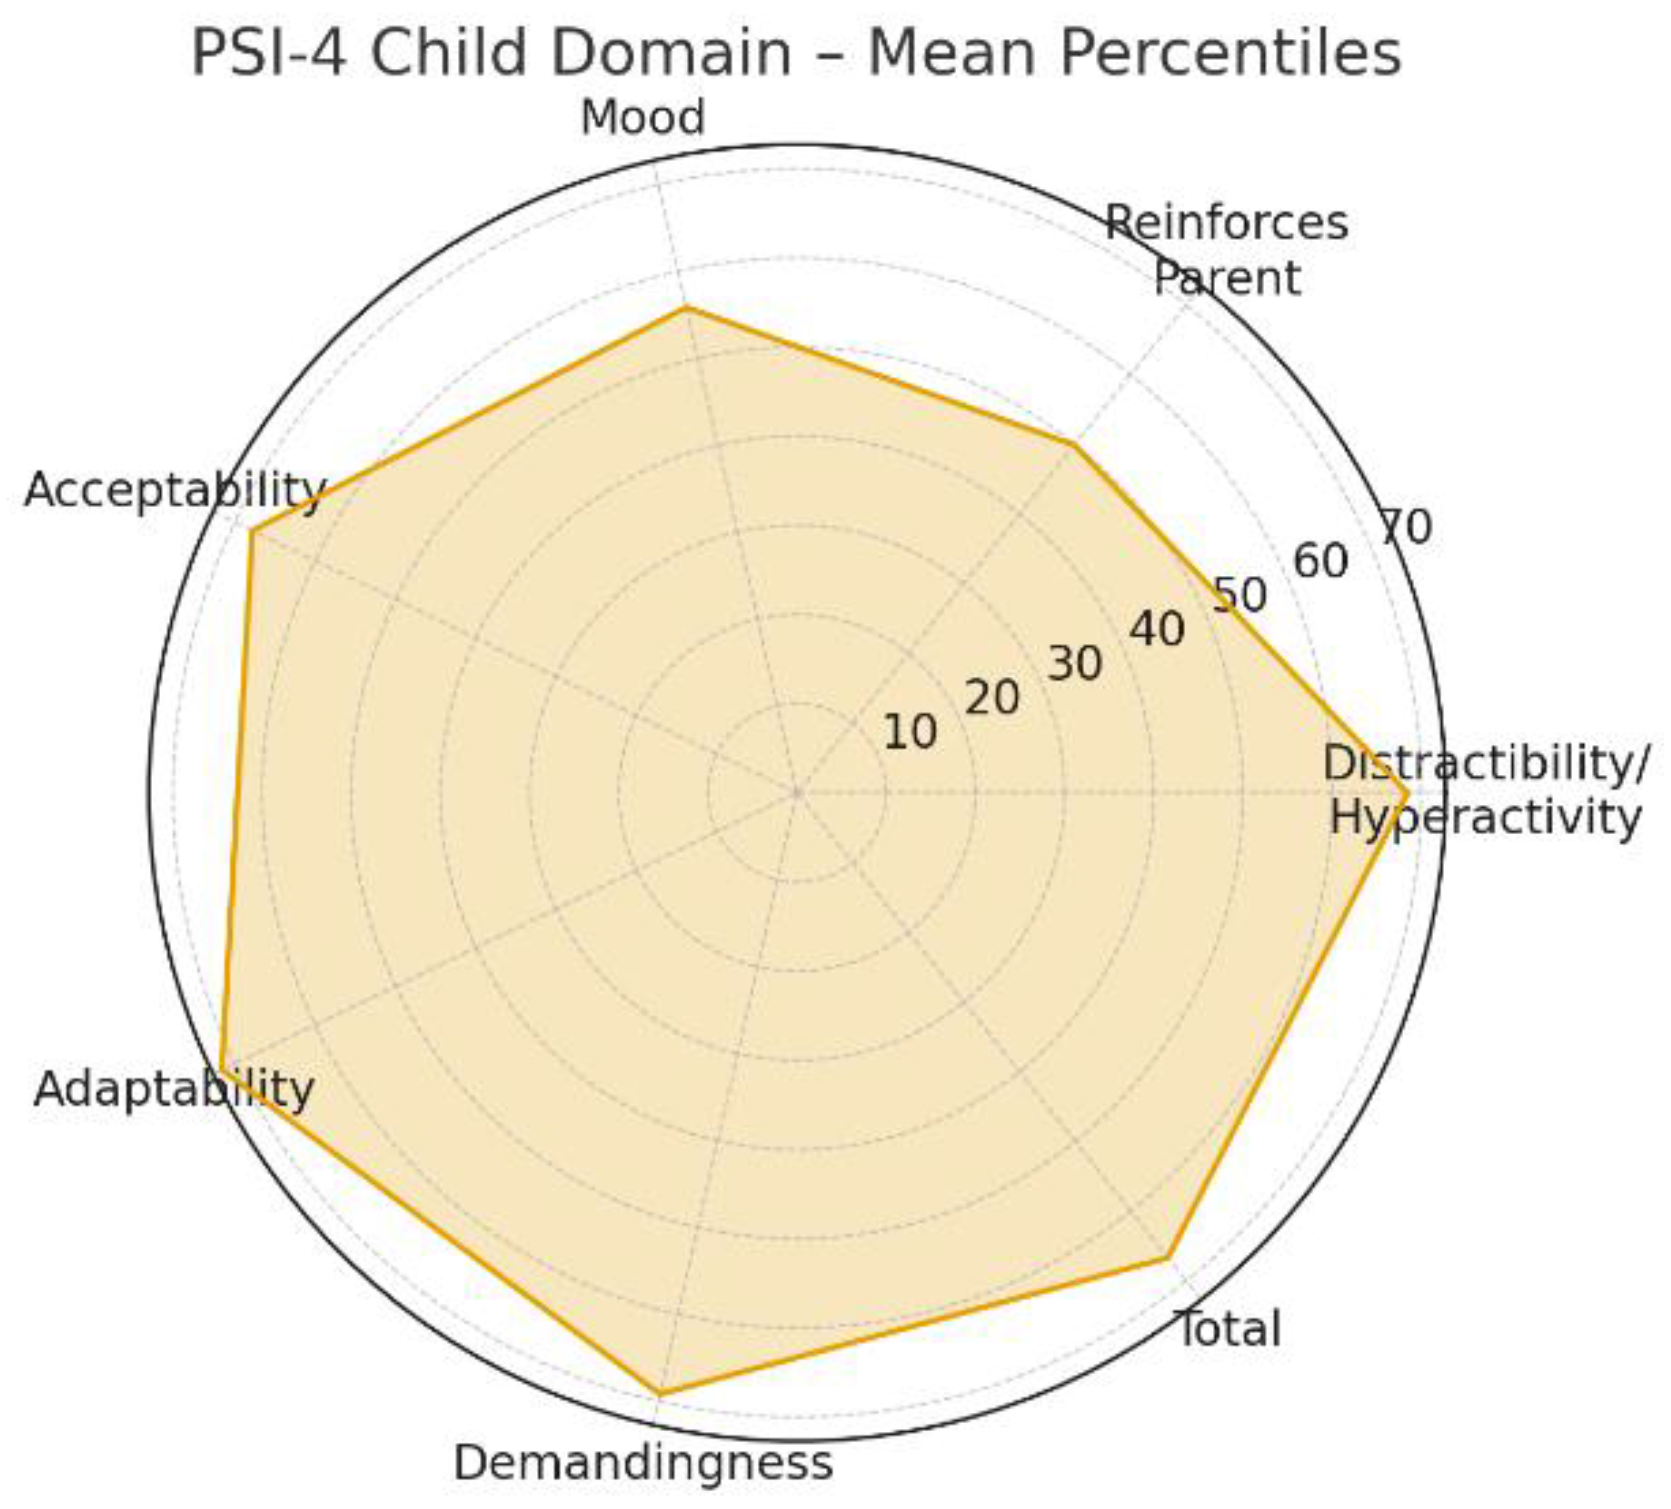
Figure 11.
PSI-4 Child Domain scores by living with the father and for headache (boxplot).
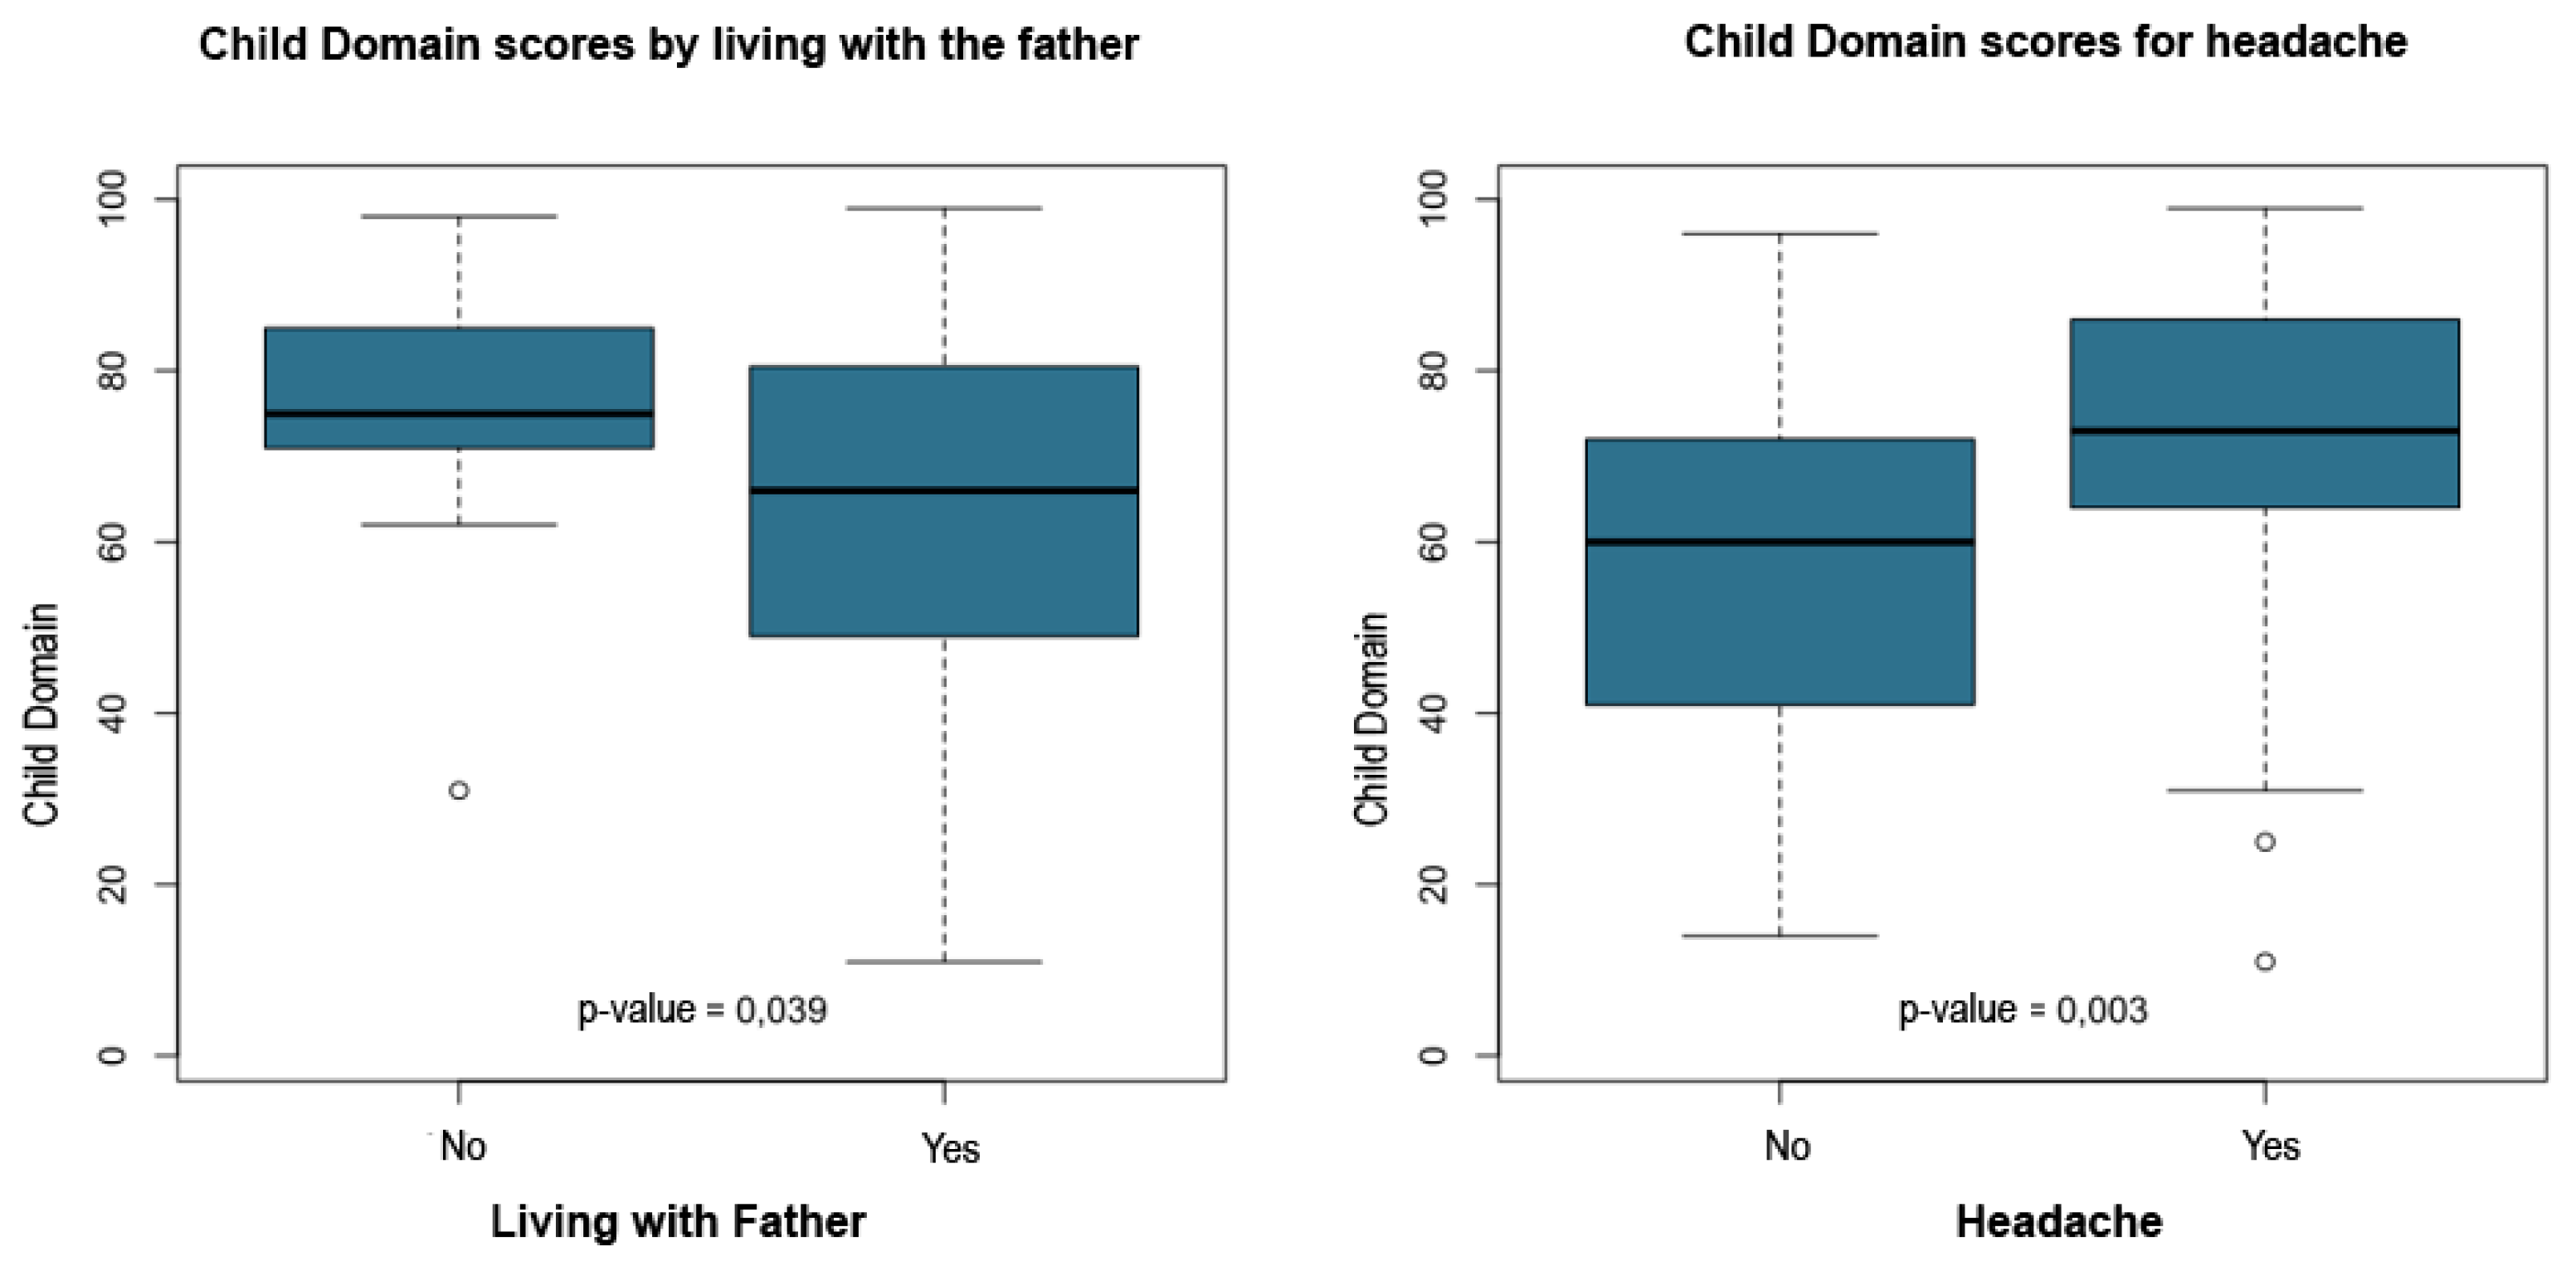
Figure 12.
PSI-4 Child Domain scores by maternal light intolerance and sadness (boxplots).
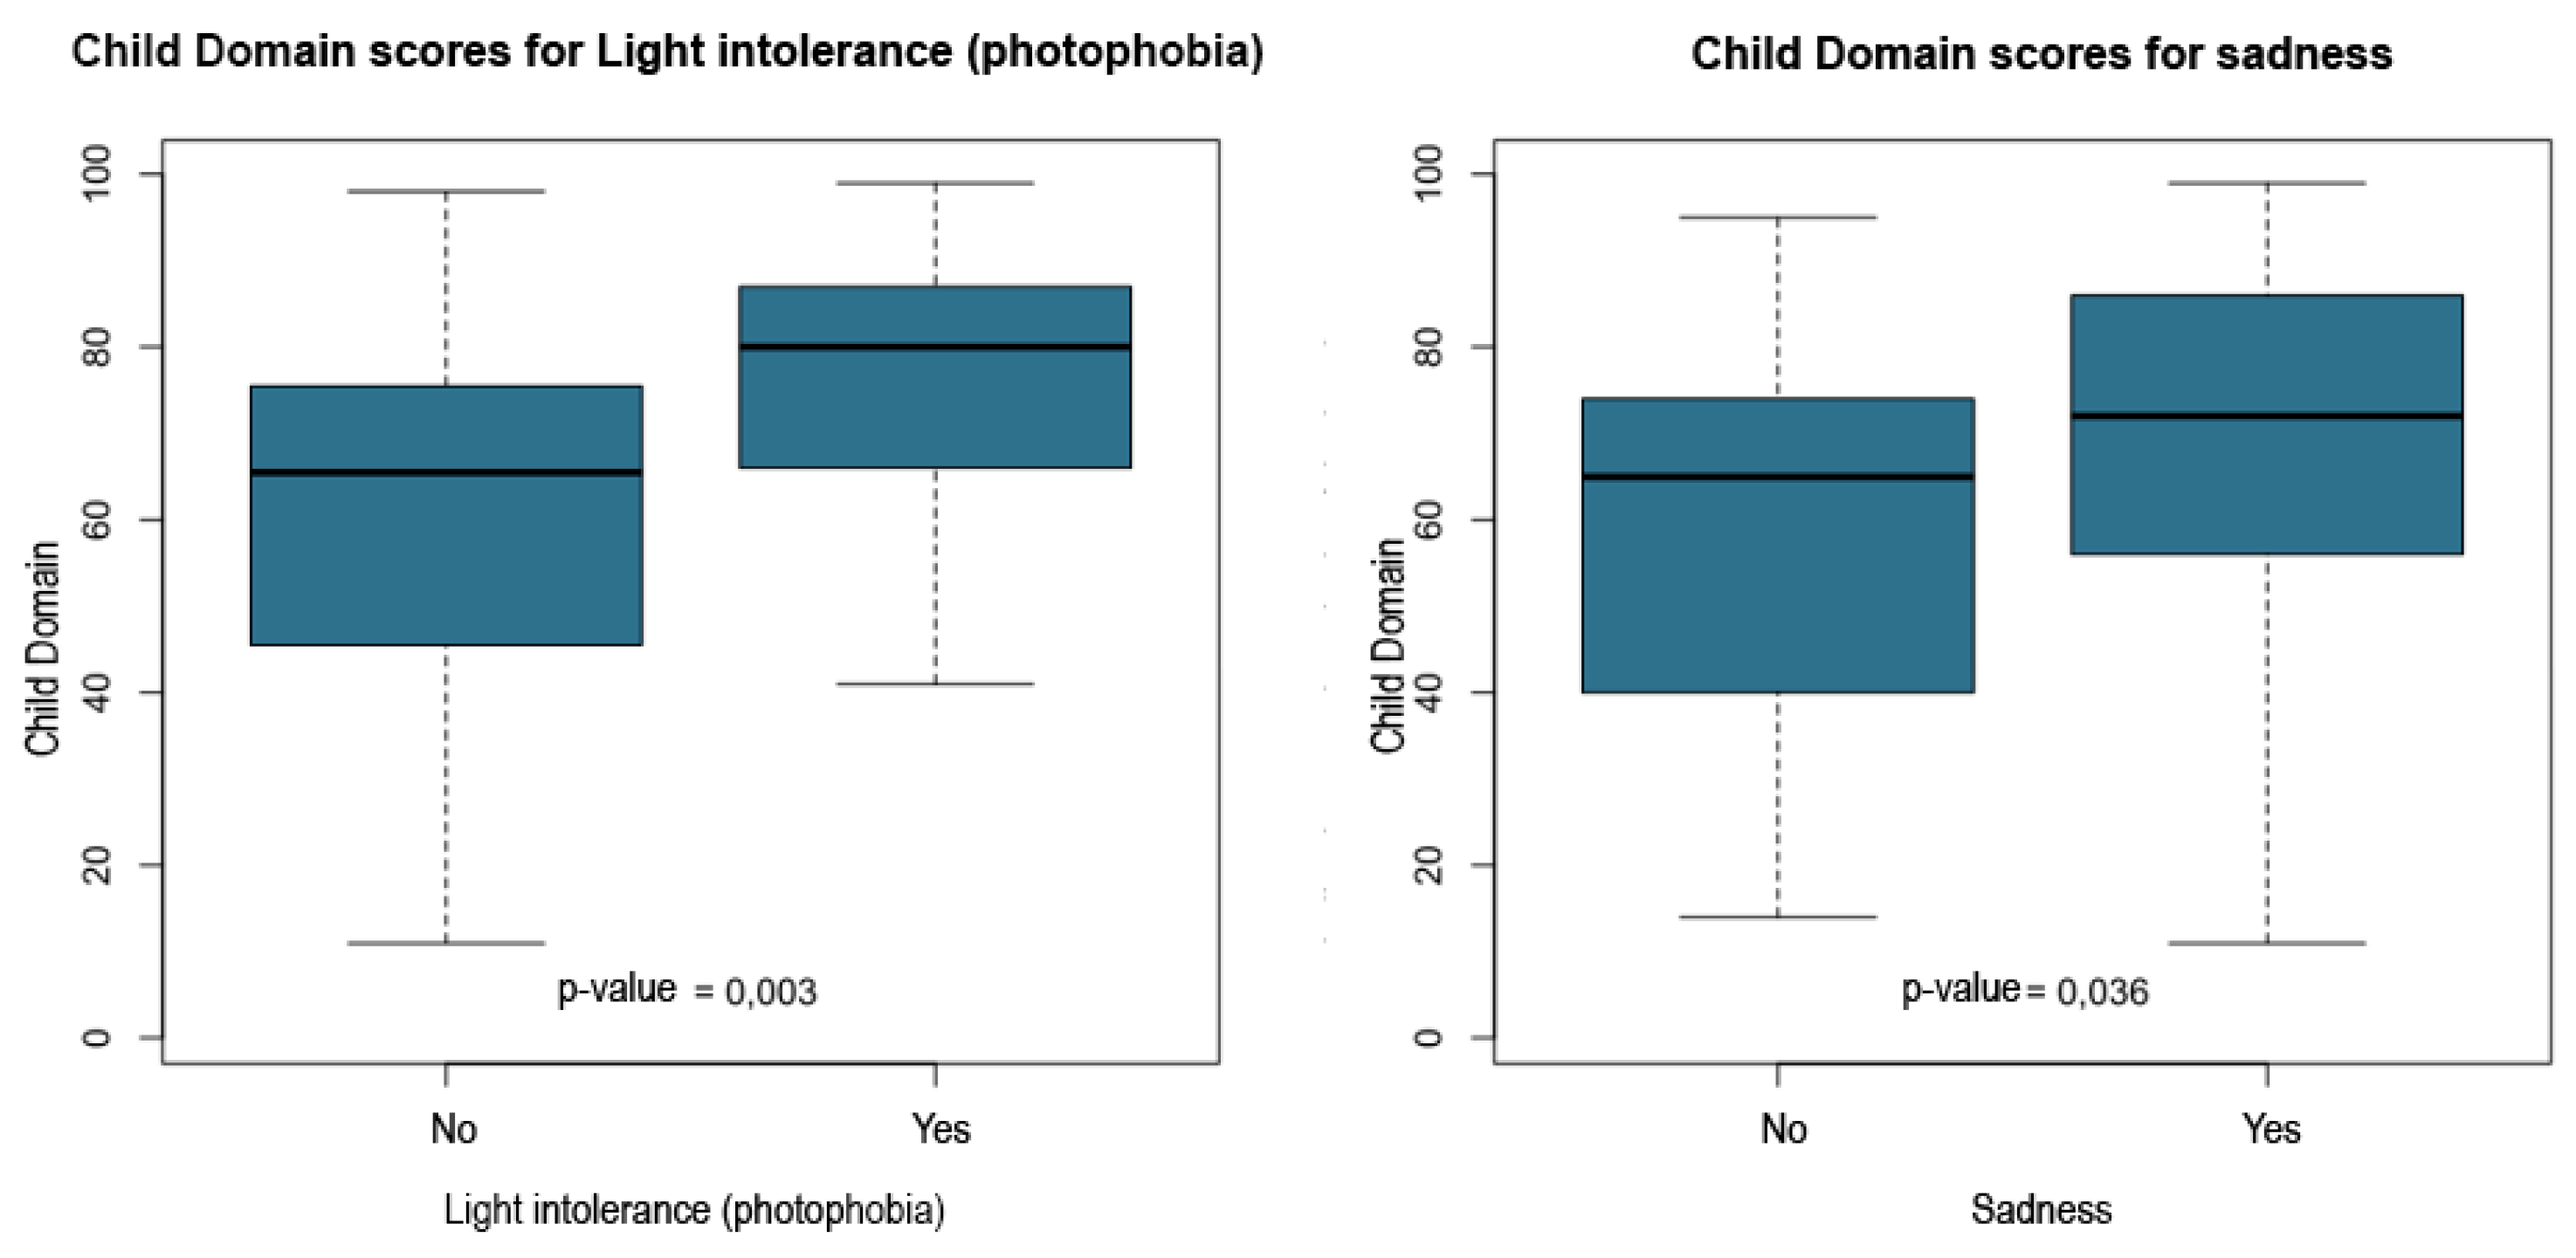
Figure 13.
PSI-4 Child Domain scores by maternal fatigue and body pain (boxplots).
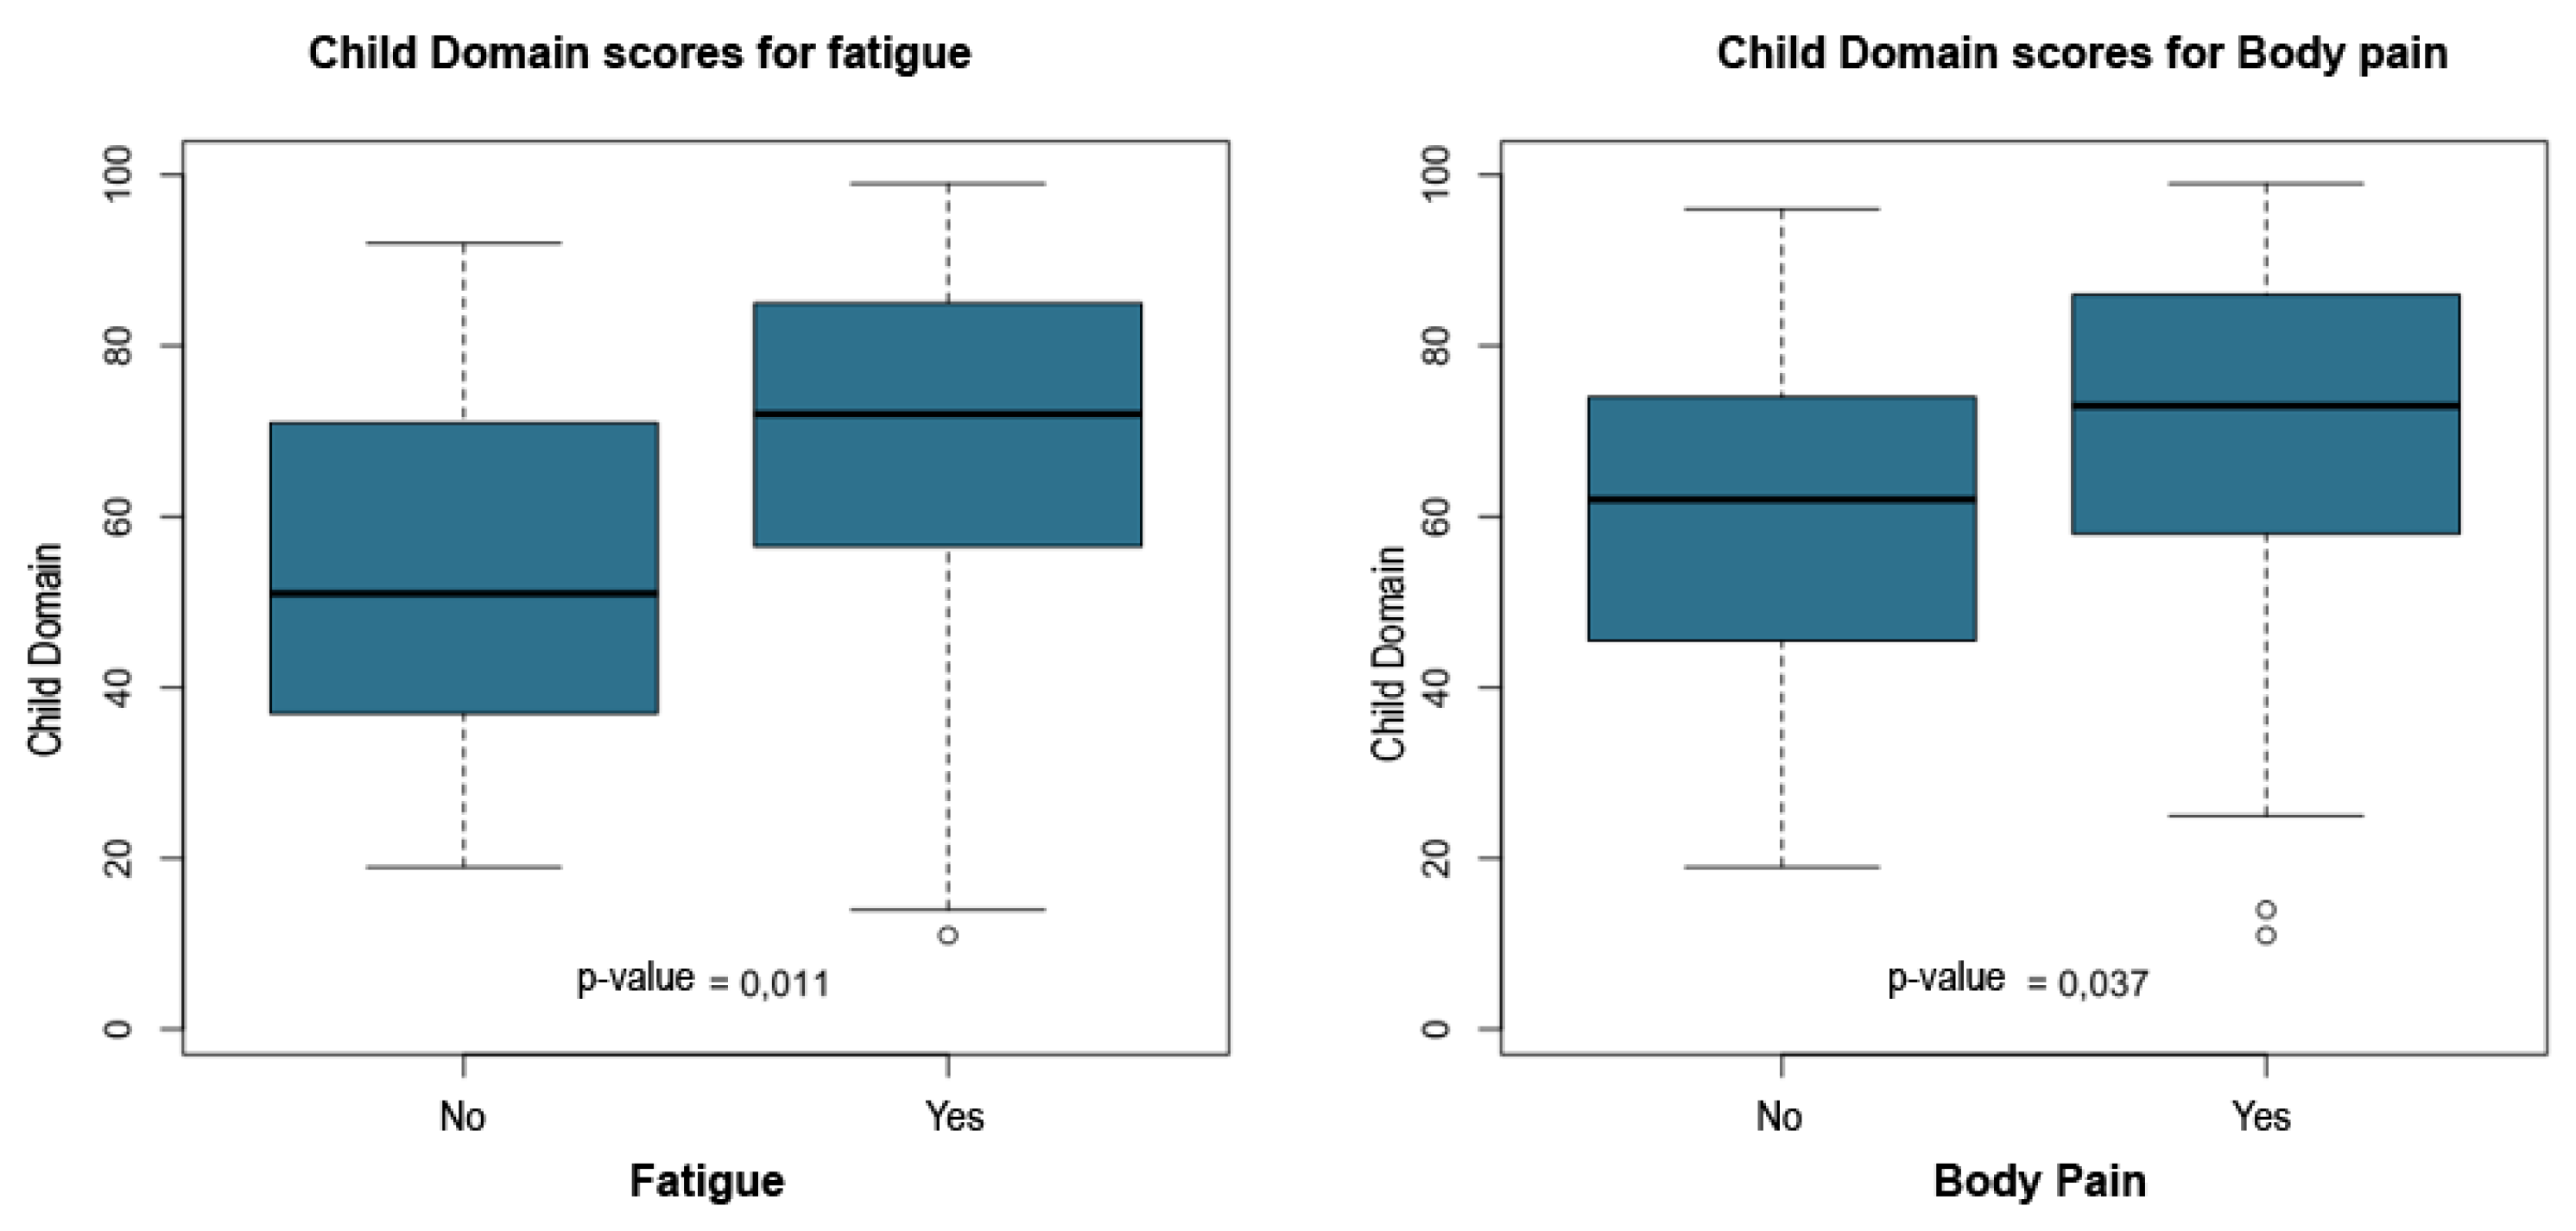
Figure 14.
PSI-4 Child Domain scores by insomnia and difficulty falling asleep (boxplot).
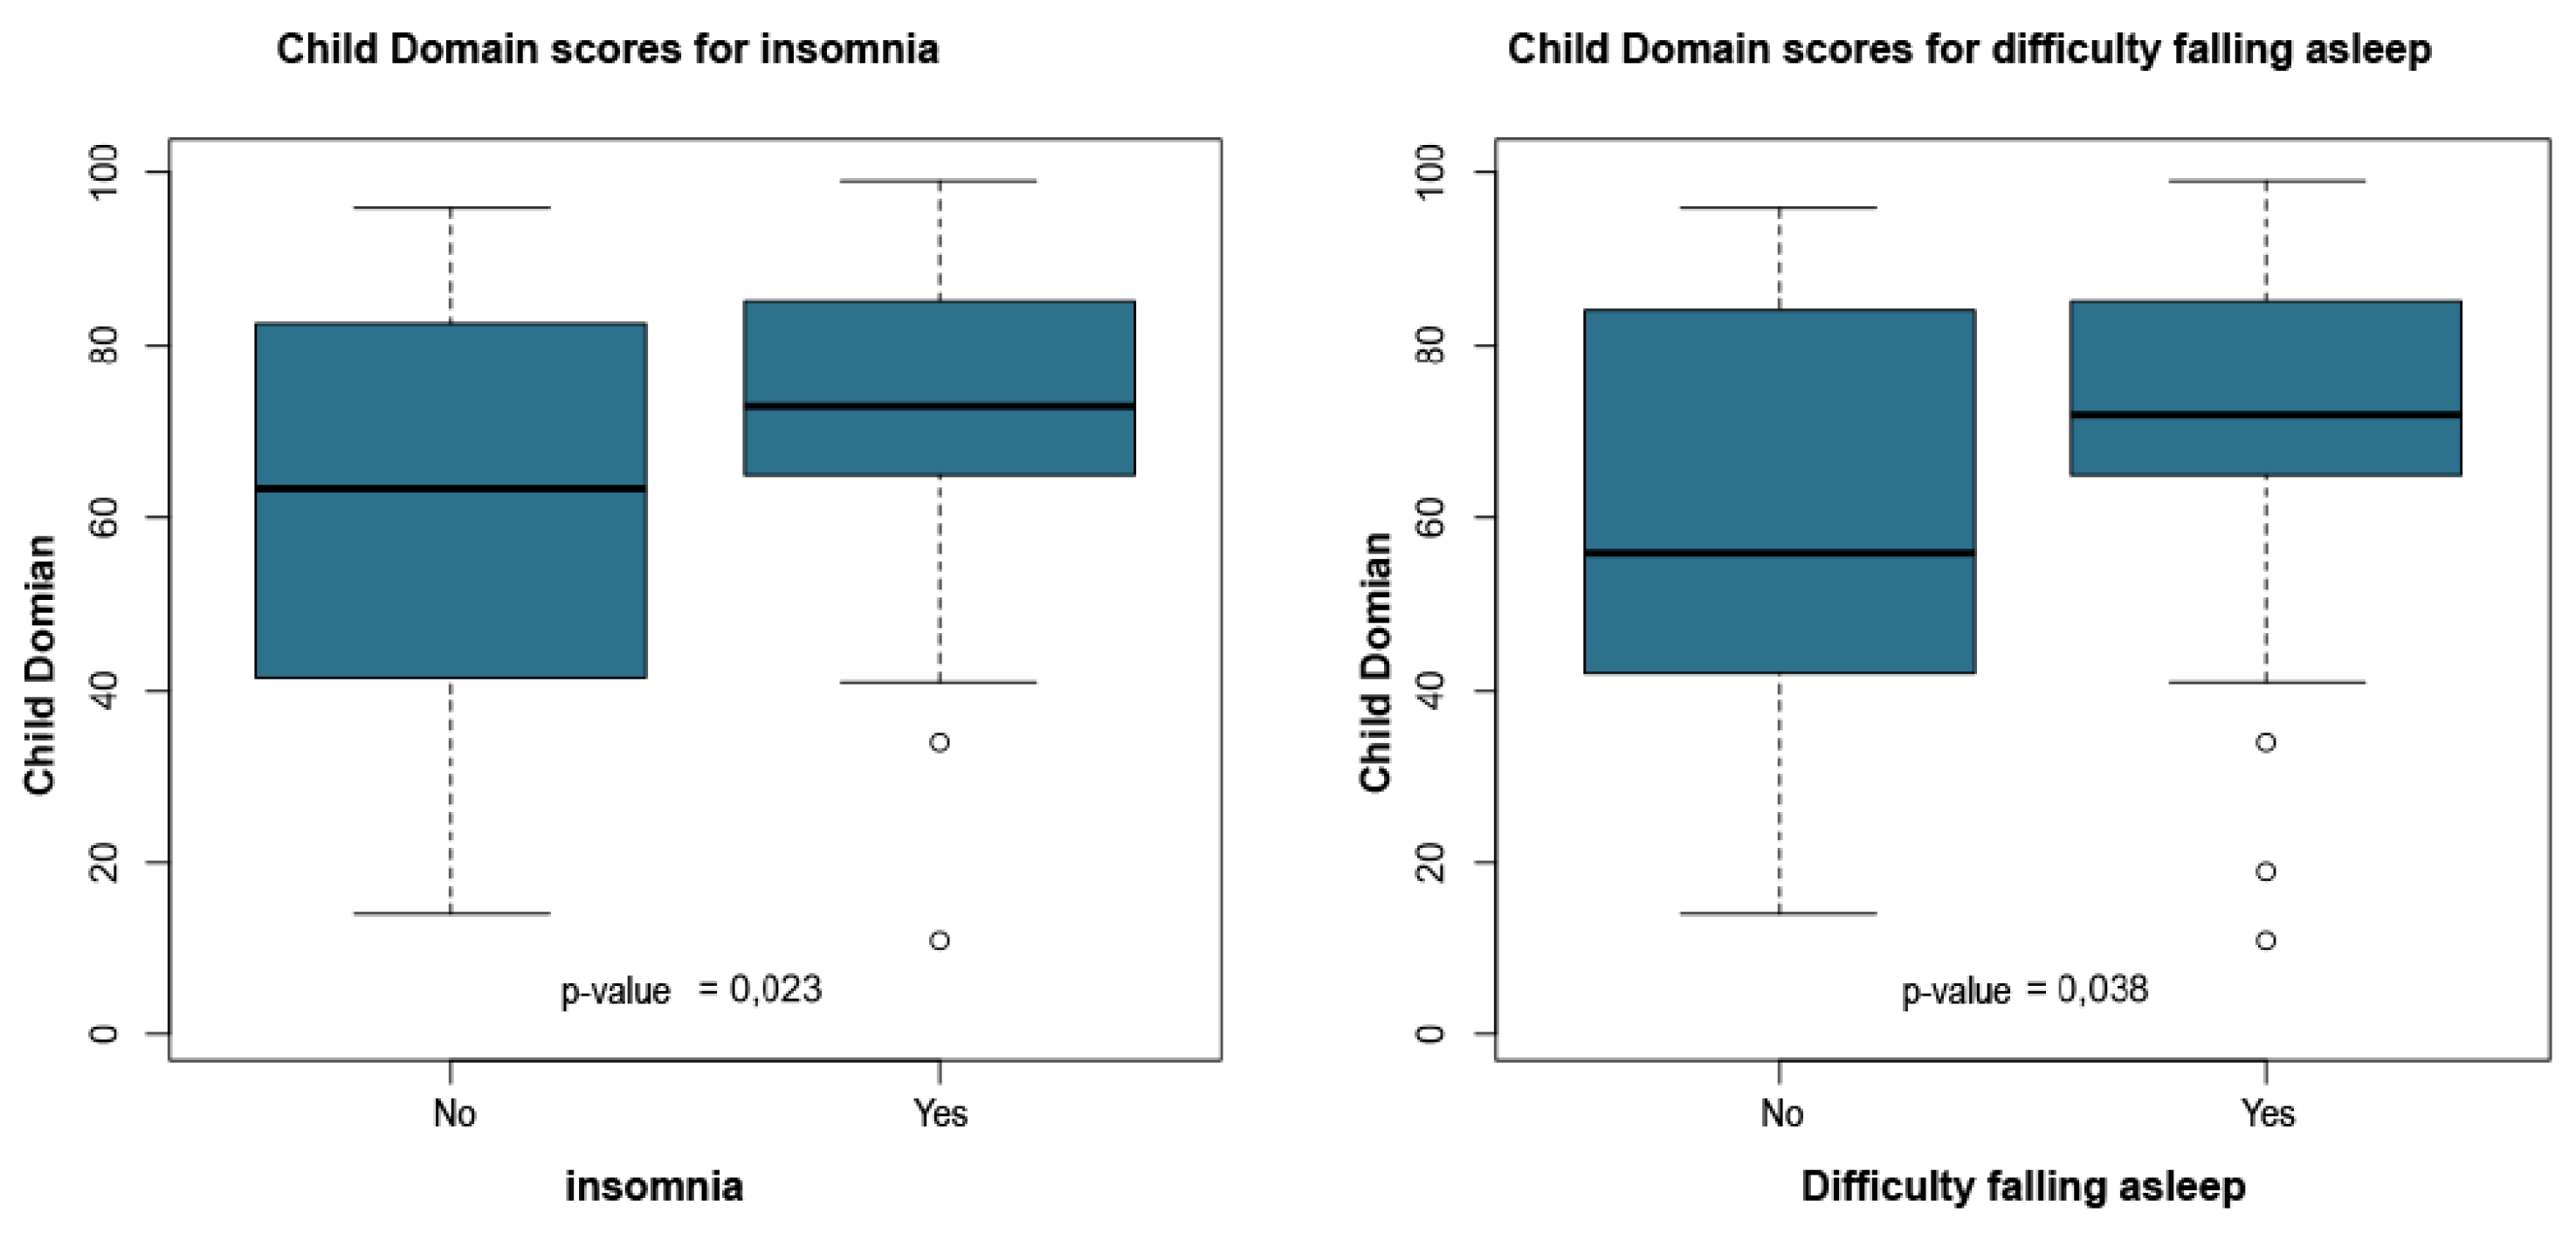
Figure 15.
PSI-4 Child Domain scores by maternal early morning awakening (boxplot).
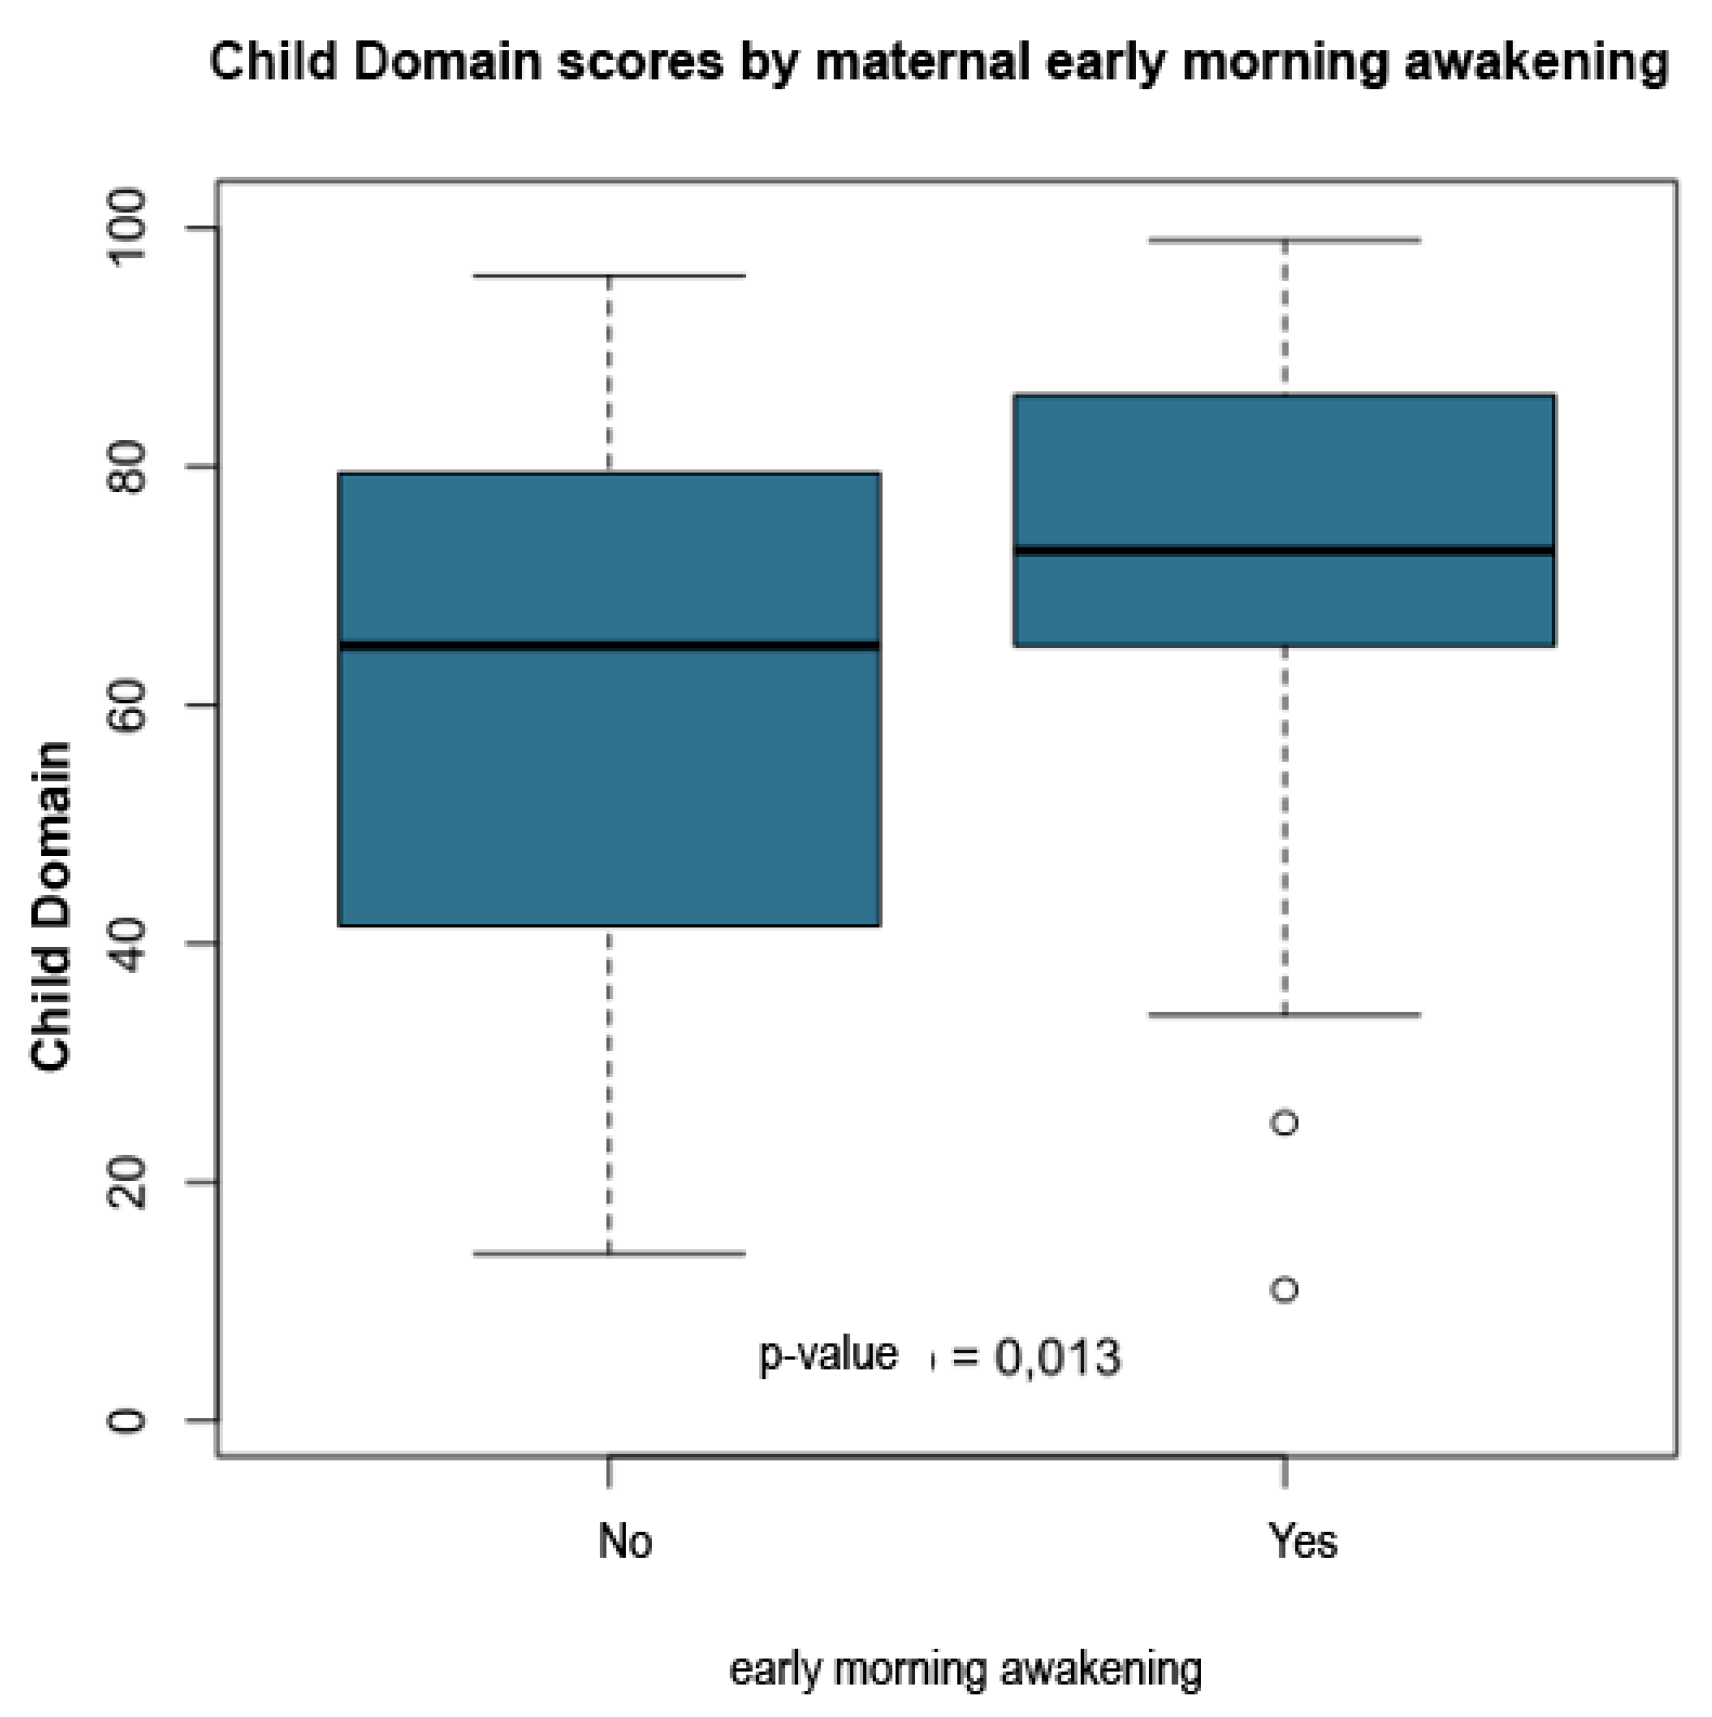
Figure 16.
Radar Chart PSI-4 Parent Domain.
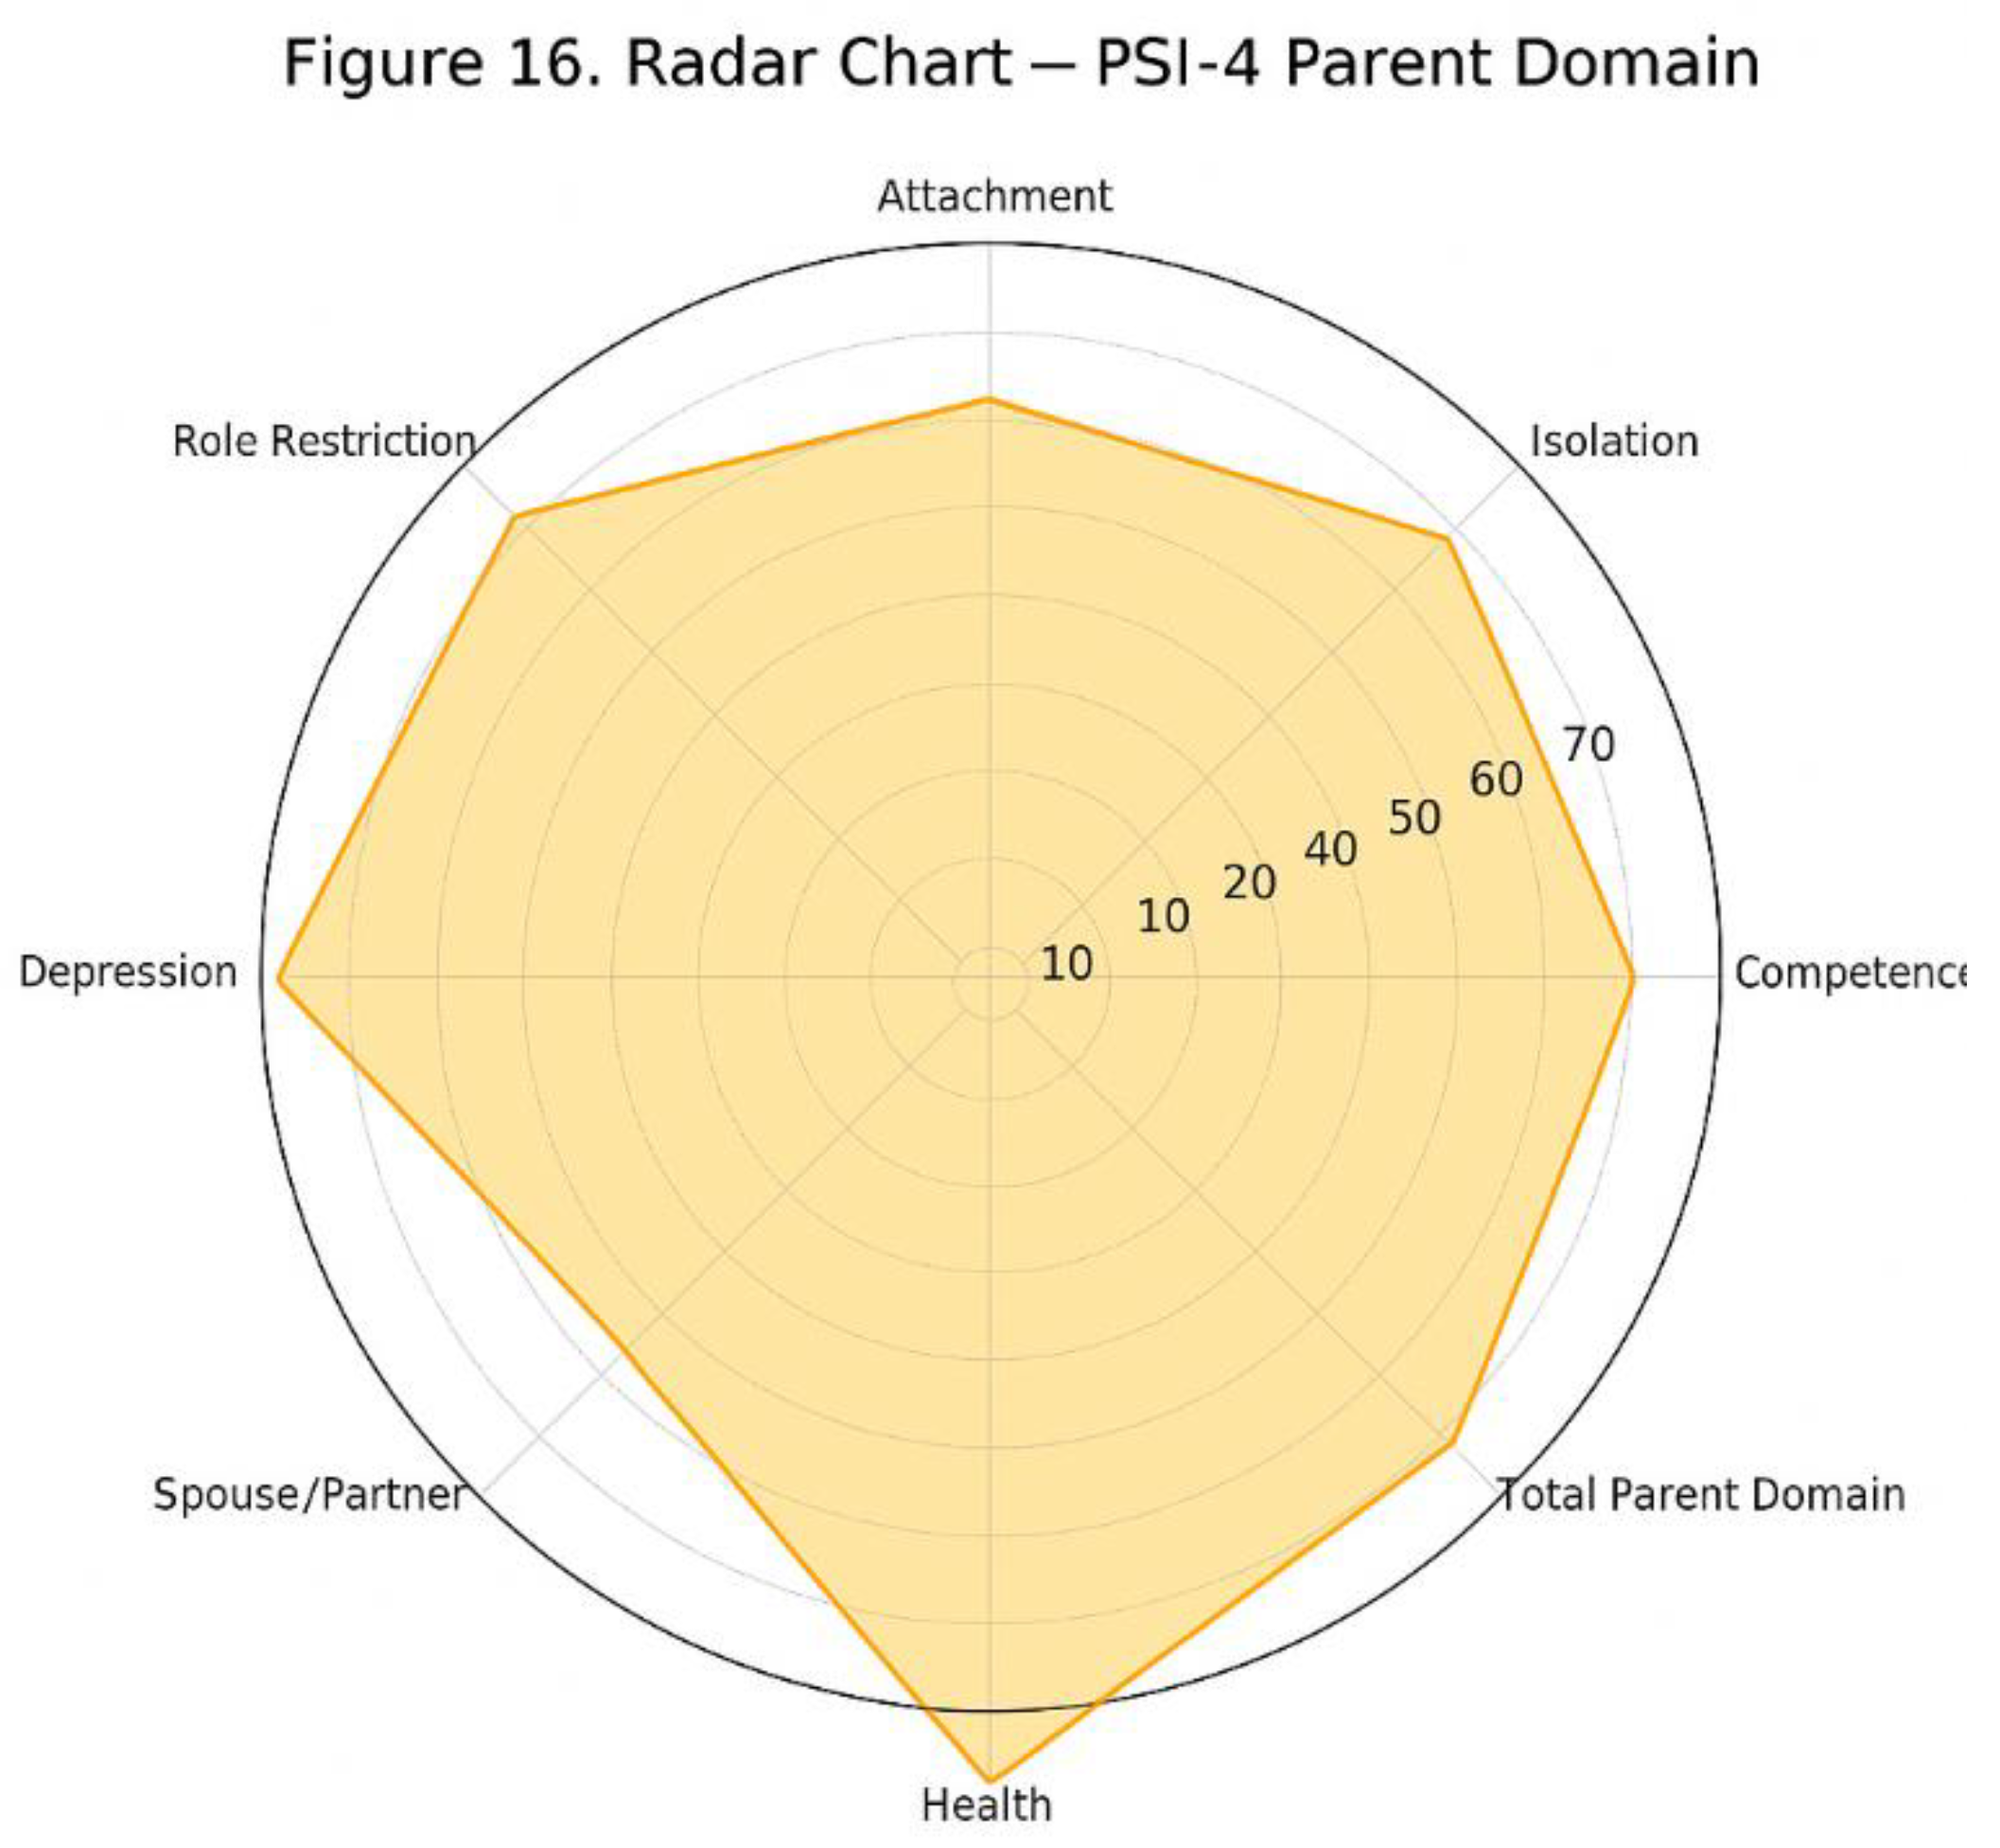
Figure 17.
Radar Chart QFVI-3 (0-3 years).
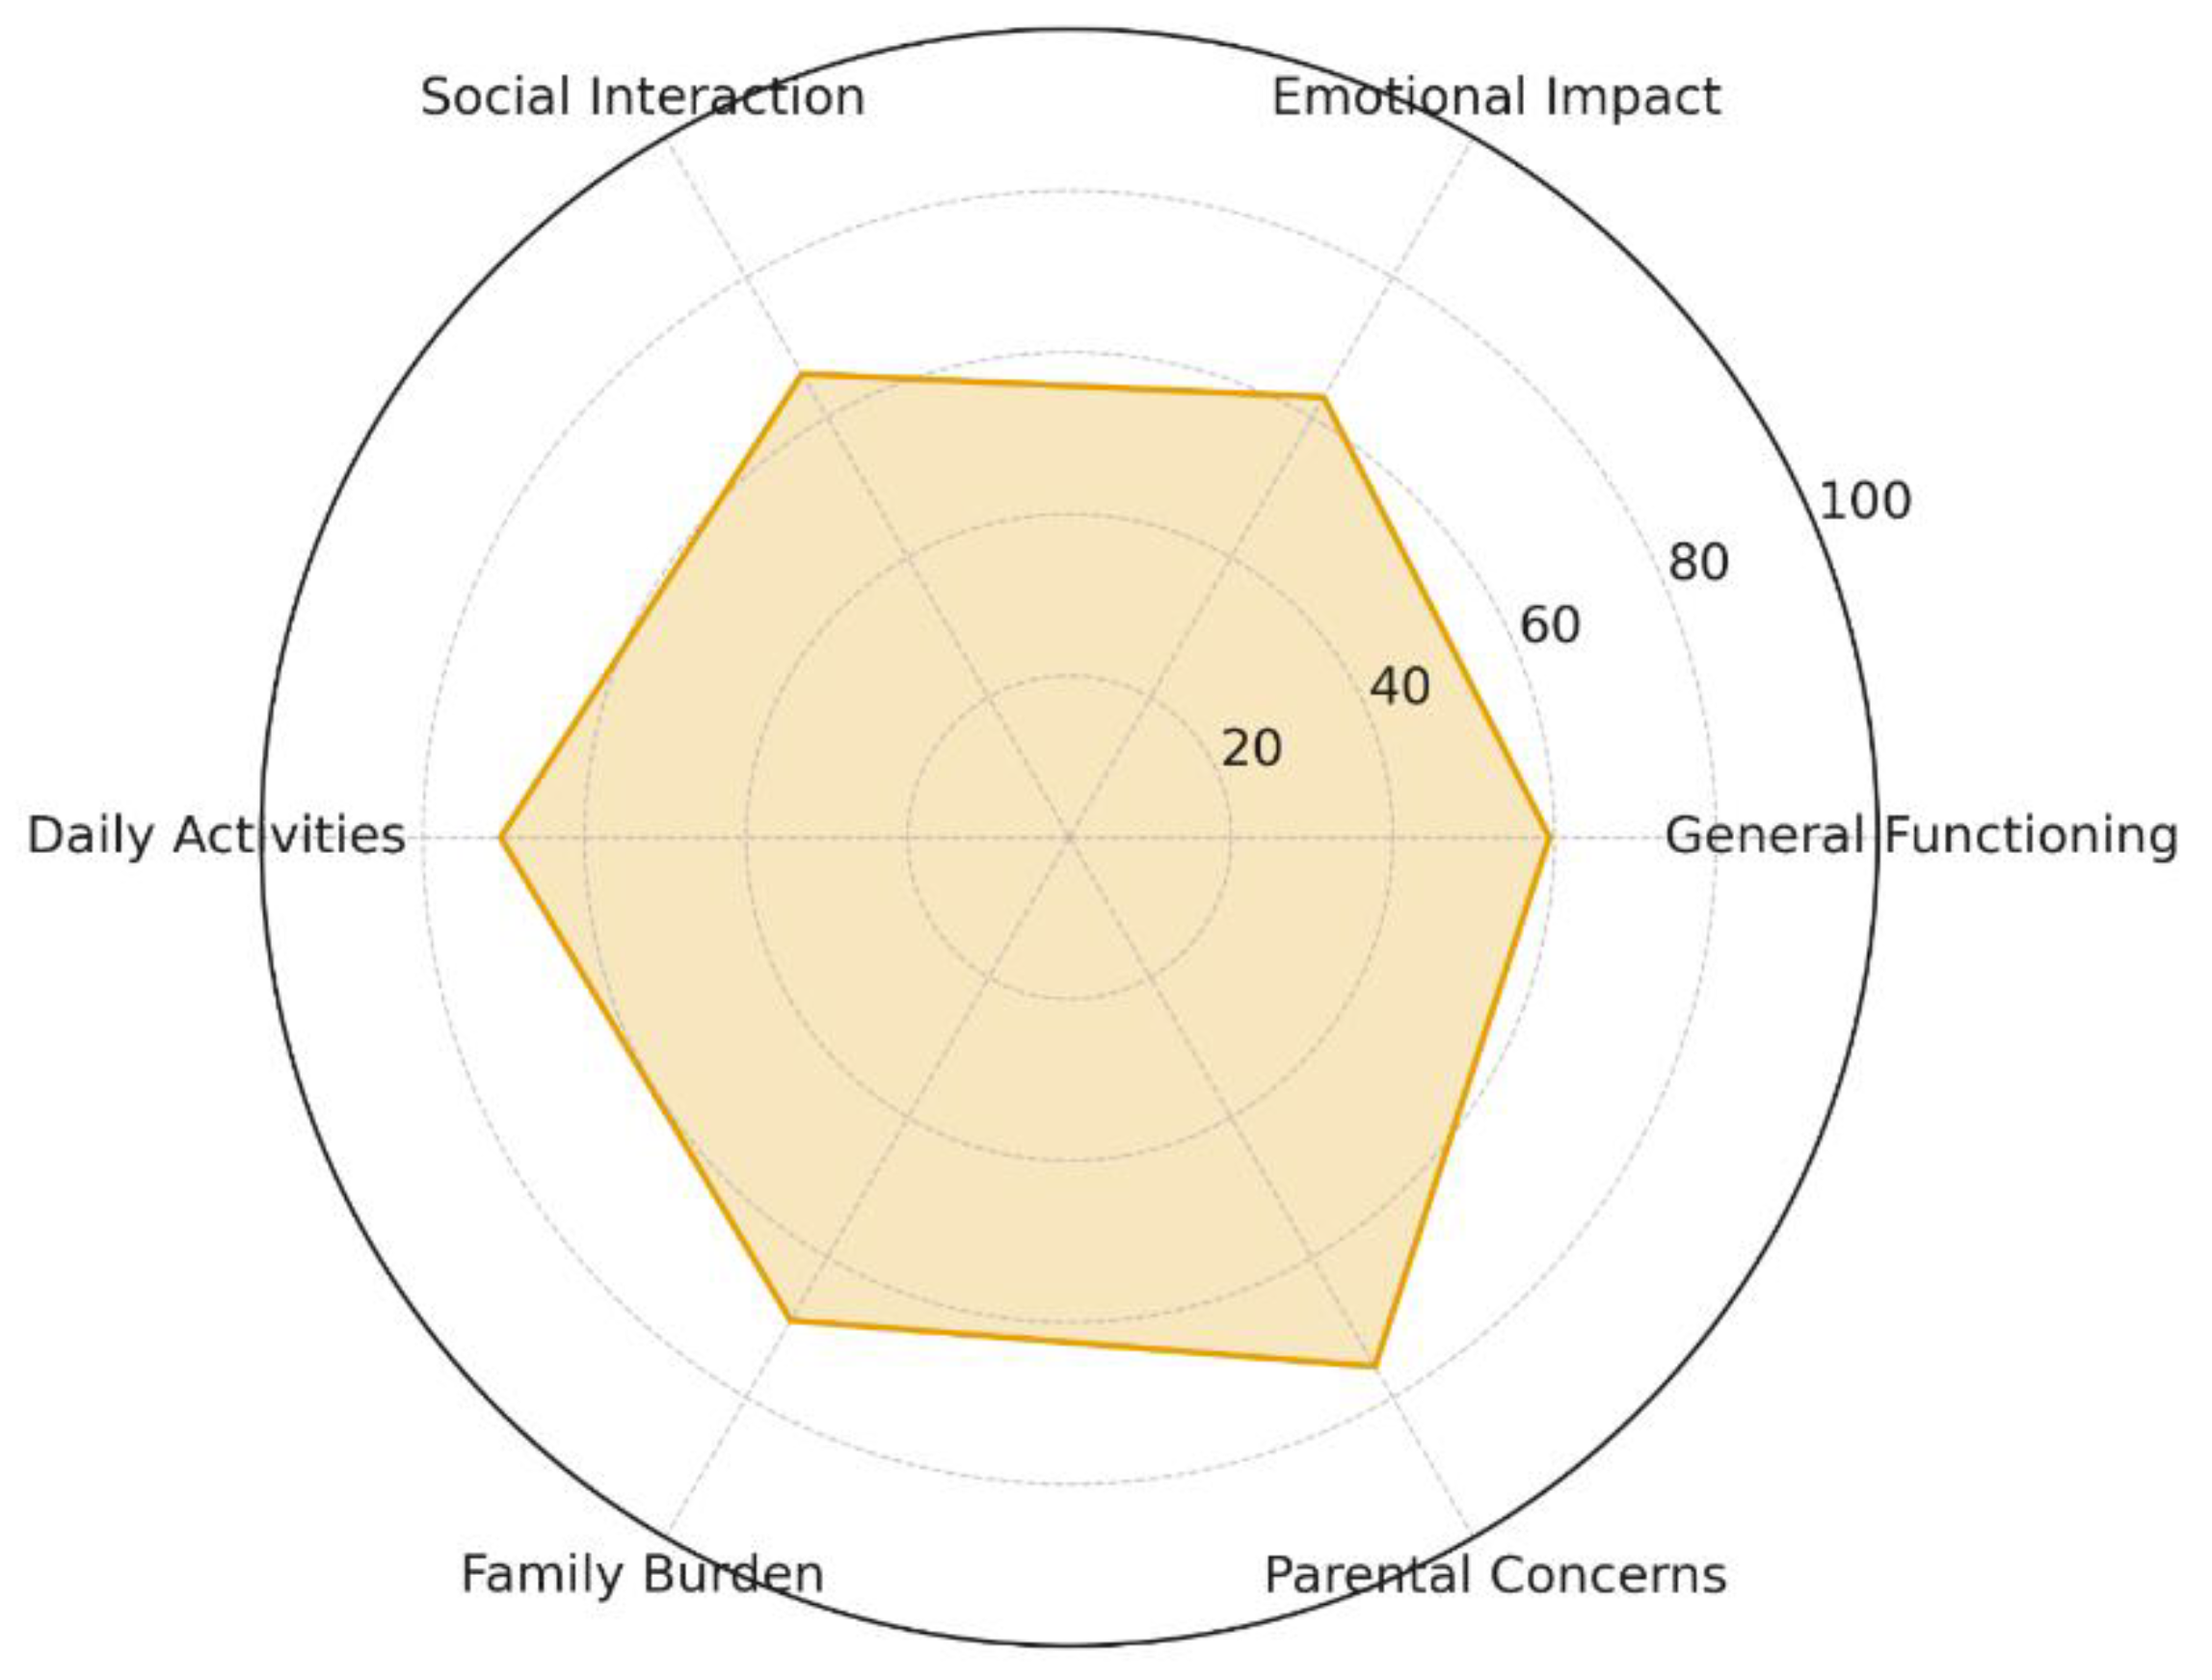
Figure 18.
Radar Chart QFVI-7 (3-7 years).
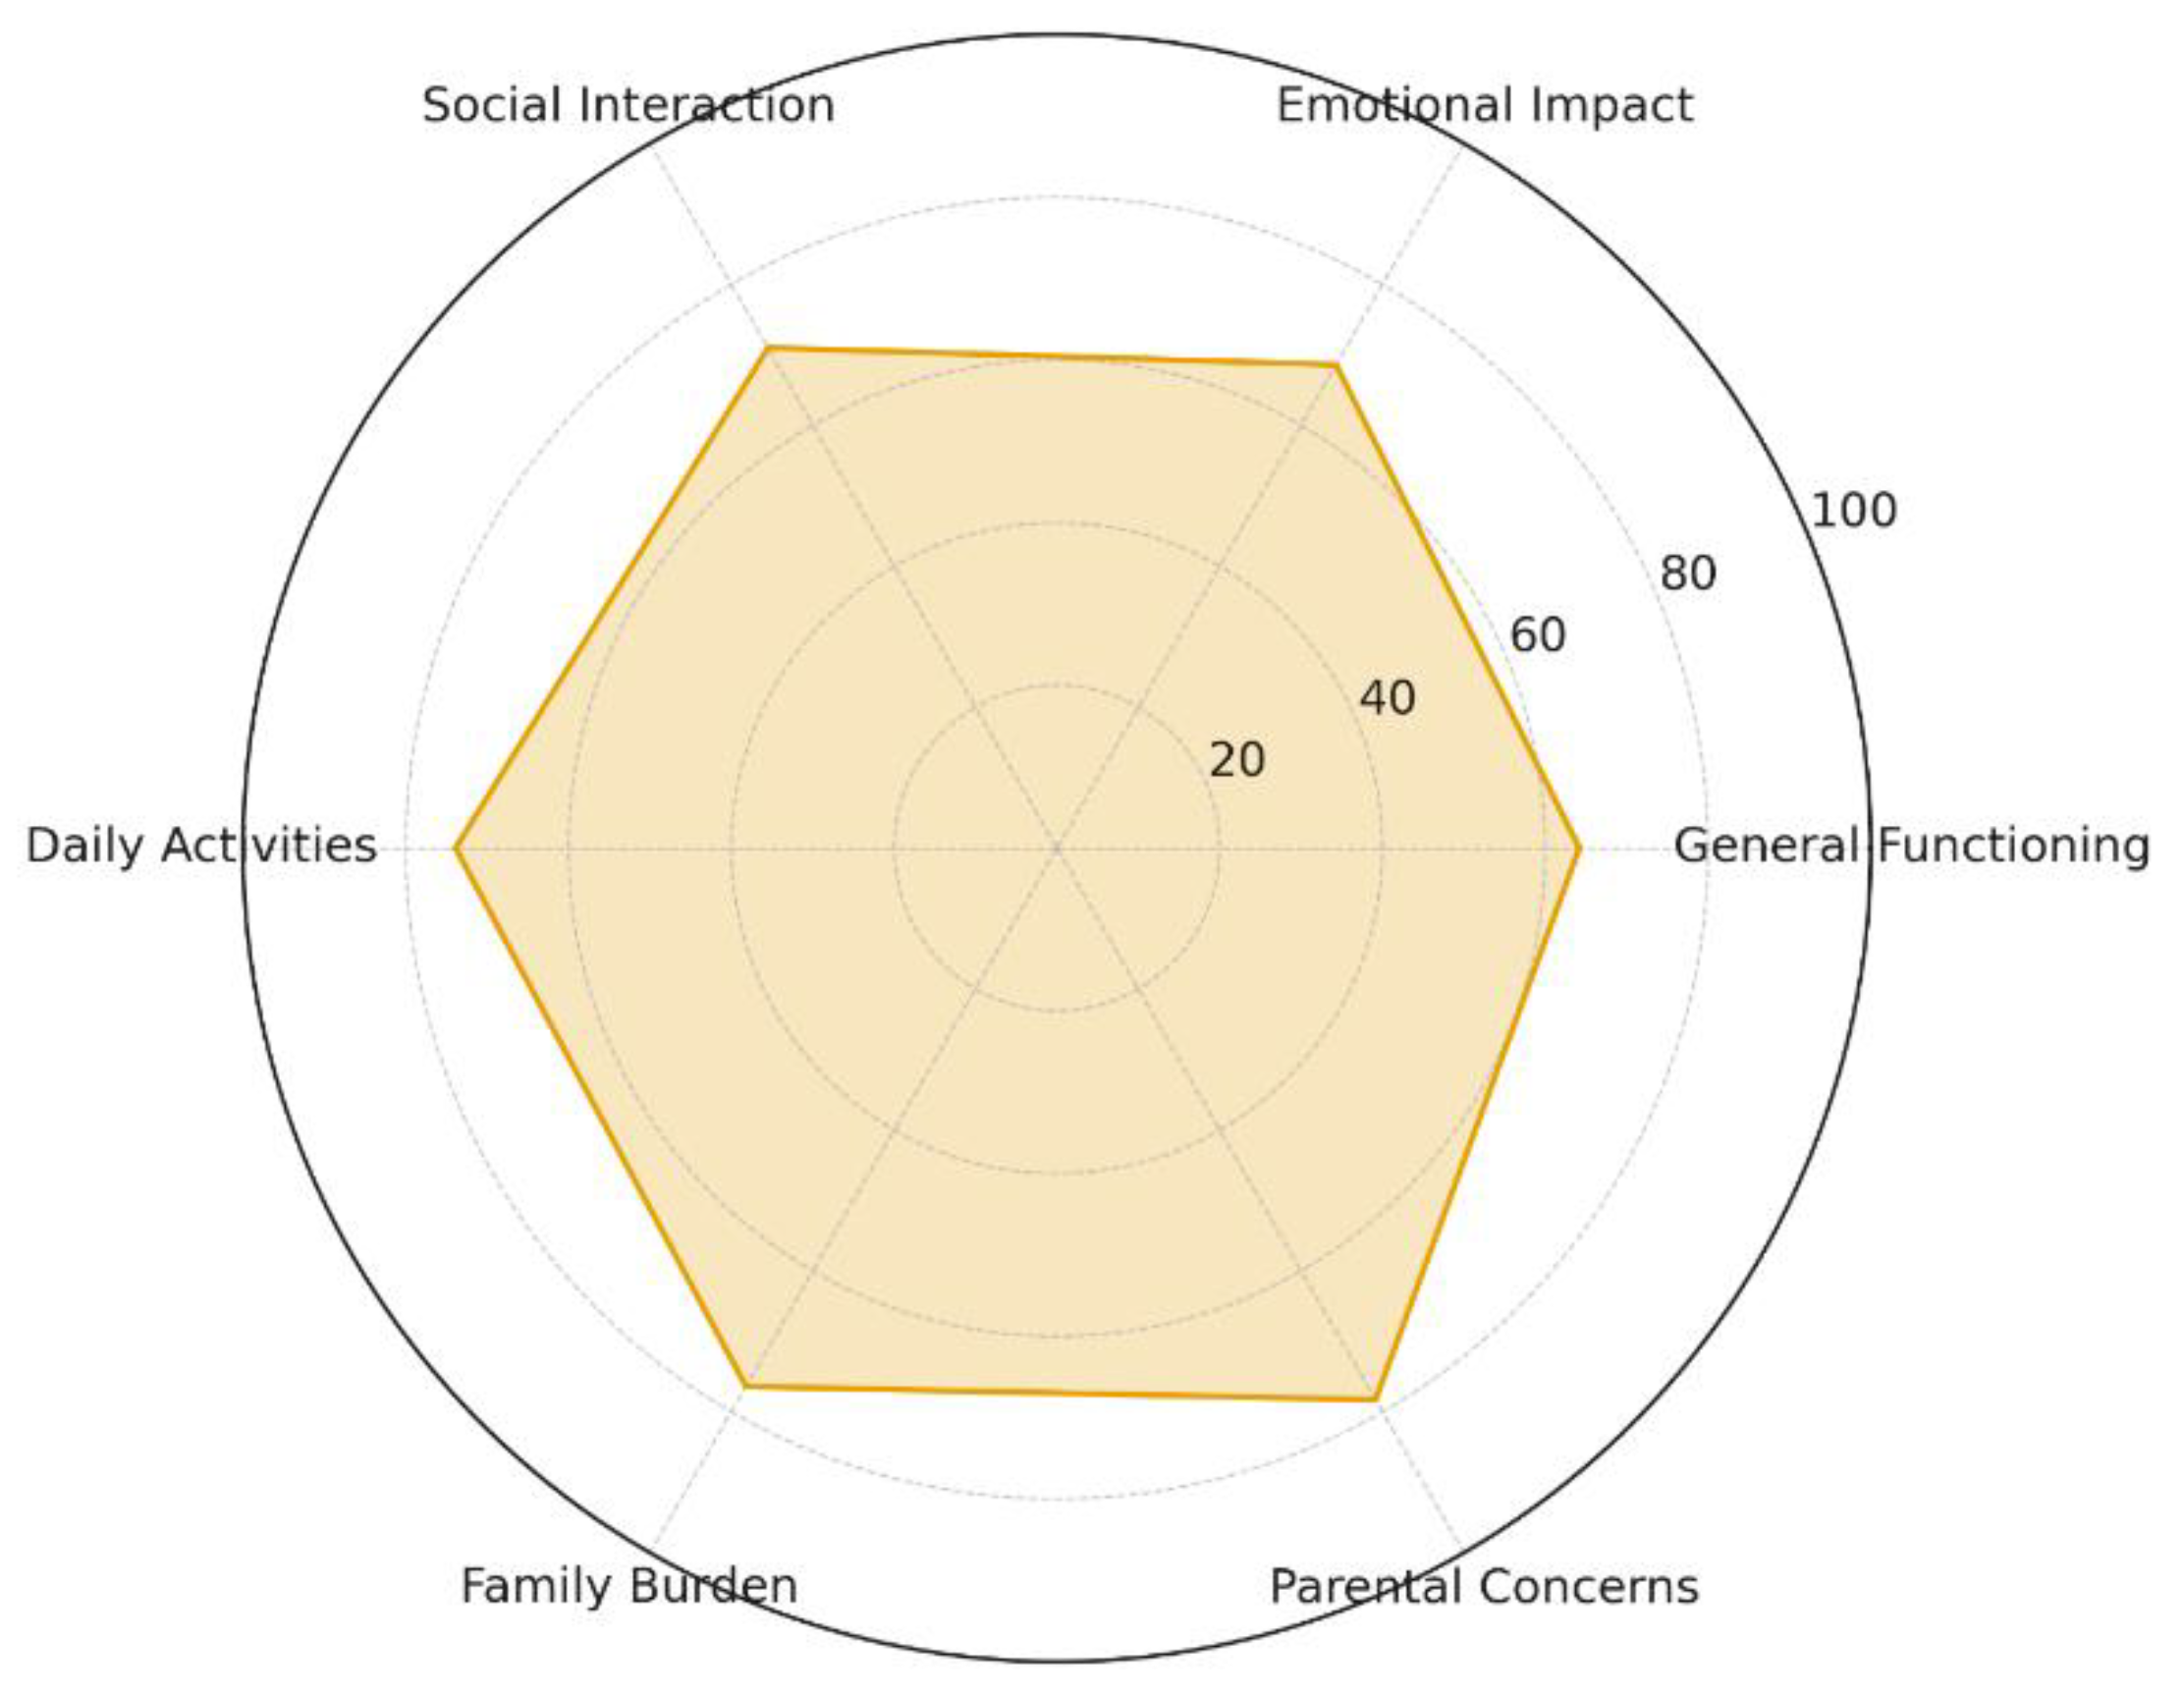
Table 1.
Child Clinical and Sociodemographic Characteristics.
| Variable | Value | Unit / Categories | Notes |
|---|---|---|---|
| Number of participants | 81 | n | |
| Age (mean ± SD) | 6.07 ± 3.60 | years | No median or range available |
| Sex - Male | 52 (64.2%) | n (%) | |
| Sex - Female | 29 (35.8%) | n (%) | |
| School Attendance - Yes | 58 (71.6%) | n (%) | |
| School Attendance - No | 23 (28.4%) | n (%) | |
| School Type - Regular | 50 (61.7%)1 | n (%) | ¹ Percent calculated from N=81; raw = 50/58 = 86.2% |
| School Type - Special | 8 (9.9%) | n (%) | |
| Educational Resource: Assistant | 19 (23.5%)2 | n (%) | ² Multiple responses possible |
| Educational Resource: Computer Tools | 12 (14.8%) | n (%) | |
| Educational Resource: Accessibility Adaptations | 11 (13.6%) | n (%) | |
| Educational Resource: None | 52 (64.2%) | n (%) | |
| Physical Activity - Yes | 26 (32.1%) | n (%) | |
| Physical Activity - No | 55 (67.9%) | n (%) | |
| Leisure Activities - Yes | 36 (44.4%) | n (%) | |
| Leisure Activities - No | 45 (55.6%) | n (%) |
Table 2.
Family and Socioeconomic Characteristics.
| Variable | Category / Value | n (%) | Notes |
|---|---|---|---|
| Socioeconomic Class (ABEP) | B2/C1 | 10 (12.35%) | |
| C2 | 18 (22.22%) | ||
| D | 33 (40.74%) | Majority | |
| E | 3 (3.70%) | ||
| Undeclared | 17 (20.99%) | ||
| Maternal Employment | Does not work outside home | 64 (79.01%) | |
| Works outside home | 17 (20.99%) | ||
| Receives Social Benefits | Yes | 44 (54.32%) | |
| No | 37 (45.68%) | ||
| Health Insurance | No | 57 (70.37%) | |
| Yes | 24 (29.63%) | ||
| Maternal Marital Status | Married | 47 (58.02%) | |
| Stable union | 15 (18.52%) | ||
| Single | 9 (11.11%) | ||
| Divorced | 6 (7.41%) | ||
| Widowed | 4 (4.94%) | ||
| Child Lives with Father | Yes | 59 (72.84%) | |
| No | 21 (25.93%) | ||
| Missing1 | 1 (1.23%) | ¹ One participant did not respond to this item. |
Table 3.
Maternal Characteristics.
| Variable | Category / Value | n (%) / Mean ± SD | Range / Notes |
|---|---|---|---|
| Maternal Age (years) | - | 36.90 ± 7.89 | 25-58 |
| BMI (kg/m²) | - | 26.98 ± 4.76 | 18.73-39.54 |
| Weekly Work Hours | - | 37.00 ± 4.54 | 30-40 hours |
| Hypertension | Yes | 13 (16.05%) | - |
| No | 68 (83.95%) | - | |
| Elevated Blood Glucose | Yes | 8 (9.88%) | - |
| No | 73 (90.12%) | - | |
| Headache | Yes | 51 (62.96%) | No = 30 (37.04%) |
| Dizziness | Yes | 21 (25.93%) | No = 60 (74.07%) |
| Nausea | Yes | 15 (18.52%) | No = 66 (81.48%) |
| Photophobia | Yes | 33 (40.74%) | No = 48 (59.26%) |
| Sadness | Yes | 57 (70.37%) | No = 24 (29.63%) |
| Forgetfulness | Yes | 62 (76.54%) | No = 19 (23.46%) |
| Fatigue | Yes | 67 (82.72%) | No = 14 (17.28%) |
| Insomnia | Yes | 41 (50.62%) | No = 40 (49.38%) |
Table 4.
PSI-4 Child Domain Percentile Scores.
| Subscale | Mean Percentile | SD | 95% CI (Lower) |
95% CI (Upper) |
|---|---|---|---|---|
| Distractibility/Hyperactivity | 68.47 | 23.30 | 63.46 | 73.58 |
| Reinforces Parent | 49.89 | 25.90 | 44.31 | 55.79 |
| Mood | 55.84 | 27.14 | 50.21 | 61.79 |
| Acceptability | 67.80 | 25.06 | 62.09 | 73.01 |
| Adaptability | 71.62 | 22.57 | 66.39 | 76.48 |
| Demandingness | 69.17 | 24.08 | 63.90 | 74.53 |
| Total Child Domain | 66.70 | 21.67 | 61.00 | 72.00 |
Table 5.
Group Comparisons for PSI-4 Child Domain Scores.
| Variable | Direction of Association | p-value |
|---|---|---|
| Lives with father | Higher scores when NOT living with father | 0.039 |
| Maternal headache | Higher scores when present | 0.003 |
| Intolerance to light/noise | Higher scores when present | 0.003 |
| Maternal sadness/distress | Higher scores when present | 0.036 |
| Maternal fatigue | Higher scores when present | 0.011 |
| Maternal body pain | Higher scores when present | 0.037 |
| Maternal insomnia | Higher scores when present | 0.023 |
| Difficulty falling asleep | Higher scores when present | 0.038 |
| Early morning awakenings | Higher scores when present | 0.013 |
Table 7.
Group Comparisons for PSI-4 Parent Domain Scores.
| Variable | Direction of Association | p-value |
|---|---|---|
| Lives with father | Higher PD scores when NOT living with father | 0.015 |
| Maternal intolerance to light/noise | Higher PD scores when present | <0.001 |
| Maternal sadness | Higher PD scores when present | <0.001 |
| Maternal fatigue | Higher PD scores when present | 0.027 |
| Maternal body pain | Higher PD scores when present | 0.001 |
| Maternal insomnia | Higher PD scores when present | 0.001 |
| Difficulty falling asleep | Higher PD scores when present | 0.001 |
| Early morning awakenings | Higher PD scores when present | 0.040 |
| Income class (ABEP) | No significant difference | >0.05 |
| Parental education | No significant difference | >0.05 |
Table 8.
QFVI 3 Descriptive Scores.
| Domain | Mean Score |
|---|---|
| General Functioning | 59.4 |
| Emotional Impact | 62.9 |
| Social Interaction | 66.2 |
| Daily Activities | 70.4 |
| Family Burden | 69.0 |
| Parental Concerns | 75.6 |
Table 9.
QFVI 7 Descriptive Scores.
| Domain | Mean Score |
|---|---|
| General Functioning | 64.2 |
| Emotional Impact | 68.6 |
| Social Interaction | 71.0 |
| Daily Activities | 73.9 |
| Family Burden | 76.4 |
| Parental Concerns | 78.3 |
Table 12.
Exploratory Predictors of Parental Stress.
| Predictor Variable | Univariate Association (p-value) | Multivariable β | Multivariable p-value |
|---|---|---|---|
| Maternal depressive symptoms | <0.001 | +0.41 | <0.01 |
| Socioeconomic class | <0.01 | -0.25 | 0.03 |
| Lives with father of child | <0.05 | +0.22 | 0.04 |
| QFVI total score | <0.05 | -0.20 | 0.04 |
| Child age | >0.05 | n.s. | - |
| Maternal age | >0.05 | n.s. | - |
| Physical activity | <0.05 (univariate) | n.s. | - |
n.s. = non-significant.
Disclaimer/Publisher’s Note: The statements, opinions and data contained in all publications are solely those of the individual author(s) and contributor(s) and not of MDPI and/or the editor(s). MDPI and/or the editor(s) disclaim responsibility for any injury to people or property resulting from any ideas, methods, instructions or products referred to in the content. |
© 2025 by the authors. Licensee MDPI, Basel, Switzerland. This article is an open access article distributed under the terms and conditions of the Creative Commons Attribution (CC BY) license (http://creativecommons.org/licenses/by/4.0/).
Copyright: This open access article is published under a Creative Commons CC BY 4.0 license, which permit the free download, distribution, and reuse, provided that the author and preprint are cited in any reuse.


