Submitted:
02 December 2025
Posted:
05 December 2025
You are already at the latest version
Abstract
Reaction time (RT) is a key indicator of cognitive and motor processing speed, and its age-related decline has important implications for everyday activities such as driving. However, conventional Psychomotor Vigilance Tests (PVTs) assess hand responses and do not capture lower-limb reaction characteristics relevant to pedal operations. This study used a foot-response version of the PVT (Foot PVT) to compare RTs between younger and older adults and to examine the influence of height, sleep factors, and physical activity level (PAL). Twenty younger adults (24 ± 3 years) and twenty-four older adults (73 ± 5 years) performed a 10-minute Foot PVT between 11:00 and 14:00. Participants responded to visual stimuli by moving the right foot laterally from a central pedal to the left or right pedals. RT mean, RT median, RT SD, skewness, and kurtosis were calculated, and correlation and multiple regression analyses were conducted using height, five OSA Sleep Inventory factors, and PAL as predictors. RT mean was significantly slower in older adults (818 ± 105 ms) than in younger adults (700 ± 73 ms), indicating an age-related delay of approximately 120 ms. Older adults showed lower skewness and kurtosis, suggesting more homogeneous responses and a cautious response strategy. In younger adults, height correlated negatively with RT (r = −0.593), and multiple regression identified height as the only significant predictor (adjusted R² = 0.316). No significant predictors were found in older adults. In the combined sample, height and age jointly explained 37.2% of RT variance. These findings indicate that Foot PVT performance reflects both biomechanical characteristics and age-related declines in reaction speed. Height strongly influences RT in younger adults, whereas RT in older adults appears to be shaped by multifactorial age-related changes. The Foot PVT provides a practical tool for assessing lower-limb reaction capabilities relevant to driving and aging.
Keywords:
Foot PVT
; pedal operation
; reaction time
; ageing
1. Introduction
Reaction time (RT) is a fundamental cognitive index that reflects the speed of a series of neural processing steps—from perceiving an external sensory stimulus to evaluating and processing it, and finally generating a motor response. A widely used method for quantitatively assessing RT is the Psychomotor Vigilance Test (PVT), which has been applied for decades [1,2]. The PVT measures a button-press response to a simple visual stimulus and is highly sensitive to fluctuations in arousal level and attentional function. RT obtained from the PVT provides a direct indication of central nervous system information-processing speed and is influenced by physiological and psychological factors such as sleep deprivation, fatigue, aging, and individual differences [3,4,5]. Therefore, quantitative assessment of RT is essential for understanding human cognitive and motor-control abilities. The PVT has been broadly applied across diverse fields, including clinical research, ergonomics, and traffic psychology [6,7]. Recent studies have optimized PVT duration and measurement precision, validated shortened protocols [8,9], and explored its applications in occupational settings such as night-shift work [10,11]. Additionally, smartphone-based PVT applications have been developed to predict sleep insufficiency and declines in alertness [12,13].
RT is particularly critical in tasks such as automobile driving, in which rapid and accurate responses to visual stimuli are required. Even slight delays may contribute directly to traffic accidents, making RT-based assessment of attention and alertness an important topic in traffic safety research [14,15,16]. At the same time, many countries—including Japan—are experiencing rapid population aging. As of 2024, individuals aged 65 years or older account for 29.3% of Japan’s population, the highest proportion worldwide, and this value is projected to reach 34.8% by 2040 [17]. Furthermore, as of October 2019, older adults accounted for nearly one-third of all licensed drivers in Japan [18]. Traffic accidents involving older drivers remain a major societal concern, partly due to age-related declines in cognitive and motor functions. According to the Tokyo Metropolitan Police Department, human factors such as delayed detection contribute to nearly 80% of traffic accidents in which an older driver is the primary party, with many cases involving delayed responses to signal changes or pedal misapplication errors, such as pressing the accelerator instead of the brake [19]. These incidents likely reflect age-related reductions in information-processing speed and response-control ability. Thus, simple and objective methods for evaluating individual reaction capabilities are needed to prevent such accidents.
Conventional PVTs are designed for hand responses and therefore cannot directly assess the foot responses required during driving. To address this limitation, we developed a novel foot-response version of the PVT (Foot PVT) [20]. The Foot PVT uses a three-color visual stimulus (red, yellow, blue) arranged to resemble a traffic signal, and participants respond by pressing one of three pedals. The system requires only a low-cost commercial foot pedal and a laptop computer. Participants rest their foot on the center pedal during the waiting period and press the left or right pedal depending on the stimulus color, enabling automated measurement of RT. Our previous study [20] demonstrated that older adults exhibited significantly slower RTs than younger adults and showed fewer false starts, suggesting that older adults may adopt a more cautious response strategy, prioritizing accuracy over speed. Moreover, the Foot PVT captures multiple behavioral indicators—including false starts, miss responses, and correction time—allowing a more comprehensive assessment of attentional stability and response accuracy than the conventional PVT. Therefore, this system has potential applications as a cognitive and behavioral evaluation tool for assessing driving ability and supporting older drivers.
RT measured by the Foot PVT may be influenced by factors beyond age. For example, sleep quality and alertness directly affect attention and response speed [11,21]. Regular physical activity level (PAL) helps maintain muscle strength and nerve conduction velocity and may contribute to more efficient motor responses [22]. Furthermore, physical characteristics such as height may influence RT through differences in neural conduction distance or biomechanical movement patterns [23]. However, few studies have simultaneously examined such physiological and lifestyle factors, and research using foot-response tasks in older adults remains limited.
Therefore, the present study aimed to compare RT characteristics between younger and older adults using the Foot PVT and to analyze multiple factors associated with RT. Specifically, we examined sleep-related variables (five subscales of the OSA Sleep Inventory MA version) [24,25], PAL [26], and height as explanatory variables, and investigated their associations with RT. Additionally, we analyzed the shape of the RT distribution (standard deviation, skewness, kurtosis) to explore individual differences in response stability and attentional characteristics.
2. Materials and Methods
2.1. Foot PVT and Task
RT was measured using the Foot PVT application developed by the authors. Detailed specifications of this system are provided in our previous report [20]. On the home screen, participants entered the output file name and test duration. After pressing the Enter key, three white-outlined circles were displayed in the center of a black background. When the test began, one of the circles was randomly filled with color. The three circles were arranged from left to right as blue, yellow, and red (Figure 1).
The foot pedal device (USB Foot Switch, S23-P, Shenzhen Winsun Technology Co., Ltd., Shenzhen, Guangdong, China) consisted of three pedals (Figure 1). Before each trial, participants kept their right foot on the center pedal. When a blue stimulus appeared, they pressed the right pedal; when a red or yellow stimulus appeared, they pressed the left pedal (Figure 1). If the correct pedal was pressed, the screen displayed the RT along with the word “True,” after which the display returned to black for the next trial. If an incorrect pedal was pressed, the message “The opposite one more time” appeared, and the screen did not advance until the correct pedal was pressed. In the case of a false start, the message “False start” was displayed, and the participant returned their foot to the center pedal to wait for the next stimulus. RT was defined as the time from stimulus onset to the pedal press. The inter-stimulus interval varied randomly between 2 and 10 seconds.
Figure 1.
Test screens used in the Foot PVT (upper panels) and the foot pedal device used in the experiment (lower panel).
Figure 1.
Test screens used in the Foot PVT (upper panels) and the foot pedal device used in the experiment (lower panel).
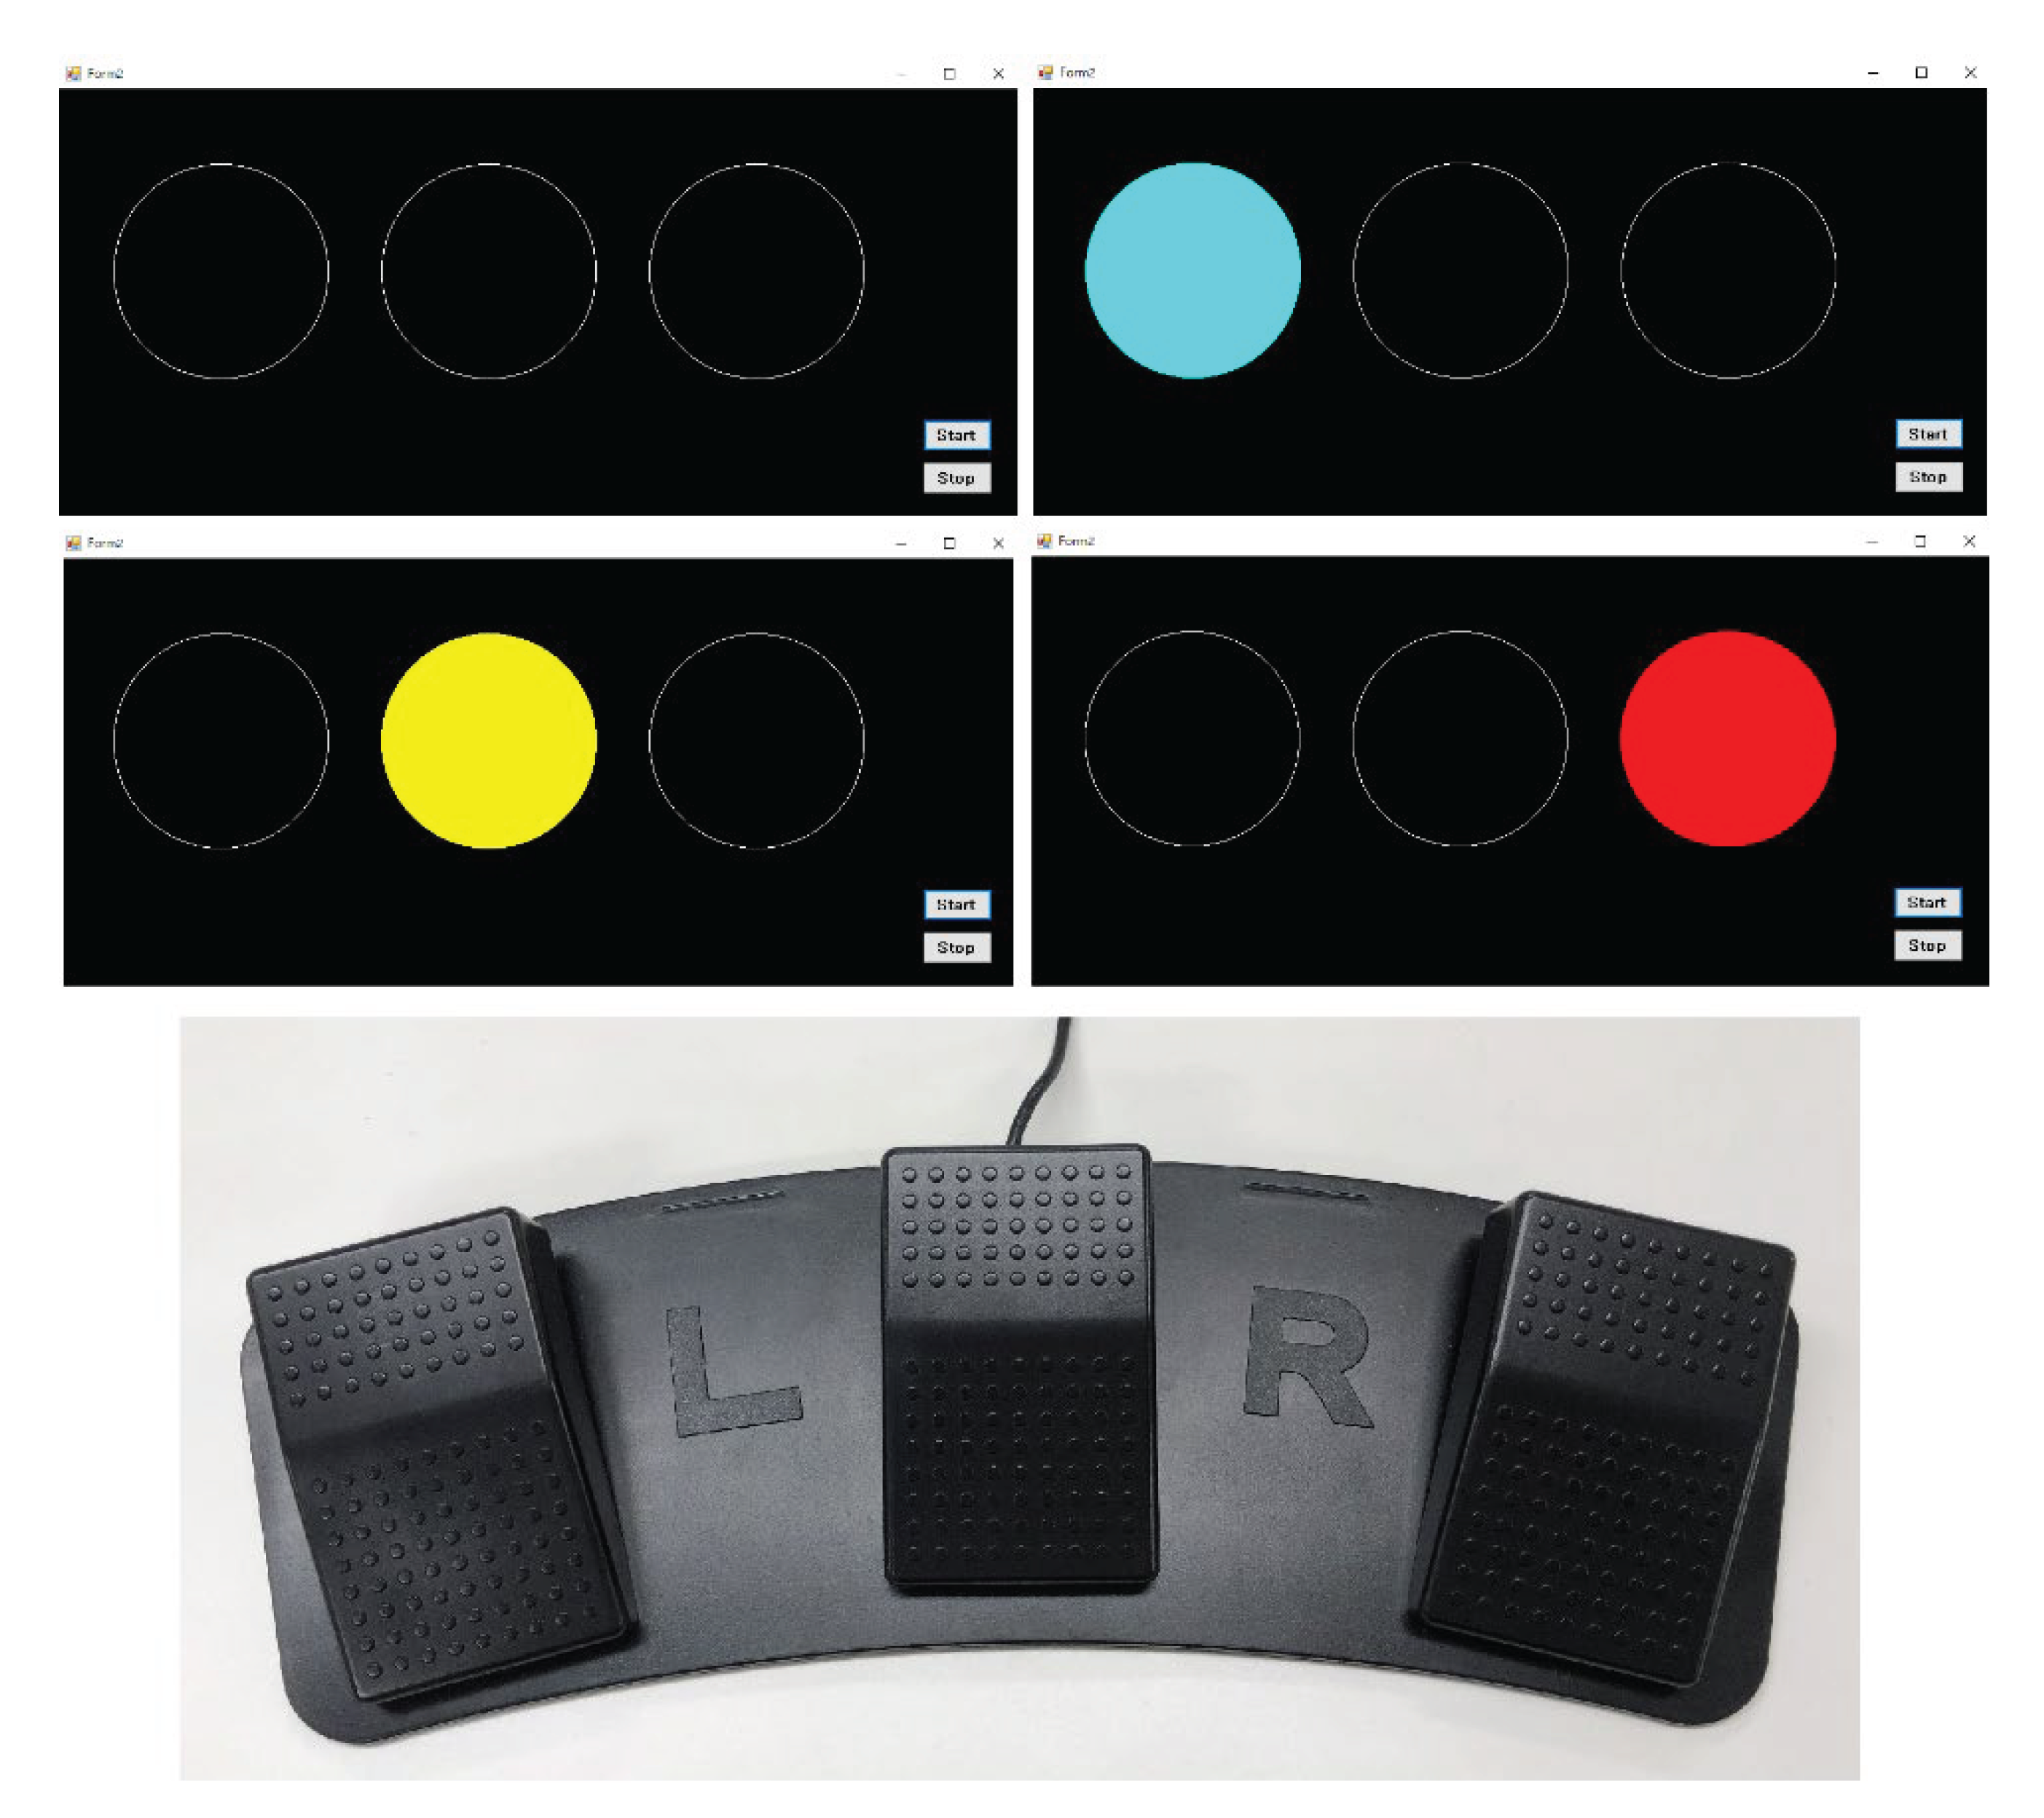
The foot pedal is a three-pedal type switch (size: 365 mm (W) × 143 mm (D) × 41 mm (H); weight: 382 g; switch type: photoelectric; interface: USB; cable length: 2 m; rating: 5 V/60 mA; service life: >2 million operations).
2.2. Participants and Experimental Protocol
The participants consisted of 20 younger adults (24 ± 3 years; 15 males and 5 females) and 24 older adults (73 ± 5 years; 12 males and 12 females). Before the experiment, we collected information on driving experience, visual acuity, height, and weekly PAL (types and durations of exercise). The average driving experience of the younger group was 3 ± 3 years (range: 0–9 years), while that of the older group was 48 ± 9 years (range: 32–60 years). We also confirmed that participants could correctly discriminate the three stimulus colors (red, yellow, blue) and verified that none had color vision deficiency.
The Foot PVT was administered between 11:00 and 14:00. Participants first completed a 5-minute practice session, followed by a 10-minute main test. All pedal operations were performed barefoot using the right foot. Participants were instructed to “press the pedal as quickly and accurately as possible.” The Foot PVT was conducted on a 15.6-inch laptop PC placed approximately 1.5 m in front of the participant. The chair height was individually adjusted to ensure that each participant could comfortably operate the pedals. The laptop was equipped with Windows 10 Pro (64-bit), an Intel® Core™ i5-6300U processor (2.40 GHz), and Intel® HD Graphics 520. To avoid the transient decrease in alertness associated with the post-lunch dip, all measurements were conducted before lunch, and participants were instructed to take their meal only after completing the Foot PVT session.
2.3. Sleep Assessment
To evaluate sleep conditions on the night prior to the experiment, the OSA Sleep Inventory MA version was administered [24,25]. Upon awakening on the test day, participants completed the questionnaire, which consists of 16 items such as “fatigue remains,” “I can concentrate,” and “I slept well.” Each item was rated on a four-point digital scale. Based on the responses, five standardized factor scores were calculated: sleepiness on rising (Sleep1), initiation and maintenance of sleep (Sleep2), dreaming (Sleep3), recovery from fatigue (Sleep4), and sleep duration (Sleep5). According to the scoring system, each factor score is standardized with a mean of 50.
2.4. Recorded Data
For each pedal press, the output file recorded the following five items:(a) stimulus color (Color), (b) correctness of the response (Evaluation), (c) interval until stimulus onset (Interval), (d) RT, and (e) elapsed time.
These data allowed calculation of correction time following an incorrect response. An example of the output format is shown in Table 1. In the Evaluation column, “T” denotes a correct response (True), and “F” denotes an incorrect response (False). In the example, a false start occurred on the third trial, yielding an RT of −3623 ms, indicating that the pedal was pressed 3623 ms earlier than the expected stimulus onset. In the fourth trial, an incorrect pedal was pressed in response to a red stimulus, followed by a correction press (4_Retry). The correction time for this error was recorded as the RT of 4_Retry (1770 ms). When an incorrect pedal is pressed, the display does not advance until the correct pedal is pressed, resulting in an Interval value of 0 ms for the retry trial.

Table 1.
Example of recorded data.
| Event No. | Color | Evaluation | Interval [ms] | RT [ms] | Elapsed time [ms] |
| 1 | Yellow | T | 6445 | 1108 | 7562 |
| 2 | Blue | T | 6369 | 611 | 14566 |
| 3 | False start | F | 9227 | -3623 | 20170 |
| 4 | Red | F | 7427 | 1105 | 28723 |
| 4_Retry | Red | T | 0 | 1770 | 30493 |
| 5 | Yellow | T | 5062 | 909 | 36472 |
2.5. Statistical Analysis
Means and standard deviations were calculated for the five sleep-related factors, PAL, and height. The Shapiro–Wilk test was used to assess the normality of each variable. When normality was confirmed, homogeneity of variances was evaluated using Levene’s test. If variances were equal, an independent-samples t-test was applied; if variances were unequal, Welch’s t-test was used. For variables that were not normally distributed, the nonparametric Mann–Whitney U test was employed.
The primary analysis compared the RT mean between age groups. As secondary analyses, group comparisons were conducted for RT SD, RT median, skewness, and kurtosis using the same procedures to examine differences in the shape of the RT distribution. Pearson’s correlation coefficients were then computed between RT mean and each explanatory variable (sleep factors, height, and PAL) to evaluate their associations with response speed.
Multiple regression analysis was additionally performed with RT mean as the dependent variable and age group, height, the five sleep factors, and PAL as explanatory variables. A bidirectional stepwise selection procedure was applied, and model fit as well as multicollinearity (condition number) were assessed. PAL was calculated as total weekly MET-hours (METs·h/week), obtained by multiplying activity-specific metabolic equivalent (METs) values—based on established literature—by the weekly duration (hours) of each activity [27,28].
Because the frequency of incorrect responses (misses, false starts, and correction time) was low, no inferential statistical tests were conducted for these variables. Instead, they were summarized descriptively and interpreted in relation to the trade-off between response speed and accuracy.
All statistical analyses were performed using Python (version 3.12.7; statsmodels and scipy packages). The significance level was set at p < 0.05 for two-tailed tests.
3. Results
Table 2 presents the percentile distribution of PAL in the younger and older groups. The median PAL was 0 METs·h/week in the younger group and 15 METs·h/week in the older group, indicating that half of the younger participants had no regular exercise habits. In contrast, many older adults engaged in regular physical activity; overall, 8 younger and 21 older participants reported habitual weekly exercise. The interquartile range was wider in the older group (5.3–19.0 METs·h/week) than in the younger group (0–6.0 METs·h/week), and several older adults showed very high activity levels (up to 98 METs·h/week). These findings suggest that the older group demonstrated both greater variability and generally higher PAL. Among younger adults, activity typically consisted of short-duration, high-intensity exercise such as strength training or running performed 1–3 times per week, and walking for commuting was not included in PAL. In contrast, many older adults regularly engaged in light-to-moderate aerobic activities such as walking, early-morning radio calisthenics [29], swimming, or golf; among them, 14 participants reported continuous weekly walking. Thus, the older group exhibited a higher frequency of habitual exercise and a predominance of sustained aerobic activity.
Table 3 summarizes the means ± standard deviations and group comparisons for the five sleep-related factors, height, and PAL. None of the sleep-related variables differed significantly between younger and older adults (p = 0.102–0.930). In contrast, height was significantly greater in the younger group (168 ± 9 cm) than in the older group (162 ± 9 cm; p = 0.039), and PAL was significantly higher in the older group (4.9 ± 7.6 vs. 19.6 ± 23.2 METs·h/week; p = 0.002). The median PAL was 0 METs·h/week in younger adults and 15 METs·h/week in older adults, consistent with the finding that half of the younger group had no exercise habit. The older group showed a wide PAL range, with maximum values reaching 98 METs·h/week, creating a highly right-skewed distribution in which the lower bound of the mean ± SD fell below zero.
Table 4 shows the basic RT statistics. Both RT mean and RT median were significantly slower in the older group (RT mean: 700 ± 73 vs. 818 ± 105 ms, p < 0.001; RT median: 675 ± 72 vs. 796 ± 96 ms, p < 0.001). In contrast, RT SD did not differ significantly between groups (p = 0.284). RT skewness was significantly higher in younger adults (1.93 ± 0.99 vs. 1.41 ± 0.69, p = 0.047), and kurtosis was also significantly higher (7.20 ± 4.66 vs. 4.13 ± 3.24, p = 0.014). These findings indicate that the older group exhibited a flatter RT distribution with fewer extreme delayed responses. Correlation analyses showed no significant associations between RT mean and either skewness or kurtosis in either age group (r = 0.054–0.252, p > 0.28).
Table 5 presents the Pearson correlation coefficients between RT mean and each explanatory variable. In younger adults, RT mean showed moderate negative correlations with height (r = −0.593, p = 0.006) and Sleep1 (r = −0.557, p = 0.011). In the older group, however, no variables were significantly correlated with RT mean. When all participants were pooled, height showed a moderate negative correlation with RT mean (r = −0.478, p = 0.001). PAL was positively correlated with RT mean in the combined sample (r = 0.325, p = 0.032), but the direction of association differed by age group (negative trend in younger adults; positive trend in older adults). Because many younger adults had PAL = 0, the between-group difference likely inflated the overall correlation. Therefore, RT mean cannot be considered consistently associated with PAL. Significant correlations are illustrated in Figure 2.
Table 6 shows the results of the multiple regression analysis with RT mean as the dependent variable. Stepwise selection identified height as the only significant predictor in the younger group (B = −4.57, p = 0.006; adjusted R² = 0.316; F = 13.75, p = 0.006), whereas no significant predictors were identified in the older group. In the combined model, height and age group were selected as significant explanatory variables (adjusted R² = 0.372; F = 13.75, p < 0.001). Height had a negative regression coefficient (B = −3.89, p = 0.010), while age group had a positive coefficient (B = 95.12, p = 0.001). These findings indicate that greater height was associated with faster reactions, whereas higher age was associated with slower reactions. Overall, Foot PVT performance appears to reflect a combination of physical characteristics and age-related effects.
Table 7 summarizes the frequency of misses and false starts. Most participants completed the Foot PVT without any misses or false starts. The mean correction time was similar between groups (Younger: 666 ± 347 ms; Older: 714 ± 225 ms). Because these events were infrequent, no inferential statistical analyses were performed.
Table 2.
Percentile distribution of PAL in younger and older adults.
| Statistic (METs·h/week) | Younger (n=20) | Older (n=24) | Comment |
| Minimum | 0 | 0 | Both groups included participants with no regular exercise. |
| 25%tile | 0 | 5.3 | One quarter of younger adults did not exercise at all. |
| Median | 0 | 15.0 | Half of the younger adults had 0 METs·h/week, whereas older adults averaged 15. |
| 75%tile | 6.0 | 19.0 | Upper quartile of older adults exercised regularly. |
| Maximum | 20.5 | 98.0 | A few older adults were extremely active (outlier level). |
The PAL distribution was highly right-skewed; younger adults included many inactive; participants, whereas older adults showed wide variability.
Table 3.
Group comparisons of sleep-related factors, PAL, and height.
| Factor | Younger (n=20) | Older (n=24) | Test | p-value |
| Sleep1 | 47.5±8.6 | 49.1±9.0 | S | 0.532 |
| Sleep2 | 47.1±7.8 | 45.8±10.4 | S | 0.664 |
| Sleep3 | 50.6±10.1 | 49.7±9.9 | M | 0.930 |
| Sleep4 | 46.3±9.6 | 50.8±8.5 | S | 0.102 |
| Sleep5 | 47.0±7.6 | 51.2±11.8 | M | 0.194 |
| Height (cm) | 168±9 | 162±9 | S | 0.039 |
| PAL (METs・h/week) | 4.9±7.6 | 19.6±23.2 | M | 0.002 |
Statistical tests are indicated as follows: S = Student’s independent t-test (parametric, equal vari ances); M = Mann–Whitney U test (nonparametric).
Table 4.
Descriptive statistics and group comparisons of RT.
| Index | Younger (n=20) | older (n=24) | Test | p-value |
| RT mean (ms) | 700 ± 73 (666–734) |
818 ± 105 (773–863) |
S |
<0.001 |
| RT median (ms) | 675 ± 72 (641–709) |
796 ± 96 (754–837) |
S | <0.001 |
| RT SD (ms) | 122± 25 | 139± 53 | M | 0.283 |
| Skewness | 1.93± 0.99 | 1.41± 0.69 | S | 0.047 |
| Kurtosis | 7.20± 4.66 | 4.13± 3.24 | S | 0.014 |
| r (RT mean .vs. Skewness) | 0.054 | 0.109 | - | 0.822 Older:0.611) |
| r (RT mean .vs. Kurtosis) | 0.252 | -0.135 | - | 0.283 (Older:0.528) |
Values in parentheses for RT mean and RT median represent the 95% confidence intervals. Statistical tests are indicated as follows: S = Student’s independent t-test (parametric, equal variances); M = Mann–Whitney U test (nonparametric).
Table 5.
Pearson’s correlation coefficients between RT mean and explanatory variables.
| Factor | Younger (n=20) | Older (n=24) | All (n=44) | |||
| r | p-value | r | p-value | r | p-value | |
| Sleep1 | -0.557 | 0.011 | -0.261 | 0.216 | -0.248 | 0.104 |
| Sleep2 | -0.223 | 0.346 | -0.184 | 0.391 | -0.200 | 0.194 |
| Sleep3 | 0.303 | 0.194 | 0.093 | 0.664 | 0.115 | 0.457 |
| Sleep4 | -0.363 | 0.115 | -0.138 | 0.523 | -0.041 | 0.791 |
| Sleep5 | -0.388 | 0.091 | -0.267 | 0.206 | -0.127 | 0.411 |
| Height | -0.593 | 0.006 | -0.279 | 0.188 | -0.478 | 0.001 |
| PAL (METs・h/week) | -0.269 | 0.252 | 0.231 | 0.277 | 0.325 | 0.032 |
Figure 2.
Scatter plots showing significant correlations with RT mean. Upper: Sleep1 vs. RT in the younger group; Middle: Height vs. RT in the younger group; Lower: Height vs. RT in all participants. Dotted lines indicate linear regression fits; regression equations and determination coefficients (R2) are shown in each panel. A higher Sleep1 score indicates less sleepiness upon waking..
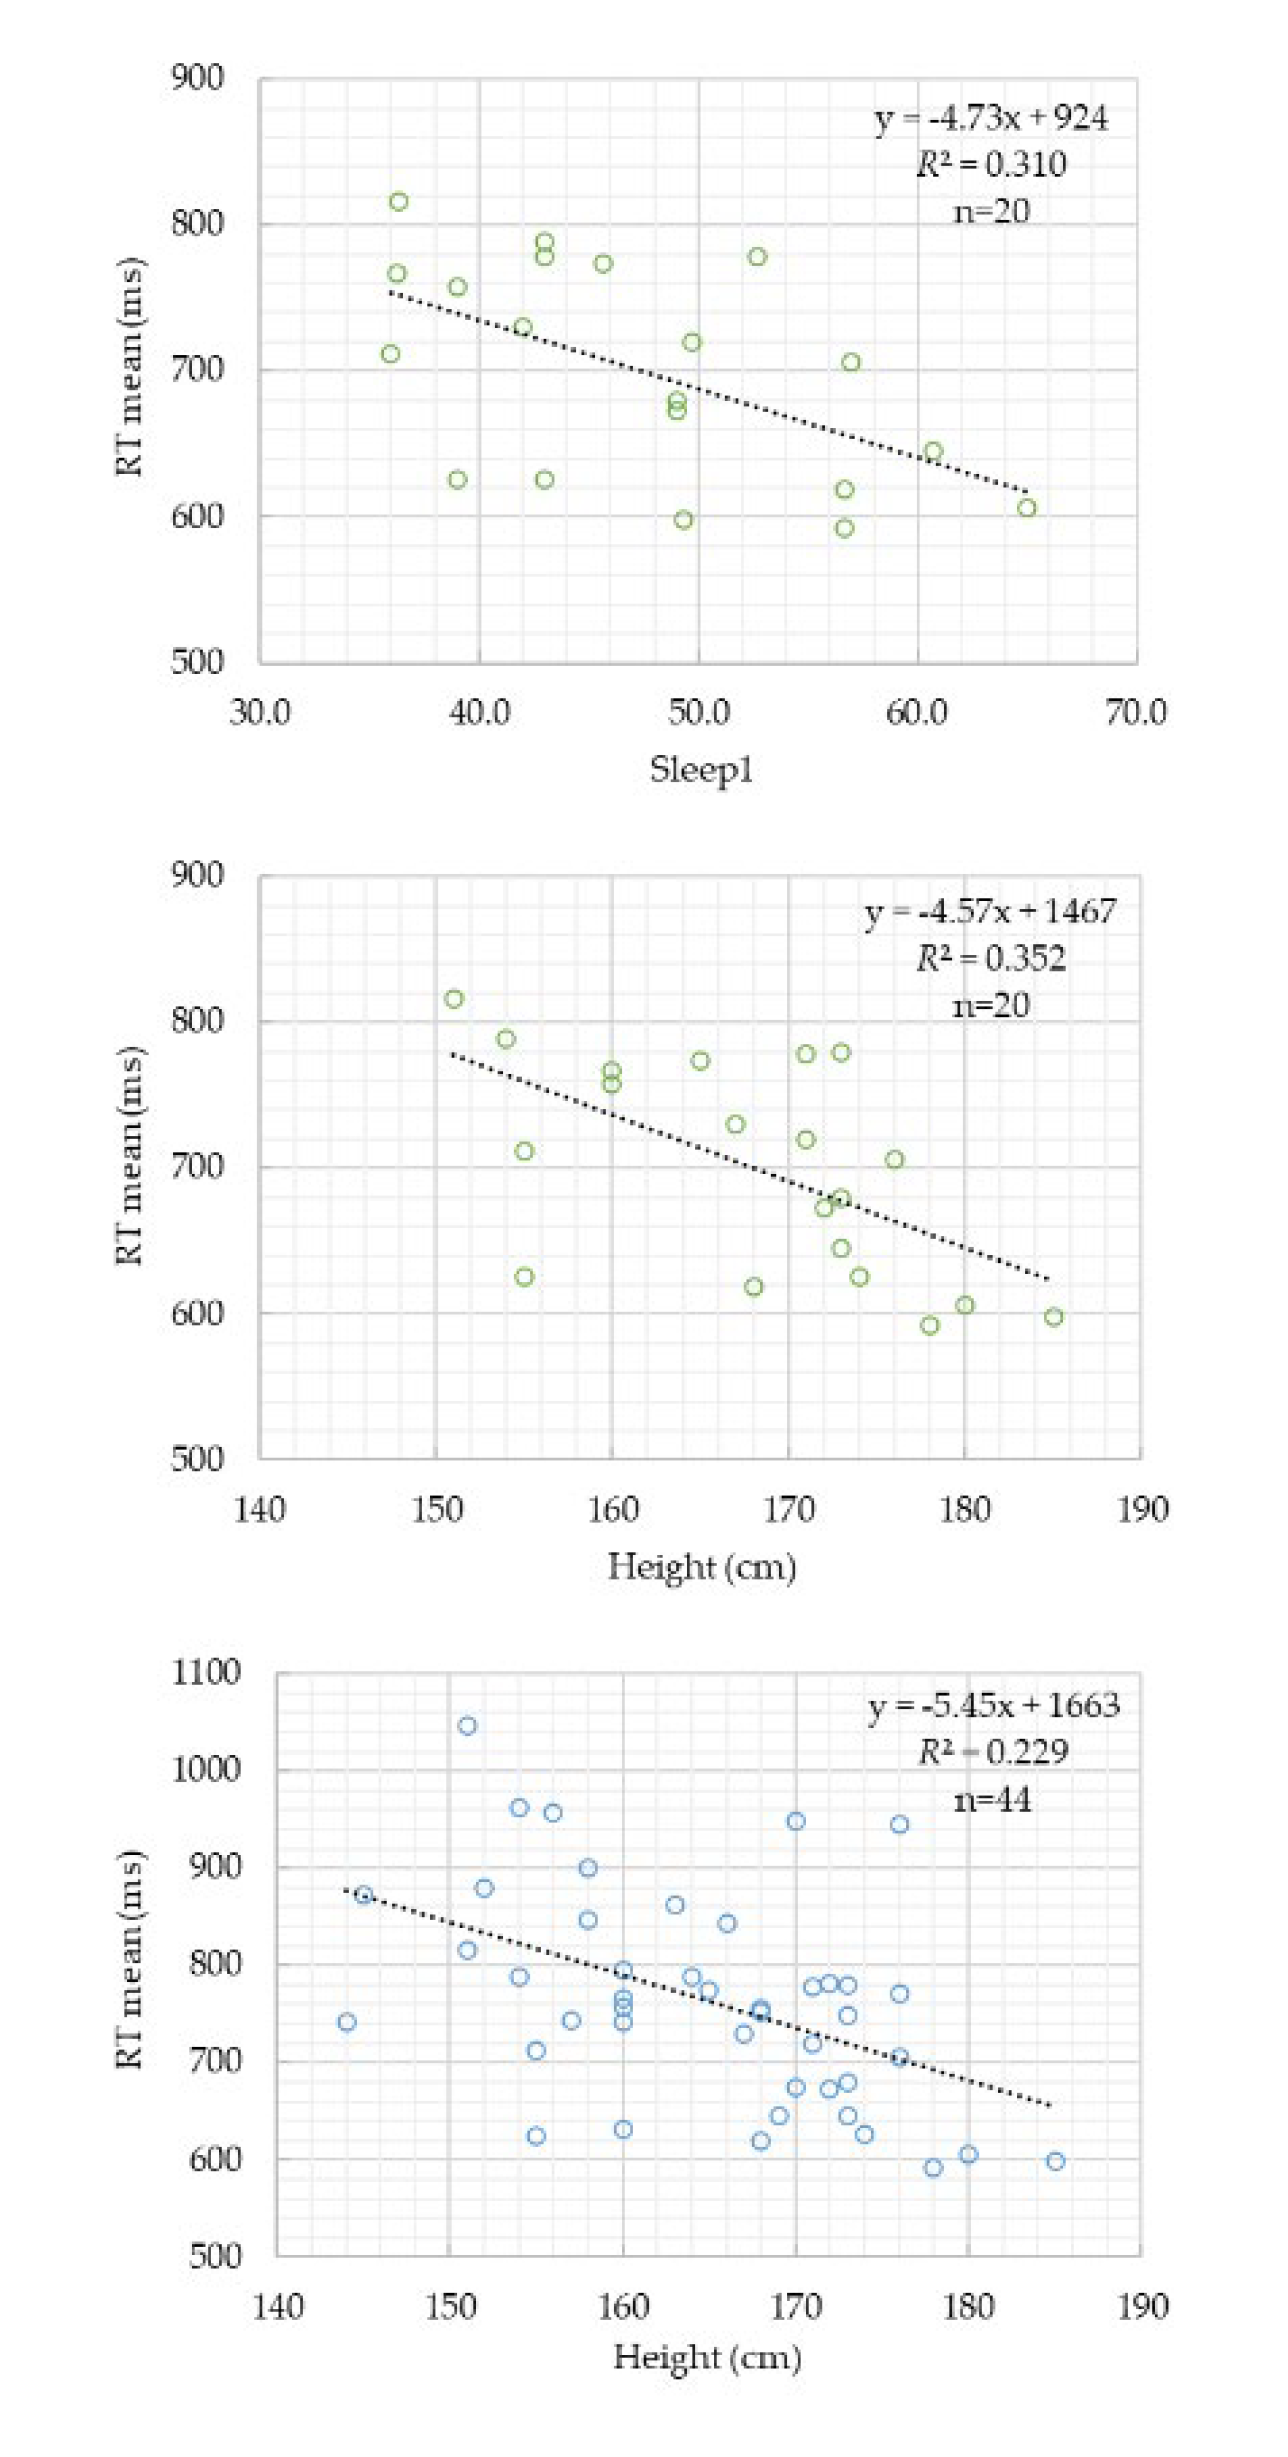
Table 6.
Results of multiple regression analysis with RT mean as the dependent variable.
| Model | Predictor | B | SE | t | p | Adjusted R² | F(p) |
| (i) Younger | Constant | 1467.18 | 245.67 | 5.97 | 0.000 | 0.316 | 13.75 (0.006) |
| Height (cm) | -4.57 | 1.46 | -3.13 | 0.006 | |||
| (ii) Older | Constant | 818.15 | 21.81 | 37.52 | 0.000 | 0 | — |
| (iii) Combined |
Constant | 1258.94 | 255.71 | 4.92 | 0.000 | 0.372 | 13.75 (0.001) |
| Height (cm) | -3.89 | 1.45 | -2.69 | 0.010 | |||
| Age group | 95.12 | 27.66 | 3.44 | 0.001 |
Age group (1 = younger, 2= older) ,Combined model (younger + older).
Table 7.
Frequency of misses and false starts in the Foot PVT.
| Category |
Young (n = 20) |
Older (n = 24) |
Category |
Young (n = 20) |
Older (n = 24) |
Correction time (ms) |
| Miss count | Count of participants | False start count | Count of participants | Mean±SD | ||
| 0 times | 11 | 16 | 0 times | 10 | 19 | Young: 666 ± 347 Older: 714 ± 225 |
| 1 time | 4 | 6 | 1 time | 2 | 2 | |
| 2 times | 4 | 1 | 2 times | 5 | 3 | |
| 8 times | 1 | 1 | 3–9 times | 3 | 0 | |
Numbers indicate the count of participants per category in each age group. Each participant pressed the pedals approximately 90 times during the 10-minute Foot PVT session.
4. Discussion
The main findings of this study demonstrated that both RT mean and RT median were significantly slower in the older group, clearly confirming age-related declines in reaction speed even in the Foot PVT. This result is consistent with previous findings from finger-based PVT studies [30,31,32], reaffirming that aging slows neural processing from visual stimulus detection to motor execution. Although RT SD did not differ significantly between groups, the distributional characteristics showed notable differences. The older group exhibited significantly lower skewness and kurtosis, indicating a flatter distribution with fewer extreme delays and greater response consistency. While aging generally slows neural processing, older adults may adopt a cautious response strategy that prioritizes avoiding excessively delayed responses. Indeed, the older group showed fewer false starts, reflecting conservative behavior that suppresses premature responses. Such patterns align with prior research showing that older adults compensate for declines in cognitive and sensory function through safety-oriented driving behaviors, such as reducing speed and increasing following distance [33,34,35].
One motivation for including height as an explanatory variable was to examine whether nerve conduction distance—from visual perception to lower-limb motor execution—could influence RT. Because peripheral nerve conduction velocity shows minimal inter-individual variation, taller individuals with longer central-to-peripheral pathways would theoretically exhibit slightly longer conduction times [36,37]. However, the present findings did not support this hypothesis: in the younger group, taller participants showed shorter RTs. The Foot PVT requires a lateral foot-movement task involving ankle inversion/eversion and hip abduction/adduction—movements similar to the rotational foot posture used during accelerator–brake transitions in driving. Biomechanical studies of pedal operations have shown that pedal switching relies more on lateral rotation of the foot than on whole-leg movement, and that such movement increases leg-muscle activation [38]. Considering these findings, it is plausible that taller individuals—with longer legs and different joint geometries—could initiate lateral foot movements more efficiently, resulting in shorter RTs. However, this interpretation remains speculative; future studies should directly measure biomechanical variables such as muscle strength, joint range of motion, and lower-limb morphology.
None of the five sleep-related factors differed significantly between groups, and their associations with RT were limited. In younger adults, Sleep1 showed a moderate negative correlation with RT, suggesting that subjective sleepiness or insufficient sleep impairs attention, consistent with prior research [39,40]. In contrast, no sleep factor correlated with RT in the older group. Age-related changes in sleep architecture (reduced deep sleep and increased awakenings) and larger circadian fluctuations in alertness may obscure such associations [41,42]. Older adults also show dissociations between subjective sleep ratings and physiological sleep indices [43], making single-time subjective assessments insufficient for capturing effects on attention. To minimize confounding from sleep inertia and the post-lunch dip, all measurements were conducted between 11:00 and 14:00. This interval has been shown in large-scale PVT studies to yield the most stable RT performance [44], supporting the validity of our protocol.
The participant sample exhibited a pronounced imbalance in PAL. Younger adults had a median PAL of 0 METs·h/week, indicating a largely inactive group, whereas older adults displayed substantially higher PAL, with many engaging in regular walking, swimming, radio exercises, or golf. Higher PAL is known to support cognitive and attentional functioning in older adults [45,46], suggesting that the observed RT difference of approximately 120 ms may underestimate the contrast that would be observed between younger adults and sedentary older adults. Conversely, physical inactivity has been associated with cognitive difficulties in younger adults [47,48], and the large proportion of inactive individuals in the younger group may have contributed to the greater variability observed in their RT distribution.
Multiple regression analysis showed that height was the only significant predictor of RT in the younger group, explaining 31.6% of the variance. This indicates that individual differences in RT were strongly influenced by biomechanical factors. In contrast, no significant predictors emerged in the older group, suggesting that RT is shaped by multifactorial age-related changes, including neuromuscular decline and increased cautiousness. In the combined model including both age groups, height and age were selected as significant predictors, jointly explaining 37.2% of the variance. Height contributed to faster RTs, whereas age contributed to slower RTs. These results indicate that Foot PVT performance is primarily determined by two stable individual characteristics—body size and aging—consistent with prior work demonstrating that PVT performance reflects multiple stable individual traits [44].
The RT distribution in the younger group was characterized by high skewness (1.93 ± 0.99) and high kurtosis (7.20 ± 4.66), indicating a heavy-tailed distribution with occasional extremely delayed responses. This pattern suggests greater susceptibility to transient attentional lapses despite generally faster responses. PVT research has emphasized that mean RT alone is insufficient to characterize attentional performance and that delayed responses and tail heaviness provide important insights [49,50], consistent with the present findings. In contrast, the older group exhibited lower skewness (1.41 ± 0.69) and lower kurtosis (4.13 ± 3.24), indicating fewer extreme delays and more homogeneous responses. This pattern suggests that older adults may prioritize response stability and avoid extremely delayed reactions, consistent with a cautious response strategy.
Several limitations should be acknowledged. First, PAL differed markedly between the two groups, with many highly active older adults; therefore, the present RT characteristics may not generalize to less active older populations. Second, biomechanical variables such as leg length, joint mobility, and muscle strength were not directly measured, leaving interpretations regarding the height–RT relationship inferential. Third, the Foot PVT relies on lateral foot movement, a specific motor modality; generalization to other RT tasks requires further investigation. Finally, sleep factors were assessed only using subjective questionnaires; incorporating objective sleep measurements may facilitate more precise evaluation of their relationship with attentional performance.
5. Conclusions
This study compared RT between younger and older adults using the Foot PVT and examined how age, height, sleep factors, and PAL influence RT. Mean RT was 700 ± 73 ms in the younger group and 818 ± 105 ms in the older group, indicating an age-related delay of approximately 120 ms. Older adults also showed lower skewness and kurtosis, suggesting more homogeneous responses and a cautious response strategy that suppresses premature responses.
In the younger group, RT was inversely correlated with height, and multiple regression analysis identified height as the sole significant predictor, explaining 31.6% of the variance. In contrast, no significant predictors emerged in the older group. In the combined model, height and age jointly explained 37.2% of RT variance, indicating that Foot PVT performance is primarily influenced by body size and aging.
These findings demonstrate that the Foot PVT is a sensitive tool for capturing biomechanical characteristics and age-related differences in reaction performance. The Foot PVT may have valuable applications in traffic-safety research and in the assessment of lower-limb motor function in older adults.
Author Contributions
Conceptualization, Y.Y. ; methodology, Y.Y.; software, Y.Y.; validation, Y.Y., K.Y. ; formal analysis, Y.Y.; investigation, Y.Y.; resources, K.Y.; data curation, Y.Y.; writing—original draft preparation, Y.Y.; writing—review and editing, Y.Y.; visualization, Y.Y.; supervision, K.Y.; project administration, K.Y. All authors have read and agreed to the published version of the manuscript.
Funding
This research received no external funding.
Institutional Review Board Statement
The studies involving human subjects were reviewed and approved by School of Design & Architecture, Nagoya City University Institutional Review Board (No. 6 Geirin-No. 1, approved 23 April 2024).
Informed Consent Statement
Informed consent was obtained from all subjects involved in this study.
Data Availability Statement
The RT datasets analyzed in this study are not publicly available due to privacy considerations but can be obtained from the corresponding author upon reasonable request.
Conflicts of Interest
The authors declare that they have no competing interests.
Abbreviations
The following abbreviations are used in this manuscript:
| PVT | psychomotor vigilance test |
| Foot PVT | foot-response version of the PVT |
| RT | reaction time |
| PAL | physical activity level |
References
- Dinges, D.F.; Powell, J.W. Microcomputer analysis of performance on a portable, simple visual RT task during sustained opera tions. Behav. Res. Methods Instrum. Comput. 1985, 17, 652–655.
- Dinges, D.F.; Pack, F.; Williams, K.; Gillen, K.A.; Powell, J.W.; Ott, G.E.; Aptowicz, C.; Pack, A.I. Cumulative sleepiness, mood disturbance, and psychomotor vigilance performance decrements during a week of sleep restricted to 4–5 hours per night. Sleep 1997, 20, 267–277.
- Basner, M.; Moore, T.M.; Nasrini, J.; Gur, R.C.; Dinges, D.F. Response speed measurements on the psychomotor vigilance test: How precise is precise enough? Sleep 2021, 44, zsaa121.
- Chaisilprungraung, T.; Stekl, E.K.; Thomas, C.L.; Blanchard, M.E.; Hughes, J.D.; Balkin, T.J.; Doty, T.J. Quantifying the effects of sleep loss: Relative effect sizes of the psychomotor vigilance test, multiple sleep latency test, and maintenance of wakefulness test. Sleep Adv. 2022, 3, zpac034.3.
- Jones, M.J.; Dunican, I.C.; Murray, K.; Peeling, P.; Dawson, B.; Halson, S.; Miller, J.; Eastwood, P.R. The psychomotor vigilance test: A comparison of different test durations in elite athletes. J. Sports Sci. 2018, 36(18), 2033–2037.
- Basner M, Moore TM, Nasrini J, Gur RC, Dinges DF. Response speed measurements on the psychomotor vigilance test: how precise is precise enough? Sleep. 2021, 44, zsaa121.
- Mollicone DJ, Kan K, Coats S, Mott C, van Wollen M, Hatch A, Gallagher J, Williams S, Motzkin D. Use of the psychomotor vigilance test to aid in the selection of risk controls in an air medical transport operation. Sleep Adv. 2023, 4, zpad003.
- Antler CA, Yamazaki EM, Casale CE, Brieva TE, Goel N. The 3-Minute Psychomotor Vigilance Test Demonstrates Inadequate Convergent Validity Relative to the 10-Minute Psychomotor Vigilance Test Across Sleep Loss and Recovery. Front. Neurosci. 2022, 16, 815697.9.
- Thompson BJ, Shugart C, Dennison K, Louder TJ. Test-retest reliability of the 5-minute psychomotor vigilance task in working-aged females. J. Neurosci. Methods 2022, 365, 109379.
- Ferris M, Bowles KA, Bray M, Bosley E, Rajaratnam SMW, Wolkow AP. The impact of shift work schedules on PVT performance in naturalistic settings: a systematic review. Int. Arch Occup. Environ. Health 2021, 94, 1475-1494.
- Çolak M, Esin MN. Factors affecting the psychomotor vigilance of nurses working night shift. Int. Nurs. Rev. 2024, 71 ,84-93.
- Grant DA, Honn KA, Layton ME, Riedy SM, Van Dongen HPA. 3-minute smartphone-based and tablet-based psychomotor vigilance tests for the assessment of reduced alertness due to sleep deprivation. Behav. Res. Methods. 2017,49, 1020-1029.
- Reifman, J.; Ramakrishnan, S.; Liu, J.; Kapela, A.; Doty, T.J.; Balkin, T.J.; Kumar, K.; Khitrov, M.Y. 2B-Alert App: A Mobile Application for Real-Time Individualized Prediction of Alertness. J. Sleep Res. 2019, 28, e12725.
- Droździel, P.; Tarkowski, S.; Rybicka, I.; Wrona, R. Drivers’ Reaction Time Research in the Conditions in the Real Traffic. Open Eng. 2020, 10, 35-47.
- Poliak, M.; Svabova, L.; Benus, J.; Demirci, E. Driver Response Time and Age Impact on the Reaction Time of Drivers: A Driving Simulator Study among Professional-Truck Drivers. Mathematics 2022, 10, 1489.
- Bauder, M.; Paula, D.; Pfeilschifter, C.; Petermeier, F.; Kubjatko, T.; Riener, A.; Schweiger, H.-G. Influences of Vehicle Communication on Human Driving Reactions: A Simulator Study on Reaction Times and Behavior for Forensic Accident Analysis. Sensors 2024, 24, 4481.
- Ministry of Internal Affairs and Communications. Statistics Topics No.142. Available online: https://www.stat.go.jp/data/topics/pdf/topics142.pdf (accessed on 1 Nov 2025).
- CabinetOffice, Government of Japan. Available online: https://www8.cao.go.jp/koutu/taisaku/r02kou_haku/zenbun/genkyo/feature/feature_01_3.html (accessed on 1 November 2025).
- Tokyo Metropolitan Police Department. Preventing Traffic Accidents Involving Elderly Drivers. Tokyo Metropolitan Police Department 2024. Available online: https://www.keishicho.metro.tokyo.lg.jp/kotsu/jikoboshi/koreisha/koreijiko.html (accessed on 1 November 2025).
- Yoshida, Y.; Yuda, E.; Yokoyama, K. Design of the new Foot PVT for screening driving ability. Hardware 2025, 3, 3.
- Mota Albuquerque P, Ribeiro Franco CM, Sampaio Rocha-Filho PA. Assessing the impact of sleep restriction on the attention and executive functions of medical students: a prospective cohort study. Acta. Neurol. Belg. 2023, 123, 1421-1427.
- Chiaramonte, R.; Pavone, V.; Testa, G.; Pesce, I.; Scaturro, D.; Musumeci, G.; Mauro, G.L.; Vecchio, M. The Role of Physical Exercise and Rehabilitative Implications in the Process of Nerve Repair in Peripheral Neuropathies: A Systematic Review. Diagnostics 2023, 13, 364.
- Alonso, A.C.; Luna, N.M.; Mochizuki, L.; Barbieri, F.; Santos, S.; Greve, J.M. The influence of anthropometric factors on postural balance: The relationship between body composition and posturographic measurements in young adults. Clinics (Sao Paulo) 2012, 67, 1433–1441.
- Okamura, H.; Mihara, K.; Tsuda, A.; Morisaki, T.; Tanaka, Y.; Shoji, Y. Subjective Happiness Is Associated with Objectively Evaluated Sleep Efficiency and Heart Rate during Sleep: An Exploratory Study Using Non-Contact Sheet Sensors. Sustainability 2020, 12, 4630.
- Japan Organization of Better Sleep (JOBS). OSA Sleep Inventory MA version. Available online: https://www.jobs.gr.jp/osa_ma.html (accessed on 1 Nov 2025).
- Herrmann, S.D.; Willis, E.A.; Ainsworth, B.E.; Barreira, T.V.; Hastert, M.; Kracht, C.L.; Schuna, J.M. Jr; Cai, Z.; Quan, M.; Tudor-Locke, C.; Whitt-Glover, M.C.; Jacobs, D.R. Jr. 2024 Adult Compendium of Physical Activities: A Third Update of the Energy Costs of Human Activities. J. Sport Health Sci. 2024, 13, 6–12.
- Ainsworth, B.E.; Haskell, W.L.; Herrmann, S.D.; Meckes, N.; Bassett, D.R., Jr.; Tudor-Locke, C.; Greer, J.L.; Vezina, J.; Whitt-Glover, M.C.; Leon, A.S. 2011 Compendium of Physical Activities: A second update of codes and MET values. Medicine & Science in Sports & Exercise 2011, 43, 1575–1581.
- National Institutes of Biomedical Innovation, Health and Nutrition. Revised “List of Physical Activity METs (METs Table)”; Available online: https://www.nibn.go.jp/eiken/programs/2011mets.pdf (accessed on 1 November 2025).
- Osuka, Y.; Kojima, N.; Sugie, M.; Omura, T.; Motokawa, K.; Maruo, K.; Ono, R.; Aoyama, T.; Inoue, S.; Kim, H.; Sasai, H. Effects of a Home-Based Radio-Taiso Exercise Programme on Health-Related Quality of Life in Older Adults with Frailty: Protocol for an Assessor-Blind Randomized Controlled Trial. BMJ Open. 2022, 12, e063201.
- Doroudgar, S.; Chuang, H.M.; Perry, P.J.; Thomas, K.; Bohnert, K.; Canedo, J. Driving Performance Comparing Older versus Younger Drivers. Traffic Inj. Prev. 2017, 18, 41-46.
- Cooper, J.M.; Wheatley, C.L.; McCarty, M.M.; Motzkus, C.J.; Lopes, C.L.; Erickson, G.G.; Baucom, B.R.W.; Horrey, W.J.; Strayer, D.L. Age-Related Differences in the Cognitive, Visual, and Temporal Demands of In-Vehicle Information Systems. Front. Psychol. 2020, 11, 1154.
- Depestele, S.; Ross, V.; Verstraelen, S.; Brijs, K.; Brijs, T.; van Dun, K.; Meesen, R. The Impact of Cognitive Functioning on Driving Performance of Older Persons in Comparison to Younger Age Groups: A Systematic Review. Transp. Res. Part F Traffic Psychol. Behav. 2020, 73, 433-452.
- Robertsen, R.; Lorås, H.W.; Polman, R.; Simsekoglu, O.; Sigmundsson, H. Aging and Driving: A Comparison of Driving Performance Between Older and Younger Drivers in an On-Road Driving Test. SAGE Open 2022, 12, 2.
- Mouloua, M.; Rinalducci, E.; Smither, J.; Brill, J.C. Effect of Aging on Driving Performance. Proc. Hum. Factors Ergon. Soc. Annu. Meet. 2004, 48, 253-257.
- Greene, W.R.; Smith, R. Driving in the Geriatric Population. Clin. Geriatr. Med. 2019, 35, 127-131.
- Rivner, M.H.; Swift, T.R.; Malik, K. Influence of age and height on nerve conduction. Muscle Nerve 2001, 24, 1134-1141.
- Thakker, D.V.; Kariya, V.B. A Cross-Sectional Study of Comparison between Individual Height and Median Nerve Conduction Velocity. Sch. Int. J. Anat. Physiol. 2019, 2, 325-329.
- Tjolleng, A.; Yang, J.; Jung, K. Analysis of Leg Muscle Activities and Foot Angles while Pressing the Accelerator Pedal by Different Foot Postures. Appl. Sci. 2022, 12, 13025.
- Dinges, D.F.; Pack, F.; Williams, K.; Gillen, K.A.; Powell, J.W.; Ott, G.E.; Aptowicz, C.; Pack, A.I. Cumulative sleepiness, mood disturbance, and psychomotor vigilance performance decrements during a week of sleep restricted to 4-5 hours per night. Sleep 1997, 20(4), 267-277.
- Lim, J.; Dinges, D.F. Sleep deprivation and vigilant attention. Ann. N. Y. Acad. Sci. 2008, 1129, 305-322.
- Mattis, J.; Sehgal, A. Circadian Rhythms, Sleep, and Disorders of Aging. Trends Endocrinol. Metab. 2016, 27(4), 192-42.
- Schmidt, C.; Peigneux, P.; Cajochen, C. Age-related changes in sleep and circadian rhythms: Impact on cognitive performance and underlying neuroanatomical networks. Front. Neurol. 2012, 3, 118.
- Landry, G.J.; Best, J.R.; Liu-Ambrose, T. Measuring sleep quality in older adults: A comparison using subjective and objective methods. Front. Aging Neurosci. 2015, 7, 166.
- Yuda, E.; Yoshida, Y. Individual Differences in Sustained Attention: Effects of Age, Sex, and Time of Day Based on Psychomotor Vigilance Task Performance. Appl. Sci. 2025, 15, 5487.
- Voelcker-Rehage, C.; Niemann, C. Structural and functional brain changes related to different types of physical activity across the life span. Neurosci. Biobehav. Rev. 2013, 37, 2268–2295.
- Colcombe, S.; Kramer, A.F. Fitness effects on the cognitive function of older adults: A meta-analytic study. Psychol. Sci. 2003, 14, 125–130.
- Shi, B.; Mou, H.; Tian, S.; Meng, F.; Qiu, F. Effects of Acute Exercise on Cognitive Flexibility in Young Adults with Different Levels of Aerobic Fitness. Int. J. Environ. Res. Public Health 2022, 19, 9106.
- Sun, Q.; Xu, Z.; Lyu, D.; Xu, X.; Wang, L.; Yan, T.; Yan, J. Physical activity and cognitive difficulties in adolescents: A cross-sectional study of 13,677 participants. Complement. Ther. Clin. Pract. 2025, 59, 101965.
- Basner, M.; Dinges, D.F. Maximizing sensitivity of the psychomotor vigilance test (PVT) to sleep loss. Sleep 2011, 34, 581–591.
- Yamashita, A.; Rothlein, D.; Kucyi, A.; Valera, E.M.; Germine, L.; Wilmer, J.; DeGutis, J.; Esterman, M. Variable Rather Than Extreme Slow Reaction Times Distinguish Brain States during Sustained Attention. Sci. Rep. 2021, 11, 14883.
Disclaimer/Publisher’s Note: The statements, opinions and data contained in all publications are solely those of the individual author(s) and contributor(s) and not of MDPI and/or the editor(s). MDPI and/or the editor(s) disclaim responsibility for any injury to people or property resulting from any ideas, methods, instructions or products referred to in the content. |
© 2025 by the authors. Licensee MDPI, Basel, Switzerland. This article is an open access article distributed under the terms and conditions of the Creative Commons Attribution (CC BY) license (http://creativecommons.org/licenses/by/4.0/).
Copyright: This open access article is published under a Creative Commons CC BY 4.0 license, which permit the free download, distribution, and reuse, provided that the author and preprint are cited in any reuse.


