
Submitted:
02 December 2025
Posted:
03 December 2025
You are already at the latest version
Abstract
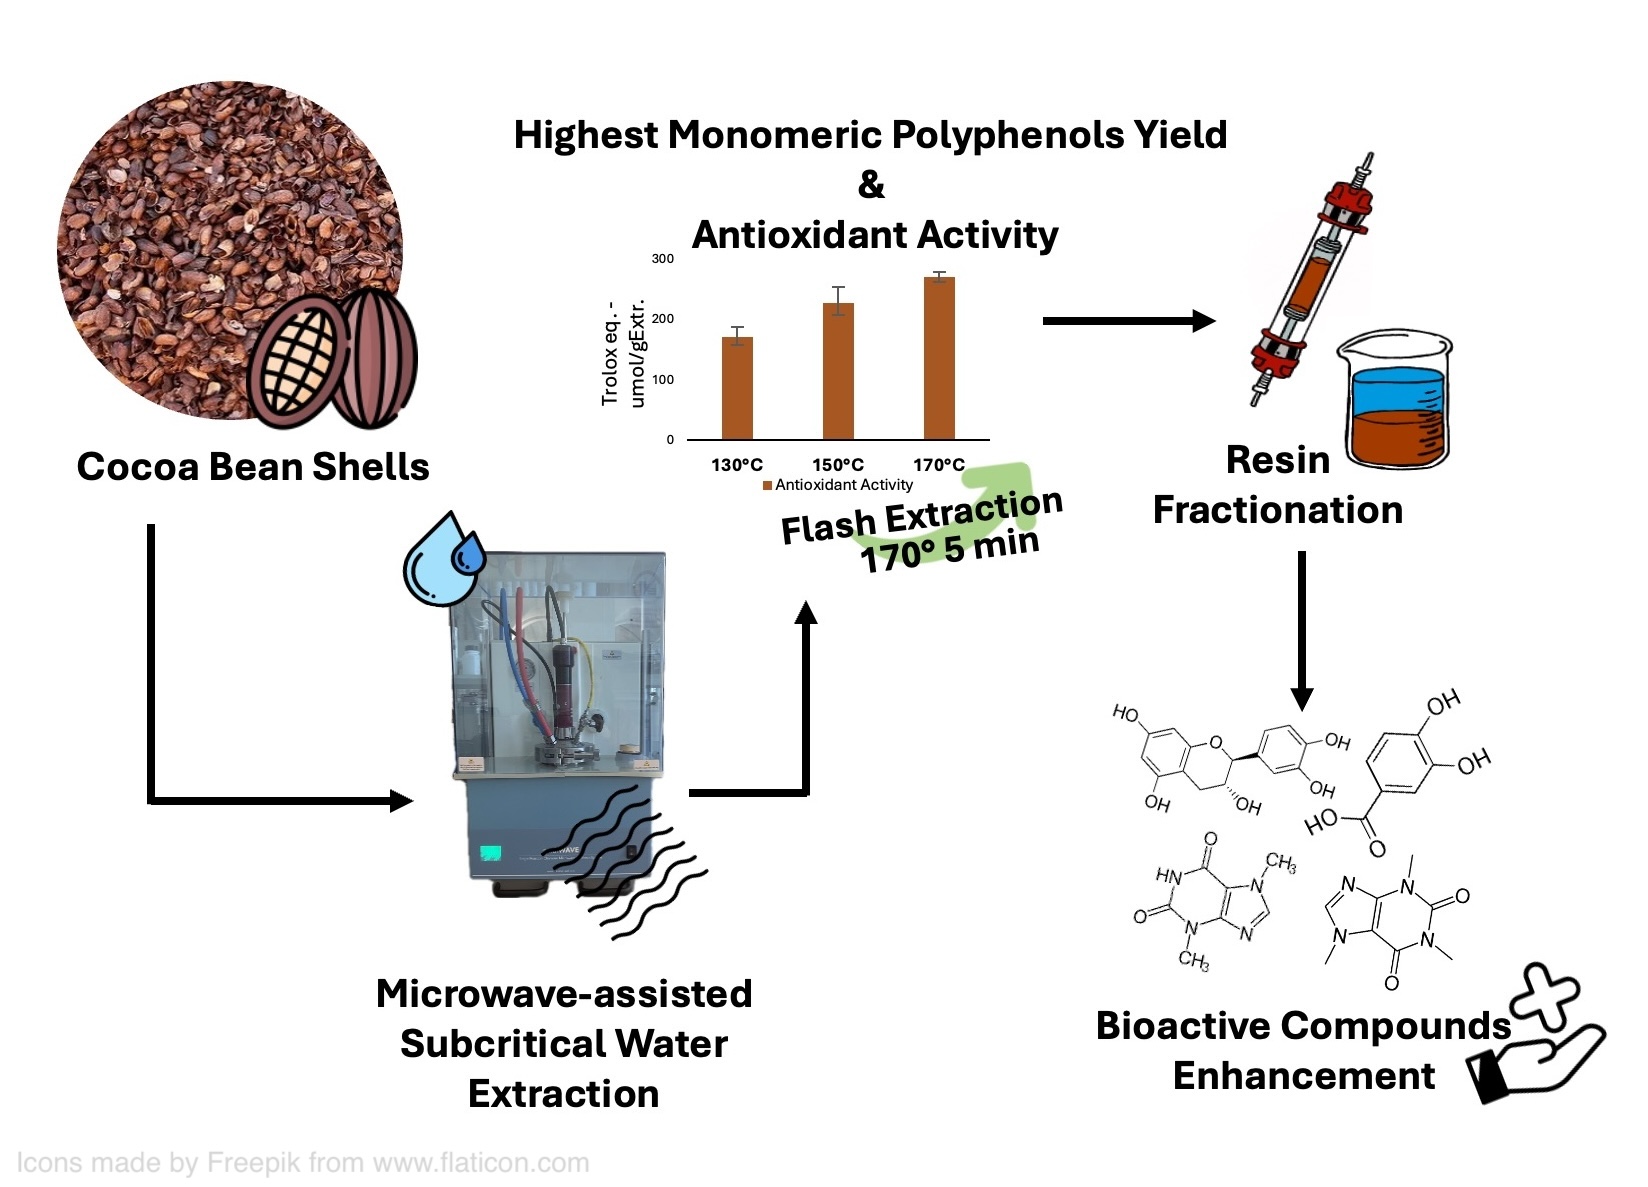
Cocoa bean shells (CBS) represent a significant by-product of the transformation of cocoa beans, constituting approximately 15% of the total cocoa bean weight. Recently, interest in exploring the potential of these shells as a sustainable source of functional ingredients for use in cosmetics and nutraceuticals has grown.
The present study investigates Microwave-Assisted Subcritical Water Extraction (MASWE) as a green and fast technique to recover bioactive compounds from CBS. A flash extraction (five minutes) at 170°C yielded a maximum of 45.79 mg of gallic acid equiva-lents (GAE) per gram of CBS, which was higher than that obtained using conventional conditions (25.73 mgGAE/gCBS with 50% acetone solution). Additionally, the HPLC pro-file of the extract from MASWE revealed a significant increase in hydroxybenzoic acids and catechin, compared to the conventional extract.
Following the optimization of the extraction process, seven distinct resins were examined to isolate a bioactive-enriched fraction: Sepabeads SP700 was found to be the most effec-tive resin for concentrating such compounds, increasing both methylxanthines and TPC selectivity up to 4.2-fold.
This valorization approach integrating MASWE and downstream optimization offers an innovative strategy to recover added-value products in line with green extraction and nutraceutical innovation.
Keywords:
Cocoa Beans Shells
; green extraction
; Microwave Assisted Subcritical Water Extraction
; polyphenols
; theobromine
; catechins
; flavonoids
; bioactive compounds
1. Introduction
Cocoa bean shells (CBS) by-products of the transformation of cocoa (Theobroma cacao L.) beans, are not generated in the country of origin, but rather in the country where the beans undergo industrial treatment. The cocoa shell is removed either before or after roasting; it is estimated that 7,000 tons of CBS are produced worldwide each year [1].
There is now a growing interest in exploring the potential of these shells as a sustainable source of functional ingredients for cosmetic and nutraceutical applications, due to its richness in phenolic compounds, mostly flavan-3-ols, and other bioactive compounds such as methylxanthines [2]. Both catechins and theobromine have proven to be beneficial against either age related or non-age-related memory loss and to metabolic syndromes such as diabetes [3,4,5].
The phenolic compounds present in CBS are originally located in the cotyledons and later migrate to the shells. For this reason, the phenolic population of CBS is mainly composed of monomeric catechins and smaller procyanidins, which are more mobile inside the plant’s tissues [6]. Cocoa bean shells are already employed in the food industry for the purpose of creating infusions or adding aroma to beverages [7]. Their desirable taste and health benefits, as well as their existing use in the food sector [8] render CBS a very interesting source of bioactives for nutraceutical supplements.
Microwave-Assisted Subcritical Water Extraction (MASWE) has proved to be a green and efficient technology to extract value-added compounds from plant biomass, being generally considered safer, cheaper and less environmentally impactful compared to conventional solvent-based methods [9]. Subcritical water is an effective solvent for the extraction of bioactives such as polyphenols due to its dielectric constant, that is closer to ethanol, one of conventionally used solvents for extraction of polyphenols [10]. The characteristics of Subcritical Water Extraction (SWE) can be linked to the considerably fast and homogeneous heating offered by microwave technology, that helps water to quickly reach the subcritical state. This feature enables flash extraction processes at high temperatures, thus minimizing the thermal degradation of bioactives [11,12].
This study investigated the MASWE of CBS, showing that maximum total phenolic content (TPC), antioxidant activity (DPPH•), and catechin monomer yield can be obtained in short time employing rather high temperatures. It was also hypothesized that this process may extract polyphenols that are tightly bound to the cell wall and not extractable with organic solvents and temperatures below 100 °C [13,14]. The best conditions identified were 170 °C for 5 minutes, resulting in a process which is rapid and potentially scalable due to its reduced extraction time. A screening of various conventional protocols was conducted to facilitate a comparative analysis of the phenolic yield and composition. An exhaustive conventional extraction protocol (ECE) was implemented to ascertain the maximum yield obtainable through repetitive conventional extractions with organic solvents.
Following the optimization of the extraction process, seven distinct resins were examined to find the best one for the isolation of a bioactive-enriched fraction.
2. Materials and Methods
2.1. Screening of Conditions
MASWE was performed using a multimodal microwave reactor (SynthWAVE, Milestone S.r.l., Bergamo, Italy) at defined temperatures and under inert gas. The system was continuously stirred throughout the treatment
The tested temperatures were 130, 150 and 170 °C. Solid to liquid ratios of 1:10, 1:15 and 1:20 were investigated; 1 g of biomass was weighed for each extraction.
The experiments were conducted over a specified timescale from 5 to 30 min., with each temperature and solid-to-liquid ratio sampled at five-minute intervals. Each time tested corresponded to a different batch due to the closed design of the SynthWAVE system, which precludes the possibility of sampling during the extraction process.
The following conditions were applied to all processes: the nitrogen pressure was set at 15 bar, the extraction temperature was reached through a five-minute ramp, and the stirring rate was maintained at 60%.
The extracts were then centrifuged at 4200 rpm for 5 minutes and filtered under vacuum. The spent biomass was then washed with 5 mL of deionized water and centrifuged at 4200 rpm for 5 minutes. This process was repeated three times, and the supernatants were filtered. All the liquid fractions were collected and lyophilized and, then stored at -18 °C for further characterization.
2.2. Benchmark Extraction - ECE Protocol
ECE involves the use of methanol/water and acetone/water mixtures preceded by a defatting step in hexane [15]. It should be noted that the procedure involves multiple steps, with each step being repeated twice. The overall extraction time was 20 hours, as outlined in Table 1. The liquid fractions were dried, weighted and refrigerated for further characterization.
2.3. Bound Polyphenols Extraction
The extraction of bound polyphenols was added after the ECE protocol to ensure that the entire polyphenolic fraction contained in cocoa bean shells was extracted. The protocol employed was that of Rebollo-Hernández et al. [16].
The solid residues remained after the extraction of soluble free phenolics were hydrolyzed with 20 mL NaOH (4M) for 1 hour at 25 °C, under continuous shaking. After hydrolysis, the samples were acidified to pH 2 using concentrated HCl, then centrifuged at 4000g for 15 minutes at 4 °C to precipitate both residual biomass and lignin. The resulting supernatant was extracted three times with a diethyl ether:ethyl acetate mixture (50:50, v/v). Finally, the combined organic fractions were evaporated to dryness, weighted and characterized. The polyphenolic fraction derived from this protocol was considered as bound. This step was encountered as the fifth and last step of ECE protocol.
2.4. Conventional Extractions
Conventional extractions were performed to compare the extraction efficacy with MASWE. The solvents used were ethanol-water and acetone-water mixtures, [17].
All extractions were performed at reflux under conventional heating for a duration of 1 hour, employing solvent-to-water ratios of 0:100, 25:75, 50:50, 75:25, and 100:0. The solid-to-liquid ratio was maintained at 1:20, as determined through optimization of the MASWE method. After the extraction, the biomass was filtered under vacuum and thoroughly washed with the extraction solvent; the liquid fraction was dried, weighted and stored at -18 °C for further characterization.
2.5. Total Phenolic Content – Folin-Ciocalteau Test
This analytical technique provides an indication of the selectivity and the yield of polyphenols of the extractable fraction of CBS. The absorbance values of the samples at 725 nm are compared to a calibration curve of gallic acid, employed as a reference in the analysis [18]. Total polyphenols are calculated as equivalents of gallic acid using the regression equation between gallic acid standards and the sample absorbance at λ=725 nm. A sample solution of the extracts was prepared by dissolving 5 to 10 mg of dry extract in deionized water (3 mL). The analytical mixture was prepared by adding the sample solution (0.250 mL), Na2CO3 (10%, 0.500 mL), deionized water (4 mL) and finally the Folin-Ciocalteu reagent solution (0.250 mL, previously prepared by diluting the reagent 1:1 with deionized water). The spectrophotometric scan was performed after 25 minutes, storing the samples at room temperature in the dark. Analyses were carried out in triplicate and reported as average value ± standard deviation (SD). The results are expressed in Gallic Acid Equivalents; the TPC yield as mg GAE/g CBS, and the TPC selectivity as mg GAE/g extract.
2.6. Antioxidant Activity – DPPH• Assay
The antioxidant activity was assessed using the stable free radical 2,2-diphenyl-1-picrylhydrazyl (DPPH•) [19]. A sample solution was prepared by dissolving 1-2 mg of dry extract in deionized water and used to produce five to eight sequential dilutions. The absorbance of a 50% sample solution in methanol was subtracted from the sample (matrix effect) and a solution containing 50% of free radical (A~0.45, λ = 515 nm) in methanol was adopted as a reference (100%). The samples were stored at room temperature in the dark for 20 minutes before the spectrophotometric scan at λ = 515 nm. The inhibition % is defined as per Equation (1):
The IC50 (half maximal inhibiting concentration, concentration of antioxidant compounds that leads to a 50% reduction in DPPH• absorbance) was calculated plotting the %I vs. concentration of the samples using a Probit regression model (Software Bobo Least Squares ver. 0.9.1.) [20]. The standard used was Trolox, and the antioxidant activity was reported as Trolox eq. (μmol TE/g extract). Only regressions with a R2 of 0.97 or higher were considered; the results are reported with the corresponding confidence intervals.
2.7. UPLC-DAD
The chromatographic separation was carried out using an Acquity UPLC BEH C18 column (1.7 µm, 2.1 × 100 mm) to ensure high-resolution separation of the analytes. The mobile phase consisted of two solvents: Phase A, containing 0.5% acetic acid in MilliQ water, and Phase B, containing 0.5% acetic acid in acetonitrile. A flow rate of 0.3 mL/min was maintained throughout the analysis. Each sample was analyzed in duplicate.
The gradient elution was programmed as follows: the initial composition was set at 1% Phase B and held constant for the first 2 minutes. Over the next 18 minutes, the proportion of Phase B was gradually increased to 20%. The gradient continued to rise, reaching 95% Phase B in 40 minutes, and was maintained at this level until 50 minutes. Then, the solvent composition was returned to its initial state of 1% Phase B, and re-equilibration was carried out until 60 minutes to prepare the system for the next injection.
The system incorporated an ISET module (G4220A – Jetweaver V100 Mixer V1.0) and a Multisampler (47129A, 40 µL syringe, V1.0) to mimic the UPLC-Q-TOF-MS/MS for a better comparison with the samples analyzed with UPLC-Q-TOF-MS/MS instrument.
Calibration curves were done with m-hydroxybenzoic acid, theobromine, caffeine, catechin, epicatechin, 3,4-dihydroxyphenylacetic acid and procyanidin B2 purchased from Merck (Darmstadt, Germany).
2.8. UPLC-Q-TOF-MS/MS
The chromatographic separation was performed using an Acquity UPLC BEH C18 column (1.7 µm, 2.1 × 100 mm), the composition of the phases, flow rate and gradient elution was the same as the UPLC-DAD method (Section 2.7).
Mass spectrometric detection was performed using an electrospray ionization (ESI) source, operating in both positive (ESI⁺) and negative (ESI⁻) modes to target different analytes. More specifically, ESI⁺ mode was applied for the detection of theobromine and caffeine and ESI⁻ for the analysis of polyphenols. Each sample was analyzed in duplicate.
The mass spectrometer was operated using a nozzle voltage of 3500 V, a fragmentor voltage of 150 V, the drying gas temperature was set at 200 °C and the sheath gas temperature at 300 °C. These settings were optimized to maximize sensitivity and ionization efficiency while minimizing excessive fragmentation and background noise.
2.9. Batch Screening of Resins
Seven styrene resins were screened to identify the most effective for separating polyphenols from CBS extract (Table 2).
For each resin, 2 g were activated overnight in 100% ethanol to reduce swelling during the process, then conditioned twice for 30 minutes using Milli-Q water acidified to pH 2 with formic acid. The screening was conducted using the MASWE-optimized extract, which was filtered through a 0.2 µm membrane to remove undissolved particles that could interfere with resin separation; the extract was then brought at pH 3 to enhance interactions between the polyphenols and the resin [21]. After conditioning, the resins were isolated by vacuum filtration and transferred into 50 mL Falcon tubes. Each tube received 10 mL of extract, and the mixtures were agitated at 800 rpm for 1 hour using a Heidolph Synthesis 1 (Heidolph Scientific Products GmbH).
Following incubation, the unbound fraction was removed by vacuum filtration. The resins were then washed with Milli-Q water (10 mL) acidified to pH 2 with formic acid for 1 hour under the same agitation conditions. After having removed the wash fraction, the elution was carried out with a 50% ethanol solution, which stirred another 1-hour incubation at 800 rpm. Finally, any remaining bound compounds were eluted with 100% ethanol under identical conditions, followed by vacuum separation.
Resin efficiency was assessed by quantifying the total phenolic content (TPC) in each fraction: the unbound fraction, the 50% ethanol elution (50% EtOH), considered optimal due to its lower solvent requirement, and the 100% ethanol (100% EtOH) fraction, used to remove and study the polyphenolic fraction that was not eluted with 50% EtOH. The aqueous unbound and wash fraction were frequently considered together as unbound+wash, as they represent the fraction who did not interact with the resins. The recovery of selected compounds (quantification of protocatechuic acid, hydroxybenzoic acid, catechin, epicatechin, procyanidin B, theobromine and caffeine) in 50% EtOH fraction as well as the increase of selectivity was also determined with HPLC.
The increase of selectivity (%S) was evaluated using Equation (2):
The TPC or HPLC mass balance (%MB) was calculated using Equation (3):
2.10. Dynamic Adsorption with SP700
SP700 was identified as the optimized resin from the batch test and was consequently utilized for the dynamic adsorption investigation (Figure S2). Eight grams of resin were subjected to activation via an overnight soak in 100% ethanol. Thereafter, the resin was conditioned on consecutive 30-minute cycles using Milli-Q water that had been acidified to a pH of 2 with formic acid. Following these steps, the resin was loaded into an Empty Solid Loader (SepaChrom).
Throughout the duration of the fractionation process, a constant flux of 0.4 milliliters per minute (mL/min) was maintained with a peristaltic pump (Masterflex® L/S® Standard Digital Drives, Avantor®) thereby preserving a rate of 3 bed volumes (BV) per hour.
After conditioning of the column, 40 mL of sample was loaded into the column, acidified to pH 3 with formic acid. The unbound fraction was collected during loading. Subsequent to loading, three bed volumes were utilized to purge the residual unbound compounds from the column. The wash fraction was collected during this step. The elution step was carried out using a 50% ethanol solution, and the bed volumes were meticulously separated and collected until the eluted liquid exhibited a colorless appearance. Subsequently, the column was regenerated with 1 BV of 100% ethanol. The eluate was then evaluated to assess the characteristics of the fraction that remained bound to the column after the elution.
Each fraction collected was dried and weighted, analyzed for TPC and HPLC (the same compounds were monitored as in the batch test). The selectivity enhancement and mass balance were calculated using Equations (2) and (3).
3. Results and Discussion
3.1. Conventional Extractions
3.1.1. Total Phenolic Content (TPC)
The conventional extractions (including ECE) were first performed to compare the results with MASWE. While for ECE only the TPC yield was reported (mg GAE/ g CBS), for conventional extractions both TPC yields and selectivity were considered. As shown in Figure 1, conventional extractions yielded similar results for ethanol and acetone, demonstrating the highest yield and selectivity at solvent concentrations of approximately 50% (v/v), even if a 25% concentration exhibited nearly equivalent values. The extract yield (dw) initially increased for both solvents with increasing solvent concentration up to 50%. Then, it underwent a steep decline, reaching approximately 0.085 g/g without water. In line with these results, higher TPC values were obtained with solvent concentrations of 25-50%, which contradicts previous literature, since it is well known that polyphenols are optimally extracted from plants using mixtures with a higher ethanol or acetone concentration [22]. The observed behavior can be explained with the co-extraction of melanoidins, which are beneficial water-soluble Maillard reaction products that display great antioxidant activity and are also known to bind and incorporate phenolic compounds [23]. The highest TPC yield with ethanol (24.90 ± 0.67 mgGAE/gCBS) is marginally exceeded by that with acetone (25.73 ± 0.45 mgGAE/gCBS). However, this disparity is deemed negligible, considering the precision of the method and the standard deviation.
The TPC selectivity exhibited by extracts in acetone (102.75 ± 1.81 mgGAE/g extract) is higher than that observed for ethanol (92.26 ± 2.49 mgGAE/g extract), which may be attributed to its higher affinity for larger polyphenols, such as oligomeric procyanidins [24] and overall, its less selectivity towards other molecules. All the extractions were not as effective as ECE; using 50% ethanol, it was possible to achieve a yield equal to 80% of that obtained with ECE, while using 50% acetone 82% of ECE yield was reached.
3.1.2. HPLC
The extracts obtained under conventional conditions using water and different solvent-to-water ratios (Figure 2) show some peculiar differences: overall, water-ethanol mixtures seem to extract more procyanidin B, which is in contrast with literature, where acetone was found to better extract procyanidins [25]. Catechin and epicatechin appear to be the only compounds that follow a clear trend and are better extracted using lower percentages of solvent: 25% and 50%, respectively. No clear trend can be observed for all other compounds. The yield of hot water extraction is comparable to that of solvent extraction, which is consistent with the finding that the TPC of hot water extract (represented as 0% solvent in both graphs in Figure 1) was slightly lower compared to 25 and 50% of solvent for both acetone and ethanol.
It is important to note that the extracts obtained with 100% solvent were not included in the HPLC analysis, due to their markedly low TPC and their lower polarity, suggesting that the majority component in that fraction is represented by fats.
Even if the yields among different samples are slightly variable, probably due to the low concentration of the studied compounds, epicatechin clearly seems to be the majoritarian monomeric flavanol, which is in agreement with previous literature [26]. The yield of the screened phenols tends to be equal or lower compared to the ECE protocol. Protocatechuic acid and hydroxybenzoic acid amounts were substantially lower compared to ECE, meaning that they are prone to bind more tightly with the cell wall polysaccharides through esterification bonds and possibly necessitate different steps, including the alkaline extraction, to be fully solubilized [27].
For the extraction of xanthine (Figure 3), increasing the amount of solvent improves the extraction of both theobromine and caffeine. A solvent concentration of 75% was able to extract the highest yield of methylxanthines; there are no differences between 75% acetone and 75% ethanol, affording yields for theobromine and caffeine of ~90% and ~92%, respectively.
3.2. Screening of the Conditions for MASWE Extraction
3.2.1. TPC
As can be observed in Figure 4, the extracted polyphenols are susceptible to thermal degradation if the extraction time is prolonged. The likelihood of observing this phenomenon also increases as the extraction temperature rises.
It is evident that a solid-to-liquid ratio of 1:20 represents the best condition for all the tested temperatures. The highest yield at 150 °C was reached in 10 minutes, while the optimal time at 130 °C was 25 minutes.
However, the highest yield of polyphenols was achieved after a flash five-minutes treatment at 170 °C (45.79 mg GAE/g CBS), thus these conditions have been selected as the optimized ones.
Noteworthy, these conditions yielded the purest extract (Table 3), with a selectivity of 98.36 mg GAE/g extract, which is comparable to the highest selectivity obtained with ethanol (92.26 ± 2.49 mgGAE/g extract) and acetone (102.75 ± 1.81 mgGAE/g extract).
ECE extraction process yielded a total polyphenol yield of 31.16 mg GAE/g CBS, which is comparable to the best result obtained with MASWE at 130 °C (30.32 ± 0.60 mg GAE/g CBS), but lower with respect to other conditions. This discrepancy can be attributed to the fact that higher temperatures (150 and 170 °C) have been shown to disrupt the lignocellulosic matrix more efficiently, as the temperatures (and pressure) employed in this study for MASWE are comparable to those used in steam explosion processes, which typically range from 160 to 260 °C [28].
Enhanced disruption of lignocellulosic biomass could lead to the solubilization and further degradation of cellulose and lignin, releasing the tightly bound flavan-3-ols [14]. The difference in the total phenolic content (TPC) of extracts from MASWE and ECE could be further explained by the fact that the latter includes an alkaline treatment without an inert atmosphere at low temperature (meaning a high oxygen solubility inside the extraction liquid), which could have caused the oxidation of some of the extracted polyphenols. Furthermore, White et al. [29] reported higher yields of procyanidins when the alkaline extraction was carried out at 60 °C, suggesting that the extraction at room temperature may not have been exhaustive. Moreover, the presence of products derived from the extraction and depolymerization of lignin may have contributed to raising the TPC value in the MASWE extracts. In ECE protocol (step 5), alkaline treatment also promoted delignification, followed by its separation by precipitation at acidic pH. This could have lowered the TPC of the supernatant, since lignin is an oligomer composed of polyphenol-like molecules that are active in Folin-Ciocalteu test, as observed for lignin obtained through alkaline delignification of grape stalks [10]. Furthermore, co-extraction of melanoidins, which are primarily water-soluble, could help to explain why the TPC is higher in aqueous extracts than in ECE extracts [30].
3.2.2. Antioxidant Activity (DPPH•)
The antioxidant activity test was performed to ascertain whether the polyphenols quantified through TPC analysis retained their antioxidant capacity following high-temperature extraction. The antioxidant activity was measured on the best extracts (in terms of TPC) obtained for each temperature. As shown in Figure 5, the treatment at 170 °C for 5 minutes was the most effective to recover the highest amount of polyphenols with the highest antioxidant activity, compared to the other conditions. This result confirmed the highest selectivity observed with the TPC assay.
3.2.3. HPLC
The MASWE extraction method was found to be remarkably effective in extracting catechin, exhibiting a significantly higher yield than epicatechin (Figure 6).
This is the opposite of the trend seen with ECE and conventional extraction, and can be attributed to epicatechin undergoing epimerization into catechin at high temperatures, a process facilitated by increased steric hindrance at these temperatures. In a study by De Taeye et al. [31], it was observed that after an incubation of three hours at 90 °C, the epimerization of catechin and epicatechin reached an equilibrium, resulting in a final ratio that favored catechin, with a proportion of approximately 70:30. This finding is analogous to the ratios observed for MASWE at 130, 150, and 170 °C, which were, respectively, 59:41, 69:31, and 74:26, all in favor of catechin. It can be hypothesized that high temperatures accelerate the attainment of equilibrium by the two stereoisomers. For this reason, it is advantageous to consider the two stereoisomers together when evaluating extraction efficiency. Through this approach, it can be observed that the highest catechin + epicatechin yield was obtained at 150 °C and was ~ 0.39 mg/g CBS, whereas treatments at 130 and 170 °C afforded 0.28 and 0.33 mg/g CBS, respectively.
It can also be observed that almost all the compounds screened, except epicatechin and procyanidin B2, exhibited an increase in concentration proportional to the extraction temperature. It can be suggested that monomeric flavanols, such as catechin and epicatechin, originate from the breakdown of oligomeric procyanidins [32]. The conversion of polyphenols into smaller derivatives has been already linked to an enhancement in antioxidant activity. This behavior was investigated during both thermal [33] and microbial degradation [34], and was explained by an increase of bioavailability and a faster reaction kinetic due to the smaller size of the degradation products.
Moreover, smaller phenolic acids such as protocatechuic acid, hydroxybenzoic acid and dihydroxyphenylacetic acid probably derive from the thermal degradation of flavan-3-ols. Lin et al. observed the formation of hydroxybenzoic acids following thermal degradation of flavonols, a distinct but similar category to flavanols [35]: the authors also reported degradation reactions such as dihydroxylation and C-ring cleavage, which is a behavior that can also be postulated for the flavanols extracted from CBS sample during thermal degradation.
Lin et al. also reported that the degradation products that they observed were active substances with excellent antioxidant activity; this enhancement in antioxidant activity brought by degradation products could further explain the enhancement observed for CBS extracts with temperature increase. Chen et al. reported that microwave-assisted extraction at high temperatures yielded more monomeric catechins than conventional extraction, and the resulting extract was more bioavailable compared to the conventional extract, which was mainly composed by condensed tannins [36].
Xanthine extraction was slightly more efficient at temperatures higher than 130 °C. The maximum yield obtained for theobromine and caffeine extraction was, respectively, 85% and 73% of the benchmark quantified with ECE protocol (Figure 7). Unsurprisingly, hot water extraction is less efficient for methylxanthines compared to solvent-aided extraction. A degradation of theobromine was already observed when roasting temperature of 150 °C was maintained for more than 10 minutes [37], and caffeine was found to degrade at 146 °C by the evaluation of coffee grounds with thermogravimetric analysis; however, the level of moisture and the pressure of MASWE protocol could accelerate the process [38].
4. Resin Fractionation
4.1. Batch Screening
For the batch screening, only non-ionic polymeric resins were used as they were found to be the best performing in polyphenols enrichment [39]. Moreover, for anionic exchange resin, the sample needs to be either at neutral or basic pH, and flavan-3-ols are known to be unstable at pH > 6 [40].
Batch screening was performed to evaluate the performance of different resins in obtaining an enriched bioactive fraction. This revealed that resins XAD4, MN200 and SP207 adsorbed polyphenols too tightly, failing to fully desorb the polyphenols they had previously adsorbed. This translates into a mass balance that does not reach 100%, as observed in Figure 8. SP700 was found to be the best performing resin, with the lowest percentage of polyphenols found in the unbound+wash fraction and the highest percentage eluted in the one containing 50% ethanol.
The XAD1180N and the HP20SS demonstrated similar performance in the 50% ethanol fraction. However, more than 20% of the polyphenols were eluted in the unbound and wash fractions. This loss of phenolic compounds in the aqueous fraction reduces their efficiency in producing an enriched polyphenol fraction during ethanol elution.
XAD16 showed a behavior closely resembling that of SP700 when considering the unbound+wash fraction and two ethanolic fractions (50% and 100% EtOH) combined. Specifically, SP700 yielded 14.66% GAE and 84.58% GAE in the unbound+wash and the 50% + 100% ethanol fractions, respectively, while XAD16 yielded 15.61% GAE in the aqueous fraction and 85.32% GAE in the ethanolic one. However, XAD16 released approximately 4% more polyphenols in the 100% ethanol fraction, thus increasing solvent consumption and making the process less cost-effective. The enhanced capacity in the concentration of antioxidants displayed by XAD16 and SP700 can be attributed to the higher pore volume of the two resins, which enables them to bind molecules with a higher molecular weight, such as melanoidins — compounds that interact with the Folin-Ciocalteu reagent. [41].
It is evident from Table 4 that the polymeric resins displayed similar behavior, as expected from resins that have similar characteristics. SP207, MN200 showed the lowest TPC selectivity in the unbound and wash fraction. During ethanol elution, their values were comparable to, if not inferior to, those of the other resins. The two highest selectivity values in 50% ethanol fraction were displayed by XAD4 and SP700 and the highest one for 100% ethanol was observed for SP700 and MN200.
Overall, SP700 resulted the best performing resin for both the quantity and the quality of the polyphenolic eluates. This promising behavior can be explained by higher surface area and pore volume compared to other resins screened. Indeed, pore dimensions and surface area were found to be crucial for flavan-3-ols enrichment [42]. SP700 is also characterized by a different chemical structure, as it is constituted of ethyl vinylbenzene–DVB (Table 2). The elected resin was already used to recover phenols from autohydrolysis liquors of barley husks [43] and to separate phenolic monomers derived from lignin depolymerization [44].
The single compound selectivity enhancement was evaluated for protocatechuic acid, hydroxybenzoic acid, catechin, epicatechin and procyanidin B2 as model phenolic compounds and for theobromine and caffeine as methylxanthines (Table 5).
All the compounds were concentrated at least two-fold, with protocatechuic acid being enriched almost five-fold compared to its original concentration in the MASWE extract. The results of the single compounds are higher compared to the ones observed in TPC selectivity; this is probably due to the fact that Folin-Ciocalteu assay quantifies the total phenolic compounds and different compounds respond differently to the assay. Moreover, other compounds present in the extract could be revealed by Folin-Ciocalteu assay. Meanwhile, HPLC quantification provides a more precise measurement of individual compounds.
4.2. Dynamic Fractionation
Since SP700 has been the best performing resin in the batch evaluation, it was chosen to perform the test on polyphenols elution as a proof-of-concept.
As shown in Figure 9, the unbound+wash fraction contained 8% of the total phenolic content of the initial sample, which represents a significant improvement compared to the batch test. This enhanced retention can be attributed to the increased contact efficiency between the sample and the resin within the packed column.
Regarding mass distribution (fraction dw/crude extract dw), the unbound+wash fractions accounted for 72.10% of the total sample weight. Fractions BV1–3 represented 24.44%, BV4–6 0.56%, while the 100% ethanol wash step eluted 0.63% of the total sample weight. The overall mass balance of the process was 98%.
Most polyphenols (86.62% GAE) were eluted within BV1-2, an additional 2.52% in BV3. BV4-6 and 100% EtOH altogether eluted 2.88% of mgGAE present in the crude extract.
Within the first three BVs, the mass balance of the compounds quantified with HPLC reached 100%, except for protocatechuic acid (95%), catechin (82%), and epicatechin (99%). HPLC analysis (Figure S1) confirmed that most polyphenols were eluted within the first two BVs, with BV2 eluting the highest percentage (a mean of ~59%) of the single compounds monitored, whereas BV1 eluted ~27% and BV3 ~14%.
These findings indicate that the phenolics detected in fractions BV4-6 and 100% EtOH are different from the six ones quantified by HPLC, and probably more apolar, thus interacting more strongly with the resin.
The TPC selectivity enhancement was 329%, 420% and 255% for BV1, BV2 and BV3, respectively. The single compound selectivity enhancement is illustrated in Table 6. It’s noticeable that the enrichment is much higher in dynamic fractionation compared to the batch process in terms of either TPC results or selectivity enhancement. BV2 and BV3 exhibited the greatest selectivity enhancement for all the compounds.
5. Conclusions
In this study, an efficient protocol for the extraction of bioactive compounds from CBS using microwave technology and the subcritical water as green solvent was described. The extractions under optimized conditions (170 °C, 5 min) afforded a yield of 45.78 mg GAE/g CBS as well as the highest selectivity (98.36 mg GAE/g extract).
In all cases, MASWE demonstrated superiority over conventional protocols in terms of TPC recovery. The efficacy of MASWE was confirmed by HPLC, which revealed that the concentration of catechin monomers within the extract was markedly higher than that of conventional extracts. Additionally, a substantial enhancement of hydroxybenzoic acids was associated with the increase of extraction temperature: this is probably due to the enhanced extraction of bound polyphenols coupled with the hydrolysis of larger procyanidins which are tightly bound to the lignocellulosic biomass. [30,31].
On the contrary, theobromine and caffeine tend to be extracted optimally with solvents and with a lower yield in MASWE, probably due to thermal degradation.
A screening among different non-ionic polymeric resins found that Sepabeads SP700 was the most effective one for recovering cocoa phenolic compounds. In batch tests, it released 60% of the phenolic content during elution with 50% ethanol and an additional 24% during the 100% ethanol washing step, increasing selectivity three-fold and six-fold, respectively.
The dynamic adsorption on SP700 successfully fractionated the polyphenols, eluting 88.39% mgGAE within the first three bed volumes (BV). Owing to its particle size characteristics, SP700 is expected to be efficient for further scale-up. However, breakthrough experiments and further process optimization are still needed to improve the selectivity of the enriched polyphenolic fraction and to reduce ethanol consumption.
Supplementary Materials
The following supporting information can be downloaded at: Preprints.org, Figure S1: Chromatograms of crude extract and the first 3 bed volumes of the dynamic fractionation; Figure S2: Set up for the dynamic adsorption experiments.
Author Contributions
Conceptualization, G.C. and S.T.; methodology, S.T and C:V.; validation, L.B.; formal analysis, C.V; investigation, C.V., S.T; resources, G.C..; data curation, L.B., C.V.; writing—original draft preparation, C.V..; writing—review and editing, S.T. and G.C..; visualization, S.T.; supervision, G.C..; resources: R.S.; funding acquisition, G.C. All authors have read and agreed to the published version of the manuscript.
Funding
This work was supported by the University of Turin (Ricerca Locale 2023).
Data Availability Statement
The data underlying this study are available in the published article and its Supporting Information.
Acknowledgments
The authors are grateful to Gnosis by Lesaffre for their technical support.
Conflicts of Interest
The authors declare no conflicts of interest.
Abbreviations
The following abbreviations are used in this manuscript:
| CBS | Cocoa Bean Shell |
| MASWE | Microwave Assisted Subcritical Water Extraction |
| TPC | Total Phenolic Count |
| DPPH | 2,2-diphenyl-1-picrylhydrazyl |
| ECE | Exhaustive Conventional Extraction |
| BV | Bed Volume |
| ESI | Electrospray Ionization |
| 50% EtOH | 50% Ethanol fraction |
| 100% EtOH | 100% Ethanol fraction |
| GAE | Gallic Acid Equivalents |
| dw | Dry Weight |
References
- Okiyama, D.C.G.; Navarro, S.L.B.; Rodrigues, C.E.C. Cocoa Shell and Its Compounds: Applications in the Food Industry. Trends Food Sci Technol 2017, 63, 103–112. [CrossRef]
- Balentic, J.P.; Ačkar, Đ.; Jokic, S.; Jozinovic, A.; Babic, J.; Miličevic, B.; Ubaric, D.; Pavlovic, N. Cocoa Shell: A by-Product with Great Potential for Wide Application. Molecules 2018, 23. [CrossRef]
- Zhang, M.; Zhang, H.; Jia, L.; Zhang, Y.; Qin, R.; Xu, S.; Mei, Y. Health Benefits and Mechanisms of Theobromine. J Funct Foods 2024, 115. [CrossRef]
- Martínez-Pinilla, E.; Oñatibia-Astibia, A.; Franco, R. The Relevance of Theobromine for the Beneficial Effects of Cocoa Consumption. Front Pharmacol 2015, 6. [CrossRef]
- Patanè, G.T.; Putaggio, S.; Tellone, E.; Barreca, D.; Ficarra, S.; Maffei, C.; Calderaro, A.; Laganà, G. Catechins and Proanthocyanidins Involvement in Metabolic Syndrome. Int J Mol Sci 2023, 24. [CrossRef] [PubMed]
- Mariatti, F.; Gunjević, V.; Boffa, L.; Cravotto, G. Process Intensification Technologies for the Recovery of Valuable Compounds from Cocoa By-Products. Innovative Food Science and Emerging Technologies 2021, 68. [CrossRef]
- Cantele, C.; Rojo-Poveda, O.; Bertolino, M.; Ghirardello, D.; Cardenia, V.; Barbosa-Pereira, L.; Zeppa, G. In Vitro Bioaccessibility and Functional Properties of Phenolic Compounds from Enriched Beverages Based on Cocoa Bean Shell. Foods 2020, Vol. 9, Page 715 2020, 9, 715. [CrossRef] [PubMed]
- Sánchez, M.; Laca, A.; Laca, A.; Díaz, M. Cocoa Bean Shell: A By-Product with High Potential for Nutritional and Biotechnological Applications. Antioxidants 2023, Vol. 12, Page 1028 2023, 12, 1028. [CrossRef] [PubMed]
- Somat, H.A.; Thani, N.M.; Mustapha, W.A.W.; Lim, S.J.; Seng, N.S.S.; Rahman, H.A.; Razali, N.S.M.; Ali, M.M.; Kamal, S.M.M. Subcritical Water Extraction of Bioactive Compounds from Plant Materials: Recent Advances. Journal of Future Foods 2025. [CrossRef]
- Valle, C.; Grillo, G.; Calcio Gaudino, E.; Ponsetto, P.; Mazzoli, R.; Bonavita, G.; Vitale, P.; Pessione, E.; Garcia-Moruno, E.; Costantini, A.; et al. Grape Stalks Valorization towards Circular Economy: A Cascade Biorefinery Strategy. ChemSusChem 2025, e202402536. [CrossRef]
- Gallina, L.; Cravotto, C.; Capaldi, G.; Grillo, G.; Cravotto, G. Plant Extraction in Water: Towards Highly Efficient Industrial Applications. Processes 2022, Vol. 10, Page 2233 2022, 10, 2233. [CrossRef]
- Zhang, J.; Wen, C.; Zhang, H.; Duan, Y.; Ma, H. Recent Advances in the Extraction of Bioactive Compounds with Subcritical Water: A Review. Trends Food Sci Technol 2020, 95, 183–195. [CrossRef]
- Mikucka, W.; Zielinska, M.; Bulkowska, K.; Witonska, I. Subcritical Water Extraction of Bioactive Phenolic Compounds from Distillery Stillage. J Environ Manage 2022, 318, 115548. [CrossRef]
- Zhang, B.; Zhang, Y.; Li, H.; Deng, Z.; Tsao, R. A Review on Insoluble-Bound Phenolics in Plant-Based Food Matrix and Their Contribution to Human Health with Future Perspectives. Trends Food Sci Technol 2020, 105, 347–362. [CrossRef]
- Nollet, L.M.L.; Toldra, F. Handbook of Analysis of Active Compounds in Functional Foods; Taylor&Francis, 2012;
- Rebollo-Hernanz, M.; Cañas, S.; Taladrid, D.; Segovia, Á.; Bartolomé, B.; Aguilera, Y.; Martín-Cabrejas, M.A. Extraction of Phenolic Compounds from Cocoa Shell: Modeling Using Response Surface Methodology and Artificial Neural Networks. Sep Purif Technol 2021, 270, 118779. [CrossRef]
- Brglez Mojzer, E.; Knez Hrnčič, M.; Škerget, M.; Knez, Ž.; Bren, U. Polyphenols: Extraction Methods, Antioxidative Action, Bioavailability and Anticarcinogenic Effects. Molecules 2016, Vol. 21, Page 901 2016, 21, 901. [CrossRef]
- Singleton, V.L.; Orthofer, R.; Lamuela-Raventós, R.M. [14] Analysis of Total Phenols and Other Oxidation Substrates and Antioxidants by Means of Folin-Ciocalteu Reagent. Methods Enzymol 1999, 299, 152–178. [CrossRef]
- Brand-Williams, W.; Cuvelier, M.E.; Berset, C. Use of a Free Radical Method to Evaluate Antioxidant Activity. LWT - Food Science and Technology 1995, 28, 25–30. [CrossRef]
- Locatelli, M.; Gindro, R.; Travaglia, F.; Coïsson, J.D.; Rinaldi, M.; Arlorio, M. Study of the DPPH-Scavenging Activity: Development of a Free Software for the Correct Interpretation of Data. Food Chem 2009, 114, 889–897. [CrossRef]
- Zhong, J.L.; Muhammad, N.; Gu, Y.C.; Yan, W.D. A Simple and Efficient Method for Enrichment of Cocoa Polyphenols from Cocoa Bean Husks with Macroporous Resins Following a Scale-up Separation. J Food Eng 2019, 243, 82–88. [CrossRef]
- Oreopoulou, A.; Tsimogiannis, D.; Oreopoulou, V. Extraction of Polyphenols From Aromatic and Medicinal Plants: An Overview of the Methods and the Effect of Extraction Parameters. Polyphenols in Plants 2019, 243–259. [CrossRef]
- Martínez-Inda, B.; Jiménez-Moreno, N.; Esparza, I.; Ancín-Azpilicueta, C. Coffee and Cocoa By-Products as Valuable Sources of Bioactive Compounds: The Influence of Ethanol on Extraction. Antioxidants 2025, 14, 42. [CrossRef]
- Lazarus, S.A.; Adamson, G.E.; Hammerstone, J.F.; Schmitz, H.H. High-Performance Liquid Chromatography/Mass Spectrometry Analysis of Proanthocyanidins in Foods and Beverages. J Agric Food Chem 1999, 47, 3693–3701. [CrossRef] [PubMed]
- Klavins, L.; Perkons, I.; Mezulis, M.; Viksna, A.; Klavins, M. Procyanidins from Cranberry Press Residues—Extraction Optimization, Purification and Characterization. Plants 2022, 11, 3517. [CrossRef]
- Andres-Lacueva, C.; Monagas, M.; Khan, N.; Izquterdo-Pulido, M.; Urpi-Sarda, M.; Permanyer, J.; Lamuela-Raventós, R.M. Flavanol and Flavonol Contents of Cocoa Powder Products: Influence of the Manufacturing Process. J Agric Food Chem 2008, 56, 3111–3117. [CrossRef]
- Carboni Martins, C.; Rodrigues, R.C.; Domeneghini Mercali, G.; Rodrigues, E. New Insights into Non-Extractable Phenolic Compounds Analysis. Food Research International 2022, 157, 111487. [CrossRef] [PubMed]
- Hoang, A.T.; Nguyen, X.P.; Duong, X.Q.; Ağbulut, Ü.; Len, C.; Nguyen, P.Q.P.; Kchaou, M.; Chen, W.H. Steam Explosion as Sustainable Biomass Pretreatment Technique for Biofuel Production: Characteristics and Challenges. Bioresour Technol 2023, 385, 129398. [CrossRef] [PubMed]
- White, B.L.; Howard, L.R.; Prior, R.L. Release of Bound Procyanidins from Cranberry Pomace by Alkaline Hydrolysis. J Agric Food Chem 2010, 58, 7572–7579. [CrossRef] [PubMed]
- Kitchen, B.; Williamson, G. Melanoidins and (Poly)Phenols: An Analytical Paradox. Curr Opin Food Sci 2024, 60, 101217. [CrossRef]
- De Taeye, C.; Kankolongo Cibaka, M.L.; Jerkovic, V.; Collin, S. Degradation of (-)-Epicatechin and Procyanidin B2 in Aqueous and Lipidic Model Systems. First Evidence of “Chemical” Flavan-3-Ol Oligomers in Processed Cocoa. J Agric Food Chem 2014, 62, 9002–9016. [CrossRef]
- Zhang, J.; Liu, D.; Wang, A.; Cheng, L.; Wang, W.; Liu, Y.; Ullah, S.; Yuan, Q. Production of Oligomeric Procyanidins by Mild Steam Explosion Treatment of Grape Seeds. Bioresour Bioprocess 2021, 8, 1–12. [CrossRef]
- Ávila, F.; Martinez, N.; Mora, N.; Márquez, K.; Jiménez-Aspee, F. Effect of Thermal Treatment on the Extraction and Antioxidant and Antiglycation Activities of (Poly)Phenols from Ribes Magellanicum. Molecules 2025, 30, 318. [CrossRef]
- Chen, W.; Zhu, X.; Lu, Q.; Zhang, L.; Wang, X.; Liu, R. C-Ring Cleavage Metabolites of Catechin and Epicatechin Enhanced Antioxidant Activities through Intestinal Microbiota. Food Research International 2020, 135, 109271. [CrossRef]
- Lin, S.; Simal-Gandara, J.; Cao, H.; Xiao, J. The Stability and Degradation Products of Polyhydroxy Flavonols in Boiling Water. Curr Res Food Sci 2023, 6, 100509. [CrossRef]
- Chen, J.; Thilakarathna, W.P.D.W.; Astatkie, T.; Rupasinghe, H.P.V. Optimization of Catechin and Proanthocyanidin Recovery from Grape Seeds Using Microwave-Assisted Extraction. Biomolecules 2020, 10. [CrossRef] [PubMed]
- Hermund, D.B.; Larsen, L.K.; Trangbæk, S.R.; Madsen, Q.K.R.M.T.; Sørensen, A.D.M.; Kaya, J.; Jacobsen, C. Fate of Flavonoids and Theobromine in Cocoa Beans during Roasting: Effect of Time and Temperature. J Am Oil Chem Soc 2025, 102, 35–45. [CrossRef]
- Grzelczyk, J.; Fiurasek, P.; Kakkar, A.; Budryn, G. Evaluation of the Thermal Stability of Bioactive Compounds in Coffee Beans and Their Fractions Modified in the Roasting Process. Food Chem 2022, 387, 132888. [CrossRef] [PubMed]
- Pinelli, D.; Molina Bacca, A.E.; Kaushik, A.; Basu, S.; Nocentini, M.; Bertin, L.; Frascari, D. Batch and Continuous Flow Adsorption of Phenolic Compounds from Olive Mill Wastewater: A Comparison between Nonionic and Ion Exchange Resins. International Journal of Chemical Engineering 2016, 2016. [CrossRef]
- Ananingsih, V.K.; Sharma, A.; Zhou, W. Green Tea Catechins during Food Processing and Storage: A Review on Stability and Detection. Food Research International 2013, 50, 469–479. [CrossRef]
- Oracz, J.; Lewandowska, U.; Owczarek, K.; Caban, M.; Rosicka-Kaczmarek, J.; Żyżelewicz, D. Isolation, Structural Characterization and Biological Activity Evaluation of Melanoidins from Thermally Processed Cocoa Beans, Carob Kibbles and Acorns as Potential Cytotoxic Agents. Food Chem 2024, 442, 138423. [CrossRef]
- Beeler, N.; Hühn, T.; Rohn, S.; Colombi, R. Purification of Flavonoids from an Aqueous Cocoa (Theobroma Cocoa L.) Extract Using Macroporous Adsorption Resins. Molecules 2025, 30. [CrossRef] [PubMed]
- Conde, E.; Moure, A.; Domínguez, H. Recovery of Phenols from Autohydrolysis Liquors of Barley Husks: Kinetic and Equilibrium Studies. Ind Crops Prod 2017, 103, 175–184. [CrossRef]
- Rios, A.G.; Costa, C.A.E.; Ribeiro, A.M.; Rodrigues, A.E.; Ferreira, A.F.P. Competitive Adsorption of Vanillin, Vanillic Acid, and Acetovanillone onto SP700 Resin. J Chem Eng Data 2024, 69, 3660–3667. [CrossRef]
- Soares, I.D.; Cirilo, M.E.M.; Junqueira, I.G.; Vanin, F.M.; Rodrigues, C.E. da C. Production of Cookies Enriched with Bioactive Compounds through the Partial Replacement of Wheat Flour by Cocoa Bean Shells. Foods 2023, 12. [CrossRef]
- Cantele, C.; Rojo-Poveda, O.; Bertolino, M.; Ghirardello, D.; Cardenia, V.; Barbosa-Pereira, L.; Zeppa, G. In Vitro Bioaccessibility and Functional Properties of Phenolic Compounds from Enriched Beverages Based on Cocoa Bean Shell. Foods 2020, 9. [CrossRef]
Figure 1.
Total phenolic content at different concentrations of acetone and ethanol.
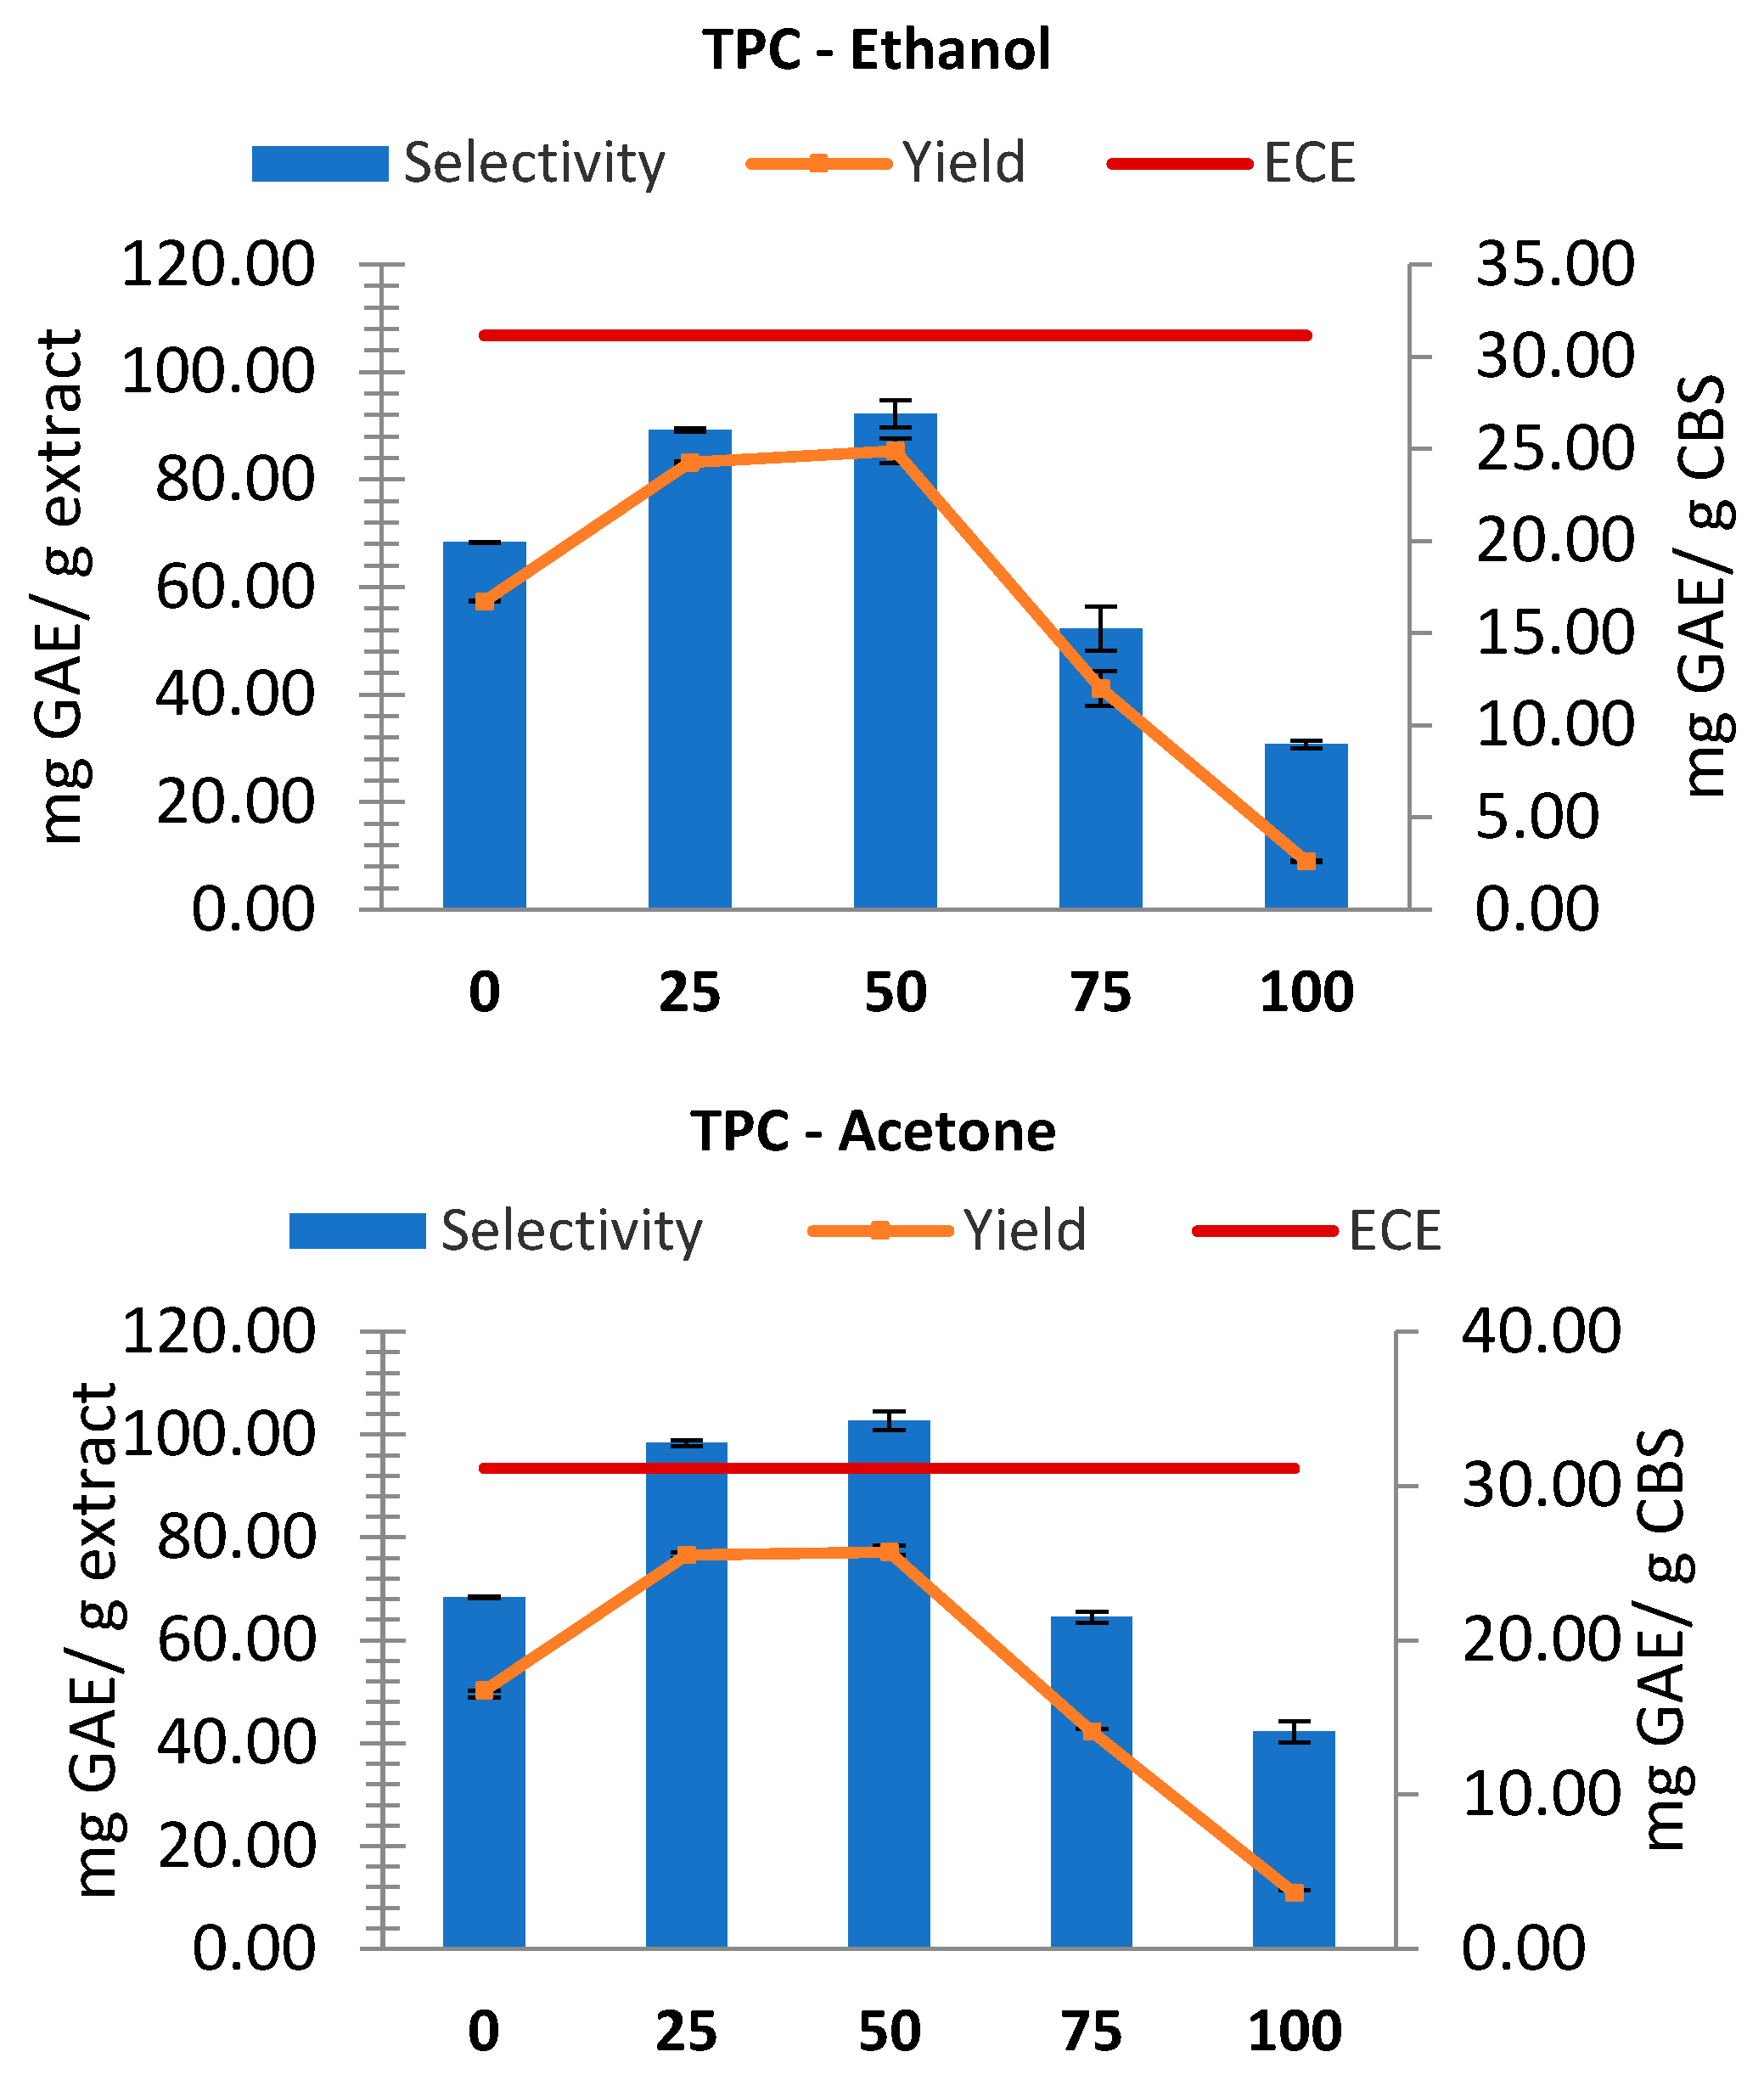
Figure 2.
Comparison of polyphenols yield between ECE protocol and conventional extractions.
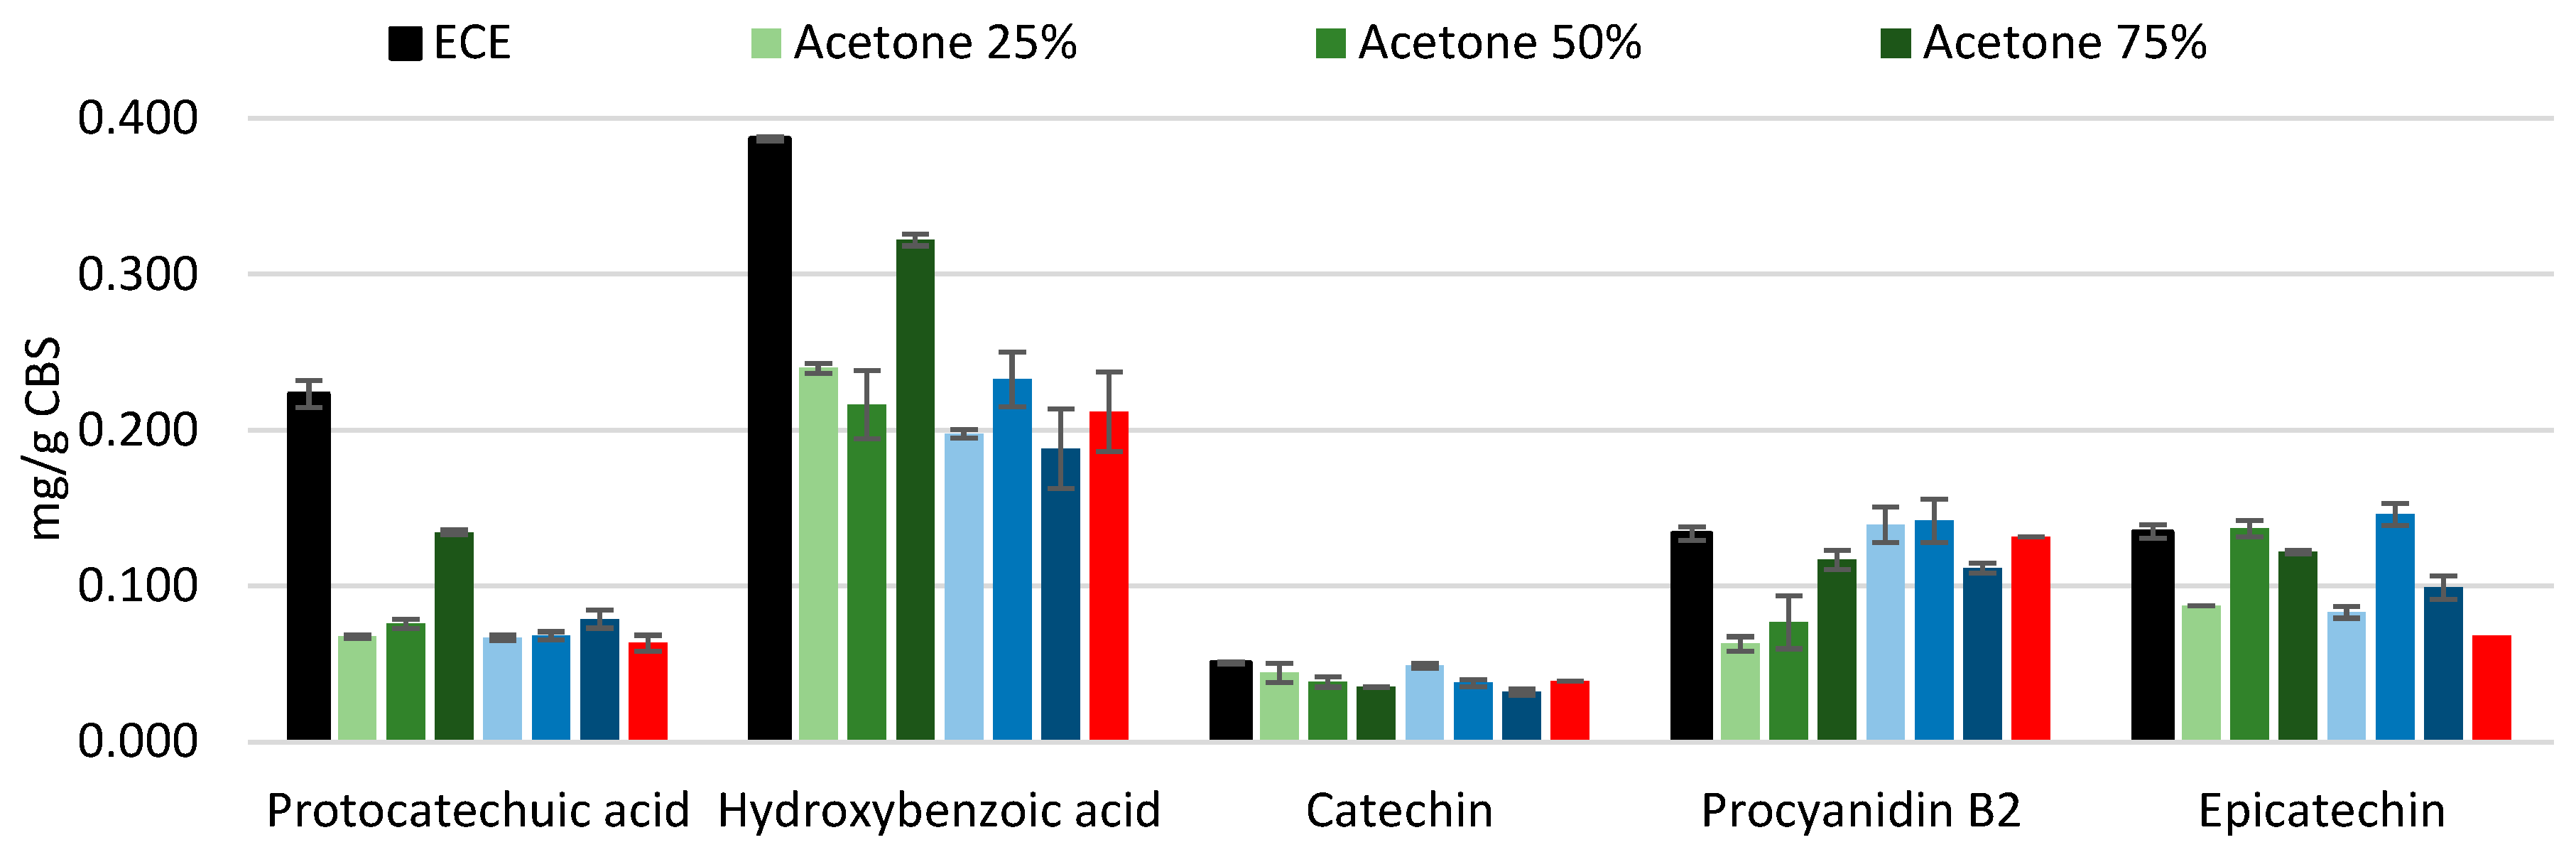
Figure 3.
Comparison of xanthines yield between ECE protocol and conventional extractions.
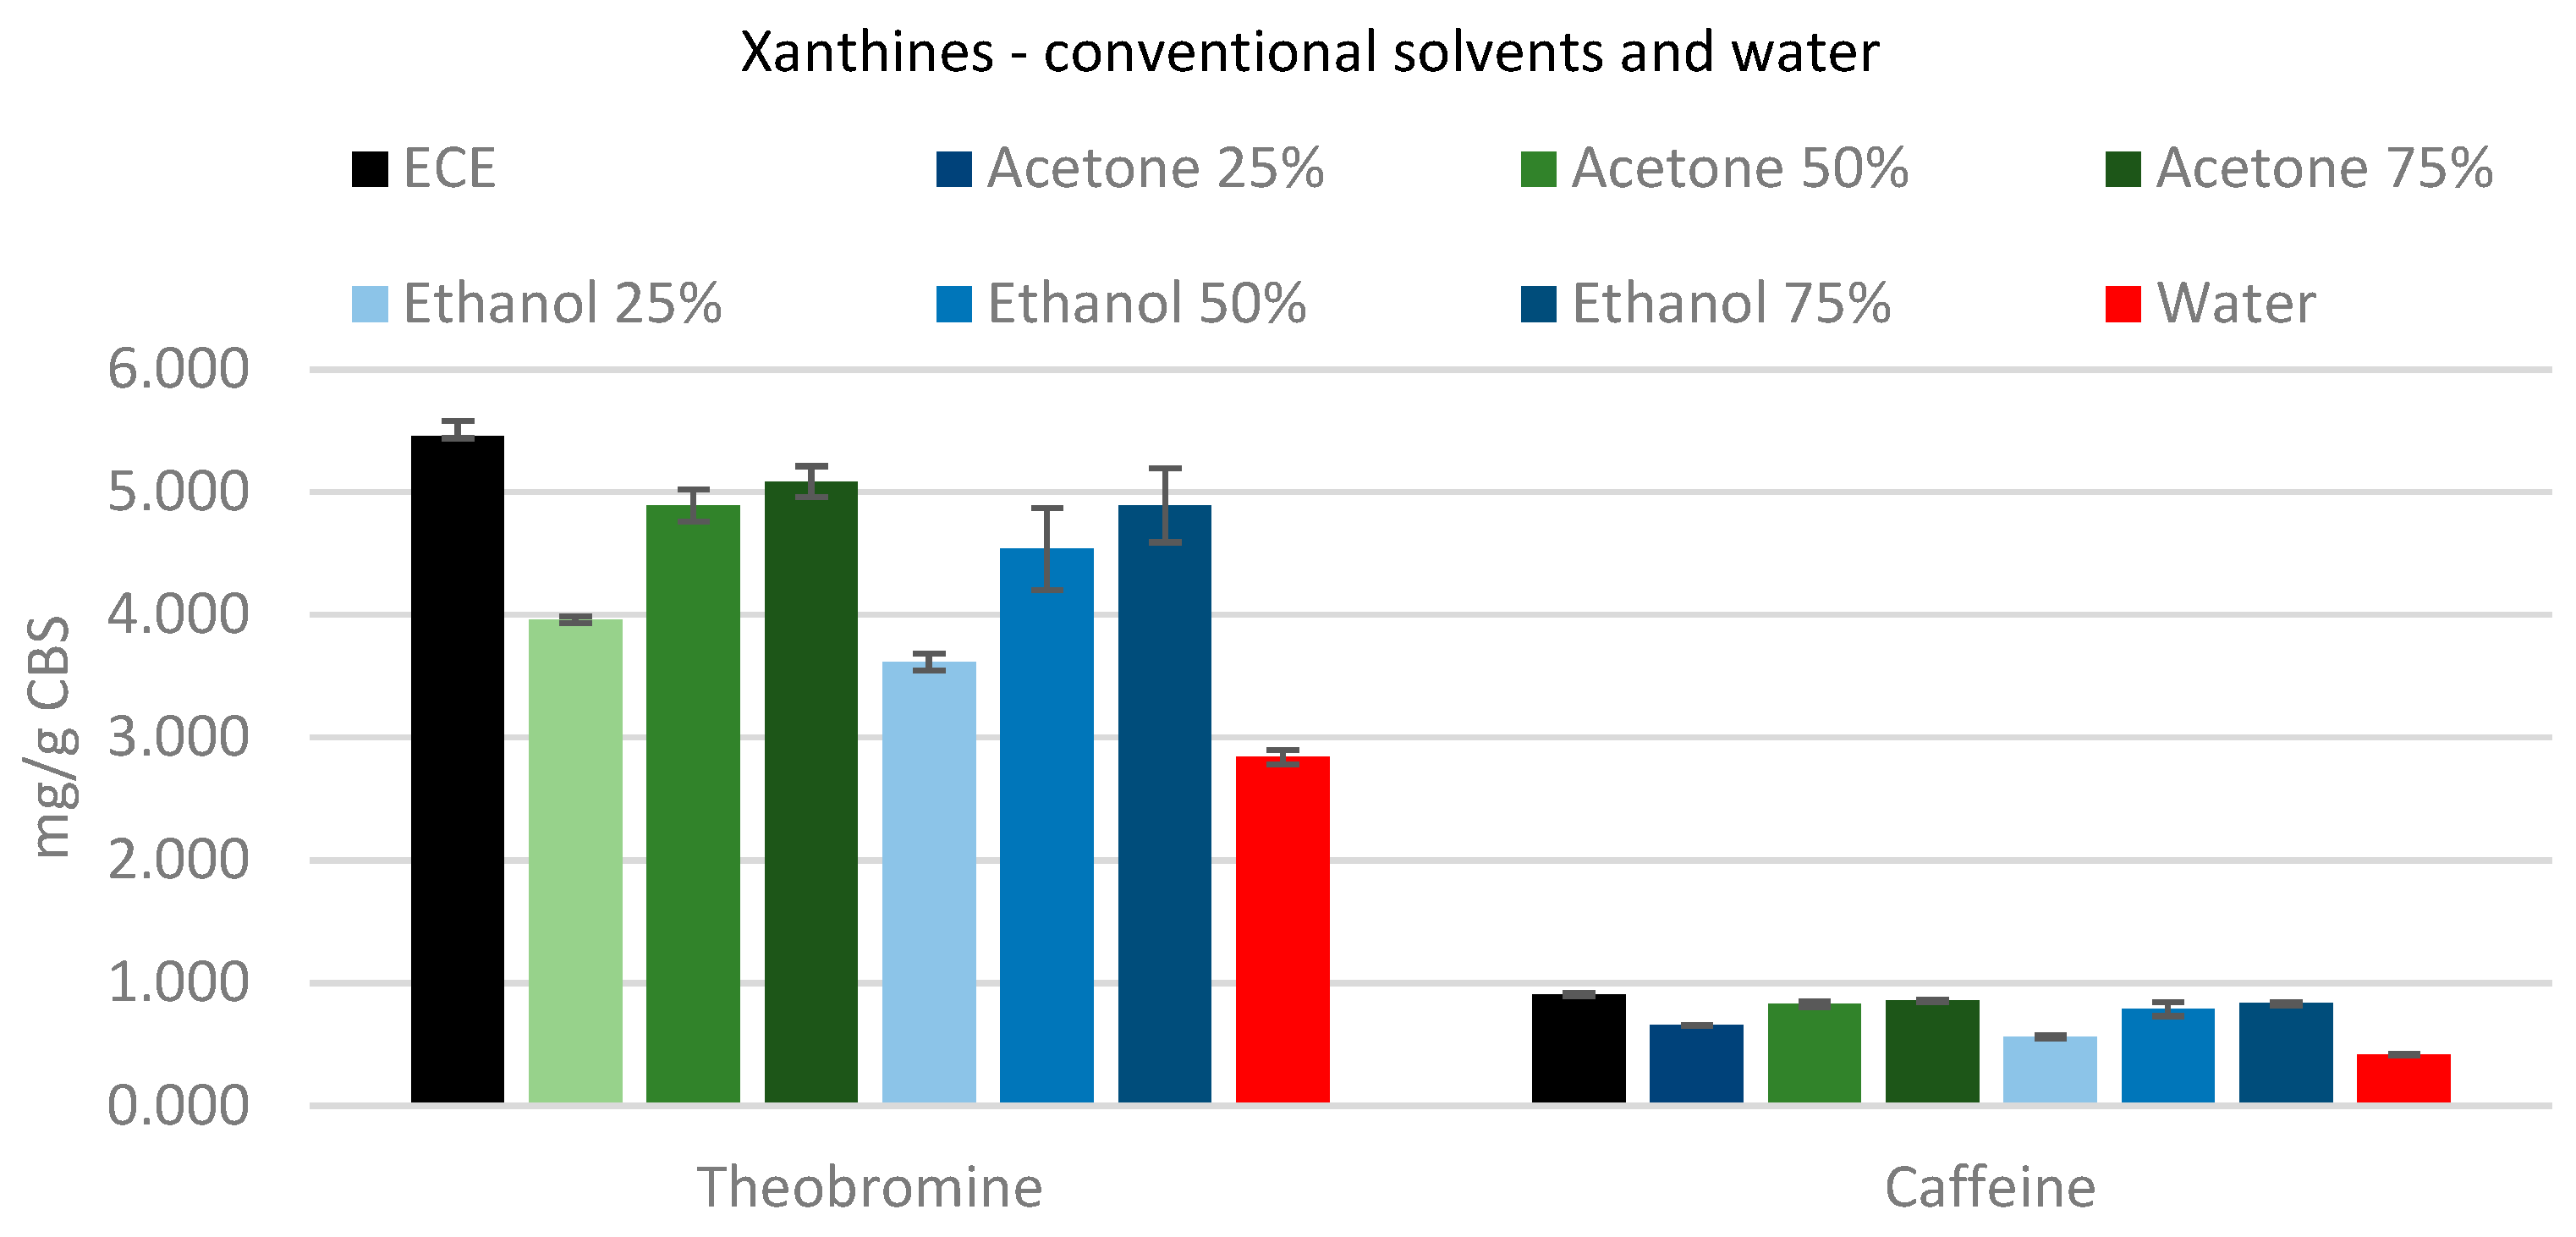
Figure 4.
Screening of extraction conditions at (A) 130°C, (B) 150°C and (C) 170°C.
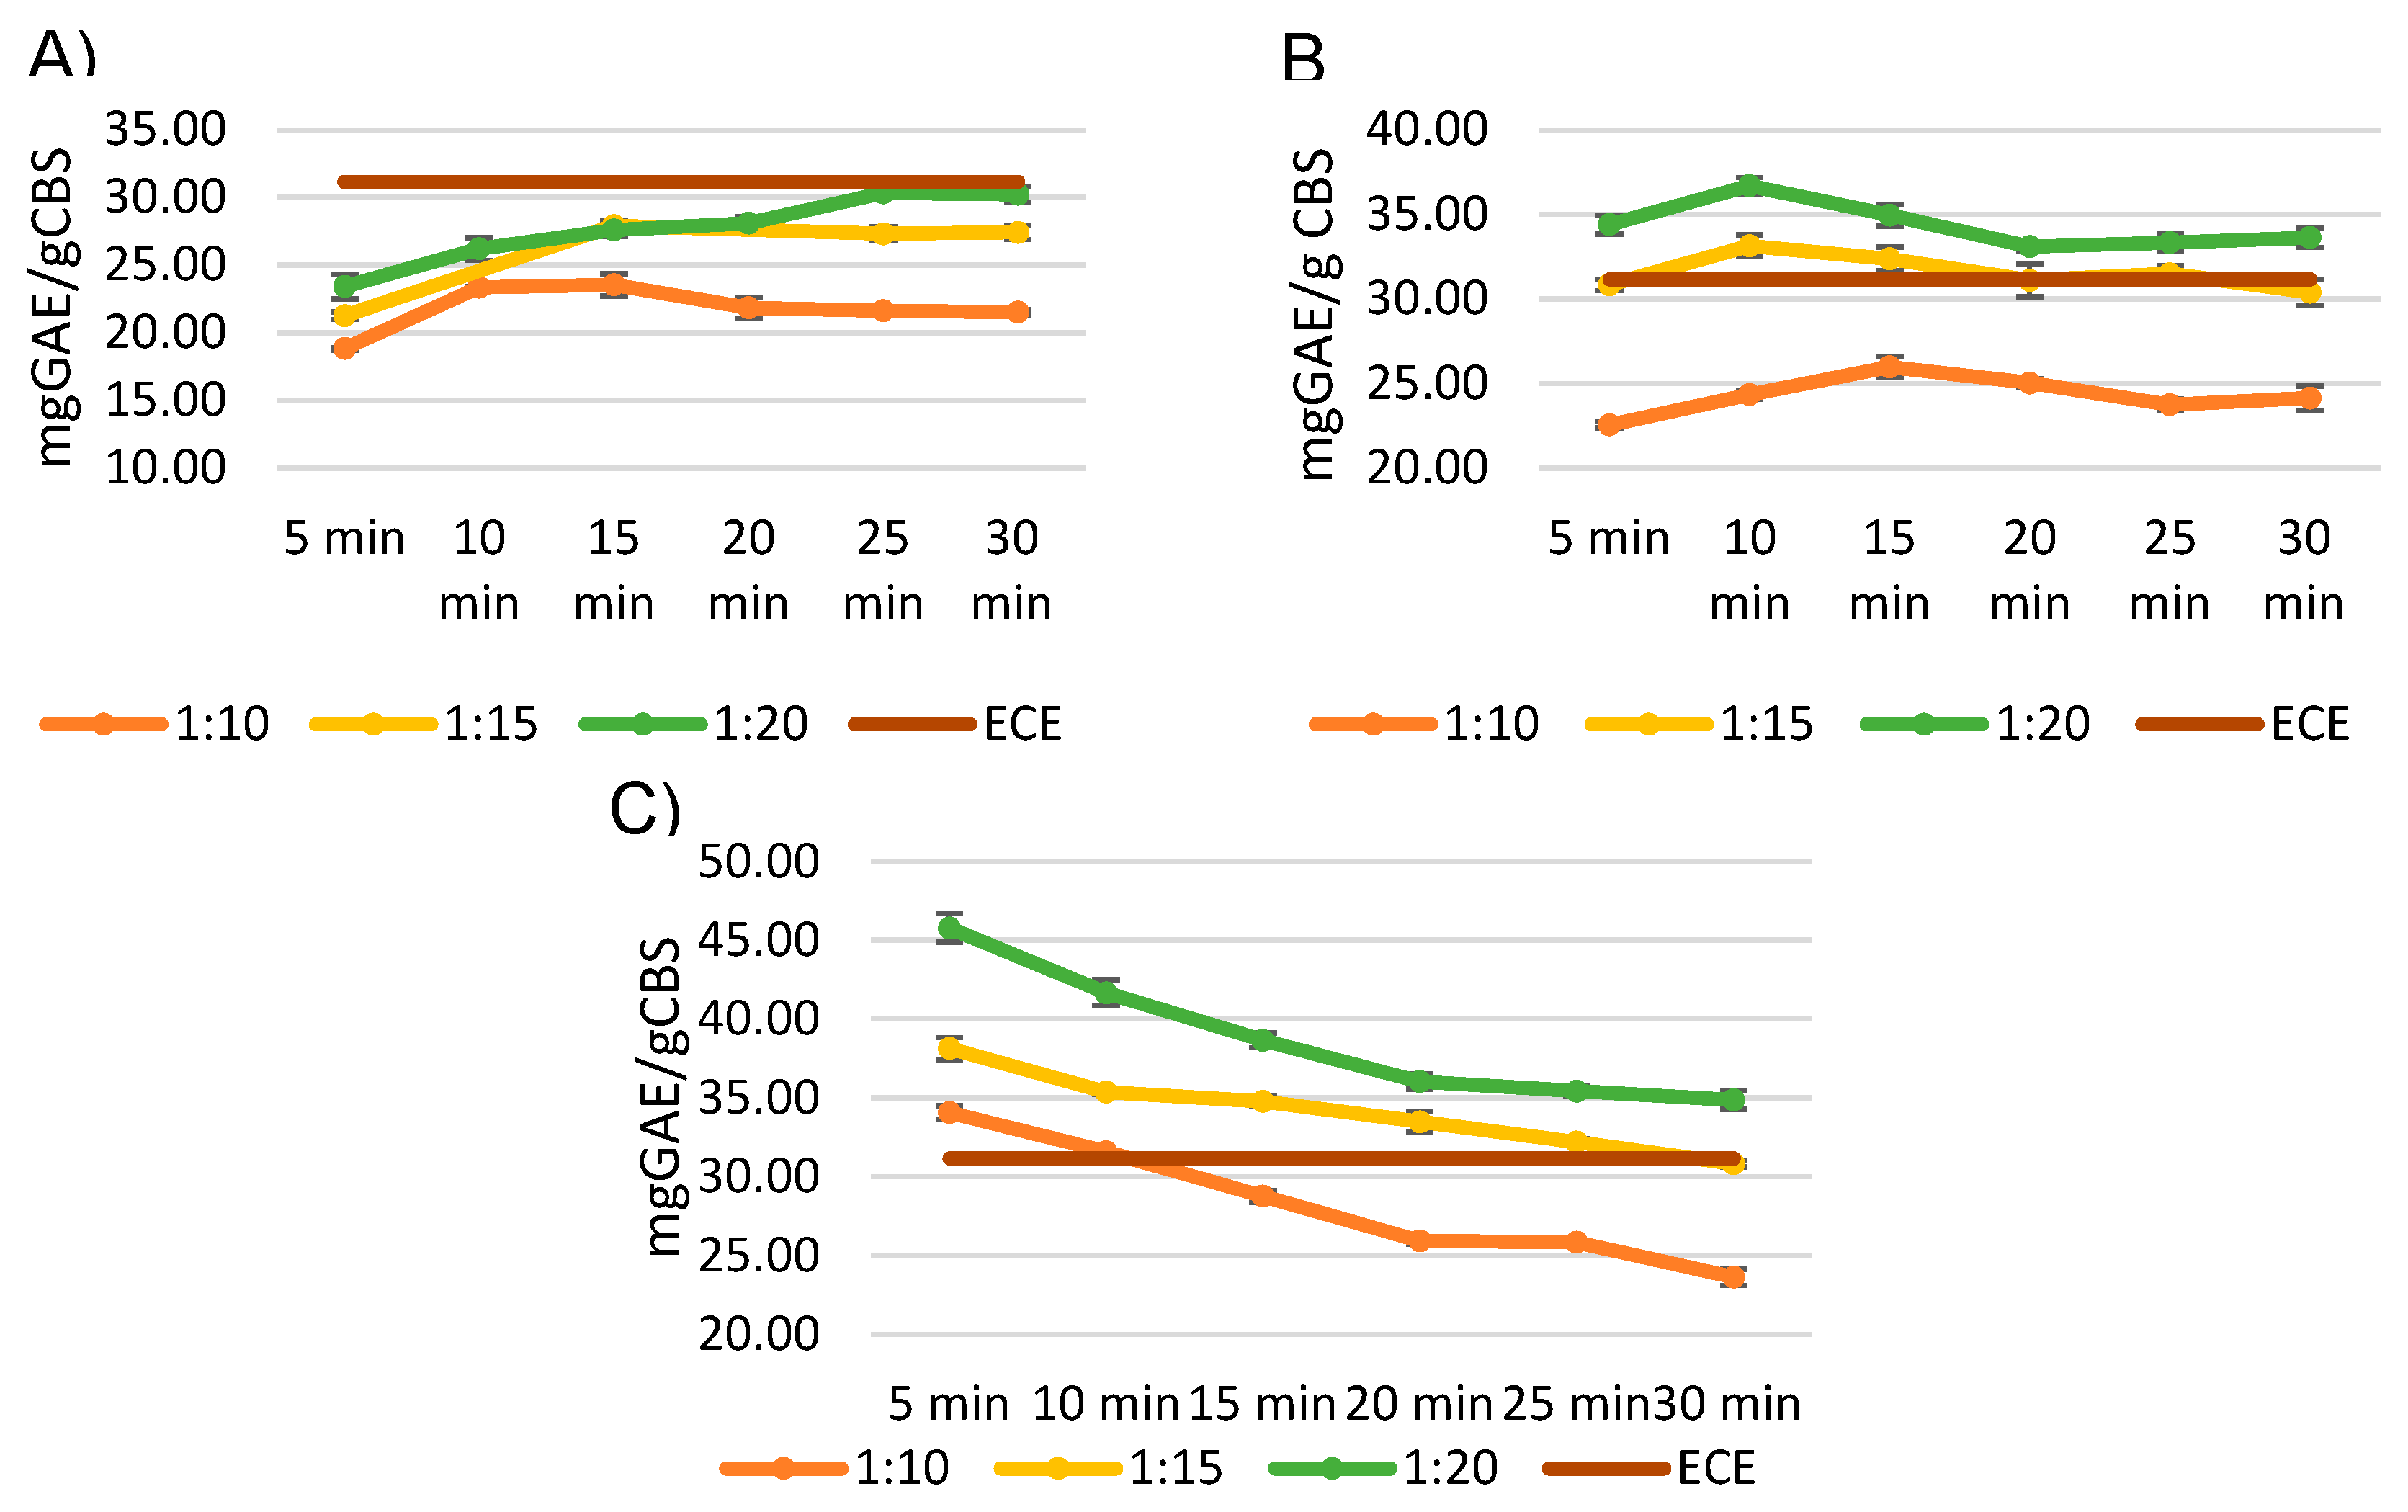
Figure 5.
Antioxidant activity of the extract obtained at the optimized time for each temperature tested.
Figure 5.
Antioxidant activity of the extract obtained at the optimized time for each temperature tested.
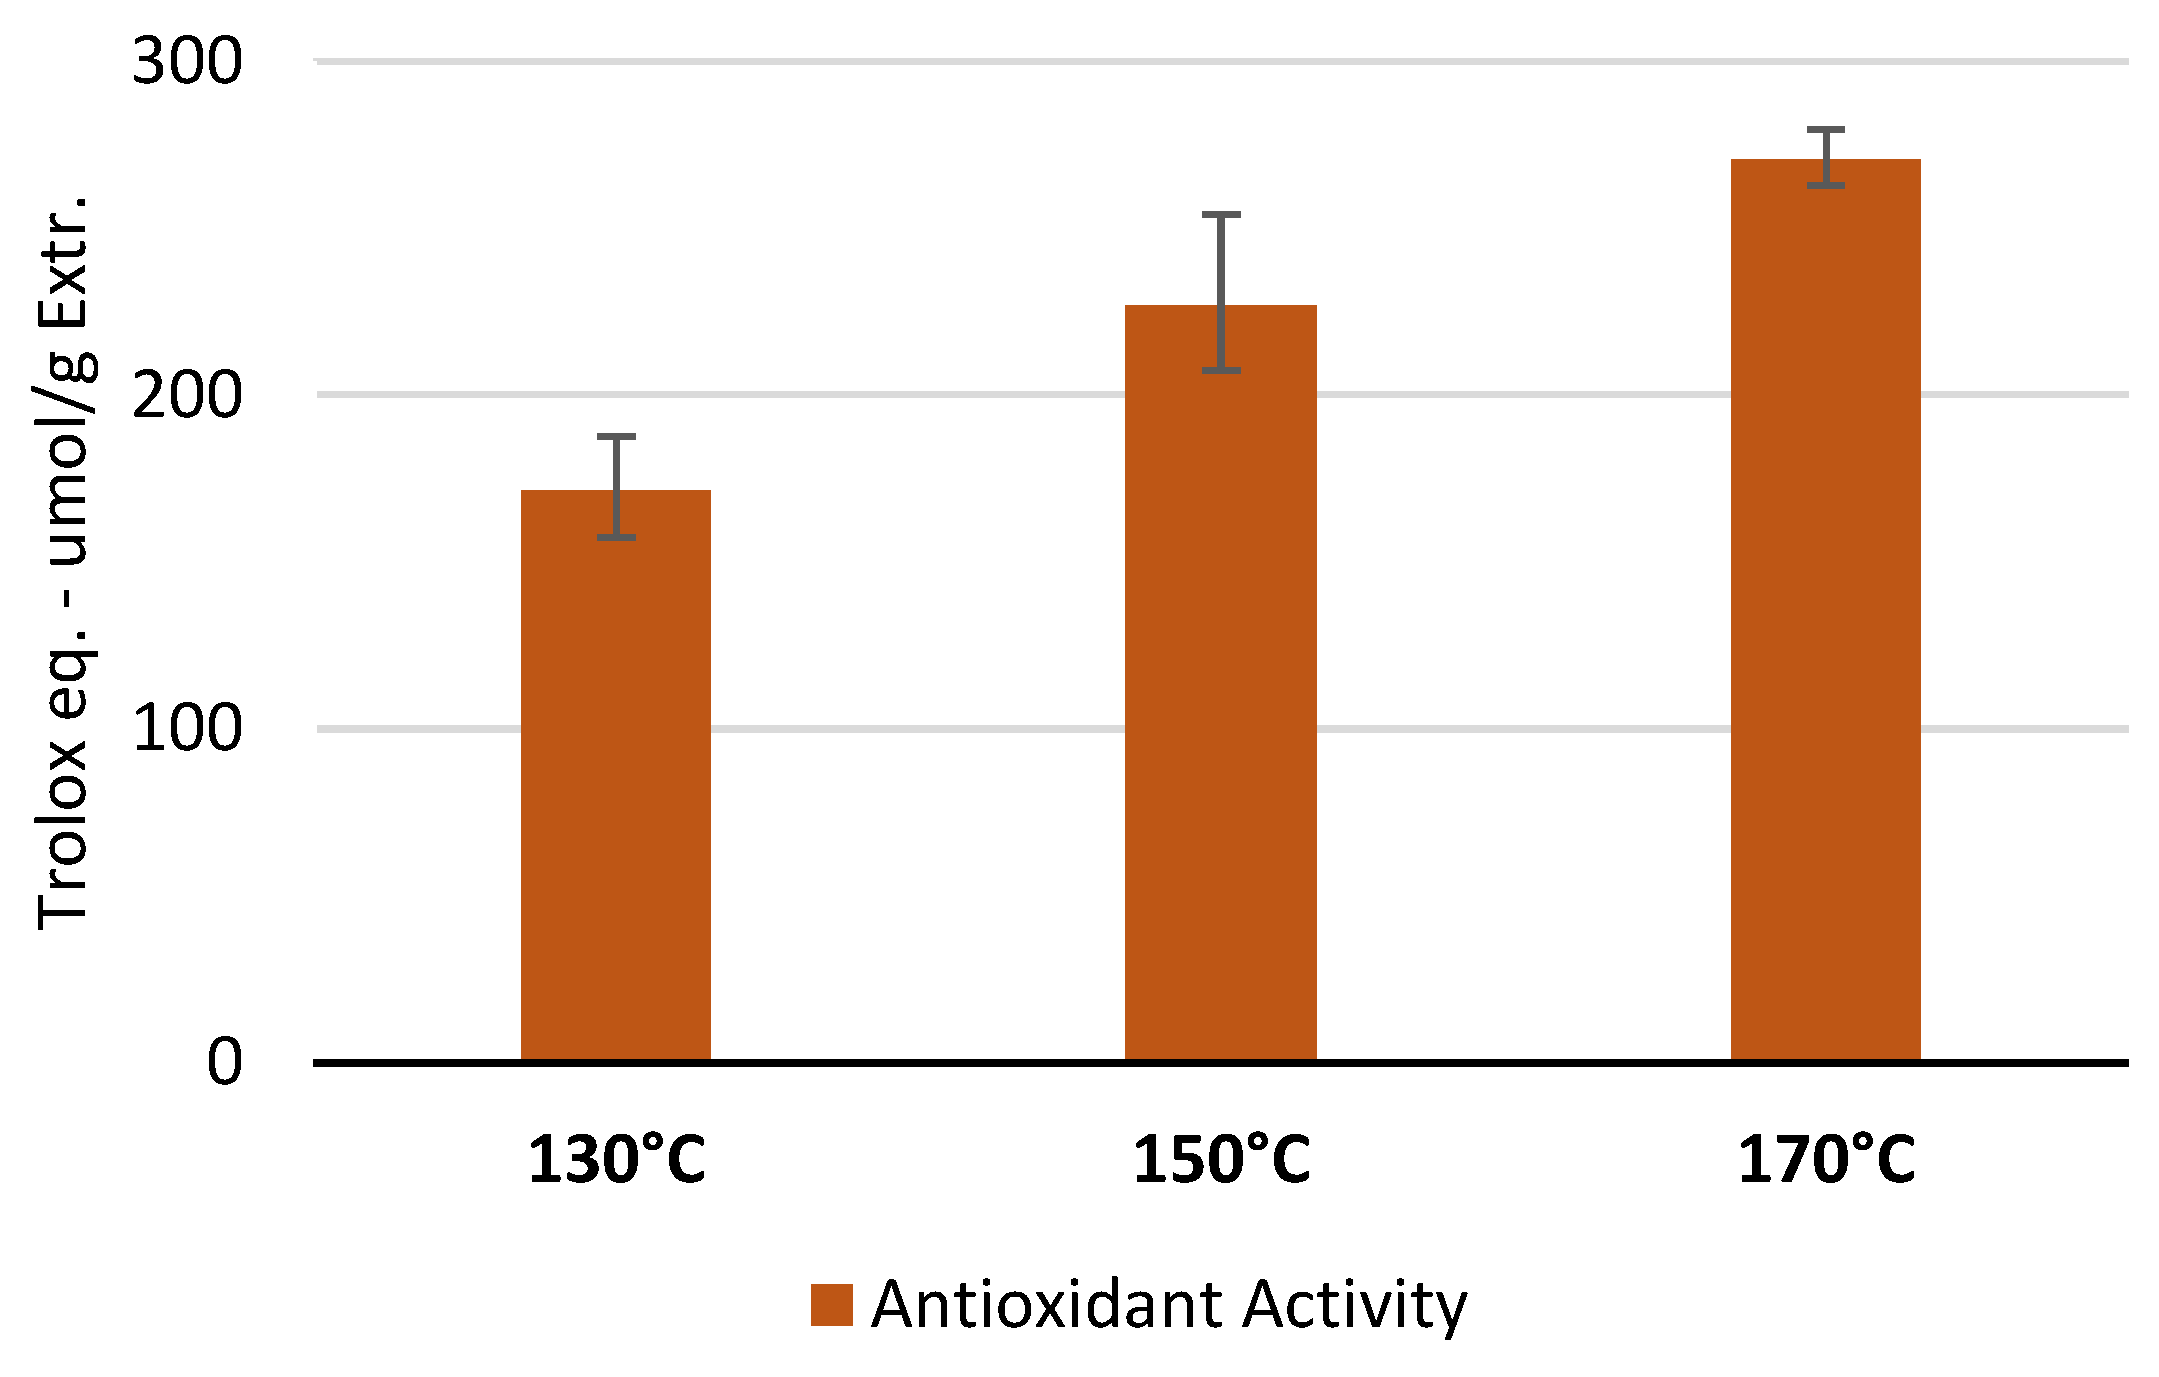
Figure 6.
Comparison of polyphenols yield between ECE protocol and MASWE.
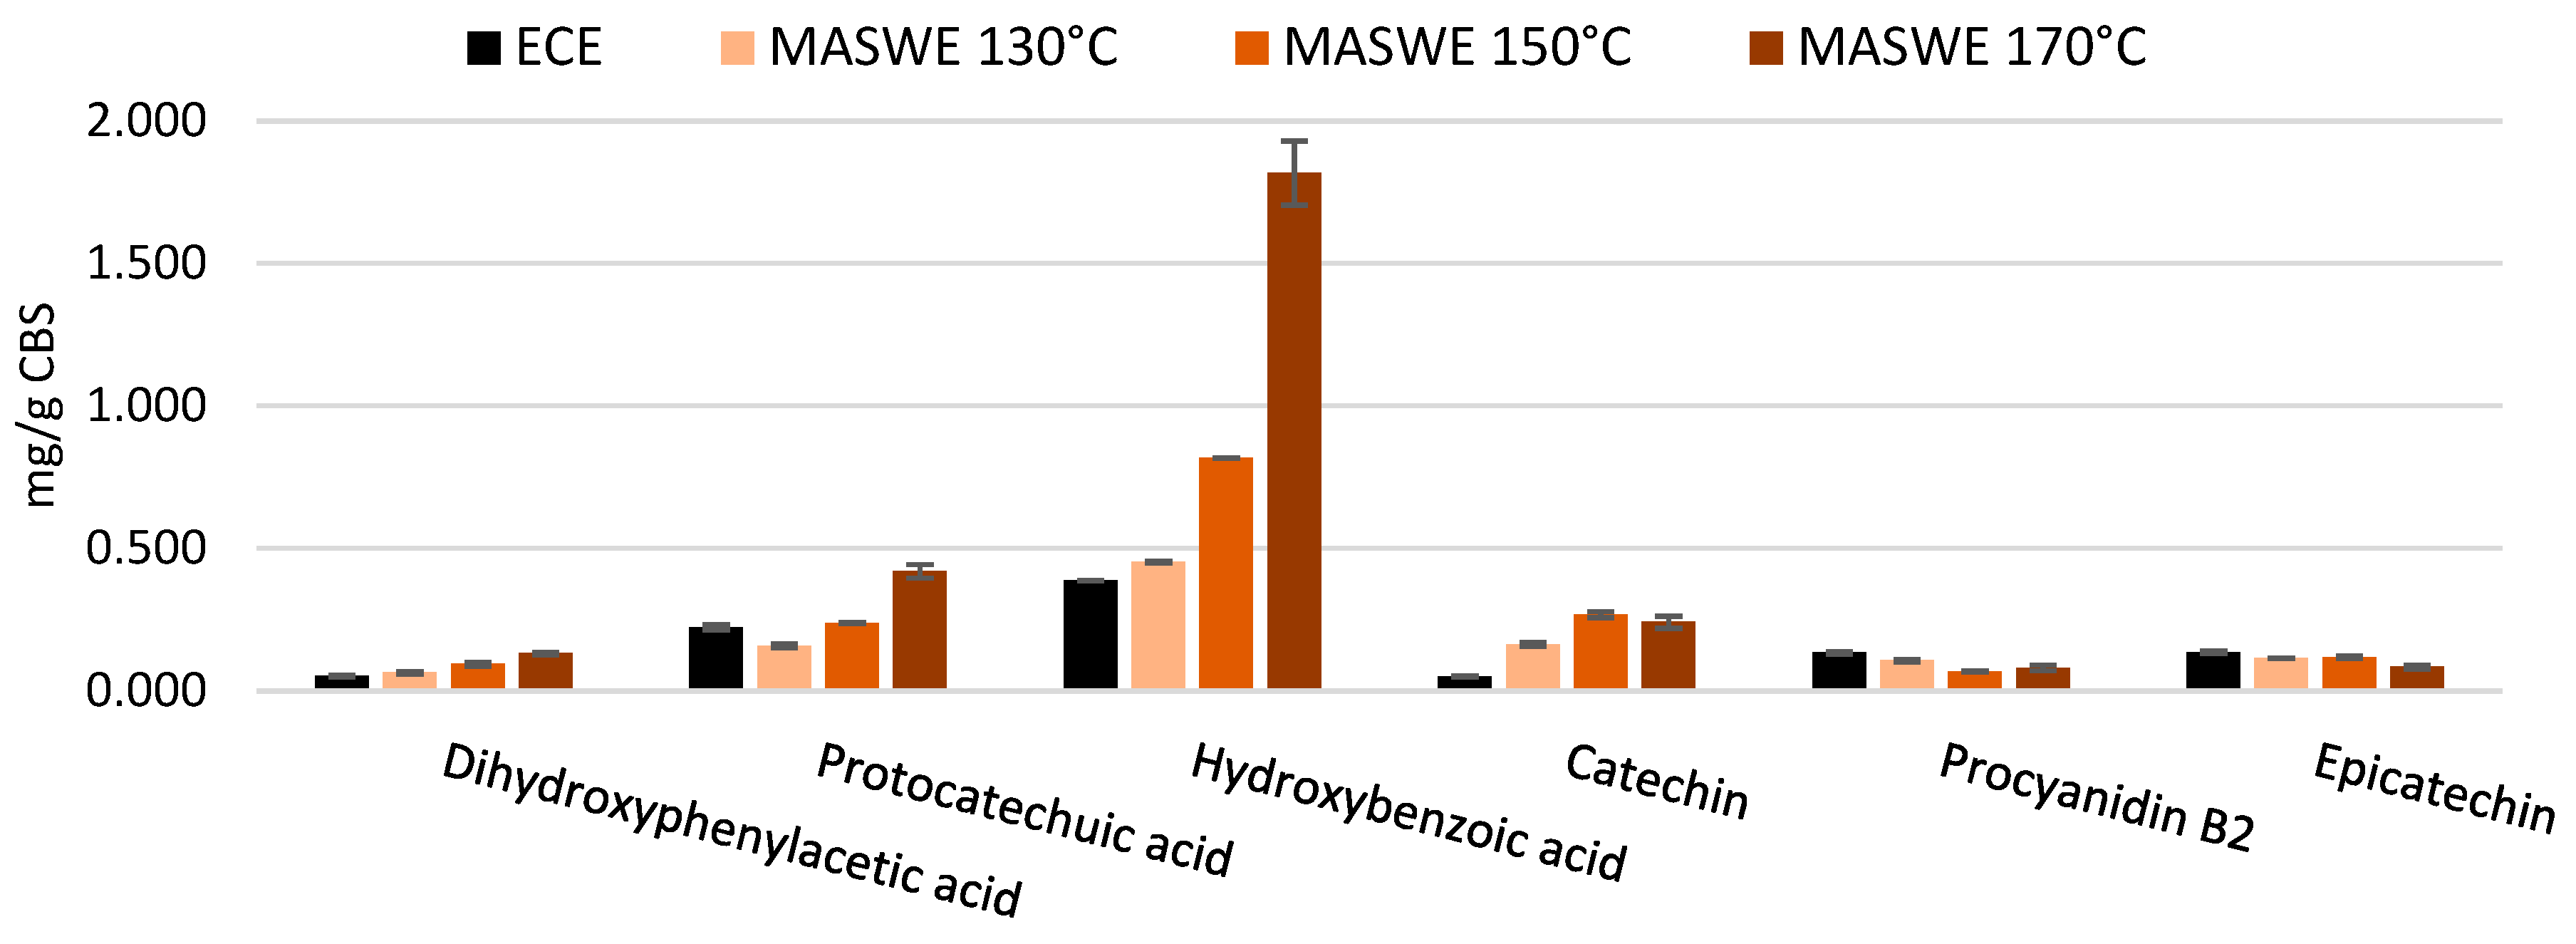
Figure 7.
Comparison of xanthines yield between ECE protocol and MASWE (130°C, 25 min; 150°, 10 min; 170°, 5 min).
Figure 7.
Comparison of xanthines yield between ECE protocol and MASWE (130°C, 25 min; 150°, 10 min; 170°, 5 min).
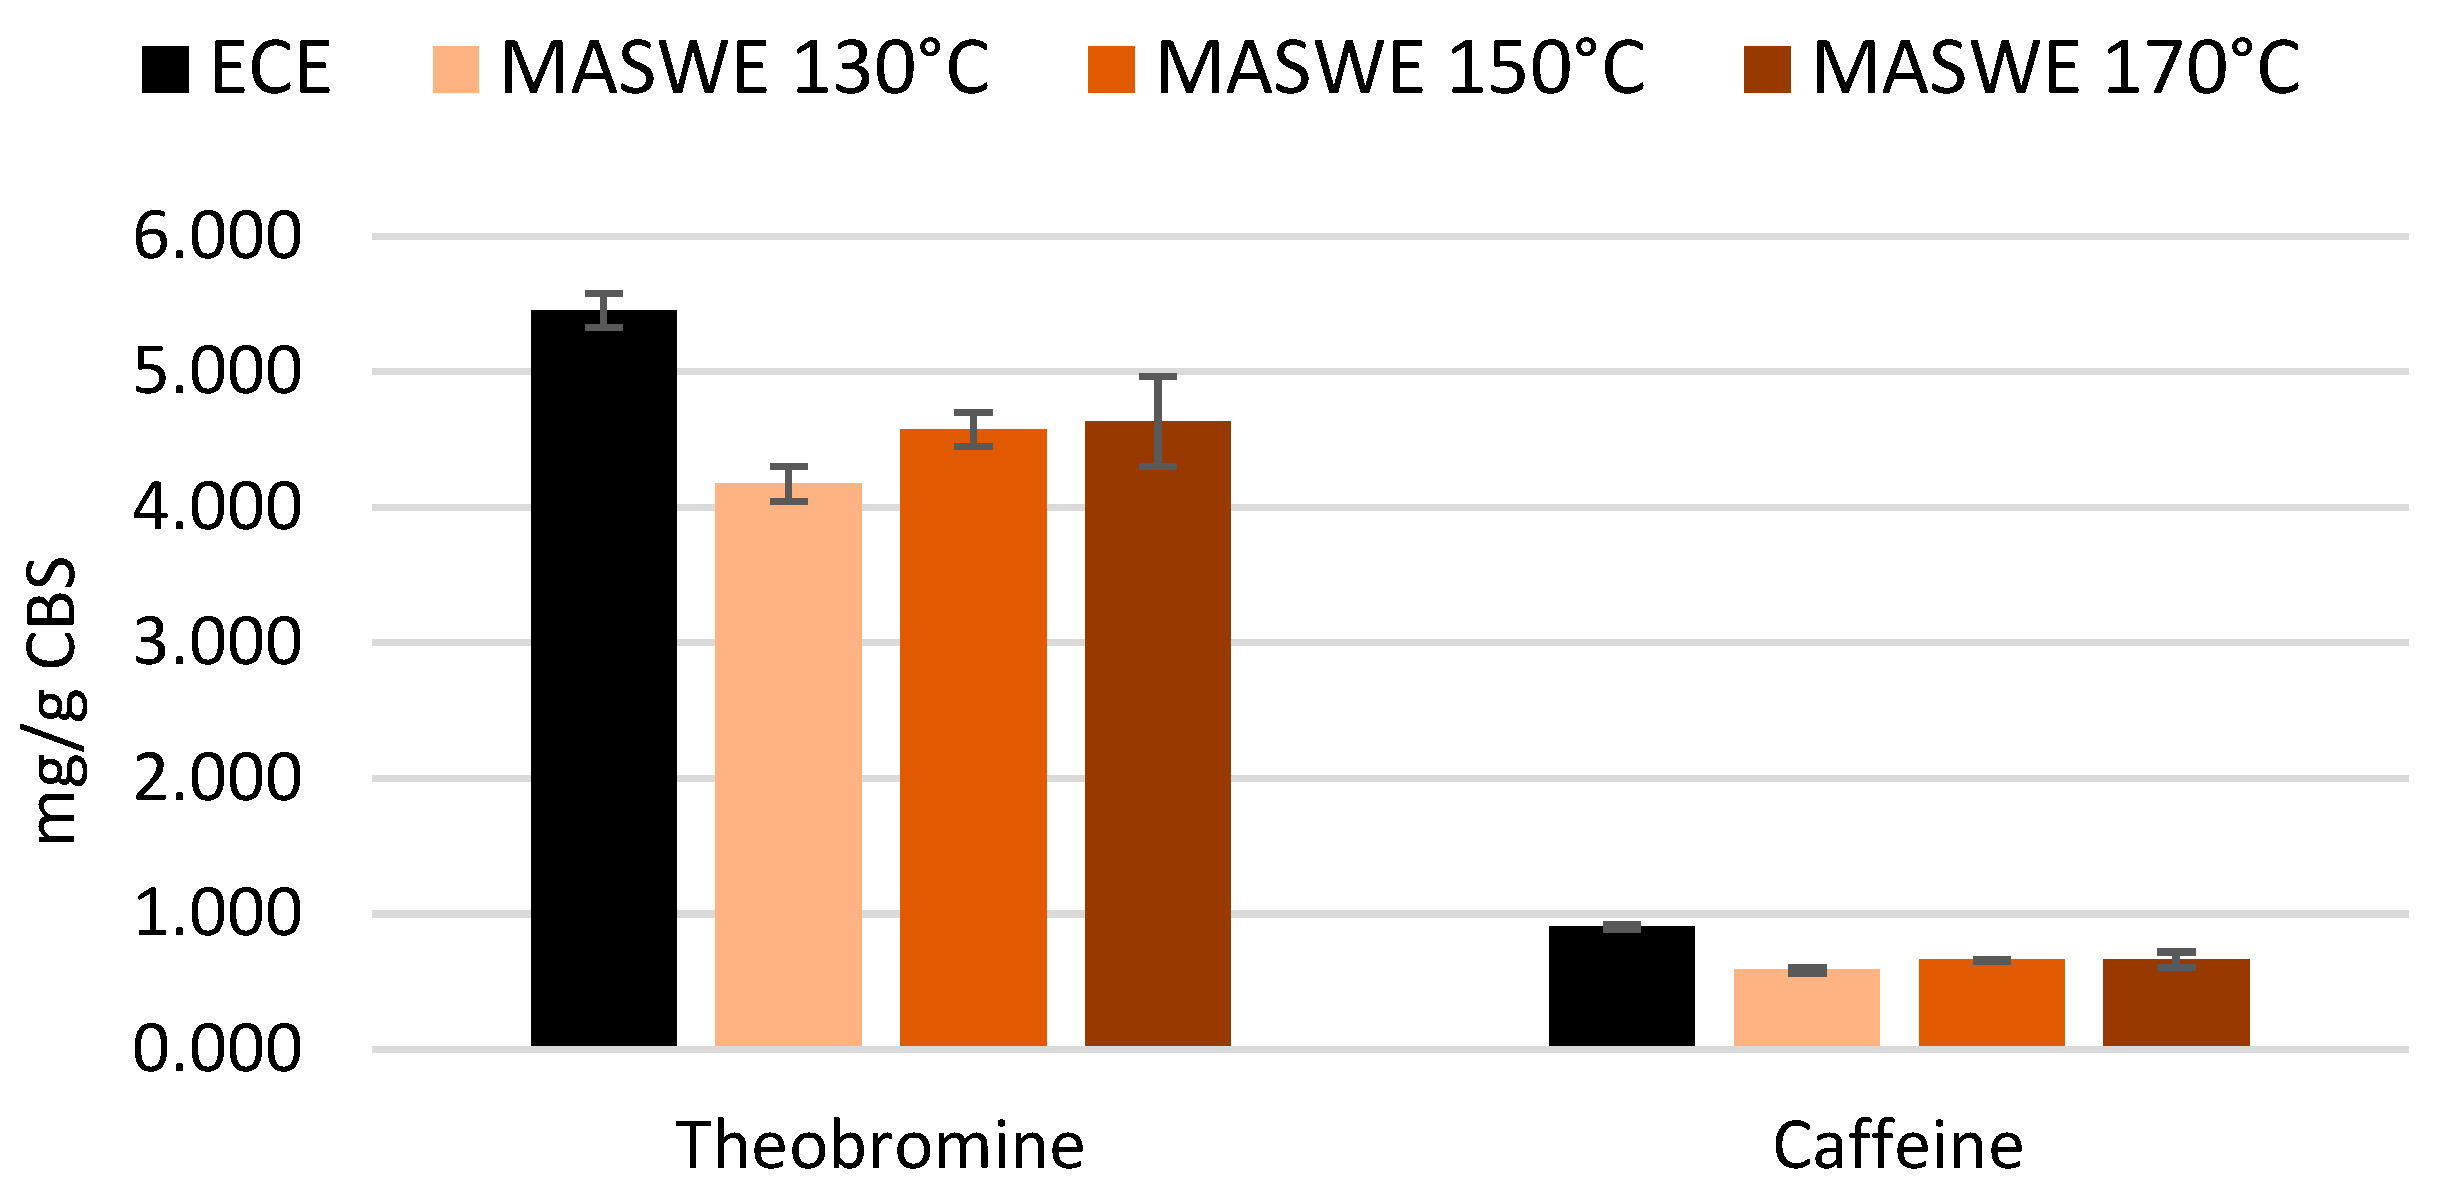
Figure 8.
Fractionation of CBS extract in different macroporous resins.
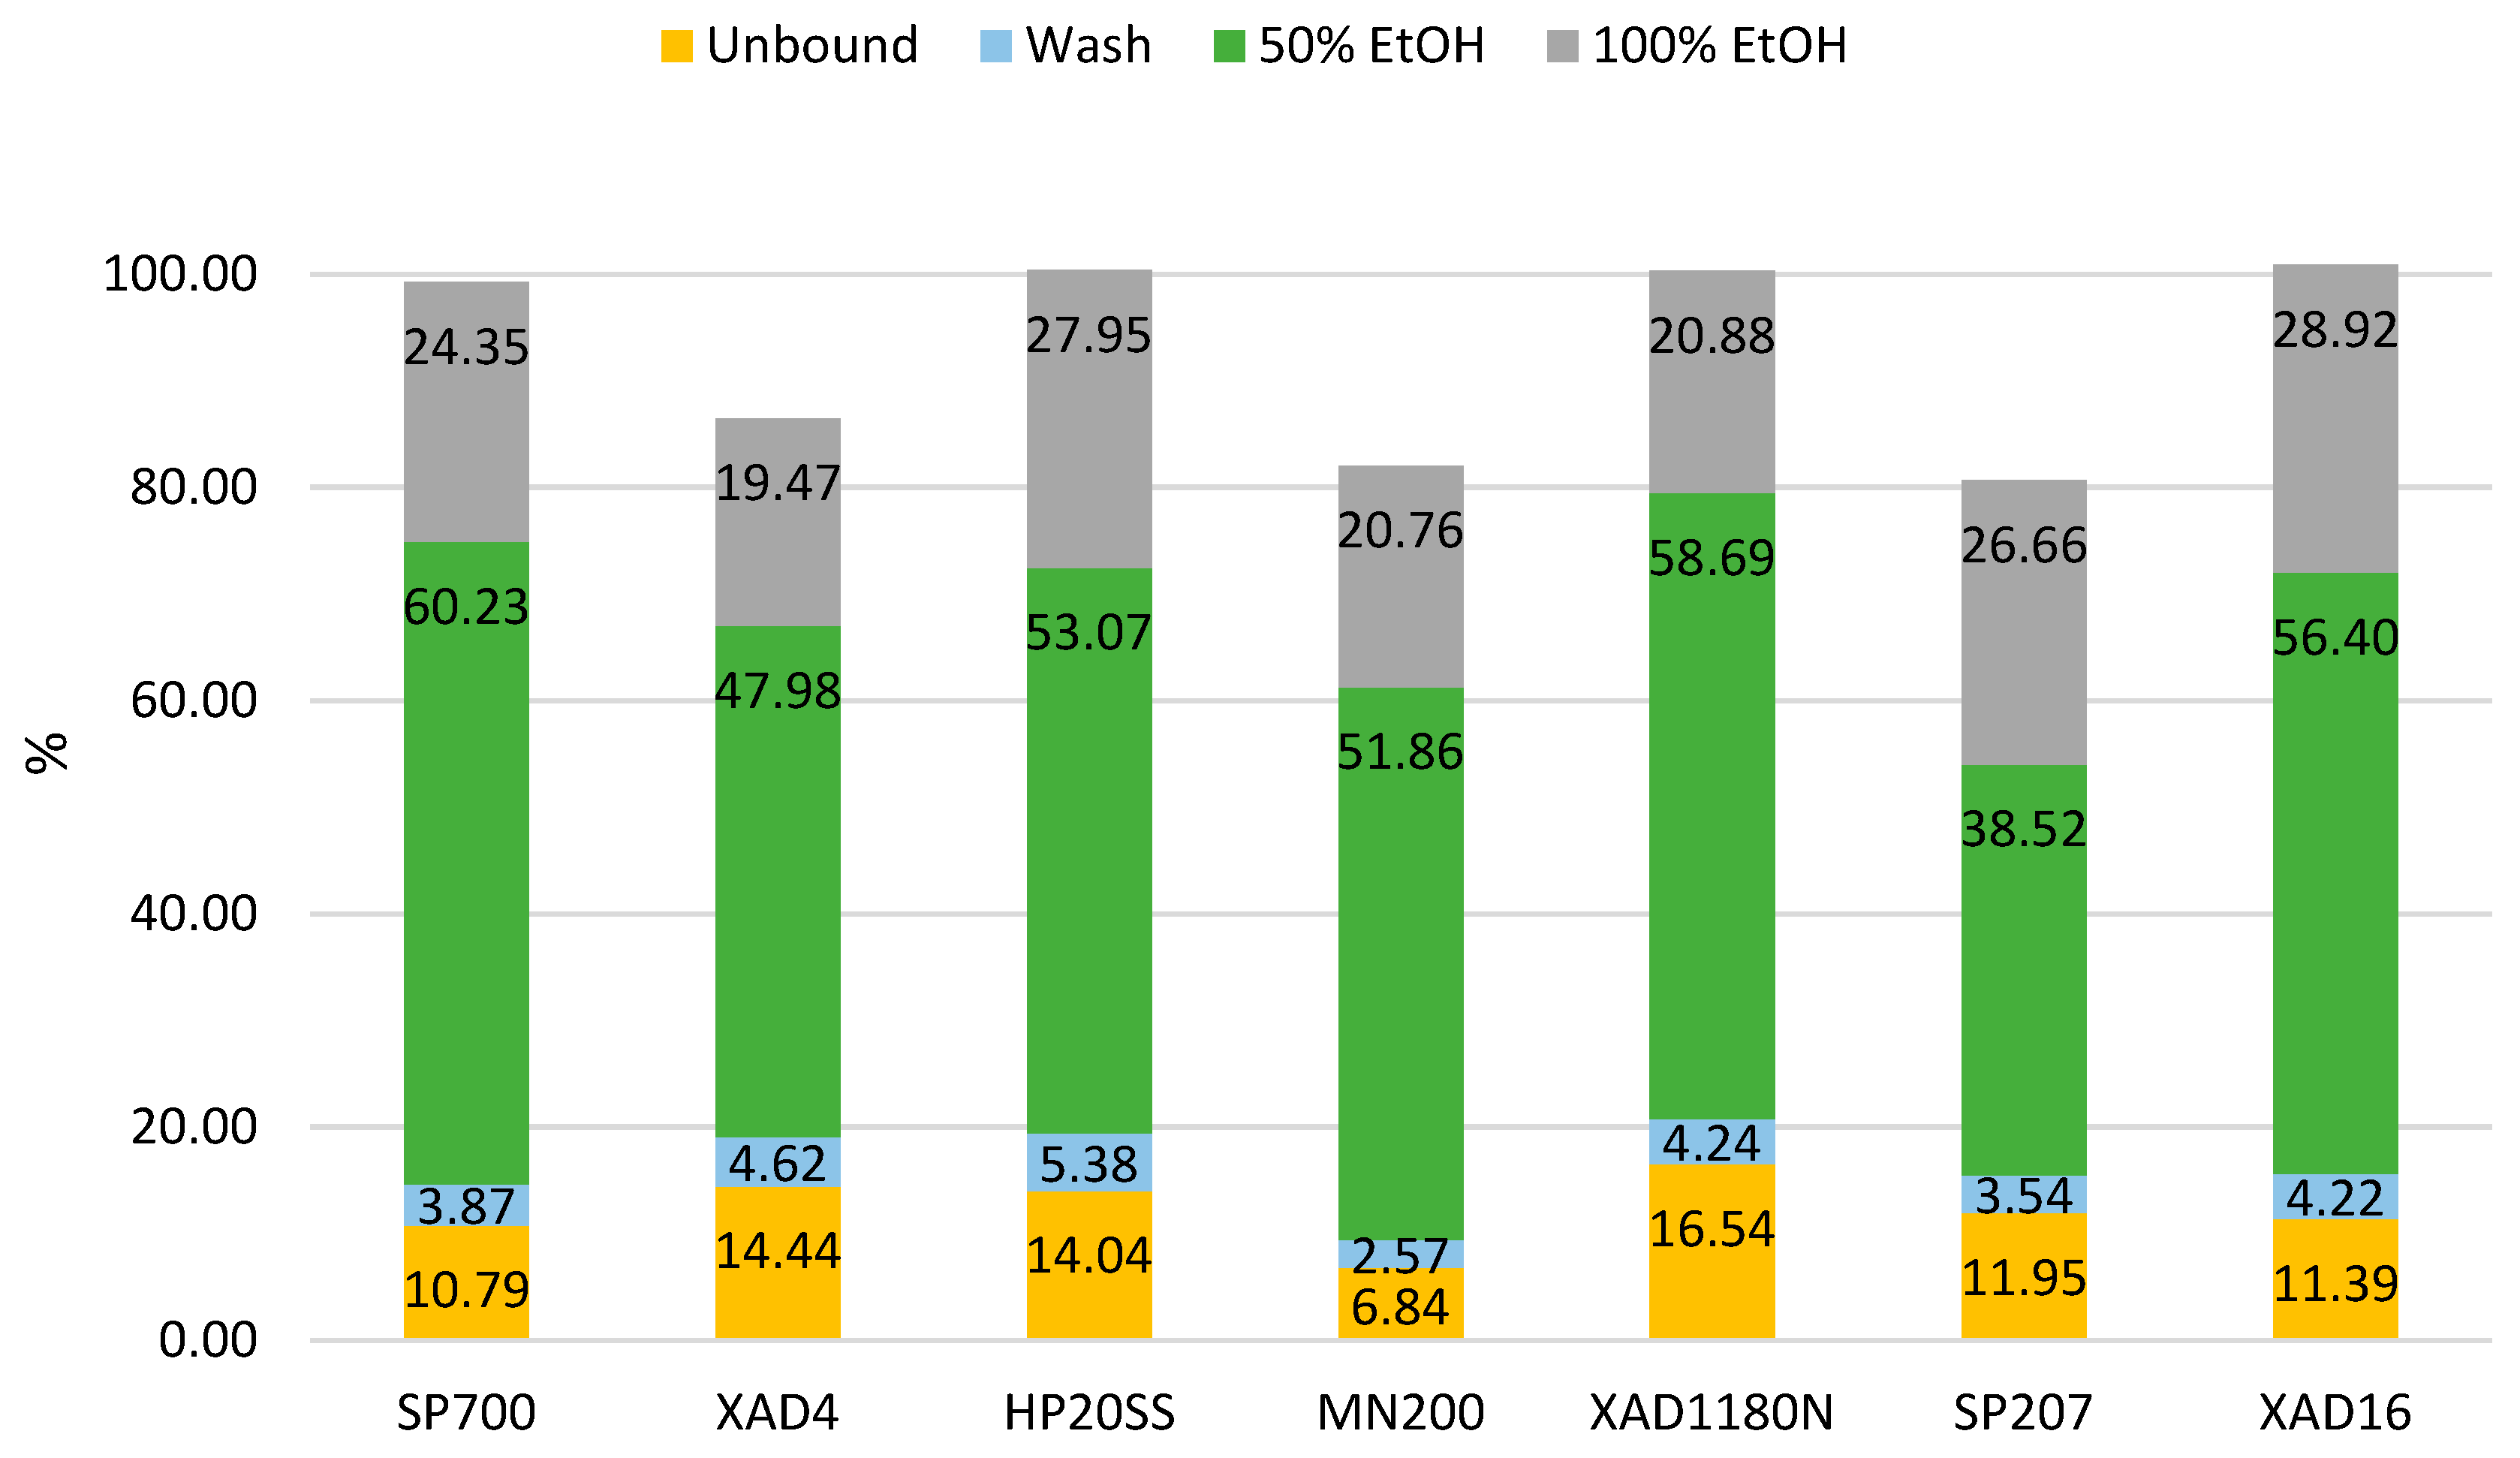
Figure 9.
Fractionation of the total phenolic content (TPC) in the different fractions.
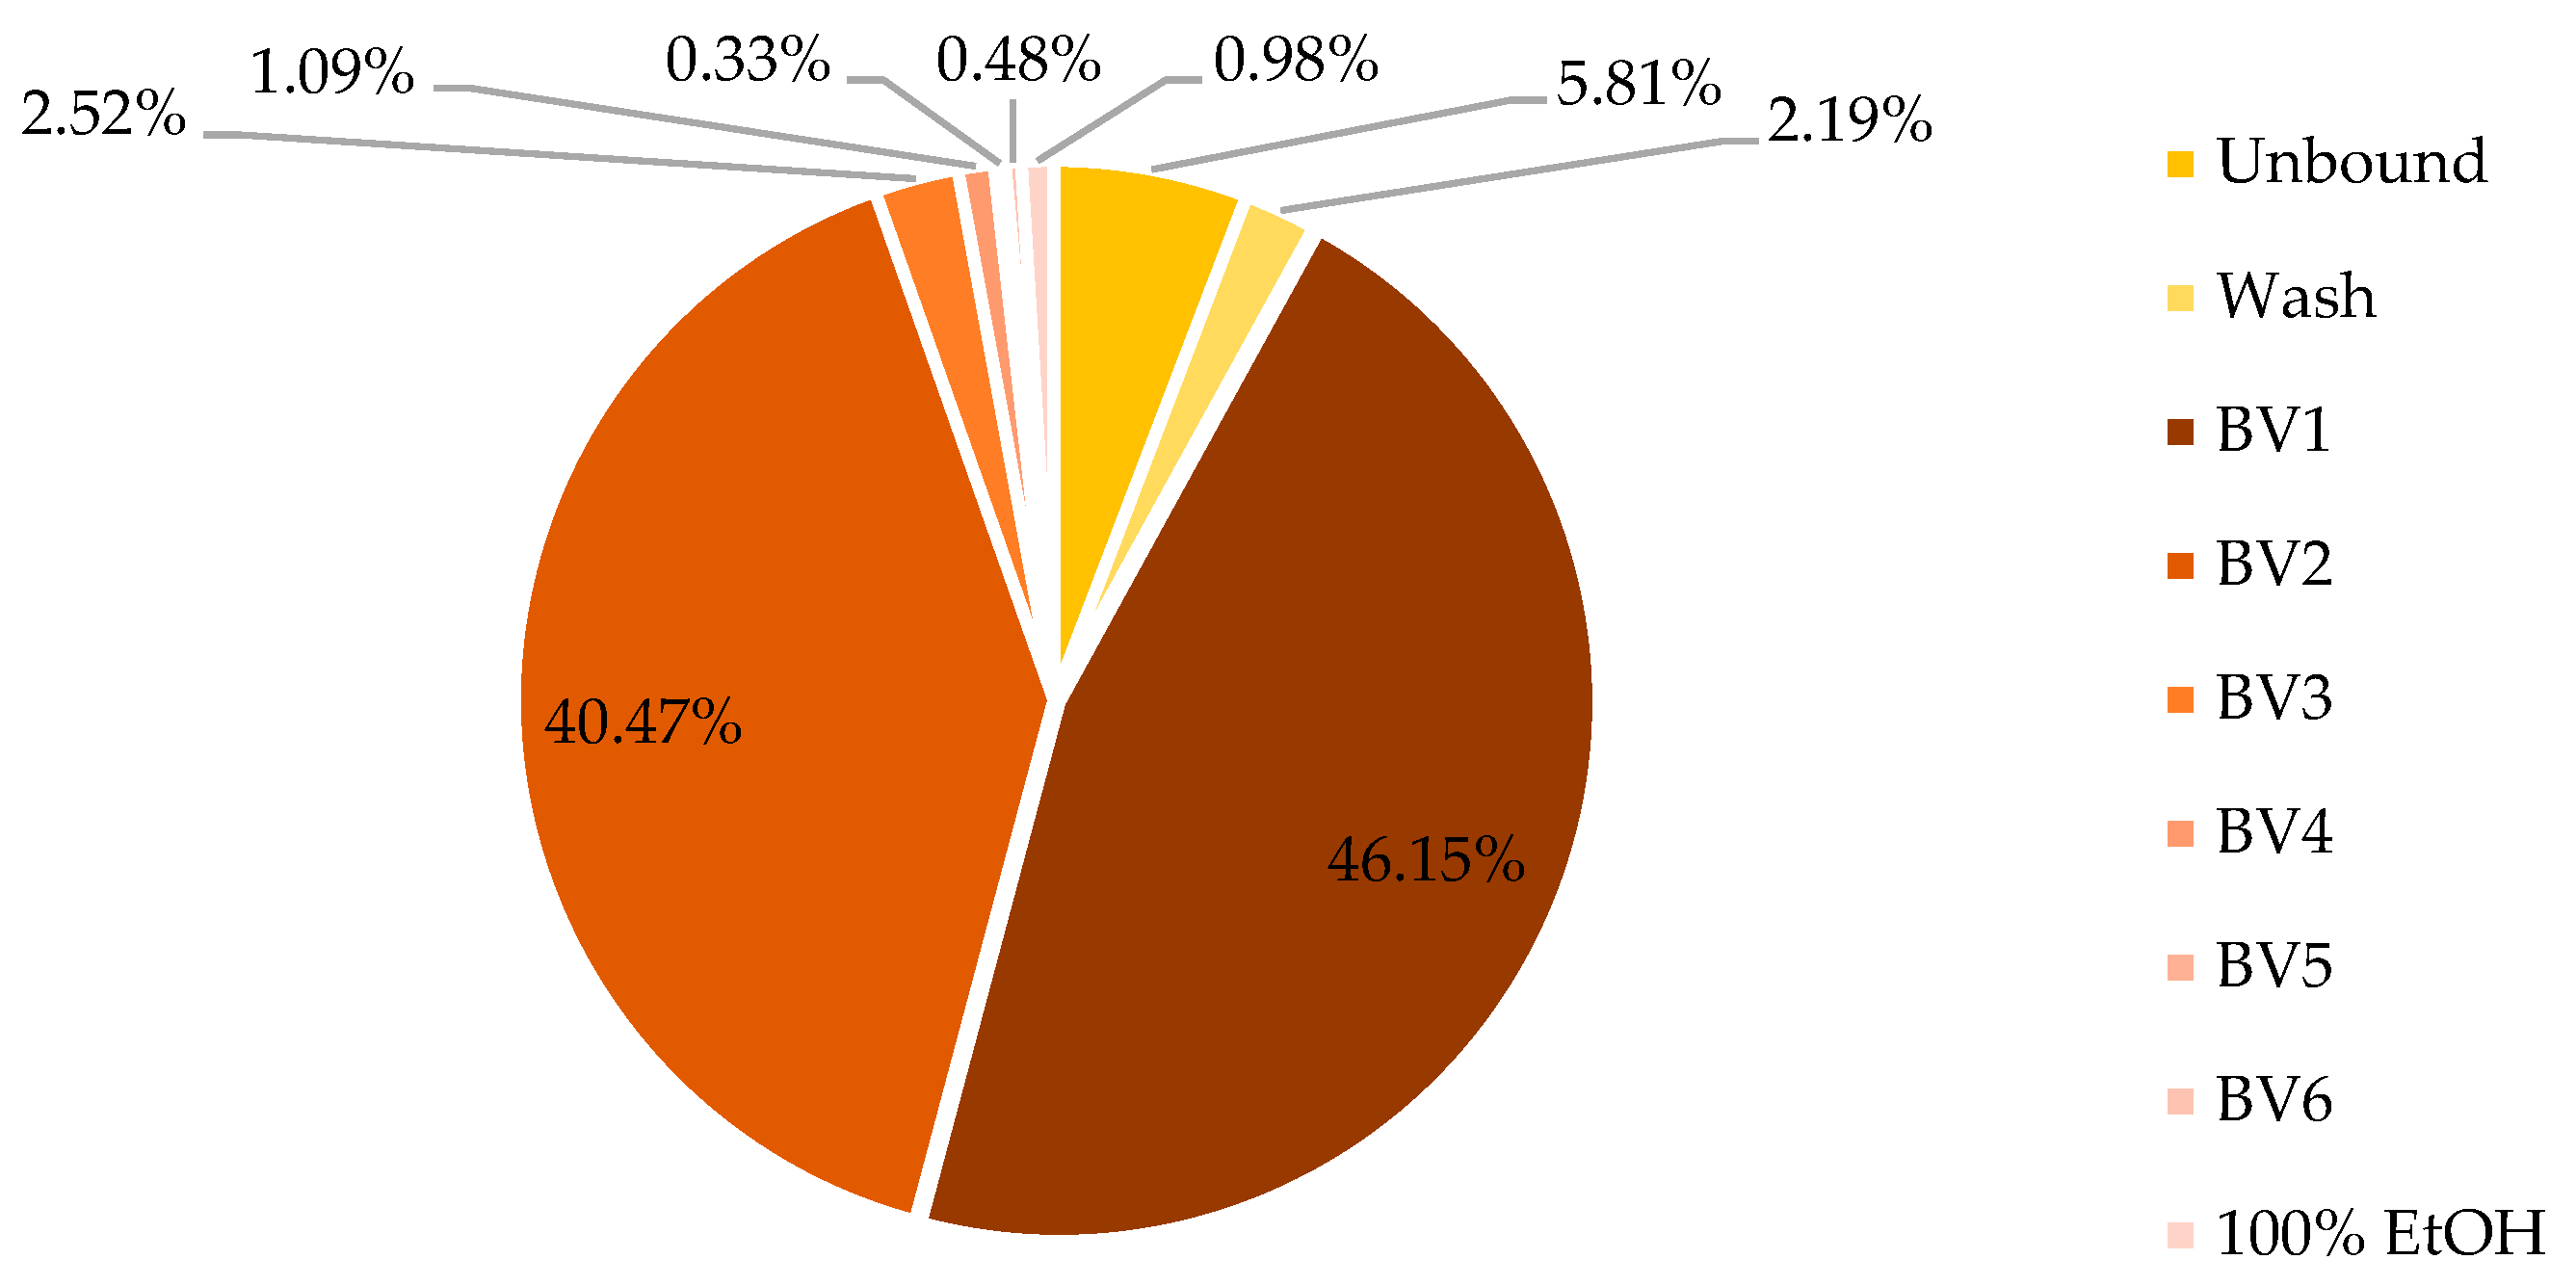

Table 1.
ECE protocol – extractable polyphenols.
| Step | Solvent | Temperature | Time (h) | Rep. |
| Defatting | Hexane | Reflux | 2 | 2 |
| 1 | Methanol/water 80/20 | Room temperature | 2 | 2 |
| 2 | Acetone/water 70/30 | Room temperature | 2 | 2 |
| 3 | Methanol/water 80/20 | Reflux | 2 | 2 |
| 4 | Acetone/water 70/30 | Reflux | 2 | 2 |
Table 2.
Resin specifications of the different resins screened.
| Code | Producer | Matrix | Surface area (m2/g) |
Pore radius (Å) |
Pore volume (mL/g) |
Moisture (%) |
Particle size (μm) |
| SP700 | Diaion Mitsubishi | Ethyl vinylbenzene-DVB | 1100 | 90 | 2.2 | 60-70 | 250-700 |
| XAD4 | DuPont | Styrene-DVB | 725 | 25 | 0.98 | 54-60 | 350-600 |
| HP20SS | Diaion Mitsubishi | Styrene-DVB | 560 | 290 | 1.2 | 55-67 | 63-150 |
| MN200 | EcoLab Purolite | Polystyrene-DVB | 1100 | 350 | 0.4 | 57-61 | 300-1200 |
| XAD1180N | DuPont | Styrene-DVB | 1100 | 90 | 1.4 | 60-70 | 350-600 |
| SP207 | Diaion Mitsubishi | Brominated styrene-DVB | 650 | 105 | 1.2 | 43-53 | 250 < |
| XAD16 | Diaion Mitsubishi | Styrene-DVB | 800 | 50 | 1.82 | 62-70 | 350-600 |
Table 3.
Polyphenol selectivity at optimized extraction times per temperature.
| Solid-to-liquid ratio (g:mL) | Temperature (°C) | Time (min) | TPC Selectivity (mgGAE/g extract) |
S.D. (mg/g) |
| 1:20 | 130 | 25 | 72.90 | 1.43 |
| 150 | 10 | 80.21 | 1.06 | |
| 170 | 5 | 98.36 | 1.94 |
Table 4.
Selectivity enhancement (%) of the fractions obtained through batch fractionation with the selected resins (100%= amount in raw extract).
Table 4.
Selectivity enhancement (%) of the fractions obtained through batch fractionation with the selected resins (100%= amount in raw extract).
| TPC selectivity Unbound (%) |
TPC selectivity Wash (%) |
TPC selectivity 50% EtOH (%) |
TPC selectivity 100% EtOH (%) |
|
| SP700 | 9.25 | 22.55 | 189.62 | 305.32 |
| XAD4 | 12.11 | 24.09 | 197.55 | 248.53 |
| HP20SS | 13.68 | 25.33 | 142.20 | 220.95 |
| MN200 | 6.28 | 13.67 | 173.39 | 285.84 |
| XAD1180N | 13.91 | 35.30 | 174.97 | 198.65 |
| SP207 | 12.12 | 13.69 | 130.97 | 261.73 |
| XAD16 | 9.82 | 25.65 | 174.43 | 157.37 |
Table 5.
Enrichment of single model compounds in 50% EtOH fraction (100%= amount in raw extract).
| Selectivity Enhancement (%) | |
| Protocatechuic acid | 493.72 |
| Theobromine | 377.79 |
| Hydroxybenzoic acid | 339.45 |
| Catechin | 294.32 |
| Caffeine | 313.54 |
| Procyanidin B2 | 292.09 |
| Epicatechin | 226.60 |
Table 6.
Selectivity enhancement of single compounds.
| Compound | Selectivity enhancement (%) | ||
| BV1 | BV2 | BV3 | |
| Protocatechuic acid | 214.09 | 633.06 | 448.78 |
| Theobromine | 384.38 | 490.09 | 227.83 |
| Hydroxybenzoic acid | 106.86 | 886.45 | 1438.47 |
| Catechin | 136.32 | 492.23 | 1590.72 |
| Caffeine | 87.01 | 768.01 | 2026.97 |
| Procyanidin B2 | 228.23 | 660.26 | 1455.37 |
| Epicatechin | 230.47 | 397.63 | 2959.25 |
Disclaimer/Publisher’s Note: The statements, opinions and data contained in all publications are solely those of the individual author(s) and contributor(s) and not of MDPI and/or the editor(s). MDPI and/or the editor(s) disclaim responsibility for any injury to people or property resulting from any ideas, methods, instructions or products referred to in the content. |
© 2025 by the authors. Licensee MDPI, Basel, Switzerland. This article is an open access article distributed under the terms and conditions of the Creative Commons Attribution (CC BY) license (http://creativecommons.org/licenses/by/4.0/).
Copyright: This open access article is published under a Creative Commons CC BY 4.0 license, which permit the free download, distribution, and reuse, provided that the author and preprint are cited in any reuse.


