Submitted:
02 December 2025
Posted:
02 December 2025
You are already at the latest version
Abstract
This research studied the role of the fisheries sector, in particular pond-based grouper aquaculture in the coastal area of Lamongan, Indonesia, which is crucial for coastal food security and economy. Despite relatively high productivity, technical efficiency was not optimal because of its limited livelihood assets, which include human, natural, social, financial, and physical capital. The gap in ownership of these assets has resulted in technical efficiency variations across farmers and has affected both their livelihoods and environmental sustainability. Previous research has mostly focused on capture fisheries or non-grouper species, leaving a critical gap regarding the linkage between livelihood assets and technical efficiency in pond-based grouper aquaculture. This research measured livelihood asset levels, technical efficiency, and the effect of assets on efficiency, using quantitative data from 83 respondents. Livelihood assets were assessed through scoring and index analysis, technical efficiency was estimated using Stochastic Frontier Analysis (SFA), and the determinants of inefficiency were examined through Tobit regression with robust standard errors. The results found that the average livelihood asset index was 0.47 (moderate), with financial capital being the weakest component. Technical efficiency averaged 0.83, indicating efficient use of inputs while still allowing room for improvement. Natural capital (land area and water resources) and financial capital (income and savings) significantly affected technical inefficiency, whereas human, social, and physical capital did not. These findings emphasize the important to strengthen the financial capital and the management of natural resources optimally to promote the efficiency and sustainability of grouper aquaculture in the coastal area of Lamongan, Indonesia.
Keywords:
livelihood assets
; technical efficiency
; pond-based grouper aquaculture
; scoring and index method
; Stochastic Frontier Analysis
; Tobit regression (robust)
; policy and sustainability
1. Introduction
The aquaculture sector has developed into one of the main pillars of global food security [1,2,3]. According to [4], nowadays more than 50% of the global fish supply derives from aquaculture, and Asia contributes nearly 90% of the total production. This growth not only increased the availability of animal protein, but also provided jobs for more than 20 million coastal households in developing countries. However, at this figure, there is a disparity in productivity between large and small-scale businesses. Many small-scale farmers have very limited access to capital, technology and knowledge, preventing them from achieving optimal technical efficiency [5]. In the pond-based grouper aquaculture in the coastal area of Lamongan, Indonesia, a similar phenomenon occurs where high productivity is not always aligned with production efficiency.
The core issues in this aquaculture are the limited livelihood assets owned by the farmers. These limited resources consist of human capital (education, skills, experience, and health), natural capital (land area, water resources, water availability, and climate change), social capital (social networks, participation in groups, access to information, and social support), financial capital (income, savings, credit/loans, and debt), and physical capital (land status, home status, equipment, vehicles). The disparity in the use of assets for livelihood has led to differences in the efficiency of the farmers [6]. It not only affects the productivity but also the economic and social livings of the coastal people who rely heavily on the pond. The situation of lower technical efficiency signifies that there is a waste of inputs, and that the production costs are high, which causes lower profit margins and, thus, the weakening of economic security for the farmers [7]. In addition, inefficient aquaculture practices could lead to further environmental tensions, like the pollution of water, the deterioration of the mangrove ecosystem, and even the creation of situations that make it harder for the farmers to deal with climate change [8]. These problems indicate that technical efficiency should be improved first if one wants to reach the goal of sustainable aquaculture in the coastal area [9].
A number of empirical studies have been attempting to determine the main factors of technical efficiency in the aquaculture industry. [10] discovered that the technical efficiency of Malaysian aquaculture systems was largely influenced by the farmers’ experience and training, as well as the quality of the seeds used. [11] reported that membership in a producer group had a positive influence on the technical efficiency of traditional fishermen in Nigeria by making it easier to get market information and technology. However, all these studies are still limited to capture fisheries or non-grouper aquaculture. The link between livelihood assets and technical efficiency for grouper commodities in brackish pond systems is still rarely studied [12,13]. This indicates that there is a crucial research gap to fill given the differences in ecological, social and economic factors between grouper aquaculture and other fisheries commodities aquaculture.
The research has the objective to measure the livelihood assets of coastal pond-based grouper farmers in the coastal area of Lamongan, to determine the technical efficiency of aquaculture businesses and to see how far the livelihood assets influence the technical efficiency of aquaculture. To this end, the research will be an empirical basis for the development of policies and interventions in fisheries that are focused on strengthening assets, improving efficiency and managing marine resources in a sustainable way. Moreover, it will be a useful addition to the literature on the uncharted area of the relationship between livelihood assets and technical efficiency in aquaculture. The research results will be highly significant for local governments, financial institutions and fisheries training institutions in their quest for creating comprehensive and sustainable productivity enhancement strategies for small-scale farmers in Indonesia. Also, this research, in turn, will provide a real contribution to enhancing the economic performance and social-ecological sustainability of the grouper aquaculture sector through the channeling of livelihood assets as a base for reinforcing the farmers’ capacity, reducing production inefficiencies, and drawing up coastal fisheries development policies.
2. Literature Review
The relationship between livelihood assets and technical efficiency in the aquaculture sector has been a primary issue in coastal resource economics especially in Southeast Asia where small- and medium-scale fisheries ones that mostly determine the local economy. In Indonesia, grouper aquaculture is considered to be of high economic importance as it generates income for coastal households and exports of high-value fish [14]. Nevertheless, the technical efficiency of this aquaculture business is sometimes influenced by the inequality of livelihood assets, such as having little capital, unskilled labor, and lack of access to eco-friendly technology and markets. Some other works indicate that the proper management of the livelihood assets (human, social, natural, financial, and physical) can enhance the adaptive capacity of fish farmers and lead to improved resource use efficiency [15].
2.1. Livelihood Assets in Grouper Aquaculture
The Sustainable Livelihood Framework (SLF) approach asserts that the economic success of coastal households relying on a mix of assets, which includes human capital (education and skills), natural capital (water quality and pond), social capital (social networks and institutions), financial capital (capital and income), and physical capital (production facilities and infrastructure). Research conducted by [15] indicates that the sustainability of livelihood assets around conservation areas was not very high, the lowest being 23% for financial and 29% for natural capital, which directly contributed to the low productivity of fishermen. For the case of grouper aquaculture in Indonesia, these two capitals attract limitations thereby restricting farmers across the board in adopting eco-friendly technology as well as managing disease risks leading to technical inefficiencies.
2.2. Technical Efficiency and Its Affecting Factors
Technical efficiency (TE) has been defined as the capacity of a producer to extract the maximum output from a mix of inputs that are available [16]. In a research project carried out in Indian shrimp farming, the average TE measured 0.90, meaning that there is still 10% room for increasing the output without utilizing more inputs. The main components of the technical efficiency improvement are stocking density, feed management, technical consultation, and the adoption of the biofloc system. On the other hand, [17] reported that one of the main reasons for the differences in farming efficiency among farmers is the aquaculture environment, including water quality and cultivation systems. This indicates that the differences in efficiency in grouper aquaculture in Indonesia can also be traced back to the diversity of coastal ecosystems and the farmers’ ability to adapt to changing environmental conditions.
2.3. Empirical Evidence of Grouper Aquaculture in Asia and Indonesia
Ref. [14] proposed that the global production of grouper reached at least 155,000 tons that valued at USD 630 million, of which Indonesia contributed about 11% of the total production. The use of low-value fish and the dependence on wild-caught seed are examples of unsustainable practices that, while aquaculture is providing some economic benefits, are degrading the resource efficiency and have a negative impact on the environment. A bioeconomic study in Taiwan revealed that the application of environment-friendly technologies increased grouper fertility by 18.6 tons/ha while at the same time decreasing power consumption by 1,510 kWh/ha every month [8]. This conclusion underlines the fact that the innovation in technology and the efficient management of feed are the main contributors to technical efficiency.
2.4. The Links of Livelihood Assets to Technical Efficiency
The connection between livelihood assets and technical efficiency can be further explained by cross-country empirical methods. [18] reported that education, training and counseling, stocking density, and access to loans contributed greatly to improve the technical efficiency of pond-based aquaculture in Nigeria, with an average TE at 81%. This research confirmed the role of human and financial capital in increasing productivity. In the case of Southeast Asia, [11] introduced a social aspect by reporting that being part of a producer group improved the technical efficiency by providing access to cheap inputs, market information, and institutional support. Thus, social capital like farmer groups and cooperatives in coastal areas should be strengthened as a strategic tool to improve the technical efficiency of grouper aquaculture in Indonesia.
2.5. Policy Implications and Sustainability
The research conducted in various countries points to the fact that the improvement of the technical efficiency of aquaculture can only come about through the collaboration of government policies, microfinance, and community-based extension systems. Taking Indonesia as an example, the poor coordination among the different institutions and the little technology adoption that took place were responsible for the existence of an efficiency gap of different regions [14,15]. In order to improve the sustainability of production and to gain even more access to international markets, the implementation of Better Management Practices (BMP) policies and getting the Aquaculture Stewardship Council’s ecolabel certificate are suggested. Furthermore, investing in education, technical training, and the strengthening of local cooperatives will be the conditions that have to be met to build a sustainable base of efficiency that will be advantageous to the small farmers.
3. Methods
A quantitative method was employed in this research in order to examine the association between livelihood assets and technical efficiency in grouper fish farming in ponds. The reason for this methodology was that it enables an objective evaluation of the efficiency level and a ranking of farmers’ technical performance based on different types of livelihood assets. Scoring and index were the methods used to evaluate the Livelihood assets [19], then Stochastic Frontier Analysis (SFA) to determine the technical efficiency, and finally, Tobit regression with robust standard errors was used to investigate the effect of livelihood assets on technical efficiency. This study provided a detailed picture of the connection between the farmers’ livelihood capacity and the technical efficiency of grouper aquaculture systems in ponds in the coastal area of Lamongan.
3.1. Time and Location of Research
The study was conducted in June 2025 in Lamongan, East Java, Indonesia, popularly referred to as Kampung Kerapu. This area is recognized as the largest and one of the most important places for pond-based grouper aquaculture on the Java north coast and also in Indonesia. The research area was about ±76 hectares, from the pond to the beach was approximately 50-300 meters. The chosen sites were based on the intensity of aquaculture activities, various technical practices, and the existence of production infrastructure such as water transport, access roads, and distribution facilities, among others. The high concentration of the research activities in this particular area allowed the researcher to carry out a thorough observation in respect of the aquaculture households and their aquaculture activities.
3.2. Type and Source of Data
The primary and secondary data were the two kinds used for this research. Primary data in the case of this research was obtained through structured interviews and direct observation in the field with the main respondents—the farmers cultivating grouper. A structured questionnaire was the research instrument that included the indicators of livelihood assets derived from the Sustainable Livelihood Framework [20,21], as well as production input-output variables. On the other hand, the secondary data came from publications by the Ministry of Maritime Affairs and Fisheries, the Central Bureau of Statistics of East Java Province, and academic reports of current scientific journals that were relevant to the issue at hand.
3.3. Population and Sample
The population for this study consisted of all the grouper farmers’ households located within the research area, which comprised a total of 105 fishery household units. The sampling method used was simple random sampling, which allows every element of the population to have an equal chance of being selected as a sample [22]. This choice of method was made in order to eliminate any biases in the distribution of the respondents and to ensure that the representation was proportional. The sample size was determined using the Slovin formula with an error rate of 5% [23], leading to 83 respondents being selected. This sample size was considered sufficient for statistical estimation with a high degree of confidence.
3.4. Instruments and Data Collection
The research tool was a structured questionnaire that had three major sections: (1) the identity of the respondent and characteristics of the business, (2) measures of livelihood resources such as human, natural, social, financial, and physical capital, and (3) input-output data of pond production. Data collection was done by direct interviews in the field, observation of pond conditions, and getting relevant documents from the concerned institutions.
3.5. Data Analysis Method
This analysis is conducted in several interrelated sections, and the analysis is as follows:
a. Livelihood Assets Analysis
The Livelihood assets analysis aimed to determine the capability of farmers in five main aspects: human, natural, social, financial, and physical capital [21]. Each capital was calculated by averaging the scores of the MSI transformation results and then normalizing them to an index scale of 0-1 with the formula:
The index values have been categorized into five groups: very low (0-19.99%), low (20-39.99%), moderate (40-59.99%), high (60-79.99%), and very high (80-100%). The index values for each capitals were shown in the form of an asset pentagon diagram where the further a point is from the center, the higher the access to that particular asset. This method is similar to the Sustainable Livelihood Framework concept of [20,24] which underlines the collaboration of capitals in attaining economic security.
b. Technical Efficiency Analysis (Stochastic Frontier Analysis/SFA)
The evaluation of technical efficiency was done via Stochastic Frontier Production Function with Maximum Likelihood Estimation (MLE) approach. This particular model works on the principle of partitioning the random error term (v) and the inefficiency component (u), which helps in knowing the degree of a production unit’s deviation from the efficiency frontier [25]. The basic formula of the model is presented as:
LnYI = Lnβ0 + β1LnX1 + β2LnX2 + β3LnX3 + β4LnX4 + β5LnX5 + β6LnX6 + vi - ui
The output of grouper production (Yi) is measured in kilograms, where (X1-X6) refers to the input parameters such as land area, number of seeds, amount of feed, amount of diesel fuel, amount of lime, and labor. The parameter estimation was done using STATA software, and the Technical Efficiency (TE) value was computed as follows:
TE = yᵢ/(yᵢ*) = exp (-uᵢ)
with the limit of 0 ≤ TE ≤ 1. A TE value of 1 means the full efficiency, on the other hand, TE<1 means the technical inefficiency.
c. Analysis of the Effect of Livelihood Assets on Technical Efficiency
The relationship among livelihood assets and technical efficiency were tested through Tobit regression with the dependent variable in the form of technical inefficiency (ui) estimated by SFA. The model equation can be written as:
ui = δ0 + δ1Z1 + δ2Z2 + δ3Z3 + δ4Z4+ δ5Z5 + δ6Z6 + δ7Z7 + δ8Z8 + δ9Z9 + δ10Z10 + δ11Z11 + δ12Z12 + δ13Z13 + δ14Z14 + δ15Z15 + δ16Z16 + δ17Z17 + δ18Z18 + δ19Z19 + δ20Z20 + wi
where (Z1-Z20) consists of indicators for each of the livelihood assets (education, skills, experience, health, land size, water source, water availability, climate change, social network, participation in organizations, access to information, social support, income, savings, credit/loans, debt, land status, house, equipment and vehicle). Initially, classical assumption tests comprising normality, multicollinearity and heteroscedasticity tests were carried out to validate the model. The analysis results were interpreted using the coefficient value and significance level (p-value) with STATA software assistance. This method is in line with the previous studies of [26] which highlighted the significance of livelihood assets in enhancing managerial and technical efficiency within the small-scale fisheries sector.
4. Results
4.1. Level of Livelihood Assets
The analysis of the livelihood assets level on pond-based grouper farmers in coastal area of Lamongan presented a complete picture of the farmers’ capacity to draw on different livelihood assets for the purpose of supporting their business sustainability. The assessment covered the five main components of livelihood assets which are human capital, natural capital, social capital, financial capital, and physical capital, and regarded them as a whole determining the productivity and economic security of farmers against environmental and market pressures. The discrepancy between capitals can have a positive or negative impact on the effectiveness of the livelihood strategy and the sustainability of the aquaculture system, thus making this evaluation significant. The analysis results is that the farmers’ livelihood assets level was moderate with varying strengths and weaknesses in each capital type as shown in Table 1 and Figure 1.
The interpretation of the data presented in the tables and bar graphs with regards to the livelihood assets of the farmers has led to a conclusion that the livelihood conditions of the farmers in the moderate category, with an average index of 0.47. The value represents the relative ability of farmers to access and utilize five key livelihood assets: human capital, natural capital, social capital, financial capital, and physical capital [27]. From the five types of assets, physical capital scored the highest by 0.55, indicating that the ownership of houses, equipment, and vehicles supports the physical capacity of grouper farmers, despite the fact that most of the land is still under a lease. This condition reflects economic stability and business independence, while the use of motorcycles as the main vehicle is an efficiency strategy according to geographical conditions. However, land access certainty still needs to be strengthened to ensure livelihood sustainability and long-term production efficiency. Furthermore, human capital (0.50) also took an important position because farmers with secondary education, adequate skills in pond management, and more than 10 years of experience can support in enhancing the business efficiency. Good family health also enhanced the productivity and sustainability of grouper aquaculture. Meanwhile, natural capital obtained a value of (0.46), indicating a moderate links between land area, water sources, water availability, and the impact of climate change in supporting grouper aquaculture. While the land size is relatively small, good quality and availability of seawater are key factors in sustaining the production. However, the threat of climate change poses a risk of fish diseases, therefore the water quality management and aquaculture adaptation are key to maintaining productivity and business security. Social capital (0.45) reflected the mutually reinforcing links between social networks, participation in organizations, access to information, and social support. Good interaction between the farmers drives knowledge exchange, while participation in groups expands access to training and assistance [28]. Access to information and family support also strengthen socioeconomic security, although organizational involvement still needs to be improved to strengthen business sustainability. Whereas financial capital is the weakest aspect with an index of only 0.37, representing the relationship between income, savings, loans and debts in supporting the sustainability of aquaculture businesses. A stable income reflected a strong financial capacity to support production, but limited savings indicated the need for better financial management. Low credit and debt activity signified a financial prudence, but also indicated the potential for improvement through more efficient financial management. Low financial capital also has an impact on the limited ability to expand production, adopt new technologies, and bear the risk of harvest failure [29,30].
This finding emphasizes that the level of livelihood assets of grouper farmers was moderate, with variations between assets reflecting the balance between individual capacity and access to resources. Physical and human capital were dominant in sustaining business efficiency and sustainability, while natural and social capital served as a support for environmental and socio-economic security. On the contrary, financial capital was a key limiting factor as a result of poor savings accumulation and access to finance. This finding is consistent with a literature stating that a combination of livelihood assets instead of only one type strengthening the capacity of small-scale aquaculture businesses [31], but comprehensive asset management is also needed to support the security and sustainability of fishery businesses [32].
From a theoretical perspective, the findings provide backing to the Sustainable Livelihood Framework (SLF) introduced by [21], which underlines the interaction of livelihood assets among each other when facing external vulnerabilities like price fluctuations, environmental changes, and production risks. Imbalance between capitals, for example, shouldered or led by high physical capital not accompanied by or paired with financial and social capital, might restrict the farmers’ ability to adapt and thus limit their efforts towards putting their resources to the best possible use, so the grouper aquaculture business development strategy should be directed to a multi-capital approach that equally distributes the investment among infrastructure, human capacity building, and access to finance and social services. In this way, the development of the livelihood assets will not only be aimed at economic growth but will also embrace social empowerment and environmental sustainability as part of the sustainable coastal development [20,33].
4.2. Level of Technical Efficiency
The technical efficiency level of grouper aquaculture in ponds has been the primary indicator to determine how far the farmers used their production resources to give the maximum output. Technical efficiency reflected the effectiveness of the input use combinations such as land area, quantity of seeds, amount of feed, amount of diesel fuel, amount of lime, and amount of labor, in producing a productive and sustainable harvest. In pond management, high efficiency indicates the ability of farmers to reduce the cost, reduce wastage, and maintain productivity stability despite facing various environmental conditions. On the contrary, low technical efficiency indicates potential improvements in management, technology or human resource capacity. In general, this efficiency analysis provides an overview about the economic and technical performance of grouper aquaculture businesses at the farmer level, which serves as the basis for formulating sustainable aquaculture development policies. The technical efficiency levels are described in Table 2 and Figure 2.
The analysis results of the technical efficiency of grouper aquaculture show that the majority of farmers have achieved high production and are close to maximum efficiency. Based on the measurement results with the Stochastic Frontier Analysis (SFA) approach, the average technical efficiency was 0.83 with a range of values between 0.59 and 0.94. This value indicated that in general, grouper farmers have been able to utilize about 83% of the existing optimal input potential. The efficiency distribution showed that 65.06% of respondents were in the efficient category (0.80-0.90), while 14.46% were classified as highly efficient (≥0.90). Only a small number (3.61%) were still below the minimum efficiency threshold (<0.70). The above chart illustrates the dominance of the efficient category as the peak of the distribution, indicating that the distribution of technical efficiency among farmers is relatively balanced with a positive trend towards high efficiency, indicating the homogeneity of input management practices and technology in the research area [34].
The high level of technical efficiency in grouper aquaculture was caused by several factors, including the ability of farmers to manage seed stocking densities consistently and the support of semi-intensive technology, consistent with the research studies of [16] and [35]. On the other side, low-efficiency farmer groups generally encounter a shortage of working capital, a lack of input diversification, and a poor technical knowledge of water quality management. This condition has confirmed the view that an increase in technical efficiency is not the result of using large amounts of inputs, but on the ability to allocate inputs optimally according to the conditions of the aquaculture environment [25]. The symmetrical normal distribution curve also indicates that the variation in efficiency between farmers is relatively small, indicating that most business units are operating at near-optimal production capacity.
The findings from this study showed that the pond-based grouper aquaculture business is technically efficient and moreover, it will be able to enhance productivity through management optimization. The average efficiency level by 0.83 implied that there was still an opportunity to increase production by around 17% without the need to increase production inputs, only by improving governance and technological innovation. Moreover, the high level of efficiency distribution showed that external factors such as infrastructure availability, institutional support, and access to technological information played a role in maintaining the stability of farmers’ technical performance [36]. Thus, the technical capacity building through training, technology assistance and facilitation of access to finance is a vital strategy to eliminate the difference in efficiency that is still there among the farmer groups. This is the same view as that of [37] who differentiated between technical, allocative, and economic efficiency in production. In this research, technical efficiency described to what extent farmers could maximize output from a given combination of inputs without regard to price or cost structure. A high level of efficiency indicated the success of the cultivation system in achieving the optimal input-output combination under certain technological conditions. In addition, this finding is also consistent with the frontier production function theory developed by [38], stating that variations in efficiency among farmers represent the influence of managerial factors, experience, and technology application on production performance. Consequently, it can be concluded that high level of technical efficiency in pond-based grouper aquaculture not only reflects successful management of production factors, but it is also an indicator of the sector’s readiness to deal with the modernization of sustainable aquaculture.
4.3. The Effect of Livelihood Assets on the Technical Efficiency
The effect of livelihood assets on the technical efficiency of pond-based grouper aquaculture in the coastal area of Lamongan showed that how the various assets owned by farmers, including human, natural, social, financial and physical capital, play a role in determining the level of productivity and the ability to manage resources efficiently. Such assets not only reflected the economic and technical capacity, but also described the adaptive capacity of farmers in the face of environmental and market dynamics. In grouper aquaculture business, the balance between asset types is key in reducing production inefficiencies and business sustainability. For this reason, this analysis was performed to identify the relative contribution of each asset to technical inefficiency and the relationship between variables affecting business performance. The results regarding the effect of each livelihood asset on the technical inefficiency of aquaculture are described in Table 3 and Figure 3.
Based on the estimation results of Tobit regression with robust standard errors, the links between livelihood assets and technical inefficiency indicate that there is a variation in contribution of each asset component to the production efficiency of grouper farmers. From the table of estimation results and the bar graph, we can see that most variables hold positive coefficients with various significance levels. From the natural capital aspect, the land size variable (δ₅Z₅) has a negative coefficient of -0.0373 and is significant at the 5% level (p = 0.012), implying that the larger the land size, the lower the level of technical inefficiency. It means that farmers with wider land ownership tend to be able to utilize production inputs more optimally. This particular result supports the findings of [25] and [16] who reported that land size is the most important factor in the growth of technical efficiency in aquaculture and agriculture [18]. On the other hand, the water source variable (δ₆Z₆) has a positive coefficient of 0.0284 and is significant at the 1% level (p = 0.001), suggesting water source capacity to increase inefficiency, which implies that the more the reliance on one water source, the more the potential of technical efficiency decrease. Regarding financial capital, the Z income (δ₁₃Z₁₃) and Z savings (δ₁₄Z₁₄) variables are equally significant at the 1% level (p = 0.001 and p = 0.008). This implicates that the higher the income and savings of farmers, the higher the level of technical inefficiency or the lower the technical efficiency. This condition may occur as the farmers with high income and savings tend to reduce production costs or do not allocate resources optimally.
On the contrary, other variables for human capital (education, skills, experience, health); natural capital (water availability, climate change); social capital (social networks, participation in organizations, access to information, social support); financial capital (credit, debt); and physical capital (status of land, houses, equipment, vehicles) showed no significant effect (p>0.05). This indicated that the capital dimension has yet to make a real contribution in explaining variations in technical inefficiency among the farmers, meaning that its role in improving the effectiveness of input use is relatively limited. In summary, it emphasizes that technical inefficiency is affected by the characteristics of natural and financial capital, while other capital has not made significant contributions in increasing or lowering the inefficiency.
The core findings of this analysis showed that the livelihood assets component contributed differently to the technical efficiency of grouper aquaculture. Natural capital, primarily land area, was a great contributor to the reduction of the technical inefficiency, while the reliance on water sources led to increased inefficiency. In the case of financial capital, high income and savings were linked to an increase in inefficiency, probably because of the poor allocation of resources. Human capital, social capital, and physical capital had no effect, which might mean that they were not contributing much to efficiency due to either respondent uniformity or inefficient asset use. Therefore, the technical efficiency improvement is mainly dependent on the co-operation of productive natural and financial capitals, which is further supported by the integration of human, social, and physical capacities.
The particular finding is in line with the Sustainable Livelihood Framework [20,21] that underlines that the sustainability of households and the efficiency of the economy depend on the optimal mix of the five capital inputs: human, social, natural, financial, and physical. Thus, the study results or findings revealed that multiplying one income source and having lots of assets actually determined the technical efficiency. Also, natural and financial capital brought in as direct factors accessed while human and social capital were regarded as the supporting factors. Thus, essentially, the notion in [39] that no or little welfare can be achieved without the interaction between assets and livelihood strategies. Theoretically, the positive links between income, savings, and technical efficiency illustrates the principle of livelihood resilience, which is the ability of the livelihood system to maintain productivity despite external pressures such as fluctuating feed prices or climate change. On the other hand, the negative links between credit and technical efficiency indicates the presence of financial vulnerability, where debt burden without productivity improvement might reduce the overall efficiency. The research results, therefore, have not only added to the literature regarding the significance of livelihood assets in the small-scale fishery economies [26], but also pointed out the major role of financial and natural capitals as the key enhancers of technical efficiency, the necessity for social empowerment and human capacity development as the supporting elements. Technical efficiency improvement schemes will not only depend on the supplying of assets but also on asset management, integration, and adaptive utilization to achieve long-term sustainability [24,40].
5. Discussion
The findings of this research confirmed that the measurement of livelihood assets showed that farmers’ livelihood conditions were in the “moderate” category with an average index of 0.47, which indicated a relative balance between capitals but with a significant weakness in the financial capital. Human and physical capital earned the highest scores, then came natural and social capital, while financial capital was the weakest point. This answers the first research question that variations among livelihood assets are the major factor in pond aquaculture sustainability. The absence of financial capital limits the farmers’ capacity to access technology and increase production. This finding aligns with the Sustainable Livelihood Framework [20,21] which points out the necessity of capital balance. On the other hand, the study’s contribution lies in its verification that financial deficits paving the way for livelihood imbalances may limit productivity even with relatively large human and physical capital, a situation that is not often pointed out in aquaculture studies in Southeast Asia.
The analysis of the technical efficiency of pond-base grouper aquaculture in the coastal area of Lamongan, Indonesia was classified as high, with an average technical efficiency (TE) value of 0.83. This number indicates that the majority of farmers have optimized input use to 83% of the maximum available potential. This outcome answers the second research question that the grouper aquaculture system in the research area is relatively technically efficient and there is still an opportunity to increase by 17% without additional new inputs. The equal distribution of efficiency also reflected the homogeneity of technical and managerial practices among farmers. This confirms the argument that the factors of feed management, water quality control, and the use of semi-intensive technology are key to successful pond efficiency [25]. Accordingly, these results showed that while the majority of farmers are still operating on a small scale, their ability to manage resources is close to best practice at the local level.
Tobit regression with robust standard errors provided empirical evidence of the effect of livelihood assets on the technical efficiency of grouper aquaculture. The findings show that land area has a significant negative effect on technical inefficiency, indicating that more land can help farmers optimize resource utilization and thus improve efficiency. On the contrary, the variables of water resources, income, and savings had a significant positive effect on technical inefficiency, indicating that there are challenges in resource management and financial utilization that have not been maximized in supporting efficiency. Other assets such as human, social and physical capital did not show significant effects, which may be the result of the homogeneity of the respondents or the limited utilization of these assets in aquaculture practices. This finding contradicts the research of [18] and [11] who ranked human and social capital as the key factors of efficiency. This dissimilarity can be explained by highlighting the weakness of human, social and physical capital, hence the need for effective management and optimization of natural and financial capital to improve efficiency in grouper aquaculture, as well as providing strategic directions for capacity building of farmers to optimize various capitals as a whole.
The theoretical contribution of this research is in the strengthening and development of the Sustainable Livelihood Framework (SLF) concept in explaining the linkages between livelihood assets and technical efficiency in the aquaculture sector. The research results emphasized that a balance between assets or the five main capitals (human, natural, social, financial and physical) is a pre-condition to achieve a sustainable production efficiency. The imbalance between assets, especially the poor financial capital despite the relatively strong human and physical capital, showed that efficiency depends not only on the availability of assets, but also on the synchronized function of capital in supporting the production performance and sustainability of aquaculture businesses.
The practical implications of this research showed that the enhancement of technical efficiency in pond-based grouper aquaculture in the coastal area of Lamongan should be directed at strengthening and balancing livelihood assets. Local governments and stakeholders need to prioritize the enhancement of access to microfinance and the financial management of farmers to strengthen their weak financial capital. Besides, technical training support, institutional strengthening of groups, and better production facilities and water infrastructure provision will lead to the rise of the capital’s human, social, and physical effectiveness. This integrative approach is important to make it possible for all livelihood assets to work together in a positive way that will increase the technical efficiency, productivity, and sustainability of aquaculture businesses in coastal areas.
From the methodological perspective, the major merit of this research lies in utilizing a combination of Stochastic Frontier Analysis (SFA) and Tobit regression with robust variance that allows for a simultaneous assessment of technical inefficiency and its associated factors. This method provides a better degree of accuracy in estimation than nonparametric approaches like DEA since it has the capability of distinguishing random errors from inefficiency components [36,38]. Nonetheless, its limitation is the cross-sectional character of the data, which cannot depict the efficiency dynamics across periods and the possibility of bias introduced by the environmental variables that have not been completely accounted for. Moreover, even though the livelihood assets index was standardized, assessments based on respondents’ perceptions may contain subjectivity. Therefore, further research using panel data and integrating biophysical data is recommended to strengthen the analysis model.
Overall, this research opens up new paths in the study of technical efficiency in aquaculture by positioning livelihood assets as an important factor. While most aspects of human, social, and physical capital did not contribute significantly due to the similarity of respondent characteristics, natural and financial capital greatly influenced technical efficiency. As the scarcity of research testing the role of capital in dynamic efficiency, it is suggested that future research should combine spatial approaches and panel models to understand climate change and the role of local institutions in promoting the concept of asset-based sustainability, assessing the social, economic, and ecological resilience of coastal communities in an integrated manner.
6. Conclusions
This research suggested that the analysis of livelihood assets of farmers was in the moderate category with an index of 0.47, where human, natural, social, and physical capital were relatively moderate, while financial capital was still low. Technical efficiency was high, with an average efficiency of 0.83, reflecting the optimization of inputs up to 83% of the maximum potential. The key factors affecting the efficiency were seedling management and semi-intensive technology support. The results of the Tobit regression with robust standard errors showed that financial capital (income and savings) and natural capital (land size and water resources) had a significant effect on technical efficiency, while human, social, and physical capital did not have a significant impact. These findings support the theory of asset-based efficiency in aquaculture and emphasize the importance of enhancing the natural and financial capital for sustainable productivity in coastal area.
To enhance the business sustainability and technical efficiency of pond-based grouper aquaculture in the coastal area of Lamongan, there is a need for policies focusing on access to low-interest microfinance, financial literacy, and diversification of family income sources. Local governments need to strengthen irrigation systems and pond water quality management. Moreover, educational and extension institutions need to provide more extensive technical and managerial training. Social institutions such as cooperatives and farmer groups need to be optimized as information sharing and market collaboration platforms. This research has its limitations since it used a cross-sectional data that did not capture the time changes and micro-environmental aspects. Future research is recommended to use panel data and spatial approaches to assess interactions between assets in the context of climate change and to integrate local institutions into technical efficiency models.
Author Contributions
Conceptualization, W.S.; Methodology, N.H., S. and A.W.M.; Software, W.S. and S.; Validation, N.H. and A.W.M.; Formal Analysis, W.S. and S.; Investigation, W.S.; Data Curation, W.S. and S.; Writing – Original Draft Preparation, W.S., N.H., S. and A.W.M.; Writing – Review & Editing, W.S., N.H., S. and A.W.M.; Visualization, W.S.; Supervision, N.H. and A.W.M.; Project Administration, W.S. All authors have read and approved the published version of this manuscript.
Funding
This research did not receive funding from external sources.
Institutional Review Board Statement
The Approval Letter of Ethics for this research was approved by Institute for Research, Development and Community Service, Universitas Islam Lamongan, No. 1906/UNISLA.C10/PN/VI/2025.
Informed Consent Statement
This article approach reported a quantitative study based on data collection through questionnaires from respondents at the research location. Informed consent was collected from all respondents before the commencement of the research. Additionally, the participants were informed about the purpose, methodology, and expected results of the research, including confidentiality guarantees. The participation was voluntary; moreover, the possibility to withdraw at any time without consequences is provided. No personal information identifying the respondents is included in the publication of the results for privacy reasons.
Data Availability Statement
The data is available in the article.
Acknowledgments
Special thanks to all respondents and fisheries extension officers who were willing to provide the necessary data and information during the research. Furthermore, we would like to thank the Library of Universitas Brawijaya for its assistance in writing this journal article.
Conflicts of Interest
The authors declare there is no conflict of interest.
References
- Bene, C.; Arthur, R.; Norbury, H.; Allison, E.H.; Beveridge, M.; Bush, S.; Campling, L.; Leschen, W.; Little, D.; Squires, D.; et al. Contribution of Fisheries and Aquaculture to Food Security and Poverty Reduction: Assessing the Current Evidence. World Dev 2016, 79, 177–196. [Google Scholar] [CrossRef]
- Naylor, R.L.; Hardy, R.W.; Buschmann, A.H.; Bush, S.R.; Cao, L.; Klinger, D.H.; Little, D.C.; Lubchenco, J.; Shumway, S.E.; Troell, M. A 20-Year Retrospective Review of Global Aquaculture. Nature 2021, 593, E12. [Google Scholar] [CrossRef] [PubMed]
- Troell, M.; Costa-Pierce, B.; Stead, S.; Cottrell, R.S.; Brugere, C.; Farmery, A.K.; Little, D.C.; Strand, Å.; Pullin, R.; Soto, D.; et al. Perspectives on Aquaculture’s Contribution to the Sustainable Development Goals for Improved Human and Planetary Health. J World Aquac Soc 2023, 54, 251–342. [Google Scholar] [CrossRef]
- Food and Agriculture Organization of the United Nations. the State of World Fisheries and Aquaculture 2020: Sustainability in Action; American Oil Chemists Society: Rome, 2020; Vol. 32. [Google Scholar]
- Ali Hamad, W.; Md Nurul Islam, G. The Role of Livelihood Assets on the Improvement of the Livelihoods of Fisher Households in Zanzibar. American Journal of Environmental and Resource Economics 2022, 7, 25–36. [Google Scholar] [CrossRef]
- Tan, D.N. How Do Livelihood Assets Affect the Environmental Sustainability of Shrimp Farming? A Case Study in Tra Vinh Province, Vietnam. Egypt J Aquat Biol Fish 2021, 25, 15–41. [Google Scholar] [CrossRef]
- Jueseah, A.S.; Tómasson, T.; Knutsson, O.; Kristofersson, D.M. Technical Efficiency Analysis of Coastal Small-Scale Fisheries in Liberia. Sustainability (Switzerland) 2021, 13. [Google Scholar] [CrossRef]
- Cheng, A.C.; Yang, T.Y.; Lai, C.H.; Li, Y.S.; Luo, Y.F.; Chuang, H.C. Economic Benefit Analysis of the Application of Eco-Friendly Aquaculture Technology in the Farming of Groupers and the Fourfinger Threadfin. Journal of Environmental Management 2024, 371. [Google Scholar] [CrossRef]
- Su, Y.; Yu, H.; Gao, C.; Sun, S.; Liang, Y.; Liu, G.; Wang, M. Effects of Vegetation Cover and Aquaculture Pollution on Viral Assemblages in Mangroves Sediments. J Hazard Mater 2024, 476. [Google Scholar] [CrossRef]
- Islam, G.M.N.; Tai, S.Y.; Kusairi, M.N. A Stochastic Frontier Analysis of Technical Efficiency of Fish Cage Culture in Peninsular Malaysia. Springerplus 2016, 5. [Google Scholar] [CrossRef]
- Adetoyinbo, A.; Otter, V. Can Producer Groups Improve Technical Efficiency Among Artisanal Shrimpers in Nigeria? A Study Accounting for Observed and Unobserved Selectivity. Agricultural and Food Economics 2022, 10, 1–11. [Google Scholar] [CrossRef]
- Obiero, K.O.; Waidbacher, H.; Nyawanda, B.O.; Munguti, J.M.; Manyala, J.O.; Kaunda-Arara, B. Predicting Uptake of Aquaculture Technologies Among Smallholder Fish Farmers in Kenya. Aquaculture International 2019, 27, 1689–1707. [Google Scholar] [CrossRef]
- Aung, Y.M.; Khor, L.Y.; Tran, N.; Shikuku, K.M.; Zeller, M. Technical Efficiency of Small-Scale Aquaculture in Myanmar: Does Women’s Participation in Decision-Making Matter. Aquac Rep 2021, 21, 1. [Google Scholar] [CrossRef]
- Rimmer, M.A.; Glamuzina, B. A Review of Grouper (Family Serranidae: Subfamily Epinephelinae) Aquaculture from a Sustainability Science Perspective. Rev Aquac 2017, 1–30. [Google Scholar] [CrossRef]
- Ismail, K.; Vitasari, H.; Habibah, S.N. The Low Level of Sustainability of Fishing Households Livelihood Assets Around Marine Conservation Areas. BIO Web Conf 2023, 70, 1. [Google Scholar] [CrossRef]
- Kumaran, M.; Anand, P.R.; Kumar, J.A.; Ravisankar, T.; Paul, J.; Vasagam, K.P.K.; Vimala, D.D.; Raja, K.A. Is Pacific White Shrimp (Penaeus Vannamei) Farming in India Is Technically Efficient? — A Comprehensive Study. Aquaculture 2017, 468, 262–270. [Google Scholar] [CrossRef]
- Mitra, S.; Khan, M.A.; Nielsen, R.; Islam, N. Total Factor Productivity and Technical Efficiency Differences of Aquaculture Farmers in Bangladesh: Do Environmental Characteristics Matter. J World Aquac Soc 2020, 51, 1–13. [Google Scholar] [CrossRef]
- Ogundari, K.O.S.O. An Examination of Income Generation Potential of Aquaculture Farms in Alleviating Household Poverty: Estimation and Policy Implications from Nigeria Introduction. Turk J Fish Aquat Sci 2009, 9, 39–45. [Google Scholar]
- Li, H.; Nijkamp, P.; Xie, X.; Liu, J. A New Livelihood Sustainability Index for Rural Revitalization Assessment-A Modelling Study on Smart Tourism Specialization in China. Sustainability (Switzerland) 2020, 12, 1–18. [Google Scholar] [CrossRef]
- Scoones, I. Sustainable Rural Livelihoods a Framework for Analysis I D S Working Paper 7 2; 1998. [Google Scholar]
- DFID. Sustainable Livelihoods Guidance Sheets; 1999. [Google Scholar]
- Krejcie, R. V Determining Sample Size for Research Activities. Educ Psychol Meas 1970, 30, 607–610. [Google Scholar] [CrossRef]
- Noor, J. Metodologi Penelitian: Skripsi, Tesis, Disertasi & Karya Ilmiah, 1st ed.; Kencana: Jakarta, 2011; ISBN 978-602-3730-82-2. [Google Scholar]
- Ellis, F. Rural Livelihoods and Diversity in Developing Countries; Oxford University Press: Oxford, 2000; ISBN 0-19-829696-7. [Google Scholar]
- Coelli, T.J.; Prasada Rao, D.S.; O’Donnel, C.J.; Battese, G.E. An Introduction to Efficiency and Productivity Analysis; 2nd Edition; Springer: New York, 2005; ISBN 978-0-387-24265-1. [Google Scholar]
- Allison, E.H.; Ellis, F. The Livelihoods Approach and Management of Small-Scale Fisheries. Mar Policy 2001, 25, 377–388. [Google Scholar] [CrossRef]
- Torres, B.; Cayambe, J.; Paz, S.; Ayerve, K.; Heredia-R, M.; Torres, E.; Luna, M.; Toulkeridis, T.; García, A. Livelihood Capitals, Income Inequality, and the Perception of Climate Change: A Case Study of Small-Scale Cattle Farmers in the Ecuadorian Andes. Sustainability (Switzerland) 2022, 14. [Google Scholar] [CrossRef]
- Manlosa, A.O.; Albrecht, J.; Riechers, M. Social Capital Strengthens Agency Among Fish Farmers: Small Scale Aquaculture in Bulacan, Philippines. Frontiers in Aquaculture 2023, 2, 1–14. [Google Scholar] [CrossRef]
- Mitra, S.; Khan, M.A.; Nielsen, R. Credit Constraints and Aquaculture Productivity. Aquaculture Economics and Management 2019, 23, 410–427. [Google Scholar] [CrossRef]
- Ayim, C.; Kassahun, A.; Addison, C.; Tekinerdogan, B. Adoption of ICT Innovations in the Agriculture Sector in Africa: A Review of the Literature. Agric Food Secur 2022, 11, 16. [Google Scholar] [CrossRef]
- Stacey, N.; Gibson, E.; Loneragan, N.R.; Warren, C.; Wiryawan, B.; Adhuri, D.S.; Steenbergen, D.J.; Fitriana, R. Developing Sustainable Small-Scale Fisheries Livelihoods in Indonesia: Trends, Enabling and Constraining Factors, and Future Opportunities. Mar Policy 2021, 132. [Google Scholar] [CrossRef]
- Prayitno, G.; Auliah, A.; Efendi, A.; Hayat, A.; Subagiyo, A.; Salsabila, A.P. The Role of Livelihood Assets in Affecting Community Adaptive Capacity in Facing Shocks in Karangrejo Village, Indonesia. Economies 2025, 13. [Google Scholar] [CrossRef]
- Bebbington, A. Capitals and Capabilities: A Framework for Analyzing Peasant Viability, Rural Livelihoods and Poverty. World Dev 1999, 27, 2021–2044. [Google Scholar] [CrossRef]
- Khan, M.A.; Begum, R.; Nielsen, R.; Hoff, A. Production Risk, Technical Efficiency, and Input Use Nexus: Lessons from Bangladesh Aquaculture. J World Aquac Soc 2021, 52, 57–72. [Google Scholar] [CrossRef]
- Maucieri, C.; Nicoletto, C.; Zanin, G.; Birolo, M.; Trocino, A.; Sambo, P.; Borin, M.; Xiccato, G. Effect of Stocking Density of Fish on Water Quality and Growth Performance of European Carp and Leafy Vegetables in a Low-Tech Aquaponic System. PLoS One 2019, 14. [Google Scholar] [CrossRef]
- Battese, G.E.; Coelli, T.J. A Model for Technical Inefficiency Effects in a Stochastic Frontier Production Function for Panel Data. Empir Econ 1995, 20, 325–332. [Google Scholar] [CrossRef]
- Farrell, M.J. The Measurement of Productive Efficiency. Source: Journal of the Royal Statistical Society. Series A (General) 1957, 120, 253–290. [Google Scholar] [CrossRef]
- Aigner, D.; Lovell, C.A.K.; Schmidt, P. Formulation and Estimation of Stochastic Frontier Production Function Models*. J Econom 1977, 6, 21–37. [Google Scholar] [CrossRef]
- Chambers, R.; Conway, G. Sustainable Rural Livelihoods: Practical Concepts for the 21st Century; Brighton, UK, 1992. [Google Scholar]
- Scoones, I. Sustainable Livelihoods and Rural Development Agrarian Change & Peasant Studies; Practical Action Publishing: Rugby, UK, 2015; ISBN 978-1-85339-874-1. [Google Scholar]
Figure 1.
Index of livelihood assets.
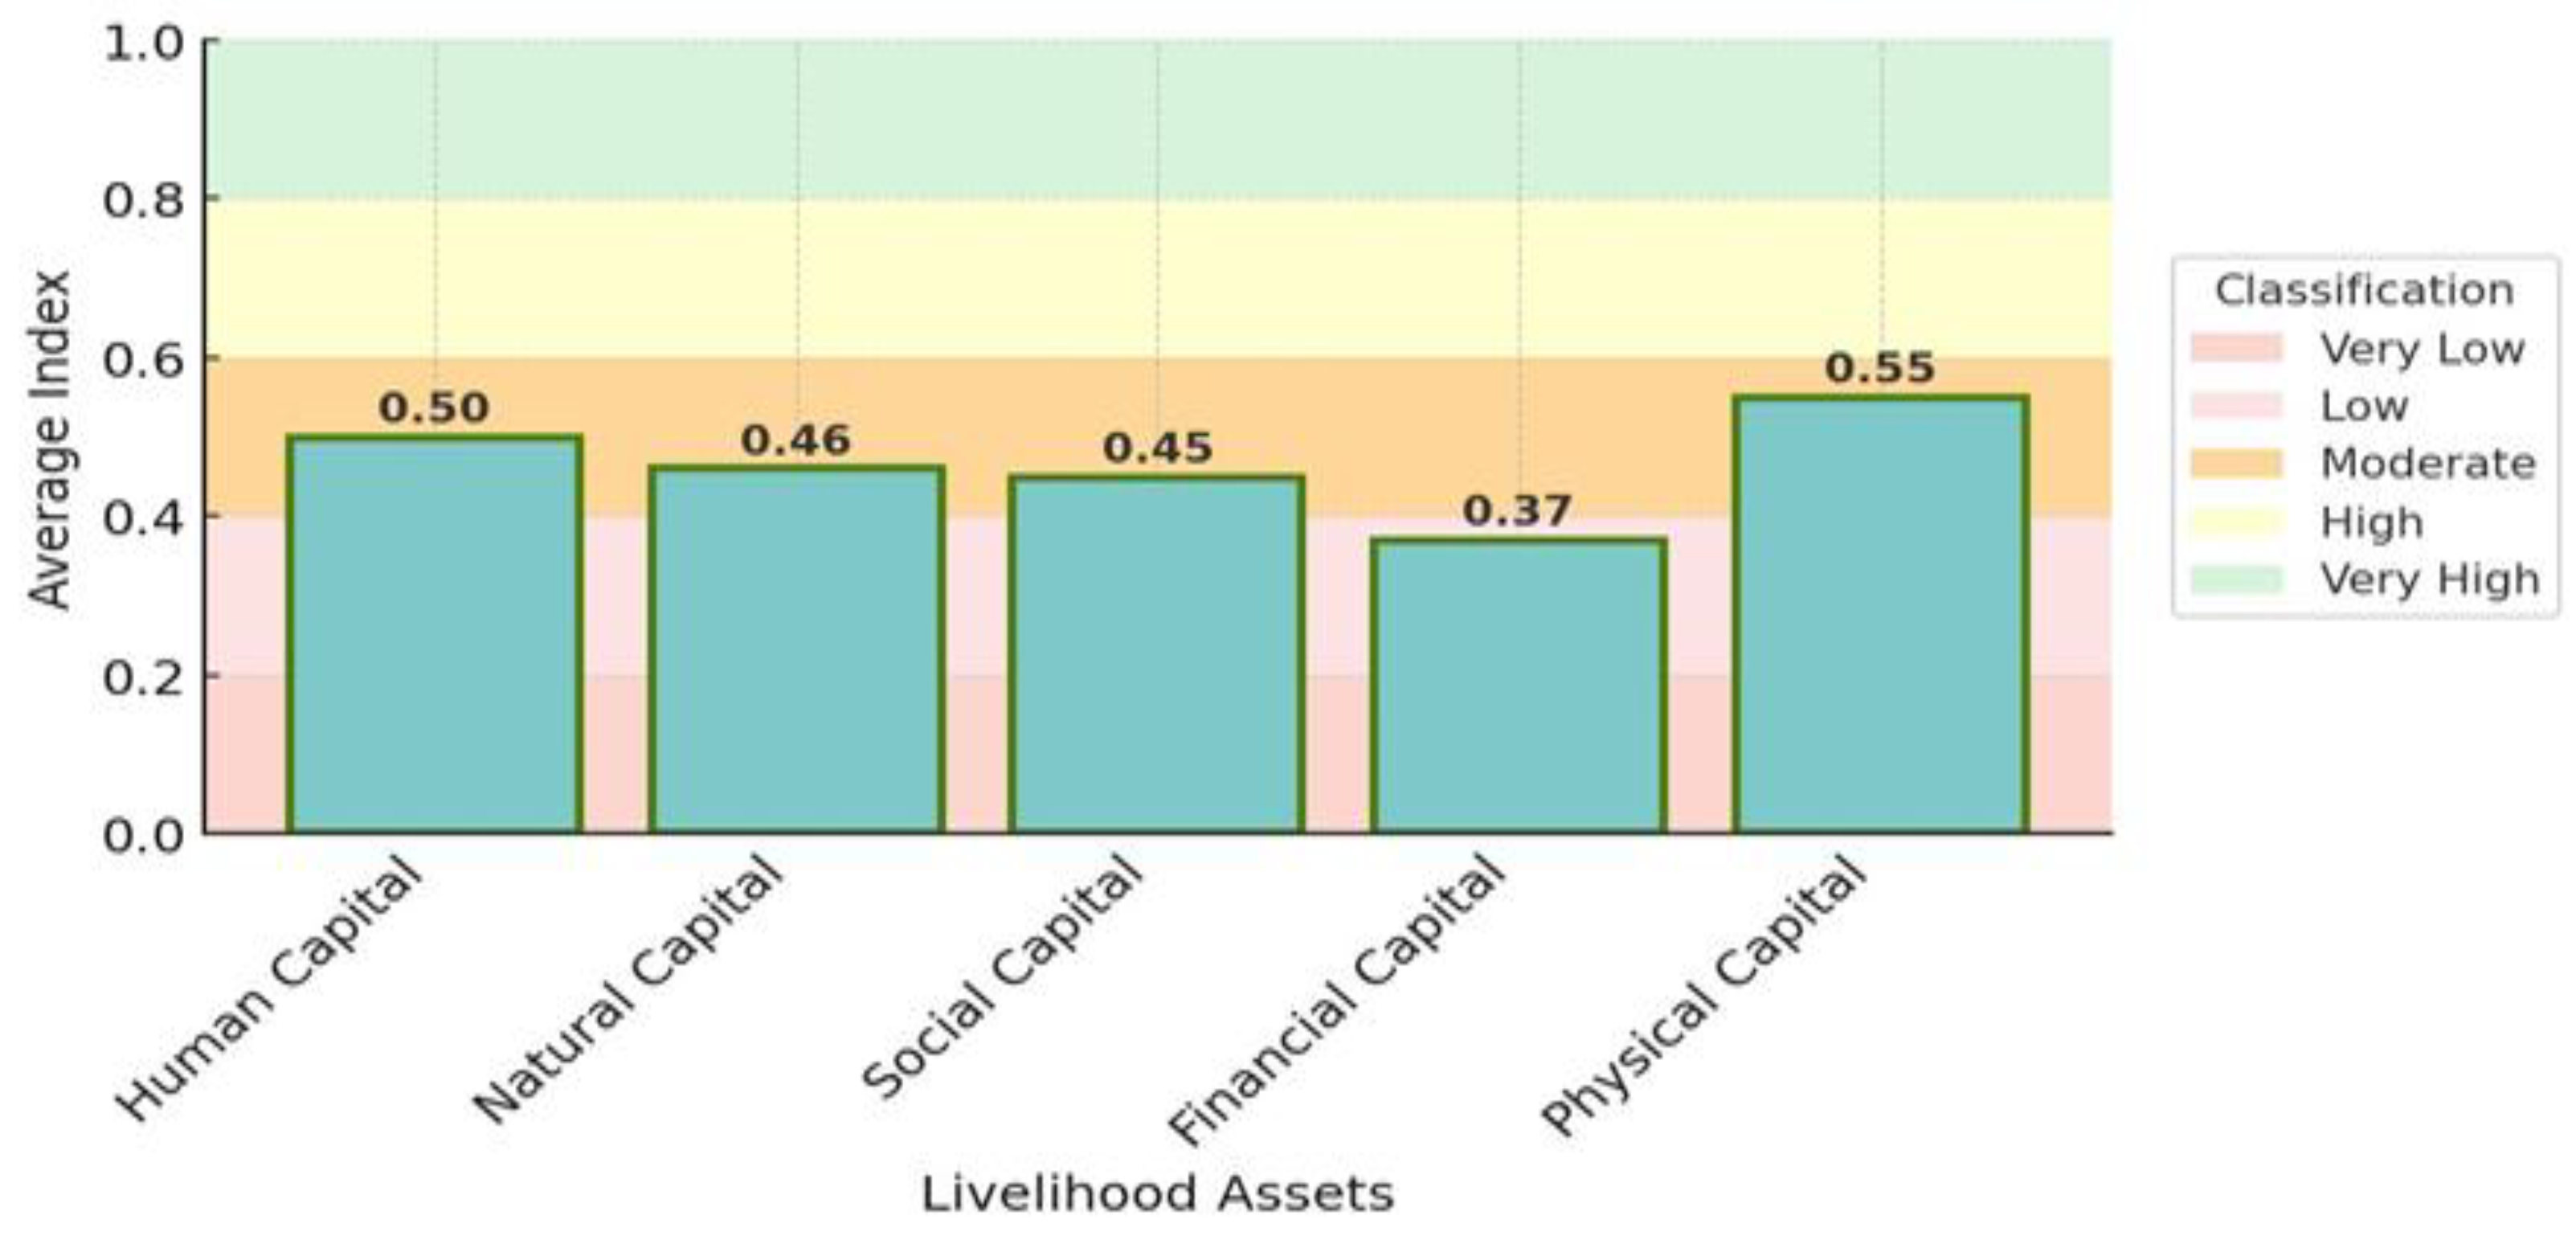
Figure 2.
Distribution of Technical Efficiency Level.
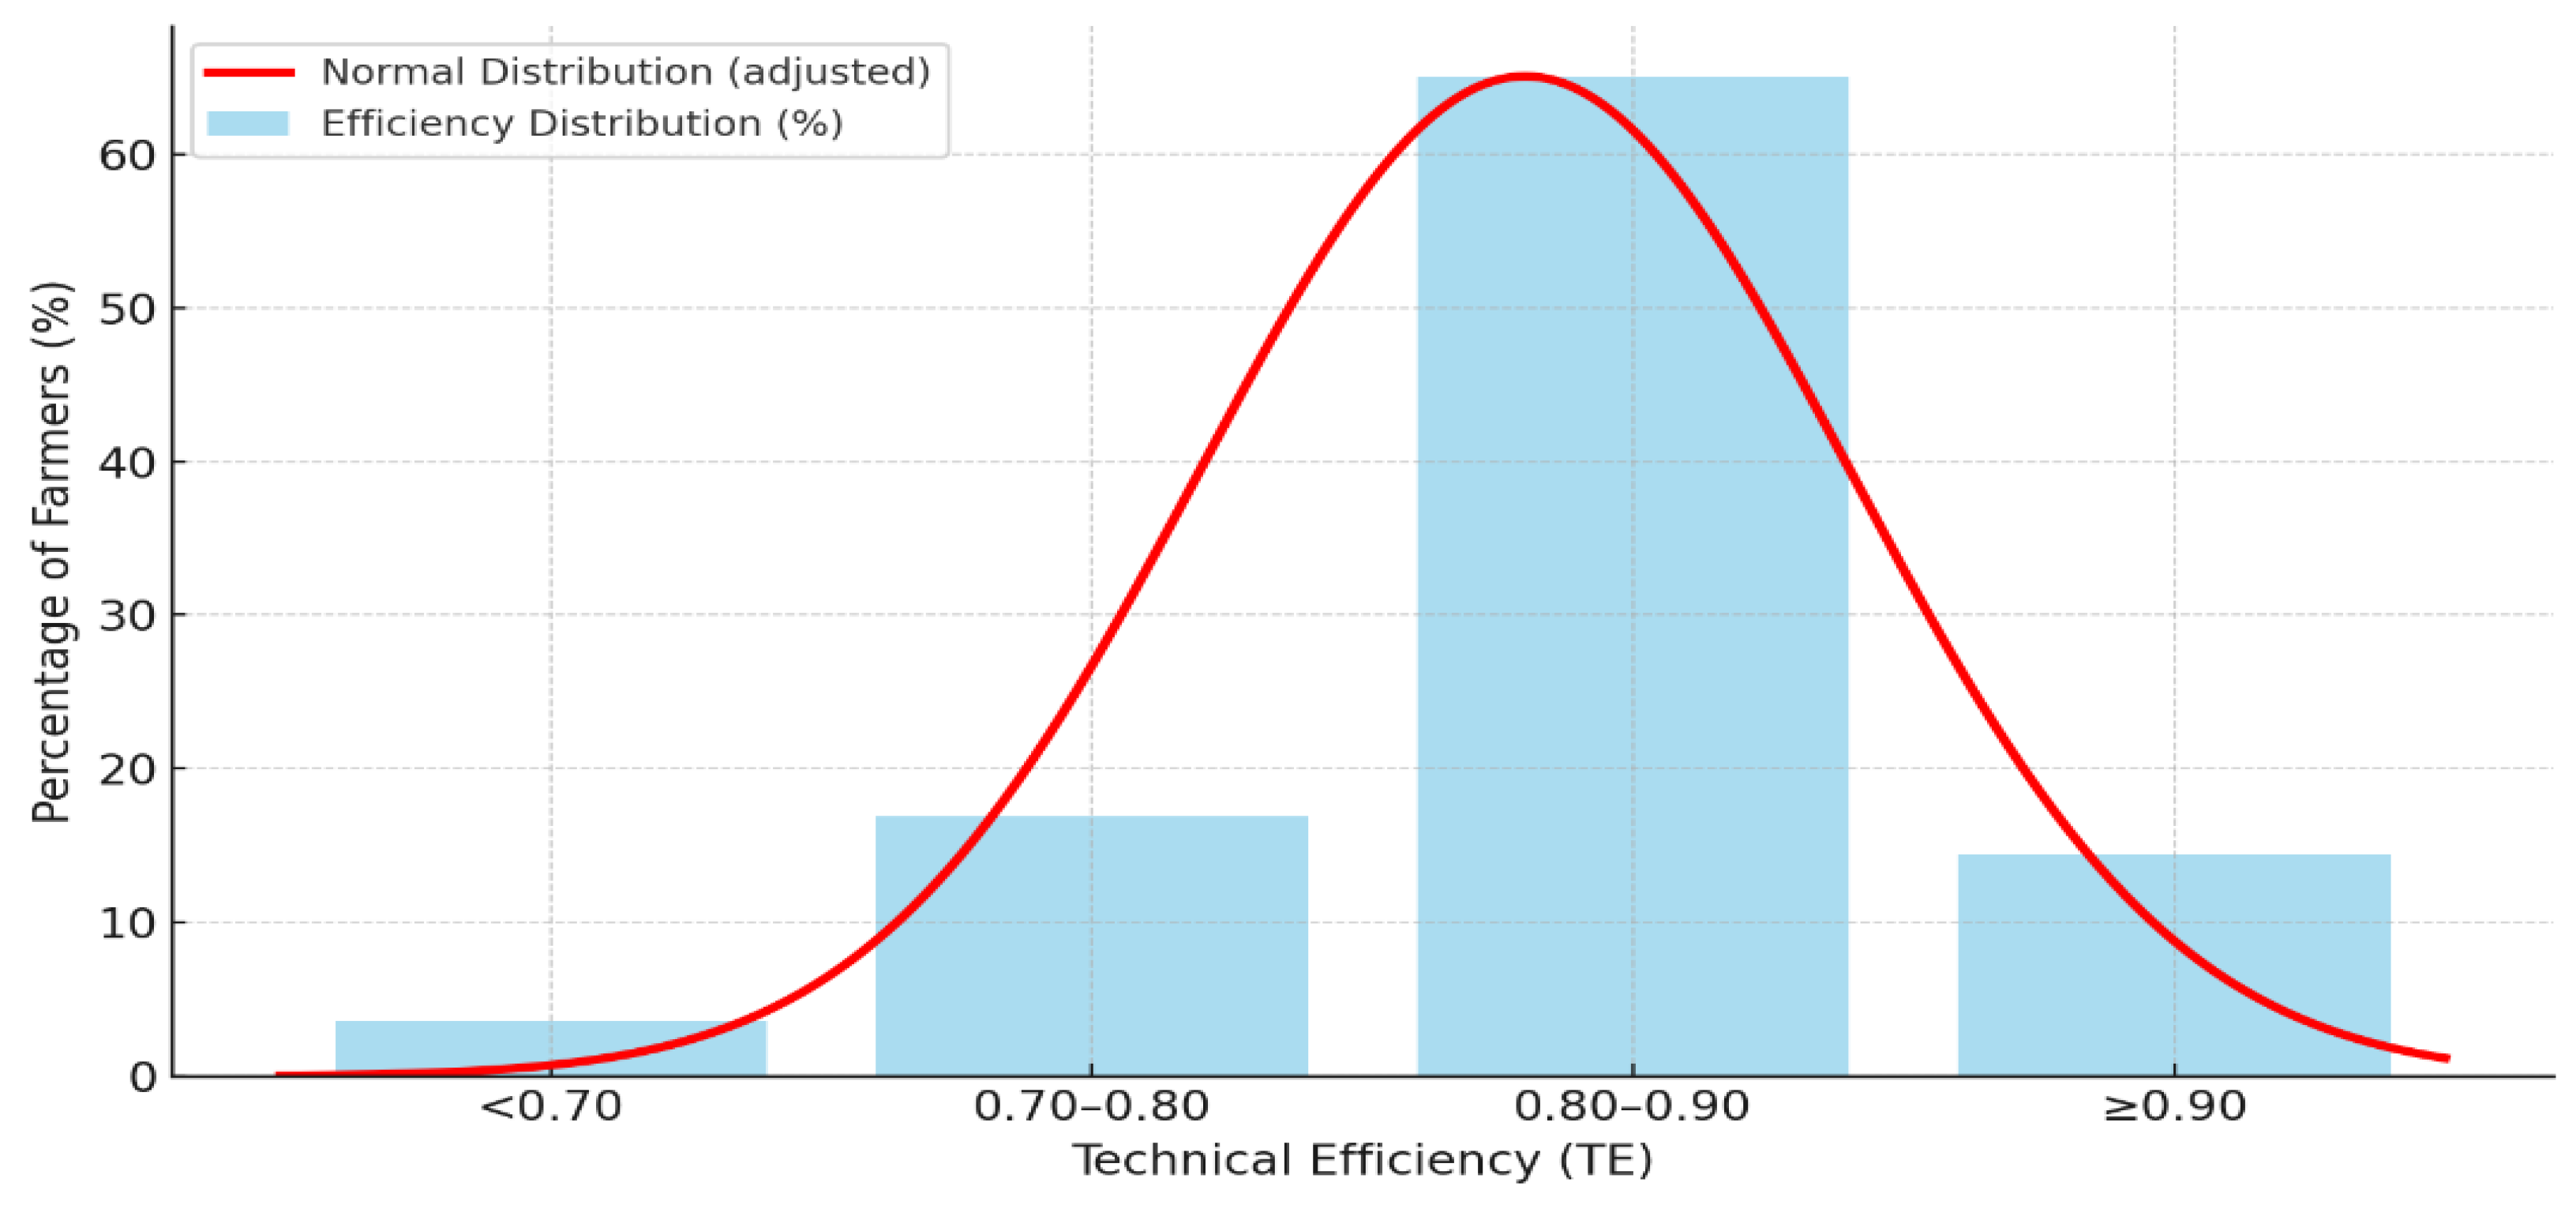
Figure 3.
Estimation of the Effect of Livelihood Assets on Technical Inefficiency.
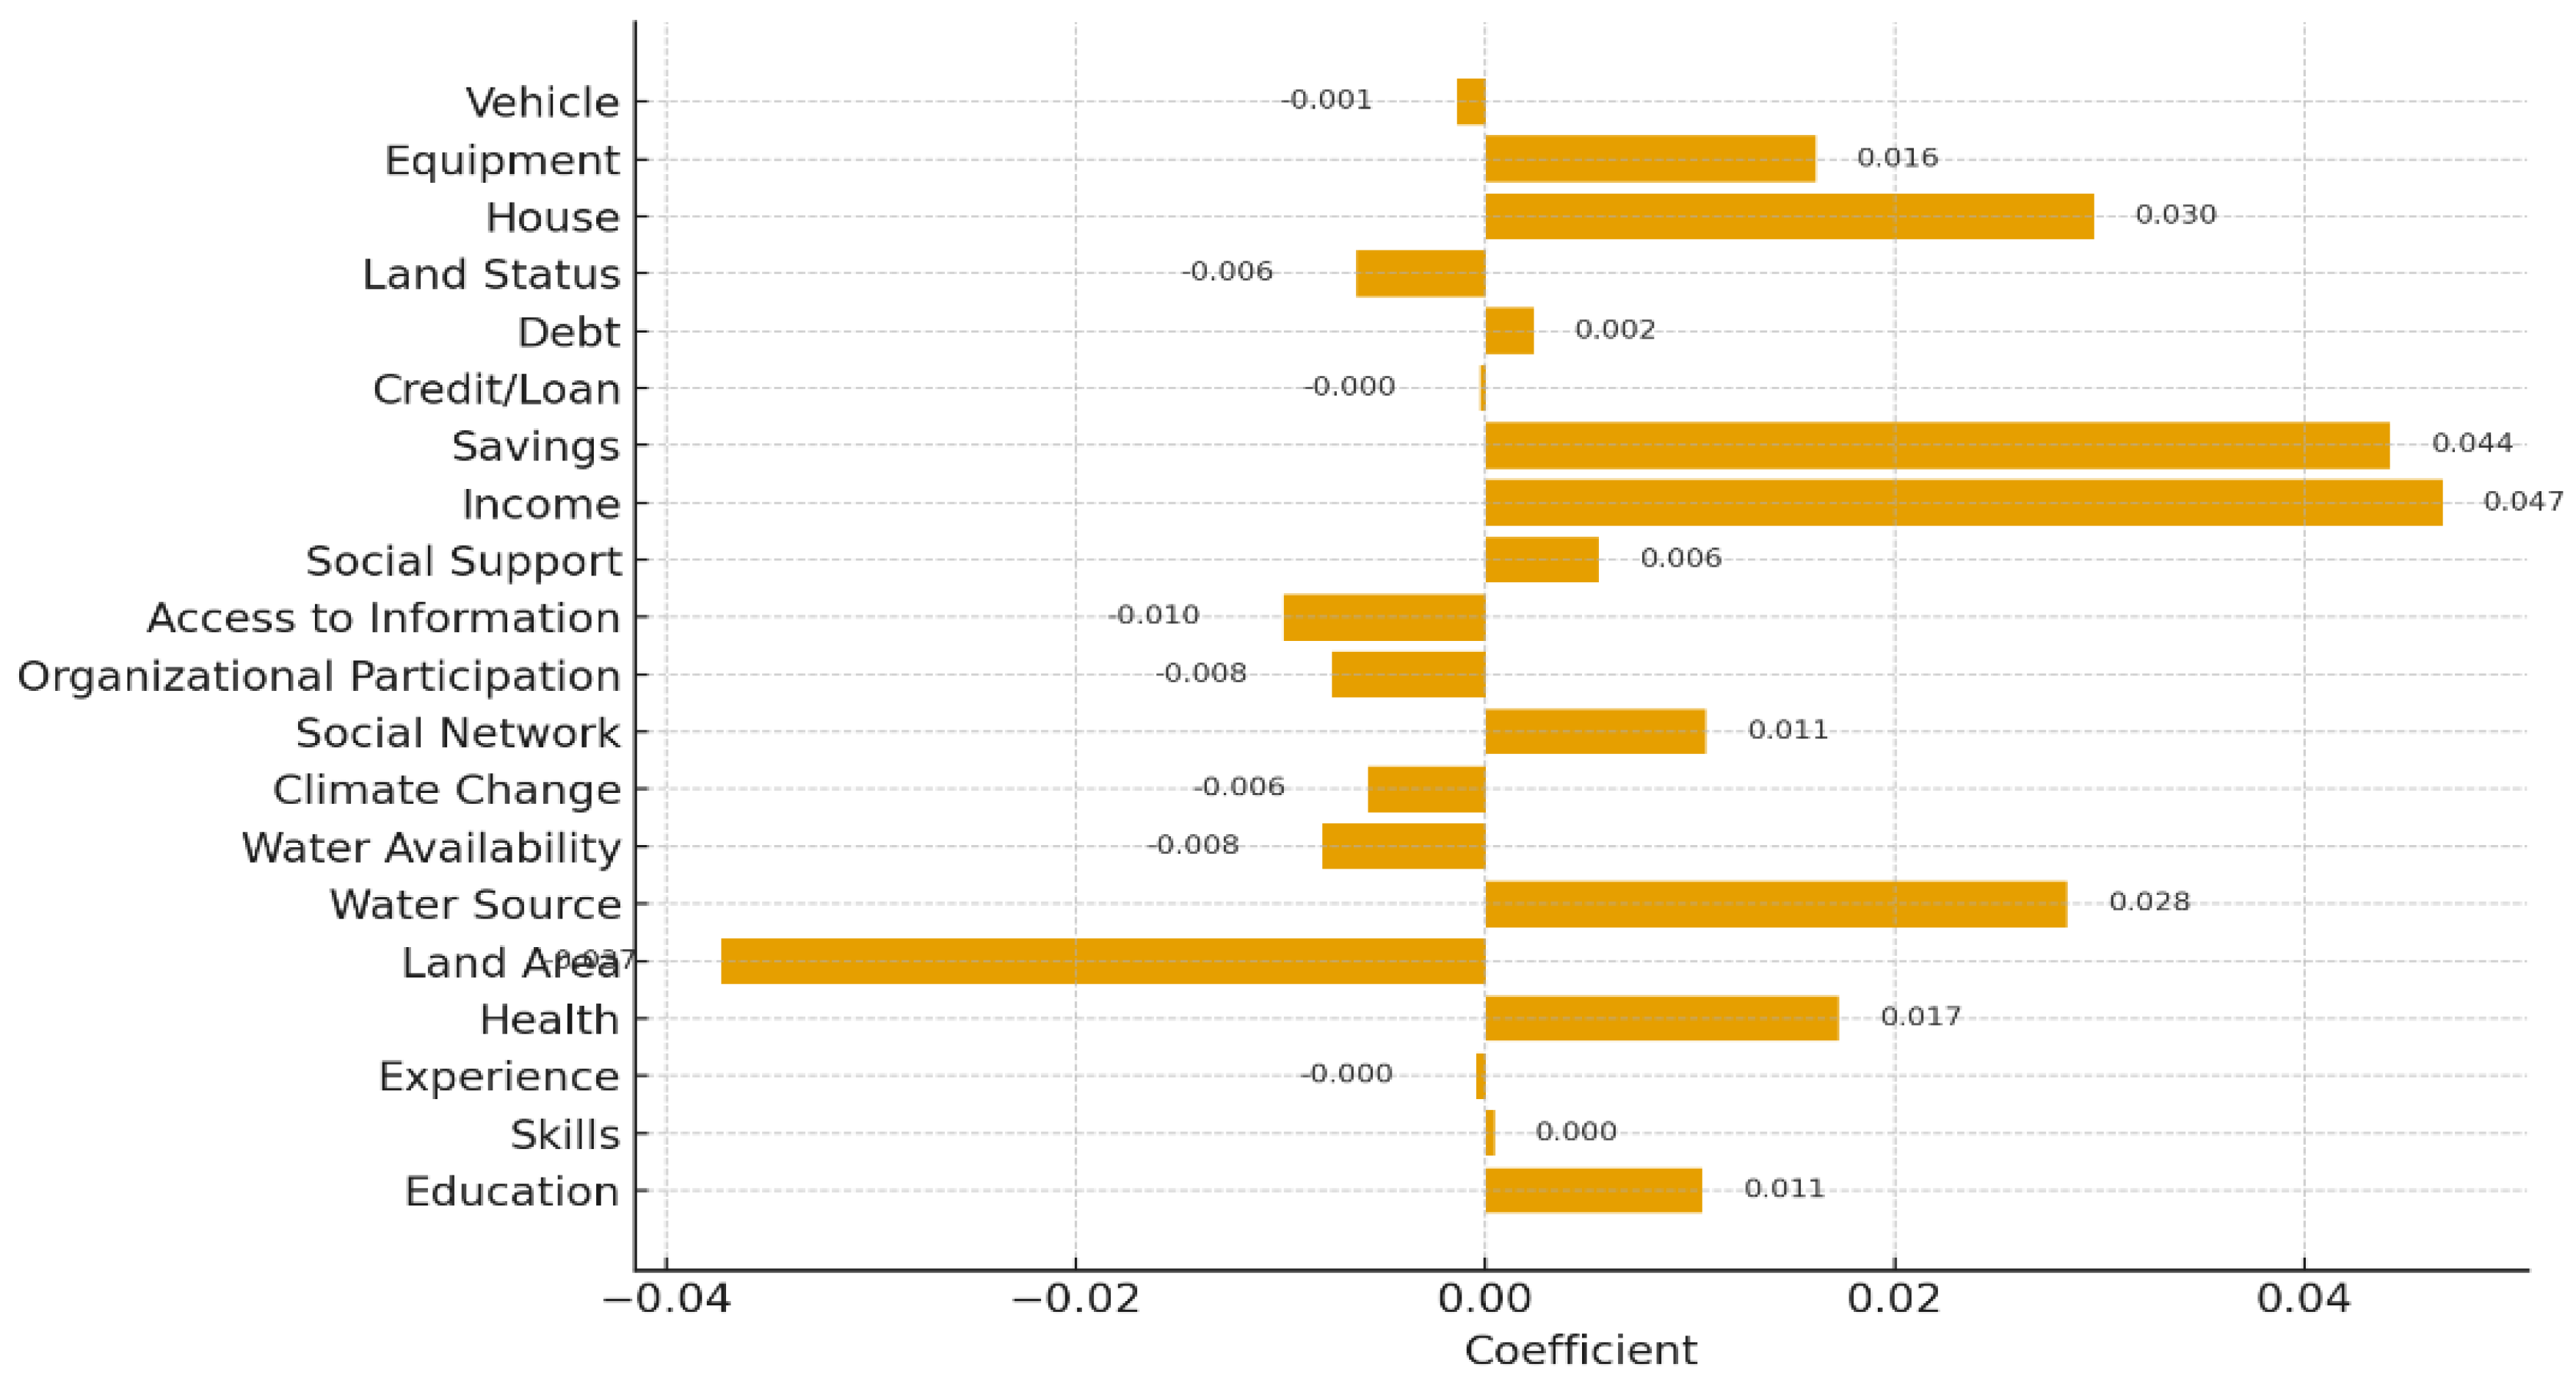

Table 1.
Index of livelihood assets.
| No | Types of Livelihood Assets | Average Score | Average Index | Percentage (%) | Classification |
|---|---|---|---|---|---|
| 1 | Human Capital | 3.01 | 0.50 | 50 | Moderate |
| 2 | Natural Capital | 2.86 | 0.46 | 46 | Moderate |
| 3 | Social Capital | 2.79 | 0.45 | 45 | Moderate |
| 4 | Financial Capital | 2.48 | 0.37 | 37 | Low |
| 5 | Physical Capital | 3.19 | 0.55 | 55 | Moderate |
| Total | 0.47 | 47 | Moderate |
Table 2.
Distribution of technical efficiency Value.
| Value | Number of Farmers (People) | Percentage (%) | Interpretation of Business Performance |
|---|---|---|---|
| < 0,70 | 3 | 3,61 | Inefficient; non-optimal use of inputs |
| ≥ 0,70 – < 0,80 | 14 | 16,87 | Moderately efficient; there is still potential for improvement |
| ≥ 0,80 – < 0,90 | 54 | 65,06 | Efficient; the majority of businesses utilize the effective inputs |
| ≥ 0,90 | 12 | 14,46 | Highly efficient; close to maximum efficiency |
| Total | 83 | 100 | |
| Average TE | 0,83 | ||
| Standard Deviation (σ) | 0,06 | ||
| TE Minimum Value | 0,59 | ||
| Maximum Value TE | 0,94 |
Table 3.
Estimation of the Effect of Livelihood Assets on Technical Inefficiency.
| Variables | Parameter | Tobit vce (robust) Regression Analysis | |||
|---|---|---|---|---|---|
| Coefficient | Std.err. | t | P>|t| | ||
| _Cons | δ0Z0 | 0.3450292 | 0.1378352 | 2.50 | 0.015 |
| Education | δ1Z1 | 0.010581 | 0.0108216 | 0.98 | 0.332 |
| Skills | δ2Z2 | 0.0004108 | 0.0100828 | 0.04 | 0.968 |
| Experience | δ3Z3 | -0.0004468 | 0.0125811 | -0.04 | 0.972 |
| Health | δ4Z4 | 0.0172567 | 0.0146496 | 1.18 | 0.243 |
| Land Area | δ5Z5 | -0.037339 | 0.0144101 | -2.59 | 0.012 |
| Water source | δ6Z6 | 0.0284048 | 0.0085174 | 3.33 | 0.001 |
| Water availability | δ7Z7 | -0.007971 | 0.0172092 | -0.46 | 0.645 |
| Climate change | δ8Z8 | -0.0057031 | 0.0111866 | -0.51 | 0.612 |
| Social network | δ9Z9 | 0.0107716 | 0.0094441 | 1.14 | 0.258 |
| Participation in organization | δ10Z10 | -0.0075363 | 0.0075957 | -0.99 | 0.325 |
| Access to information | δ11Z11 | -0.0098654 | 0.0082784 | -1.19 | 0.238 |
| Social support | δ12Z12 | 0.0055162 | 0.0082678 | 0.67 | 0.507 |
| Income | δ13Z13 | 0.046687 | 0.0127666 | 3.66 | 0.001 |
| Savings | δ14Z14 | 0.0441468 | 0.0159923 | 2.76 | 0.008 |
| Credit/loan | δ15Z15 | -0.0002958 | 0.004694 | -0.06 | 0.950 |
| Debt | δ16Z16 | 0.0023344 | 0.0046509 | 0.50 | 0.617 |
| Land Status | δ17Z17 | -0.0062853 | 0.0076213 | -0.82 | 0.413 |
| Home | δ18Z18 | 0.0297134 | 0.0232653 | 1.28 | 0.206 |
| Equipment | δ19Z19 | 0.0161212 | 0.0232052 | 0.69 | 0.490 |
| Vehicle | δ20Z20 | -0.0014296 | 0.0060986 | -0.23 | 0.815 |
| Log pseudolikelihood | 139.60253 | ||||
| Prob > F | 0.0001 | ||||
Disclaimer/Publisher’s Note: The statements, opinions and data contained in all publications are solely those of the individual author(s) and contributor(s) and not of MDPI and/or the editor(s). MDPI and/or the editor(s) disclaim responsibility for any injury to people or property resulting from any ideas, methods, instructions or products referred to in the content. |
© 2025 by the authors. Licensee MDPI, Basel, Switzerland. This article is an open access article distributed under the terms and conditions of the Creative Commons Attribution (CC BY) license (http://creativecommons.org/licenses/by/4.0/).
Copyright: This open access article is published under a Creative Commons CC BY 4.0 license, which permit the free download, distribution, and reuse, provided that the author and preprint are cited in any reuse.


