Submitted:
01 December 2025
Posted:
02 December 2025
You are already at the latest version
Abstract
Recent advances in Deep Learning (DL) have enabled the integration of diverse biomedical data for disease prediction and risk stratification. Building on this progress, this study proposes a robust framework for Multi Label Classification (MLC) of comorbidities in patients with Obstructive Sleep Apnea (OSA) using diverse physiological and clinical data sources. A one-dimensional Convolutional Neural Network (1D-CNN) was developed to process and fuse time series signals, oxygen saturation (SpO2), derived SpO2 features, and nasal airflow (FP0), with demographic and physiological parameters, enabling the identification of key comorbidities such as arterial hypertension, diabetes mellitus, and asthma/COPD. The proposed model was trained and fine tuned using the Optuna hyperparameter optimization framework, addressing class imbalance through weighted loss adjustments. Its performance was comprehensively assessed using multi label evaluation metrics, including macro/micro F1-score, AUC-ROC, AUC-PR, subset and partial accuracy, Hamming loss, and Multi Label Confusion Matrix (MLCM) . The 1D-CNN achieved superior predictive performance compared to traditional Machine Learning (ML) classifiers with macro AUC-ROC = 0.7305 and AUC-PR = 0.7497. The model demonstrated consistent behavior across age, gender, and BMI groups, indicating strong generalization and minimal demographic bias. The results confirm that SpO2 and airflow signals inherently encode comorbidity specific physiological patterns, enabling efficient and scalable screening of OSA related comorbidities without the need for full polysomnography. Although the study is limited by data set size, it provides a methodological basis for the application of multi label DL models in clinical decision support systems. Future research should focus on the expansion of multicenter datasets, thereby improving model interpretability and potential clinical adoption.
Keywords:
obstructive sleep apnea (OSA)
; deep learning (DL)
; 1D-CNN
; multi label classification (MLC)
; multi label confusion matrix (MLCM)
; sleep medicine
; polysomnography
1. Introduction
Obstructive Sleep Apnea (OSA) is one of the most common sleep related breathing disorders and affects a large portion of the global population. Current estimates suggest that nearly one billion individuals have some degree of OSA, which highlights its significance as a major public health concern [1]. OSA is characterized by repeated pauses or reductions in airflow during sleep due to upper airway obstruction. These events cause oxygen desaturation, fragmented sleep, and increased physiological stress. When these disturbances occur chronically, they can lead to serious long term cardiovascular, metabolic, and respiratory consequences [2,3].
Thus, extensive research has shown that OSA is strongly associated with several important comorbidities, including hypertension, type 2 diabetes mellitus, and chronic respiratory diseases such as asthma or chronic obstructive pulmonary disease (COPD) [4]. The likelihood of developing these conditions increases with OSA severity. In addition, demographic and clinical factors such as age, body mass index (BMI), metabolic irregularities, and inflammatory processes further influence the interaction between OSA and its comorbidities [5,6]. Detecting these comorbidities early is essential for preventing complications and improving patient outcomes.
Polysomnography (PSG) remains the clinical gold standard for OSA diagnosis. PSG includes continuous monitoring of several physiological signals, such as oxygen saturation (), airflow, heart activity, brain waves, and muscle tone. Although PSG is highly reliable, it is resource intensive, costly, and time consuming. The interpretation of PSG data typically requires manual scoring performed by trained clinicians, which can introduce variability, slow down the diagnostic process, and limit scalability [7,8,9,10]. As the volume and complexity of biomedical data continue to grow, traditional manual analysis becomes increasingly challenging.
Advances in machine learning (ML) and deep learning (DL) have opened new possibilities for improving diagnostic support in sleep medicine. DL models are capable of automatically learning patterns from physiological time series data and often achieve higher performance than traditional analytic methods. Convolutional Neural Networks (CNNs) are particularly effective for analyzing biomedical signals such as and nasal airflow because they can extract meaningful temporal features directly from raw input data [11]. These advantages make DL promising for building automated systems aimed at identifying OSA related health risks.
Most existing research focuses primarily on detecting, monitoring, or classifying the severity of OSA itself, without addressing the broader clinical presentation in which multiple health conditions often occur together [12]. Studies in this field mainly concentrate on identifying apnea and hypopnea events or estimating OSA severity levels, while very few investigate the prediction or classification of comorbidities associated with OSA [13,14]. To the best of current knowledge, only one study highlights the importance of identifying comorbidities in this patient population, and no DL approaches have been developed specifically for Multi Label Classification (MLC) comorbidity. This gap indicates a clear need for models that can analyze diverse physiological and clinical features in order to detect several coexisting conditions more accurately. The aim of this study is to develop a Deep Neural Network (DNN) based approach for multi label classification of OSA related comorbidities using different types of data, including PSG signals, clinical variables, and signal derived features.
In this study, a DL based method using PSG signals and additional clinical information is explored to identify several comorbidities associated with OSA. In the next sections of this paper the dataset and preprocessing steps applied to the physiological signals will be described. The extraction and preparation of clinical and signal derived features will be explained. The architecture of the proposed one-dimensional Convolutional Neural Network (1D-CNN) for MLC will be presented, the evaluation metrics and comparison procedures will be outlined, and the experimental results and interpretation of model performance will be discussed. This structure provides a complete overview of how DL can support more accurate and efficient identification of comorbidities in patients with OSA.
2. Related Work
Artificial intelligence (AI) techniques are increasingly used in medicine as the availability of large and diverse datasets grows and as clinical practice demands faster and more accessible diagnostic solutions. Different biomedical modalities including physiological signals, medical imaging, wearable sensor data, and electronic health records require analytical methods capable of capturing their temporal, spatial, and structural patterns. While traditional ML approaches remain valuable for structured and interpretable data, modern DL architectures such as CNNs, RNNs, LSTMs, and Transformers dominate contemporary research due to their ability to model complex patterns in signals, images, and multimodal inputs [15]. However, despite these advances, current research remains largely monomodal and rarely addresses the classification of OSA-related comorbidities. In the domain of physiological time series, common approaches include RNNs, LSTMs, GRUs, 1D-CNNs, and ensemble methods such as RF and XGBoost [16], as well as multimodal architectures combining CNN and LSTM models on EEG, ECG, , and airflow signals [17]. More advanced systems integrate physiological and EHR data through hybrid DL/ML frameworks [18], while GAN based models have been explored for enhancing minority classes in or airflow datasets [19,20]. Other studies fuse physiological signals with CT imaging or EHR data using CNN–Transformer pipelines [21,22].
Similar methodological diversity is visible in research based on EHR, questionnaires, and broad multimodal datasets, where Transformers, Graph Neural Networks (GNNs), and hybrid architectures are commonly applied [23,24,25]. In medical imaging, CNNs continue to serve as the foundation, with increasing adoption of Transformers, 3D-CNNs, and hybrid systems that integrate images with physiological or behavioural signals [26,27,28]. Such multimodal solutions often rely on CNN, GNN, and U-Net based components, or combine multiple sensor types through CNN–Transformer frameworks [29,30,31,32]. A separate line of work has investigated multi label classification with combinations of ECG, EEG, EMG, MRI, CT, and wearable sensor data using SVM, GAN, or reinforcement learning approaches [33,34,35].
AI has also become increasingly prominent in sleep medicine, particularly for automated detection of OSA. Early studies relied on handcrafted features extracted from or ECG signals processed with FCNN or classical ML methods [36,37]. More recent research employs ResNet models, contrastive learning, multiscale architectures, and attention mechanisms to detect apnea events or estimate AHI directly from physiological signals [38,39,40]. EEG based and multimodal systems combine wavelet-based features, CNNs, BiLSTMs, and attention models to improve event detection and sleep staging [41,42,43,44,45,46]. Additional OSA related work integrates anatomical imaging, acoustic data, or thermal and depth information using CNN based architectures [47,48,49,50]. Clinical variable models using logistic regression, XGBoost, SVM, and RF also remain widely used [51,52,53], together with an increasing emphasis on explainable AI (XAI) for improved clinical trust [54].
Despite this rapid progress, most OSA related studies predominantly focus on predicting AHI, detecting apnea and hypopnea events, or assessing disease severity. The systematic classification of OSA related comorbidities remains largely unexplored, and the majority of existing approaches rely on a single data modality, limiting their ability to capture the broader physiological and clinical context. Additionally, existing studies typically rely on only one type of data whether imaging, time series physiological signals, or clinical metadata resulting in models that overlook important cross modal relationships and interactions. Multimodal models capable of integrating multiple biomedical sources and performing multi label comorbidity classification are still missing, representing a clear methodological gap that this study aims to address.
3. Data Description & Preprocessing
3.1. Dataset Description
The dataset used in this study consists of 144 patients who underwent standard overnight polysomnography (PSG) at the Sleep Medicine Centre Split (SleepLab Split). All recordings were acquired in clinically supervised conditions using full PSG systems, and the data were exported in European data format (.edf) [55]. For the purpose of this study, two physiological signals were selected due to their strong relevance for respiratory analysis: oxygen saturation () measured via pulse oximetry, nasal airflow (FP0) recorded using a nasal pressure transducer. Both signals capture essential information about respiratory disturbances during sleep. reflects blood oxygen fluctuations associated with apnea and hypopnea events, whereas FP0 reflects airflow amplitude and respiratory cycles. Alongside the time series signals, the dataset includes clinical and demographic information, such as: age, sex, BMI, heart rate (HR), and Apnea–Hypopnea Index (AHI). A set of signal derived features was also computed to describe the timing and severity of respiratory events, including the duration of airflow cessation, desaturation duration, the delay between airflow loss and oxygen decline, and slope based markers reflecting the dynamics of oxygen drops and recovery.
This multimodal structure provides a comprehensive representation of each patients physiological and clinical profile. An illustration of the whole process in the 1D CNN model is illustrated in the Figure 1.
3.2. Signal Preprocessing
The PSG recordings contained noise, artifacts, and varying sampling rates depending on the recording system. Because .edf files occupy a large amount of memory, the and FP0 channels were extracted from the original PSG recordings and stored in the Feather format to enable faster and more efficient processing [57]. To ensure reliable analysis and allow uniform model input, the signals underwent a structured preprocessing procedure. The original recordings had sampling rates that were much higher than required for analyzing slow respiratory processes. The Figure 2 shows and FP0 signals of one patient during night before artifact removal and filtering.
Therefore, both and signals were resampled to a uniform sampling rate of 5 Hz. This rate is widely used in respiratory signal analysis because it preserves the essential shape of desaturation and airflow events while significantly reducing data volume and computational complexity. The raw signals included invalid values caused by sensor displacement, signal loss, saturation clipping, or patient movement. Such artifacts were detected and corrected using: interpolation for short missing segments, replacement of physiologically impossible values, smoothing of extreme spikes, correction of baseline drift in airflow signals. These steps ensure that only physiologically meaningful patterns remain available for feature extraction and model training. A combination of filtering methods was applied to improve signal smoothness and suppress high frequency noise: low pass filtering to preserve slow respiratory components [58], moving average smoothing to stabilize short term fluctuations [59], Savitzky-Golay filtering before computing derivatives. These filters help reveal true desaturation patterns and airflow changes while avoiding distortion of clinically relevant events.
After cleaning and filtering, both signals were divided into fixed length windows covering short time intervals. Windowing allows the model to learn local temporal patterns such as apnea onset, airflow reduction, and the progression of oxygen decline. It also allows the dataset to be converted into multiple training samples per patient, improving model robustness. Figure 3 show the and FP0 signals of one patient during night after artifact and outlier removal.
3.3. Feature Engineering
To complement the raw physiological signals, a set of features was engineered to quantify specific aspects of abnormal breathing events. Desaturation events were identified in the waveform using thresholds related to amplitude drop and minimum event duration. Airflow cessation events were identified in the FP0 signal and paired with corresponding desaturations to ensure that extracted events were clinically meaningful. From each matched event pair, several temporal and morphological parameters were calculated:
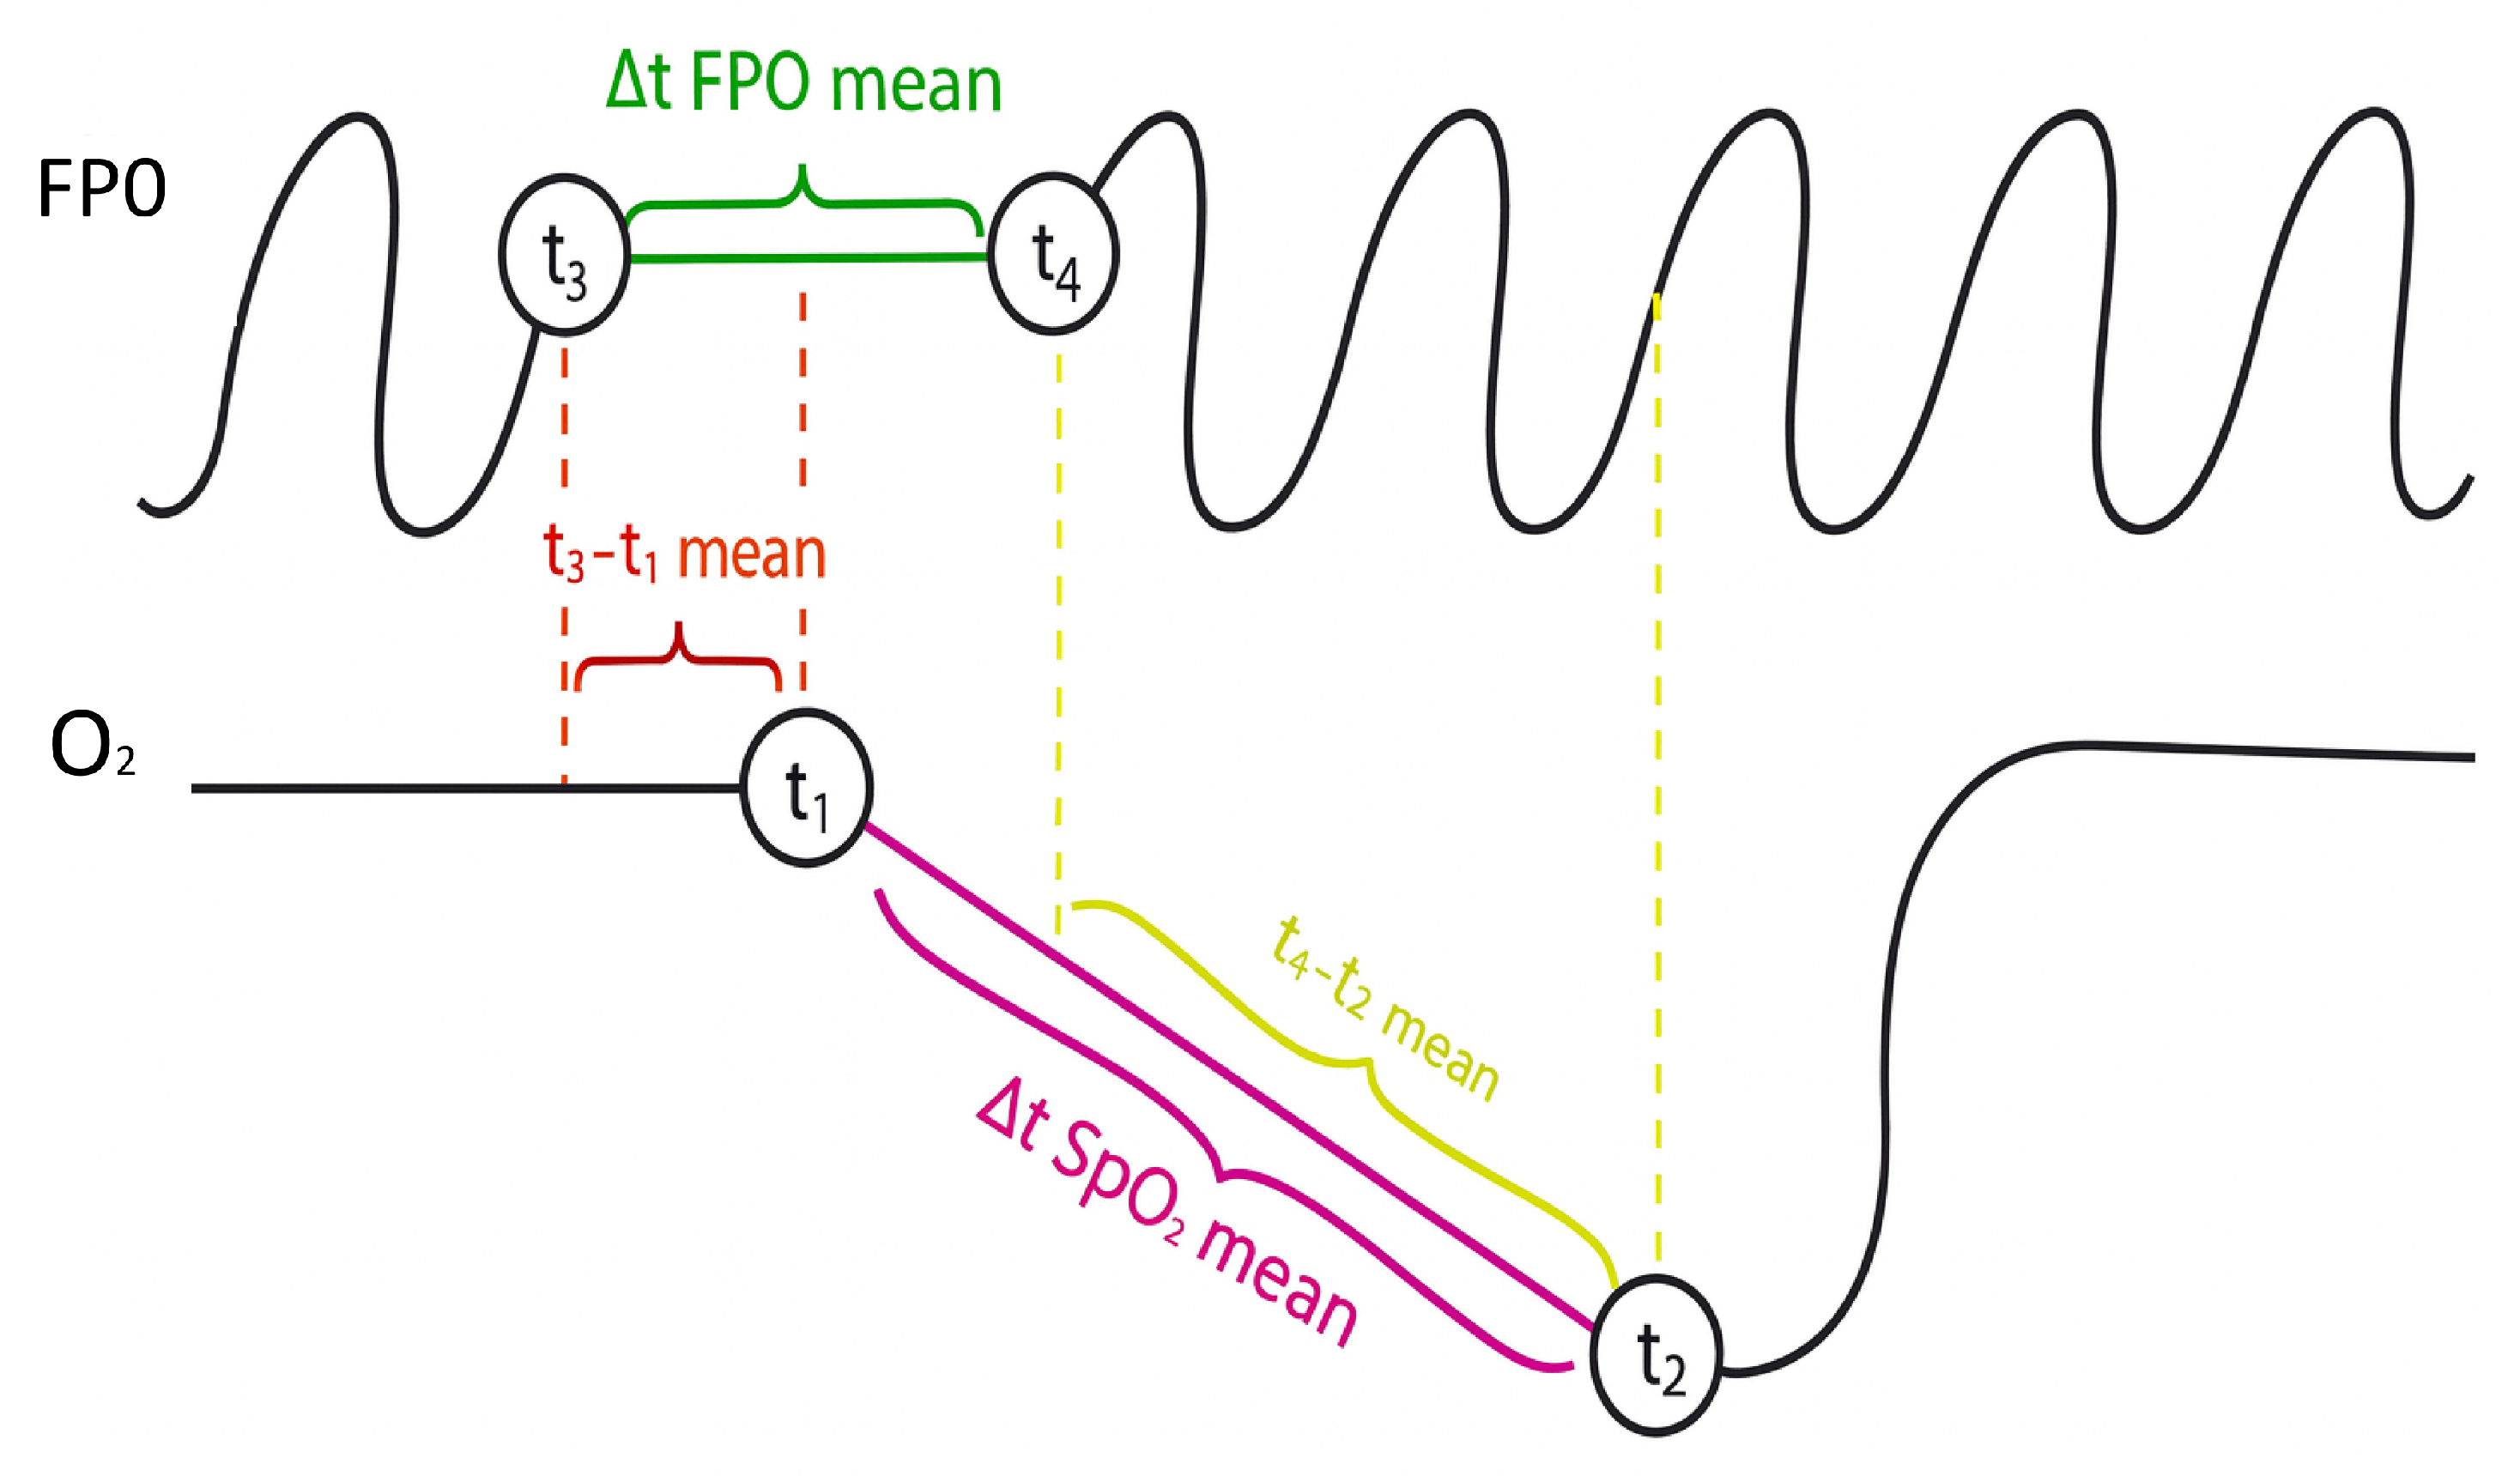
- t3–t1 mean: Defined as the average delay between the onset of FP0 cessation (t1) and the beginning of oxygen desaturation (t3). This parameter quantifies the latency between respiratory obstruction and its physiological manifestation in blood .
- t4–t2 mean: Defined as the average delay between the resumption of FP0 (t2) and the start of oxygen recovery (t4). This reflects the time needed for to normalize once breathing resumes.
- : The mean duration of FP0 cessation episodes, computed directly from the FP0 signal between markers t1 (start of apnea) and t2 (end of apnea). This value represents the average length of respiratory arrest events.
- : The mean duration of oxygen desaturation episodes, calculated as the time interval between t3 (start of desaturation) and t4 (end of desaturation). It provides a measure of how long remains depressed during events.
- : The average desaturation difference, i.e. the difference between the initial value and the minimum value reached during all detected desaturation events throughout the night. This quantifies the drop in oxygen during the night.
- mean slope: The average slope of the desaturation curves, calculated as / during the fall phase of all events. It describes the rate of decline in , distinguishing between abrupt and gradual desaturations.
Figure 4.
Additional Parameters for Neural Network
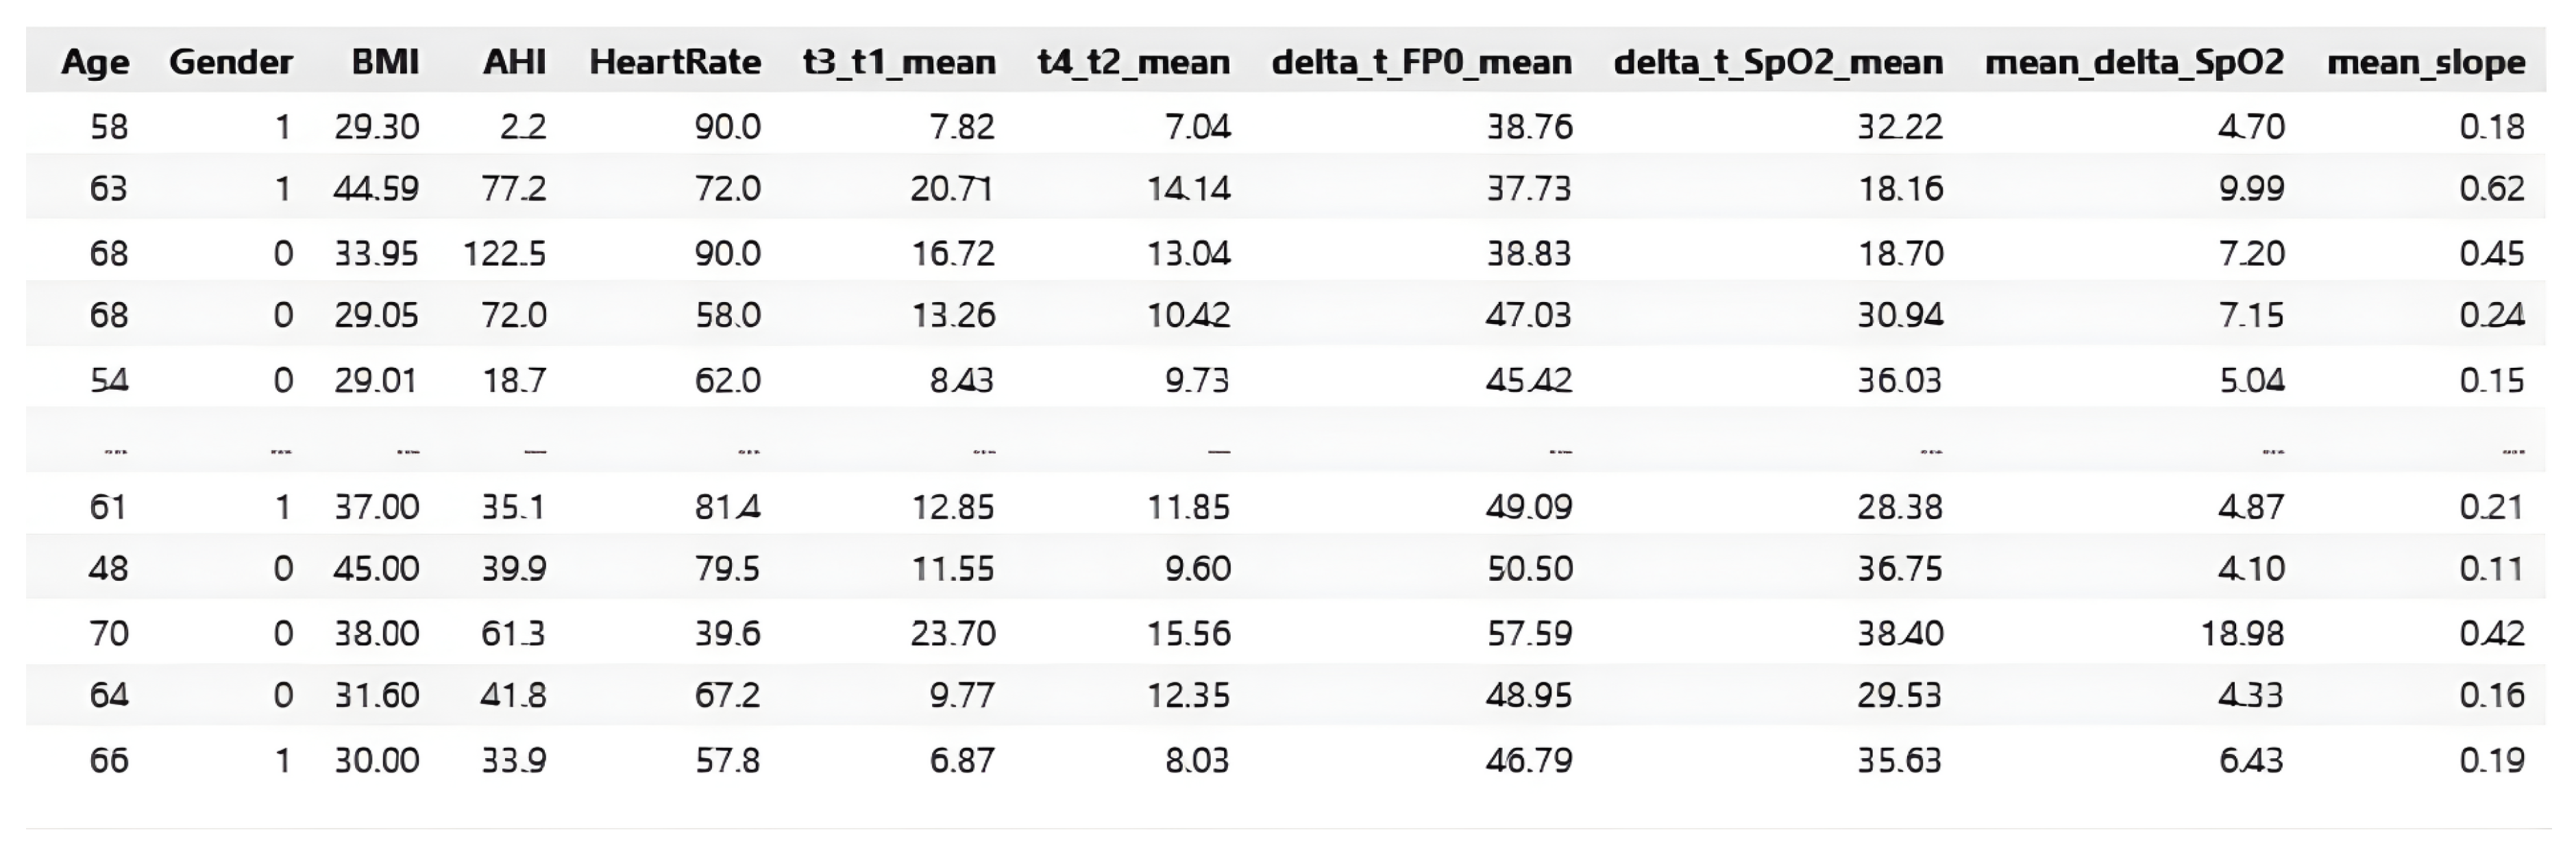
These features describe the physiological relationship between airflow changes and oxygen regulation, capturing clinically relevant respiratory patterns that may reflect underlying comorbidities. All extracted features, along with demographic and clinical variables, were normalized to ensure consistent scaling across patients. The final dataset integrates three types of information: preprocessed and FP0 time series windows, computed temporal and morphological features, clinical and demographic variables.
Figure 5.
and FP0 signals with defined markers, illustration.
This structure enables the DL model to simultaneously analyze short term respiratory dynamics and longer term patient characteristics.
3.4. Limitations of Dataset
Although the dataset provides valuable clinical information, several limitations must be acknowledged: class imbalance, lack of healthy controls, limited number of physiological channels. Some comorbidities, especially diabetes mellitus and asthma/COPD, occur far less frequently than hypertension. Multi label combinations are even rarer. This imbalance increases classification difficulty and may affect the stability of model predictions. All individuals in the dataset were referred for PSG due to suspected or confirmed sleep disordered breathing. Only two channels ( and FP0) were used for model development. Full PSG includes many additional channels EEG, ECG, EMG, respiratory belts that could potentially improve classification performance. The limited number of available signals restricts the models access to multimodal information.
4. Methods
4.1. Problem Definition
The goal of this study is to develop a MLC model capable of identifying three clinically relevant comorbidities commonly associated with OSA: hypertension, diabetes mellitus, and asthma/COPD. Each patient can simultaneously exhibit zero, one, two, or all three comorbidities. The predictive task therefore requires assigning a vector of three binary outputs, where each element indicates the presence or absence of a specific condition.
This setup differs from traditional single label classification because labels are not mutually exclusive. The model must learn to capture shared patterns across conditions while also distinguishing features unique to each disease.
4.2. 1D-CNN Architecture
Convolutional Neural Networks (CNNs) are a core DL architecture originally developed for image analysis, where they extract spatial patterns using trainable filters [60]. Their fundamental mechanism for learning local features through convolution extends naturally to one-dimensional data, making them highly suitable for biomedical time series signals. In the context of sleep medicine, 1D-CNNs are effective because physiological waveforms such as and airflow contain characteristic temporal structures associated with respiratory instability and oxygen desaturation events. These temporal signatures can be difficult to capture using traditional ML methods but can be efficiently learned through convolutional layers that scan the signal and detect recurring patterns [61].
In 1D form, each convolutional filter slides along the temporal axis of the signal and computes a dot product between the kernel and local segments of the waveform. This enables the model to detect short term events such as rapid desaturation declines or airflow cessations, as well as more gradual patterns related to apnea severity or recovery dynamics. Additional components such as activation functions, padding, and stride control the nonlinearity and temporal resolution of the learned representations. The use of the ReLU activation function enhances gradient flow and prevents saturation effects, while padding ensures that the temporal length of the output remains aligned with the input signal [62].
The predictive task in this study is formulated as a MLC problem, where each patient may simultaneously exhibit several comorbidities rather than belonging to a single diagnostic category. This stands in contrast to traditional single label classification, where each instance is associated with exactly one class . A simple visual illustration of this difference is shown in Figure 6, which compares mutually exclusive labels with multi label assignmets applicable to real world biomedical data [63,64]..
Within this learning framework, convolutional layers play a key role in extracting temporal patterns from biomedical signals. A conceptual overview of how convolutional operations progressively transform the input signal through stacked feature extraction blocks is shown in Figure 7, which illustrates the hierarchical flow from raw time series data to deeper learned representations [61].
Building on these concepts, the proposed model uses a multi branch 1D-CNN architecture designed to integrate PSG time series with clinical information. Two branches process the physiological signals independently: one for oxygen saturation (), one for derivated signal and one for nasal airflow (). Each branch contains convolutional layers that learn relevant temporal motifs, followed by batch normalization to stabilize training and dropout to reduce overfitting. Global Average Pooling (GAP) condenses each feature map into a compact representation, emphasizing dominant temporal patterns rather than specific signal positions. In parallel, a third branch processes clinical and signal derived parameters such as age, BMI, AHI, heart rate, and respiratory timing features. This structured input is passed through a fully connected pathway to generate a dense embedding compatible with the signal based representations. The outputs of all three branches are then concatenated to form a unified feature vector that captures: temporal dependencies in the waveform, airflow related respiratory patterns, and broader patient level characteristics. To support multi label prediction, the final output layer uses three independent sigmoid units, enabling simultaneous estimation of hypertension, diabetes mellitus, and asthma/COPD. This design aligns the model with the multi label nature of the task.
A detailed overview of the complete architecture, including convolutional hyperparameters, dense layers, dropout rates, and the focal loss configuration, is presented in Figure 8, which summarizes every component used in the final implementation.
Overall, the integration of convolutional feature extraction, clinical feature processing, and multi label prediction enables the model to leverage diverse biomedical data and to learn both short term physiological patterns and long term patient characteristics. This architecture proved effective in identifying comorbidity related signatures within PSG signals, supporting its use in automated risk assessment for OSA populations.
4.3. Class Imbalance Handling
The dataset exhibits notable class imbalance, especially for diabetes mellitus and asthma/COPD, which occur less frequently than hypertension. Multi label combinations further amplify this imbalance and can bias the model toward majority classes. To address this issue, the training process incorporates weighted binary cross entropy, where each label is assigned a class specific weight inversely proportional to its frequency. This ensures that rare comorbidity classes contribute more strongly to the loss function, encouraging the model to learn from underrepresented cases. A detailed analysis of comorbidity distribution was performed to calculate appropriate weights and to identify the imbalance between single label, dual label, and triple label cases.
4.4. Evaluation Metrics
The evaluation of MLC models requires metrics that capture the fact that each instance may contain multiple labels simultaneously. Unlike single label classification, where each sample has exactly one true class, MLC allows partial correctness, meaning that a prediction may overlap with the true label set even when the match is not exact. For this reason, model performance was assessed using a combination of label based, example based, threshold independent, and error based metrics [65,66].
Label based metrics evaluate each comorbidity independently by computing standard binary measures such as accuracy, precision, recall, and F1-score [67]. These metrics rely on the following definitions:
To summarize results across all labels, macro and micro averaging were applied. Macro averaging assigns equal weight to each label, while micro averaging aggregates all true positives, false positives, true negatives, and false negatives across labels:
Example based metrics evaluate prediction correctness at the level of each patient. Subset Accuracy is the strictest measure, requiring the entire predicted label set to match the true label set exactly:
Flat Accuracy evaluates correctness at the level of individual labels:
Partial Accuracy quantifies the overlap between the predicted and true label sets:
Threshold independent metrics were also used. The Area Under the ROC Curve (AUC-ROC) and the Area Under the Precision Recall Curve (AUC-PR) measure discriminative performance across different thresholds. AUC-PR is particularly informative for imbalanced datasets.
To quantify fine grained prediction errors, Hamming Loss was calculated:
Finally, model errors were analyzed using a multi label confusion matrix (MLCM). Unlike traditional confusion matrices, which assume a single true class, the multi label version computes true positives, false positives, true negatives, and false negatives separately for each comorbidity. This enables detailed inspection of label wise misclassifications and reveals dependencies between comorbidities [68,69,70,71].
The combined use of these complementary metrics provides a comprehensive evaluation framework for assessing the models ability to detect multiple comorbidities simultaneously and supports a detailed interpretation of predictive performance.
5. Results
This section presents the quantitative evaluation of the proposed 1D-CNN architecture for MLC of comorbidities in patients with OSA. All experiments were conducted on a workstation equipped with an Intel® Core™ i5-1135G7 CPU (2.40 GHz) and 16 GB RAM. The complete training procedure for the final model required less than one hour, depending on the selected hyperparameters.
The dataset was diverse into training (70%), validation (15%), and test (15%) subsets. The independent test set fully unseen during model development was used exclusively for the final evaluation. The model outputs three binary labels corresponding to hypertension, diabetes mellitus, and asthma/COPD.
Table 1 summarises the raw MLCM, including class wise precision and recall. The diagonal values represent correctly predicted labels, while non diagonal entries represent misclassifications or clinically realistic co-occurrences.
Label demonstrates perfect recall (1.00), indicating that all true instances were successfully detected, despite its relatively small prevalence. Labels and exhibit moderate recall (0.50 and 0.70), reflecting typical overlaps between clinically related comorbidities. To investigate cross label relationships, the precision and recall matrices were computed from the raw MLCM.

Table 2.
Precision Matrix (Column Normalized)
| 0.89 | 0.00 | 0.36 | |
| 0.00 | 0.55 | 0.00 | |
| 0.11 | 0.45 | 0.64 |
Table 3.
Recall Matrix (Row Normalized)
| 0.50 | 0.00 | 0.50 | |
| 0.00 | 1.00 | 0.00 | |
| 0.05 | 0.25 | 0.70 |
High diagonal values in both tables confirm that the 1D-CNN maintains stable precision and recall across all labels. Misclassifications primarily occur among physiologically or clinically related comorbidities, which is expected due to natural co-occurrence patterns.
Table 4.
Summary of evaluation metrics.
| Metric | Value | Definition | Interpretation |
|---|---|---|---|
| Subset accuracy | 0.2857 | Exact match across all labels per sample. | Strictest metric, a sample counts as correct only if all labels are predicted correctly. Lower values are expected in multi label tasks with partial hits. |
| Flat accuracy | 0.6349 | Bit level accuracy over all labels (flattened). | Indicates frequent partial correctness at the label (bit) level across samples. |
| Partial accuracy | 0.6349 | Mean per sample label match ratio. | Aligns with flat accuracy, shows that, on average, about two thirds of labels per sample are correct. |
| (F1-macro) | 0.5329 | Unweighted mean F1 across labels. | Treats rare and frequent labels equally, lower due to class imbalance and harder labels. |
| (F1-micro) | 0.5490 | Global F1 aggregating TP/FP/FN over all labels. | Reflects overall balance of precision/recall across the dataset. |
| (F1-weighted) | 0.5511 | F1 weighted by label frequency. | Slight uplift vs. macro due to dominance of frequent labels. |
| AUC-ROC (macro) | 0.7305 | Mean area under ROC curve across labels (one vs rest). | Threshold independent discrimination, higher indicates better ranking of positives vs. negatives across labels. |
| AUC-PR (macro) | 0.7497 | Mean area under Precision–Recall curve across labels. | More informative under class imbalance, higher indicates better detection of positives with fewer false alarms. |
| Hamming loss | 0.3651 | Fraction of misclassified labels over all samples and labels. | Complement of flat accuracy (here ); lower is better. |
Table 4 presents the full set of multi label evaluation metrics. Subset accuracy (strictest measure) reached 0.2857, indicating exact match of all labels for 29% of samples. Flat and partial accuracy achieved markedly higher values (0.6349), reflecting consistent partial correctness. F1-scores (macro, micro, weighted) ranged between 0.53–0.55, demonstrating balanced performance across both frequent and rare labels. Macro AUC-ROC = 0.7305 and AUC-PR = 0.7497 indicate strong threshold independent discriminative capability.
The proposed 1D-CNN demonstrates stable and generalizable performance across all metrics. The high precision for and (0.89 and 0.64) indicates a low false positive rate Table 2, while achieves extremely high recall (1.00), confirming the models ability to recognize all true cases of this comorbidity Table 3. This behaviour suggests that the network successfully differentiates subtle temporal features embedded in the and FP0 signals and effectively integrates structured clinical parameters.
Moderate recall for and primarily stems from the natural overlap between comorbidities (e.g., hypertension and metabolic disorders), not from instability of the model. Precision and recall matrices confirm this by showing the highest off diagonal confusion occurring between clinically correlated labels.
Global metrics further support model robustness. The model achieves approximately two thirds correctness at the label level (flat/partial accuracy = 0.6349) and balanced F1-scores despite class imbalance. High macro AUC-ROC and AUC-PR values reflect excellent ranking performance even when labels overlap.
Overall, these results demonstrate that the CNN reliably extracts meaningful temporal patterns from physiological waveforms. Comorbidities exhibit consistent and interpretable prediction behaviour, not random confusion. The architecture generalizes well to unseen patients, confirming robustness for real world deployment.
Furthermore, stratified analysis by age, gender, and BMI indicates that the model performs consistently across all demographic subsets.
Age groups (Figure 9): Most stable performance occurs in the 40–69 range groups with the largest representation and typical comorbidity prevalence. Slight deviations in youngest and oldest ranges are attributable to small sample sizes. Gender (Figure 10): No significant differences. Minor fluctuations reflect natural prevalence differences rather than model bias. BMI categories (Figure 11): Highest stability occurs in overweight/obese class I ranges (BMI 25–34.9). Extremes (BMI > 40) show moderate increase in errors due to physiological variability and fewer samples.
These findings indicate that performance variability is driven by dataset distribution rather than any inherent bias, suggesting suitability for diverse clinical populations. The proposed 1D-CNN successfully captures: short term oxygen desaturation dynamics, airflow interruption patterns, patient level clinical characteristics. This multimodal integration enables reliable multi label prediction of comorbidities directly from PSG derived signals. Results confirm that and FP0 alone carry strong discriminative potential for identifying hypertension, diabetes mellitus, and asthma/COPD, supporting the development of cost efficient screening tools. The strong threshold independent performance (AUC-ROC, AUC-PR), balanced F1 scores, and clinically plausible confusion patterns highlight the models potential for real world deployment.
6. Discussion
The findings of this study demonstrate that the proposed multi branch 1D-CNN model can effectively extract clinically meaningful temporal patterns from and signals and integrate them with structured clinical variables to identify key comorbidities associated with OSA. The model achieved balanced multi label performance across hypertension, diabetes mellitus, and asthma/COPD, despite notable class imbalance within the dataset. This indicates that weighted loss functions and multimodal feature fusion successfully mitigated the dominance of majority labels and encouraged the network to learn discriminative representations even for less frequent comorbidities.
The raw MLCM (Table 1) shows that hypertension and asthma/COPD achieved moderate recall (0.50 and 0.70), while diabetes mellitus reached perfect recall (1.00). This result is particularly noteworthy given the relatively low prevalence of diabetes within the dataset, suggesting that the model learned subtle temporal clinical signatures specific to the metabolic profile of diabetic patients. Precision remained high across all labels (0.89–0.64), indicating low false positive rates and confirming that the classifier avoids overpredicting comorbidities, which is crucial for clinical usability.
Analysis of the precision and recall matrices (Table 2 and Table 3) further highlights that misclassifications predominantly occur between clinically related comorbidities most notably hypertension and diabetes mellitus. This is consistent with well known physiological and metabolic interactions in OSA patients, where sympathetic activation, intermittent hypoxia, and obesity contribute to overlapping risk profiles. These errors therefore likely reflect meaningful comorbidity co-occurrence rather than model instability.
Evaluation metrics (Table 4) reinforce these observations. Flat accuracy and partial accuracy of 0.635 show that approximately two thirds of labels per patient were correctly predicted, while macro/micro/weighted F1-scores (0.533–0.551) indicate consistent performance across both frequent and rare labels. Threshold independent metrics revealed strong discriminative capability (macro AUC-ROC = 0.731; AUC-PR = 0.750), confirming that the learned representations generalize well to unseen patient data. Combined, these results support the robustness of the proposed multimodal architecture.
Subgroup analyses, Figure 9, Figure 10, Figure 11, provide additional insights into demographic generalization. The model maintains stable performance across gender, with only minor variations reflecting natural prevalence differences rather than systematic bias. Age based performance shows the highest stability in the 40–69 cohort consistent with the highest sample density while extremes of age exhibit greater variance due to limited representation. Similarly, accuracy remains highest within BMI ranges 25–35, aligning with typical OSA and comorbidity prevalence, whereas reduced stability in BMI ≥ 40 groups reflects physiological heterogeneity and smaller sample sizes. These findings suggest that performance variability is driven primarily by data distribution rather than architectural limitations.
Importantly, the study demonstrates that rich comorbidity related physiological information is encoded within only two PSG derived signals and . The ability of the 1D-CNN to detect comorbidities without relying on full PSG channels (EEG, EMG, ECG) underscores the potential for simplified and more accessible diagnostic workflows. This aligns with the growing need for scalable, low cost screening tools in clinical and home based environments.
Overall, the results show that 1D-CNN based multimodal learning offers a promising direction for early identification of OSA related comorbidities. The model captures both short term respiratory dynamics and long term clinical characteristics, achieving clinically interpretable and stable performance. These findings support the future integration of such models into decision support systems and telemedicine platforms.
7. Limitations and Future Work
Despite encouraging results, several limitations should be acknowledged. The dataset size (144 patients) is modest and originates from a single clinical center, which restricts the models exposure to broader population variability and may affect generalizability. In this study, only two physiological channels ( and ) were used. Although these signals are among the most informative for capturing respiratory disturbances in OSA and contributed to strong model performance, the absence of additional PSG channels (EEG, ECG, EMG, thoracoabdominal belts) limits the physiological depth available to the model. With expert validation, such multimodal inputs could be incorporated in future studies to provide complementary information and potentially improve classification accuracy.
Class imbalance also remains a notable challenge, particularly because hypertension was far more prevalent than diabetes or asthma/COPD, and multi label combinations were very rare reflecting the true clinical distribution rather than a sampling artifact. While weighted loss functions improved learning stability, some variation in performance across labels persists, suggesting the need for strategies such as data augmentation, synthetic minority over sampling (e.g., GAN based generation), or targeted rebalancing techniques in future work.
Finally, model interpretability is limited. Although convolutional architectures offer more transparency than fully connected networks, the present study did not incorporate explainable AI (XAI) techniques such as Grad-CAM, SHAP, or LIME. Integrating these tools in future research could enhance clinical trust and provide insight into which signal regions or clinical variables most strongly influence comorbidity predictions.
8. Conclusions
This study presents a novel multi branch 1D-CNN framework that integrates and signals with clinical variables to identify multiple comorbidities associated with OSA. The model demonstrated strong and balanced multi label performance, achieving high precision, stable recall, and strong discriminative capabilities across all evaluation metrics. Results indicate that essential comorbidity related physiological patterns are embedded within and airflow signals, enabling accurate prediction without full PSG.
Subgroup analyses confirmed that the model generalizes well across age, BMI, and gender, with performance variations reflecting dataset distribution rather than systematic bias. These findings highlight the potential of simplified multimodal architectures for scalable and accessible risk assessment in clinical and home monitoring scenarios.
Although limited by dataset size, class imbalance, and reliance on two physiological channels, the proposed framework establishes a solid foundation for future research in multi label comorbidity prediction. Expanding datasets, incorporating additional PSG modalities, and applying explainable AI techniques represent natural next steps toward clinical translation.
Overall, this work demonstrates that DL based analysis of simplified PSG signals can provide meaningful insights into comorbidity profiles in OSA patients and offers a promising direction for the development of intelligent, automated, and cost efficient clinical decision support systems.
References
- Benjafield, A.V.; Ayas, N.T.; Eastwood, P.R.; Heinzer, R.; Ip, M.S.M.; Morrell, M.J.; Nunez, C.M.; Patel, S.R.; Penzel, T.; Pépin, J.; et al. Estimation of the global prevalence and burden of obstructive sleep apnoea: a literature-based analysis. The Lancet Respiratory Medicine 2019, 7, 687–698. [Google Scholar] [CrossRef] [PubMed]
- Abrishami, A.; Khajehdehi, A.; Chung, F. A systematic review of screening questionnaires for obstructive sleep apnea. Canadian Journal of Anesthesia 2010, 57, 423. [Google Scholar] [CrossRef] [PubMed]
- Deviaene, M.; Varon, C.; Testelmans, D.; Buyse, B.; Van Huffel, S. Assessing cardiovascular comorbidities in sleep apnea patients using SpO2. In Proceedings of the 2017 Computing in Cardiology (CinC), 2017, pp. 1–4. [CrossRef]
- Kainulainen, S.; Töyräs, J.; Oksenberg, A.; Korkalainen, H.; Sefa, S.; Kulkas, A.; Leppänen, T. Severity of desaturations reflects OSA-related daytime sleepiness better than AHI. Journal of Clinical Sleep Medicine 2019, 15, 1135–1142. [Google Scholar] [CrossRef] [PubMed]
- Demko, B.G. The Evolution of Oral Appliance Therapy for Snoring and Sleep Apnea: Where Did We Come From, Where Are We, and Where Are We Going? Sleep Medicine Clinics 2018, 13, 467–487. [Google Scholar] [CrossRef]
- Marin, J.M.; Carrizo, S.J.; Vicente, E.; Agusti, A.G. Long-term cardiovascular outcomes in men with obstructive sleep apnoea-hypopnoea with or without treatment with continuous positive airway pressure: an observational study. Lancet 2005, 365, 1046–1053. [Google Scholar] [CrossRef]
- Bahammam, A.; Gacuan, D.; George, S.; Acosta, K.L.; Pandi-Perumal, S.R.; Gupta, R. POLYSOMNOGRAPHY I: PROCEDURE AND TECHNOLOGY. / 2016, pp. 443–456. [CrossRef]
- Gottlieb, D.J.; Punjabi, N.M. Diagnosis and management of obstructive sleep apnea: a review. Jama 2020, 323, 1389–1400. [Google Scholar]
- Slowik, J.M.; Sankari, A.; Collen, J.F. Obstructive Sleep Apnea. In StatPearls; StatPearls Publishing: Treasure Island (FL), 2025. [Google Scholar] [PubMed]
- Slowik, J.M.; Sankari, A.; Collen, J.F. Obstructive Sleep Apnea. In StatPearls; StatPearls Publishing: Treasure Island (FL), 2025. [Google Scholar] [PubMed]
- Lipton, Z.; Kale, D.; Elkan, C.; Wetzel, R. Learning to Diagnose with LSTM Recurrent Neural Networks. arXiv preprint arXiv:1511.03677 2015.
- Pattipati, M.; Gudavalli, G.; Zin, M.; Dhulipalla, L.; Kolack, E.; Karki, M.; Devarakonda, P.K.; Yoe, L. Continuous Positive Airway Pressure vs Mandibular Advancement Devices in the Treatment of Obstructive Sleep Apnea: An Updated Systematic Review and Meta-Analysis. Cureus 2022, 14, e21759. [Google Scholar] [CrossRef] [PubMed]
- Hussein, O.; Alkhader, A.; Gohar, A.; Bhat, A. Home Sleep Apnea Testing for Obstructive Sleep Apnea. Missouri Medicine 2024, 121, 60–65. [Google Scholar] [PubMed]
- Espinosa, M.A.; Ponce, P.; Molina, A.; Borja, V.; Torres, M.G.; Rojas, M. Advancements in Home-Based Devices for Detecting Obstructive Sleep Apnea: A Comprehensive Study. Sensors 2023, 23. [Google Scholar] [CrossRef]
- Zovko, K.; Šerić, L.; Perković, T.; Belani, H.; Šolić, P. IoT and health monitoring wearable devices as enabling technologies for sustainable enhancement of life quality in smart environments. Journal of Cleaner Production 2023, 413, 137506. [Google Scholar] [CrossRef]
- Hüsken, M.; Stagge, P. Recurrent neural networks for time series classification. Neurocomputing 2003, 50, 223–235. [Google Scholar] [CrossRef]
- M, I.A.C.; Ansari, M.Y.; Paul, S.; Halabi, O.; Alataresh, E.; Shah, J.; Hamze, A.; Aboumarzouk, O.; Al-Ansari, A.; Dakua, S.P. Development and Validation of a Class Imbalance-Resilient Cardiac Arrest Prediction Framework Incorporating Multiscale Aggregation, ICA and Explainability. IEEE Transactions on Biomedical Engineering 2025, 72, 1674–1687. [Google Scholar] [CrossRef] [PubMed]
- Liu, S.; Fu, B.; Wang, W.; Liu, M.; Sun, X. Dynamic Sepsis Prediction for Intensive Care Unit Patients Using XGBoost-Based Model With Novel Time-Dependent Features. IEEE Journal of Biomedical and Health Informatics 2022, 26, 4258–4269. [Google Scholar] [CrossRef] [PubMed]
- Kim, Y.; Koo, J.; Lee, S.; Song, H.; Lee, M. Explainable AI Warning Model Using Ensemble Approach for In-Hospital Cardiac Arrest Prediction: A Retrospective Cohort Study (Preprint). Journal of Medical Internet Research 2023, 25. [Google Scholar] [CrossRef] [PubMed]
- Kobir, M.; Machado, P.; Lotfi, A.; Haider, D.; Ihianle, I. Enhancing Multi-User Activity Recognition in an Indoor Environment with Augmented Wi-Fi Channel State Information and Transformer Architectures. Sensors 2025, 25. [Google Scholar] [CrossRef]
- Hossen, M.K.; Peng, Y.T.; Shao, A.; Chen, M. An ODE based neural network approach for PM2.5 forecasting. Scientific Reports 2025, 15. [Google Scholar] [CrossRef]
- Xie, J.; Wang, Z.; Yu, Z.; Ding, Y.; Guo, B. Prototype Learning for Medical Time Series Classification via Human–Machine Collaboration. Sensors 2024, 24. [Google Scholar] [CrossRef]
- Sirrianni, J.; Sezgin, E.; Claman, D.; Linwood, S. Medical Text Prediction and Suggestion Using Generative Pretrained Transformer Models with Dental Medical Notes. Methods of Information in Medicine 2022, 61. [Google Scholar] [CrossRef]
- Tian, M.; Chen, B.; Guo, A.; Jiang, S.; Zhang, A. Reliable generation of privacy-preserving synthetic electronic health record time series via diffusion models. Journal of the American Medical Informatics Association : JAMIA 2024, 31. [Google Scholar] [CrossRef]
- Huo, Z.; Booth, J.; Monks, T.; Knight, P.; Watson, L.; Peters, M.; Pagel, C.; Ramnarayan, P.; Li, K. Dynamic mortality prediction in critically Ill children during interhospital transports to PICUs using explainable AI. npj Digital Medicine 2025, 8. [Google Scholar] [CrossRef]
- Lin, P.K.; Chiu, Y.H.; Huang, C.J.; Wang, C.Y.; Pan, M.L.; Wang, D.W.; Liao, H.y.; Chen, Y.S.; Kuan, C.H.; Lin, S.Y.; et al. PADAr: physician-oriented artificial intelligence-facilitating diagnosis aid for retinal diseases. Journal of Medical Imaging 2022, 9. [Google Scholar] [CrossRef] [PubMed]
- V J, S.; D, J.F. Deep Learning Algorithm for COVID-19 Classification Using Chest X-Ray Images. Computational and Mathematical Methods in Medicine 2021, 2021, 9269173. [Google Scholar] [CrossRef] [PubMed]
- Alp, S.; Akan-R.Farshi, T.; Bhuiyan, M.S.; Disbrow, E.; Conrad, S.; Vanchiere, J.; Kevil, C.; Bhuiyan, M.A.N. Joint transformer architecture in brain 3D MRI classification: its application in Alzheimer’s disease classification. Scientific Reports 2024, 14. [Google Scholar] [CrossRef] [PubMed]
- Ahmad, S.; Ahmad, Z.; Kim, J.M. A Centrifugal Pump Fault Diagnosis Framework Based on Supervised Contrastive Learning. Sensors 2022, 22. [Google Scholar] [CrossRef]
- Rahaman Wahab Sait, A.; Alkhurayyif, Y. Lightweight hybrid transformers-based dyslexia detection using cross-modality data. Scientific Reports 2025, 15. [Google Scholar] [CrossRef]
- Jovic, A.; Frid, N.; Brkic, K.; Cifrek, M. Interpretability and accuracy of machine learning algorithms for biomedical time series analysis – a scoping review. Biomedical Signal Processing and Control 2025, 110, 108153. [Google Scholar] [CrossRef]
- Saikumar, K.; Rajesh, V.; Srivastava, G.; Lin, J.C.W. Heart disease detection based on internet of things data using linear quadratic discriminant analysis and a deep graph convolutional neural network. Frontiers in Computational Neuroscience 2022, Volume 16 - 2022. [CrossRef]
- Heydarian, M.; Doyle, T.E.; Samavi, R. MLCM: Multi-Label Confusion Matrix. IEEE Access 2022, 10, 19083–19095. [Google Scholar] [CrossRef]
- Kimura, A.; Mitsukura, Y.; Oya, A.; Matsumoto, M.; Nakamura, M.; Kanaji, A.; Miyamoto, T. Objective characterization of hip pain levels during walking by combining quantitative electroencephalography with machine learning. Scientific Reports 2021, 11. [Google Scholar] [CrossRef]
- Patil, S.; Kukreja, D. Deep Reinforced Cognitive Analytics Algorithm (DRCAM): An Advanced Method to early detection of Cognitive skill impairment using Deep Learning and Reinforcement Learning. MethodsX 2025, 14, 103277. [Google Scholar] [CrossRef]
- Khan, A.; Basit, M.S.; Farooq, O.; Khan, Y.U.; Shameem, M. Mitigating the class imbalance effect in Sleep Apnea Classification. In Proceedings of the 2023 International Conference on Recent Advances in Electrical, Electronics & Digital Healthcare Technologies (REEDCON), 2023, pp. 530–535. [CrossRef]
- Sheta, A.; Turabieh, H.; Thaher, T.; Too, J.; Mafarja, M.; Hossain, M.S.; Surani, S.R. Diagnosis of Obstructive Sleep Apnea from ECG Signals Using Machine Learning and Deep Learning Classifiers. Applied Sciences 2021, 11. [Google Scholar] [CrossRef]
- Kumar, C.B.; Bhongade, A.; Gandhi, T.K.; Panigrahi, B.K. Recognition of Obstructive Sleep Apnea from a Single Lead Electrocardiogram Signal Using a ResNet Model. In Proceedings of the 2023 14th International Conference on Computing Communication and Networking Technologies (ICCCNT), 2023, pp. 1–5. [CrossRef]
- Kumar, C.B.; Mondal, A.K.; Bhatia, M.; Panigrahi, B.K.; Gandhi, T.K. Self-Supervised Representation Learning-Based OSA Detection Method Using Single-Channel ECG Signals. IEEE Transactions on Instrumentation and Measurement 2023, 72, 1–15. [Google Scholar] [CrossRef]
- Zhang, Y.; Shi, Y.; Su, Y.; Cao, Z.; Li, C.; Xie, Y.; Niu, X.; Yuan, Y.; Ma, L.; Zhu, S.; et al. Detection and severity assessment of obstructive sleep apnea according to deep learning of single-lead electrocardiogram signals. Journal of Sleep Research 2025, 34, e14285. [Google Scholar] [CrossRef]
- Khan, A.; Biswas, S.K.; Chunka, C. An Optimized Obstructive Sleep Apnea Detection Model Using Particle Swarm Optimization and Machine Learning. In Proceedings of the 2025 10th IEEE International Conference on Integrated Circuits, Design, and Verification (ICDV), 2025, pp. 1–6. [CrossRef]
- Khan, A.; Biswas, S.K.; Chunka, C.; Barman, S. Ensembled Obstructive Sleep Apnea Detection Using Extra Tree Ensemble Technique. In Proceedings of the 2024 2nd International Conference on Advancement in Computation & Computer Technologies (InCACCT), 2024, pp. 342–347. [CrossRef]
- Satapathy, S.K.; Pattnaik, S.; Rath, R. Automated Sleep Staging Classification System Based On Convolutional Neural Network Using Polysomnography Signals. In Proceedings of the 2022 IEEE Delhi Section Conference (DELCON), 2022, pp. 1–10. [CrossRef]
- Jain, S.; Singhal, A.; Rai, J.K.; Sharma, P. Polysomnography based Sleep Stage Classification using Deep Learning for Sleep Apnea Pediatric Subjects. In Proceedings of the 2025 4th OPJU International Technology Conference (OTCON) on Smart Computing for Innovation and Advancement in Industry 5.0, 2025, pp. 1–7. [CrossRef]
- M, S.; M, G.K.; Dillon P, D.; S, A.I.; S P, S.; N, M. SomnoDx: A Real-Time Deep Learning Framework for Multimodal Sleep Disorder Diagnosis. In Proceedings of the 2025 3rd International Conference on Self Sustainable Artificial Intelligence Systems (ICSSAS), 2025, pp. 840–846. [CrossRef]
- Jirakittayakorn, N.; Manupibul, U.; Wongsawat, Y.; Mitrirattanakul, S. RespNet: A Dual-Network Approach for Automated OSA Severity Classification Utilizing PSG Type III Signals. IEEE Access 2024, 12, 148538–148552. [Google Scholar] [CrossRef]
- Hanif, U.; Leary, E.; Schneider, L.; Paulsen, R.; Morse, A.; Blackman, A.; Schweitzer, P.; Kushida, C.; Liu, S.; Jennum, P.; et al. Estimation of Apnea-Hypopnea Index Using Deep Learning On 3-D Craniofacial Scans. IEEE Journal of Biomedical and Health Informatics 2021, PP, 1–1. [Google Scholar] [CrossRef]
- He, Z.; Xiao, Y.; Wu, X.; Liang, Y.; Zhou, Y.; An, G. An Automatic Assessment Model of Adenoid Hypertrophy in MRI Images Based on Deep Convolutional Neural Networks. IEEE Access 2023, 11, 106516–106527. [Google Scholar] [CrossRef]
- Qiu, X.; Wang, C.; Li, B.; Tong, H.; Tan, X.; Yang, L.; Tao, J.; Huang, J. An audio-semantic multimodal model for automatic obstructive sleep Apnea-Hypopnea Syndrome classification via multi-feature analysis of snoring sounds. Frontiers in Neuroscience 2024, 18, 1336307. [Google Scholar] [CrossRef] [PubMed]
- Singh, S.; Anisi, M.H.; Jindal, A.; Jarchi, D. Smart Multimodal In-Bed Pose Estimation Framework Incorporating Generative Adversarial Neural Network. IEEE Journal of Biomedical and Health Informatics 2024, 28, 3379–3388. [Google Scholar] [CrossRef] [PubMed]
- Kuan, Y.C.; Hong, C.T.; Chen, P.C.; Liu, W.T.; Chung, C.C. Logistic regression and artificial neural network-based simple predicting models for obstructive sleep apnea by age, sex, and body mass index. Mathematical biosciences and engineering: MBE 2022, 19, 11409–11421. [Google Scholar]
- Javeed, A.; Berglund, J.; Moraes, A.L.; Muhammad, .; Saleem, M.; Anderberg, P. Predictive Power of XGBoost BiLSTM Model: A Machine Learning Approach for Accurate Sleep Apnea Detection Using Electronic Health Data. International Journal of Computational Intelligence Systems 2023, 2023, 188. [CrossRef]
- Kim, Y.J.; Jeon, J.S.; Cho, S.E.; Kim, K.G.; Kang, S.G. Prediction Models for Obstructive Sleep Apnea in Korean Adults Using Machine Learning Techniques. Diagnostics 2021, 11. [Google Scholar] [CrossRef]
- Troncoso-García, A.R.; Martínez-Ballesteros, M.; Martínez-Álvarez, F.; Lora, A.T. Explainable machine learning for sleep apnea prediction. In Proceedings of the International Conference on Knowledge-Based Intelligent Information & Engineering Systems, 2022.
- Korompili, G.; Amfilochiou, A.; Kokkalas, L.; et al. PSG-Audio, a scored polysomnography dataset with simultaneous audio recordings for sleep apnea studies. Scientific Data 2021, 8, 197. [Google Scholar] [CrossRef]
- Wikimedia Commons. Sleep. https://commons.wikimedia.org/wiki/File:Sleep_studies.jpg n.d. Accessed: 2024-10-30.
- VanderPlas, J. Python Data Science Handbook: Essential Tools for Working with Data. In Proceedings of the Python Data Science Handbook: Essential Tools for Working with Data. O’Reilly Media, 2016.
- Crenna, F.; Rossi, G.B.; Berardengo, M. Filtering Biomechanical Signals in Movement Analysis. Sensors 2021, 21. [Google Scholar] [CrossRef]
- Kawala-Sterniuk, A.; Podpora, M.; Pelc, M.; Blaszczyszyn, M.; Gorzelanczyk, E.J.; Martinek, R.; Ozana, S. Comparison of Smoothing Filters in Analysis of EEG Data for the Medical Diagnostics Purposes. Sensors 2020, 20. [Google Scholar] [CrossRef] [PubMed]
- Kelleher, J.D., Deep Learning; MIT Press, 2019; chapter 1, pp. 1–38.
- Kim, P. Matlab deep learning. With machine learning, neural networks and artificial intelligence 2017, 130, 151. [Google Scholar]
- Albawi, S.; Mohammed, T.A.; Al-Zawi, S. Understanding of a convolutional neural network. In Proceedings of the 2017 International Conference on Engineering and Technology (ICET), 2017, pp. 1–6. [CrossRef]
- Gibaja, E.; Ventura, S. Multi-label learning: a review of the state of the art and ongoing research. Wiley Interdisciplinary Reviews: Data Mining and Knowledge Discovery 2014, 4, 411–444. [Google Scholar] [CrossRef]
- Koyejo, O.O.; Natarajan, N.; Ravikumar, P.K.; Dhillon, I.S. Consistent multilabel classification. Advances in Neural Information Processing Systems 2015, 28. [Google Scholar]
- Du, J.; Chen, Q.; Peng, Y.; Xiang, Y.; Tao, C.; lu, Z. ML-Net: Multi-label classification of biomedical texts with deep neural networks. Journal of the American Medical Informatics Association : JAMIA 2019, 26. [Google Scholar] [CrossRef]
- Pereira, R.B.; Plastino, A.; Zadrozny, B.; Merschmann, L.H. Correlation analysis of performance measures for multi-label classification. Information Processing & Management 2018, 54, 359–369. [Google Scholar] [CrossRef]
- Krstinić, D.; Braović, M.; Šerić, L.; Božić-Štulić, D. Multi-label classifier performance evaluation with confusion matrix. Computer Science & Information Technology 2020, 1, 1–14. [Google Scholar]
- Koço, S.; Capponi, C. On multi-class classification through the minimization of the confusion matrix norm. In Proceedings of the Asian Conference on Machine Learning. PMLR, 2013, pp. 277–292.
- Canbek, G.; Sagiroglu, S.; Temizel, T.T.; Baykal, N. Binary classification performance measures/metrics: A comprehensive visualized roadmap to gain new insights. In Proceedings of the 2017 International Conference on Computer Science and Engineering (UBMK). IEEE, 2017, pp. 821–826.
- Labatut, V.; Cherifi, H. Evaluation of performance measures for classifiers comparison. arXiv preprint arXiv:1112.4133 2011.
- Fawcett, T. An introduction to ROC analysis. Pattern recognition letters 2006, 27, 861–874. [Google Scholar] [CrossRef]
Figure 1.
A conceptual diagram of the MLC approach for comorbidity prediction in OSA patients ( Adapted from [56]).
Figure 1.
A conceptual diagram of the MLC approach for comorbidity prediction in OSA patients ( Adapted from [56]).
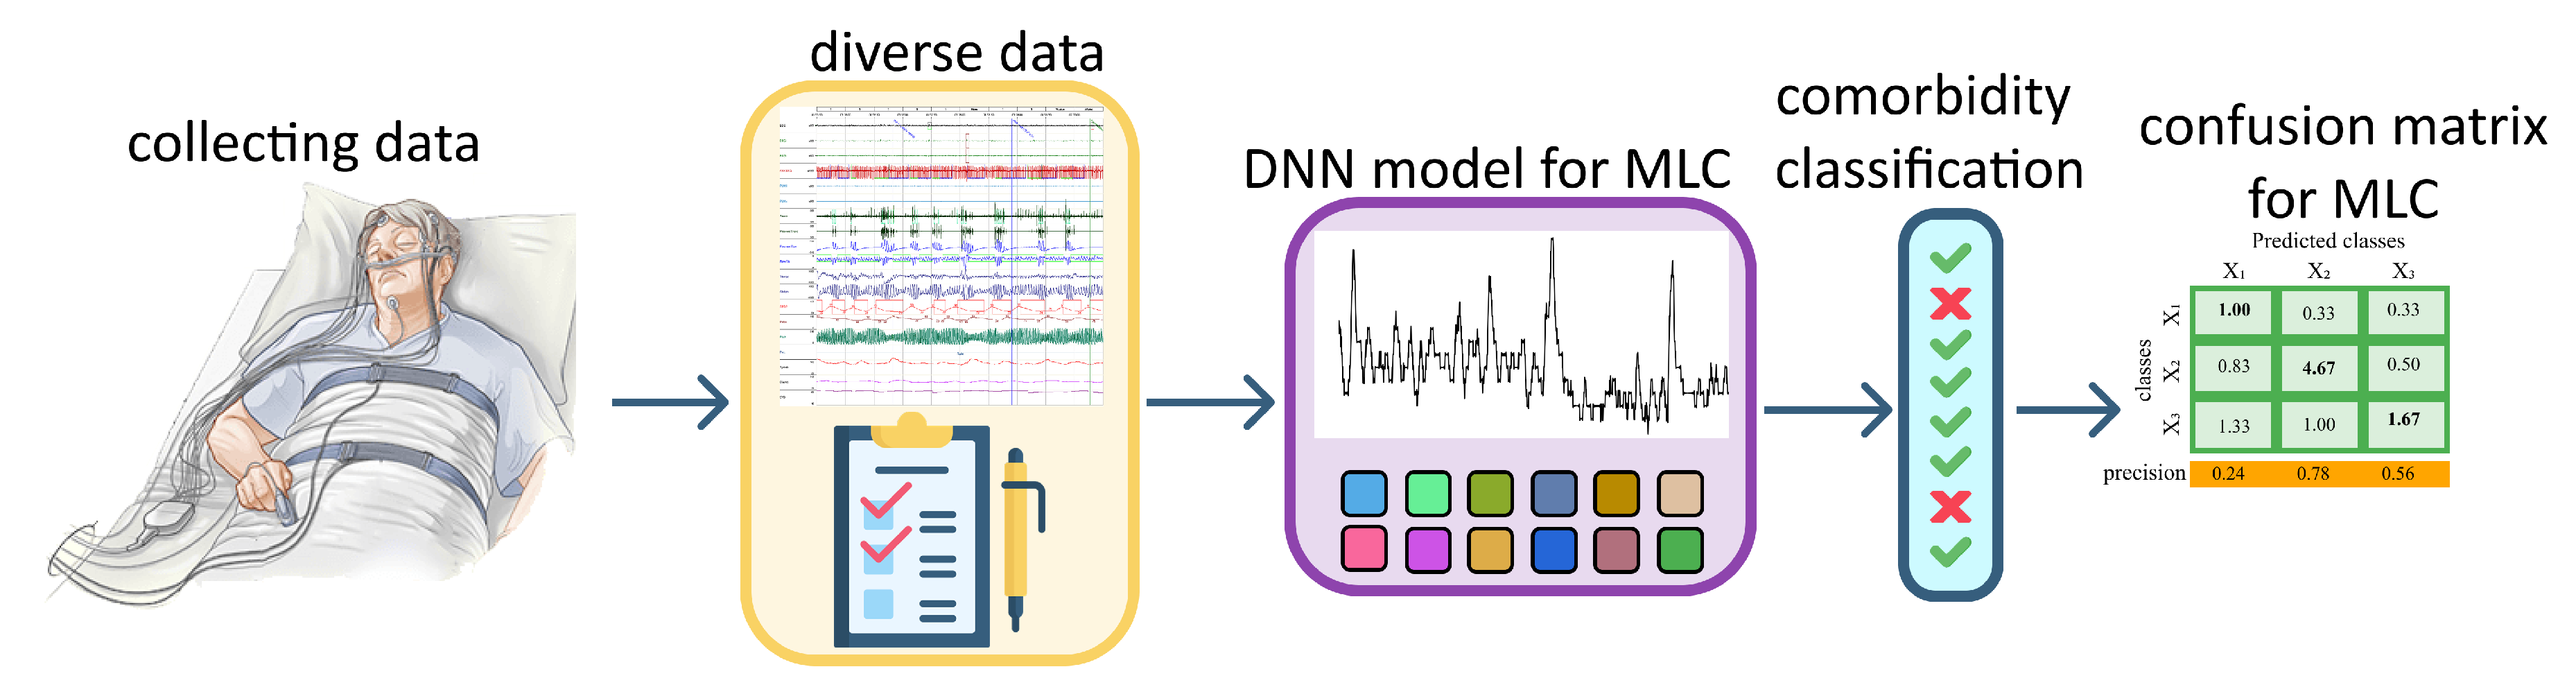
Figure 2.
and FP0 signals of patient before preprocessing procedure.
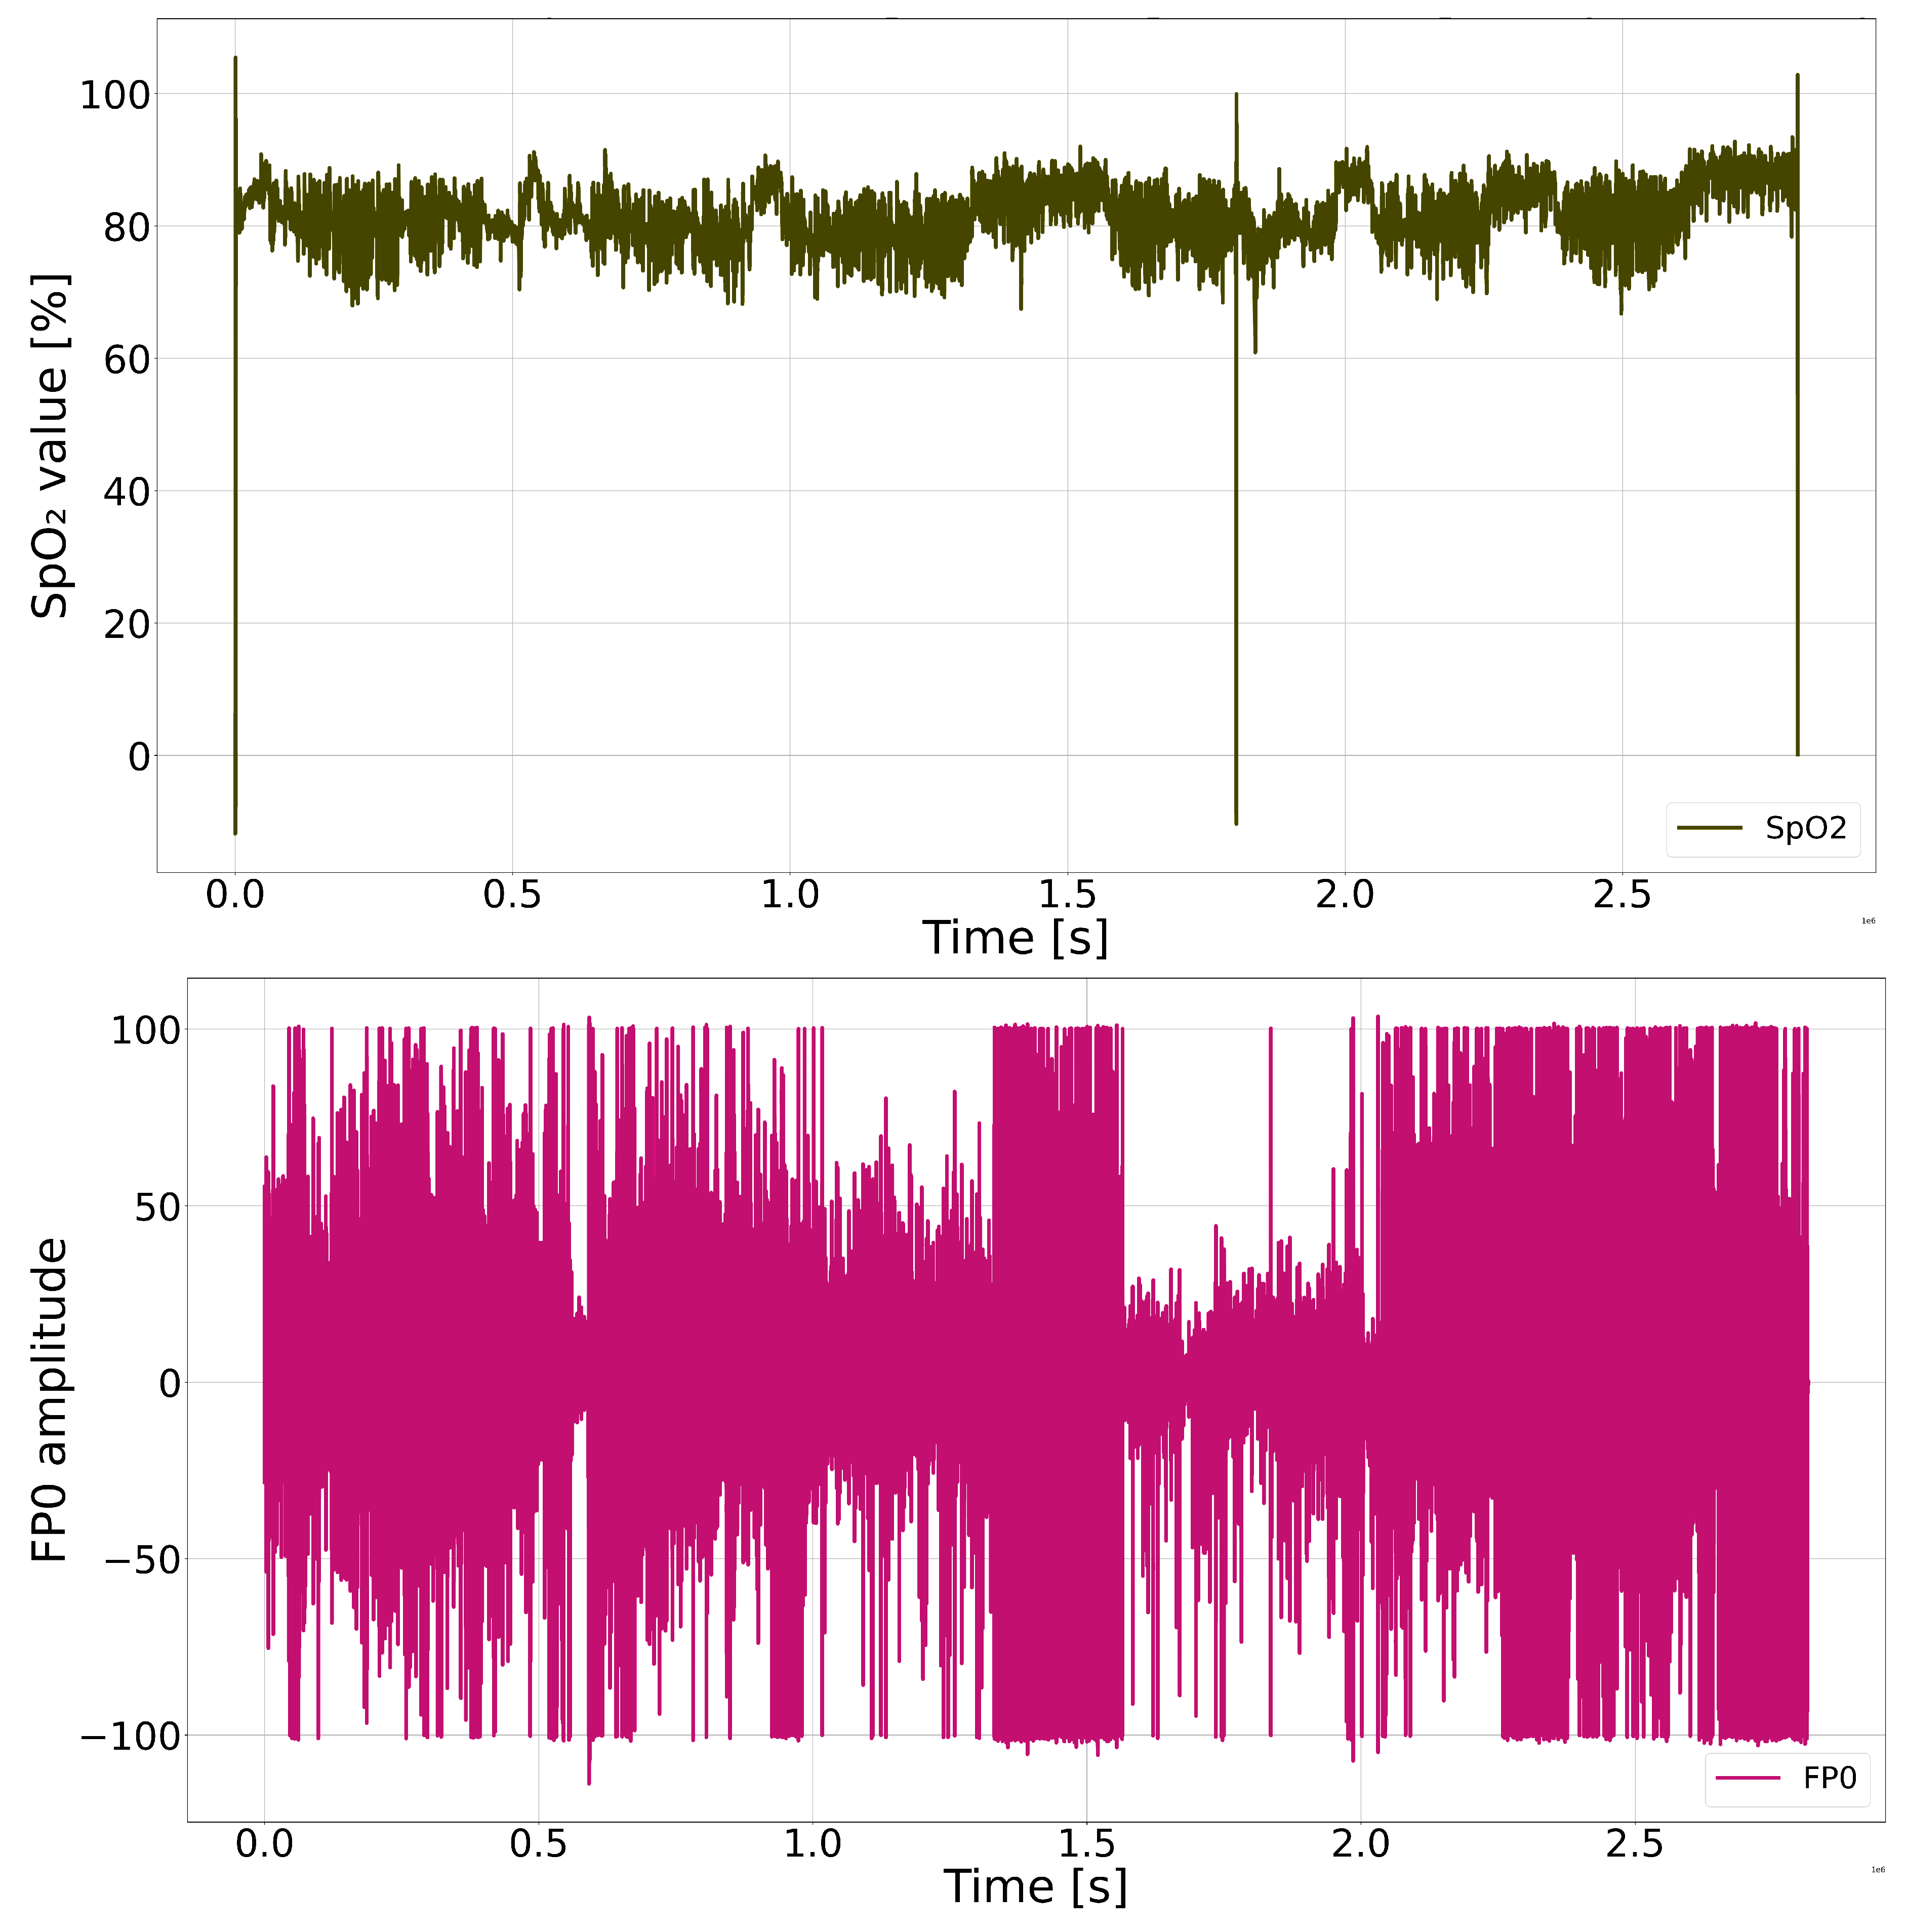
Figure 3.
and FP0 signals after artifact removal and filtering.
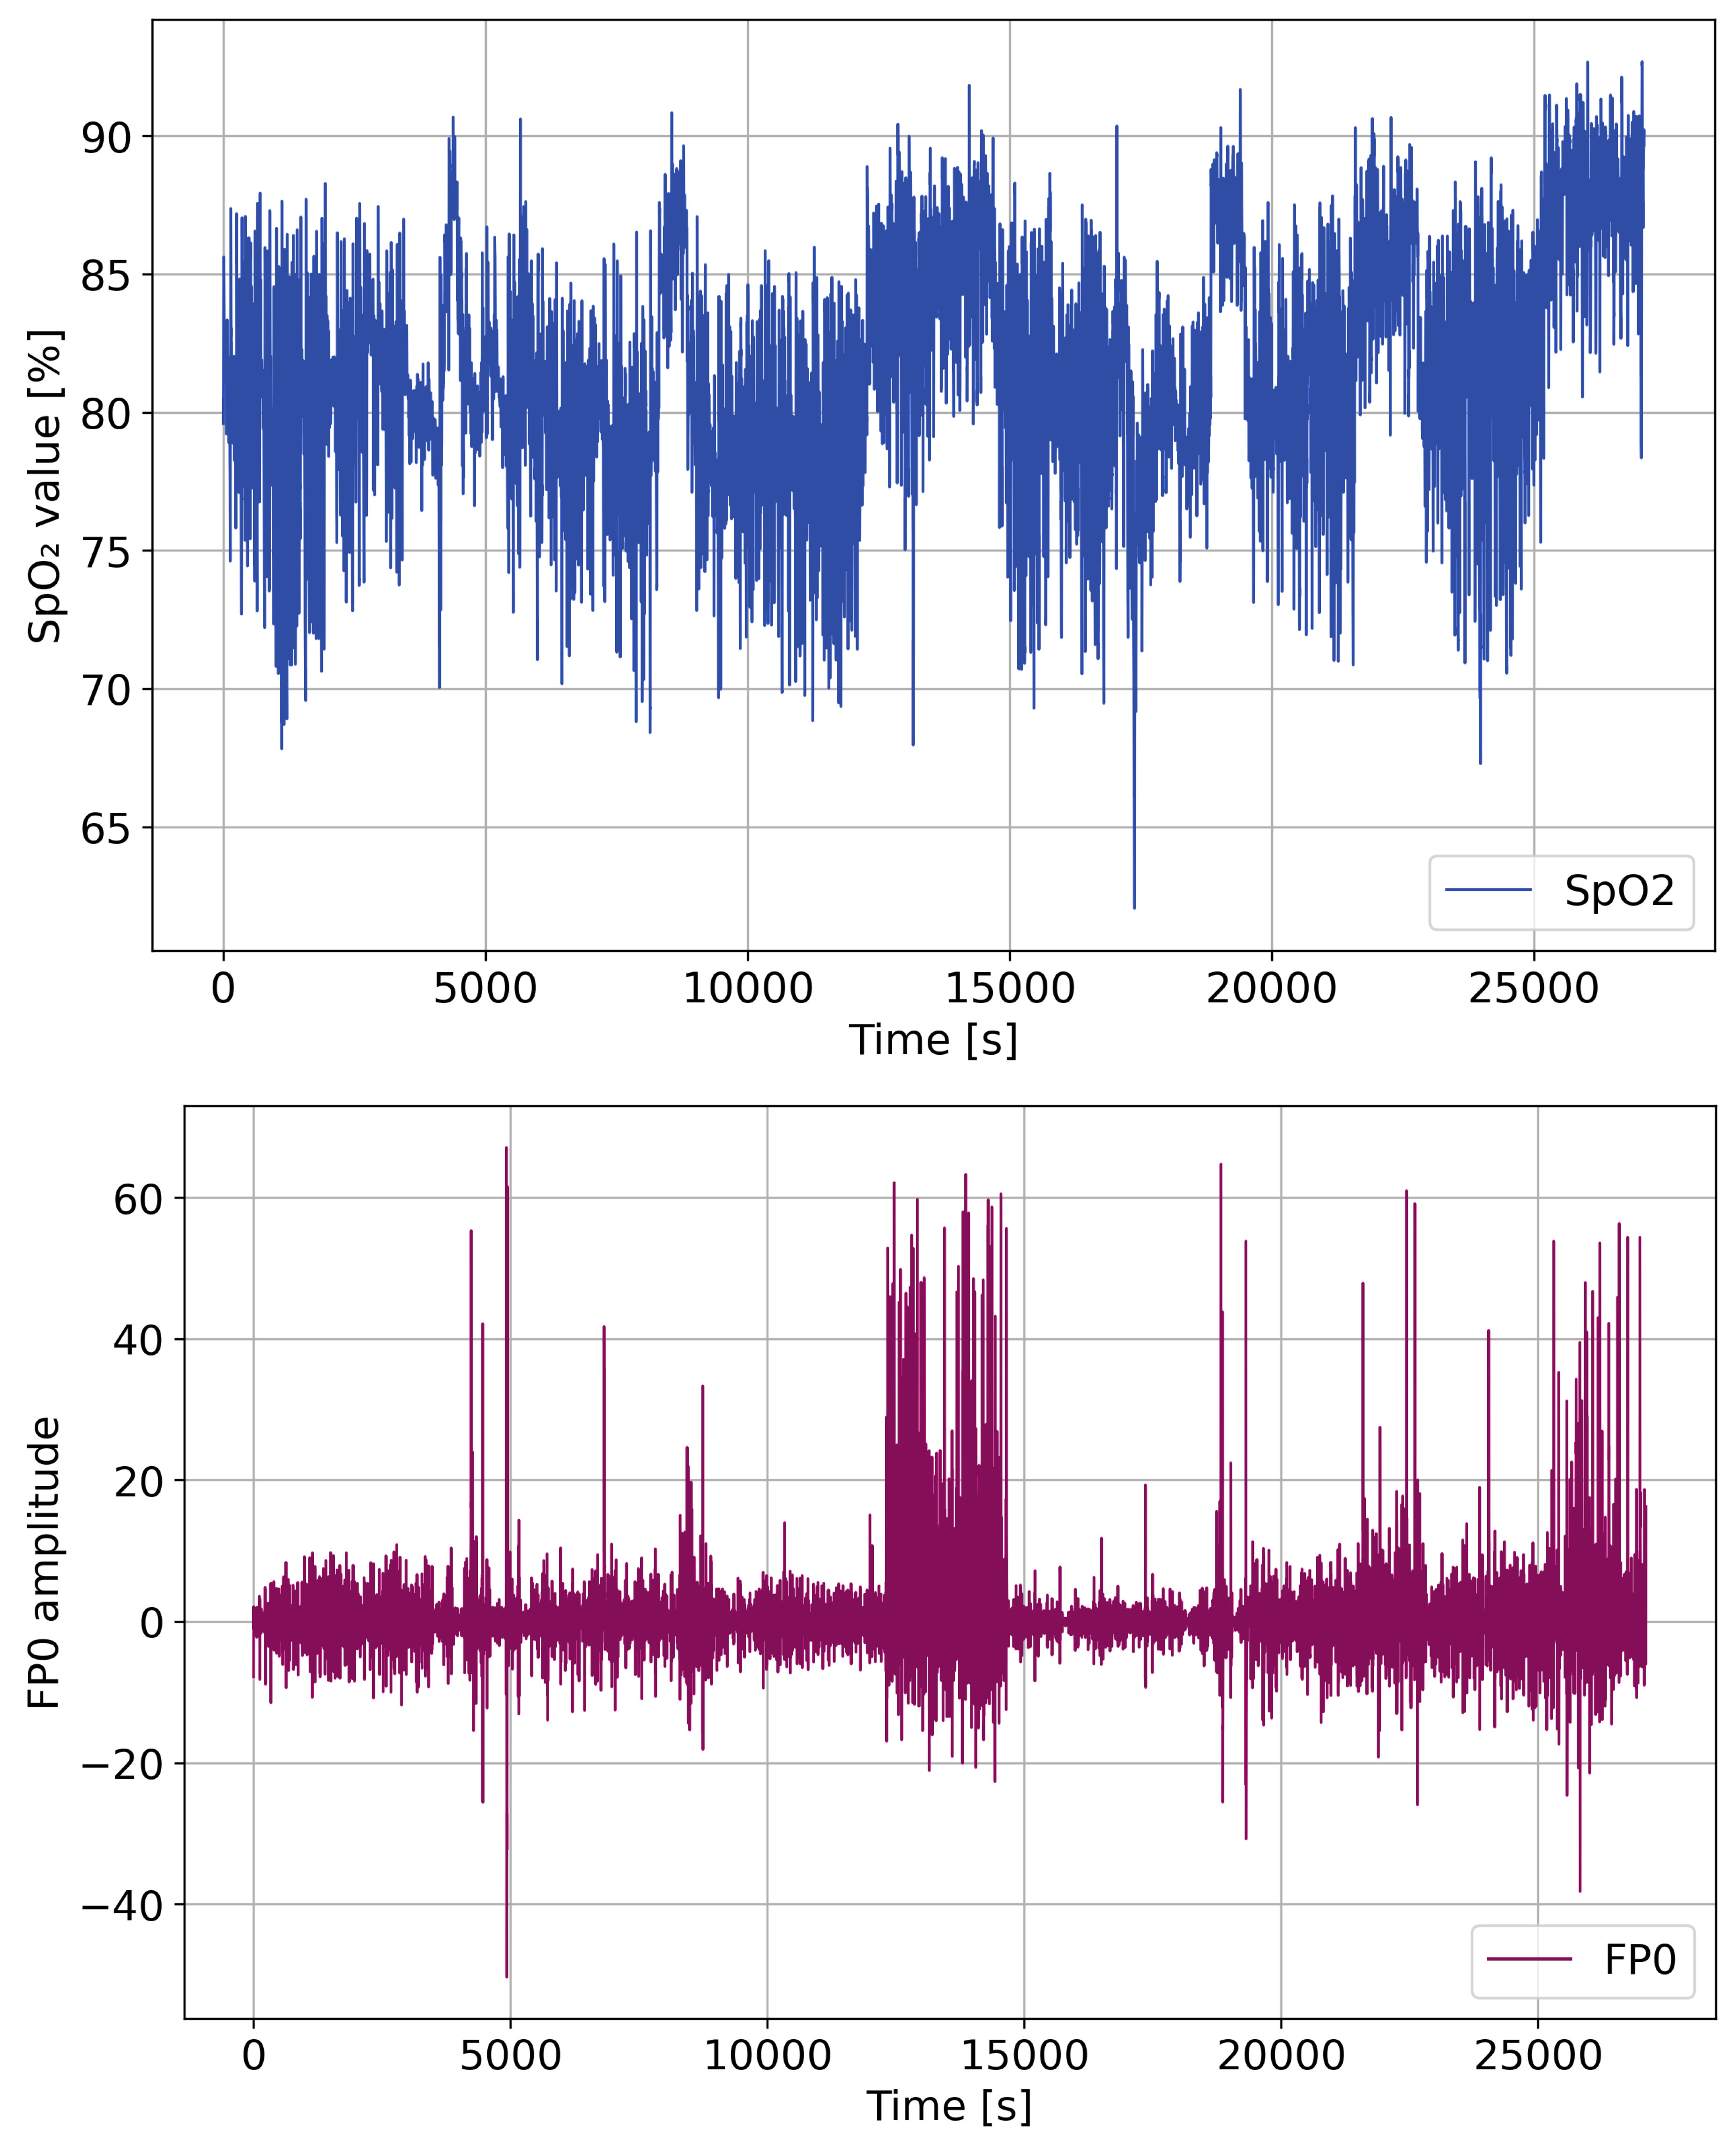
Figure 6.
Example of Single Label vs. MLC.
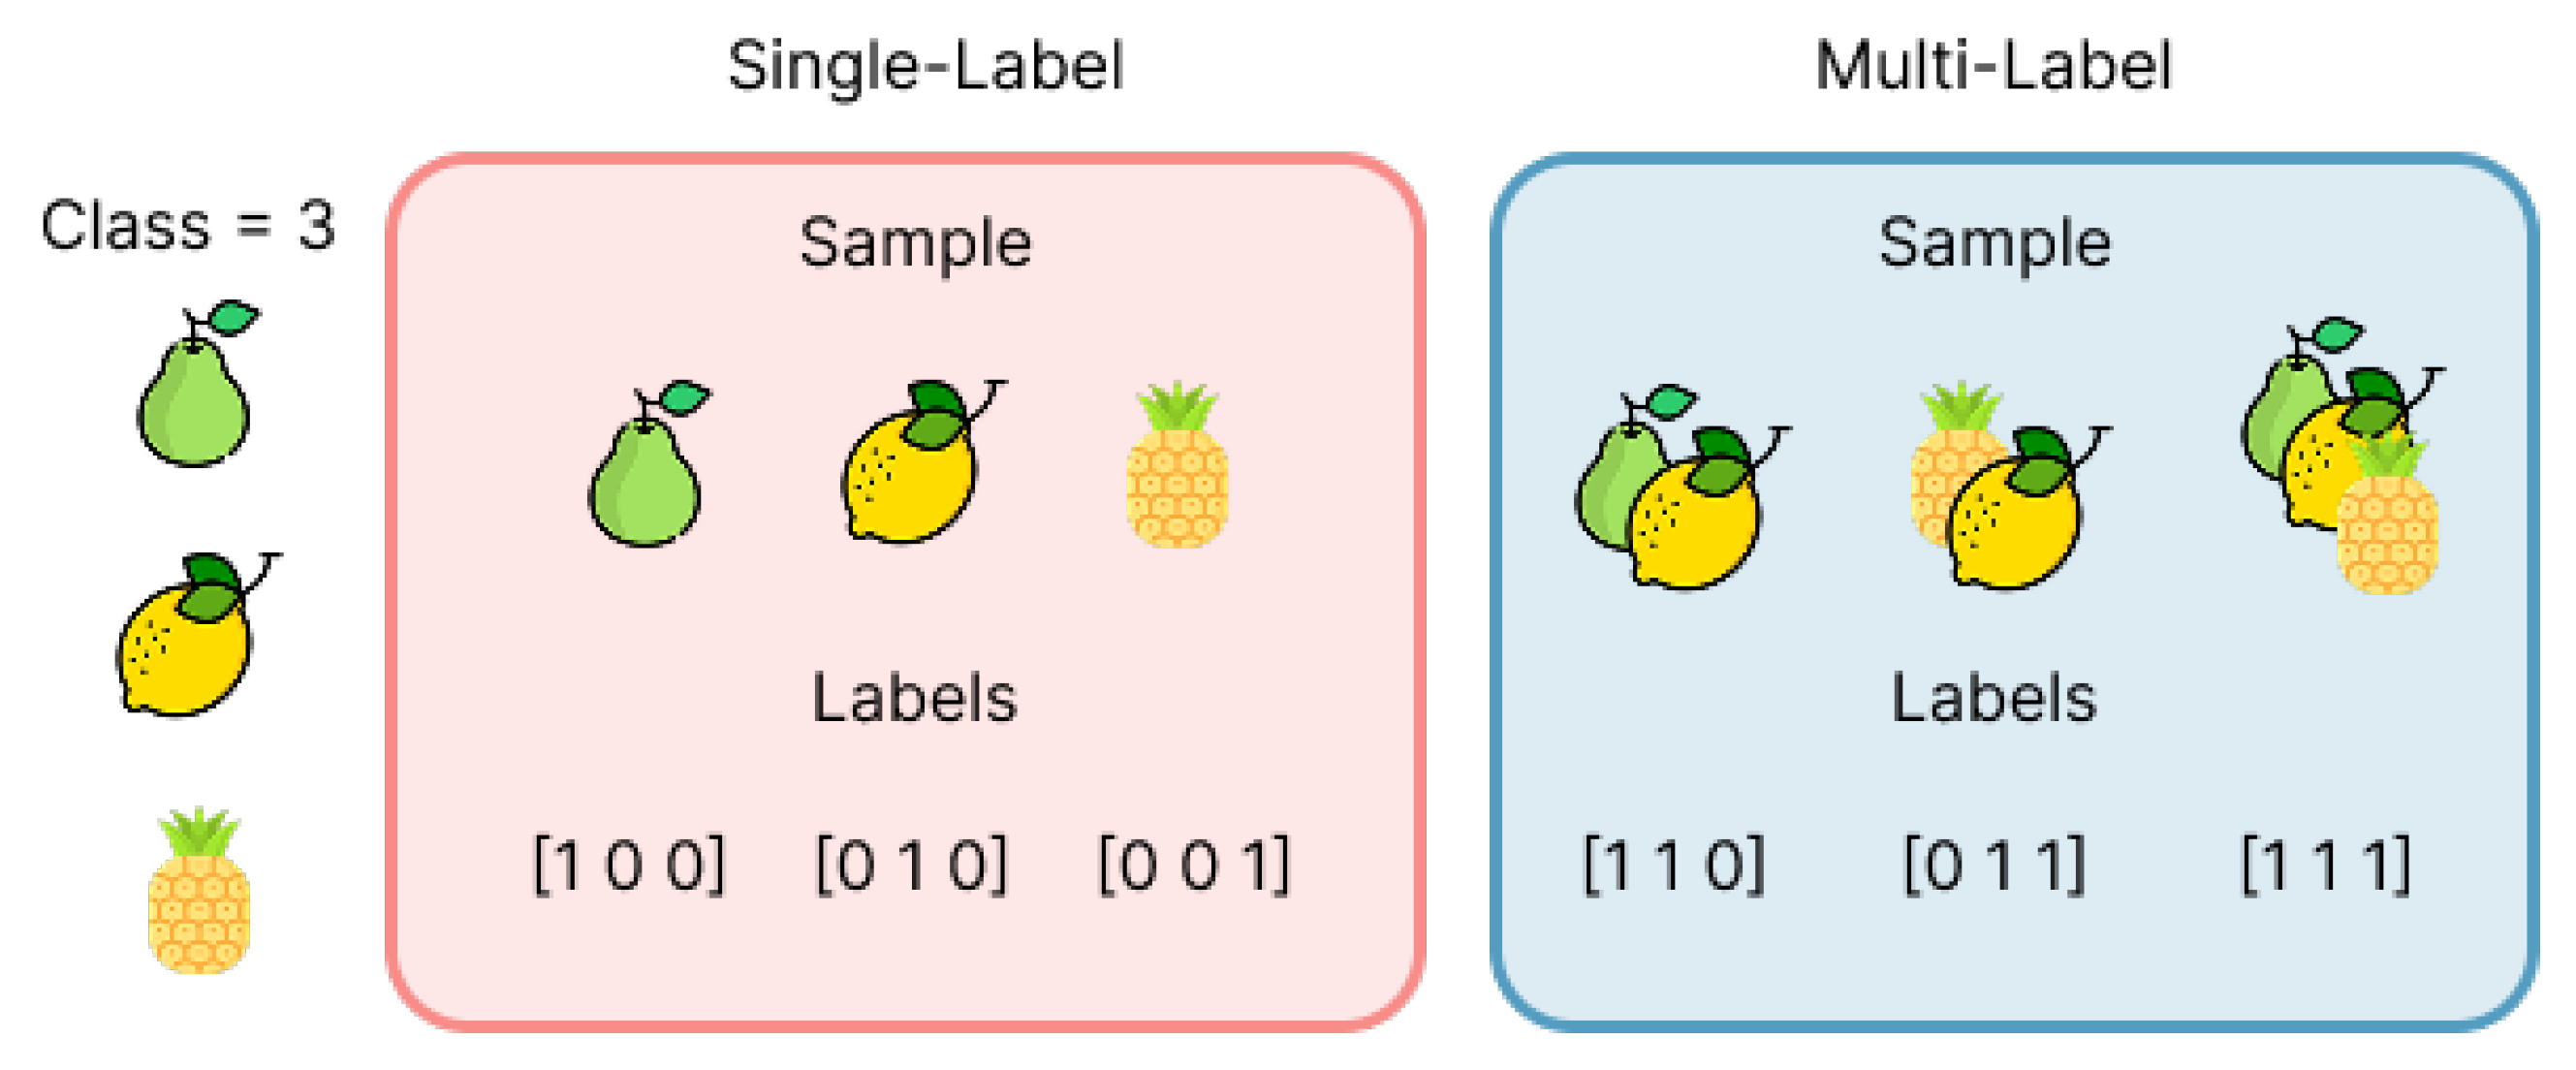
Figure 7.
Conceptual overview of convolutional feature extraction in a CNN.
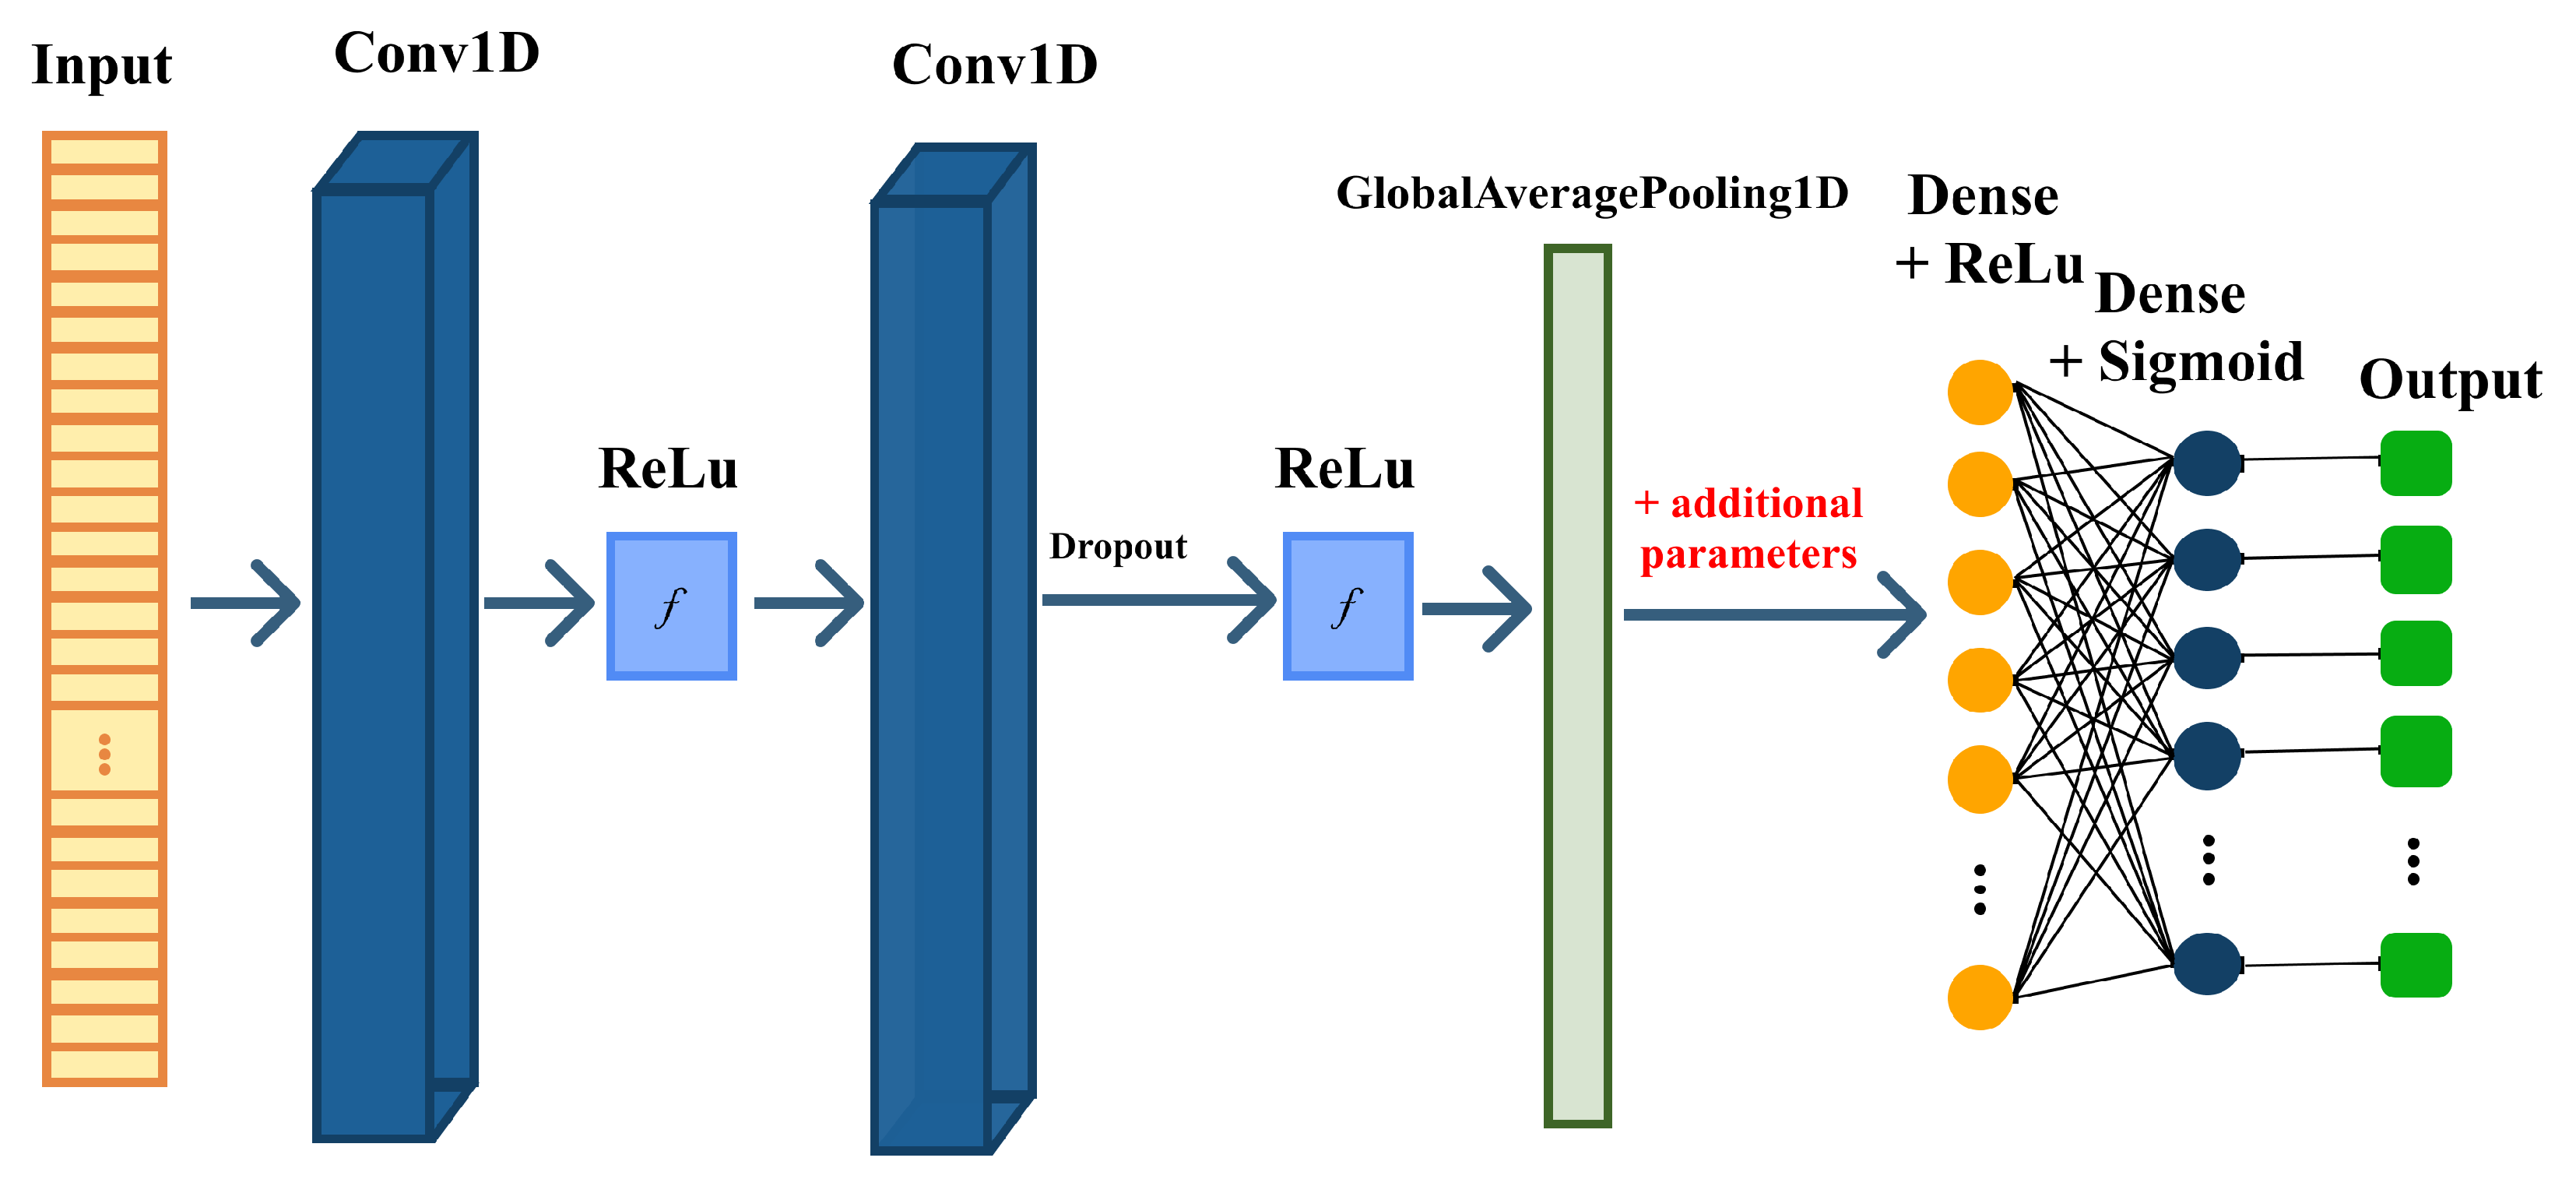
Figure 8.
Multi branch 1D-CNN architecture used for comorbidity prediction.
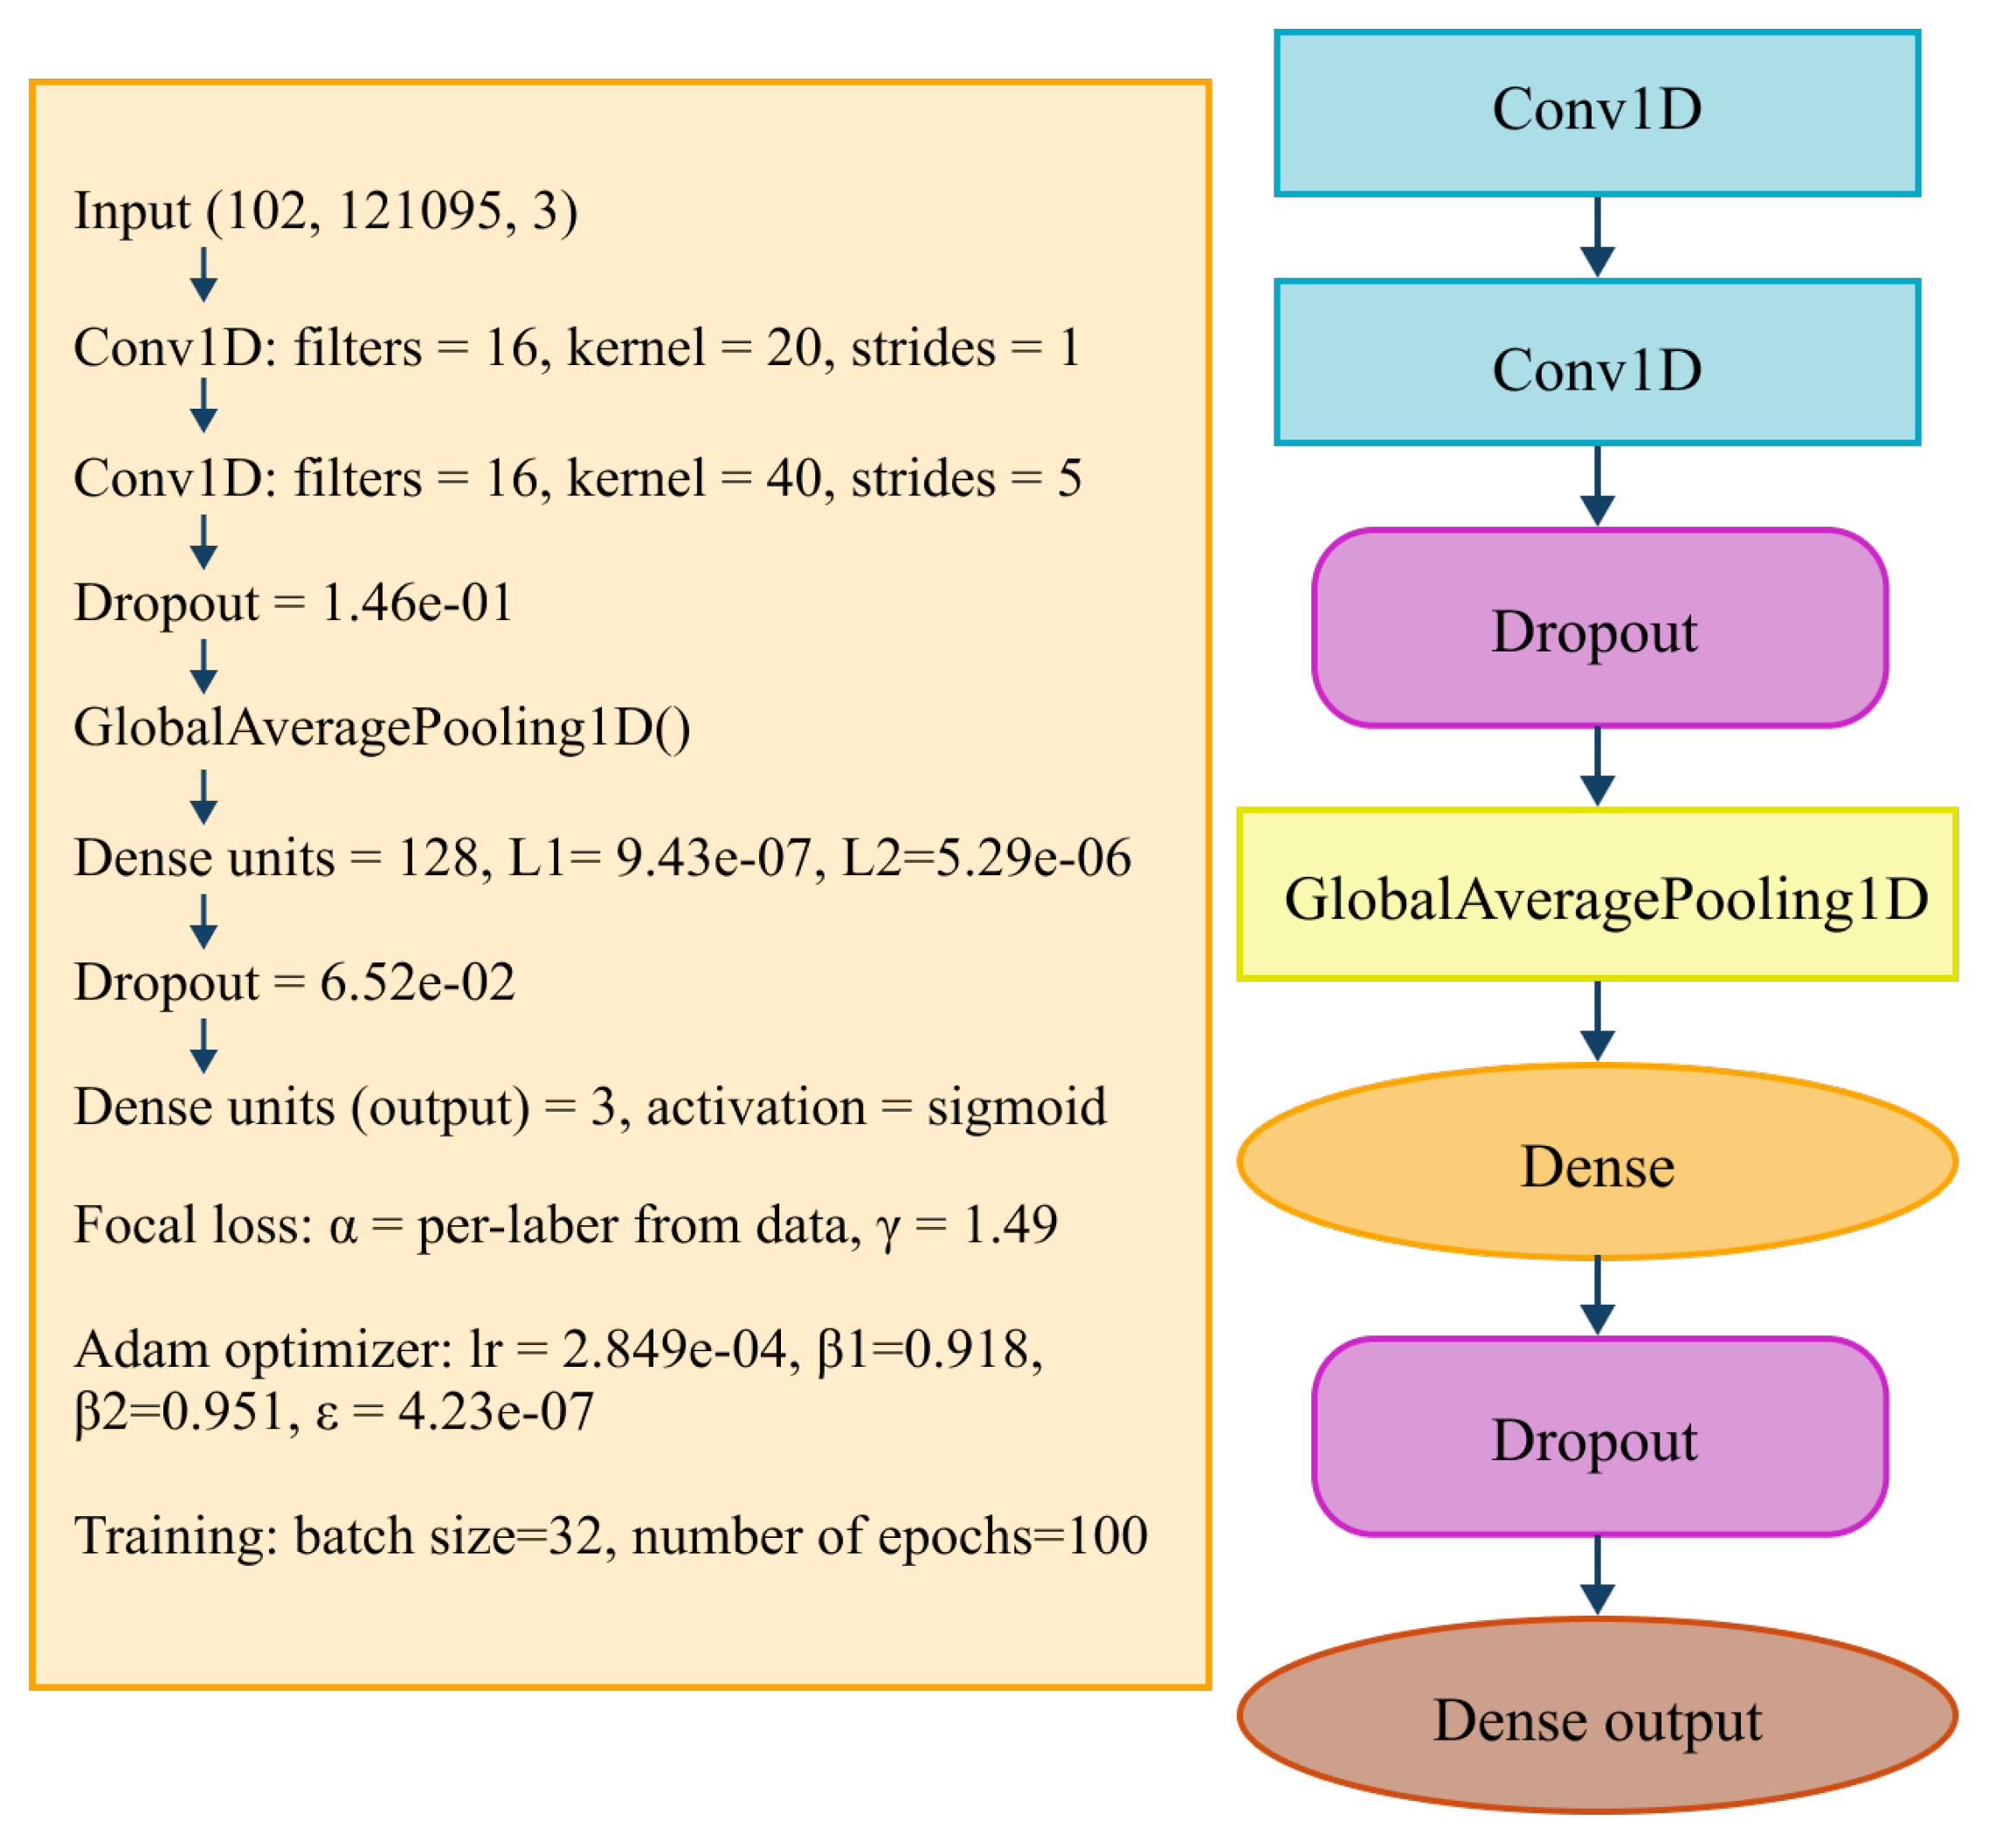
Figure 9.
Correct and Incorrect Predictions per Comorbidity by Age Group
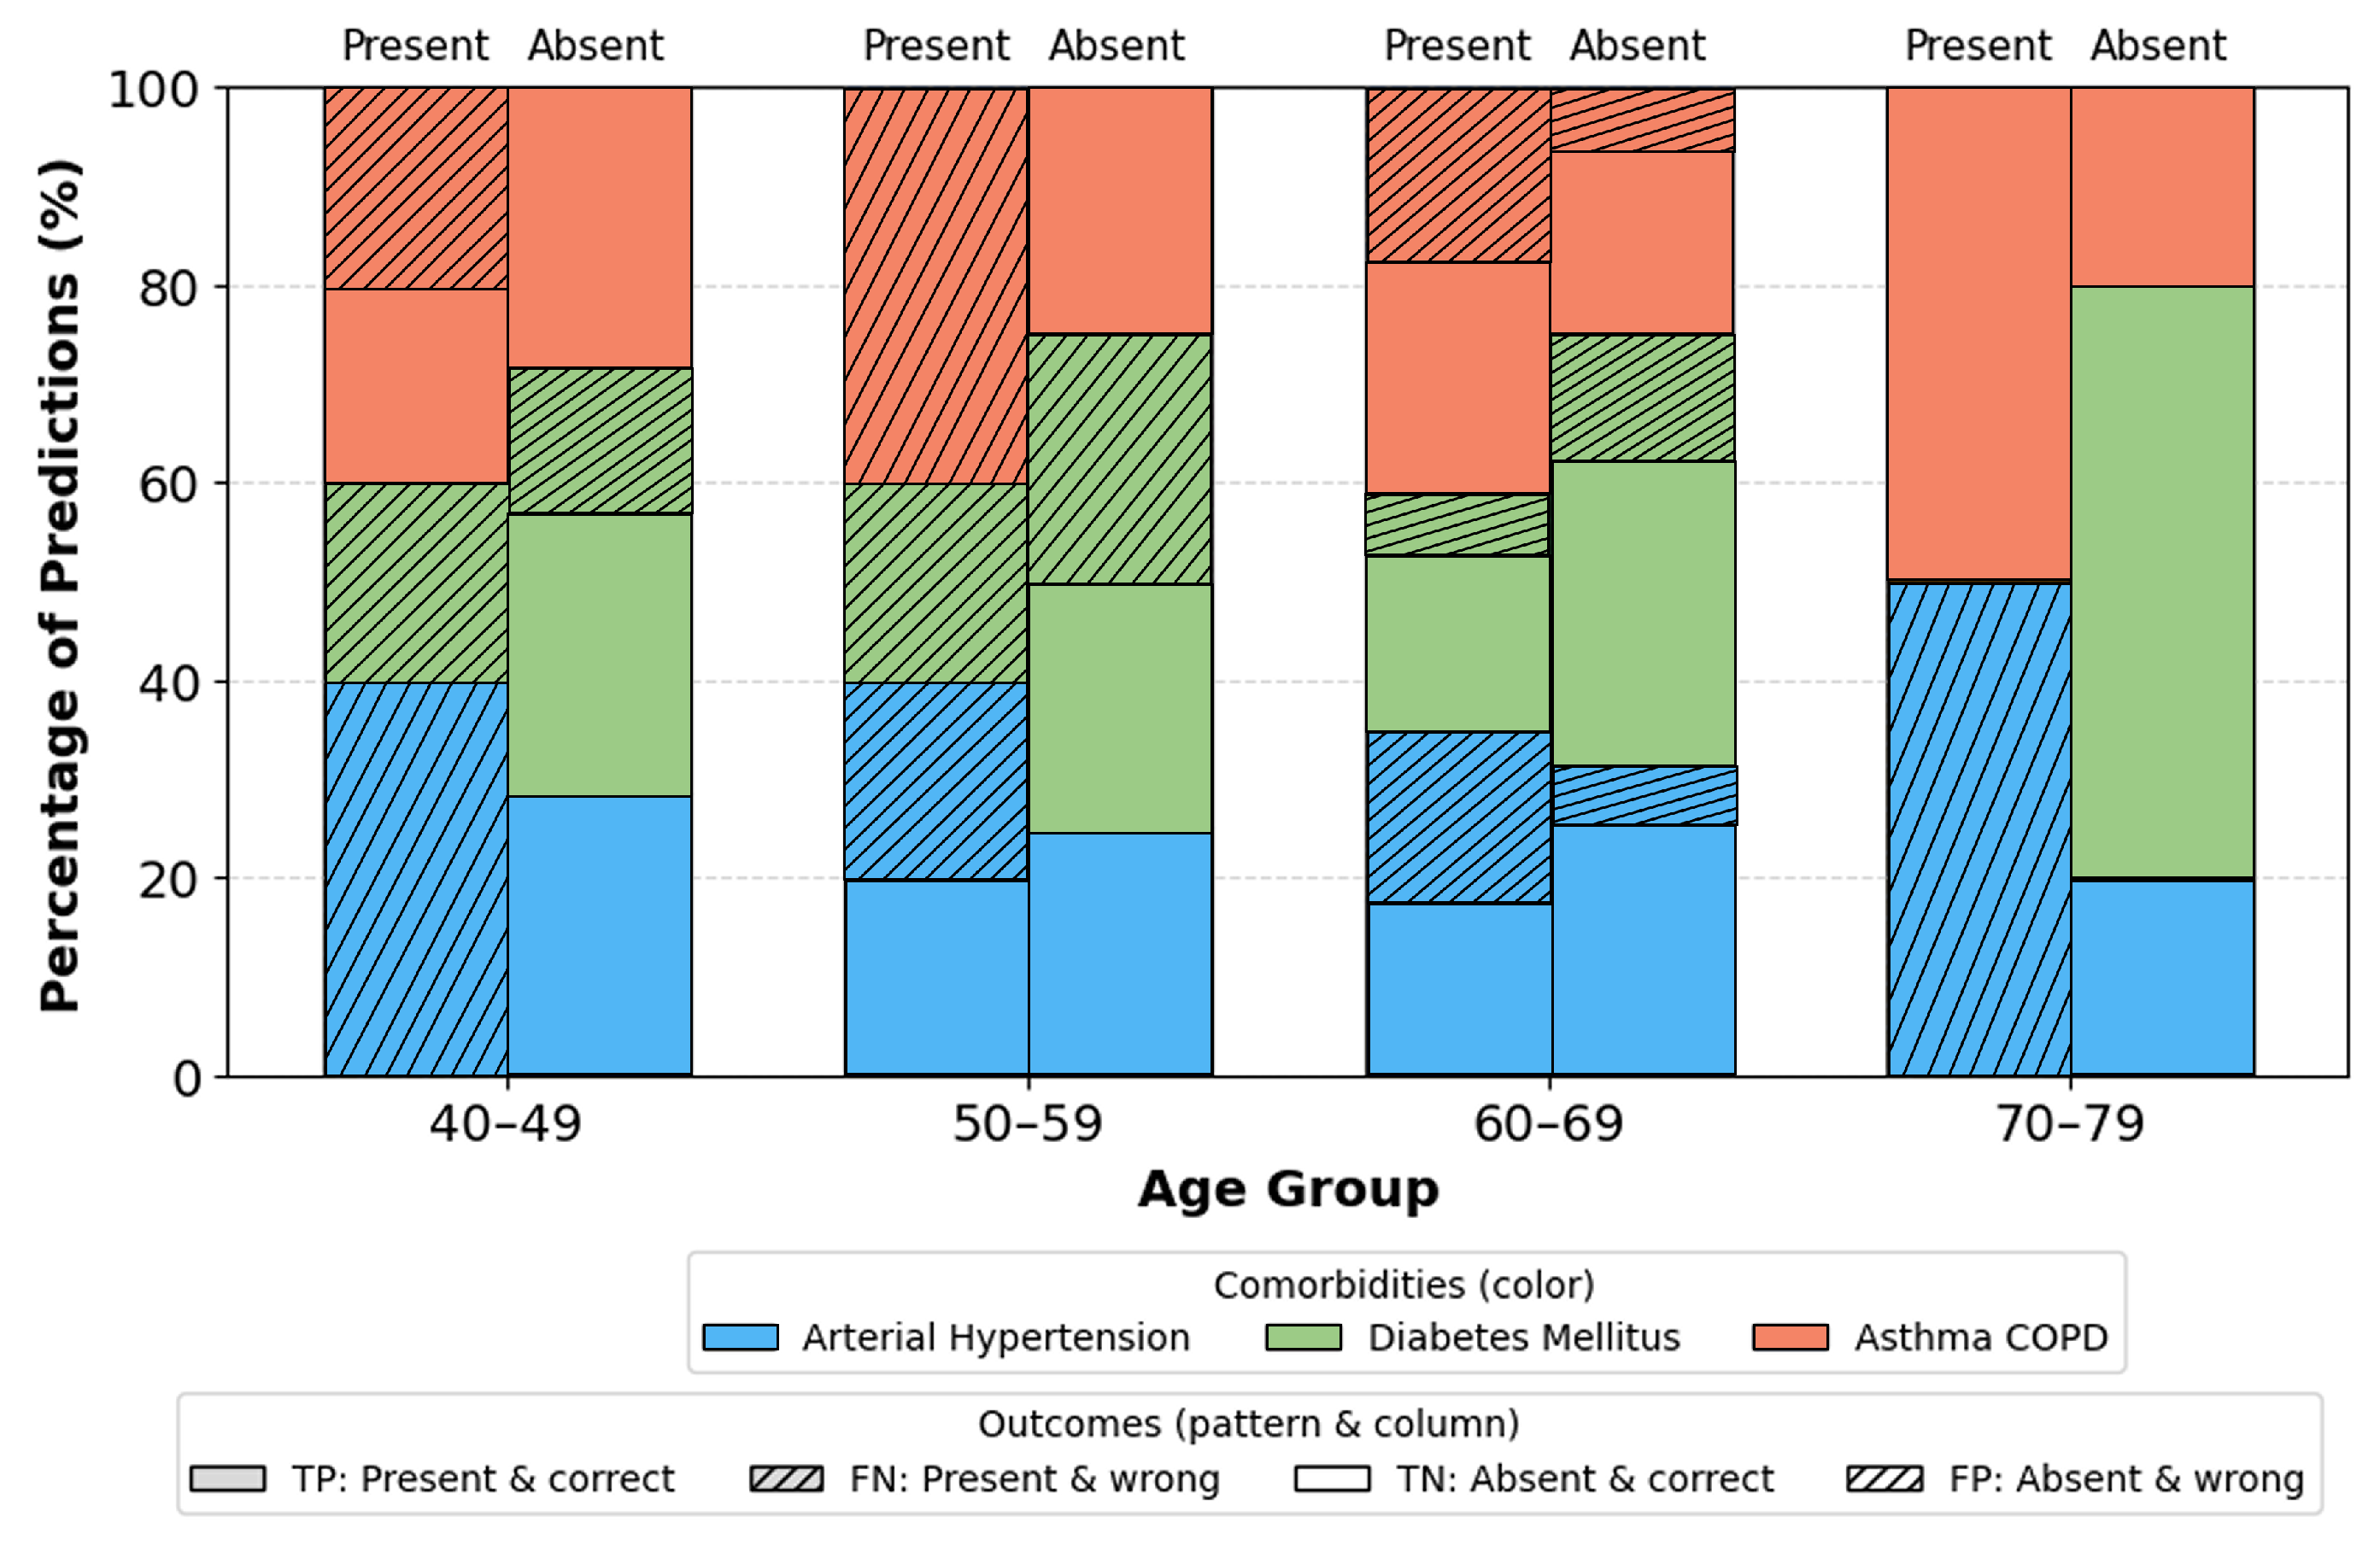
Figure 10.
Correct and Incorrect Predictions per Comorbidity by Gender
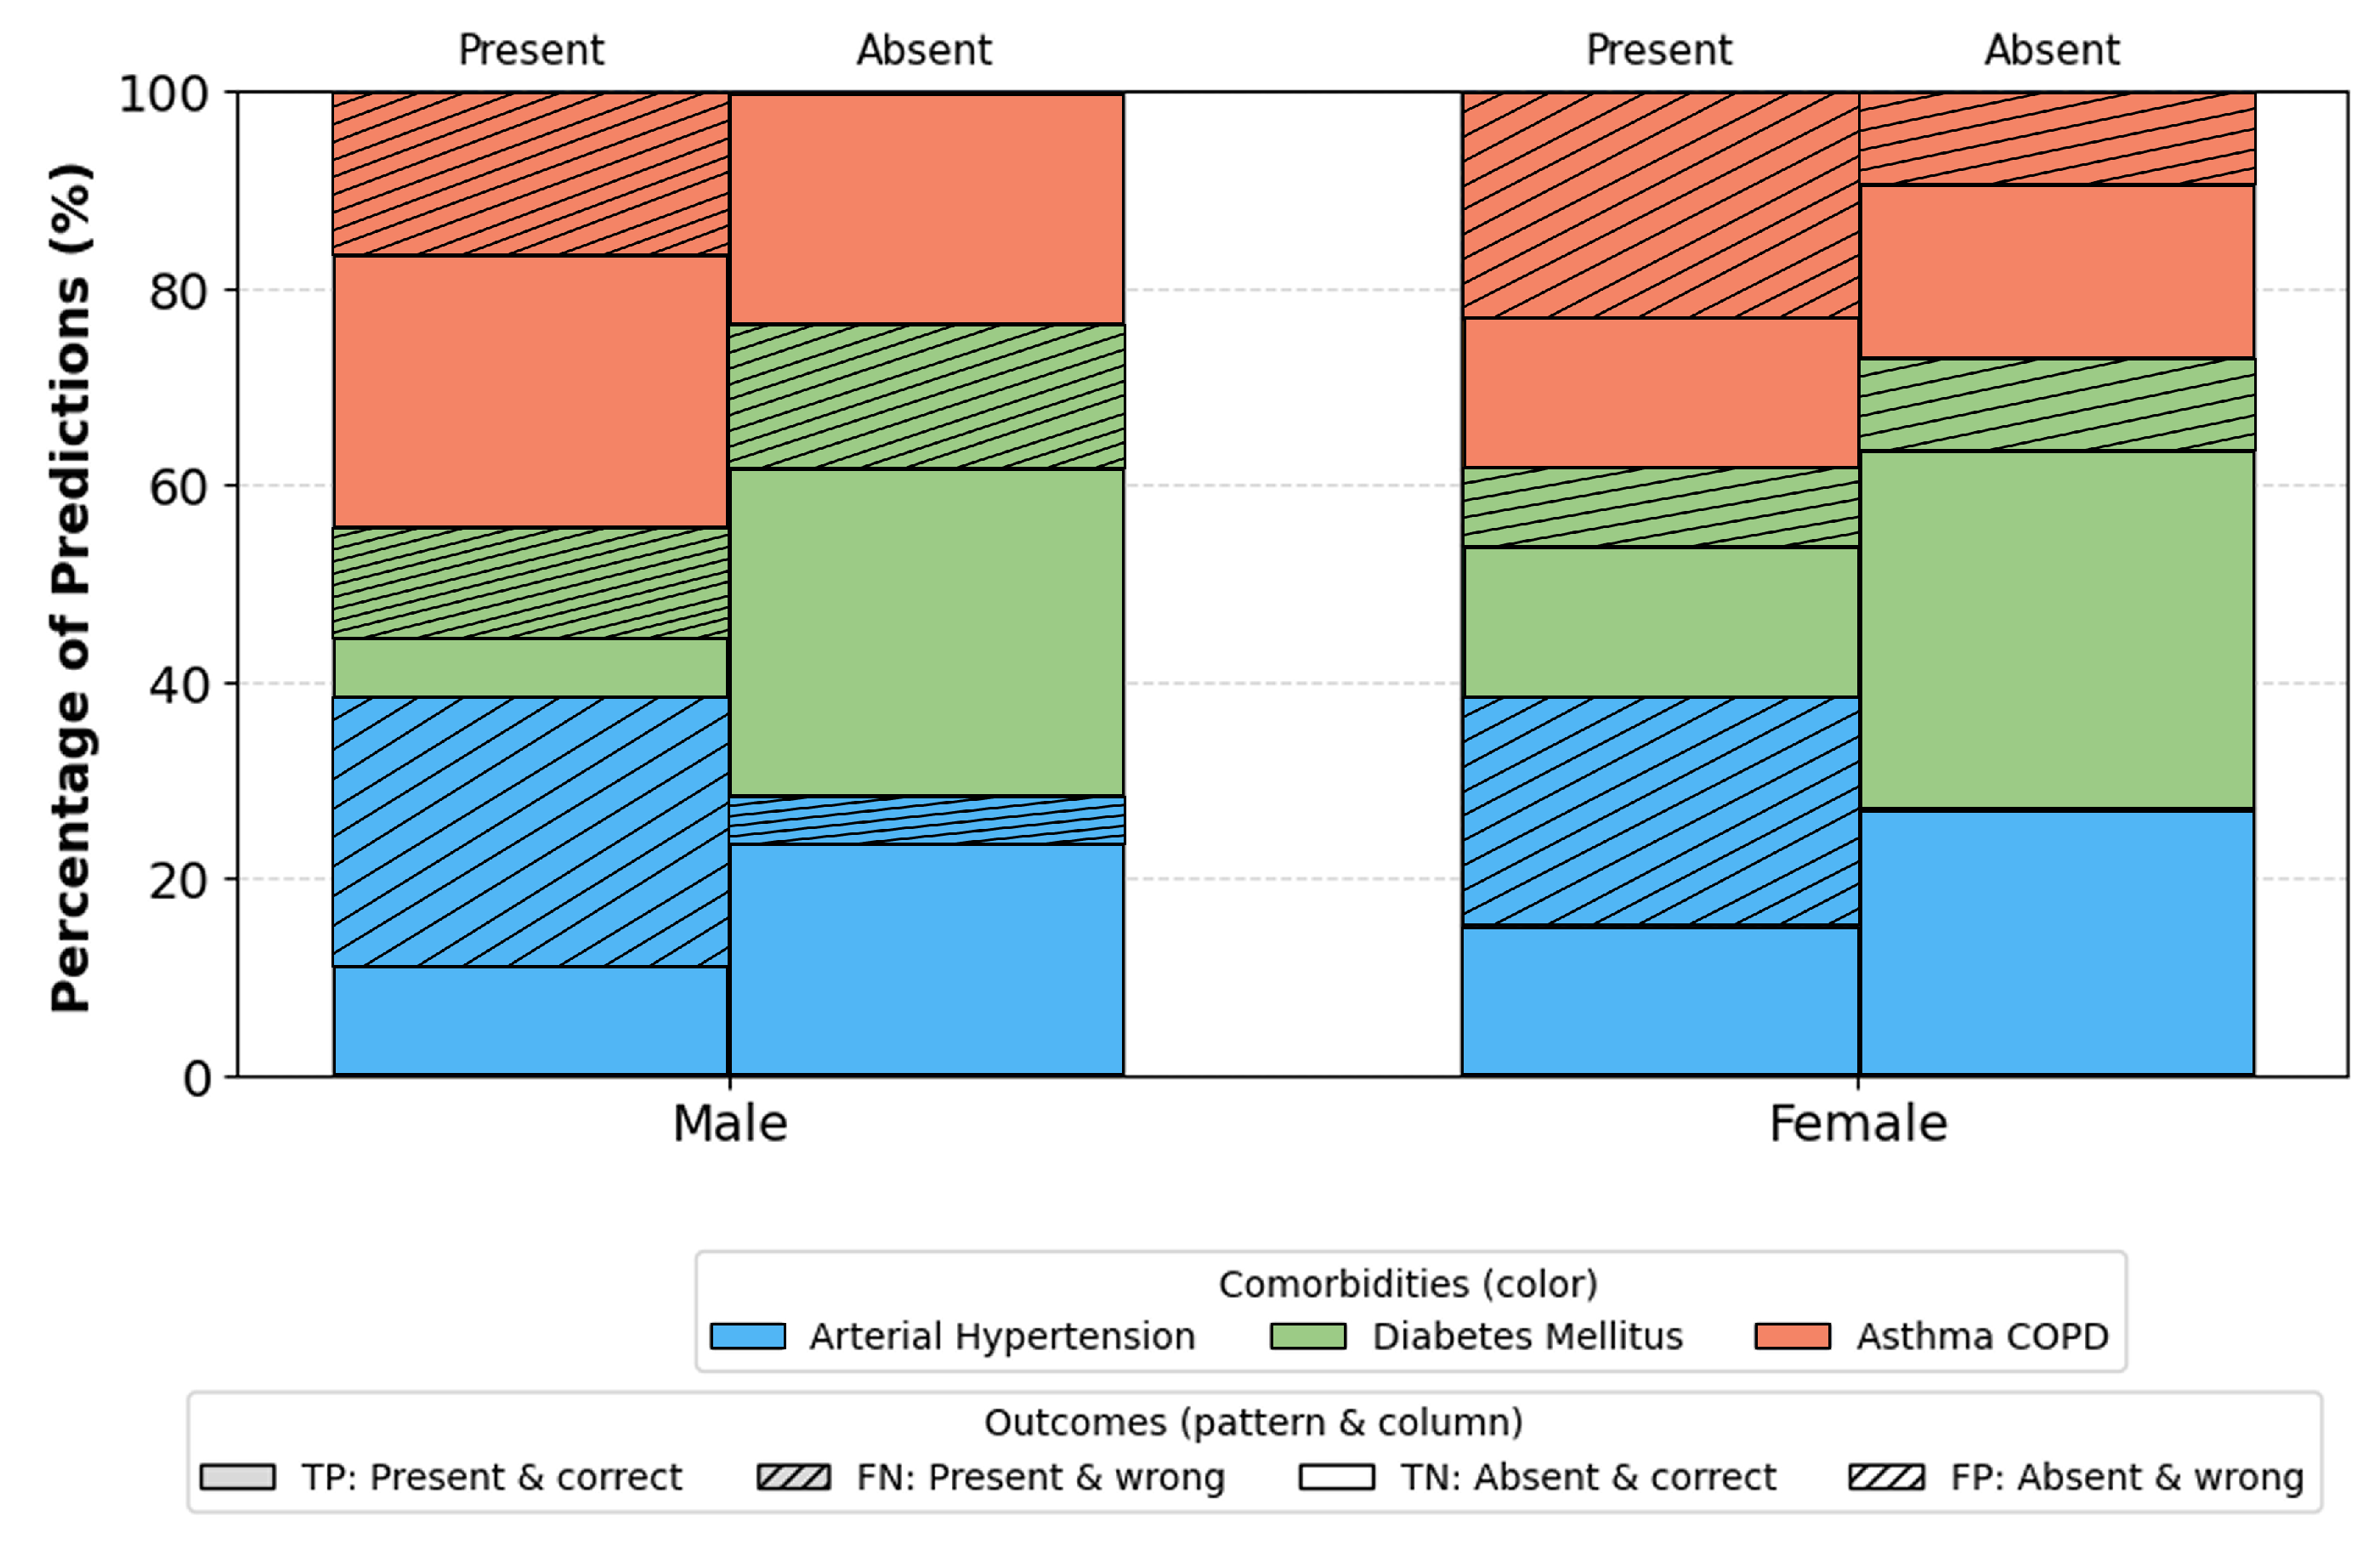
Figure 11.
Correct and Incorrect Predictions per Comorbidity by BMI Range
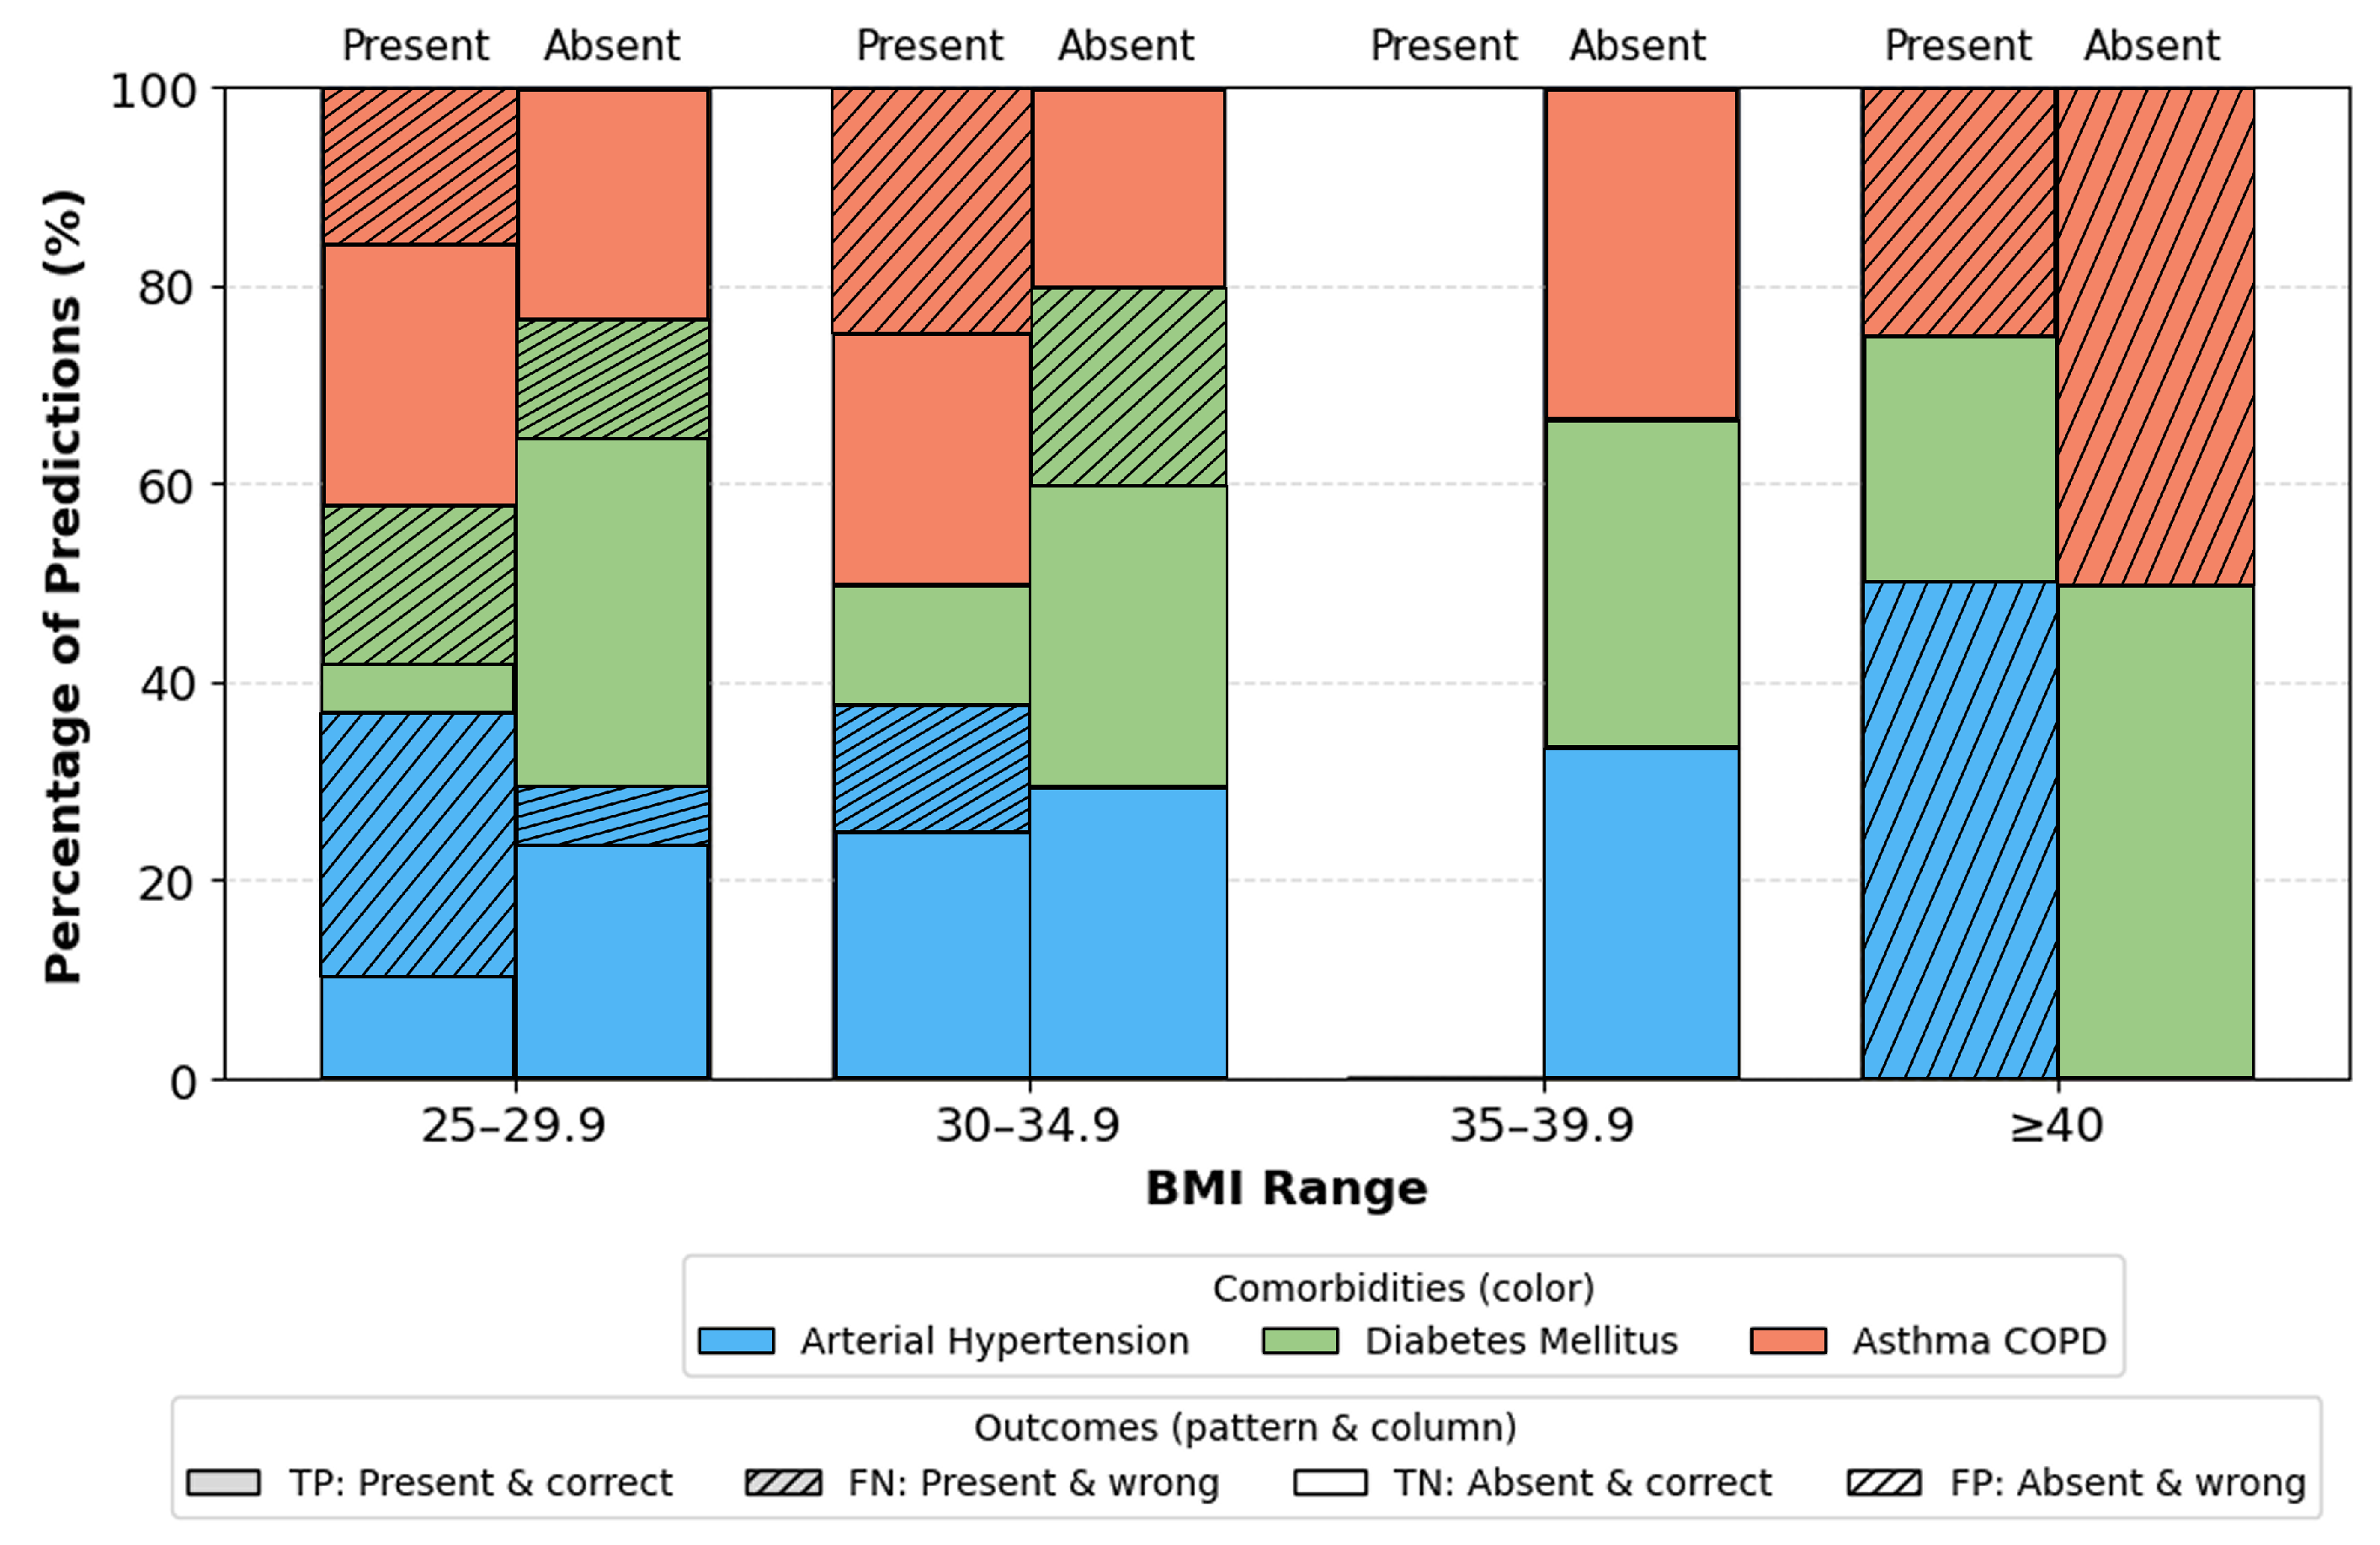
Table 1.
Raw MLCM (Results Only)
| GT | Recall | |||
|---|---|---|---|---|
| 4.0 | 0.0 | 4.0 | 0.50 | |
| 0.0 | 3.0 | 0.0 | 1.00 | |
| 0.5 | 2.5 | 7.0 | 0.70 | |
| Precision | 0.89 | 0.55 | 0.64 |
Disclaimer/Publisher’s Note: The statements, opinions and data contained in all publications are solely those of the individual author(s) and contributor(s) and not of MDPI and/or the editor(s). MDPI and/or the editor(s) disclaim responsibility for any injury to people or property resulting from any ideas, methods, instructions or products referred to in the content. |
© 2025 by the authors. Licensee MDPI, Basel, Switzerland. This article is an open access article distributed under the terms and conditions of the Creative Commons Attribution (CC BY) license (http://creativecommons.org/licenses/by/4.0/).
Copyright: This open access article is published under a Creative Commons CC BY 4.0 license, which permit the free download, distribution, and reuse, provided that the author and preprint are cited in any reuse.


