Preprint
Article

This version is not peer-reviewed.

A Model Downscaling Study of a Wind Park Exposure to Extreme Weather: A Case of Storm ‘Ylva’ in Arctic Norway

Submitted:

01 December 2025

Posted:

02 December 2025

You are already at the latest version

Abstract

Wind energy has the potential to become an important source of energy for remote Arctic regions. However, there are risks associated with the exposure of coastal wind parks to extremely strong winds caused by storms and polar lows. Extreme winds can either enhance or reduce wind energy production. The outcomes largely depend on the coastal landscape surrounding the wind park. To address these questions, we conducted a series of simulations using the Weather Research and Forecasting (WRF) model. This study focuses on one of the strongest wind events along the western Norwegian coast - the landfall of the storm “Ylva” (November 24–27, 2017). The study employs terrain-resolving downscaling by zooming in on the area of the Kvitfjell-Raudfjell wind park, Norway. The terrain-resolving WRF simulations reveal stronger winds at turbine hub height (80 m to 100 m above the ground level) in the coastal area. However, it was previously overlooked that the landfall of an Atlantic storm, which approaches this area from the southwest, brings the strongest winds from southeast directions, i.e., from the land. This creates geographically extensive and vertically deep wind-sheltered areas along the coast. Wind speeds at hub height in these sheltered areas are reduced, while they remain extreme over wind-channeling sea fjords. The study demonstrates that optimal wind park siting can take advantage of both sustained westerly winds during normal weather conditions and wind sheltering during extreme storm conditions. We found that the Kvitfjell-Raudfjell location is nearly optimal with respect to the extreme winds of “Ylva.”

Keywords: 
;  ;  ;  ;  

1. Introduction

Wind industries consider the coastal zone the best place for wind turbine installations. Indeed, the coastal sites provide access to strong and persistent winds - the key resource for profitable wind power generation. At the same time the coastal zone is usually described as a zone of complex terrain where extreme weather meets great spatial variability of terrain forms [1].
As many coastal areas around the globe, e.g. [2,3], the Norwegian west coast is rich in wind energy [4,5]. Persistent westerly winds support wind power potential in Norway at the level exceeding 6.2 MW km-2 [6]. Benefits, however, come not without challenges; the coastal sites are also exposed to strong winds of occasional Atlantic storms. Moreover, the coastal winds combine the speed of marine winds and boisterous gustiness of terrestrial winds [7]. The extreme wind gusts could be more damaging than the persistent extreme winds as such [2,7,8]. The exposure to strong winds and risks of damage may significantly vary along the coast as complexity of land relief and the coastal configuration can shelter some sites from the extremes. Coastal wind sheltering effects on wind parks have been largely overlooked to date, likely because the studies are focussed on assessing the typical wind-from-the-see directions. The Norwegian coast demonstrates wind park sighting challenges in full. The coast exhibits a complex configuration with many mountainous islands, sea inlets (fjords) and coastal ridges [5,9], which are exposed to strong winds from the open ocean. Winds in such an environment are jetting along fjords, valleys, and islands’ gaps whereas some sites remain sheltered from winds from certain directions [4,10,11,12,13]. This study will investigate whether wind park sites could benefit from the wind sheltering that occurs predominantly during the dangerous extreme wind episodes.
Storms with winds above 25 m/s make frequent landfall to the Norwegian coast [10,14]. Among them, storms with extreme winds cause significant damage, but until recently did not seriously threaten energy security in the Norwegian communities [15]. Greater penetration of wind power generation - currently at about 10% of the total electricity supply - in the Norwegian energy system prompts re-assessments of related risks and vulnerabilities. Strong winds are impactful but delivered only over a short time (a few hours normally) when atmospheric fronts pass a place. Thus, the strong wind episodes are localized in space and time, and their detailed studies require application of high-resolution weather models with downscaling.
A relatively high upfront investment cost of a wind park construction prompts a strong interest of developers to wind resource assessment in general, and assessment of extreme wind vulnerability in particular. There are temporal and spatial aspects which are relevant to evaluation of extreme wind exposure. The temporal aspect is related to infrequent occurrence of extreme winds (storms) [14]. An extreme storm could be missing in shorter observational records from a prospective site. Particularly, if one considers that both the strength and frequency of storms vary on decadal time scales [3,16,17]. Zhou and Esau (2025) [18] have shown that rather long (decadal time scale) observations are needed to robustly account for strong winds and their statistical approximation as the wind speed has a heavy distribution tail. The Weibull statistical distribution is usually applied for the wind resource evaluation [19]. The geographical aspect is related to spatial heterogeneity of winds. Available wind observations from meteorological stations cannot be reliably extrapolated to a prospective site in complex terrain. The wind field in such terrain demonstrates high small-scale spatial variability. This small-scale variability could be captured only by fine-resolution numerical models with downscaling [12,20,21]. In particular, the fine spatial scales of complex terrain modify wind speeds along certain, sheltered or opposite channeled, directions as it had been already demonstrated by Grønås and Sandvik [10]. These aspects make numerical models indispensable in assessment and spatial localization of extreme storm impact before a wind park is built.
This study adds to very limited research on extreme weather impact of storms and understanding of the wind sheltering/channeling along the Norwegian coast - one of the most promising regions of wind park development in Europe [22]. The study considers the wind patterns and their evolution prior, during, and shortly after landfall of the storm “Ylva” (November 19 through 28, 2017) - the most extreme (in terms of wind strength and persistence) storm observed in Northern Norway in the 21st century. Observe that in Northern Norway, meteorological stations are sparse and often non-representative so that the event was relatively poorly captured by observations, in particular with respect to the needs of the wind energy sector. There were no observations at the approximate turbine hub height level of 85 meters above the ground level (a.g.l.). At the same time, several studies indicated that models tend to underestimate the occurrence of extreme winds in complex terrain, e.g. [12,23,24]. It has been argued that coarse spatial resolution models do not capture coastal orography and hence corrupts wind profiles near the surface [23,25].
Two interconnected research questions are of interest in this context. The first question addresses spatial structure and temporal evolution of extreme winds when a storm is passing over a wind park. The second question addresses wind adjustment to complex terrain, its small-scale orography and surface morphology of the steep hill tops where the wind parks are usually found. To answer both research questions, simulations with high-resolution meteorological models are needed.
Our study has its foundation in a limited but strong modeling research of wind park and fjord sites in Northern Norway [11,12,20,21,26]. At the end of the 20th century, computational resources and meteorological model maturity allowed adequate grid resolutions for the western coast of Norway. Grønås and Sandvik [10] presented perhaps the first storm resolving simulations for the area of interest. They studied the storm Frode, which made landfall in Nordland and Troms counties on October 12, 1996, and remained the strongest storm in the area for almost 20 years until the storm “Ola” made its landfall on February 7, 2015. They used the model MEMO driven by the regional weather prediction model HIRLAM. Although their simulations are now outdated, Grønås and Sandvik [10] had demonstrated that coastal hills could cause strong recirculating flows and valley jets of a considerable damaging potential. They also showed that other areas were sheltered from the strongest winds by favorable orography upstream while they remained exposed to typical westerly winds in the simulated area. Two innovations in meteorological modeling, namely, introduction of seamless internal domain downscaling and meteorological data assimilation, changed our capability to follow up and zoom in into passing weather systems. These innovations are now incorporated also into the state-of-the-art European Centre for Medium-Range Weather Forecasts (ECMWF) Retrospective Analysis version 5 (ERA5) – the Weather Research and Forecasting (WRF) modelling chain, which has got strong momentum, and is now widely used for wind downscaling simulations and studies of the atmospheric dynamics [24,27].
The ERA5-WRF downscaling modeling chain has been applied to simulations of the coastal winds in Northern Norway. Solbakken et al. [26] simulated one year (2014-09-01 - 2015-08-30) of weather with 3 WRF domains of 27 km, 9 km, 3 km, and 1 km resolution. No extreme wind conditions were reported during the simulated year. The simulations were extended for another few months (2020-09-04 - 2021-01-24) in [26]. Birkelund [21] presented simulations of the year 2017, which included the storm “Ylva”, but his focus was on resolution effects evaluated for the wind park Fakken, and hence less related to dynamical effects over a more open coastal site of Kvitfjell-Raudfjell.
Our focus in this study is centered on the Kvitfjell-Raudfjell wind park. This narrow geographical focus is an unfortunate limitation caused by technical requirements of “zooming” downscaling with WRF [28]. This limitation applies also to simulations in other similar studies, e.g. [20,21,24,27]. The results could be generalized and applied with the required model re-run to any wind park in the region. In reality, the storm was shifting along the Norwegian coast, and thus, has affected all prospected and operating wind parks in the region.
The presented manuscript has the following structure. The next section describes data and methods. It presents the wind park, relevant observational datasets, statistical analysis methods, and provides information about configuration of the WRF model used to run wind simulations for this storm. The third section presents the results of this study. The next Discussion section debates characteristics of observed and simulated winds. Conclusions from this study are given in the last section.

2. Materials and Methods

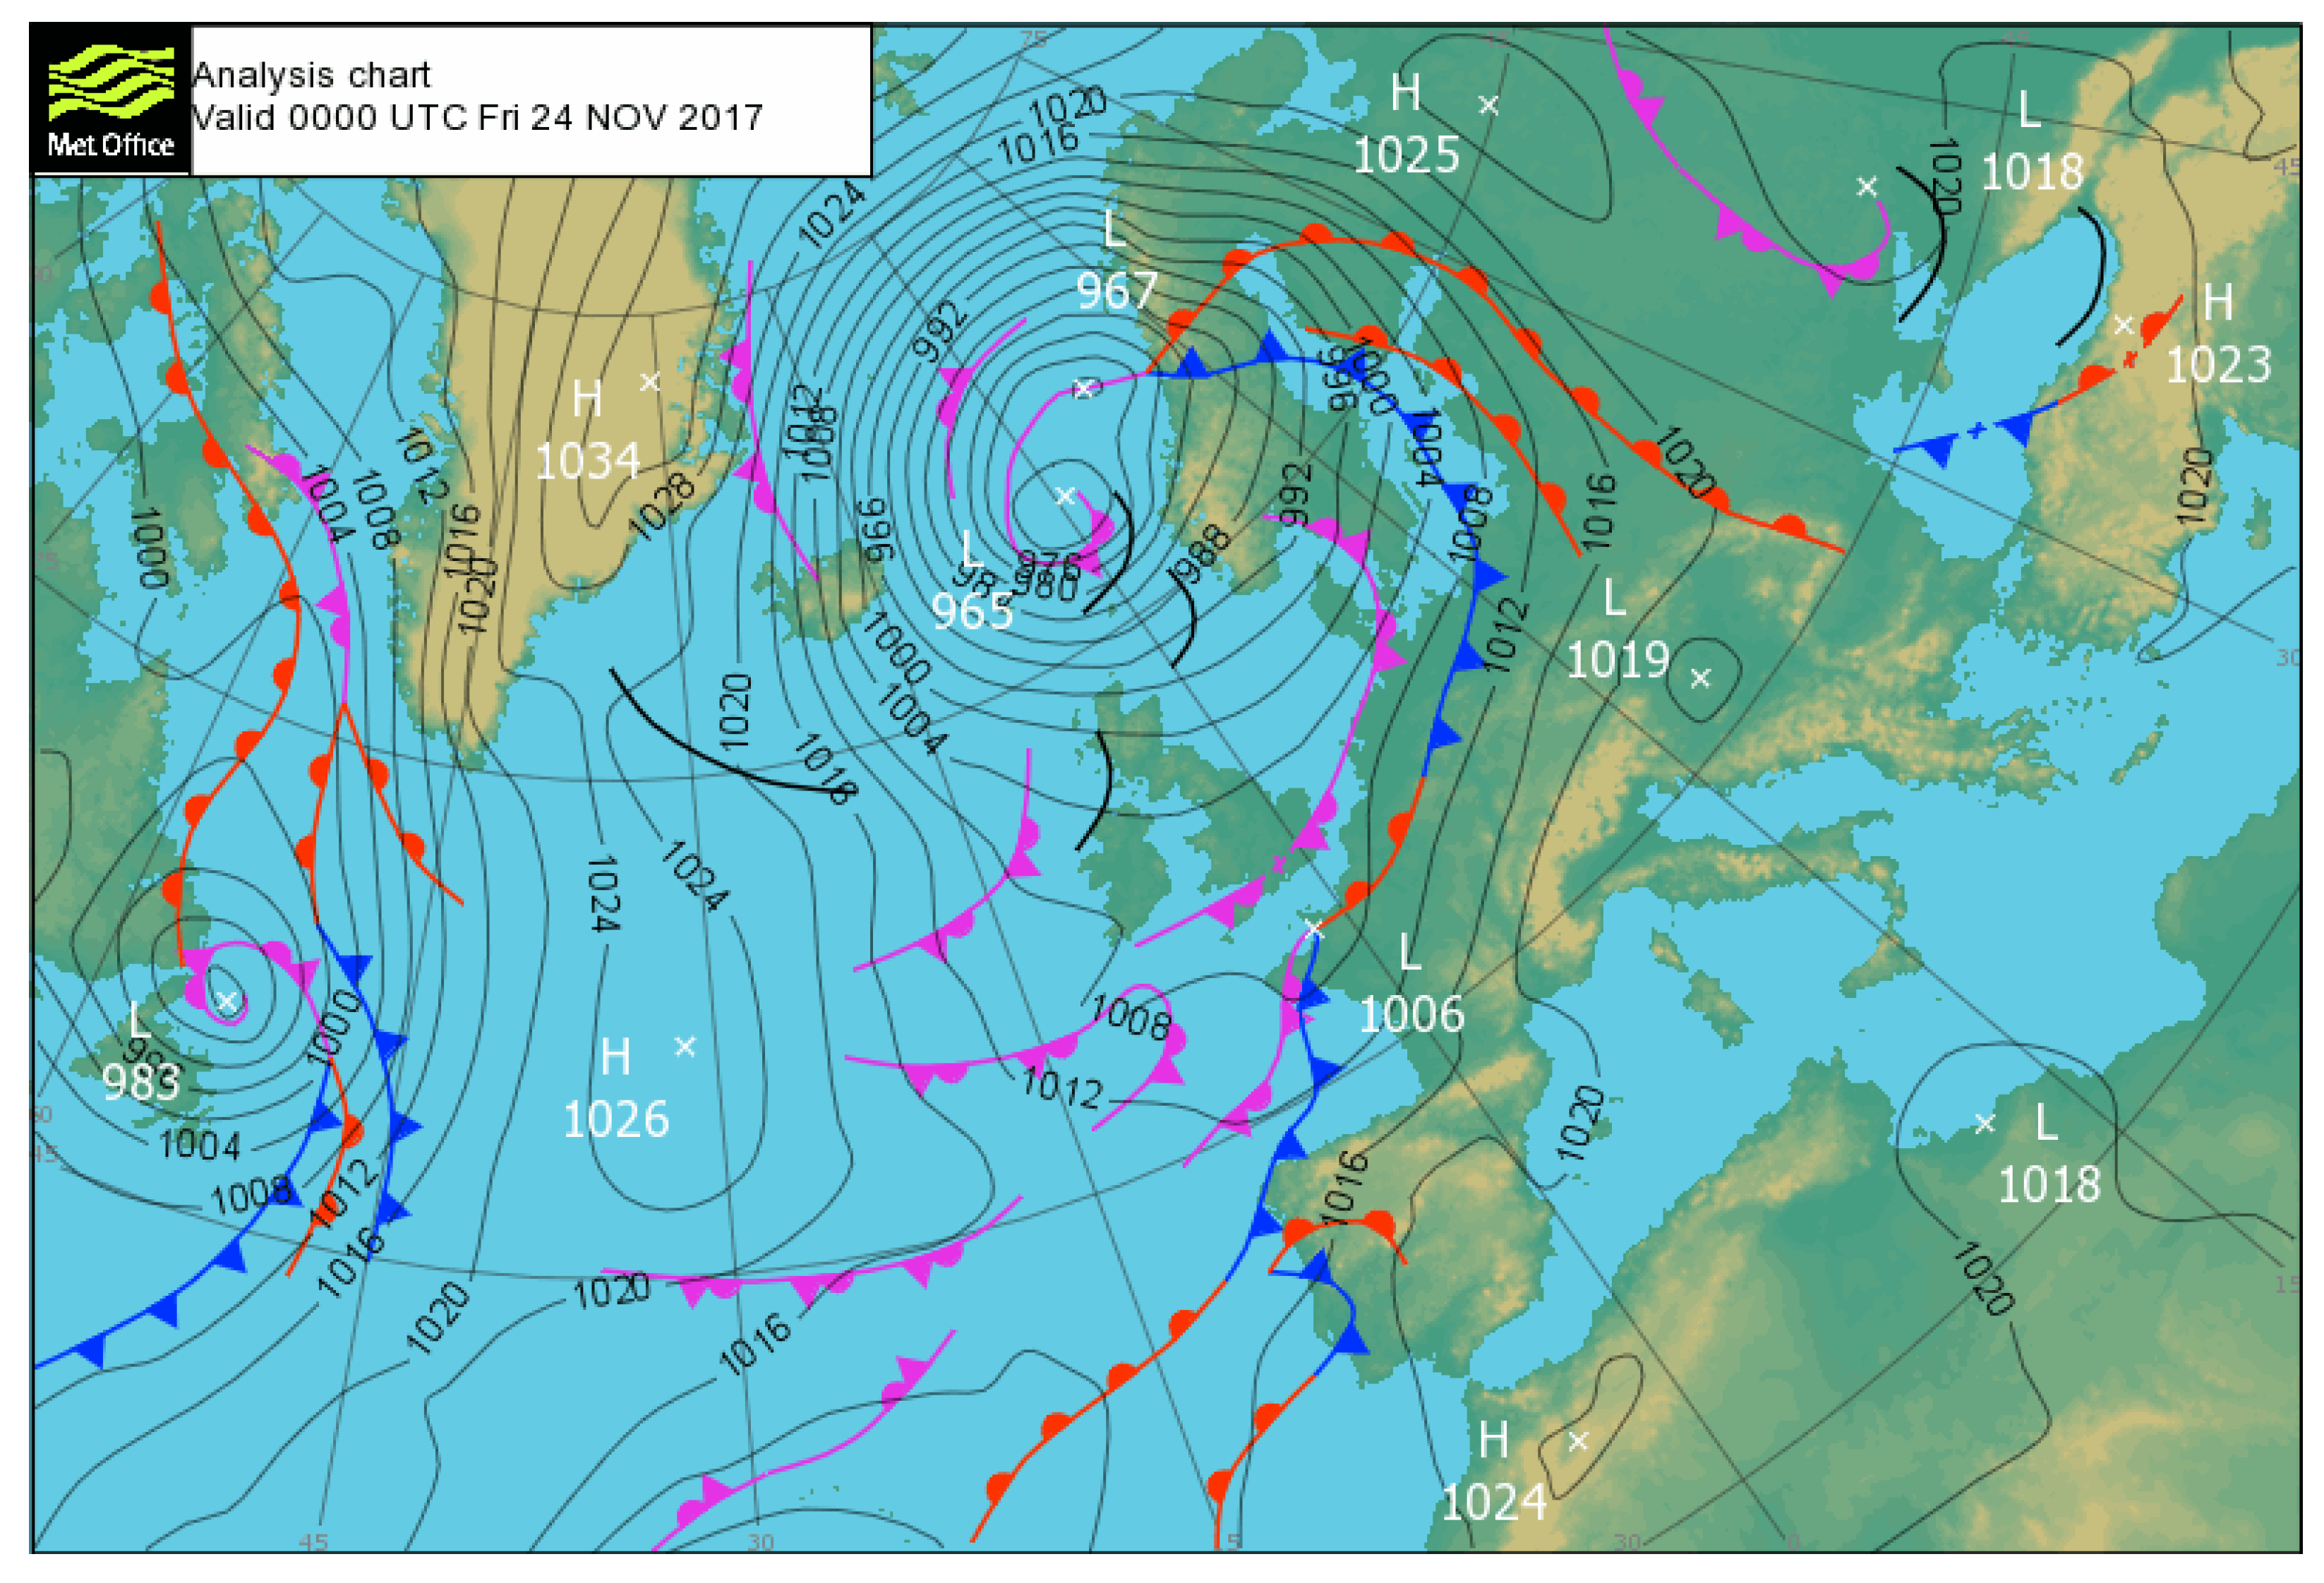
2.1. The Extreme Weather System (Storm) “Ylva”

The extreme storm “Ylva” struck Northern Norway, primarily affecting Troms and Nordland counties, in November 2017. Observations reported wind gusts reaching hurricane-force levels in some areas, with speeds exceeding 40 m/s in exposed coastal regions. The storm was accompanied by heavy snowfall, resulting in structural icing and significant snow accumulation in inland areas.
The storm “Ylva” (officially named the cyclone “Reinhard” by the Norwegian Meteorological Institute) made landfall in Nordland, Norway, on November 22, 2017. After landfall, “Ylva” moved northward along the Norwegian coast, passing through the designated area of the Kvitfjell-Raudfjell wind park in Troms between November 23 and 26, 2017. Weather forecasts from the Norwegian Meteorological Institute [29] warned of strong wind gusts ranging from 35 to 50 m/s. A synoptic analysis from UK MetOffice (Figure 1) illustrates the meteorological situation at 00:00 UTC on November 24, 2017. The low-pressure center of “Ylva” was located west of the Norwegian coast, with a secondary low-pressure center approaching central Norway. This configuration resulted in a dense concentration of isobars over Northern Norway, generating strong winds from southeast directions.
This unusual southeast wind direction led to consistent reports of unexpected wind surges originating from inland areas. As the operational weather models did not fully capture the details of the complex land orography, it was impossible to accurately characterize the storm’s impact based solely on numerical forecasts [29].
Strong southeasterly winds in the storm were blowing from mountainous coastal areas and exhibited both spatial and temporal variations on small scales. Post-storm reports revealed that areas usually less exposed to gail winds had experienced a strong impact of this storm. In Troms where the Kvitfjell-Raudfjell wind park is located, the strongest wind gusts in the lowlands reached the speed between 30 m/s and 38 m/s, whereas in the mountains, wind gusts of up to 47 m/s were registered [29]. Strong winds and heavy snow/rainfall caused damage exceeding 150 million of Norwegian krones. More than 2000 damage reclamations had been submitted to insurance companies in the aftermath of the storm [30]. This damage and reported unusual pattern of wind variations have raised concerns among infrastructure developers and assurance companies with respect to proper reassessment of the extreme wind risks and vulnerabilities [15]. They called for better understanding and assessing of storm impacts through high spatial resolution meteorological modeling.

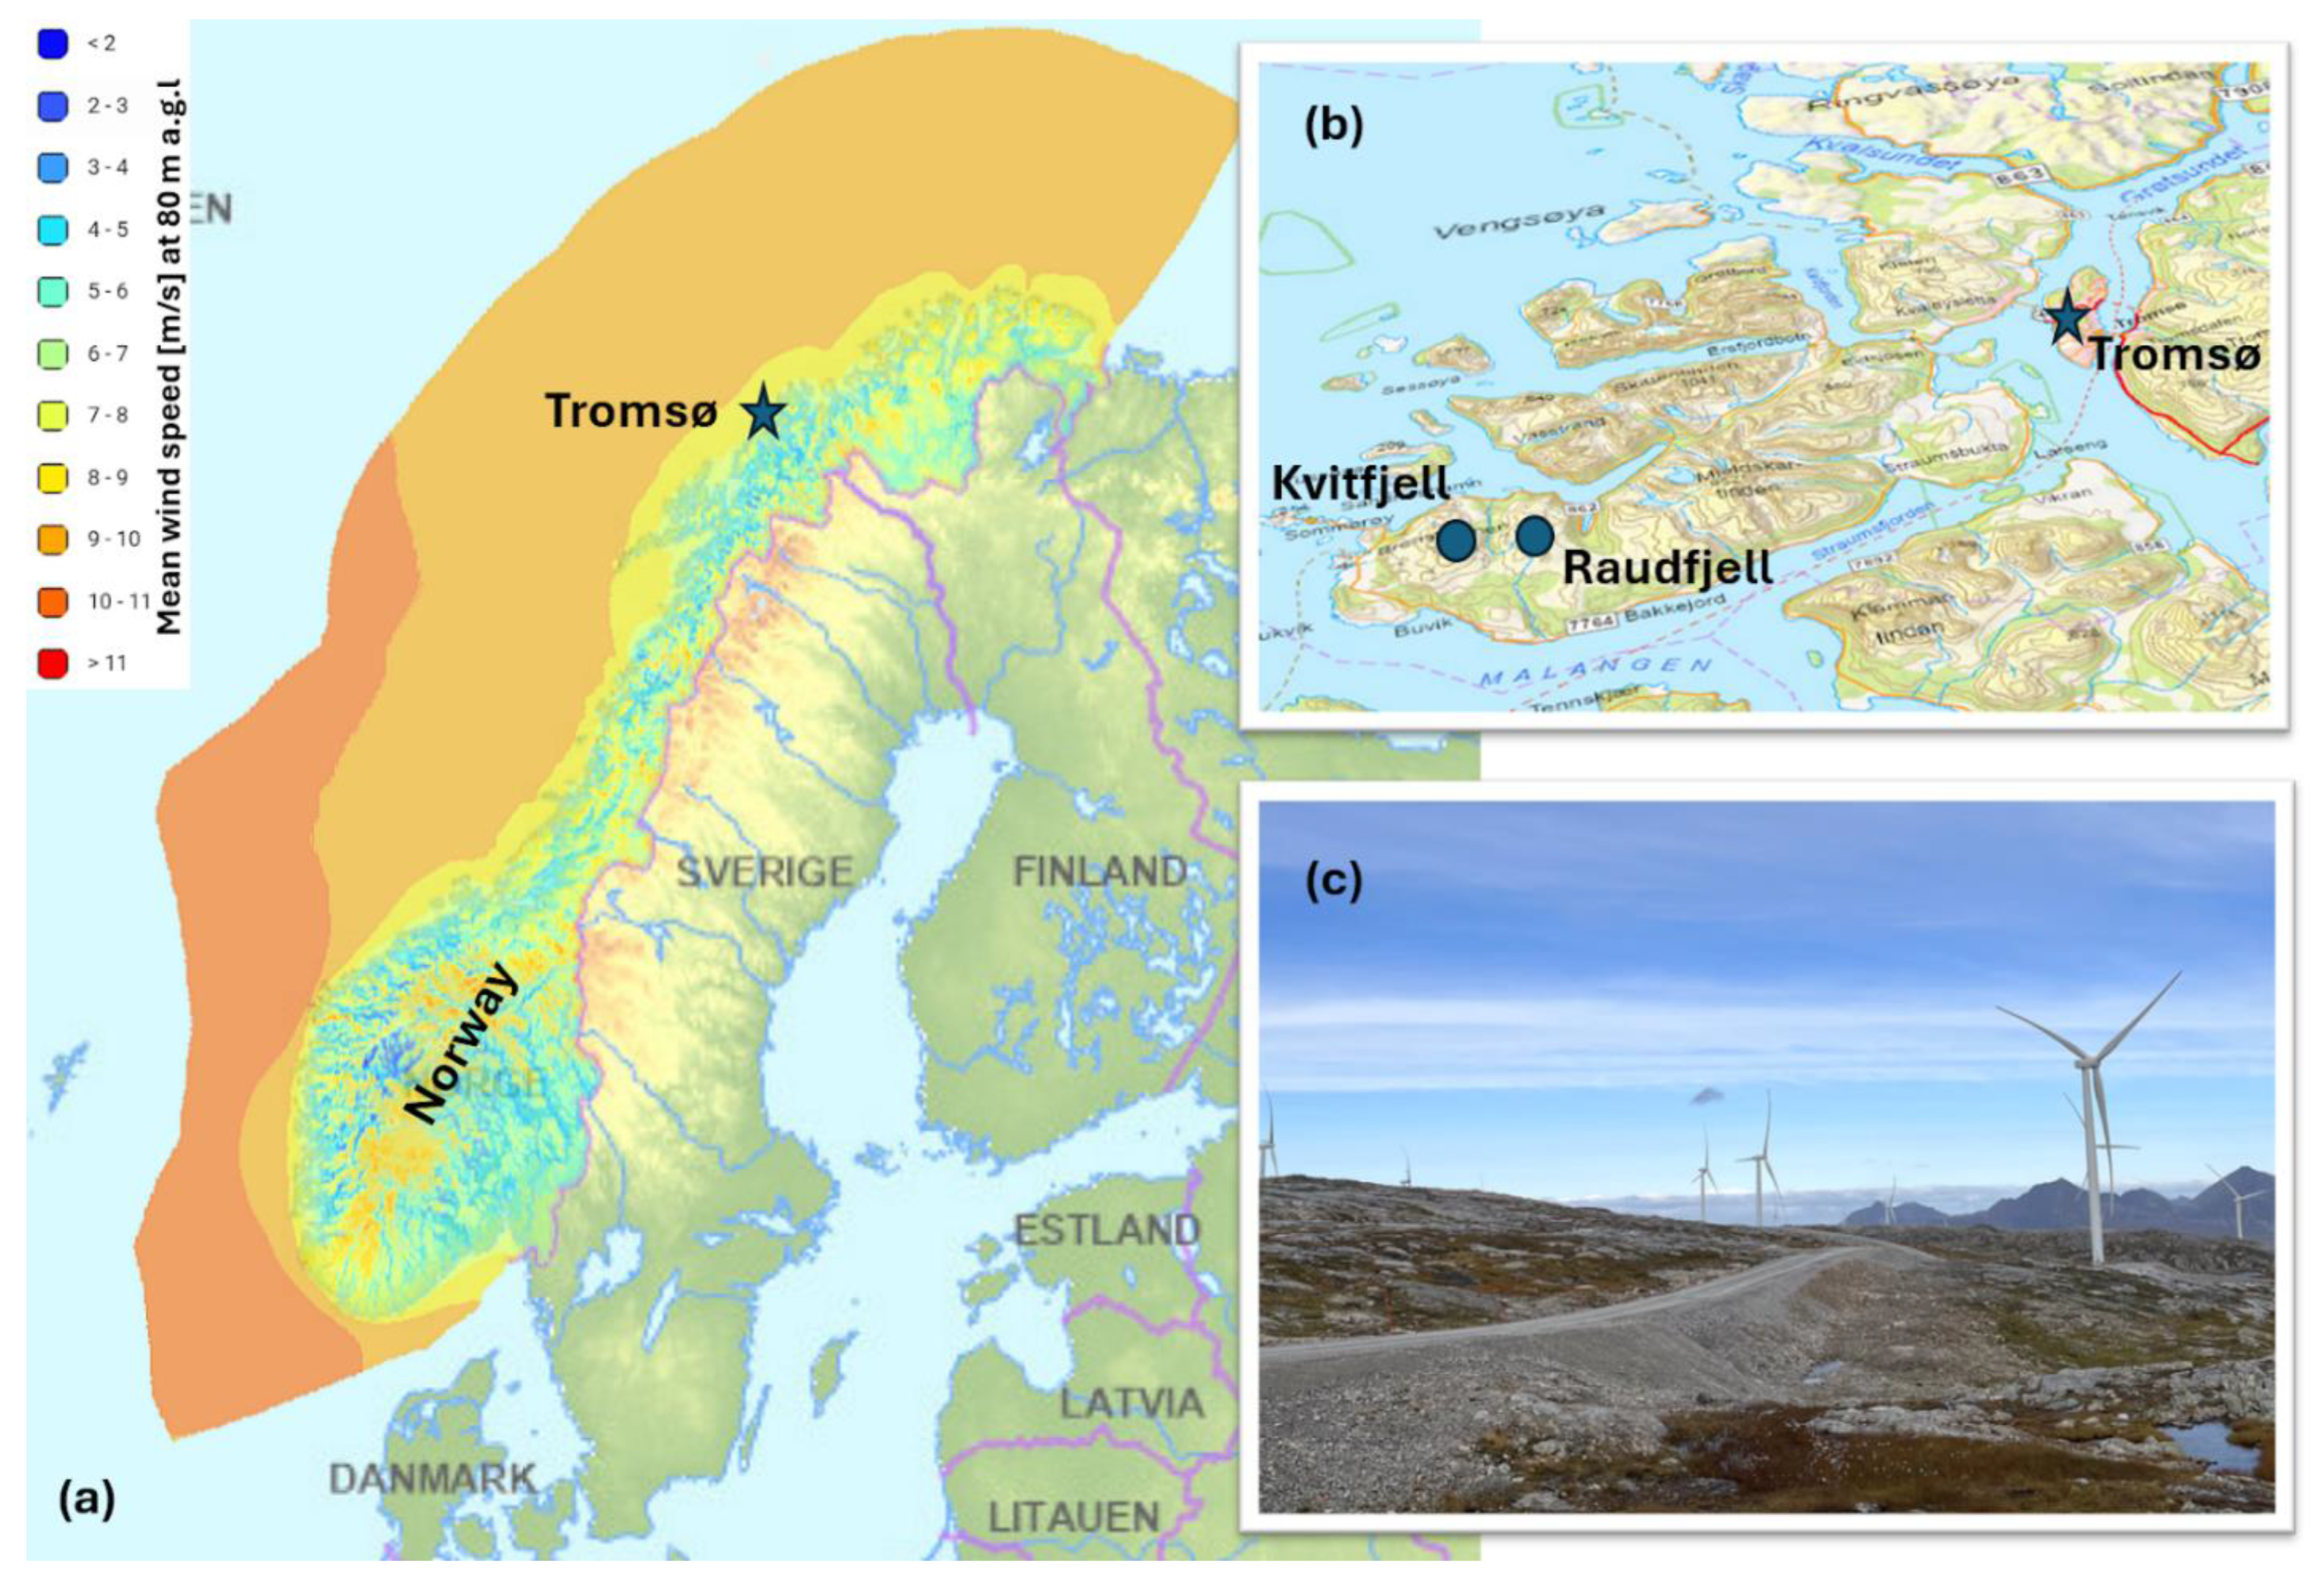
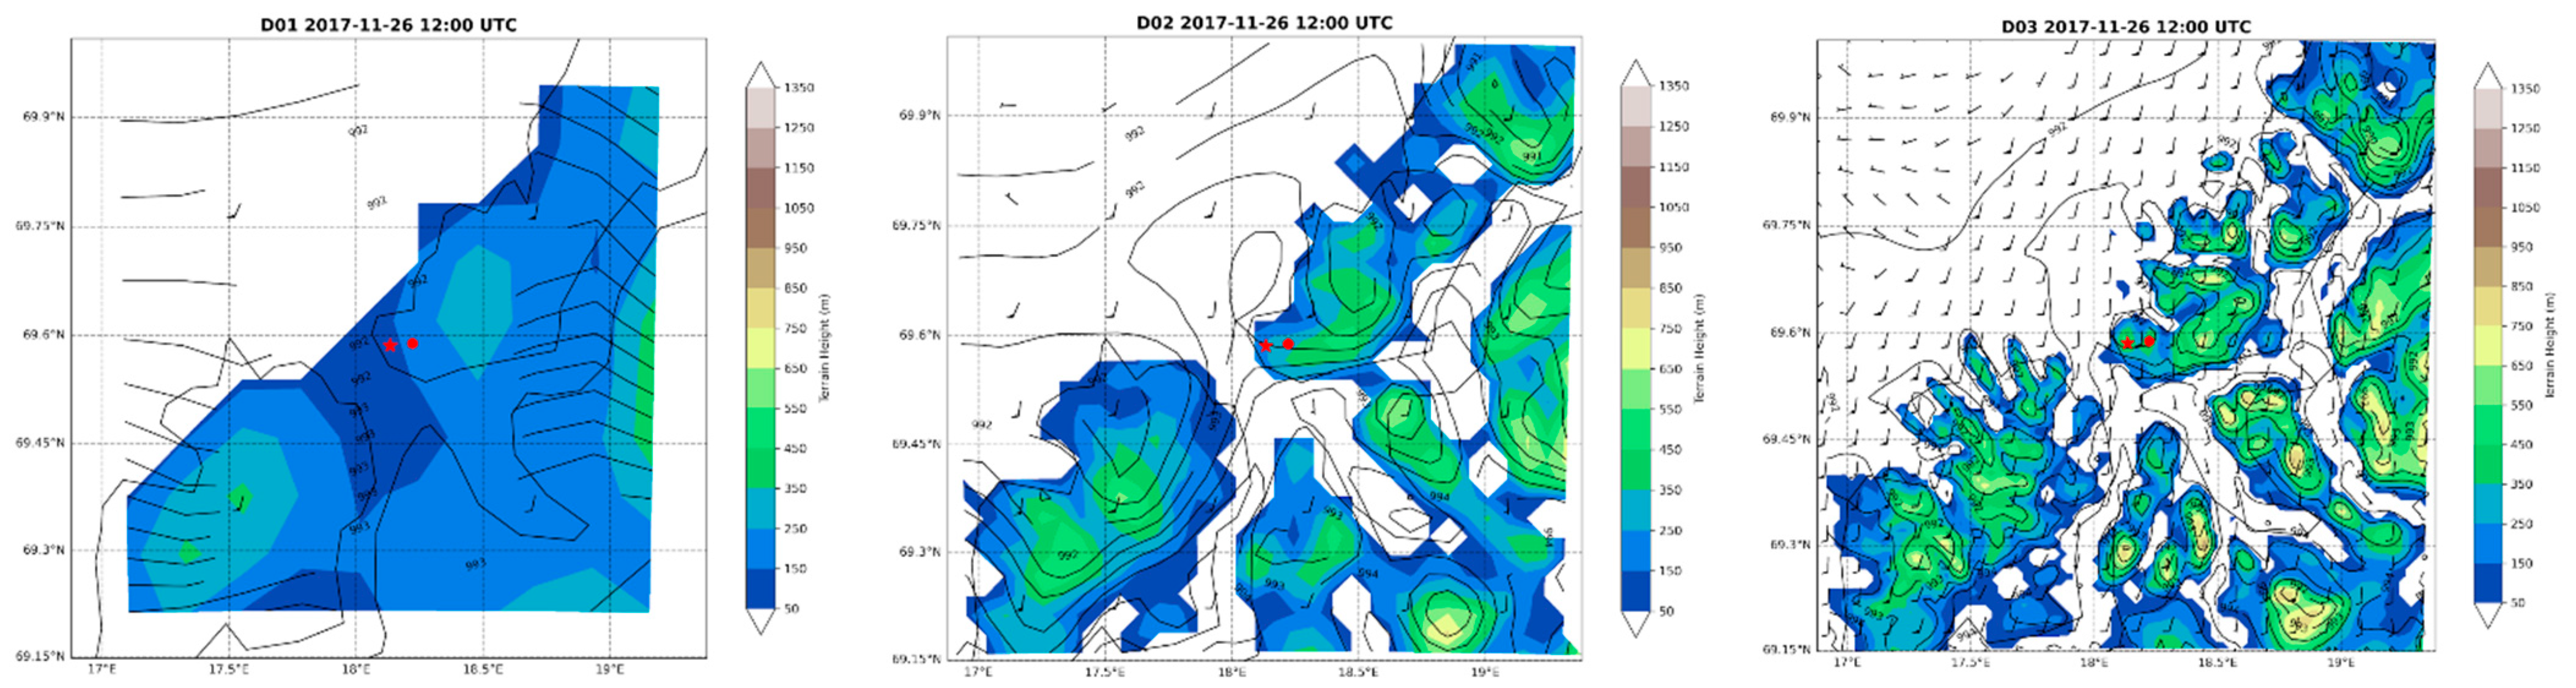
2.2. The Study Site: Kvitfjell-Raudfjell Wind Park

Kvitfjell (69.586 N, 18.135 E) and Raudfjell (69.589 N, 18.222 E) are coastal hills (in English, White and Red Mountain respectively) in northern Norway (see Figure 2). Their heights are 550 m and 505 m above sea level correspondingly. Two hills are separated by a narrow valley at 200 m above sea level. The studied wind park was commissioned to operate on the site from September 2019. The planning phase however started well before 2017. The concession was granted in 2001, and therefore, “Ylva” had a certain impact on planning the wind park. The facility operating company “Nordlys Vind” reports that “the local environmental impact of the wind farm development has been thoroughly analyzed. A number of measures are being implemented to ensure a healthy environment and minimal impact during and after construction.” [31]. As of the end of 2017, this wind park was the largest onshore renewable energy project in Europe [32]. Landscape around the wind park is complex with steep hillsides, fjords, and islands scattered in the area; the Terrain Complexity Ruggedness Index (RIX) is between 16 and 25. RIX is a measure of terrain ruggedness defined as the fractional area of a given site’s vicinity that is steeper than a specific critical slope [9]. To the southeast of Kvitfjell, the fjord of Malangen channels winds between open sea and inland areas. Further upstream to the southwest of Kvitfjell, the large island of Senja has several mountain summits of about 1000 m height, which shelter the park from typically strong westerly winds. As Kvitfjell is exposed to harsh weather conditions, the site is frequently used for studies of interactions between severe weather events and renewable energy infrastructure [12,26].
During the passage of “Ylva,” wind speeds at Kvitfjell peaked at approximately 45 m/s (as shown in the results of this study), exceeding the operational threshold for wind turbines. Had the wind park been operational at the time, this would have triggered an automatic shutdown of the turbines to prevent mechanical damage. The entire wind park would likely have remained non-operational for approximately 12 hours, resulting in a significant, though short-term, reduction in power output. A post-storm assessment, however, indicated no critical structural damage to the wind park, which was under construction at the time. This suggests that the emergency shutdown systems and structural designs functioned as intended, effectively mitigating potential damage during the extreme weather event.

2.3. Datasets

Observational data. Lack of proper observational data is often regarded as one of the main reasons that justify extensive high-resolution wind modeling. In the Kvitfjell-Raudfjell area only one meteorological station provides high quality long-term observations. The Hekkingen Fyr station is a weather station (Station ID: SN88690), located on a small islet offshore Senja in Troms (height 33 meters above the mean sea level, latitude 69.6005º N, longitude 17.83117º E). The station has provided information since November 1, 1979. It is part of the network of weather stations managed by the Norwegian Climate Services Center. Data from this station were downloaded from the site seklima.no of the Norwegian Meteorological Institute; we refer to this hourly observational data as SEKLIMA.
Medium-resolution meteorological reanalysis data. The observational dataset is complemented by datasets sampled from the retrospective meteorological analysis (reanalysis) ERA5 [33]. ERA5 is developed by the European Centre for Medium-Range Weather Forecasts (ECMWF). It is the fifth-generation global reanalysis model available through the Copernicus Climate Change Service. ERA5 has a spatial resolution of 31 km and a temporal resolution of one hour, with data accessible from 1940 onward. For our study, we fetched just hourly values for wind speed, wind direction, temperature, relative humidity, and sea-level pressure. The data could be freely downloaded from the Climate Data Store (CDS) using both a web interface and API via https://cds.climate.copernicus.eu/datasets/reanalysis-era5-pressure-levels?tab=overview (last access 21.10.2025). It is worth noting that Graham et al. (2019) [34] found that ERA5 provides the best scores for wind speed in high latitudes, with the strongest correlation and the smallest root-mean-square error (RMSE) among other reanalyses. Ramon et al. (2019) [35] have also found that ERA5 provides the best agreement with in situ tall tower wind observations among the other reanalyses. Gandoin and Garza (2024) [36] however found that ERA5 strongly underestimates offshore wind speeds in the North Sea - deficiency that is also confirmed in this study for the “Ylva” event.
High-resolution regional reanalysis data. The ERA5 data have a relatively coarse spatial resolution, which does not capture wind channeling around the wind park. A high-resolution regional reanalysis is also available. NORA3 is a regional reanalysis developed by the Norwegian Meteorological Institute [16,37]. NORA3 was specifically designed for the North Sea, Norwegian Sea, and Barents Sea regions. It covers a spatial extent ranging from 44.02° N to 84.06° N and from 30.17° W to 85.79° E. NORA3 provides a high spatial resolution of 3 km, achieved through downscaling ERA5 data using the operational numerical weather forecast HARMONIE-AROME model. Alongside wind data, NORA3 offers a comprehensive suite of meteorological parameters, including sea-level pressure, air temperature, and humidity. Recently, NORA3 has been used to optimize wind park concessions along the Norwegian coast for 30 GW power installation [22].

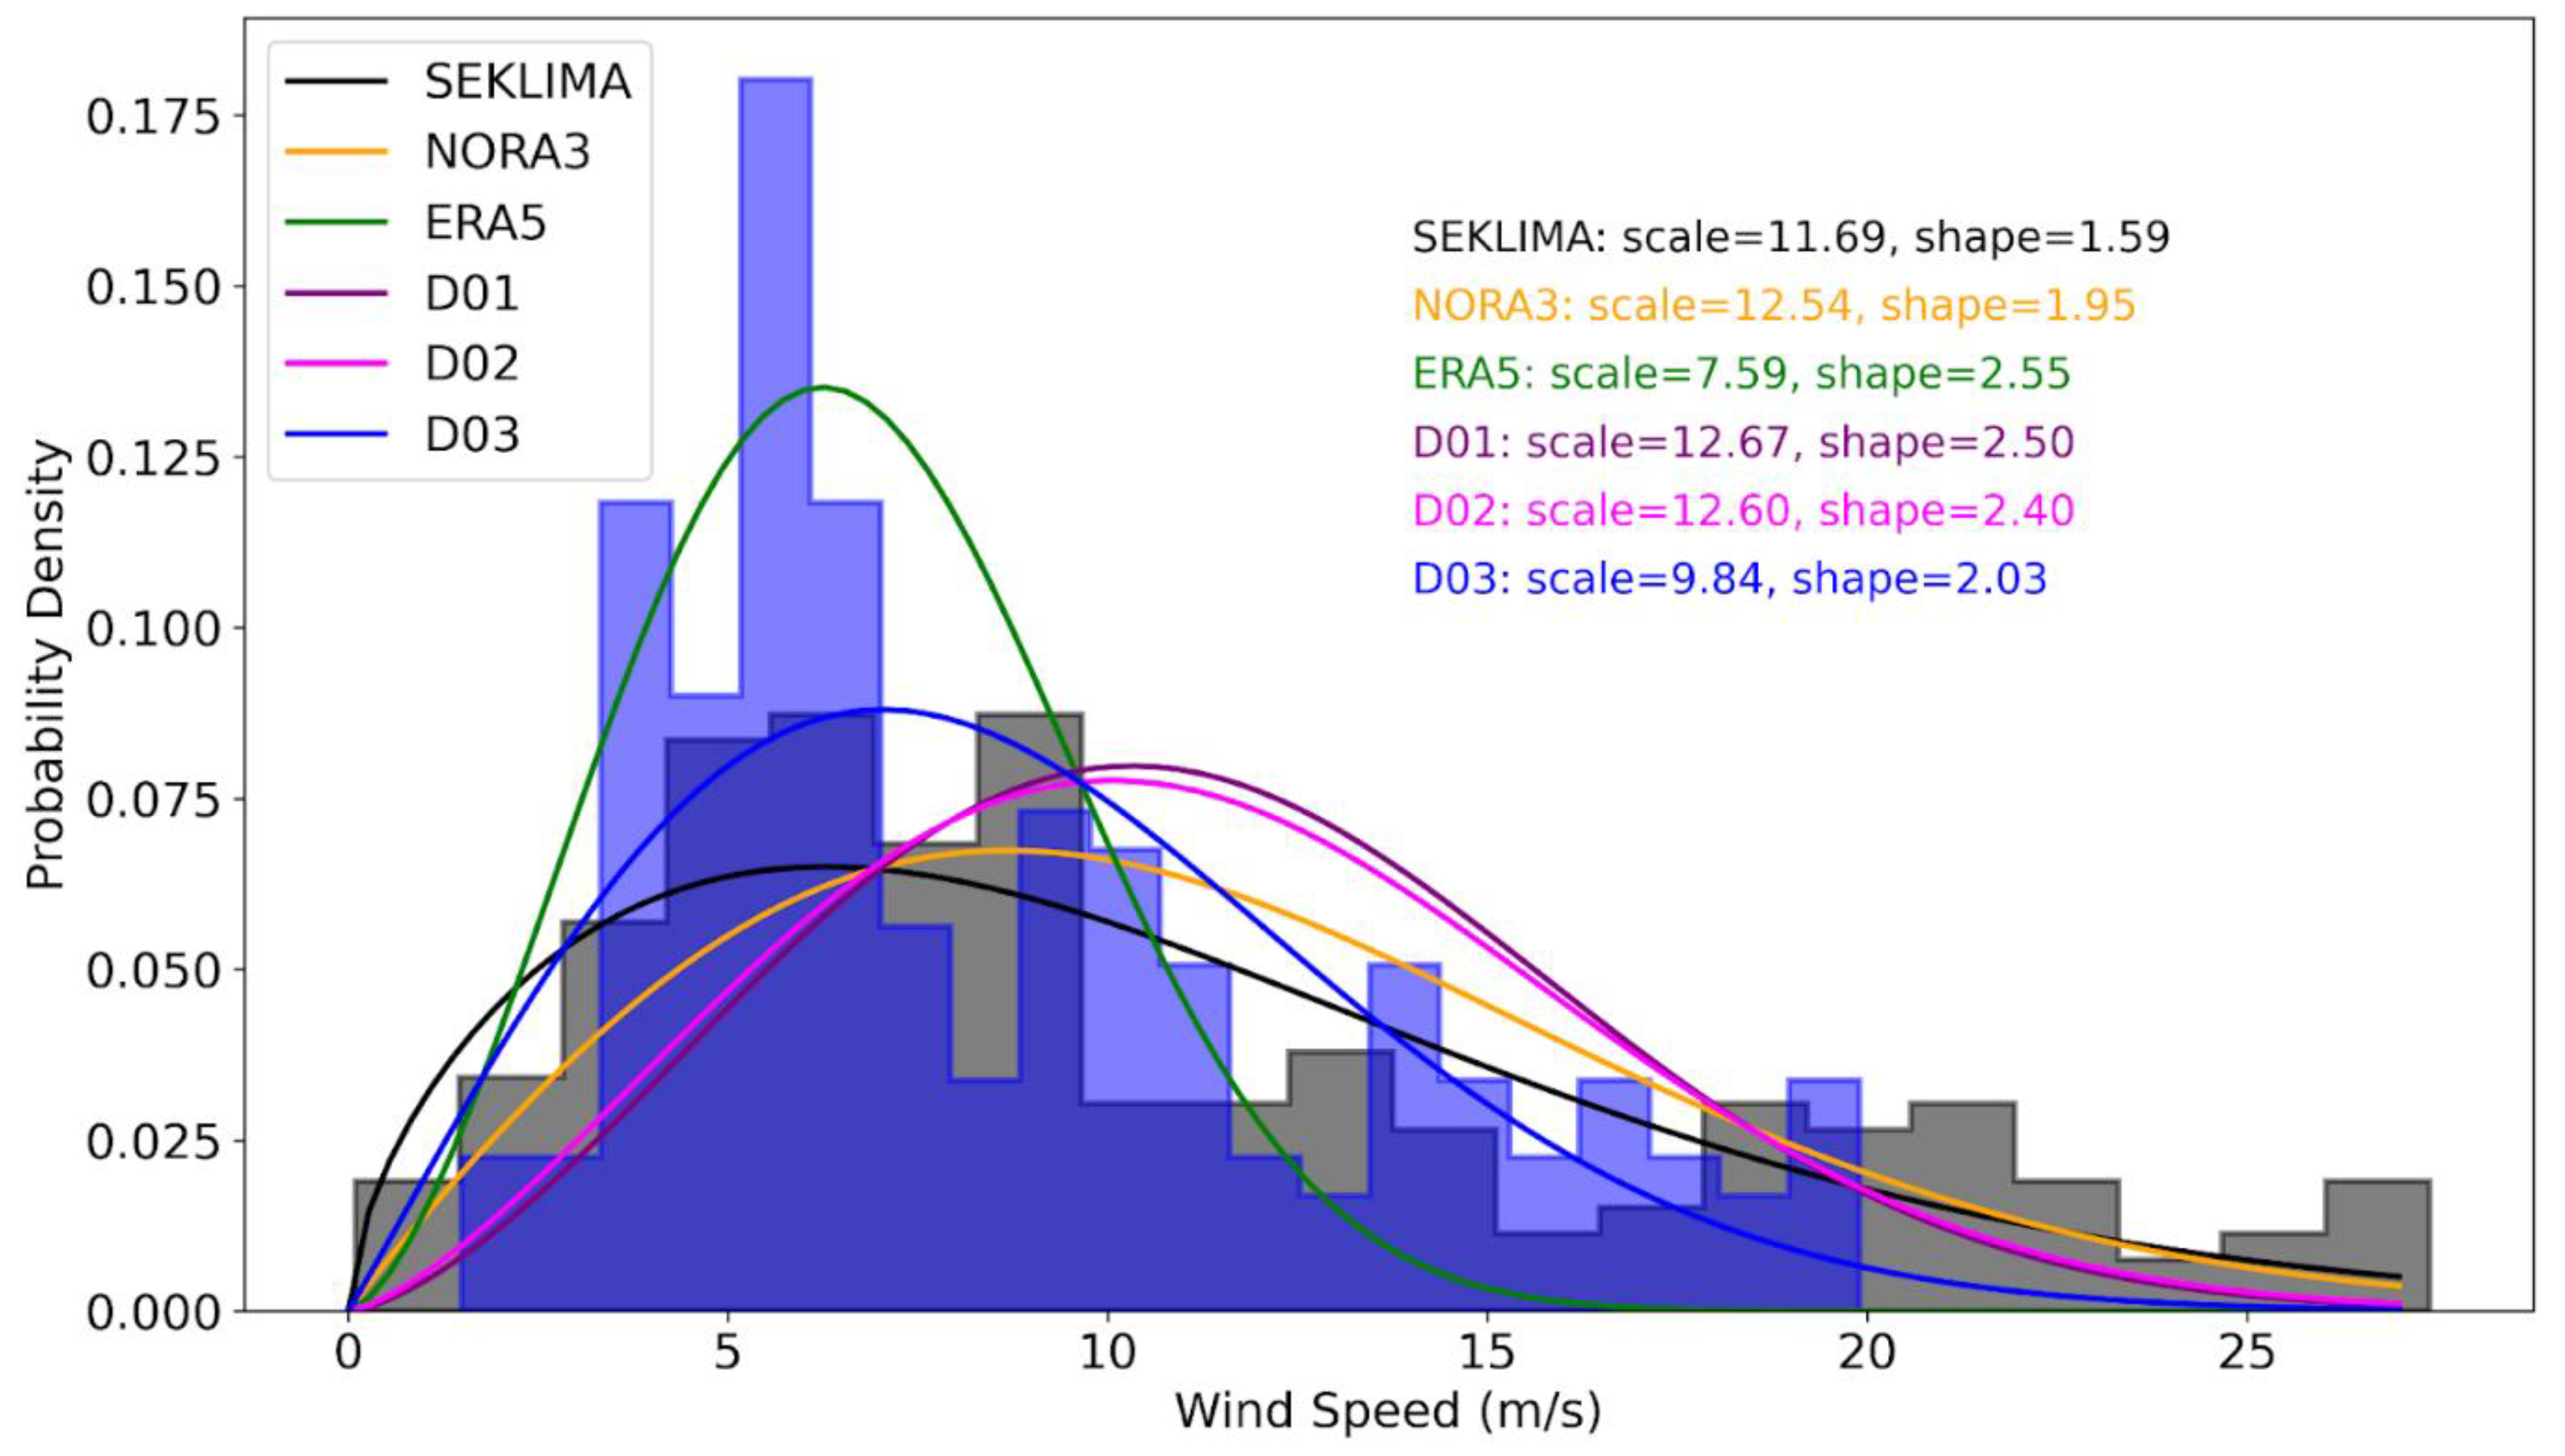
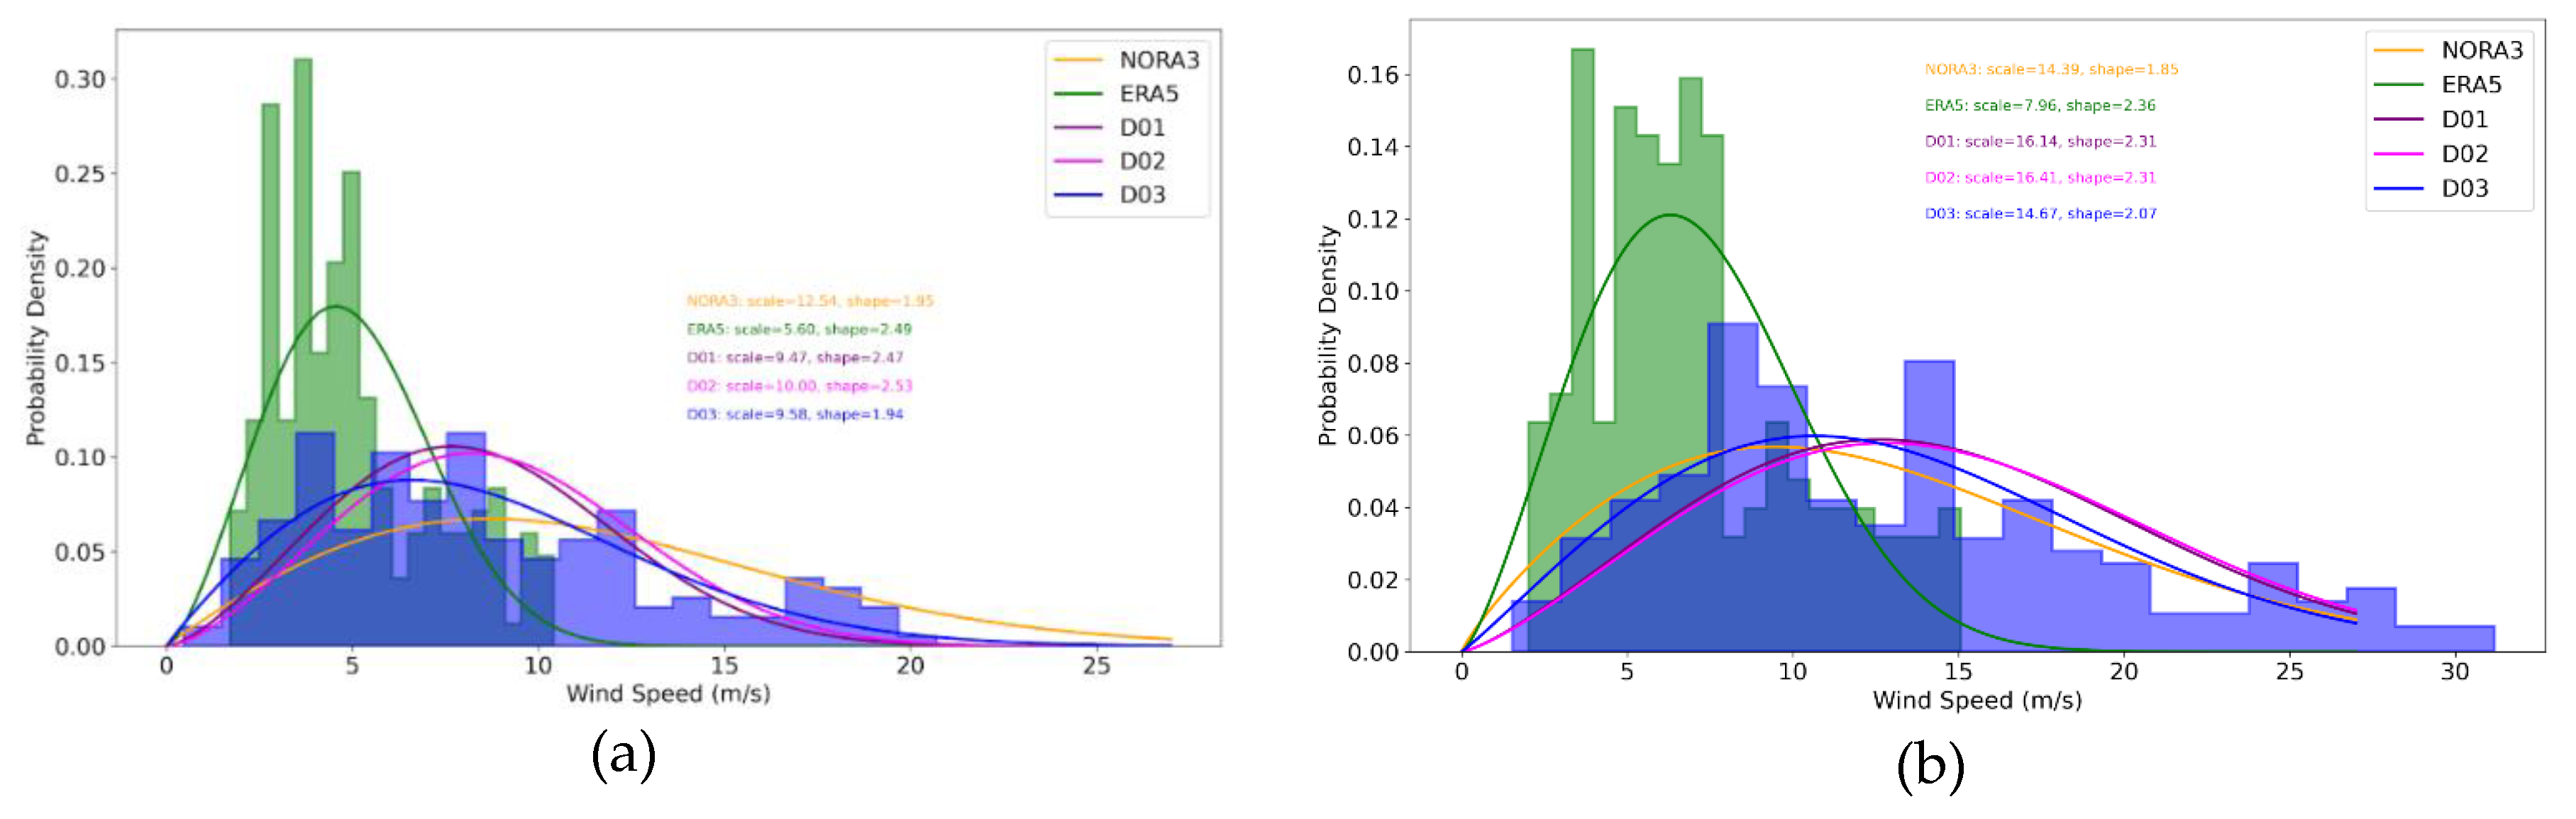
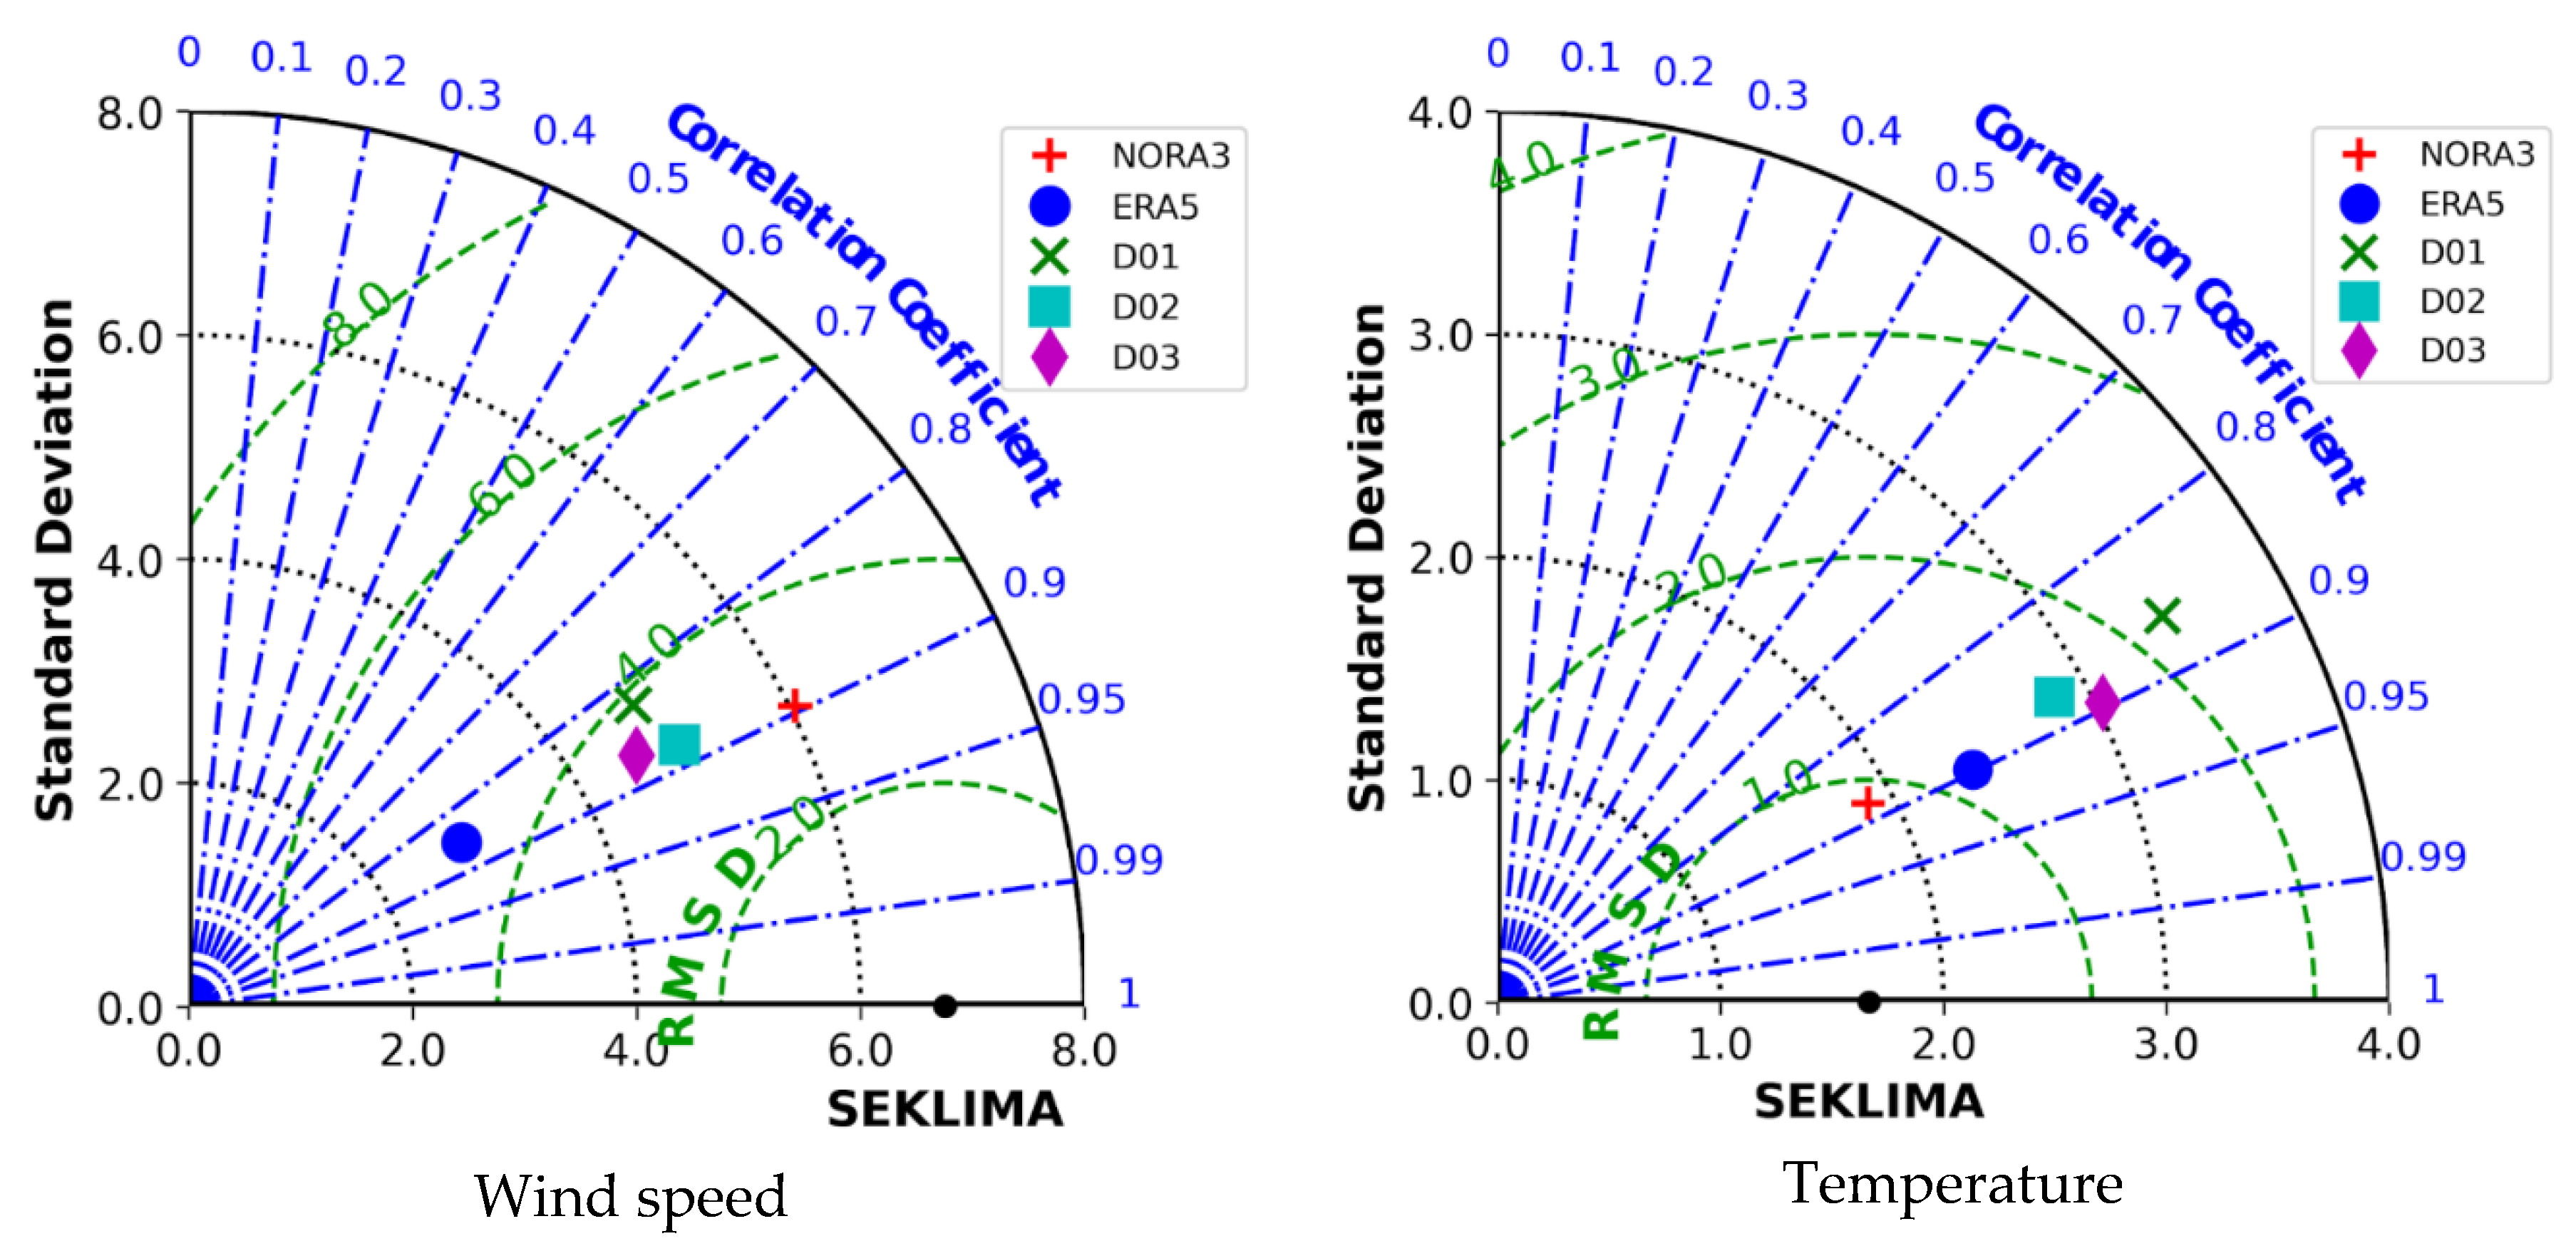
2.4. Statistical Methods for Wind Climate Evaluation

Evaluation of wind climate in this study is based on well-established statistical methods of wind energy analysis [5,21,38,39]. Climatology of wind vectors is best to be summarized in a windrose-type plot, which is a plot in polar coordinates of frequency of wind direction and wind speed occurrence. The windroses were obtained with the Python package windrose v.1.9.2 (https://pypi.org/project/windrose/).
The probability density function of wind speed is estimated through fitting the Weibull distribution shape, k , and scale, c , parameters. The scale parameter characterizes the most probably wind speed, and hence, it is related to the mean wind speed. The scale parameter characterizes the share of winds stronger than the mean wind, and hence, it is related to the extreme winds. The probability, P ( U ) , of the wind speed, U , in the Weibull distribution is defined as [19]
P U = k c U c k 1 e U c k
Although other probability distributions suitable for wind speed have been proposed, the Weibull distribution is used in the majority of publications making our results intercomparable [18,19]. The main advantage of fitting a continuous distribution is in reduction of the number of parameters, which are compared between different datasets. The Weibull distribution requires only two parameters with clear relation to the mean wind speed and the scale of the wind speed extremes. The Weibull distribution fitting was obtained with the Python package scipy using the function stats.weibull_min (https://docs.scipy.org/doc/scipy/reference/generated/scipy.stats.weibull_min.html).
The Taylor diagram is a convenient and condensed way for simultaneous benchmarking different models or datasets [40]. The diagram is useful in intercomparison of models with respect to an observational dataset. The diagram was produced using the Python package SkillMetrics developed by Peter Rochford (https://github.com/PeterRochford/SkillMetrics/tree/master)

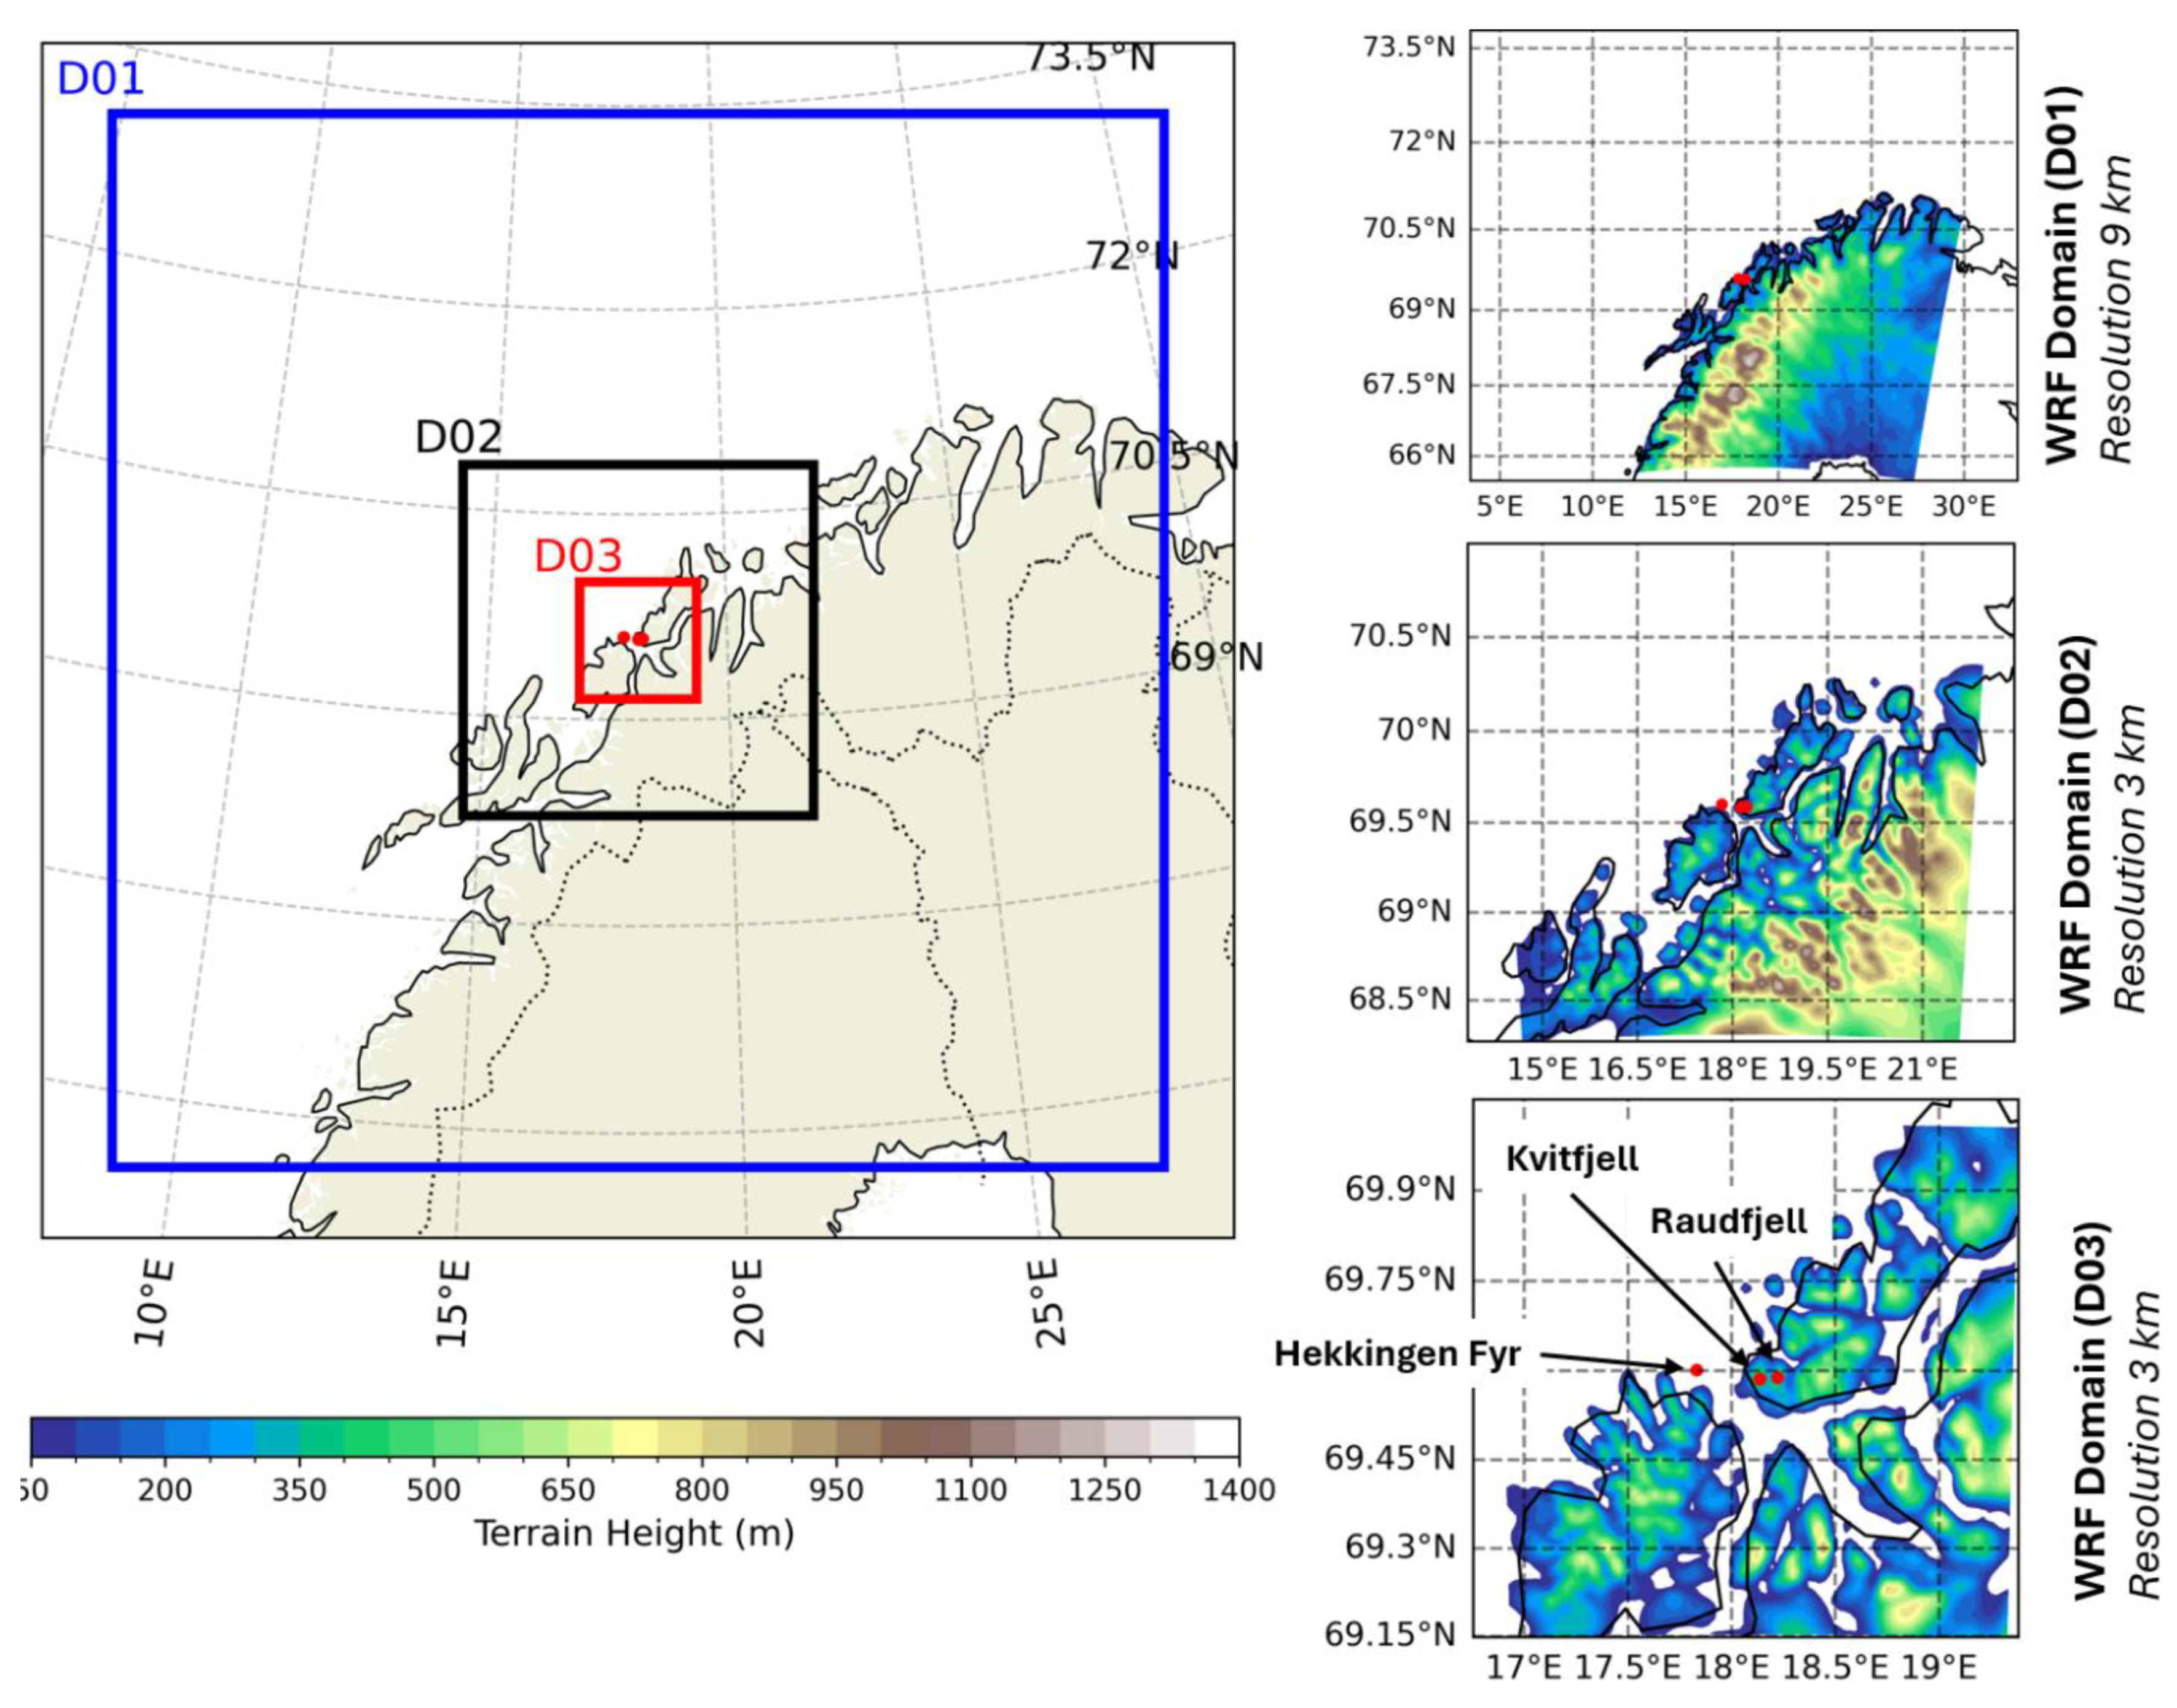
2.5. Configuration of the WRF Model

Our review of available reanalysis datasets revealed that modeling data with spatial resolution as fine as 3 km (NORA3) are already available for the “Ylva” days in the Kvitfjell-Raudfjell area. At the same time, complexity of the terrain given by RIX > 20 indicates that further resolution refinement is probably needed to properly account for wind channeling and sheltering effects. To obtain consistent model data at fine resolution, we run a downscaling modeling chain with the Advanced Weather Research and Forecasting (WRF) Model (Version 4.4). WRF is a three dimensional, nonhydrostatic mesoscale model from the National Centre for Atmospheric Research, USA [21,27,41]. The model was set for simulations of weather between November 19th 00 UTC (2017-11-19:00:00) and 27th, 2017 23 UTC (2017-11-27-23:00:00). The highest horizontal resolution achieved in this downscaling was 1 km (in the domain D03).
The model runs were configured as follows. The terrain-following coordinate system utilized the Global Multi-resolution Terrain Elevation Data 2010 (GMTED 2010) with a horizontal resolution of 30 arc-seconds (about 1 km). A nested domain configuration was implemented, consisting of an outer domain (D01) with the resolution of 9 km, the second domain (D02) with the resolution of 3 km, and the third domain (D03) with 1 km resolution. Table 1 presents the configuration of the domains. The domains are selected in the polar stereographic projection and centered at (69.58 N, 18.13 E). Figure 3 shows topography and geographical boundaries of the domains. All three domains extended from the surface up to 50 hPa with 51 vertical levels with 97 x 97 grid points in each domain. The raw output data were stored every 10 min. The raw output data were then averaged to create a dataset with hourly mean values.
Initial and lateral boundary conditions for the model runs were obtained from the ERA5 reanalysis sampled with hourly temporal resolution. Table 2 presents the WRF model configuration selected for this study. The model was run on the FRAM supercomputer facility of the Norwegian Research Infrastructure Services [42]. The model simulations used 3 nodes with 27 tasks per node; 9 days simulation was completed in 8.5 hours of wall-clock time [48].

3. Results

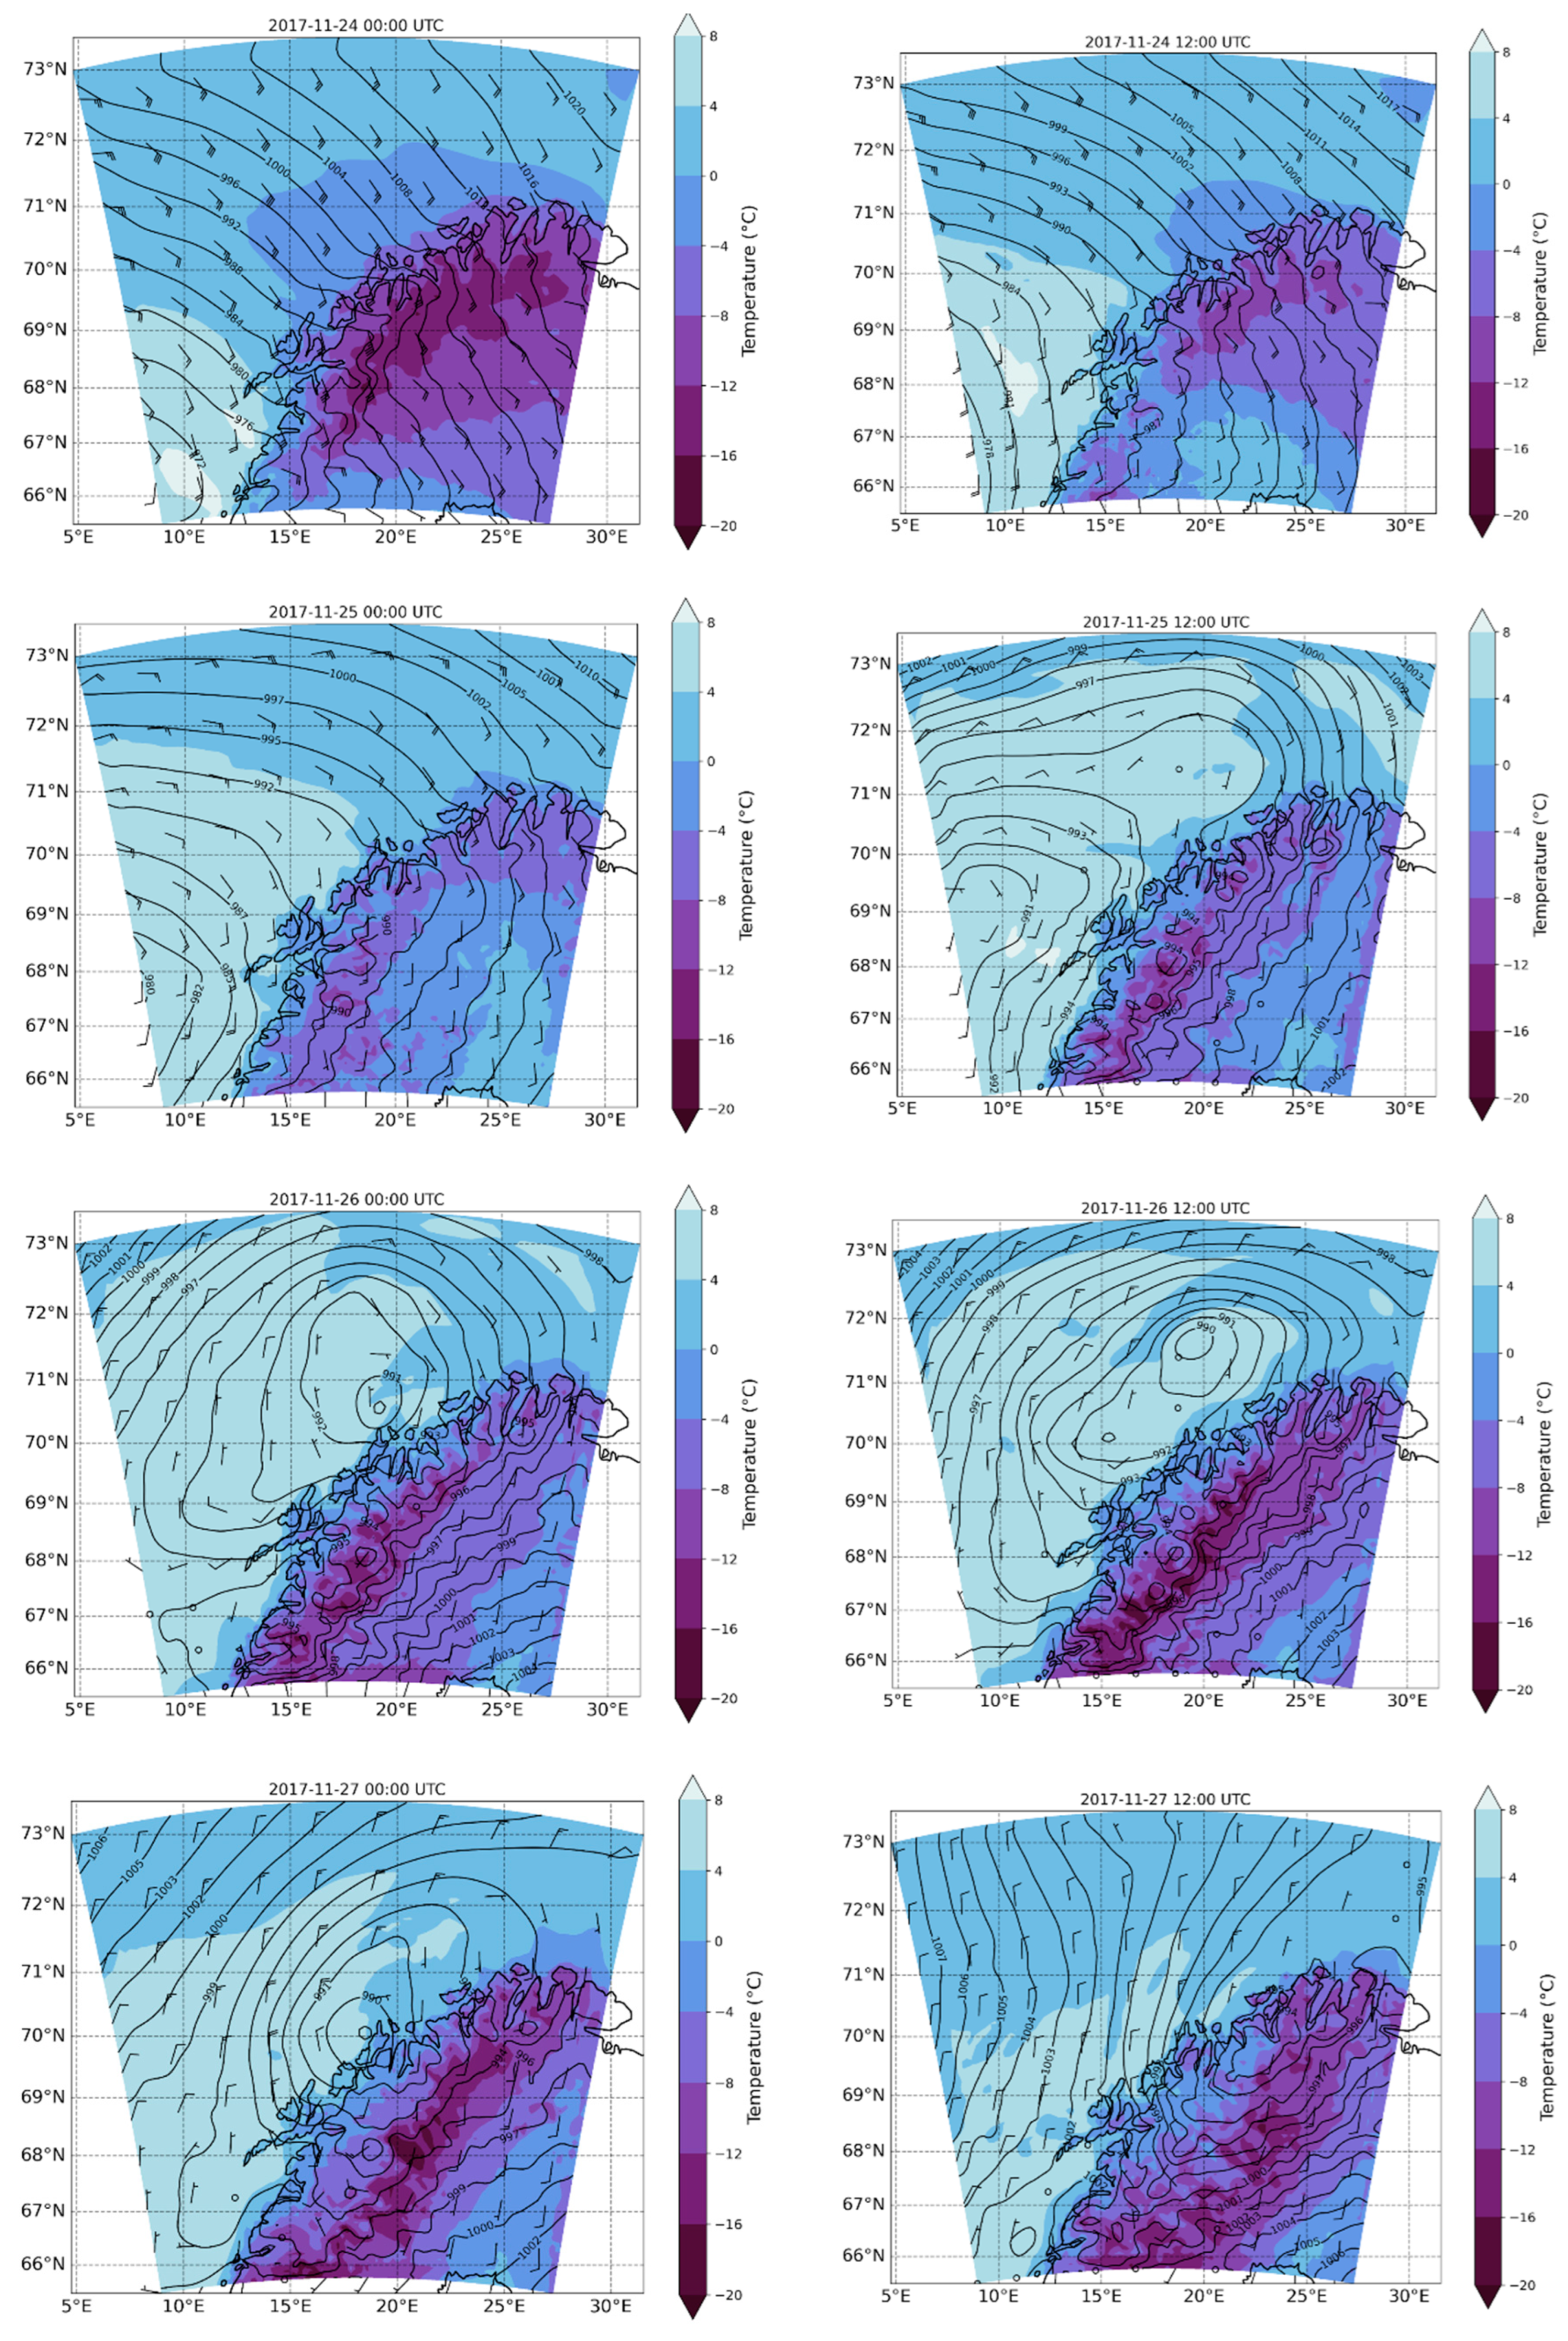
3.1. Landfall of “Ylva”: Evolution of Winds in Models

High-resolution modelling is a computational and expertise-loaded exercise. It has a value only if it reveals one or another significantly new aspect of the weather impact. In the case of a storm, the valuable new aspect is related to a geographical configuration of the areas affected by or sheltered from extreme winds or wind gusts. Orography of terrain is captured in models with different levels of detail. The captured scales are limited by the models’ horizontal resolution. In the WRF simulations, the domain D01 captures significantly less steep and less rouged terrain than D02, and even more so D03 (see Figure 3). Figure 4 shows the evolution of the storm while it was passing through the D01 domain. Two important dynamical effects could be observed. One, as expected, shows that wind blows counterclockwise but at the wind park site it rotates clockwise with time. So that at the time of the strongest winds, it blows from the southeast, and then changes its direction to south, southwest, west and finally to northwest. Another dynamical effect reveals that the coastal mountains visibly alter both isobars and wind vectors over the studied place. A closer examination reveals a number of smaller pressure centers as well as variability in the wind velocity (recirculation) within a 100 km strip along the coast.
Zooming into the downscaled simulations from D01 to D03 reveals increasing spatial variations in wind velocity vectors, which can be directly attributed to surface orography. Figure 5 illustrates how wind speed and direction change within the D03 domain for the D01, D02, and D03 WRF model runs. The D01 domain has a resolution that is too coarse to accurately capture realistic wind channeling. However, the low relief in this domain confines the incorrect wind disturbances to the lower atmospheric layers, ensuring that winds in the nested domains remain largely unaffected at turbine hub height. The D02 domain has sufficient resolution to capture the spatial scales of sea fjords and mountain ridges in the area. At this level, the model successfully simulates wind channeling but still propagates inaccuracies in wind patterns over smaller hills to the next nested domain, D03. Consequently, in the D03 domain, wind patterns at hub height are affected by these errors, particularly at the finest spatial scale. The cascading wind errors caused by progressively higher disturbances in WRF downscaling over complex orography have also been reported in [24,27]. Luzia et al. [24] identified this cascade of errors as a potential explanation for the deterioration of modeling results in fine-resolution nested domains.

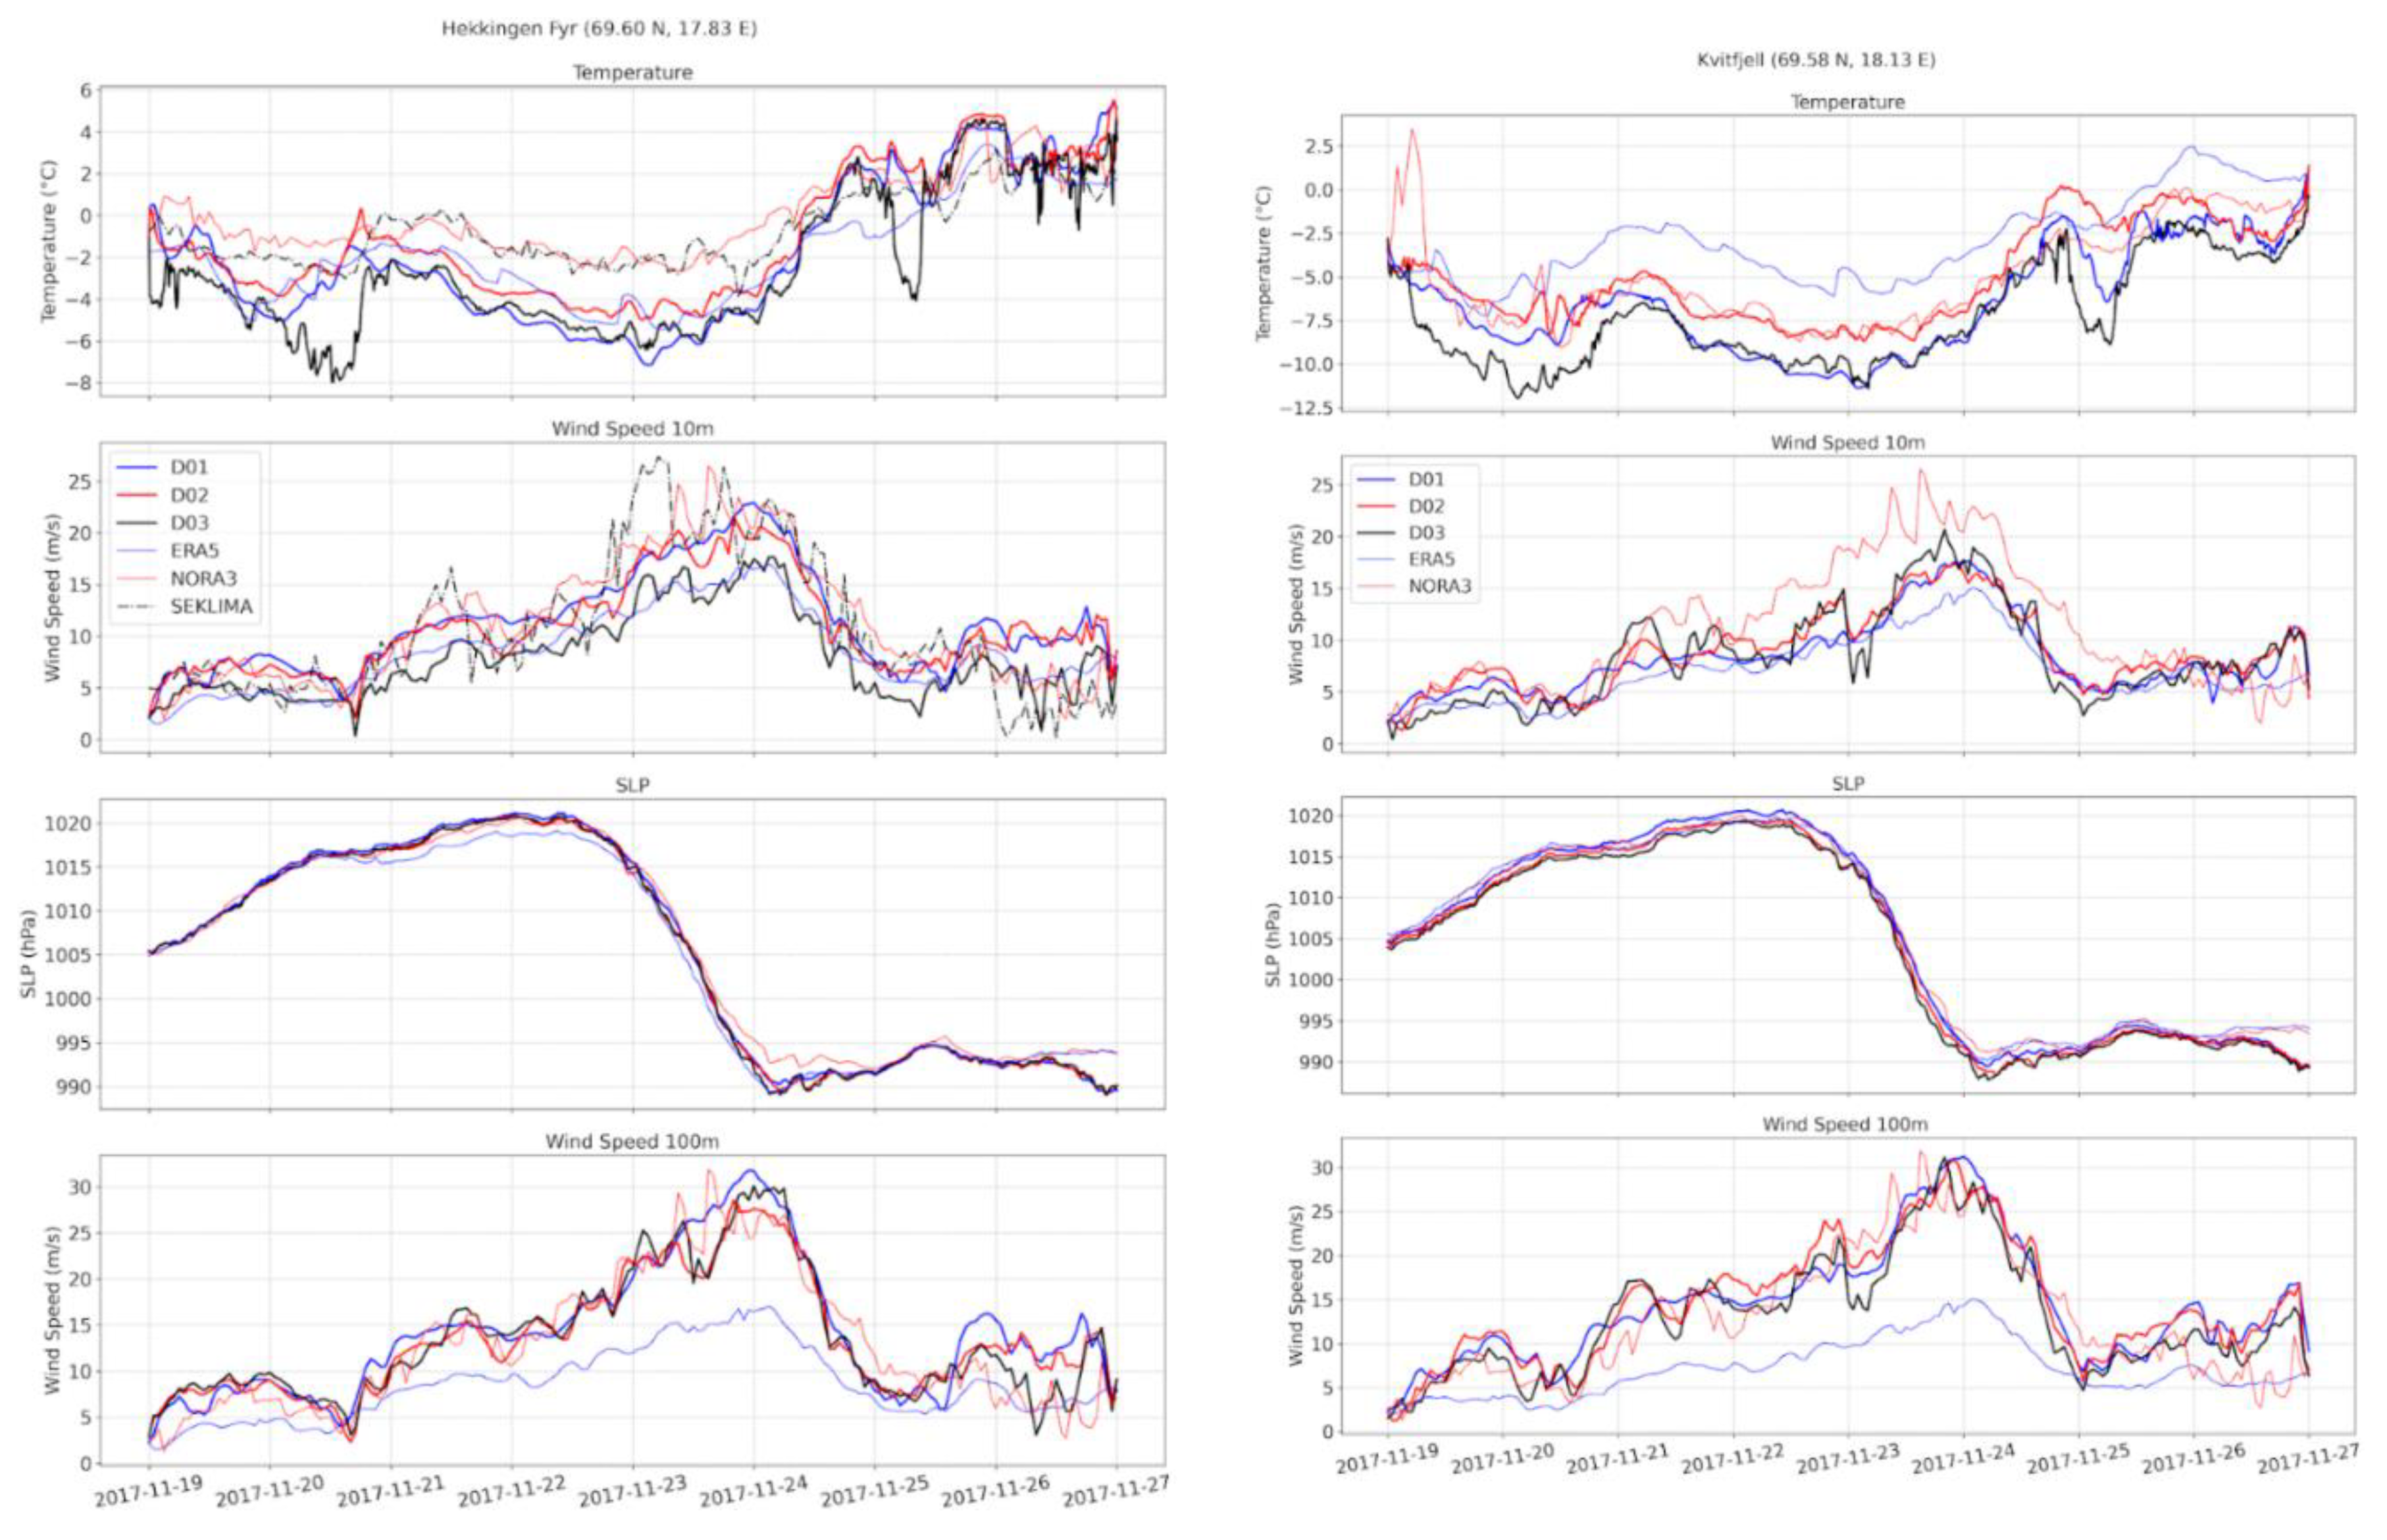
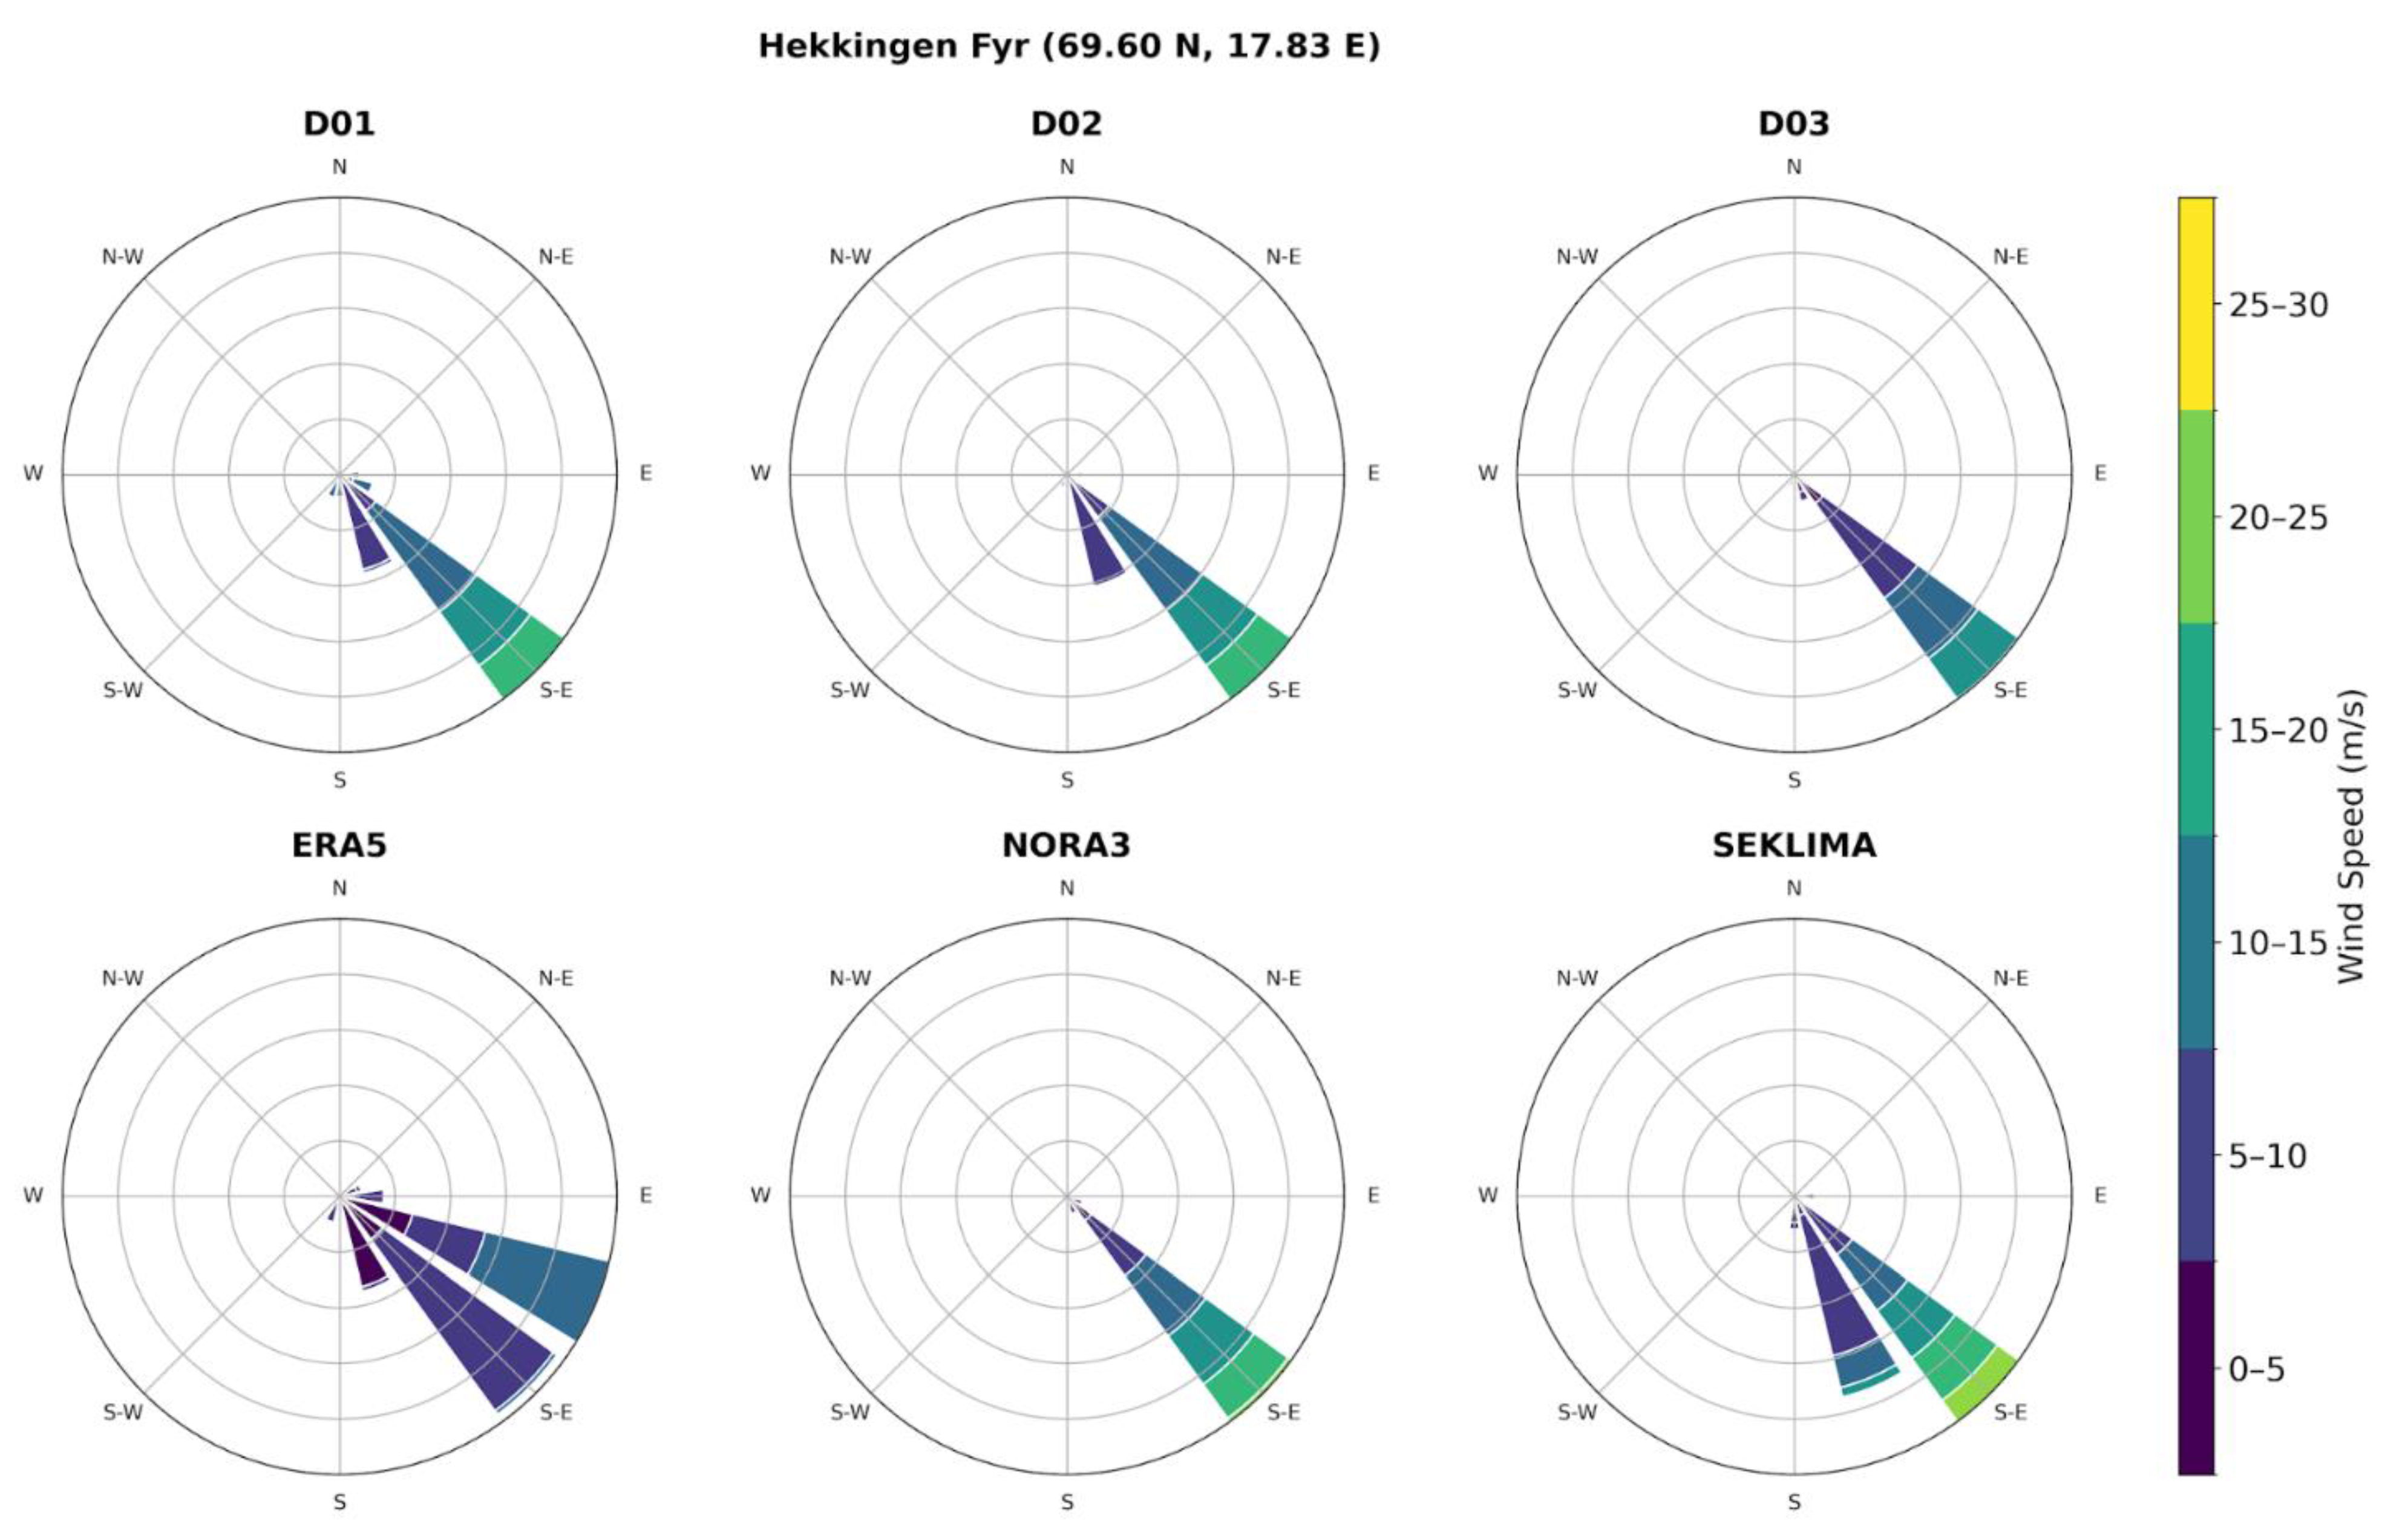
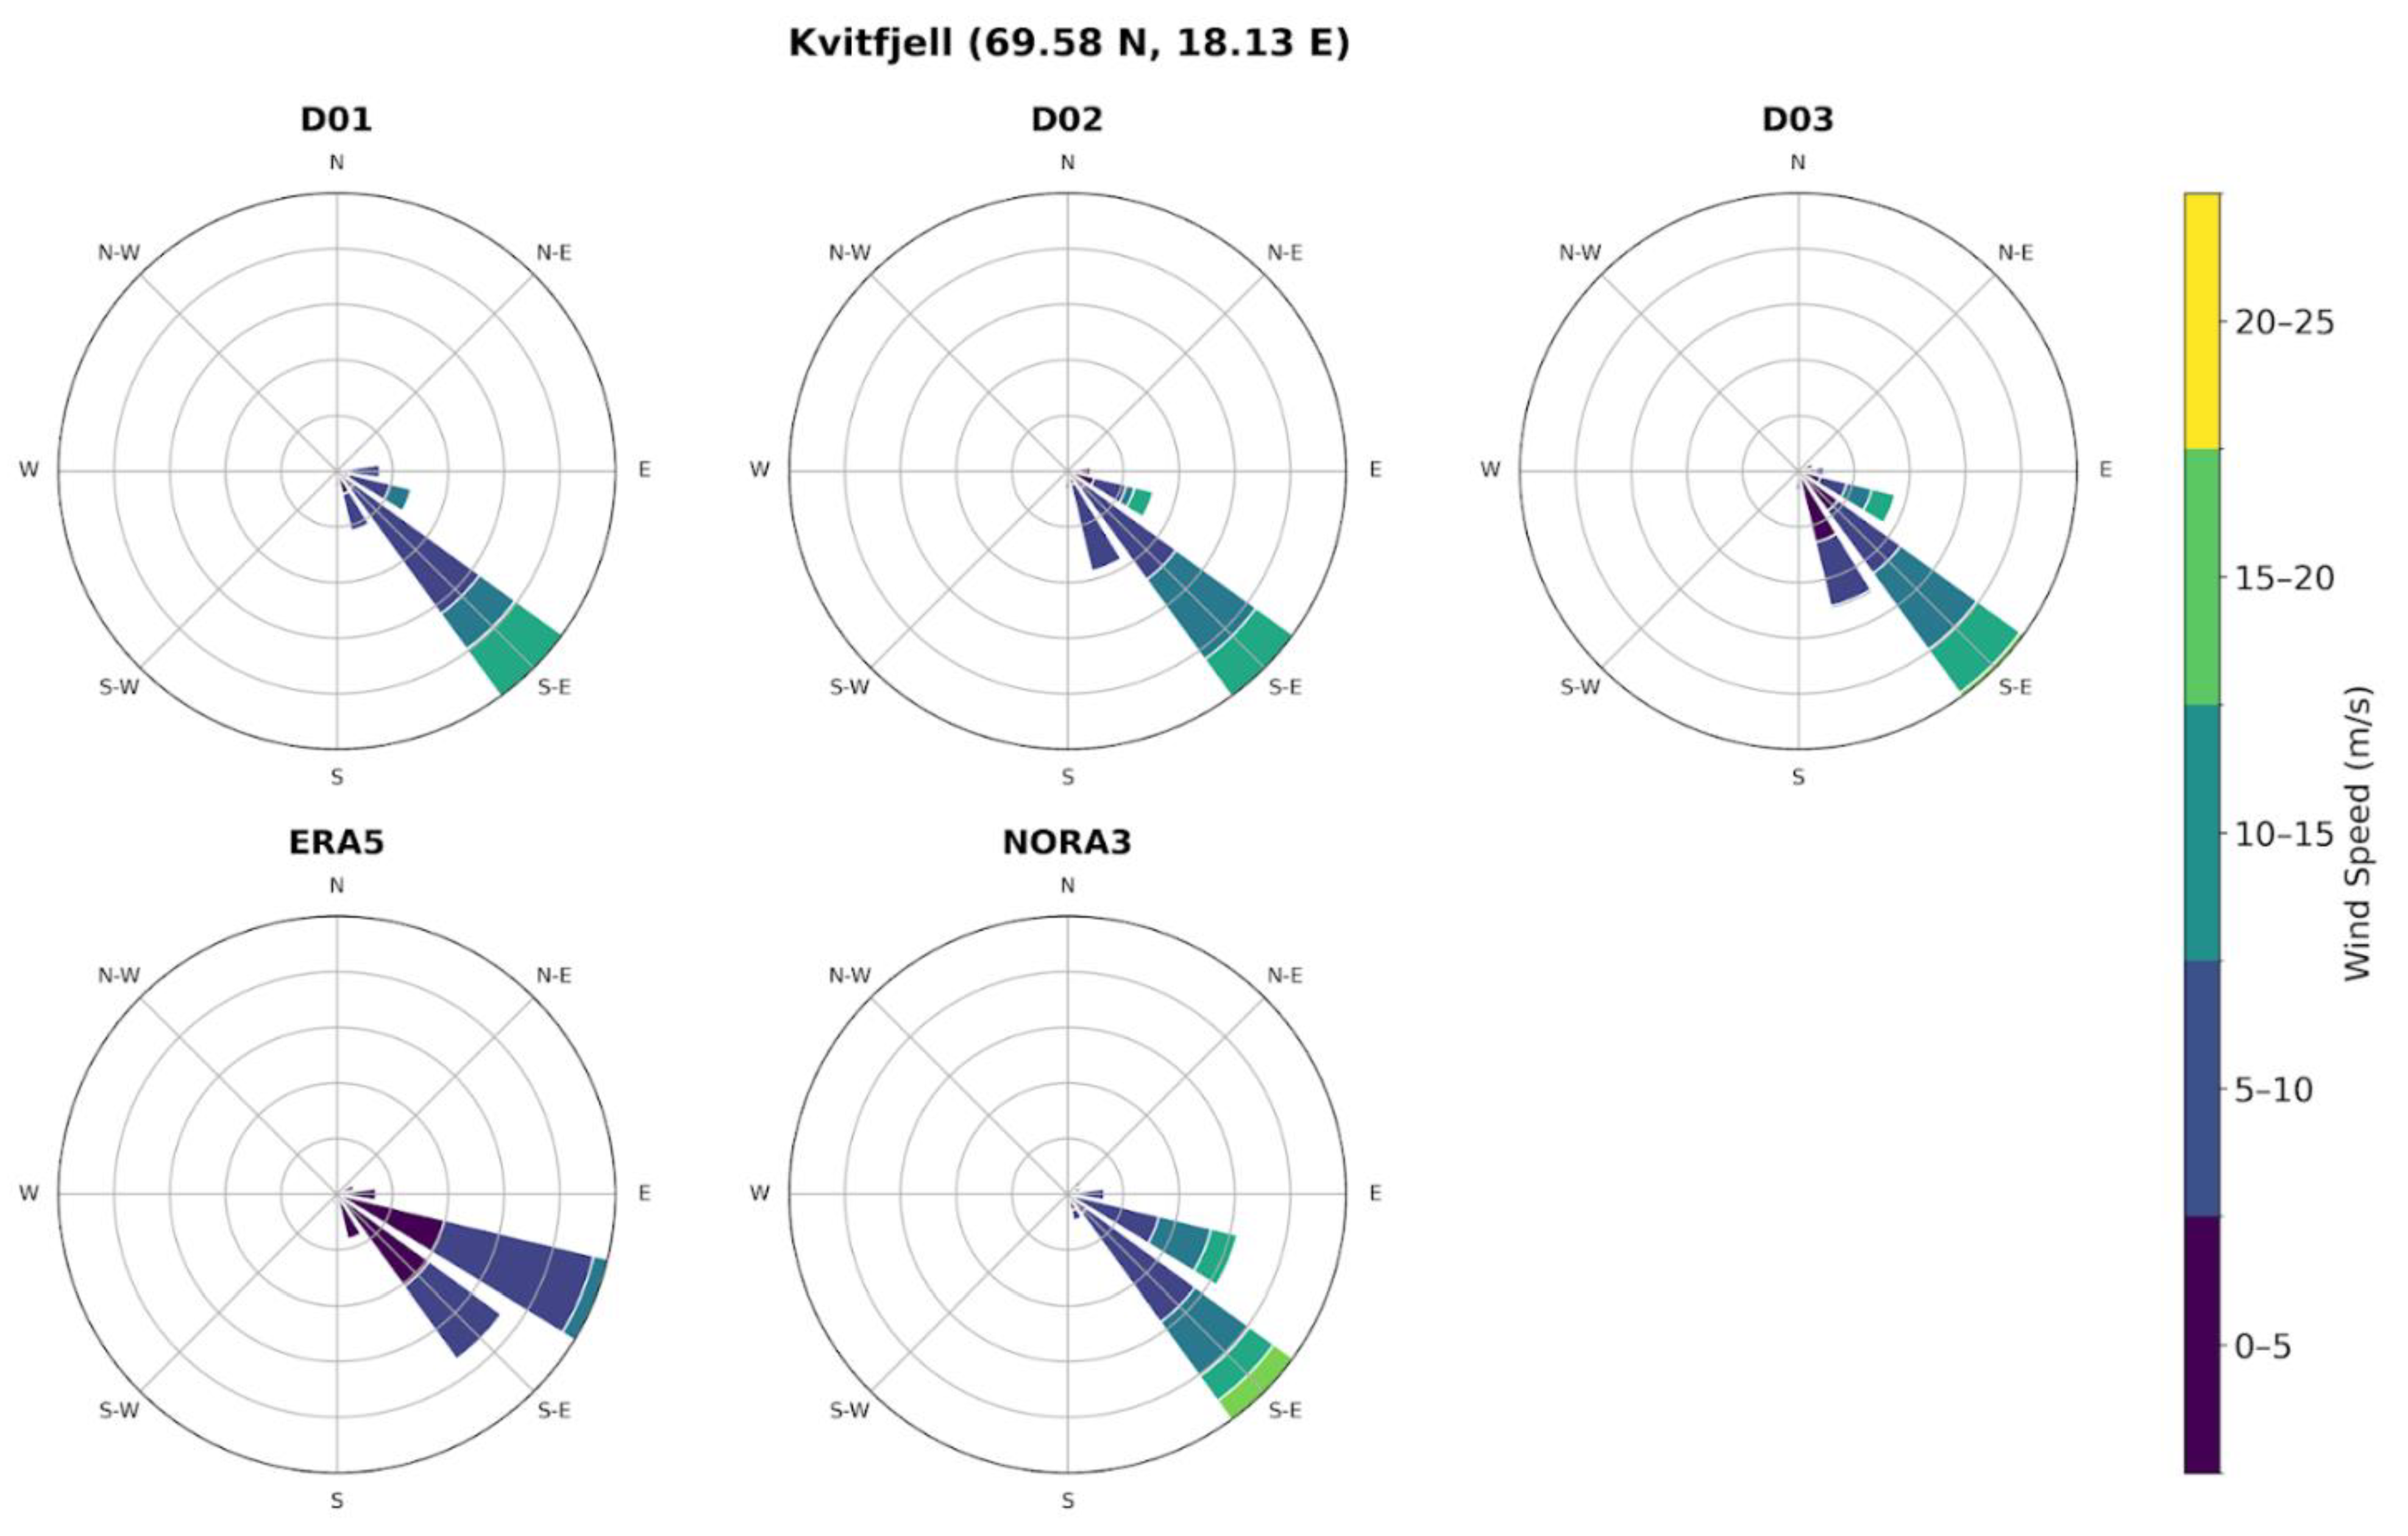
3.2. Intercomparison of Models and Observations at Selected Sites

For more detailed study, we looked at the Kvitfjell-Raudfjell wind park locations as well as on the site where observational data were collected (Hekkingen Fyr). Figure 6 shows sea level pressure, wind speed and temperature development during the “Ylva” event. Data for 3 WRF domains are compared with data from SEKLIMA (observations), ERA5 (medium-resolution reanalysis), and NORA3 (high-resolution reanalysis). It is easy to observe that while usual winds in all datasets vary and follow rather closely each other, the difference in wind speed increases significantly (by factor of 4 to 5) during the period of the strong winds. The largest effect is observed for the refinement from ERA5 to WRF resolutions. The results from the WRF domains show only relatively small changes, whereas NORA3 suggests stronger winds in mountain locations. There are overall stronger winds in high-resolution simulations as the finer grid allows for larger gradients in models and stronger wind channeling in more steep and narrow coastal valleys captured by the finer grids.
There is also an important and non-trivial result, which has been emphasized in several other WRF studies (Solbakken et al., 2021; Luzia et al., 2022; Birkelund, 2025), namely, that winds in the 1 km resolution domain (D03) are less similar to observations than in the previous 3 km domain (D02). In our study, D03 winds at Hekkinger Fyr (the SEKLIMA station) are weaker than D02 and even D01 winds. There are no systematic differences in the wind speed between WRF domains, but all of them show strong winds, which are weaker than in NORA3 but stronger than in ERA5. Observe that the pressure changes follow each other very closely in all datasets. It reassures us that the observed wind differences result from local recirculation and wind sheltering but not from the error in the storm propagation.

3.3. Comparative Statistical Analysis of Winds

Quantitative statistical analysis provides better insight into the wind variability. We analyzed wind frequencies (windroses), wind speed (Weibull) distributions, and correlations (the Taylor diagrams) between the observational and modeling data. We have 192 hourly values in each dataset, which is sufficient for a reasonable statistical analysis of the differences. Figure 7 and Figure 8 shows the wind speed and direction frequencies at Hekkingen Fyr and Kvitfjell site correspondingly. The southeast winds dominate both sites and in all datasets.
Wind roses are useful for intercomparison, but they incorporate too many parameters to effectively characterize wind variability. By fitting an empirical wind speed histogram to a prescribed Weibull distribution, the complexity is reduced to just two parameters - scale and shape - making intercomparison more straightforward. Figure 9 presents the wind speed histograms for SEKLIMA and WRF, along with the fitted Weibull curves for all datasets considered, interpolated at the Hekkingen Fyr location. It is evident that most models, including reanalysis datasets, struggle to predict extreme wind speeds exceeding approximately 20 m/s. Among the models, NORA3 and WRF D02 perform better in predicting extreme winds. However, in the case of NORA3, this improvement comes at the cost of overestimating strong winds in general. The coarse-resolution ERA5 reanalysis, in particular, exhibits significant limitations in capturing wind extremes. This underestimation of extreme winds propagates into WRF simulations, which are forced by ERA5 data, leading to a damping effect on wind extremes in the nested simulations.
There are no observations at 10 m height a.g.l. at the mountain top of Kvitfjell-Raudfjell sites. We observe however that wind speed reports submitted to the Norwegian Meteorological Institute refer to much stronger wind speed than we find in the model and reanalysis data. Thus, it is likely that NORA3 is more correct in assessment of extreme winds (Figure 10), although it might be overpredicting persistence of the strong winds in general.

3.4. Assessment of the Model Simulations Against Direct Observations

This study does not pursue the goal of a comprehensive model or reanalysis assessment. The relevant assessment studies have been already mentioned in the Introduction section of this paper. More detailed analysis of literature devoted to WRF, ERA5, and NORA3 evaluation is clearly outside the scope of our study, but nonetheless, we ran a literature search and found about 150 relevant papers published in 2025 alone. The reader should note that WRF has undergone a comprehensive evaluation against global observations and targeted meteorological field campaigns in the New European Wind Atlas (NEWA) [41]. For example, Luzia et al. [24] assessed NEWA and WRF simulations against a diverse set of observations across Europe. Cheynet et al. (2025) [43] presented a detailed cross-evaluation of ERA5, NORA3, and NEWA against lidar observations. Hassager et al. (2020) [44] assessed WRF against satellite datasets. Mann et al. (2017) assessed NEWA against a number of field campaigns in complex terrain. Finally, several studies [12,13,45] assessed WRF against observations from the Arctic coast. The assessments highlight reasonable quality of WRF and two reanalysis products, which were found to be the best in their class. The results deteriorate significantly in complex terrain conditions. For example, al Oqaily et al. [39] reported correlation coefficient between WRF simulations and meteorological masts over the Perdigao area as low as 0.3 for several locations.
We use the Taylor diagram [40] to assess the quality of different models, reanalysis, and observational datasets in this study. Figure 11 presents the assessment for wind speed at 10 m and temperature at 2 m heights a.g.l. at Hekkingen Fyr. Distinct to the assessment in [39], our results reveal rather high and approximately similar correlation coefficients of 0.9 for this extreme weather event in the challenging coastal area. Standard deviation in models is much lower than in SEKLIMA. This is a signature of insufficient spatial resolution of the models and the spatially smooth forcing from the coarse-grid domains; the small-scale motions have too short time for full development. NORA3 reanalysis shows better agreement with observations than WRF in D02, i.e., at the same spatial resolution of 3 km. This could be explained by the data assimilation in NORA3, whereas the WRF model, while it was initialized with ERA5 data and updates its boundary conditions from ERA5 every hour, uses no additional data assimilation of nudging and in this sense runs unconstrained. Similar patterns of the model quality are revealed for sea level pressure, wind speed, and temperature.

4. Discussion

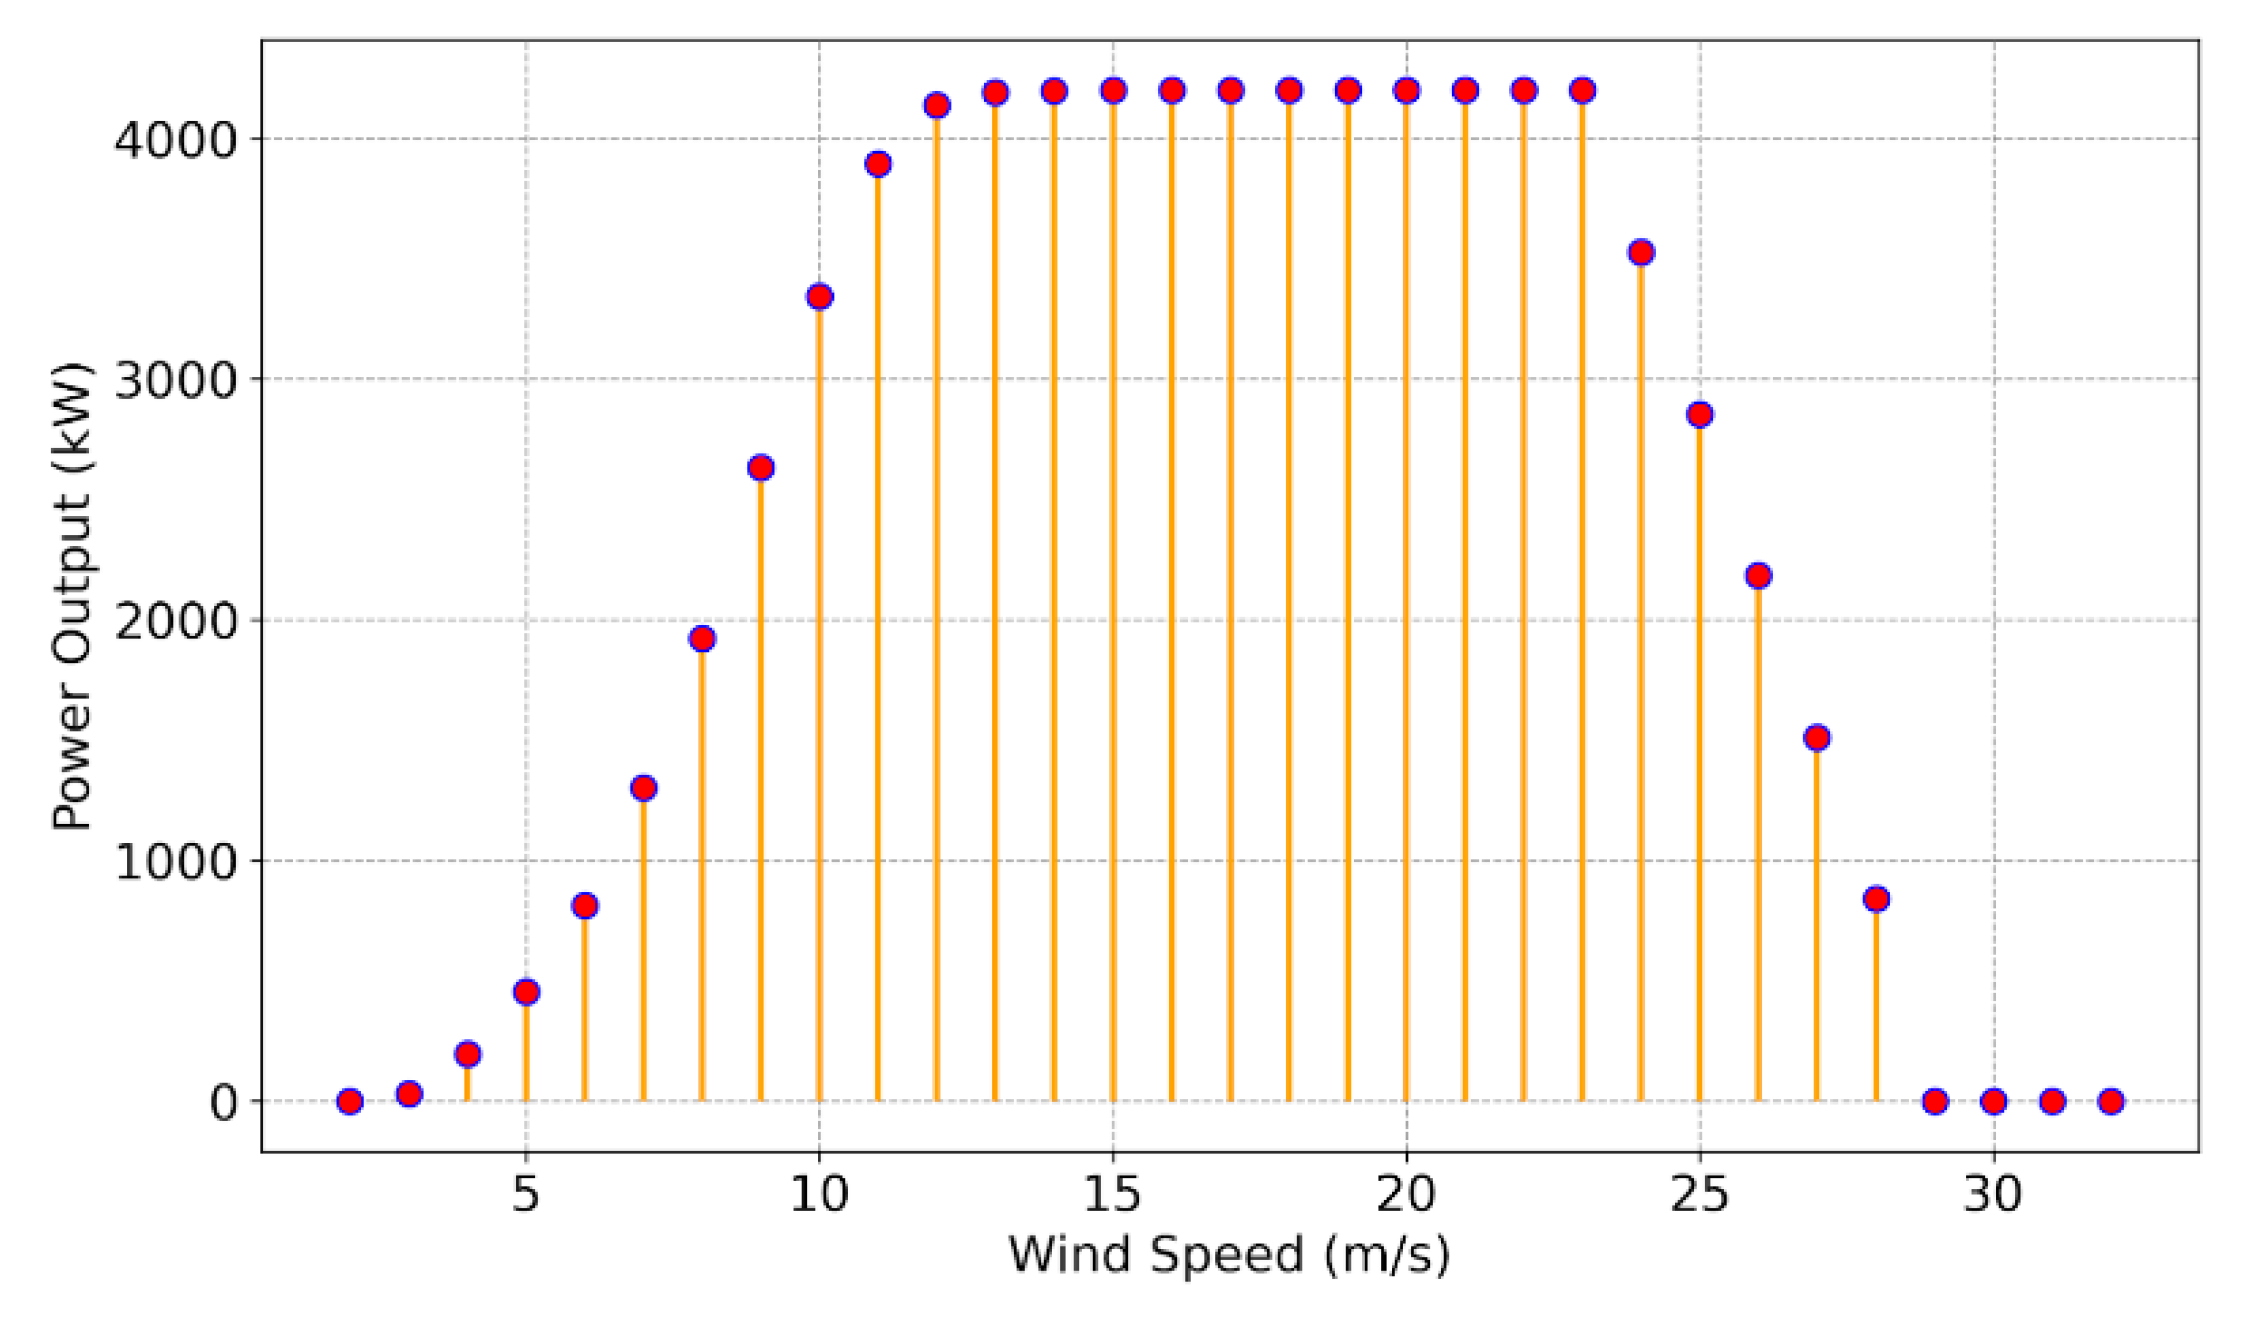
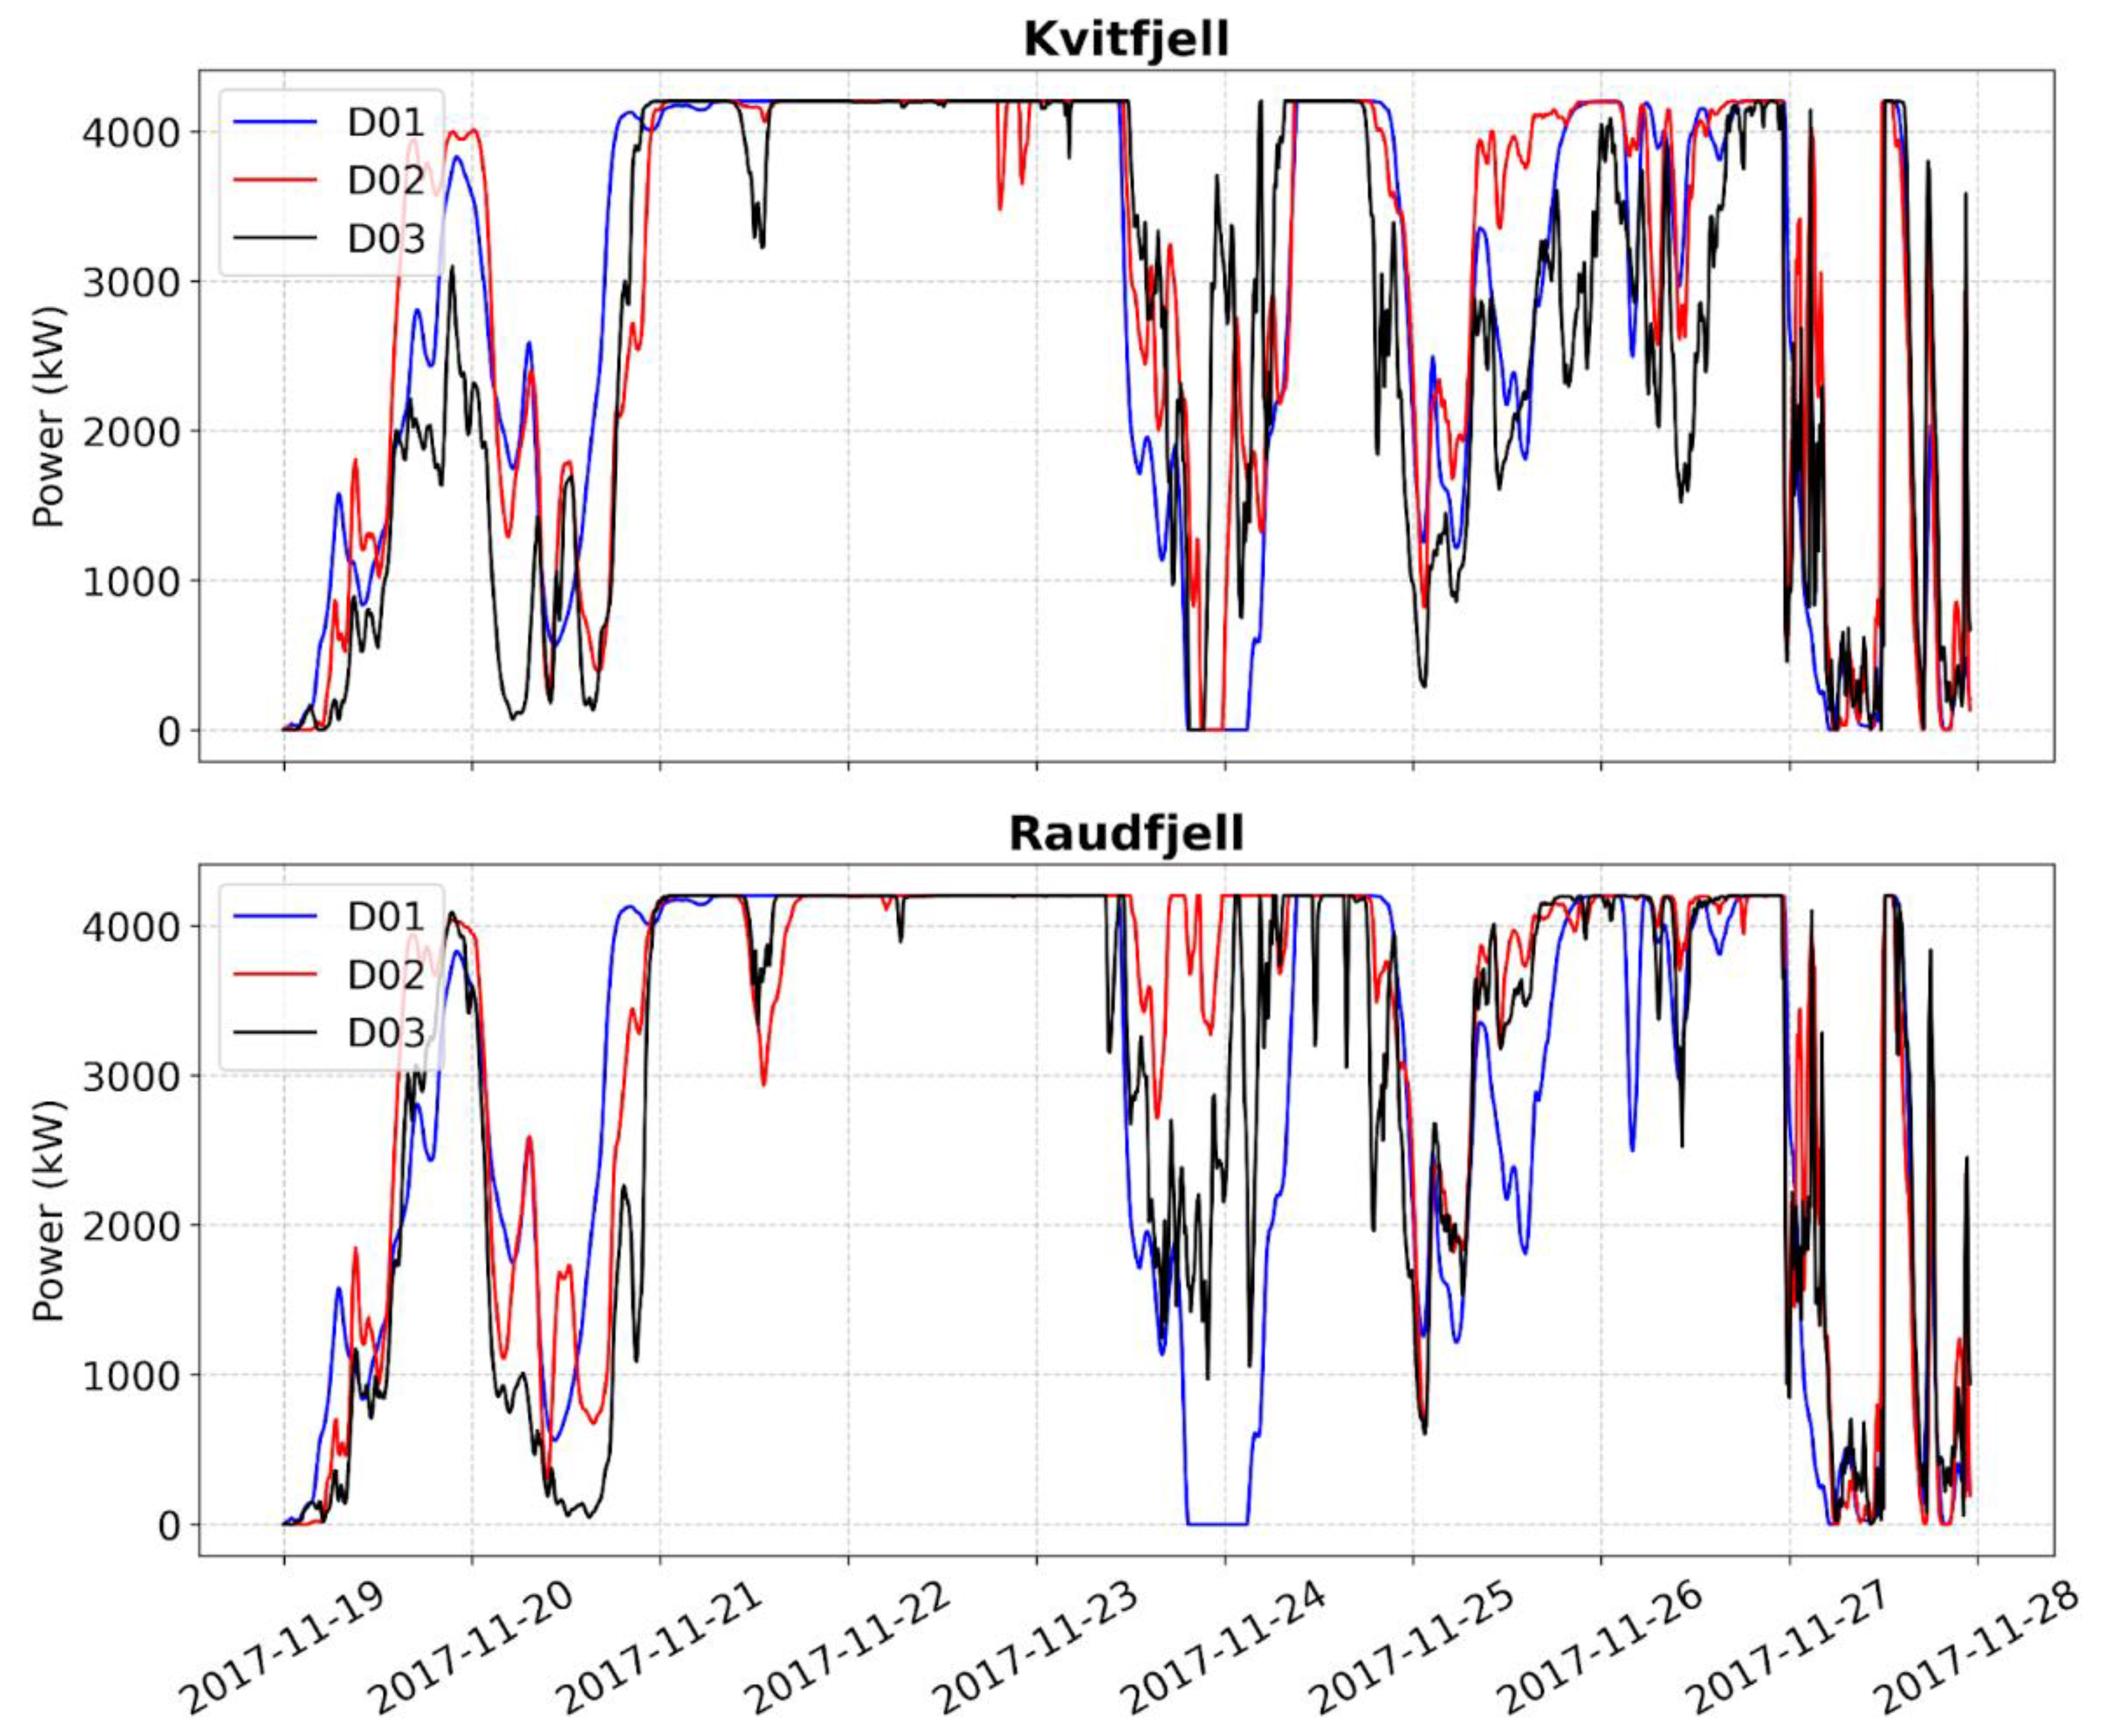
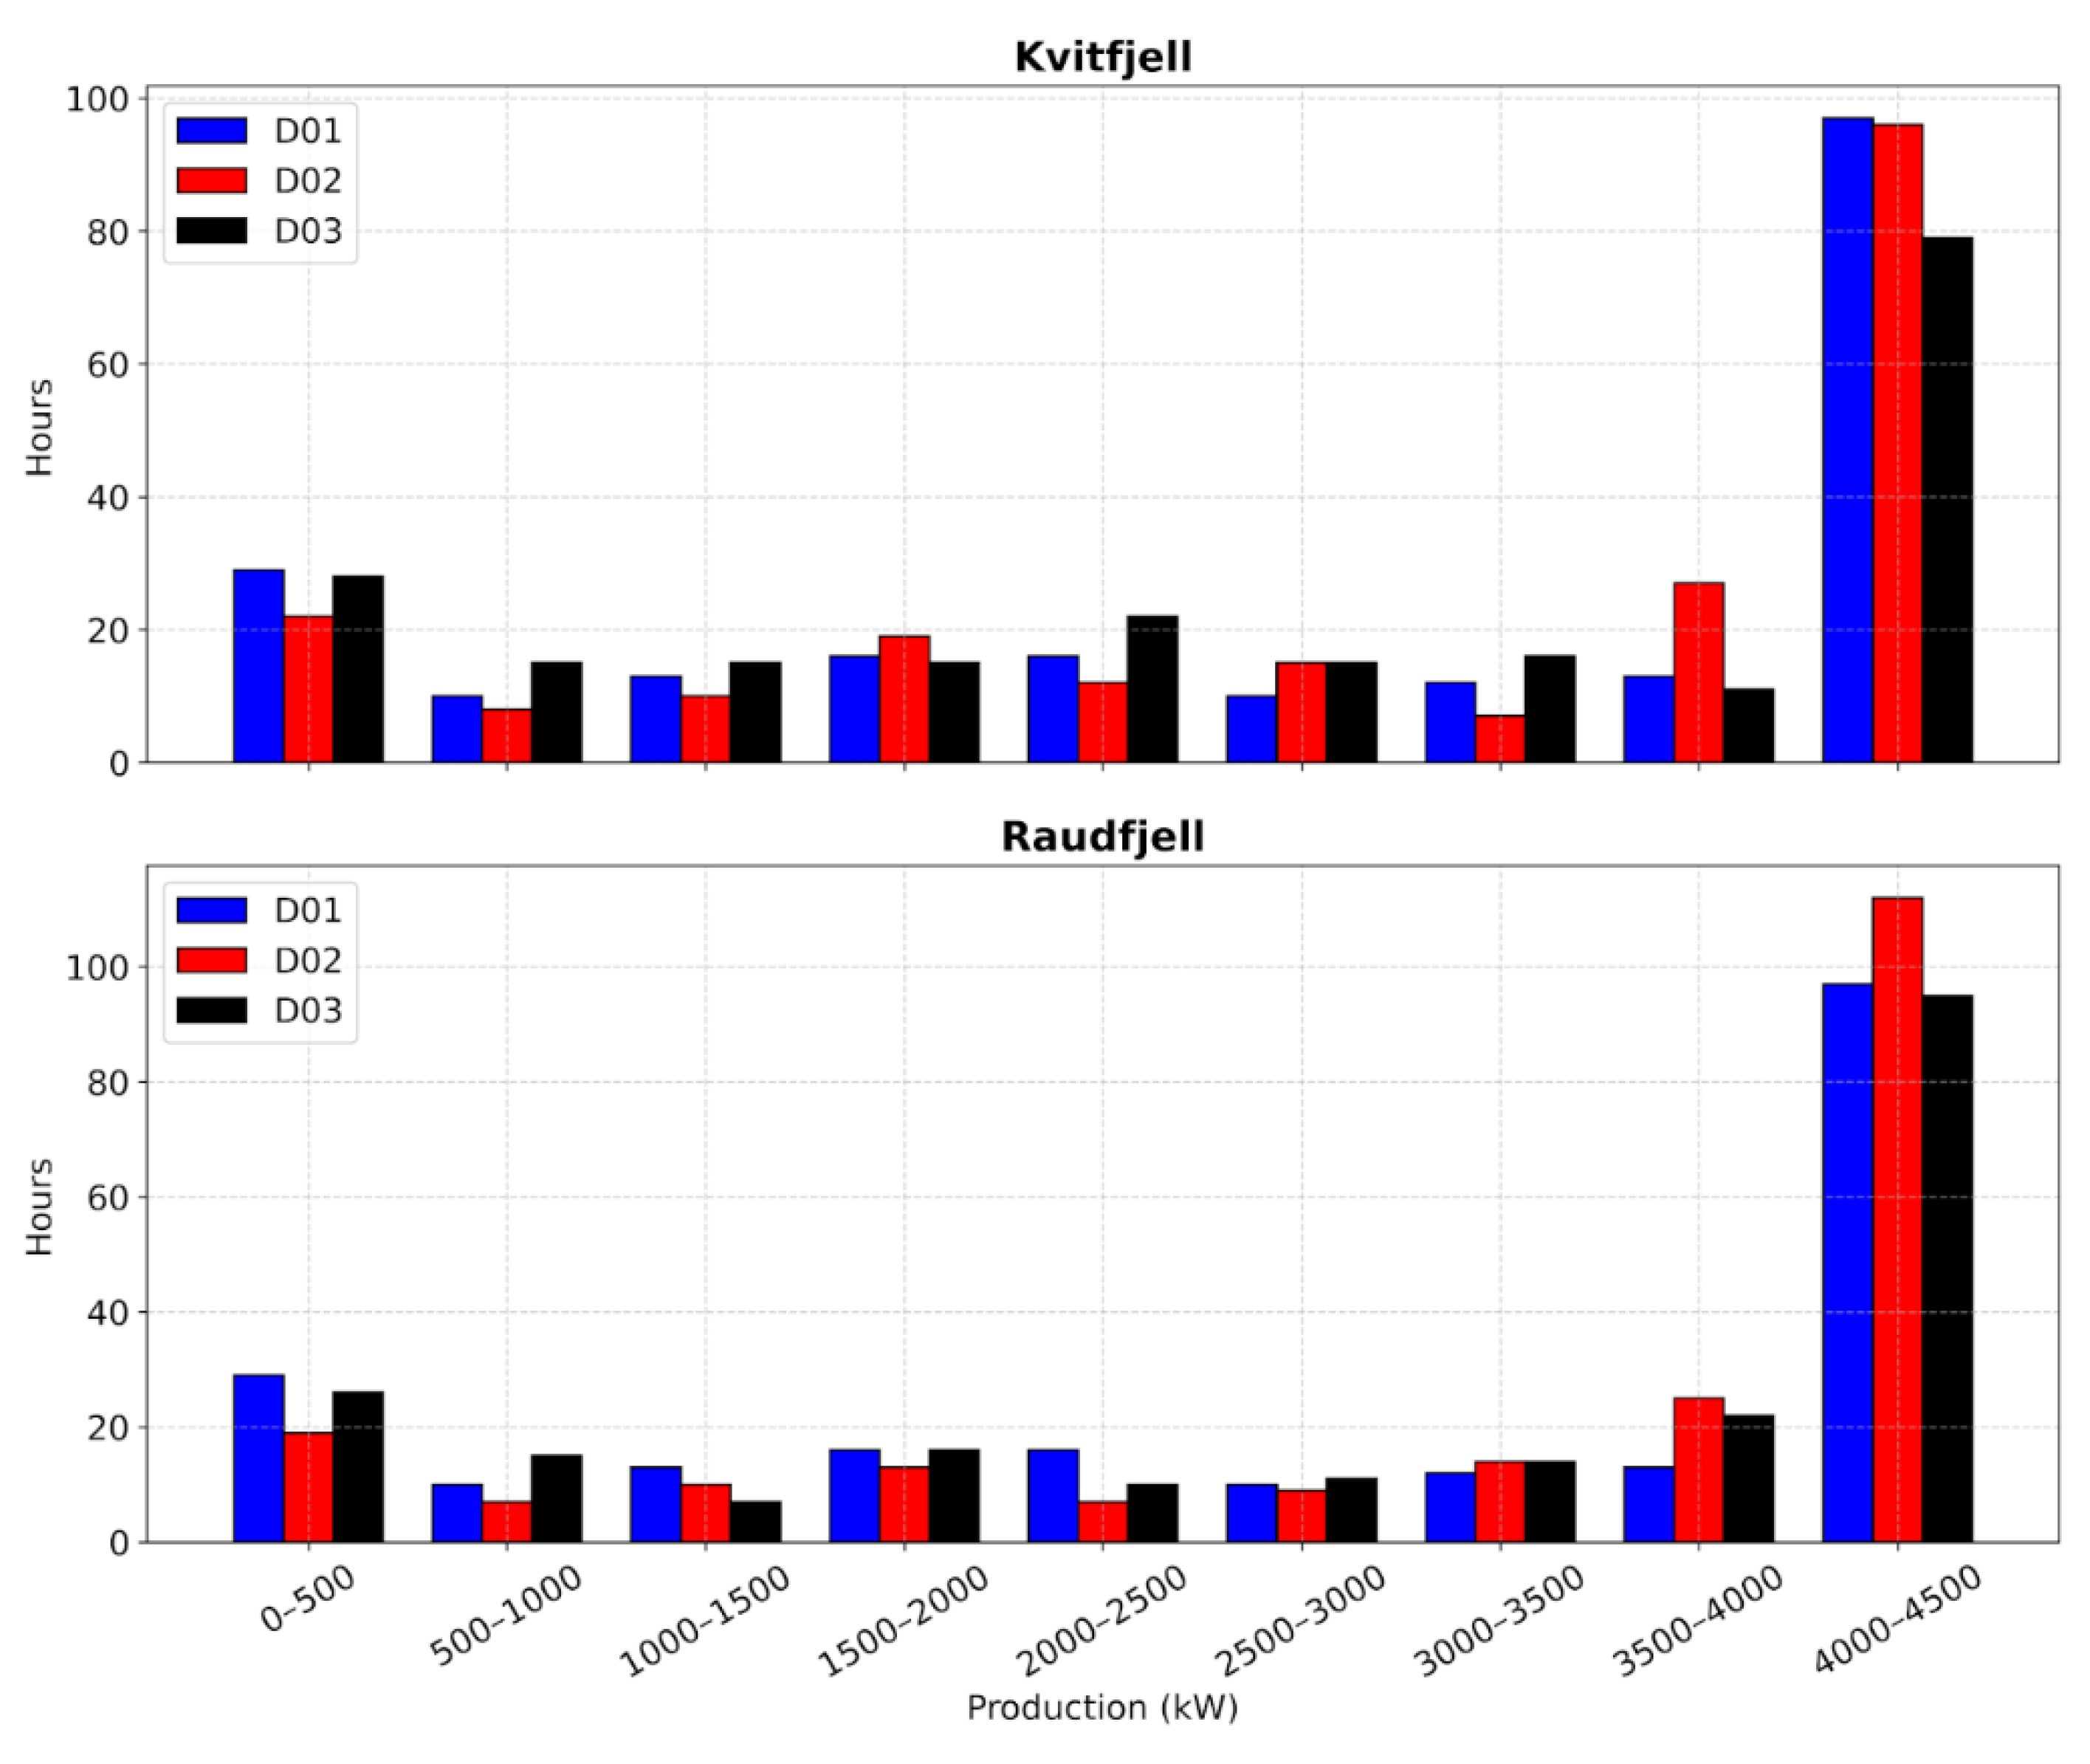
4.1. The “Ylva” Impact on Wind Power Production

The WRF simulations are purposed to estimate wind power production and possible production breaks due to extreme winds over the Kvitfjell-Raudfjell wind park. The analysis convinced us that the WRF downscaling exercise at this coastal wind park was rather successful in comparison with similar modeling exercises in other complex terrains [24,39,45]. Contrary to our expectations, however, the best results were found for the intermediate 3 km resolution domain D02. Similar results have been reported in other WRF downscaling studies (e.g., [12]). This lack of model quality convergence does not influence the estimated energy production. It is more important to focus on the strongest winds at Kvitfjell-Raudfjell because they may cross the turbine’s cut-off threshold.
The Kvitfjell-Raudfjell wind park was under construction when “Ylva” hit the place. This is a typical situation for wind energy actors as the extreme wind information is the most valuable if it was obtained before construction of the facility [15,22]. This situation is however inconvenient for modelers as modelled and observed wind power output cannot be compared directly. Instead, we make use of wind power output estimations as follows. The potential wind power output was obtained by converting wind speed to wind power output through the curve in Figure 12. Wind power output reaches its rated value in the wind speed range between 12 m/s and 23 m/s. The output sharply decreases for stronger winds, and there is no power output for winds above 28 m/s. Thus, the power output is sensitive to strong winds that the model can simulate.
Fluctuations in power output are shown in Figure 13. It reveals that the simulated power output is sensitive to both the wind speed at the given location and the model resolution (domain). Surprisingly, the highest resolution domain (D03) does not demonstrate the longest power breaks. For example, the D03 curve is between the D01 and D02 curves on 23-24 November at both places. The next day (25-26 November), however, the D03 curve is closer to the intermediate domain D02 curve at Kvitfjell, whereas at Raudfjell, it is closer to the coarse domain D01 curve. Figure 14 shows the number of hours with a certain level of power production. Here, we also see that the D03 run sustains less hours with maximal power production than coarse-resolution simulations.

4.2. Sheltering from Extreme Winds Along the Norwegian West Coast

Our modeling study reveals a paradoxical result: while winds become stronger in fine-resolution domains, the most extreme winds - those responsible for triggering energy production shutdowns - do not increase proportionally. Interestingly, there are more hours with low production in the D01 domain compared to the D02 domain. We attribute this effect to directional wind sheltering. Although the dominant wind directions in this area are from the western sectors, the strongest winds originate from the southeastern sectors, i.e., from directions that are sheltered by the coastal mountain ridge. This meteorological phenomenon, though overlooked in previous wind energy analyses, is characteristic of the Norwegian west coast.
The Atlantic stormtrack follows the Norwegian coastline, guiding synoptic low-pressure systems (cyclones) toward the Arctic [46]. In this configuration, most cyclones make landfall from the west or southwest. The strongest winds are typically found in the frontal zone to the east or northeast of the low-pressure center, meaning they originate from the easterly sectors. Consequently, the configuration of the Norwegian coastline provides natural coastal protection from the strongest winds associated with shifting Atlantic cyclones.
The specific location and extent of these sheltered areas depend on the positions of mountain gaps and sea fjords, which act as wind channels that balance the sheltering effect. In the Kvitfjell-Raudfjell area, both the SEKLIMA location and the wind park are sheltered from easterly winds, while the strongest winds are funneled through the gap between Senja and Kvaløya islands. As a result, extreme winds can only reach the area when the gap jet fluctuates. The wind speed and power production results align with this explanation, as sharp fluctuations in production are observed due to the meandering of the gap jet. In contrast, the large-scale winds remain more stable. This highlights the importance of understanding local wind dynamics and directional sheltering when assessing wind energy potential in complex coastal terrains.

5. Conclusions

Atmospheric models play an increasingly important role in wind resource assessment and wind park siting. However, running these models over a sufficiently large domain with a fine spatial grid resolution is computationally expensive and often impractical. To address this, models are typically run in a nested chain, where global-scale models, such as the one behind the ERA5 reanalysis, with coarse spatial resolution, provide boundary conditions for mesoscale meteorological models like WRF. These mesoscale models use finer grids to better resolve features such as coastal mountains.
Our analysis shows that while ERA5 data capture wind direction statistics reasonably well, they fail to accurately represent wind speed statistics. ERA5 winds are significantly weaker compared to SEKLIMA observations. Consequently, despite the widespread use of ERA5 wind data in prominent publications, e.g. [3,47], its application for wind park siting should not be prioritized [35,42].
Mesoscale model downscaling is widely regarded as a robust tool for wind energy assessment [12,16,25,35], whereas microscale models also become popular [49]. The ERA5-WRF downscaling chain is frequently used but has shown mixed and inconclusive results over complex terrain [21,24,39]. In our study, simulations using a three-domain downscaling approach with WRF were relatively successful, showing better correlations with and smaller standard deviations from observations along the challenging Norwegian west coast. The simulation results across all three domains were consistent at 100 m above ground level (a.g.l.), but greater divergence was observed at lower altitudes. This suggests that turbine hub heights are generally above the macro-scale roughness sublayer, where the wind profile is less influenced by surface orography. Instead, the wind profile follows the universal wind profile in the inertial sublayer, exhibiting sensitivity only to larger-scale orography upwind. We attribute this lack of local sensitivity to the strong constraints imposed by extreme large-scale winds on local recirculation.
Our study highlights the channeling and sheltering effects of extreme winds along the Norwegian coast. We demonstrate that the Kvitfjell-Raudfjell wind park area is one such advantageous location, where wind power generation under normal synoptic conditions is maximized, while exposure to extreme winds is minimized. The impact of storm “Ylva” on wind power production was found to be significantly less severe than suggested by the ERA5 dataset. This discrepancy is explained by the fact that storms approaching from southwestern directions generate the strongest winds from southeastern directions in the wind park area. These southeastern winds are sheltered by coastal mountains, with the strongest winds being channeled either along fjords or well above the internal atmospheric boundary layer. Winds in the rear of the storm—those blowing from the open sea—are much weaker, as both simulations and observations for November 24th and the following days confirm. Thus, we conclude that winds at the wind park site are less extreme, and high-resolution domains effectively capture the spatial localization and fragmentation of extreme winds.
In summary, we conclude that dynamical downscaling with WRF provides not only enhanced spatial detail but also valuable meteorological insights for wind resource assessment and siting. These insights stem from: (a) improved representation of terrain at kilometer-scale resolution, enabling more realistic simulations of local winds; and (b) better representation of large-scale flow channeling, as well as improved localization of wind sheltering and acceleration zones.

Author Contributions

Conceptualization, I.E. and Y.B.; methodology, I.E., P.P., and Y.B.; software, P.P.; validation, P.P.; formal analysis, I.E.; investigation, I.E.; resources, I.E. and Y.B.; data curation, P.P.; writing—original draft preparation, I.E.; writing—review and editing, I.E.; visualization, P.P.; supervision, Y.B.; project administration, P.P.; funding acquisition, Y.B. All authors have read and agreed to the published version of the manuscript.

Funding

This research was funded through an academia agreement between EQUINOR and UiT from the project HAVVIND.

Institutional Review Board Statement

Not applicable.

Informed Consent Statement

Not applicable.

Data Availability Statement

All data and analysis codes used for this study could be freely obtained from Punde, P., & Esau, I. (2025). Dataset for - Exposure of a wind park site in the Norwegian Arctic to the extreme storm “Ylva” [Data set]. Zenodo. https://doi.org/10.5281/zenodo.17673983.

Acknowledgments

Not applicable.

Conflicts of Interest

The authors declare no conflicts of interest.

Abbreviations

The following abbreviations are used in this manuscript:
WRF Weather Research and Forecasting model
NORA3 NORwegian Reanalysis Archive with a 3 km resolution
ERA5 European center for medium and long-term weather forecast Reanalysis version 5
SEKLIMA Observations and analysis archive of the Norwegian Meteorological Institute

References

  1. Clifton, A.; Barber, S.; Stökl, A.; Frank, H.; Karlsson, T. Research challenges and needs for the deployment of wind energy in hilly and mountainous regions. Wind Energy Sci. 2022, 7(6), 2231–2254. [CrossRef]
  2. Pryor, S.C.; Barthelmie, R.J. A global assessment of extreme wind speeds for wind energy applications. Nature Energy 2021, 6(3), 268–276. [CrossRef]
  3. Zhao, Y.; Tao, Y.; Chen, Y.; Yan, J.; Zeng, Z. Increasing extreme winds challenge offshore wind energy resilience. Nature Comms. 2025, 16(1), 9529. [CrossRef]
  4. Christakos, K.; Varlas, G.; Reuder, J.; Katsafados, P.; Papadopoulos, A. Analysis of a low-level coastal jet off the Western coast of Norway. Energy Procedia 2014, 53(C), 162–172. [CrossRef]
  5. Solbrekke, I.M.; Sorteberg, A. Norwegian offshore wind power—Spatial planning using multi-criteria decision analysis. Wind Energy 2024, 27, 5–32. [CrossRef]
  6. Enevoldsen, P.; Permien, F.-H.; Bakhtaoui, I.; Krauland, A.-K.; Jacobson, M.Z.; and 5 co-authors. How much wind power potential does Europe have? Examining European wind power potential with an enhanced socio-technical atlas. Energy Policy 2019, 132, 1092–1100. [CrossRef]
  7. Minola, L.; Azorin-Molina, C.; Guijarro, J.A.; Zhang, G.; Son, S.; Chen, D. Climatology of Near-Surface Daily Peak Wind Gusts Across Scandinavia: Observations and Model Simulations. J. Geophys. Res.: Atmos. 2021, 126(7). [CrossRef]
  8. Katsaprakakis, D. Al.; Papadakis, N.; Ntintakis, I. A Comprehensive Analysis of Wind Turbine Blade Damage. Energies 2021, 14(18), 5974. [CrossRef]
  9. Simensen, T.; Erikstad, L.; Halvorsen, R. Diversity and distribution of landscape types in Norway. Norwegian J. Geography 2021, 75(2), 79–100. [CrossRef]
  10. Grønås, S.; Sandvik, A.D. Numerical simulations of local winds over steep orography in the storm over north Norway on October 12, 1996. J. Geophys. Res.: Atmos. 1999, 104(D8), 9107–9120. [CrossRef]
  11. Nawri, N.; Harstveit, K. Variability of surface wind directions over Finnmark, Norway, and coupling to the larger-scale atmospheric circulation. Theor. Appl. Climatol. 2012, 107(1–2), 15–33. [CrossRef]
  12. Solbakken, K.; Birkelund, Y.; Samuelsen, E.M. Evaluation of surface wind using WRF in complex terrain: Atmospheric input data and grid spacing. Env. Mod. Soft. 2021, 145, 105182. [CrossRef]
  13. Henkies, M.; Høyland, K.V.; Shestov, A.; Duscha, C.; Sjöblom, A. The Arctic Fjord Breeze: Characteristics of a Combined Sea Breeze and Valley Wind in a Svalbard Fjord Valley. Boundary-Layer Meteorol. 2023, 189(1–3), 281–304. [CrossRef]
  14. Feser, F.; Barcikowska, M.; Krueger, O.; Schenk, F.; Weisse, R.; Xia, L. Storminess over the North Atlantic and northwestern Europe—A review. QJRMS 2015, 141, 350–382. [CrossRef]
  15. Jaison, A.; Sorteberg, A.; Michel, C.; Breivik, Ø. Assessment of wind–damage relations for Norway using 36 years of daily insurance data. Nat. Haz. Earth Sys. Sci. 2024, 24(4), 1341–1355. [CrossRef]
  16. Solbrekke, I.M.; Sorteberg, A.; Haakenstad, H.The 3 km Norwegian reanalysis (NORA3)-a validation of offshore wind resources in the North Sea and the Norwegian Sea. Wind Energy Sci. 2021, 6(6), 1501–1519. [CrossRef]
  17. Wang, K.; Wu, D.; Wu, K.; Yu, K.; Zheng, C. Interdecadal Variation Trend of Arctic Wind Energy. Energies 2023, 16(18), 6545. [CrossRef]
  18. Zhou, L.; Esau, I. Determining the ideal length of wind speed series for wind speed distribution and resource assessment, Wind Energ. Sci. Discuss. 2025 [preprint]. [CrossRef]
  19. Wais, P. A review of Weibull functions in wind sector. Renew. Sust. Energy Rev. 2017, 70, 1099–1107. [CrossRef]
  20. Bilal, M.; Birkelund, Y.; Homola, M.; Virk, M.S. Wind over complex terrain – Microscale modelling with two types of mesoscale winds at Nygårdsfjell. Renewable Energy, 2016, 99, 647–653. [CrossRef]
  21. Birkelund, Y. Numerical Weather Modelling and Large Eddy Simulations of Strong-Wind Events in Coastal Mountainous Terrain. Appl. Sci. 2025, 15(14), 7683. [CrossRef]
  22. Hølleland, S.; Berentsen, G.D.; Otneim, H.; Solbrekke, I.M. Optimal allocation of 30 GW offshore wind power in the Norwegian economic zone. Wind Energy Sci. 2025, 10(1), 293–313. [CrossRef]
  23. Fernández-González, S.; Martín, M.L.; García-Ortega, E.; Merino, A.; Lorenzana, J.; Sánchez, J.L.; Valero, F.; Rodrigo, J.S. Sensitivity Analysis of the WRF Model: Wind-Resource Assessment for Complex Terrain. J. Appl. Meteorol. Climatol. 2018, 57, 733–753. [CrossRef]
  24. Luzia, G.; Hahmann, A.N.; Koivisto, M.J. Evaluating the mesoscale spatio-temporal variability in simulated wind speed time series over northern Europe. Wind Energy Sci. 2022, 7(6), 2255–2270. [CrossRef]
  25. Carvalho, D.; Rocha, A.; Gómez-Gesteira, M.; Silva Santos, C. Sensitivity of the WRF model wind simulation and wind energy production estimates to planetary boundary layer parameterizations for onshore and offshore areas in the Iberian Peninsula. Appl. Energy 2014, 135, 234–246. [CrossRef]
  26. Solbakken, K.; Samuelsen, E.M.; Birkelund, Y. Mountain wave and downslope winds impact on wind power production. Wind Energy Sci. 2025, (preprint. [CrossRef]
  27. Onwukwe, C.; Jackson, P.L. Meteorological Downscaling with WRF Model, Version 4.0, and Comparative Evaluation of Planetary Boundary Layer Schemes over a Complex Coastal Airshed. J. Appl. Meteorol. Climatol. 2020, 59(8), 1295–1319. [CrossRef]
  28. Powers, J.G.; Klemp, J.B.; Skamarock, W.C.; Davis, C.A.; Dudhia, J.; and 23 co-authors. The Weather Research and Forecasting Model: Overview, System Efforts, and Future Directions. BAMS 2017, 98(8), 1717–1737. [CrossRef]
  29. Pedersen, I.-T.; Vassbø, T.; Nordhagen, R.; Fossli, I.; Straume, I.; Mamen, J.; Haugen, G. Ekstremværrapport Ylva 22. -24. November 2017, MET.NO 2018, report 15-18, 23 p., Tromsø, ISSN 2387-4201 (available online https://www.met.no/publikasjoner/met-info/met-info-2018/_/attachment/download/23168252-dba3-48a5-bd6b-42601ee5e38a:9aeff6d74147f57dfae2dfa12650b1376a90dcd5/MET-info-15-2018.pdf last accessed 11 September 2024).
  30. NRK (2017) available from https://www.nrk.no/nordland/_ylva_-odela-for-150-millioner_-_-trodde-ikke-skadeomfanget-ble-sa-stort-1.13809430, last access 21.10.2025.
  31. Nordlysvid: https://nordlysvind.no/project-information/overview/, last accessed November 6, 2024.
  32. SVW (2019). The Raudfjell and Kvitfjell wind farm is operating, available on https://svw.no/en/insights/the-raudfjell-and-kvitfjell-wind-farm-is-operating last access 2025-11-26.
  33. Soci, C.; Hersbach, H.; Simmons, A.; Poli, P.; Bell, B.; and 11 co-authors. The ERA5 global reanalysis from 1940 to 2022. QJRMS 2024, 150(764), 4014–4048. [CrossRef]
  34. Graham, R.M.; Cohen, L.; Ritzhaupt, N.; Segger, B.; Graversen, R.G.; Rinke, A.; Walden, V.P.; Granskog, M.A.; Hudson, S.R. Evaluation of Six Atmospheric Reanalyses over Arctic Sea Ice from Winter to Early Summer. J. Clim. 2019, 32(14), 4121–4143. [CrossRef]
  35. Ramon, J.; Lledó, L.; Torralba, V.; Soret, A.; Doblas-Reyes, F.J. What global reanalysis best represents near-surface winds? QJRMS 2019, 145(724), 3236–3251. [CrossRef]
  36. Gandoin, R.; Garza, J. Underestimation of strong wind speeds offshore in ERA5: evidence, discussion and correction. Wind Energy Sci. 2024, 9(8), 1727–1745. [CrossRef]
  37. Haakenstad, H.; Breivik, Ø.; Furevik, B.R.; Reistad, M.; Bohlinger, P.; Aarnes, O.J. NORA3: A Nonhydrostatic High-Resolution Hindcast of the North Sea, the Norwegian Sea, and the Barents Sea. J. Appl. Meteorol. Climatol. 2021, 60(10), 1443–1464. [CrossRef]
  38. Khachatrian, E.; Asemann, P.; Zhou, L.; Birkelund, Y.; Esau, I.; Ricaud, B. Exploring the Potential of Sentinel-1 Ocean Wind Field Product for Near-Surface Offshore Wind Assessment in the Norwegian Arctic. Atmos. 2024, 15(2). [CrossRef]
  39. al Oqaily, D.; Giani, P.; Crippa, P. Evaluating WRF Multiscale Wind Simulations in Complex Terrain: Insights From the Perdigão Field Campaign. J. Geophys. Res.: Atmos., 2025, 130(15). [CrossRef]
  40. Taylor, K.E. Summarizing multiple aspects of model performance in a single diagram. J. Geophys. Res.: Atmos. 2001, 106(D7), 7183–7192. [CrossRef]
  41. Skamarock, W.C.; Klemp, J.B.; Dudhia, J.; Gill, D.O.; Liu, Z.; and 7 co-authors. A Description of the Advanced Research WRF Model Version 4. National Center for Atmospheric Research. 2021.
  42. Dörenkämper, M.; Olsen, B.T.; Witha, B.; Hahmann, A.N.; Davis, N.N.; and 13 co-authors. The Making of the New European Wind Atlas – Part 2: Production and evaluation. Geosci. Model Dev. 2020, 13(10), 5079–5102. [CrossRef]
  43. Cheynet, E.; Diezel, J.M.; Haakenstad, H.; Breivik, Ø.; Peña, A.; Reuder, J. Tall wind profile validation of ERA5, NORA3, and NEWA datasets using lidar observations. Wind Energy Sci. 2025, 10(4), 733–754. [CrossRef]
  44. Hasager, C.B.; Hahmann, A.N.; Ahsbahs, T.; Karagali, I.; Sile, T.; Badger, M.; Mann, J. Europe’s offshore winds assessed with synthetic aperture radar, ASCAT and WRF. Wind Energy Sci. 2020, 5(1), 375–390. [CrossRef]
  45. Zhang, T.; Cao, L.; Li, S.; Zhan, C.; Wang, J.; Zhao, T. Comprehensive sensitivity analysis of the WRF model for meteorological simulations in the Arctic. Atmos. Res. 2024, 299, 107200. [CrossRef]
  46. Wickström, S.; Jonassen, M.O.; Vihma, T.; Uotila, P. Trends in cyclones in the high-latitude North Atlantic during 1979–2016. QJRMS 2020, 146(727), 762–779. [CrossRef]
  47. Antonini, E.G.A.; Virgüez, E.; Ashfaq, S.; Duan, L.; Ruggles, T.H.; Caldeira, K. Identification of reliable locations for wind power generation through a global analysis of wind droughts. Communications Earth & Env. 2024, 5(1), 103. [CrossRef]
  48. NRIS: https://www.uio.no/english/services/it/research/hpc/fram/ last accessed November 6, 2024.
  49. Wolf-Grosse, T.; Esau, I.; Reuder, J. Sensitivity of local air quality to the interplay between small- and large-scale circulations: a large-eddy simulation study. Atmos. Chem. Phys. 2017, 17(11), 7261–7276. [CrossRef]
Figure 1. A historical synoptic analysis and weather chart from UK MetOffice (available from https://digital.nmla.metoffice.gov.uk/SO_5ac00274-e340-4c7a-ba07-0be9797536eb/?pg=6 last access 2025-11-26). The analysis shows the meteorological situation on 00:00 UTC November 24, 2017.
Preprints 187608 g001
Figure 2. Geographical location of Kvitfjell-Raudfjell wind park in Norway. (a) The regional map shows the topography and political boundaries in Scandinavia and surrounding Northern Europe. For Norway, the mean climatological wind speed at 80 m above ground level (a.g.l) is shown by color shading. (b) The local topography map of the area of Tromsø and the wind park. (c) Photo of the wind park area taken by Igor Ezau. All maps and climatological data are taken from open access resources provided by the Norwegian Water Resources and Energy Directorate (NVE) through https://temakart.nve.no/tema/vindressurser, last access 25.10.2025.
Preprints 187608 g002
Figure 3. Extent and resolved topography of 3 downscaling domains (D01, D02, D03) in this WRF simulations. The red dots show the Hekkingen Fyr (meteorological station) and the Kvitfjell-Raudfjell wind park locations.
Preprints 187608 g003
Figure 4. Time evolution of the storm “Ylva” during its passage through the WRF D01 domain between 25 November 00:00 UTC and 27 November 12:00 UTC 2017. Coastal line and sea level pressure are shown as black contours; winds - with meteorological barbs; and temperature - with color shading. Observe that winds at the Kritfjell-Raudfjell location changed direction by 180 degrees during the first half of 26 November.
Preprints 187608 g004
Figure 5. Wind speed (barbs), sea level pressure (isolines), and the terrain height (colored scale) within the same domain at the peak of “Ylva” (12:00 UTC, November 26, 2017). The results from WRF D01 (left), D02 (center), and D03 (right) are shown.
Preprints 187608 g005
Figure 6. Time series of temperature, wind speed at 10 m and 100 m a.g.l., and sea level pressure (SLP) at the Hekkingen Fyr (SEKLIMA observations, ERA5 and NORA3 reanalysis, and WRF D01, D02, D03 simulations) and Kvitfjell (reanalysis and model simulations only) sites.
Preprints 187608 g006
Figure 7. Windrose at the Hekkingen Fyr meteorological station. Wind speed and direction frequencies are shown for the observations (SEKLIMA dataset), reanalyses ERA5 and NORA3, and WRF results in three downscaling domains, D01, D02, and D03.
Preprints 187608 g007
Figure 8. Windrose at the Kvitfjell location. Wind speed and direction frequencies are shown for reanalyses ERA5 and NORA3, and WRF results in three downscaling domains, D01, D02, and D03.
Preprints 187608 g008
Figure 9. Statistical distribution of wind speed at 10 m height at the location of SEKLIMA observations (Hekkingen Fyr). SEKLIMA data are shown as a grey histogram for observed wind speed and a black curve for its Weibull fit. WRF data in the highest resolution D03 domain are shown as a blue histogram for simulated wind speed and a blue curve for its Weibull fit. Other datasets are shown only through their Weibull fit as: an orange curve for NORA3; green - ERA5; red and magenta - WRF D01 and D02 simulated results correspondingly.
Preprints 187608 g009
Figure 10. Statistical distribution of wind speed at (a) 10 m and (b) 100 m height at the location of Kvitfjell. The legend is the same as in Figure 9.
Preprints 187608 g010
Figure 11. Assessment of ERA5, NORA3, and WRF models against SEKLIMA observations at Hekkingen Fyr for the following measures: (left) the wind speed at 10 m and (right) temperature at 2 m.a.g.l. The results are presented as the Taylor diagram.
Preprints 187608 g011
Figure 12. Turbine characteristics used in estimation of the wind power production: the wind power curve for Siemens SWT 4.2 MW. The parameters and data are taken from the NVE report available from https://www.nve.no/media/13401/mev-ws-2022-001-vind-og-produksjonsindekser-for-vindkraft-i-norge-2021.pdf (last accessed 21.10.2025).
Preprints 187608 g012
Figure 13. The simulated power output for Kvitfjell (top) and Raudfjell (bottom) wind parks. The power curves are shown for winds in the D01 (blue), D02 (red), and D03 (black) simulation domains.
Preprints 187608 g013
Figure 14. The number of hours when each part of the wind park sustains a certain level of power production. The results are estimated for three WRF downscaling domains D01, D02, D03.
Preprints 187608 g014
Table 1. Configuration of computational domains in the WRF downscaling chain.
WRF configuration D01 D02 D03
Horizontal resolution 9 km 3 km 1 km
Number of horizontal plain grid points 97 x 97 97 x 97 97 x 97
Number of vertical levels 51 51 51
Time step 30 s 10 s 3.3 s
Sampling interval 10 min 10 min 10 min
Table 2. Configuration of the WRF model.
WRF component Configuration option
Initial and boundary conditions For D01 from ERA5; D02 from D01; D03 from D02
Domain D01 extent Longitude: 9 o E 27 o E
Latitude: 66 o N 72 o N
Planetary boundary layer scheme MYNN 2.5-level TKE
Land surface scheme Noah land surface model
Radiation (short-wave and long-wave) scheme The Rapid Radiative Transfer Model for global circulation (RRTMG)
Cumulus cloud scheme Kain-Fritsch (new Eta)
Microphysics scheme The Thompson scheme with cloud water, cloud ice, snow, graupel, and rain
Disclaimer/Publisher’s Note: The statements, opinions and data contained in all publications are solely those of the individual author(s) and contributor(s) and not of MDPI and/or the editor(s). MDPI and/or the editor(s) disclaim responsibility for any injury to people or property resulting from any ideas, methods, instructions or products referred to in the content.
Copyright: This open access article is published under a Creative Commons CC BY 4.0 license, which permit the free download, distribution, and reuse, provided that the author and preprint are cited in any reuse.
Prerpints.org logo

Preprints.org is a free preprint server supported by MDPI in Basel, Switzerland.

Subscribe

Disclaimer

Terms of Use

Privacy Policy

Privacy Settings

© 2025 MDPI (Basel, Switzerland) unless otherwise stated