
Submitted:
01 December 2025
Posted:
02 December 2025
You are already at the latest version
Abstract
The invasion of Prosopis juliflora poses a growing threat to dryland ecosystems and pas-toral livelihoods across East Africa. This study presents an integrative approach that combines satellite remote sensing, machine learning, and participatory GIS (PGIS) to de-tect and map the spatial extent and socio-ecological impacts of Prosopis juliflora in Baringo County, Kenya. We evaluated the performance of three satellite platforms, Sentinel-1, Sentinel-2, and PlanetScope, using a Random Forest classifier trained on field-collected presence–absence data and vegetation indices. Sentinel-2 outperformed the other sensors, achieving a classification accuracy of 90.65%, with key variables including Visible At-mospherically Resistant Index (VARI), Ratio Vegetation Index (RVI) and red-edge bands emerging as the most important predictors. To enhance contextual understanding and validate remote sensing outputs, we conducted PGIS sessions with gender-disaggregated community groups, capturing local perceptions of invasion hotspots and blocked access to grazing routes and water sources. The comparison of satellite-derived maps and PGIS outputs revealed strong spatial congruence, particularly along water bodies, roads, and croplands. Our findings demonstrate the potential of combining Earth observation and citizen science to generate actionable knowledge for managing invasive species in da-ta-scarce dryland environments. This hybrid framework supports inclusive and spatially targeted interventions for rangeland restoration and ecosystem resilience.
Keywords:
Prosopis juliflora
; rangeland degradation
; remote sensing
; machine learning
; artificial intelligence
; citizen science
; participatory GIS
1. Introduction
Across the rangelands of East Africa, pastoralists communities in both arid and semi-arid landscapes are grappling with a silent yet aggressive invader, Prosopis juliflora. A native to South and Central America, Prosopis juliflora was introduced to Eastern Africa in the early 1970s to combat desertification and fuel-wood shortages [1]. However, this fast growing species has since expanded uncontrollably [2]. It is a hardy drought-tolerant species with deep-roots and high tolerance to poor soils, allowing it to thrive in harsh environments [3]. It forms dense thickets with canopies which displace native vegetation, reduce biodiversity, alter soil chemistry and limit access to pasture and water resources. It has altered entire ecosystems, rendering critical grazing lands inaccessible [4]. In a country like Kenya, where livelihoods are deeply intertwined with seasonal mobility, rangeland access, and water availability, the spread of Prosopis juliflora poses a direct threat to food security and resilience.
Despite growing recognition of these impacts, efforts to monitor and manage Prosopis juliflora remain limited by the lack of up-to-date and spatially comprehensive data on its extent. Conventional ground surveys are expensive and time-consuming, while existing maps are often fragmented or outdated, undermining targeted response efforts. To support evidence-based intervention and restoration strategies, there is a growing need to accurately map and monitor its spread. The presence and accessibility of high-quality spatial data on invasive species spread is fundamental for informed decision making in arid and semi-arid systems. Advancements in remote sensing and machine learning offer promising avenues to detect and monitor invasive species over large areas, offering the potential for near real-time monitoring in hard-to-reach areas. Multi-sensor satellite platforms such as Sentinel-1, Sentinel-2, and PlanetScope provide data with varying spatial, spectral, and temporal resolutions that, when combined with classification algorithms like Random Forest, can improve detection accuracy. [5,6,7]. Machine learning models such as Random Forest, Support Vector Machine (SVM) and Gradient Boosting have demonstrated strong performance in vegetation classification tasks [8,9,10,11]. The integration of artificial intelligence (AI) and remote sensing in monitoring the invasion of Prosopis juliflora in Baringo County, Kenya, highlighted the Decision Tree/Random Forest classifier as the most effective model, achieving a 95% accuracy [12]. Sentinel-2 derived variables were used to assess the performance of species distribution models in modelling the distribution of Prosopis juliflora invasion [13]. Landsat-8 imagery and random forest classifier together with ground data were also utilized to map Prosopis juliflora in West Somaliland during the dry and wet season, with the best overall accuracy attained at 84% [14].
There is limited comparative research evaluating suitable sensors for Prosopis juliflora detection that have examined the potential of different satellites in modelling the distribution of Prosopis juliflora [15,16,17,18,19]. However, comparative studies on how different sensors perform in detecting Prosopis juliflora under semi-arid conditions remain rare. At the same time, invasive species are not experienced solely as ecological phenomena, rather, they shape and are shaped by social systems. For pastoralists, Prosopis juliflora undermines access to critical resources, changes mobility patterns, and increases vulnerability during dry seasons. These local experiences are difficult to detect from satellites alone. Yet, most research and monitoring efforts continue to overlook local knowledge and the role of affected communities in identifying, mapping, and managing invasion through citizen science. Participatory GIS (PGIS), a form of citizen science, offers a way to fill this gap by documenting community perceptions of Prosopis juliflora extent and impact, and by creating spatially explicit knowledge that can complement technical datasets. When integrated with remote sensing, PGIS not only enhances the accuracy and relevance of invasion maps but supports the co-production of knowledge, making detection frameworks more inclusive and actionable for targeted interventions in dryland pastoral systems.
Integrating community-derived spatial knowledge through Participatory GIS (PGIS) complements remote sensing by capturing localized impacts of Prosopis juliflora invasion, such as obstructed grazing routes, diminished water access, and seasonal mobility constraints that are not easily detectable via satellite imagery. PGIS offers a means to validate and contextualize model outputs, enhancing both the spatial accuracy and socio-ecological relevance of invasive species maps. This integration supports the co-production of knowledge through citizen science, making detection frameworks more actionable for targeted interventions in dryland pastoral systems. This study contributes to both the technical and participatory dimensions of invasive species management by combining satellite-based monitoring with community-driven mapping in Kenya’s drylands. Specifically, we address the gaps by (i) evaluating the comparative performance of Sentinel-1, Sentinel-2, and PlanetScope satellites in detecting Prosopis juliflora using Random Forest classification, and (ii) integrating participatory GIS (PGIS) mapping with local communities as a citizen science effort to capture the perceived extent and impact of the invasion. This combined approach offers a novel perspective by aligning technical classifications with lived experience and community-grounded spatial knowledge.
Our study aims to address the following research questions.
- How accurately can Sentinel-1, Sentinel-2, and PlanetScope satellite sensors detect and map Prosopis juliflora infestation using a Random Forest classifier?
- What is the spatial extent and perceived livelihood impact of Prosopis juliflora invasion, as identified through participatory GIS mapping with local pastoralist groups?
- What spatial patterns emerge when comparing satellite-derived maps of Prosopis juliflora with community-identified invasion areas through PGIS exercise?
By combining remote sensing and machine learning analytics with community-based spatial data, this study sought to generate spatially nuanced insights that can inform targeted restoration efforts and strengthen early detection systems for invasive species in fragile dryland ecosystems.
2. Materials and Methods
2.1. Study Area
The study was conducted in Baringo County, located within the Great Rift Valley system in Kenya (0°40′0″ N, 36°0′0″ E) (Figure 1). The county lies between Lake Baringo and Lake Bogoria to the South, with diverse environmental characteristics shaped by variations in altitude, climate and vegetation. The study area is situated in the Njemps Flats, a lowland plain with an elevation of 700 meters above sea, surrounded by the Tugen Hills and Elgeyo escarpment to the west and the ridges and plateaus of Lake Baringo catchment [20]. The region experiences a semi-arid climate, with temperatures ranging from 10 °C to 35 °C and a bimodal rainfall pattern of long rains between March to May and short rains from October to December, yielding between 300 to 700 mm in the lowlands and 1200 mm in the highlands [21]. Livelihoods are predominantly based on pastoralism and agro-pastoralism, making the region highly sensitive to land-use change and ecological degradation.
Prosopis juliflora has become a dominant plant species in the lowland regions, particularly around the mid-eastern and mid-western parts of Lake Baringo, extending southward toward the northern tip of Lake Bogoria. Global concerns regarding deforestation attributed to fuelwood shortages, prompted the introduction of Prosopis juliflora to the Lake Baringo area in the early 1980s, as a part of the Fuelwood Afforestation Extension Project, aimed at combating deforestation and fuelwood shortages in arid and semi-arid regions of Kenya [1]. However, it has since proliferated beyond its intended planting zones, with significant ecological and livelihood implications. The study focuses on the subregion (Figure 1) as it was among the initial introduction sites of Prosopis juliflora and remains highly invaded. Its biophysical heterogeneity, long invasion history, and socio-economic vulnerability make it a relevant landscape for assessing the accuracy of remote sensing-based invasion detection and for understanding the spatial dimensions of community-perceived impacts.
2.2. Data Collection
Field surveys were conducted in late February 2023 and early March 2025, with a total of 215 georeferenced points recorded, capturing both presence and absence data. The surveys were conducted during this dry season in this period, when the surrounding vegetation had withered due to the dry conditions prevalent in the region, however, Prosopis juliflora retained its greenness, facilitating its identification and mapping.
To understand the areas of significant intervention and the livelihoods adversely affected by Prosopis juliflora, we sought insights from community using PGIS. Participants were divided into two groups, comprising of men and women so as to capture the gendered perspectives. We generated an A0 paper map from Google Satellite images at the scale of 1:25,000. We then asked each group to identify and mark features in the community which have been lost or blocked due to Prosopis juliflora, including roads and water sources. We also asked them to indicate the areas of high and low invasion and livestock routes, along with roads and water sources blocked by Prosopis juliflora. We subsequently digitized the mapped information and systematically created a spatial digital representation of the identified regions.
2.3. Satellite Imagery Acquisition
We acquired satellite imagery data from Sentinel-1, Sentinel -2 and PlanetScope for February 2023 and 2025. Using the Google Earth Engine platform [22], we downloaded Level-2A surface reflectance products for Sentinel-1 and Sentinel-2 from the Copernicus Open Access Hub [23], while Planet Labs Inc. provided the PlanetScope imagery [24]. We selected images from February, the driest month, due to minimal cloud cover and the distinct spectral signature of Prosopis juliflora, which remains green while surrounding vegetation is typically senescent. The key characteristics of the satellite imagery used are summarized in Table 1.
2.4. Vegetation Indices
We derived various vegetation indices and spectral ratios from the satellite image bands, as summarized in Table 2. Specifically, we computed six indices from Sentinel-1 using single co-polarization (VV) and dual-band cross-polarization (VH) data. From Sentinel-2 and PlanetScope imagery, we extracted 23 and 14 vegetation indices respectively, to capture relevant spectral characteristics associated with Prosopis juliflora detection.
We selected these vegetation indices based on their capacity to capture distinct spectral characteristics associated with Prosopis juliflora. This species exhibits unique physiological traits, such as high chlorophyll content, distinctive leaf morphology, and water-use efficiency [25]. The selected indices use specific spectral bands from different satellite sensors to enhance the distinction of Prosopis from surrounding vegetation, estimate biomass, and minimize the influence of bare ground. Additionally, these indices strengthen spectral separability from other land cover types, leveraging their strengths in capturing variations in vegetation health, structure, and moisture content.
2.5. Data Analysis and Model Evaluation
We used the Random Forest machine learning classifier, which several studies have identified as a highly effective method for vegetation classification and invasive species detection [7,12,13,14,26]. We constructed the dataset using vegetation indices as predictor variables and defined the response variable (PresAbs) as a binary factor indicating the presence or absence of Prosopis juliflora. We partitioned the data derived from digitized training areas into two subsets, allocating 70% for model training and 30% for testing. To enhance generalizability and reduce variance, we trained the model using five-fold cross-validation with mtry set to 3 and ntree set to 700. We assessed model performance using a confusion matrix. Additionally, we conducted a variable importance analysis to identify the most influential spectral indices contributing to Prosopis juliflora detection across the different satellite sources. We performed spatial prediction by applying the trained Random Forest model using predict function [27] from the base R stats package [28] to the raster stack of indices to generate predicted presence and over laid the resulting presence map with land cover data. This predictive map served to complement the participatory GIS outputs by providing a data-driven spatial layer.
3. Results
3.1. Accuracy Assessment
3.1.1. Accuracy Assessment of the Random Forest Model Results
Sentinel-2 outperformed Sentinel-1 and Planetscope in in accurately classifying Prosopis juliflora presence, presented in Table 3. The Sentinel-2 variables yielded the highest overall accuracy (90.65%) and a Cohen’s Kappa coefficient of 0.78, demonstrating strong agreement between predicted and actual classifications. The statistically significant McNemar’s test p-value for Sentinel-2, suggests meaningful differences between predicted and actual classifications, underscoring the model’s improved predictive performance. In contrast, PlanetScope produced slightly lower results than Sentinel-1 and showed the weakest agreement (Kappa 0.403), reflecting challenges in correctly identifying negative cases. Overall, Sentinel-2 demonstrated the most reliable performance, reinforcing its suitability for detecting Prosopis juliflora presence.
We further evaluated the performance of Sentinel-2 with the Random Forest model using the Receiver Operating Characteristic (ROC) curve, which illustrates the trade-off between sensitivity and specificity. The model achieved a ROC value of 0.94, indicating excellent discrimination between presence and absence of Prosopis juliflora (Figure 2). This high AUC value confirms the robustness and reliability of sentinel-2 in predicting the presence of the invasive species in the study area.
3.1.2. Variable Importance
Given that Sentinel-2 achieved the highest classification accuracy, we identified and analyzed the spectral variables that contributed most significantly to the detection of Prosopis juliflora. The variable importance plot for Sentinel-2 (Figure 3) indicates the most influential spectral features, including Visible Atmospherically Resistant Index (VARI), Green Ratio (GR), Ratio Vegetation Index (RVI), Normalized difference of alternate spectral bands (NDI5S2), Dead Fuel Index (DFI), as well as several raw spectral bands such as B8A, B4, B11, B2 and B12. These findings highlight the importance of both raw reflectance values and derived indices in enhancing species detection. The prominence of red-edge and near infrared (NIR) bands highlights the ability of Sentinel 2 to distinguish vegetation from non-vegetated features due to their sensitivity to chlorophyll concentration and leaf structure. Indices like VARI and RVI amplify the spectral signal by emphasizing plant vigor and greenness, thereby improving differentiation of Prosopis juliflora from other land cover types. By employing specific band ratios that capture the key physiological traits of vegetation, these indices outperform the interpretability of single bands alone [29]. The combination of high spectral and temporal resolution positions Sentinel-2 as a powerful sensor for detecting Prosopis juliflora, particularly when leveraging both raw spectral bands and vegetation indices tailored to vegetation characteristics.
3.2. Participatory Geographical Information Systems (GIS)
We conducted participatory GIS sessions separately with men’s and women’s groups to explore spatial knowledge, perceptions, and lived experiences related to Prosopis juliflora invasion (Figure 4). Both groups actively engaged in the mapping exercise, however, their perspectives differed significantly, reflecting gendered specific roles, responsibilities and interactions with the landscape. Men demonstrated extensive spatial awareness of Prosopis juliflora presence along livestock routes, distance grazing areas and roads. Their discussions primarily focused on impacts of Prosopis on livestock movement, blocked water access points for animals and degradation of rangelands. Some male participants recognized the importance of Prosopis juliflora as a livestock feed during the dry season, source of charcoal and live fencing. They also recognized the ecosystem level benefits including soil stabilization, reduced sandstorms, ecosystem restoration and a cooler microclimate around Lake Baringo.
Women demonstrated detailed grounded knowledge around their immediate surroundings and household environment. Their discussions focused on the domestic challenges posed by Prosopis juliflora, including restricted access to water and physical safety risks from plant’s sharp thorns. They also raised strong concerns on the health impacts, particularly eye irritation caused by the smoke when using Prosopis juliflora as firewood. Both men and women recognized the widespread and increasing dominance of Prosopis juliflora across the landscape. While they recognized its value as a source of livestock feed and fuel, they emphasized that its uncontrolled spread has disrupted their daily livelihoods. These insights underscore the need for integrated, gender-responsive management strategies that address both the ecological and socio-economic dimensions of the invasion.
By combining participatory GIS with gender-disaggregated discussions, we gained valuable insights into the spatial distribution and socio-economic impacts of invasive species [30]. Prosopis juliflora intersects with community livelihoods in complex and multifaceted ways, highlighting the importance of integrating diverse knowledge systems into environmental decision-making processes.
The community members identified the areas of high and low Prosopis juliflora invasion, as well as water sources and roads blocked by the invasive species. The digitized maps (Figure 4) reflect their inputs, revealing the highest invasions occurred along the edges of Lake Baringo and other water bodies, with water pans and rivers being particularly affected. The satellite imagery (Figure 5) further illustrates a water source, identified by the community, in the participatory maps, that has been encroached upon by Prosopis juliflora.
3.3. Predicted Presence and Absence of Prosopis juliflora
We generated the spatial prediction of Prosopis juliflora presence and absence using the predict function in R based on Random Forest model [27]. The resulting binary map (Figure 6) indicates the predicted presence areas. We developed this predictive map to complement and validate the areas that the community identified invasion zones captured through participatory mapping (Figure 5). The spatial distribution of predicted Prosopis juliflora presence reveals clustered patterns particularly around roads and waterbodies. This clustering reflects the species’ dispersal dynamics which are strongly influenced by anthropogenic disturbance and hydrological pathways. Predicted presence areas closely align with community-identified invasion hotpots, reinforcing the validity of the model outputs. These predictions offer a valuable spatial reference for prioritizing targeted management interventions.
This demonstrates the model’s effectiveness in capturing the spatial patterns associated with the target variable. The map of predicted probabilities (Figure 6) revealed clear spatial heterogeneity, highlighting the hotspots of Prosopis juliflora occurrence. This spatial output provides valuable insights for identifying priority areas for monitoring and guiding targeted management interventions. Applying a classification threshold of 0.5 produced strong performance metrics, including a precision of 0.908, indicating high accuracy in identifying true presence events, presented in Table 4.
We also analyzed the monthly NDVI profiles for 2023 to assess temporal patterns across land cover types (Figure 7). The forest area had the highest NDVI consistently through the year, ranging between 0.68 and 0.86. Prosopis juliflora maintained relatively stable NDVI values between 0.53 and 0.7, reflecting its persistent greenness and sustained photosynthetically active even during the dry months of January and February. Shrublands had moderate NDVI values, ranging between 0.18 and 0.5, with slight greening observed during the rainy season. As expected, water bodies consistently produced negative NDVI values, ranging from –0.52 to –0.3, due to their non-vegetative surfaces. Compared to other vegetation types, Prosopis juliflora exhibited less seasonal fluctuation compared to other vegetation types, indicating their invasive resilience and potential to outcompete native species in arid and semi-arid environments.
By overlaying the predicted Prosopis juliflora presence map with land cover data we identified a strong association between the invasive species and specific land cover types, particularly waterbodies, croplands and grasslands (Figure 8). These areas are critical in supporting local livelihoods, providing essential resources such as water, pasture and food. This invasion by Prosopis juliflora leads to the degradation of rangeland ecosystems, as the altered ecosystems are unable to sustain their ecological functions and support community livelihoods. It also leads to a decline in forage availability, threatening food security and households dependent on rangeland systems. Over time, this degradation leads to ecological vulnerability and reduces the resilience of communities reliant on these ecosystems.
4. Discussion
Effectively managing the spread of Prosopis juliflora requires accurate, high-resolution spatial information, given the species' profound impacts on both livelihoods and ecosystem functioning in dryland regions. In this study, Sentinel-2 satellite has emerged as the most effective sensor for detecting Prosopis juliflora invasion, delivering high classification accuracy, among the tested platforms. Its superior performance can be attributed to its rich spectral detail, particularly in the red-edge and near-infrared regions, which enhances its sensitivity to vegetation traits such as chlorophyll content and canopy structure. The high sensitivity of Sentinel-2 demonstrates its effectiveness in accurately detecting invaded areas. Key vegetation indices including VARI, RVI and GR ranked among the most important predictors underscoring the advantage of combining raw spectral bands with derived indices for improved detection of invasive species. These results align with prior studies that emphasize the role of spectral indices in strengthening species discrimination [13,32,33]. While previous research identified NDVI and GNDVI as effective indicators for Prosopis detection ([34,35], our findings did not rank these indices among the top predictors, possibly due to their lower specificity for this species in mixed land cover conditions. NDVI-based analysis effectively captures general vegetation dynamics. However, it may lack the specificity required to fully distinguish Prosopis juliflora from native vegetation species [13,14]. In contrast Planetscope and Sentinel-1 demonstrated comparatively lower classification performance. Despite PlanetScope’s finer spatial resolution and Sentinel-1’s ability to capture structural information through radar backscatter, both sensors fell short in capturing the spectral complexity required to differentiate Prosopis juliflora from surrounding vegetation. The findings highlight the critical importance of matching sensor capabilities to the spectral and structural attributes of the target species when designing remote sensing-based monitoring strategies.
By incorporating community perspectives into the analysis, we identified a strong spatial agreement between predicted Prosopis juliflora presence and areas that local residents recognized as invaded. This step was essential not only for validating satellite-based predictions but also for capturing ground-level realities that remote sensing alone cannot fully represent [36] and vice versa where only self-reporting is not enough [37]. Community members detailed the species’ adverse impacts on critical livelihood resources, including grazing lands, water sources, and roads, which have significantly disrupted their daily activities. At the same time, they acknowledged the perceived benefits of Prosopis juliflora, such as its use as fuelwood, its role in moderating microclimates, and its value as a supplementary feed during dry seasons. However, they also highlighted its negative effects, particularly digestive issues in livestock and its encroachment on water bodies and agricultural lands. These insights reveal the nuanced and often contradictory relationship between rural communities and invasive species, where ecological harm coexists with socio-economic utility [38,39].
Integrating this gender-disaggregated local knowledge adds a critical socio-ecological dimension to the study, setting it apart from prior remote sensing efforts that often rely solely on biophysical data. This approach not only enhances the credibility of the spatial predictions but also ensures that management interventions are grounded in the lived experiences and priorities of those most affected. By bridging advanced ecological modelling with participatory spatial knowledge rooted in citizen science, the study offers a more holistic framework for addressing invasive species in complex human-environment systems using citizen science.
The spatial prediction maps effectively identified Prosopis juliflora-invaded areas and revealed a distinct pattern of clustered invasions, particularly along roads, water bodies, and grazing corridors. This spatial distribution reflects natural and anthropogenic mechanisms of seed dispersal with livestock movement, water flow and human activities, acting as key facilitators of the species’ spread. Integrating predictive modelling with PGIS data significantly enhanced the reliability and contextual relevance of invasion mapping by aligning remote sensing outputs with community-level observations. The NDVI time-series analysis further reinforced the invasive resilience of Prosopis juliflora, highlighting its ability to maintain consistent photosynthetic activity and greenness throughout the year even during the dry season, unlike native vegetation that typically senesces under moisture stress [40,41]. This physiological advantage enables Prosopis juliflora to outcompete indigenous species and expand aggressively in arid and semi-arid environments. Notably, the dry season provides optimal conditions for detecting Prosopis juliflora via satellite imagery, as its persistent greenness contrasts sharply with the surrounding withered vegetation [12]. The ability of Prosopis juliflora to thrive year-round underscores its long-term ecological implications, including biodiversity loss, reduced rangeland productivity, and diminished water availability.
5. Conclusions
The study highlights the importance of integrating satellite remote sensing with machine learning to enhance the detection and mapping of Prosopis juliflora in semi-arid landscapes. Sentinel-2 exhibited a higher accuracy due to its rich spectral resolution and the effectiveness of derived vegetation indices, compared to PlanetScope and Sentinel-1, reflecting their limitations in spectral sensitivity and structural discrimination. Incorporating community perspectives captured through gender-disaggregated participatory GIS provided valuable contextual insights that complemented and validated the remote sensing output. Local knowledge on the spatial extent and impacts of Prosopis juliflora offered a nuanced understanding of its socio-ecological implications, highlighting aspects often overlooked by remote sensing alone. Our study also revealed using NDVI time-series analysis that Prosopis juliflora maintains stable greenness throughout the year, even during dry seasons, underscoring its invasive resilience and competitive advantage in water-limited environments. This phenological trait enhances its detectability using satellite imagery and contributes to its dominance over native vegetation. The satellite based remote analysis coupled with machine learning models and community insights offers a robust framework for supporting targeted management interventions and prioritizing control efforts. The study contributes to advancing remote sensing methodologies and citizen science application for invasive species monitoring and emphasizes the importance of co-producing knowledge with affected communities. Future work should further explore the integration of multi-sensor data to address the complexities of heterogenous landscapes and mixed vegetation types, thereby improving detection accuracy and operational scalability.
Author Contributions
Conceptualization, A.P.; Data collection, F.C. and D.G.; writing-original draft, F.C.; analysis, F.C. and A.P.; writing-review, D.G., R.D., A.W. and A.P.; editing, D.G., R.D., A.W. and A.P.; investigation A.P.; methodology, A.P. All authors have read and agreed to the published version of the manuscript.
Funding
This research received no external funding.
Data Availability Statement
The data that supports the findings of this study are available from the corresponding author (A.P) upon reasonable request.
Acknowledgments
We would like to thank CGIAR Science Programmes - Accelerator for Digital Transformation (DTA) and Sustainable Animal and Aquatic Foods (SAAF) for supporting this work.
Conflicts of Interest
The authors declare no conflicts of interest.
References
- Mwangi, E.; Swallow, B. Prosopis Juliflora Invasion and Rural Livelihoods in the Lake Baringo Area of Kenya. Conservation and Society 2008, 6, 130. [Google Scholar] [CrossRef]
- Mungoche, J.; Wasonga, O.V.; Ikiror, D.; Akala, H.; Gachuiri, C.; Gitau, G. Prosopis Juliflora in the Drylands: A Review of Invasion, Impacts and Management in Eastern Africa. Sustainable Environment 2025, 11. [Google Scholar] [CrossRef]
- Walsh, S.J. Multi-Scale Remote Sensing of Introduced and Invasive Species: An Overview of Approaches and Perspectives. In Understanding Invasive Species in the Galapagos Islands; Torres, M.D.L., Mena, C.F., Eds.; Social and Ecological Interactions in the Galapagos Islands; Springer International Publishing: Cham, 2018; pp. 143–154. ISBN 978-3-319-67176-5. [Google Scholar]
- Degefu, M.A.; Assen, M.; Few, R.; Tebboth, M. Performance of Management Interventions to the Impacts of Prosopis Juliflora in Arid and Semiarid Regions of the Middle Awash Valley, Ethiopia. Glob. J. Agric. Innov. Res. Dev 2022, 9, 35–53. [Google Scholar] [CrossRef]
- Royimani, L.; Mutanga, O.; Odindi, J.; Dube, T.; Matongera, T.N. Advancements in Satellite Remote Sensing for Mapping and Monitoring of Alien Invasive Plant Species (AIPs). Physics and Chemistry of the Earth, Parts A/B/C 2019, 112, 237–245. [Google Scholar] [CrossRef]
- Villalobos Perna, P.; Di Febbraro, M.; Carranza, M.L.; Marzialetti, F.; Innangi, M. Remote Sensing and Invasive Plants in Coastal Ecosystems: What We Know So Far and Future Prospects. Land 2023, 12, 341. [Google Scholar] [CrossRef]
- Zaka, M.M.; Samat, A. Advances in Remote Sensing and Machine Learning Methods for Invasive Plants Study: A Comprehensive Review. Remote Sensing 2024, 16, 3781. [Google Scholar] [CrossRef]
- McCarty, D.A.; Kim, H.W.; Lee, H.K. Evaluation of Light Gradient Boosted Machine Learning Technique in Large Scale Land Use and Land Cover Classification. Environments 2020, 7, 84. [Google Scholar] [CrossRef]
- Savitha, C.; Talari, R. Evaluating the Performance of Random Forest, Support Vector Machine, Gradient Tree Boost, and CART for Improved Crop-Type Monitoring Using Greenest Pixel Composite in Google Earth Engine. Environ Monit Assess 2025, 197, 437. [Google Scholar] [CrossRef] [PubMed]
- Sheykhmousa, M.; Mahdianpari, M.; Ghanbari, H.; Mohammadimanesh, F.; Ghamisi, P.; Homayouni, S. Support Vector Machine Versus Random Forest for Remote Sensing Image Classification: A Meta-Analysis and Systematic Review. IEEE J. Sel. Top. Appl. Earth Observations Remote Sensing 2020, 13, 6308–6325. [Google Scholar] [CrossRef]
- Zhang, H.; Eziz, A.; Xiao, J.; Tao, S.; Wang, S.; Tang, Z.; Zhu, J.; Fang, J. High-Resolution Vegetation Mapping Using eXtreme Gradient Boosting Based on Extensive Features. Remote Sensing 2019, 11, 1505. [Google Scholar] [CrossRef]
- Paliwal, A.; Mhelezi, M.; Galgallo, D.; Banerjee, R.; Malicha, W.; Whitbread, A. Utilizing Artificial Intelligence and Remote Sensing to Detect Prosopis Juliflora Invasion: Environmental Drivers and Community Insights in Rangelands of Kenya. Plants 2024, 13, 1868. [Google Scholar] [CrossRef] [PubMed]
- Ahmed, N.; Atzberger, C.; Zewdie, W. Species Distribution Modelling Performance and Its Implication for Sentinel-2-Based Prediction of Invasive Prosopis Juliflora in Lower Awash River Basin, Ethiopia. Ecol Process 2021, 10, 18. [Google Scholar] [CrossRef]
- Meroni, M.; Ng, W.; Rembold, F.; Leonardi, U.; Atzberger, C.; Gadain, H.; Shaiye, M. Mapping Prosopis Juliflora in West Somaliland with Landsat 8 Satellite Imagery and Ground Information. Land Degrad Dev 2017, 28, 494–506. [Google Scholar] [CrossRef]
- Gunawardena, A.R.; Fernando, T.T.; Nissanka, S.P.; Dayawansa, N.D.K. Assessment of Spatial Distribution and Estimation of Biomass of Prosopis Juliflora (Sw.) DC. in Puttlam to Mannar Region of Sri Lanka Using Remote Sensing and GIS. Trop. Agric. Res. 2015, 25, 228. [Google Scholar] [CrossRef]
- Ng, W.-T.; Rima, P.; Einzmann, K.; Immitzer, M.; Atzberger, C.; Eckert, S. Assessing the Potential of Sentinel-2 and Pléiades Data for the Detection of Prosopis and Vachellia Spp. in Kenya. Remote Sensing 2017, 9, 74. [Google Scholar] [CrossRef]
- Wakie, T.T.; Evangelista, P.H.; Jarnevich, C.S.; Laituri, M. Mapping Current and Potential Distribution of Non-Native Prosopis Juliflora in the Afar Region of Ethiopia. PLoS ONE 2014, 9, e112854. [Google Scholar] [CrossRef]
- Zagajewski, B.; Kluczek, M.; Zdunek, K.B.; Holland, D. Sentinel-2 versus PlanetScope Images for Goldenrod Invasive Plant Species Mapping. Remote Sensing 2024, 16, 636. [Google Scholar] [CrossRef]
- Ahmed, N.; Zewdie, W. Modeling Invasive Prosopis Juliflora Distribution Using the Newly Launched Ethiopian Remote Sensing Satellite-1 (ETRSS-1) in the Lower Awash River Basin, Ethiopia. In Applications of Remote Sensing; IntechOpen, 2023; ISBN 978-1-83769-634-5. [Google Scholar]
- Mbaabu, P.R.; Ng, W.-T.; Schaffner, U.; Gichaba, M.; Olago, D.; Choge, S.; Oriaso, S.; Eckert, S. Spatial Evolution of Prosopis Invasion and Its Effects on LULC and Livelihoods in Baringo, Kenya. Remote Sensing 2019, 11, 1217. [Google Scholar] [CrossRef]
- Ochieng, R.; Recha, C.; Bebe, B.O.; Ogendi, G.M. Rainfall Variability and Droughts in the Drylands of Baringo County, Kenya. OALib 2017, 04, 1–15. [Google Scholar] [CrossRef]
- Gorelick, N.; Hancher, M.; Dixon, M.; Ilyushchenko, S.; Thau, D.; Moore, R. Google Earth Engine: Planetary-Scale Geospatial Analysis for Everyone. Remote Sensing of Environment 2017, 202, 18–27. [Google Scholar] [CrossRef]
- European Space Agency (ESA) Copernicus Sentinel-1 and Sentinel-2 Level-2A Surface Reflectance Data 2025.
- Planet Labs Inc., PlanetScope Imagery. 2025.
- Hussain, M.I.; El-Keblawy, A.; Mitterand Tsombou, F. Leaf Age, Canopy Position, and Habitat Affect the Carbon Isotope Discrimination and Water-Use Efficiency in Three C3 Leguminous Prosopis Species from a Hyper-Arid Climate. Plants 2019, 8, 402. [Google Scholar] [CrossRef]
- Shiferaw, H.; Bewket, W.; Eckert, S. Performances of Machine Learning Algorithms for Mapping Fractional Cover of an Invasive Plant Species in a Dryland Ecosystem. Ecology and Evolution 2019, 9, 2562–2574. [Google Scholar] [CrossRef] [PubMed]
- Chambers, J.M.; Hastie, T.J. (Eds.) Statistical Models in S, 1st ed.; Routledge, 2017; ISBN 978-0-203-73853-5. [Google Scholar]
- R Core Team R: A Language and Environment for Statistical Computing; R Foundation for Statistical Computing. 2024.
- Xue, J.; Su, B. Significant Remote Sensing Vegetation Indices: A Review of Developments and Applications. Journal of Sensors 2017, 2017, 1–17. [Google Scholar] [CrossRef]
- Luigi Nimis, P.; Pittao, E.; Altobelli, A.; De Pascalis, F.; Laganis, J.; Martellos, S. Mapping Invasive Plants with Citizen Science. A Case Study from Trieste (NE Italy). Plant Biosystems - An International Journal Dealing with all Aspects of Plant Biology 2019, 153, 700–709. [Google Scholar] [CrossRef]
- Brown, C.F.; Brumby, S.P.; Guzder-Williams, B.; Birch, T.; Hyde, S.B.; Mazzariello, J.; Czerwinski, W.; Pasquarella, V.J.; Haertel, R.; Ilyushchenko, S.; et al. Dynamic World, Near Real-Time Global 10 m Land Use Land Cover Mapping. Sci Data 2022, 9, 251. [Google Scholar] [CrossRef]
- Iqbal, I.M.; Balzter, H.; Firdaus-e-Bareen; Shabbir, A. Identifying the Spectral Signatures of Invasive and Native Plant Species in Two Protected Areas of Pakistan through Field Spectroscopy. Remote Sensing 2021, 13, 4009. [Google Scholar] [CrossRef]
- Ouma, Y.O.; Gabasiane, T.G.; Nkhwanana, N. Mapping Prosopis L. (Mesquites) Using Sentinel-2 MSI Satellite Data, NDVI and SVI Spectral Indices with Maximum-Likelihood and Random Forest Classifiers. Journal of Sensors 2023, 2023, 8882730. [Google Scholar] [CrossRef]
- Bhaveshkumar, K.I.; Sharma, L.K.; Verma, R.K. Applicability of Phenological Indices for Mapping of Understory Invasive Species Using Machine Learning Algorithms. Biol Invasions 2024, 26, 2901–2921. [Google Scholar] [CrossRef]
- Mallmann, C.L.; Zaninni, A.F.; Filho, W.P. Vegetation Index Based In Unmanned Aerial Vehicle (Uav) To Improve The Management Of Invasive Plants In Protected Areas, Southern Brazil. In Proceedings of the 2020 IEEE Latin American GRSS & ISPRS Remote Sensing Conference (LAGIRS); IEEE: Santiago, Chile, March 2020; pp. 66–69. [Google Scholar]
- Van Etten, J.; De Sousa, K.; Aguilar, A.; Barrios, M.; Coto, A.; Dell’Acqua, M.; Fadda, C.; Gebrehawaryat, Y.; Van De Gevel, J.; Gupta, A.; et al. Crop Variety Management for Climate Adaptation Supported by Citizen Science. Proc. Natl. Acad. Sci. U.S.A 2019, 116, 4194–4199. [Google Scholar] [CrossRef]
- Paliwal, A.; Jain, M. The Accuracy of Self-Reported Crop Yield Estimates and Their Ability to Train Remote Sensing Algorithms. Front. Sustain. Food Syst. 2020, 4, 25. [Google Scholar] [CrossRef]
- Reynolds, C.; Venter, N.; Cowie, B.W.; Marlin, D.; Mayonde, S.; Tocco, C.; Byrne, M.J. Mapping the Socio-Ecological Impacts of Invasive Plants in South Africa: Are Poorer Households with High Ecosystem Service Use Most at Risk? Ecosystem Services 2020, 42, 101075. [Google Scholar] [CrossRef]
- Shackleton, R.T.; Shackleton, C.M.; Kull, C.A. The Role of Invasive Alien Species in Shaping Local Livelihoods and Human Well-Being: A Review. Journal of Environmental Management 2019, 229, 145–157. [Google Scholar] [CrossRef] [PubMed]
- Hussain, M.I.; Shackleton, R.; El-Keblawy, A.; González, L.; Trigo, M.M. Impact of the Invasive Prosopis Juliflora on Terrestrial Ecosystems. In Sustainable Agriculture Reviews 52; Lichtfouse, E., Ed.; Sustainable Agriculture Reviews; Springer International Publishing: Cham, 2021; Vol. 52, pp. 223–278. ISBN 978-3-030-73244-8. [Google Scholar]
- Rajak, P.; Afreen, T.; Raghubanshi, A.S.; Singh, H. Rainfall Fluctuation Causes the Invasive Plant Prosopis Juliflora to Adapt Ecophysiologically and Change Phenotypically. Environ Monit Assess 2024, 197, 26. [Google Scholar] [CrossRef] [PubMed]
Figure 1.
A map of study area in Baringo county, showing collected presence and absence points of Prosopis juliflora from field.
Figure 1.
A map of study area in Baringo county, showing collected presence and absence points of Prosopis juliflora from field.
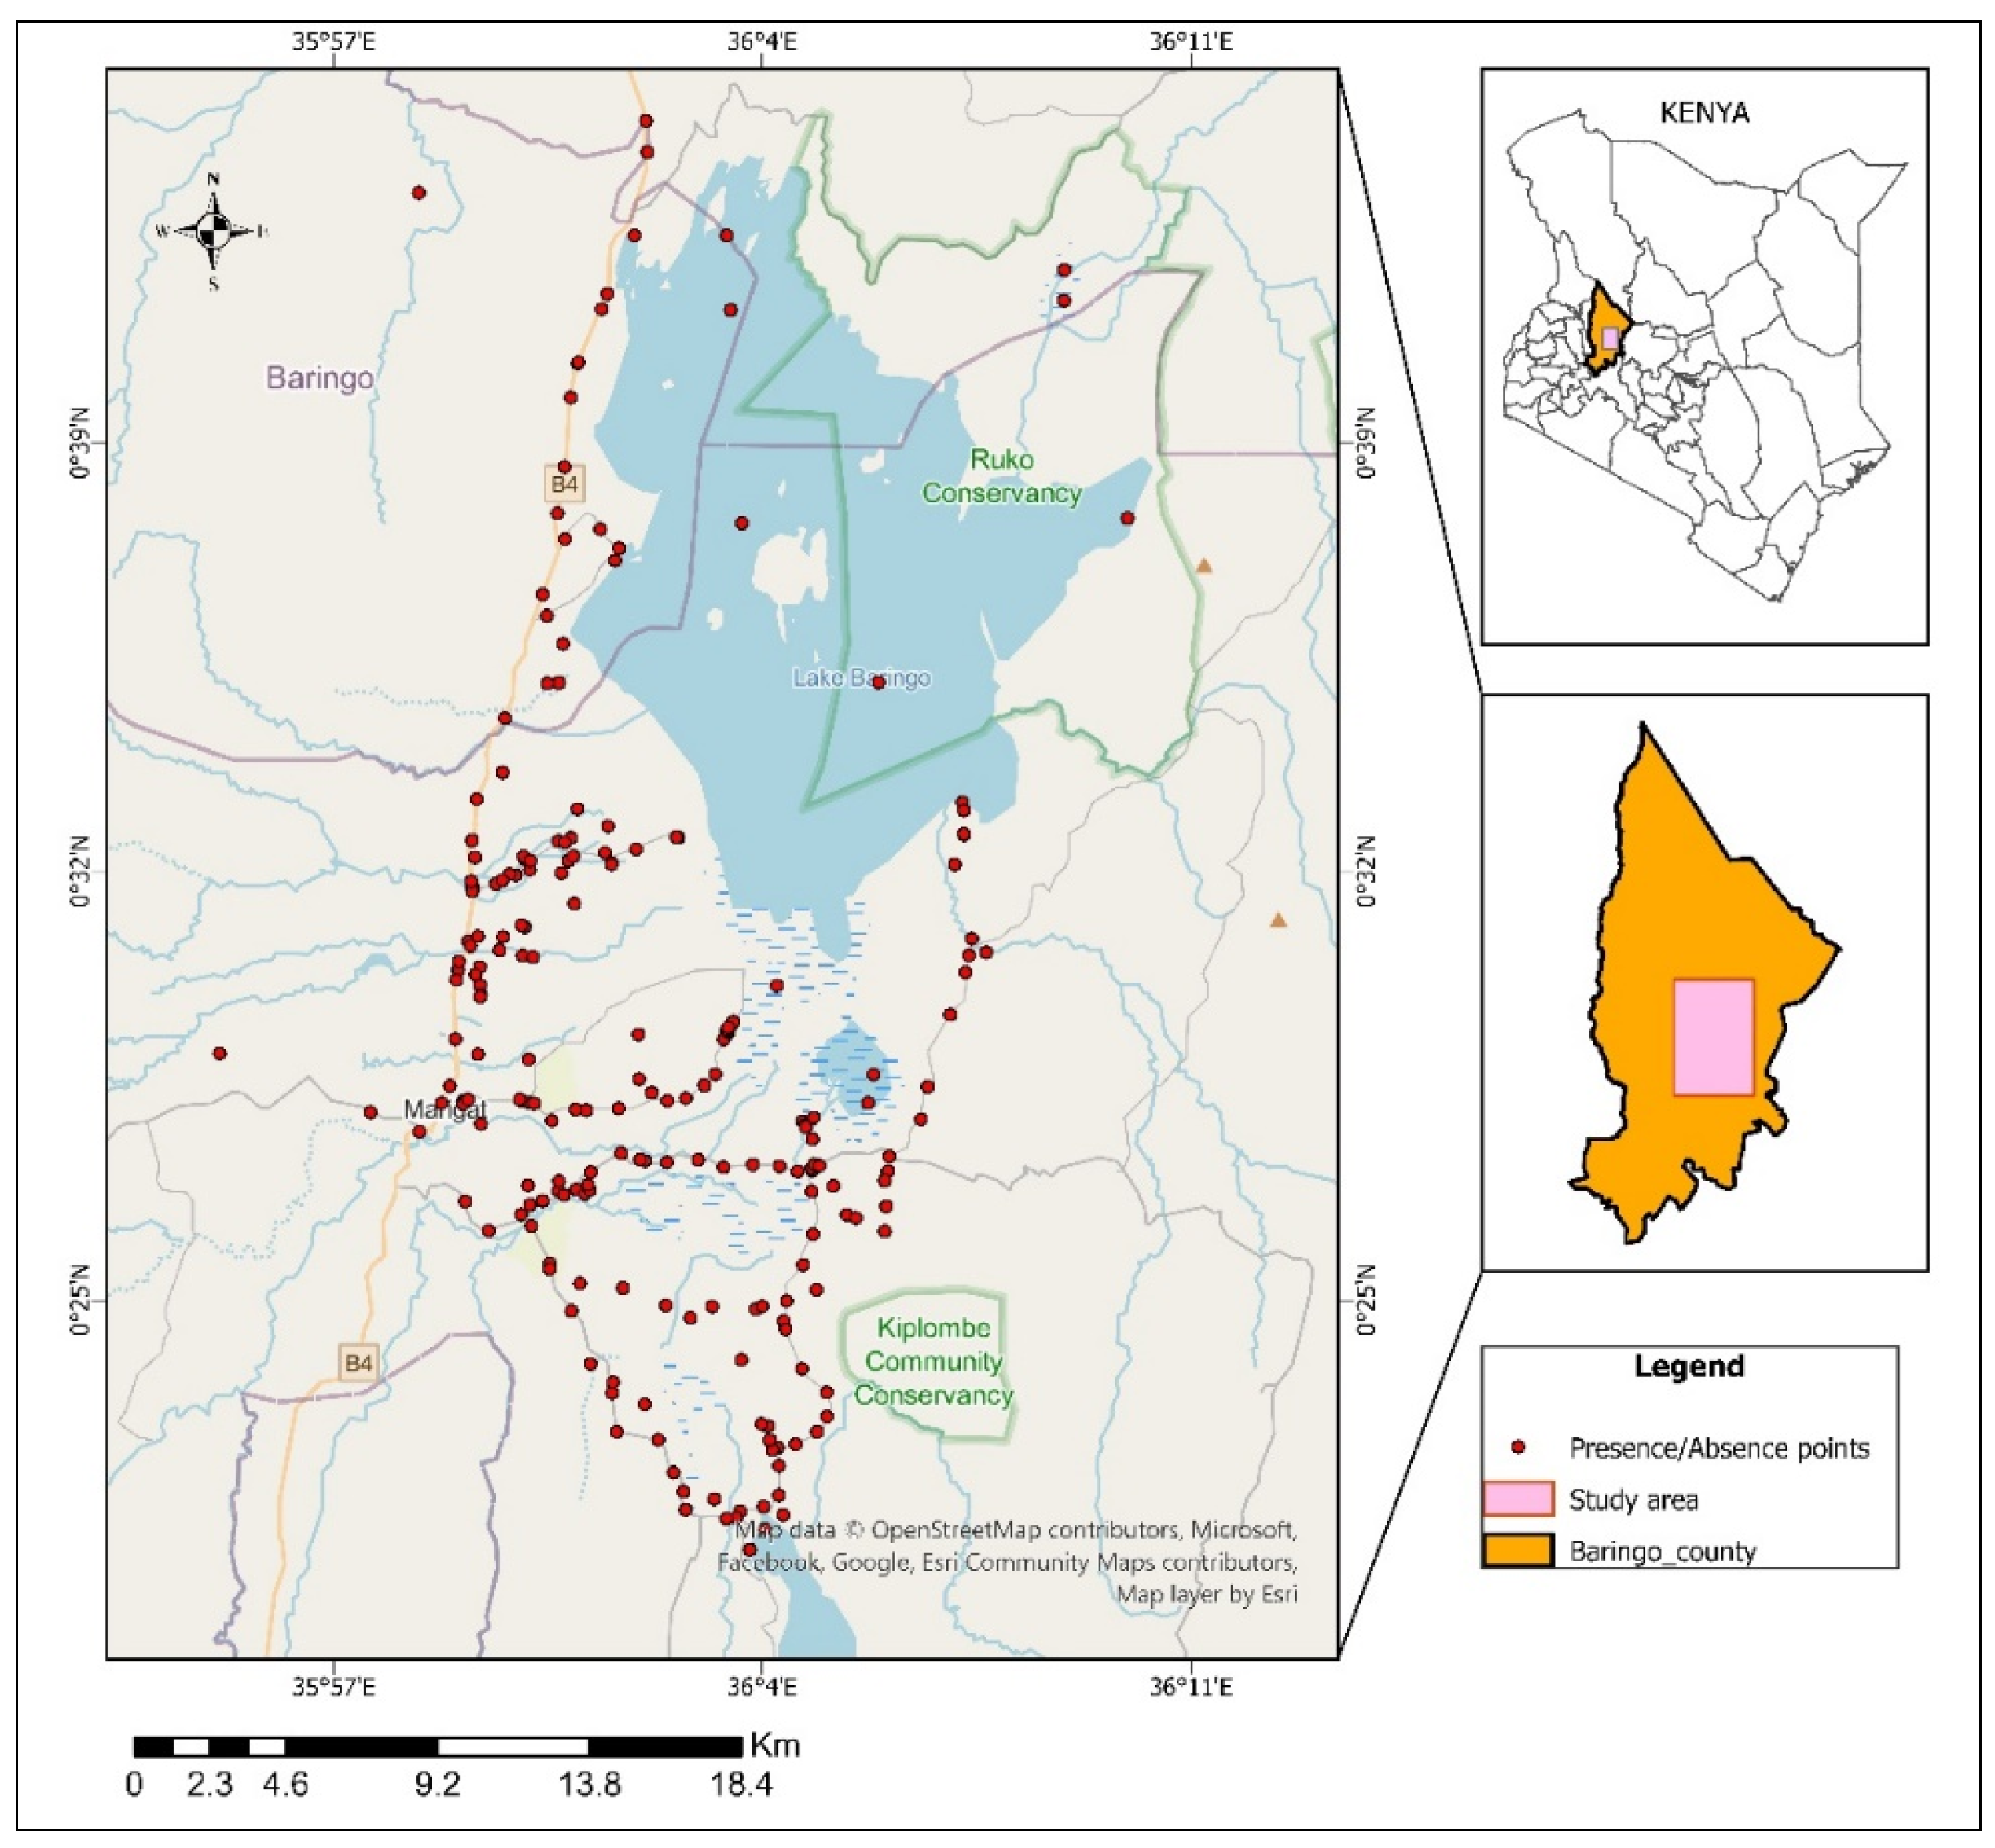
Figure 2.
ROC curve for Sentinel-2 data.
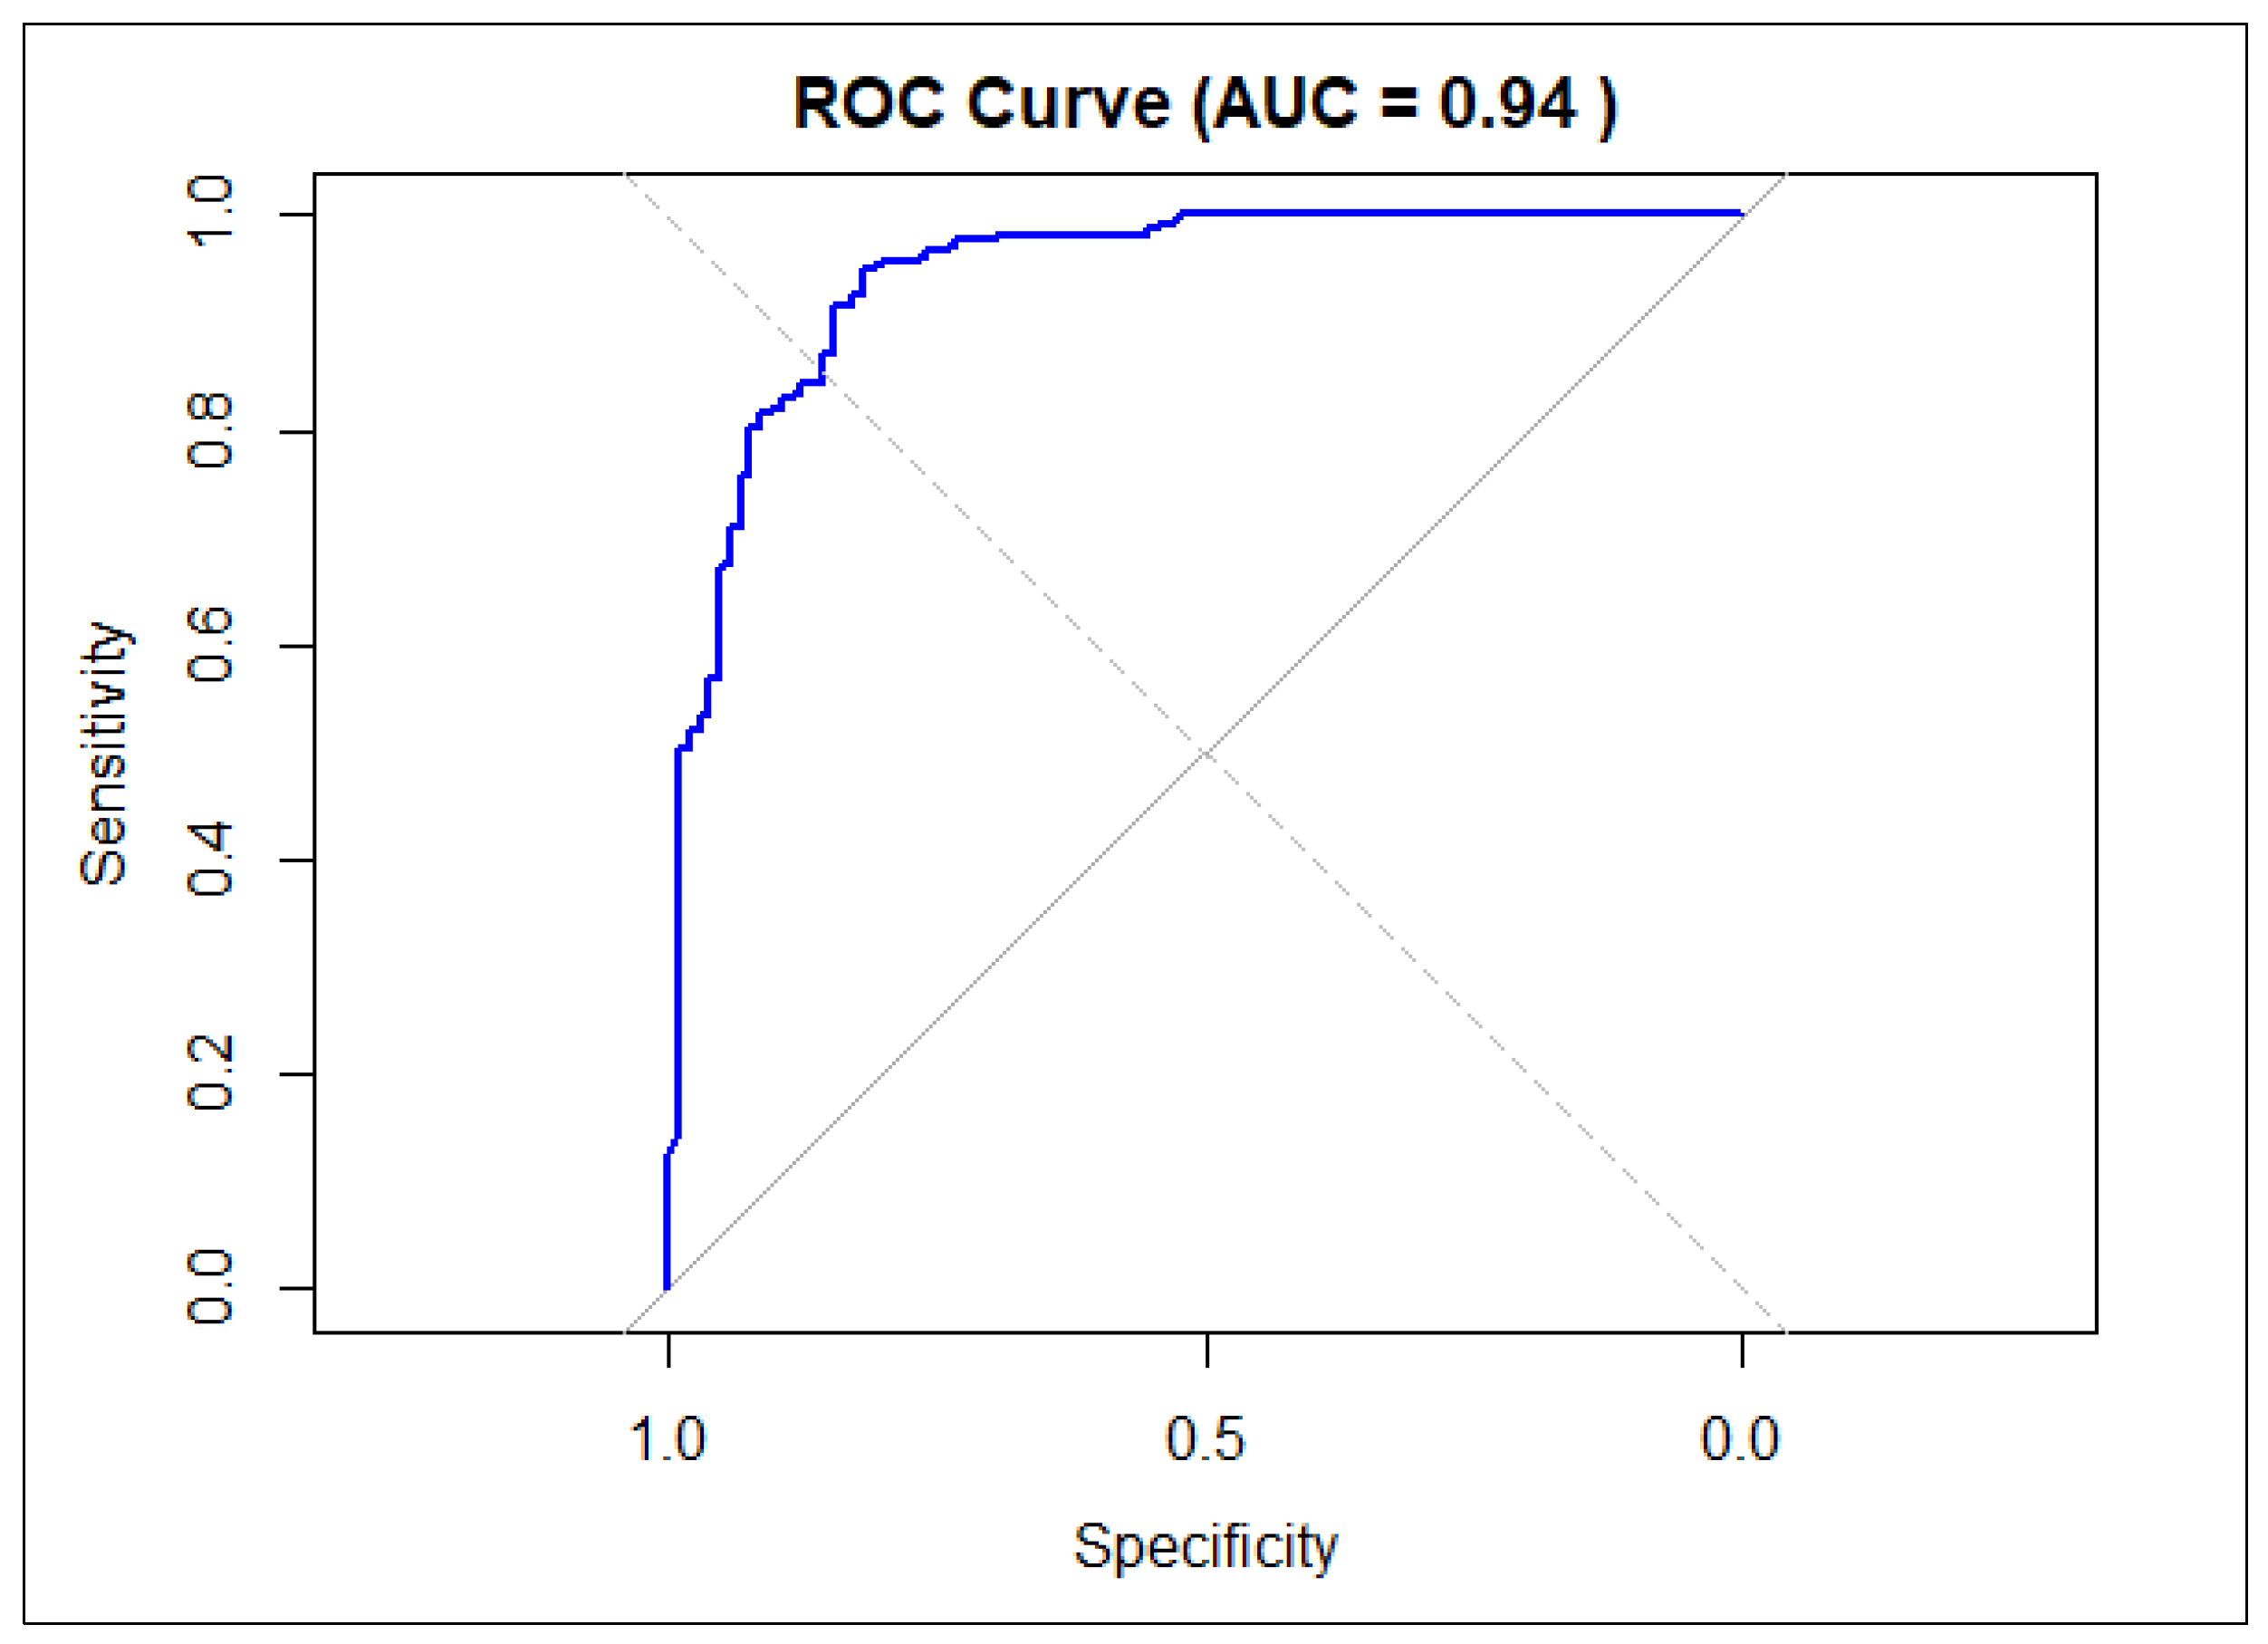
Figure 3.
The 20 most important indices/bands from Sentinel-2 images that contributed most significantly to the detection of Prosopis juliflora.
Figure 3.
The 20 most important indices/bands from Sentinel-2 images that contributed most significantly to the detection of Prosopis juliflora.
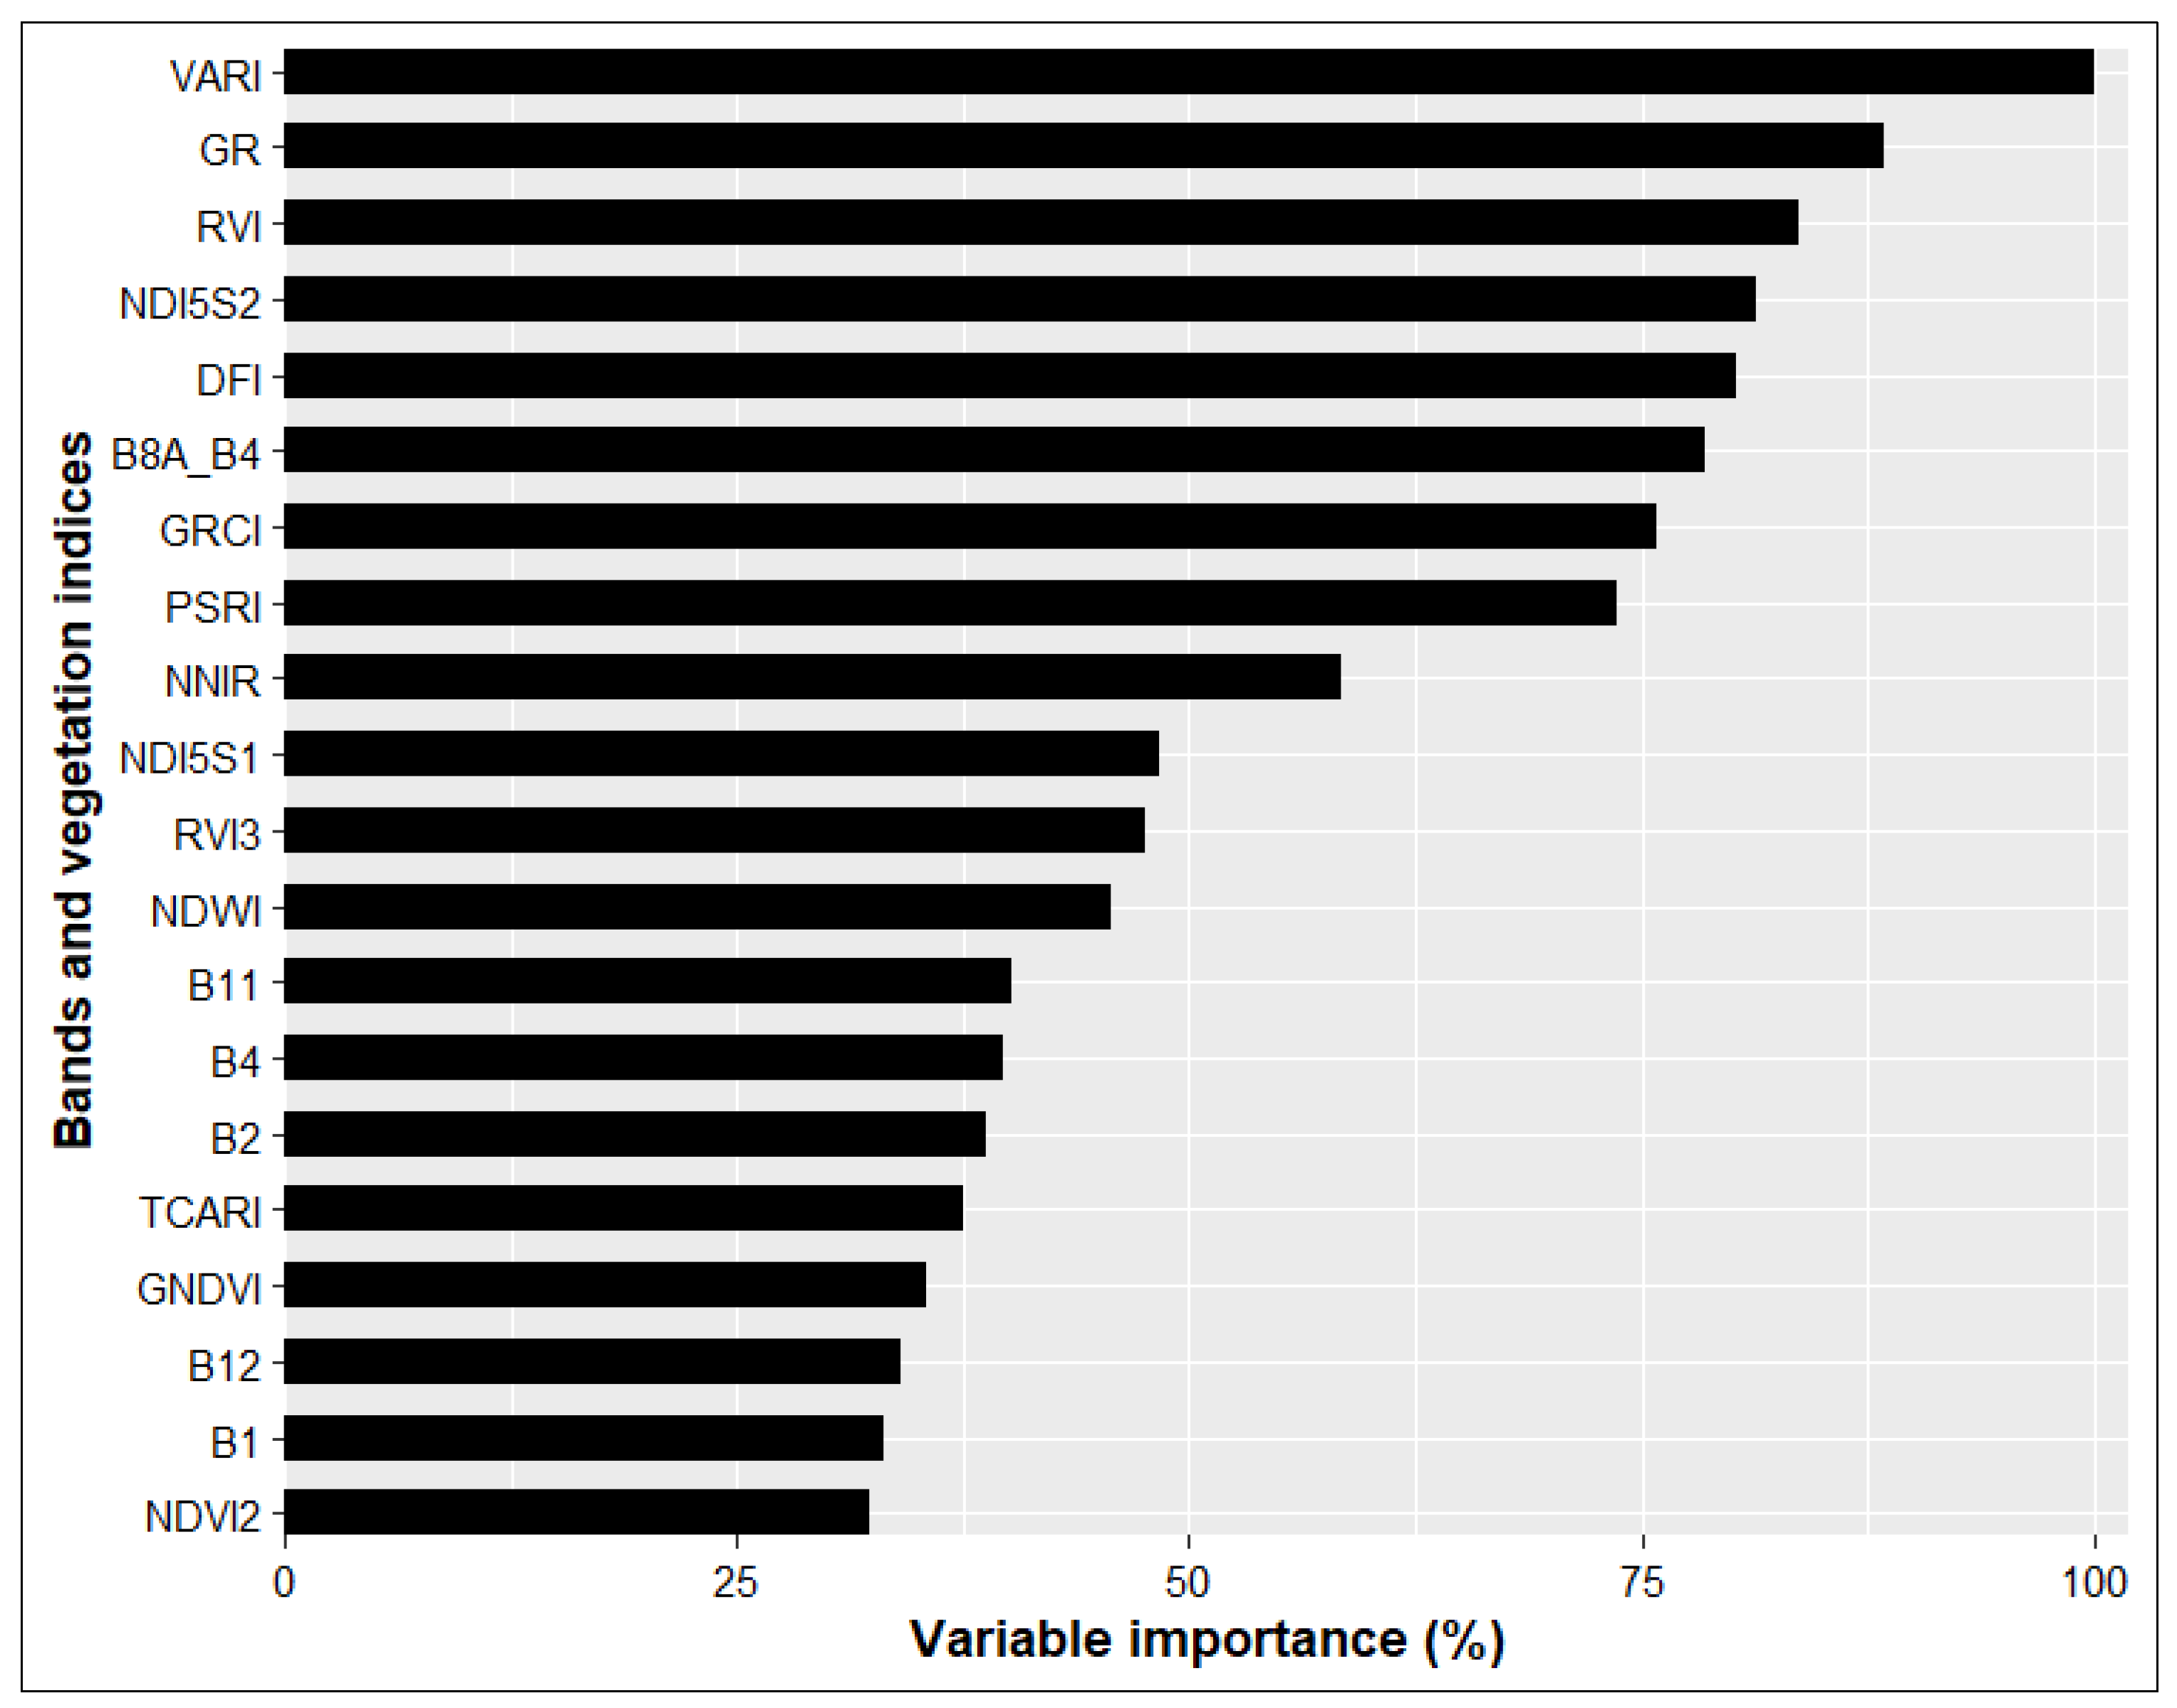
Figure 4.
Digitized maps of information from men and women as a result of participatory GIS.
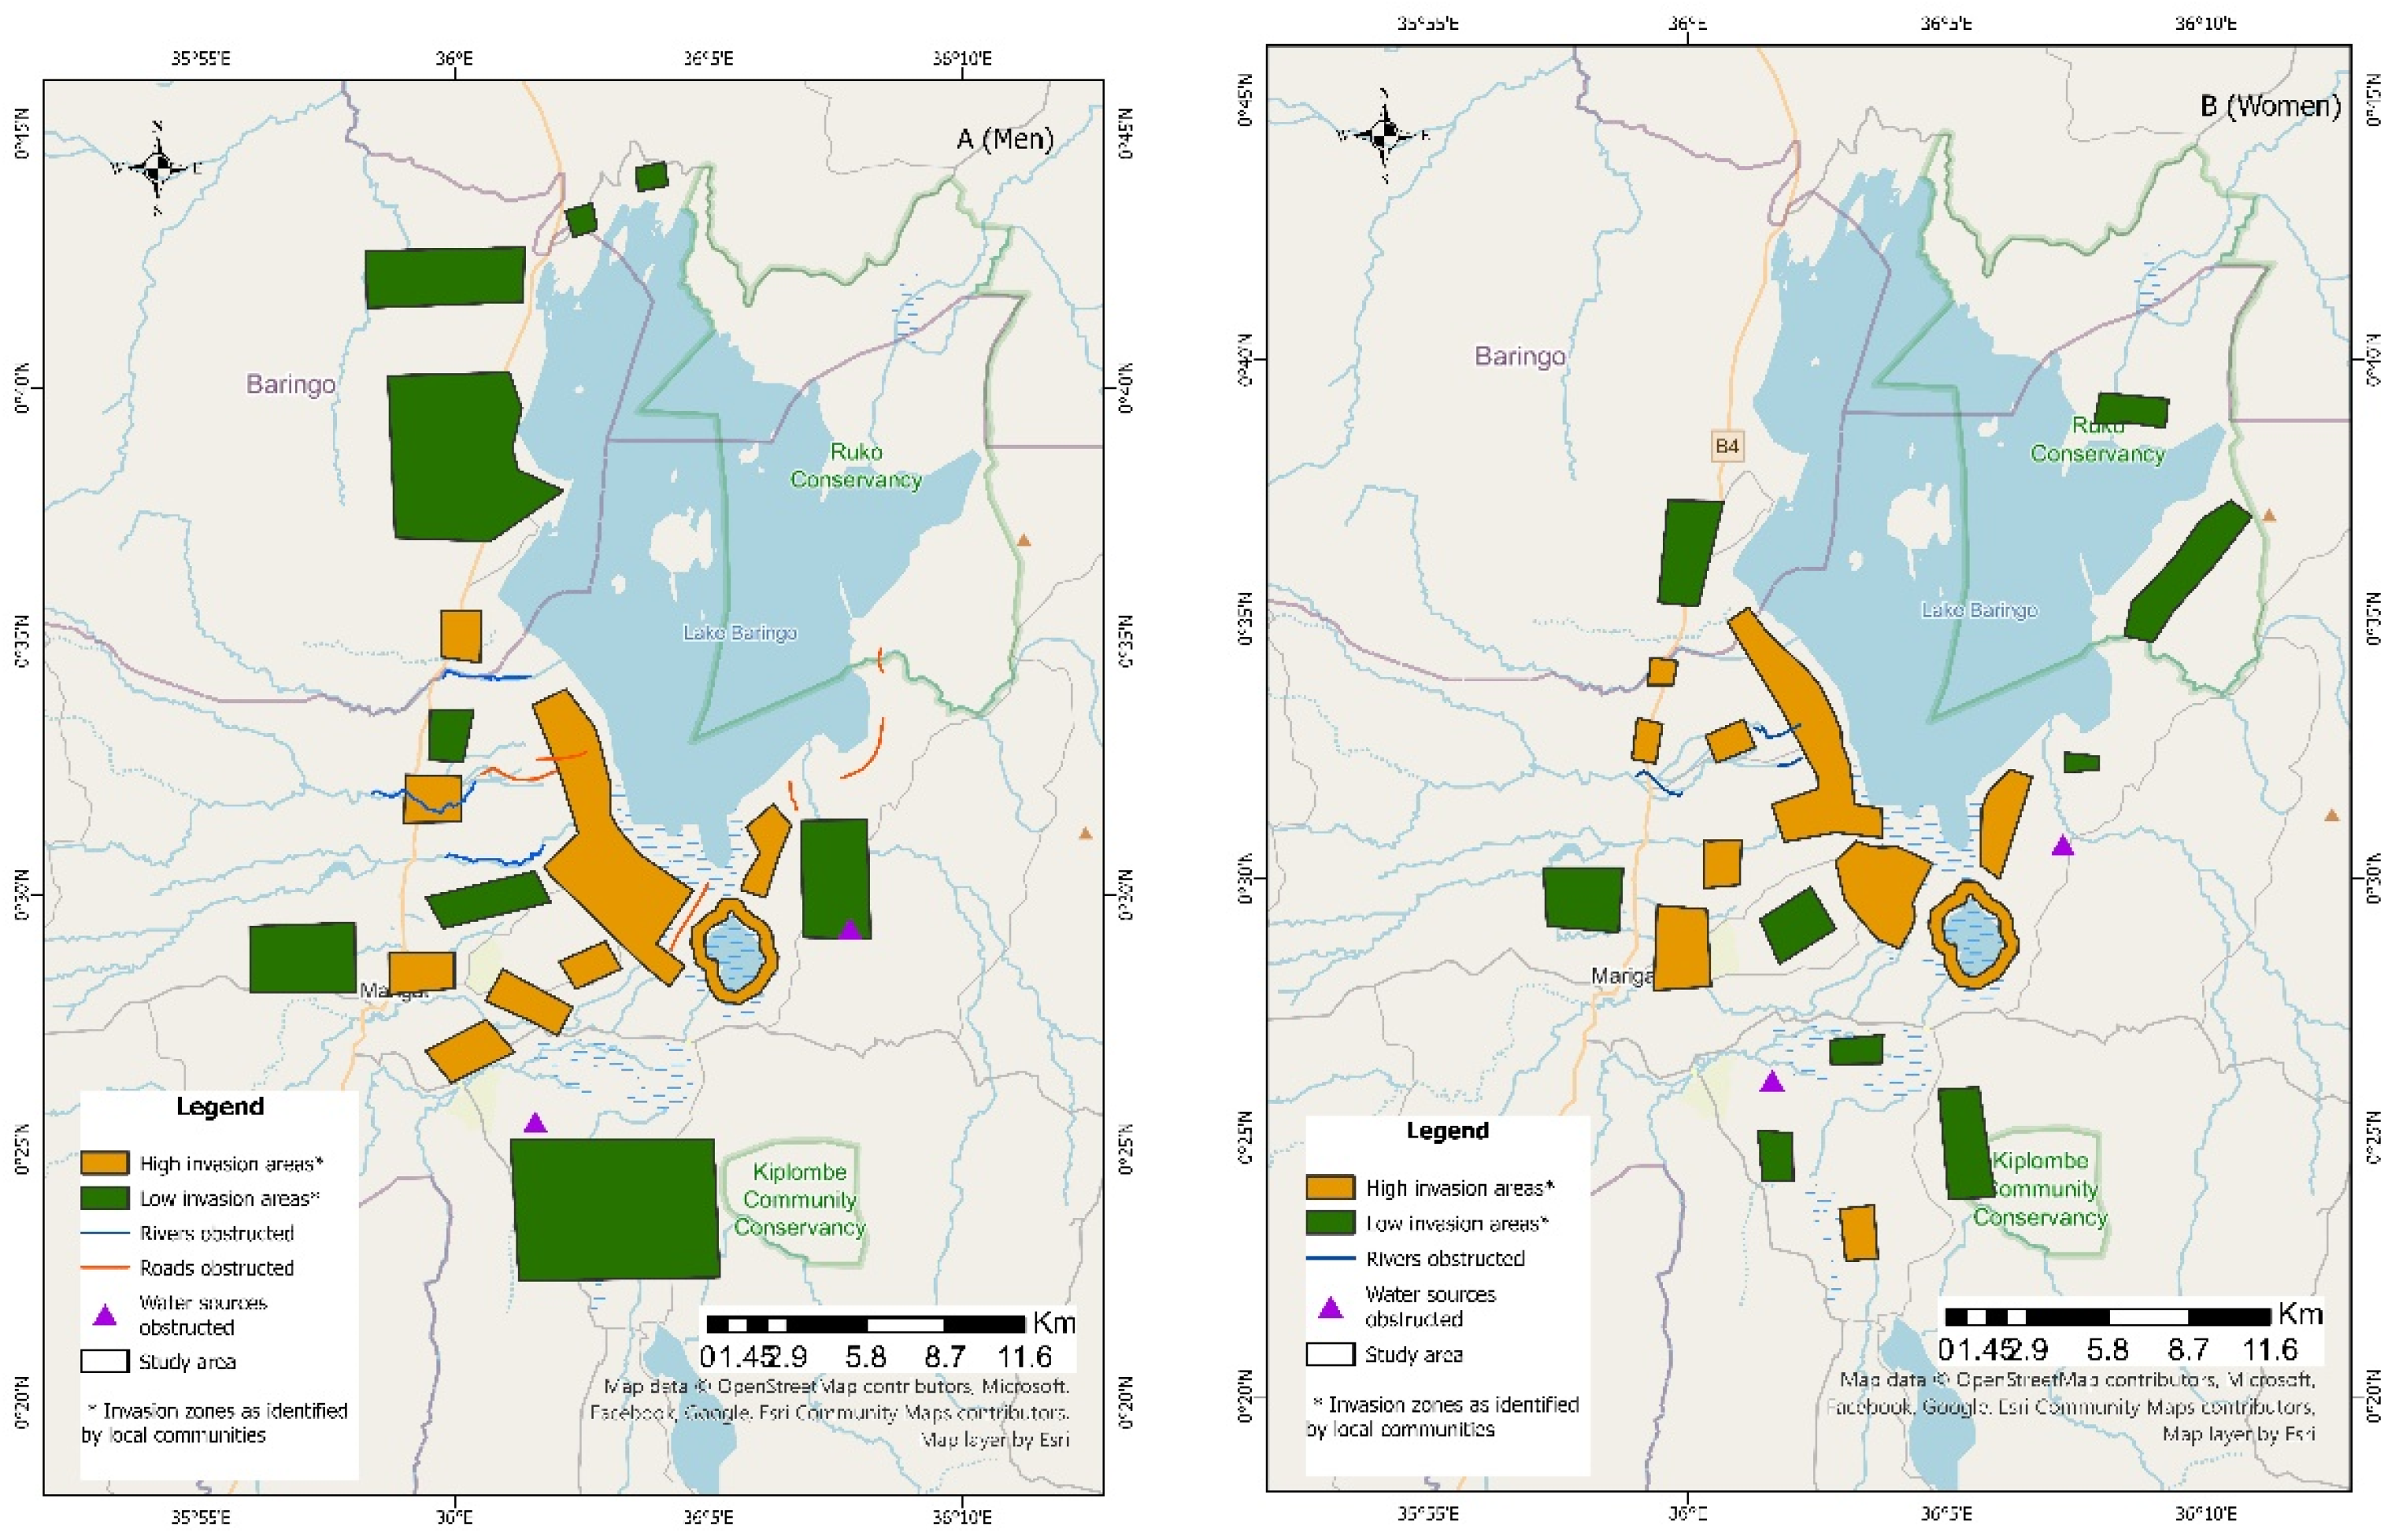
Figure 5.
Progression of Prosopis juliflora encroachment on a waterpan (February 2017–February 2023).
Figure 5.
Progression of Prosopis juliflora encroachment on a waterpan (February 2017–February 2023).
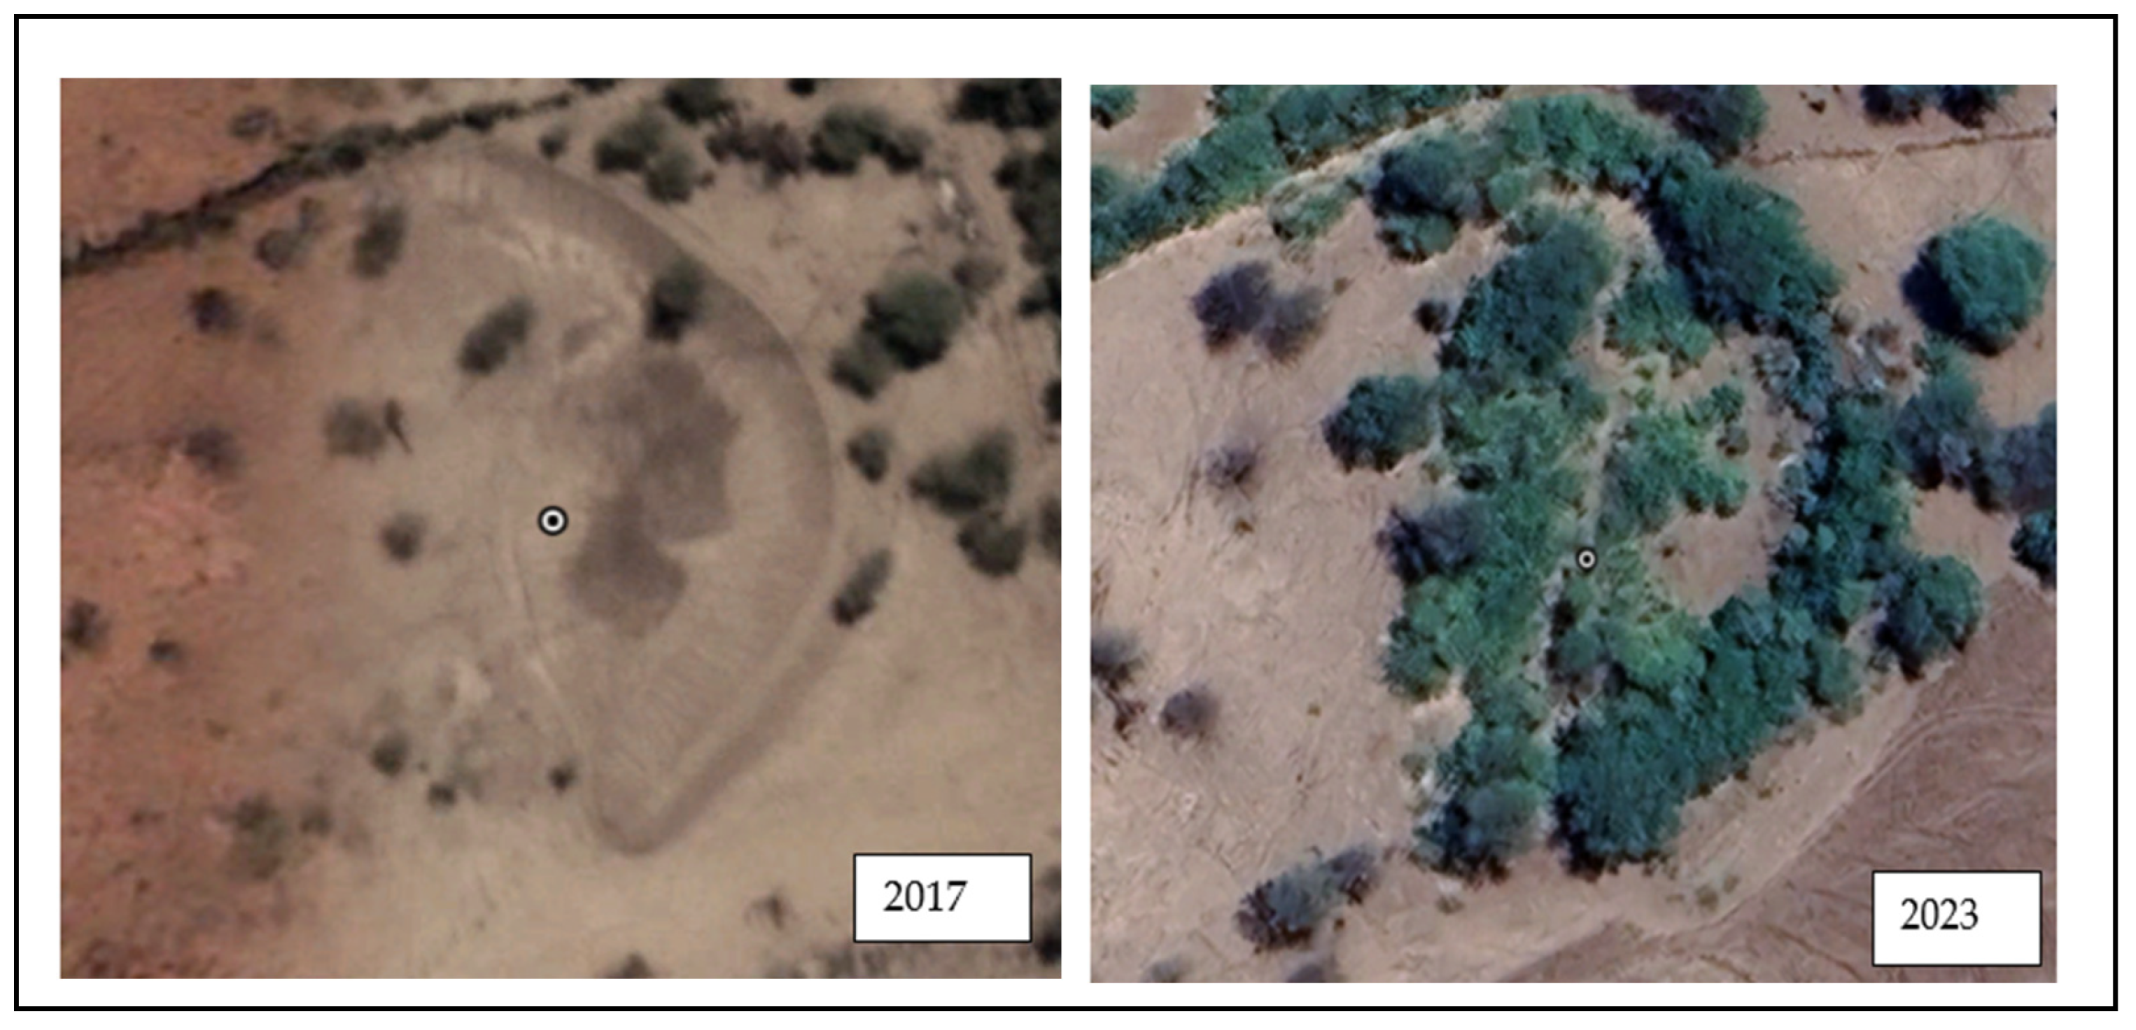
Figure 6.
Predicted presence and absence map of Prosopis juliflora as a result of random forest model.
Figure 6.
Predicted presence and absence map of Prosopis juliflora as a result of random forest model.
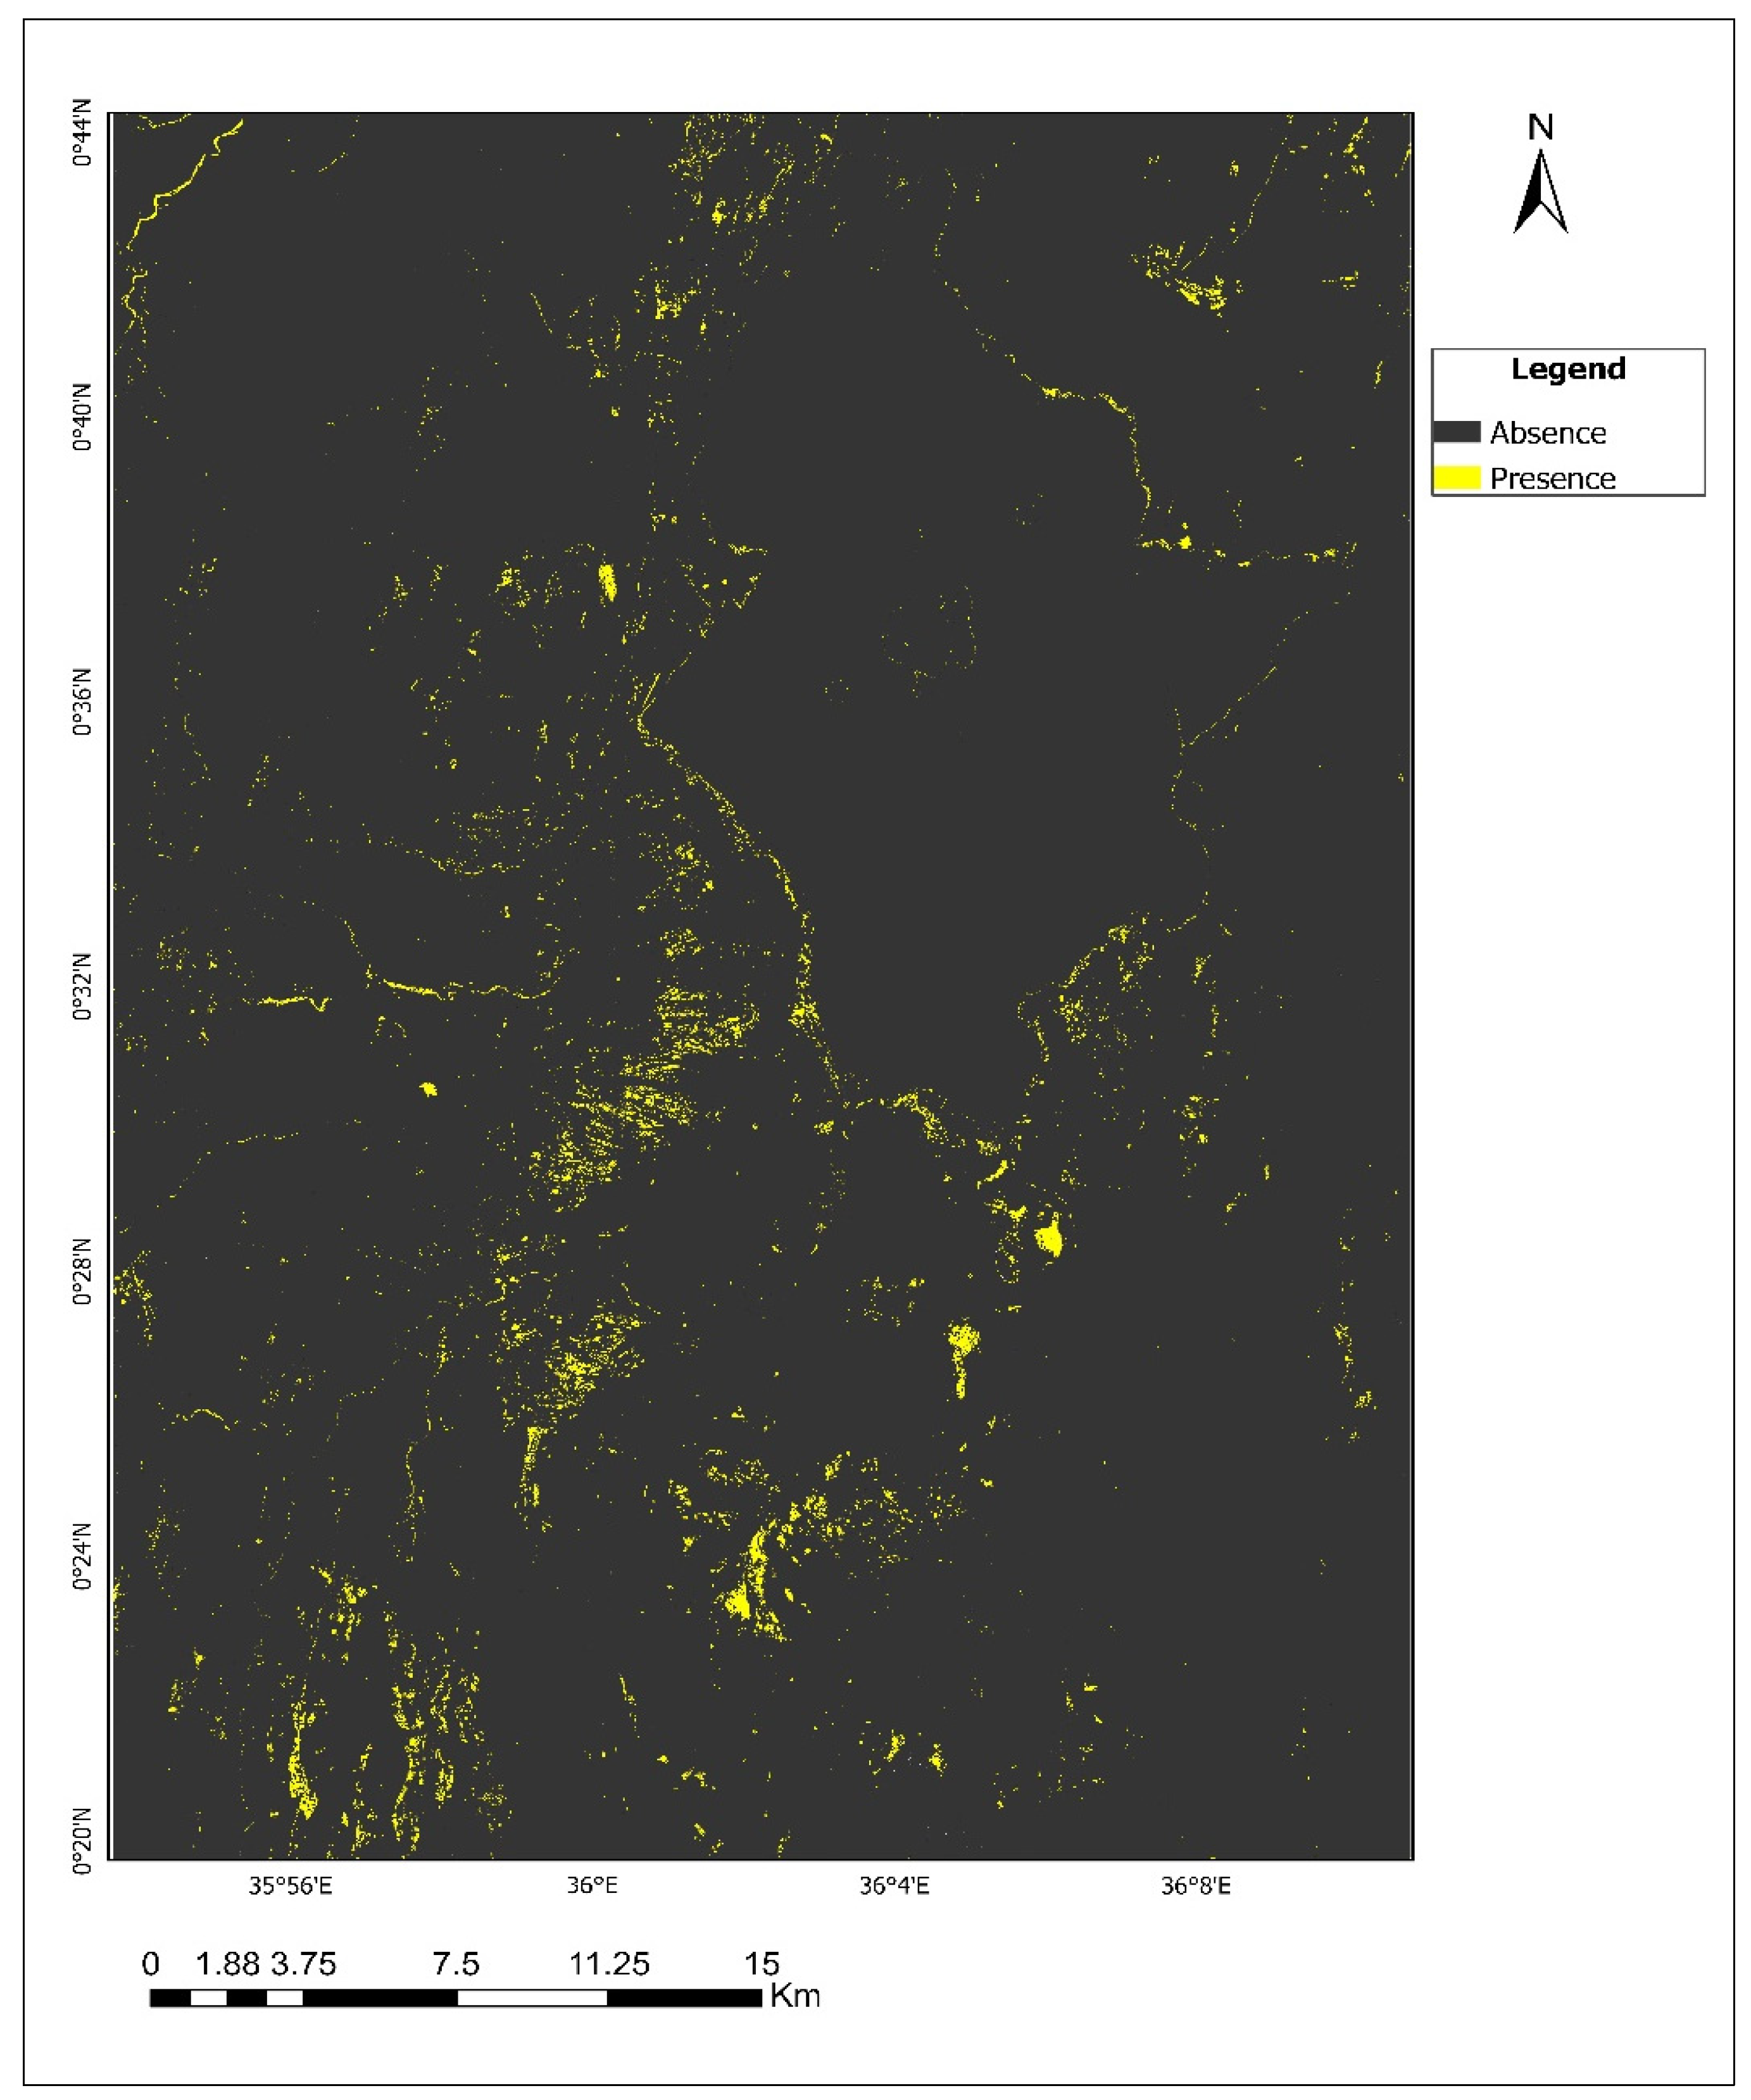
Figure 7.
Monthly NDVI profiles for different land cover types in 2023. Prosopis juliflora maintained relatively stable NDVI values between 0.53 and 0.7, reflecting its persistent greenness and sustained photosynthetically active even during the dry months of January and February.
Figure 7.
Monthly NDVI profiles for different land cover types in 2023. Prosopis juliflora maintained relatively stable NDVI values between 0.53 and 0.7, reflecting its persistent greenness and sustained photosynthetically active even during the dry months of January and February.
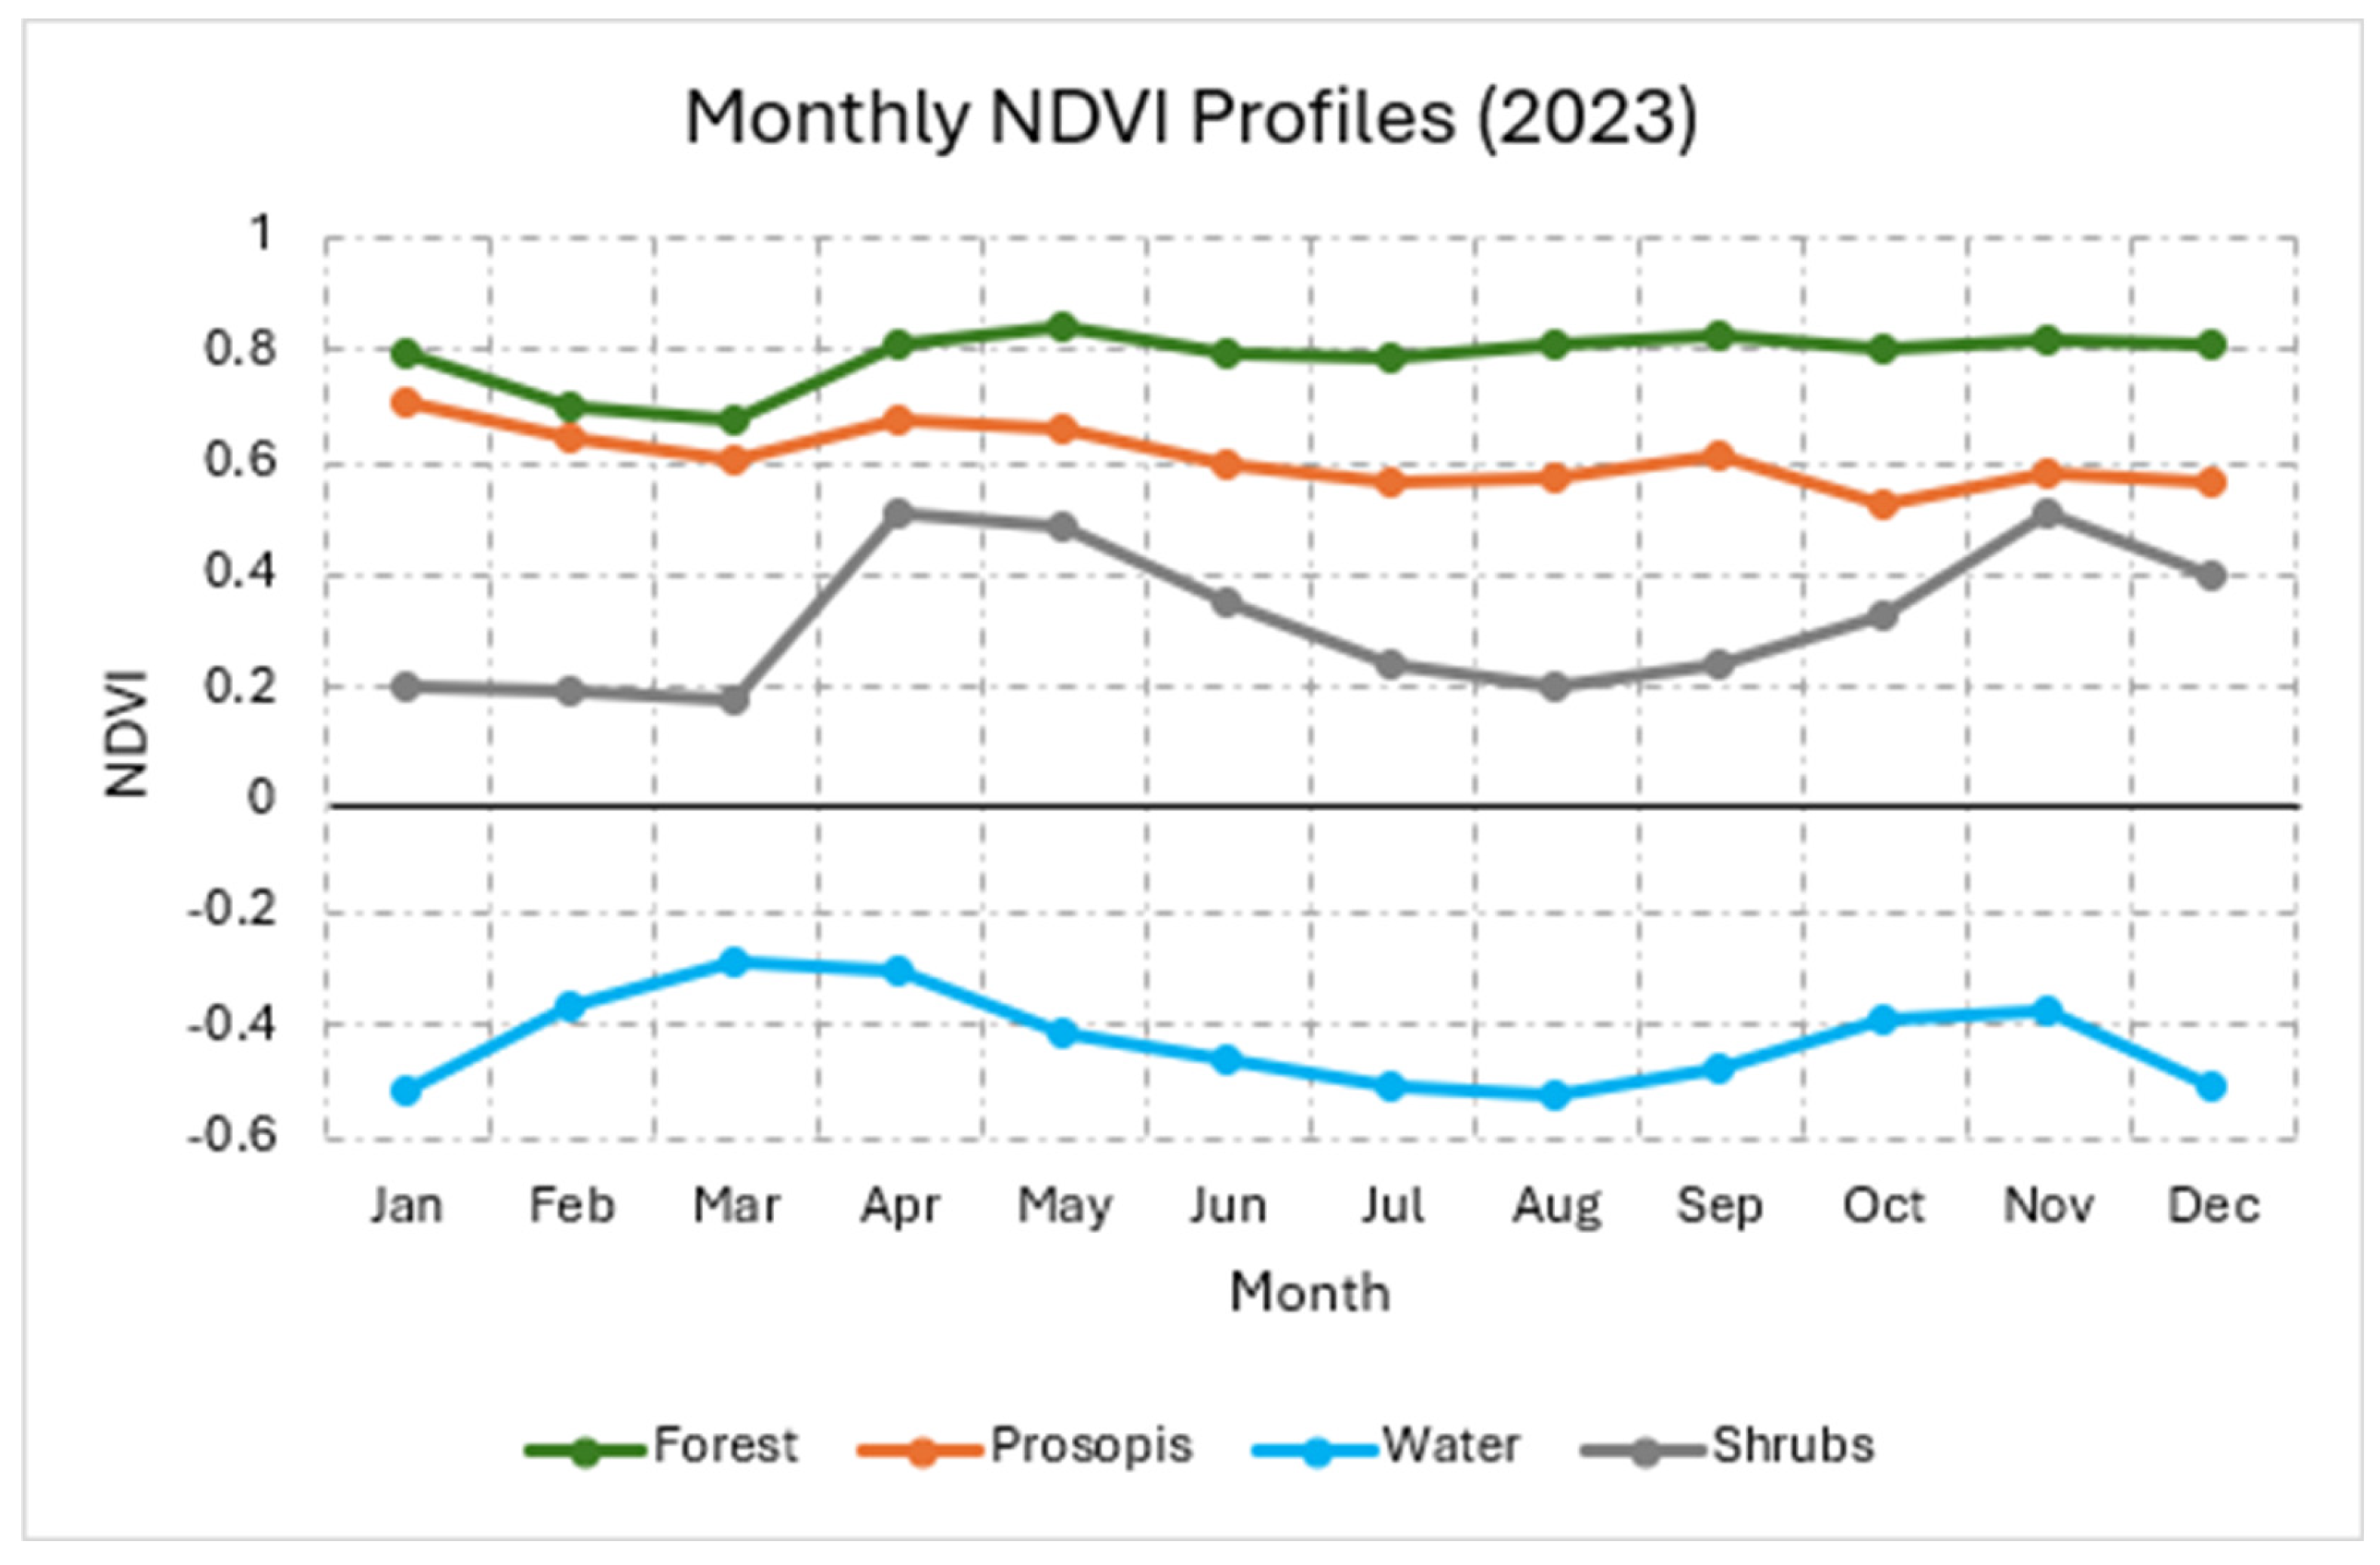
Figure 8.
Predictive presence of Prosopis juliflora mapped over land cover map (Dynamic World Land Cover [31]).
Figure 8.
Predictive presence of Prosopis juliflora mapped over land cover map (Dynamic World Land Cover [31]).
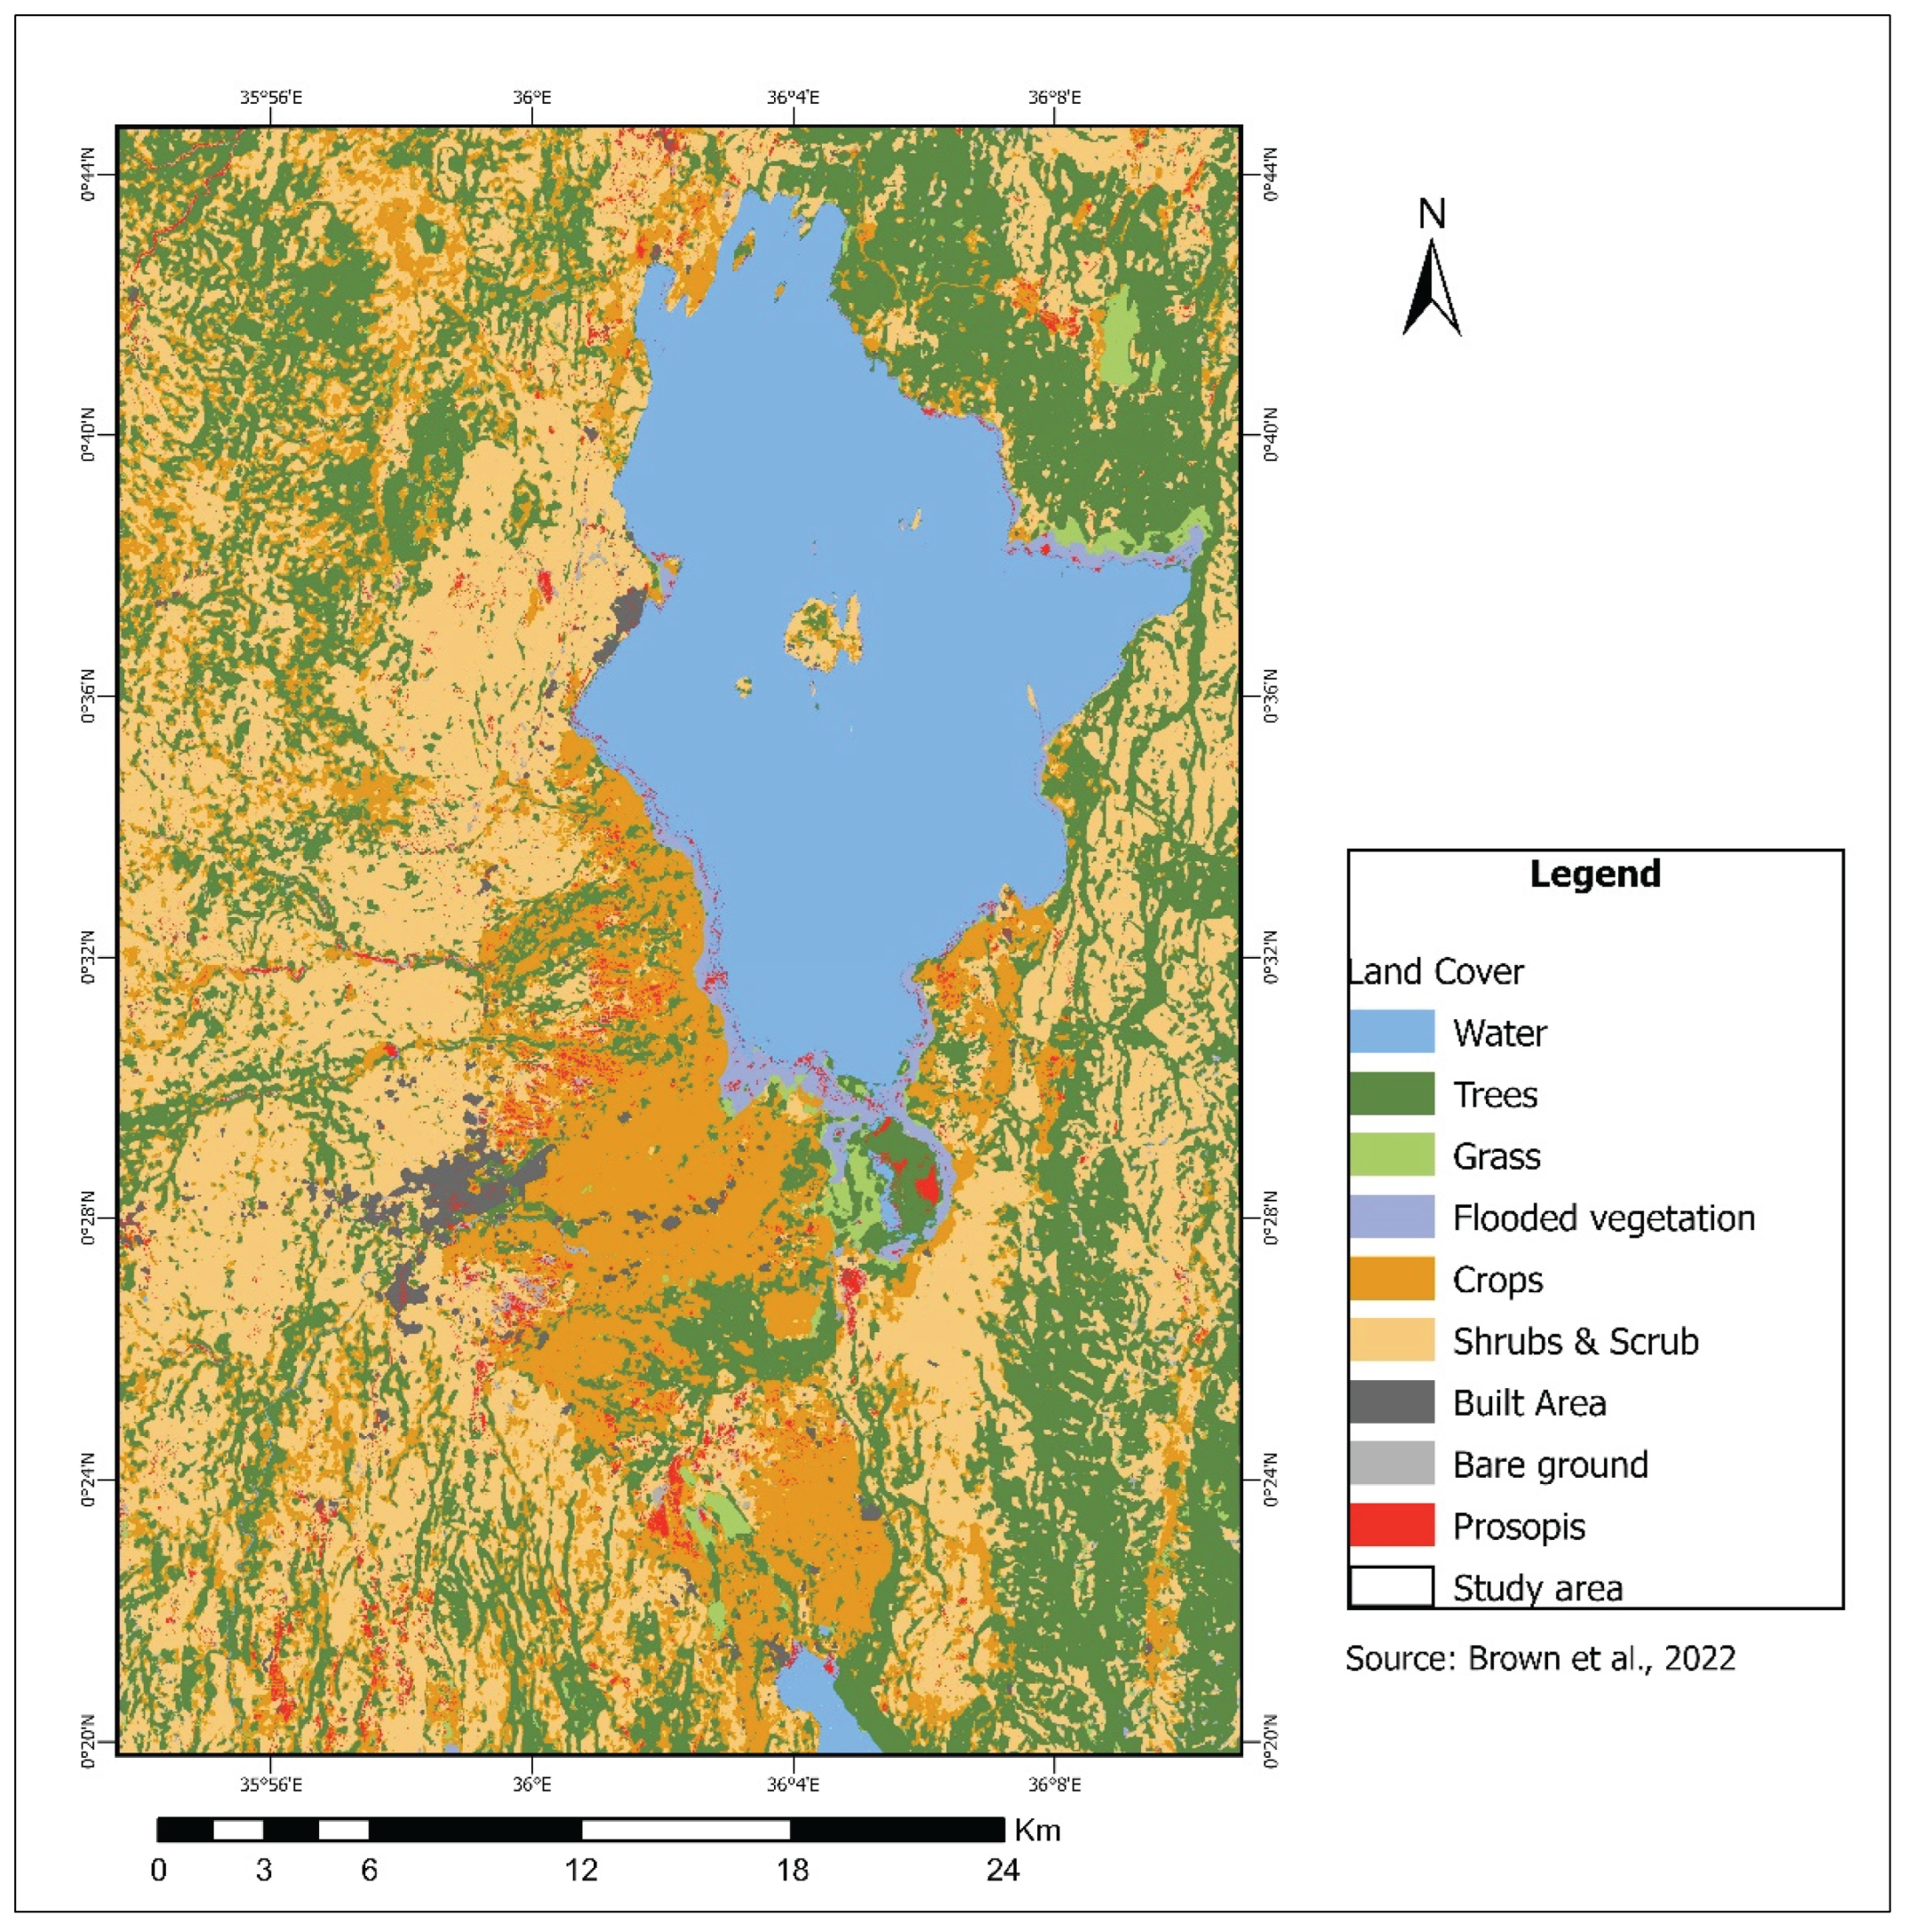

Table 1.
Comparison of satellite characteristics for Prosopis juliflora mapping.
| Attribute | Sentinel-1 | Sentinel-2 | PlanetScope |
|---|---|---|---|
| Sensor Type | C-band Synthetic Aperture Radar (SAR) | Multispectral Instrument (MSI) | Multispectral (CubeSat constellation) |
| Spatial Resolution | 10m | 10m (Visible & NIR), 20m (Red-edge & SWIR), 60m (Atmospheric bands) | 3m |
| Spectral Bands | SAR (VV, VH polarization) | 13 bands: B1 (Coastal), B2 (Blue), B3 (Green), B4 (Red), B5–B7 (Red Edge), B8 (NIR), B8A (Red Edge 4), B9 (Water Vapor), B10 (Cirrus), B11–B12 (SWIR). | 4 bands: Blue, Green, Red, NIR |
| Temporal Resolution | 6–12 days | 5 days | Daily |
Table 2.
Vegetation indices utilized for spectral differentiation of Prosopis juliflora from other vegetation types.
Table 2.
Vegetation indices utilized for spectral differentiation of Prosopis juliflora from other vegetation types.
| Sentinel 1(S1) | Sentinel 2 (S2) | Planetscope (PS) |
|---|---|---|
|
|
|
Table 3.
Accuracy assessment metrics.
| Sentinel 1 | Sentinel 2 | Planetscope | |
|---|---|---|---|
| Overall Accuracy (%) | 79.84 | 90.65 | 76.56 |
| Cohen’s Kappa Coefficient | 0.5109 | 0.779 | 0.403 |
| McNemar’s Test p-Value | 0.077556 | 0.00617 | 0.03887 |
Table 4.
Classification metrices based on predicted probabilities.
| Metric | Value |
|---|---|
| Precision | 0.908 |
| Recall | 0.959 |
| F1 score | 0.933 |
Disclaimer/Publisher’s Note: The statements, opinions and data contained in all publications are solely those of the individual author(s) and contributor(s) and not of MDPI and/or the editor(s). MDPI and/or the editor(s) disclaim responsibility for any injury to people or property resulting from any ideas, methods, instructions or products referred to in the content. |
© 2025 by the authors. Licensee MDPI, Basel, Switzerland. This article is an open access article distributed under the terms and conditions of the Creative Commons Attribution (CC BY) license (http://creativecommons.org/licenses/by/4.0/).
Copyright: This open access article is published under a Creative Commons CC BY 4.0 license, which permit the free download, distribution, and reuse, provided that the author and preprint are cited in any reuse.


