Preprint
Article

This version is not peer-reviewed.

Glycosylation of Reduced Chalcones as Antidiabetic Compounds: Design, Synthesis, Characterisation, and in Silico Evaluation

Submitted:

30 November 2025

Posted:

02 December 2025

You are already at the latest version

Abstract

Background/Objectives: Diabetes is a chronic metabolic disorder that leads to elevated blood sugar levels and has become a global concern. Though there has been an increase and evolution of antidiabetic drugs and therapeutics, they fall short of the desired efficacy and are often associated with adverse effects. This study explores reduced chalcone as a scaffold to design and synthesize potential antidiabetic drugs with improved efficacy through glycosylation and supplemented by in silico evaluation. Methodology: The 3ʹ-hydroxychalcone was initially reduced to 1-phenyl-3-(3ʹ-hydroxyphenyl)propane (2), followed by direct C-glycosylation at C-4ʹ under temperature control from -78 to room temperature (RT) and afforded the C-4ʹ glucosylated 1,3-diaryl propane. The first step in the mechanism was 3ʹ-O-glycosylation, and the resultant 3ʹ-O-a,b-glucose isomer mixture was isolated at -40 . NMR spectroscopy and mass spectrometry were used to characterise and validate compound structures. These compounds' antidiabetic potentials and drug-likeness were evaluated through integrated computational techniques. Results: The main compound (5) showed no inhibitory activity against α-glucosidase and α-amylase. However, all the compounds showed higher probable antidiabetic activities and improved drug-likeness relative to aspalathin. Their binding affinity assessment showed they are potential ‘pan-binders’ with high binding affinities to several proteins implicated in the advancement of diabetes, including AKT, AMPK, GLUT4, SGLT2, and SIRT6. Furthermore, they were observed to stabilise within the binding pocket of AKT, underscored by strong hydrogen and hydrophobic bonds resulting in protein conformational changes, thus highlighting their antidiabetic potential. Conclusion: The synthesised glucosyl chalcones could be potential lead compounds for developing novel antidiabetic compounds.

Keywords: 
;  ;  ;  ;  

1. Introduction

Diabetes is a chronic health condition characterized by the dysregulation of carbohydrate, fat, and protein metabolism due to insulin deficiency or cell insensitivity to insulin, resulting in elevated blood glucose levels. This metabolic disorder affects millions of people and has become a global canker. It is a condition that persists for a lifetime and increases the risk of developing various diseases, such as blindness. [1], kidney failure [2], cardiovascular disease [3], neurodegenerative disorders [4], and complications during pregnancy [5]. Many interventions, including gene therapy [6], stem cell therapy [7], statin therapy [8], and small-molecule drugs [9] have been developed over the years to address this menace. While these therapies are expensive and beyond the accessibility of many, the current antidiabetic drugs do not present the desired efficacy. They are associated with side effects, which have necessitated the search for new interventions (drugs) with improved efficacy and minimal side effects. As such, researchers are relentlessly in search of novel antidiabetic drugs.
Chalcones are among the well-known compounds used in traditional medicine to treat several diseases, including diabetes. As privileged scaffolds, they elicit antidiabetic properties through glucose transporter type 4 (GLUT4) protein, alpha-amylase, peroxisome proliferator-activated receptor-gamma (PPARγ), sodium-glucose cotransporter 2 (SGLT2), dipeptidyl peptidase 4 (DPP-4), adenosine monophosphate (AMP)-activated protein kinase (AMPK), aldose reductase (ALR), and protein tyrosine phosphatase 1B (PTP1B) [10,11]. These privileged scaffolds are secondary metabolites of terrestrial plants, including Scutellaria, Angelica, Humulus, and Glycyrrhiza species, and are the bases of flavonoid and isoflavonoid biosynthesis. The chalcone structure contains a 1,3-diphenyl-2-propen-1-one moiety: a three-carbon chain containing an α,β-unsaturated carbonyl connects the two aromatic rings [12]. This basic structure is either the trans (E) or cis (Z) isomer, and the E-isomer has been reported to be more stable than the Z-isomer (Figure 1) [13].
The structure contains several reactive hydrogens, which offer opportunities for structural modifications and the synthesis of several chalcone derivatives. Though a plethora of literature exists on the potential use of chalcones as antidiabetic drugs, no chalcone-derived drug has been approved yet. Aspalathin, a glucosylated dihydrochalcone, is one of the main constituents of Aspalathus linearis (rooibos tea) and has been found to be a powerful antidiabetic compound by stabilizing plasma blood-sugar levels. Han et. al. [14] synthesised aspalathin via an aldol condensation followed by hydrogenation to form the 1,3-diaryl propane, subsequent glucosylation of the 1,3-diaryl propane, and oxidation of the benzylic position to yield the dihydrochalcone, aspalathin. Thus, in this study, we propose the synthesis of C- and O-glucosylated reduced chalcone derivatives and compare their predicted antidiabetic activities with the results of molecular modeling of the reactive hydrogens in the proposed compounds, offering opportunities for structural modifications and the synthesis of several chalcone derivatives. Thus, through in-silico techniques, the reactive hydrogens were investigated to design and evaluate the antidiabetic potential of the proposed compounds.

2. Methodology

2.1. General Information
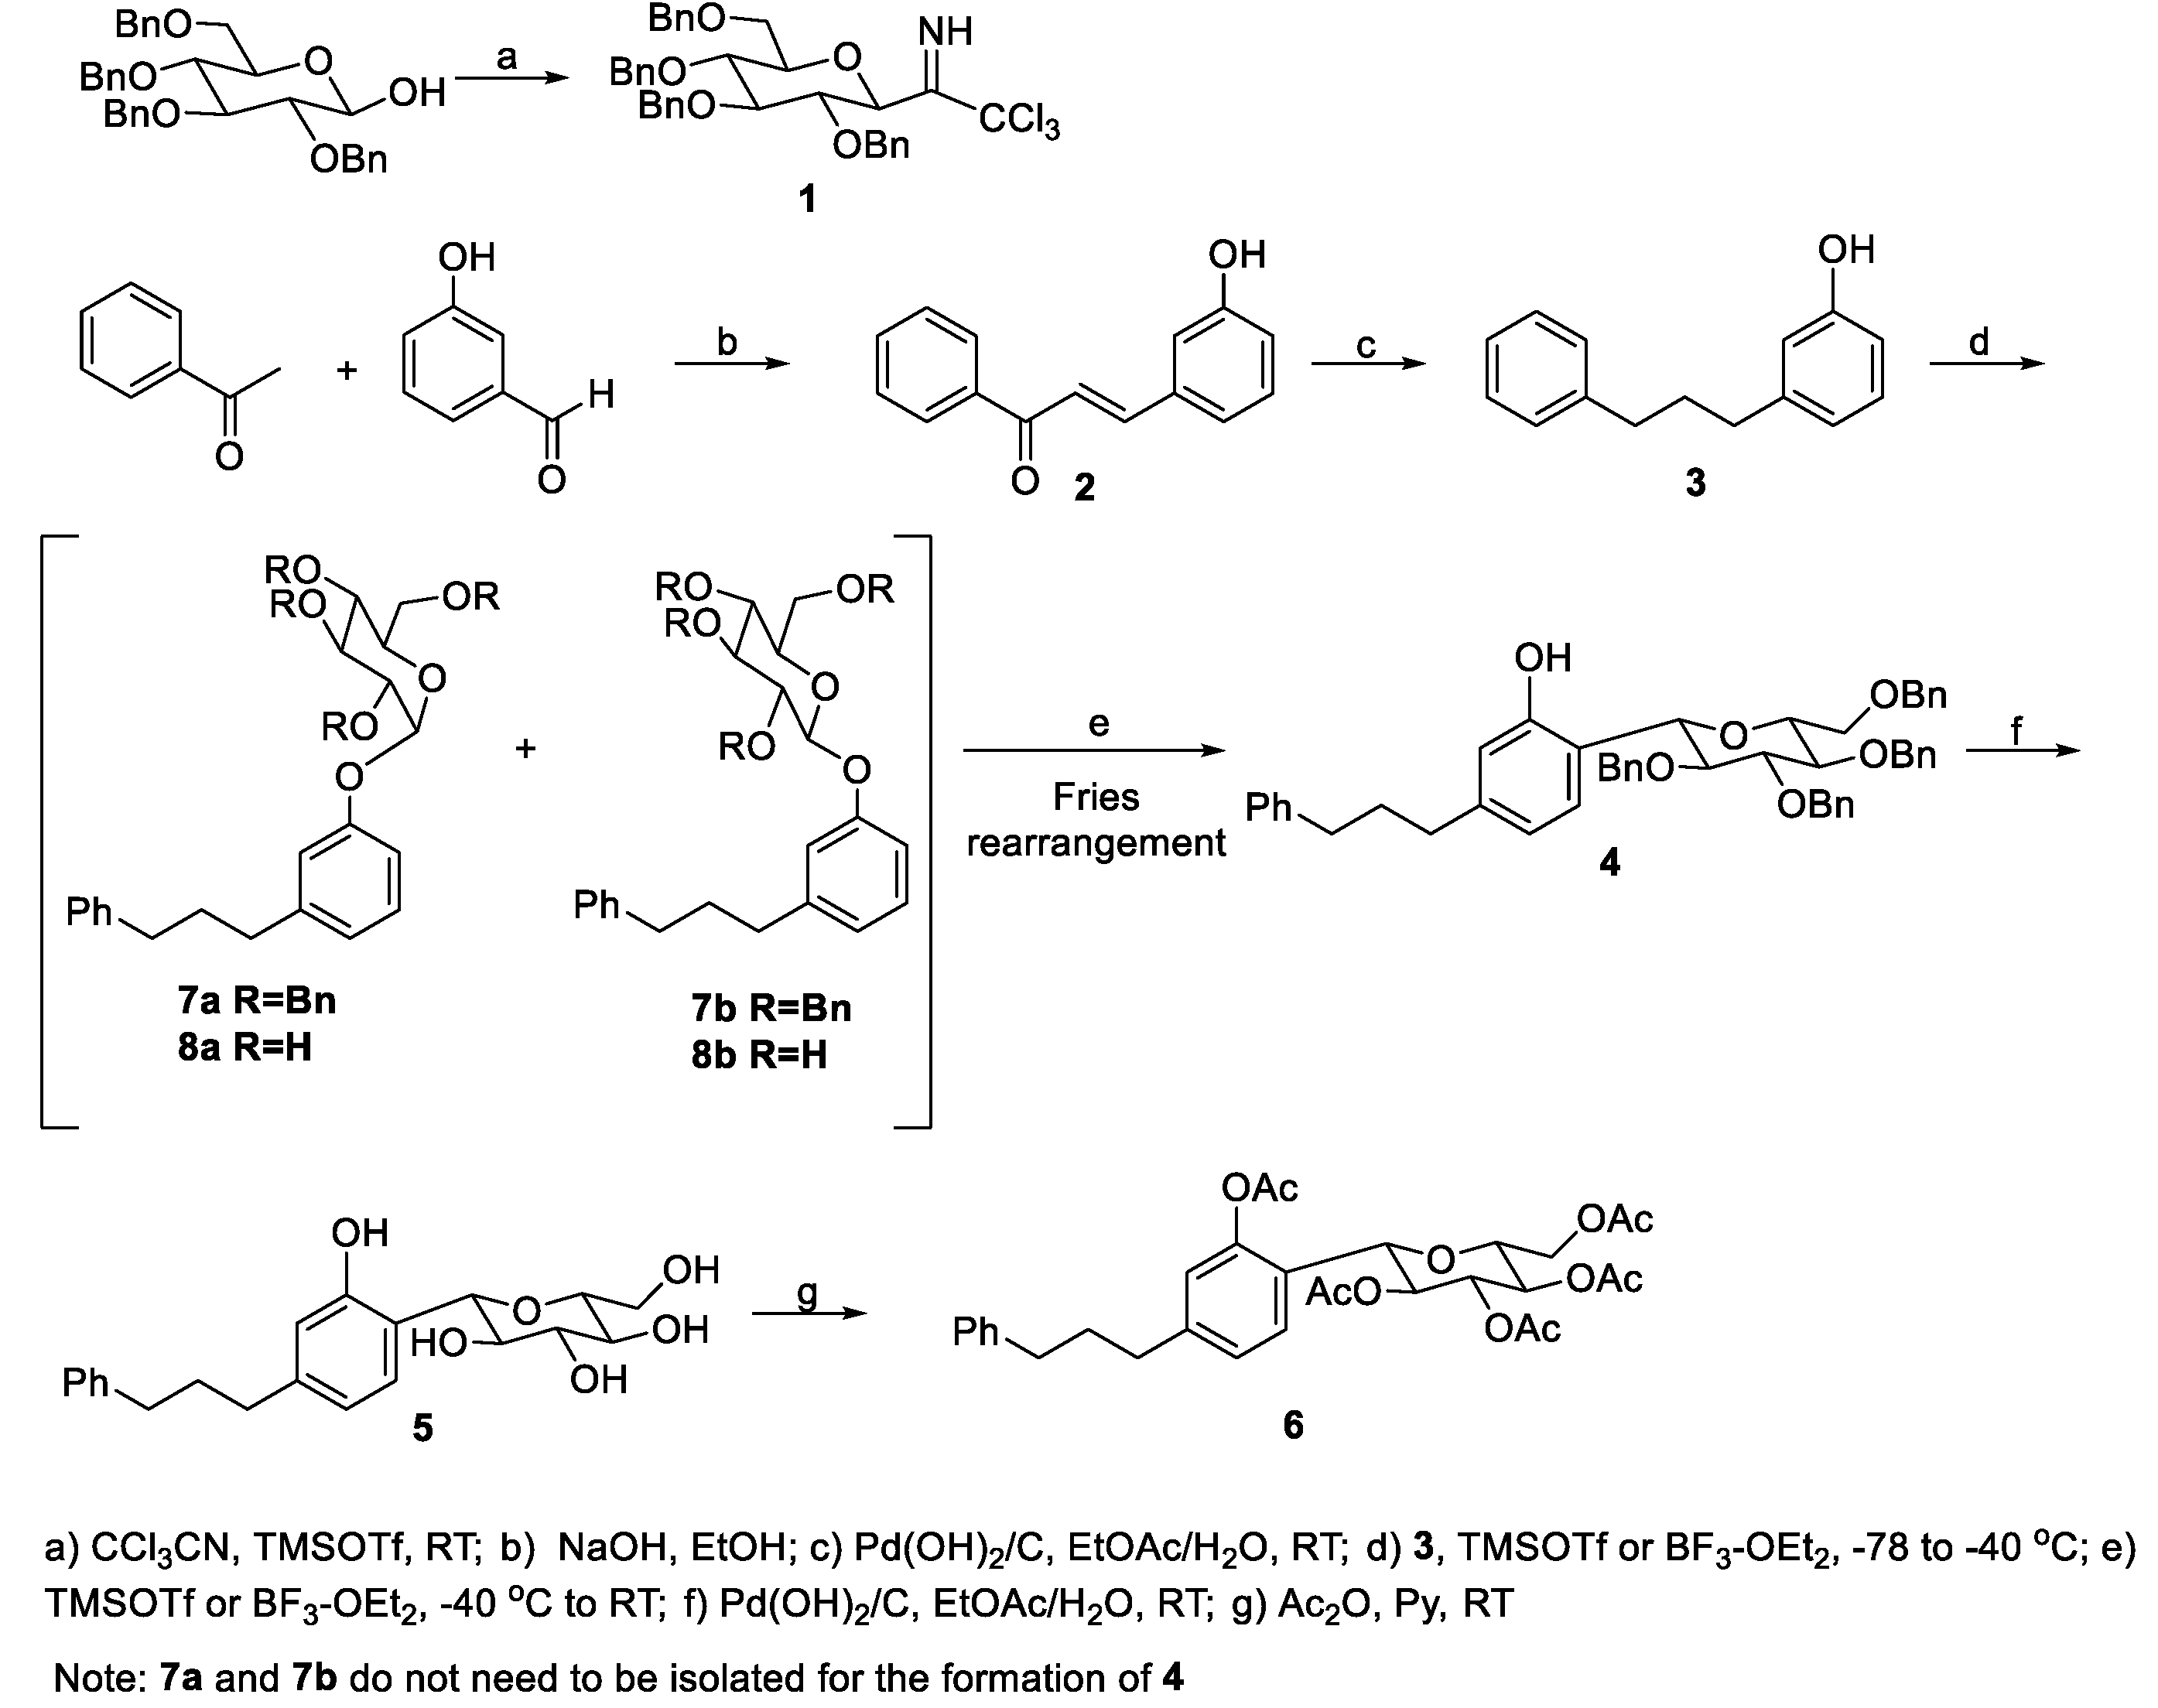
Experimental Procedures. Melting points were determined with a Reichert Thermopan microscope with a Kofflerhot-stage and were uncorrected. Solid-state FT-IR spectra were recorded as neat compounds on a Bruker Tensor 27 spectrometer. A 600 MHz Bruker Avance spectrometer was used to record the 1H NMR, COSY, HMBC, HSQC (600 MHz), and 13C, APT (150 MHz) experiments in either CDCl3 (δH = 7.24; δC = 77.2) or methanol-d4 (δH = 4.87 and 3.31; δC = 49.2) with TMS as internal standard. Chemical shifts were expressed as parts per million (ppm) on the delta (δ) scale, and coupling constants (J) are accurate to 0.01 Hz. High-resolution mass spectral data (HRMS) were collected using a Waters Micromass LCT Premier TOF-MS spectrometer. All samples were dissolved and diluted to ∼2 ng/μL and infused without additives. Thin-layer chromatography (TLC) was performed on Merck aluminum sheets (silica gel 60 F 254, 0.25 mm). Reactions were monitored by TLC on silica gel, with detection by UV light (254 nm). Thin-layer chromatograms were sprayed with a 2% (v/v) solution of formaldehyde (40% solution in H2O) in concentrated H2SO4 and subsequently heated to 110 °C to effect maximum development of colour. The chemicals used in this study were obtained from commercial suppliers and were of analytical grade.

2.2. Syntheses

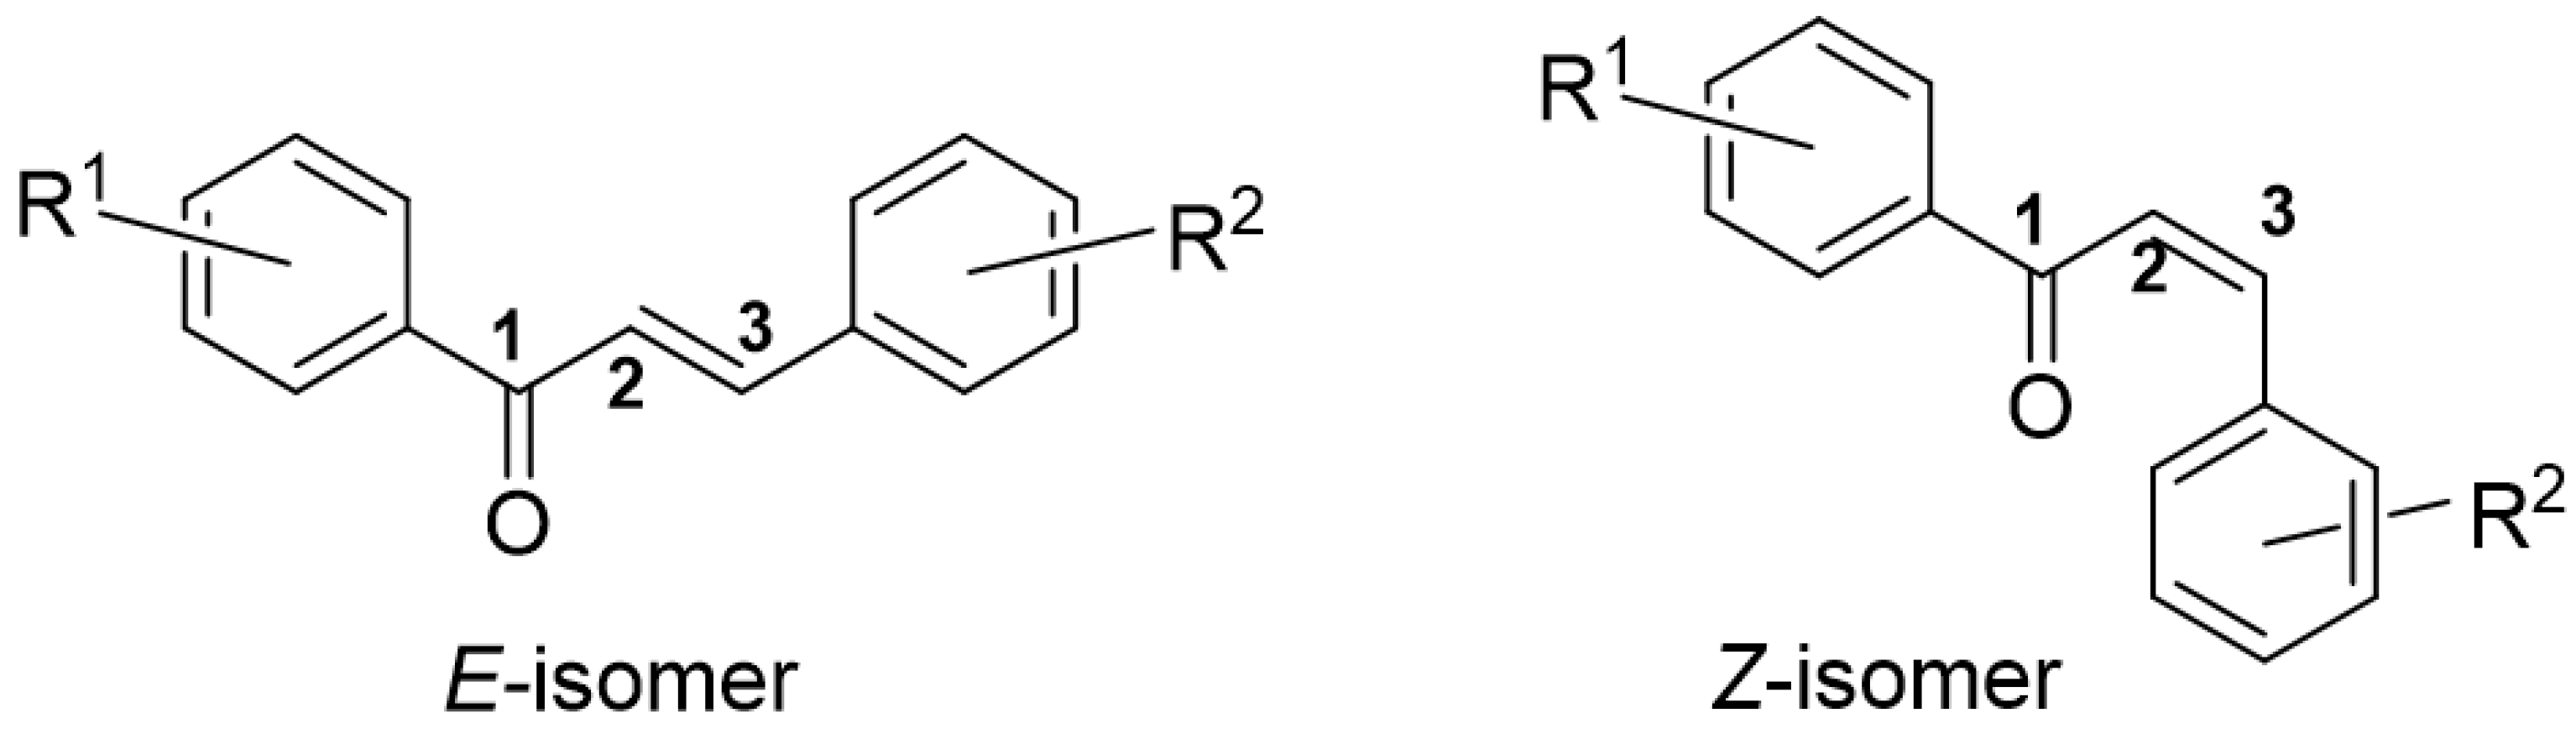
2.2.1. Synthesis of (E)-3-(3-hydroxyphenyl)-1-phenylprop-2-en-1-one (2)

Acetophenone (2.974 g; 24.7 mmol) and 3-hydroxybenzaldehyde (2.963 g; 24.3 mmol) yielded the title compound from EtOH as beige crystals (Rf = 0.33, toluene:acetone (5:5), 1.260 g, 23%, mp 162 – 163 °C; IR (neat): νmax = 3347.25, 1586.36, 1572.07, 777.78, 699.32 cm-1 ; 1H NMR (acetone-d6, TMS, 600 MHz) δ 8.60 (s, 1 x OH), 8.17 – 8.13 (2H, m, H-2', H-6'), 7.81 (1H, d, J = 15.6 Hz, H-3), 7.73 (1H, d, J = 15.6 Hz, H-2), 7.66 (1H, tt, J = 6.9, 1.2 Hz, H-4'), 7.60–7.55 (2H, m, H-3', H-5'), 7.33 (1H, dt, J = 7.6, 1.2 Hz, H-6''), 7.31 (1H, d, J = 7.6 Hz, H-5''), 7.29 (1H, t, J = 1.9 Hz, H-2''), 6.96 (1H, ddd, J = 7.6, 2.4, 1.3 Hz, H-4''); 13C NMR (acetone-d6, TMS, 150 MHz) δ 189.1 (C-1), 157.8 (C-3''), 144.1 (C-2), 138.2 (C-1'), 136.5 (C-1''), 132.8 (C-4'), 130.0 (C-5''), 128.7 (C-3', C-5'), 128.4 (C-2', C-6'), 122.0 (C-3), 120.1 (C-6''), 117.6 (C-4''), 115.0 (C-2''); HRESMS [M+H]+ m/z 225.0837 (calcd for C15H12O2 + H+ , 225.0839) [15]

2.2.2. Synthesis of 3-(3-phenylpropyl)phenol (3)

20% Pd(OH)2/C (600 mg, 60 wt%) was added to a solution of (E)-3-(3-hydroxyphenyl)-1-phenylprop-2-en-1-one (2) (1 g, 0.04 mol) in ethyl acetate (3 mL) and water (9 mL). Hydrogen gas (H2) was passed through the reaction mixture at atmospheric pressure. After stirring overnight at room temperature, the reaction mixture was filtered through silica gel and extracted with ethyl acetate (2 x 30 mL). The organic layer was dried over magnesium sulfate, filtered, and concentrated under vacuum to afford the title compound as a brown oil (215 mg, 25%). 1H NMR (CDCl3, 600 MHz) δ 7.28 (2H, d, J = 6.6 Hz, H-2ʹʹ/6ʹʹ), 7.18 (2H, d, J = 6.6 Hz, H-3ʹʹ/5ʹʹ), 7.14 (1H, t, J = 6.6 Hz, H-5ʹ), 6.68 (1H, d, J = 7.7 Hz, H-6ʹ), 6.68 (1H, d, J = 2.1, H-2ʹ), 6.66 (1H, d, J = 2.1, 7.7 Hz, H-4ʹ), 2.62 (2H, t, J = 7.5 Hz, H-1), 2.66 (2H, t, J = 7.5 Hz, H-3), 1.96 (2H, pent, J = 7.5 Hz, H-2). 13C NMR (CDCl3, 150 MHz) δ 155.5 (C-3ʹ), 144.4 (C-4ʹʹ), 144.3 (C-1ʹʹ), 129.6 (C-1'), 128.4 (C-2ʹʹ/6ʹʹ), 128.3 (C-3ʹʹ/5ʹʹ), 125.8 (C-5ʹ), 121.1 (C-6ʹ), 115.4 (C-2ʹ), 112.7 (C-4ʹ), 35.5 (C-3), 35.3 (C-2), 32.8 (C-1).

2.2.3. Synthesis of 1-phenyl-3-(4ʹ-C-β-D-2ʹʹʹ,3ʹʹʹ,4ʹʹʹ,6ʹʹʹ-tetra-O-benzylglucopyranosyl-3'-hydroxyphenyl)propane (4)

BF3.OEt2 (0.2 mL, 1.55 mmol) was added dropwise to a stirred mixture of 3-(3-phenylpropyl)phenol 3 (42 mg, 0.2 mmol), 2,3,4,6-tetra-O-benzyl-D-glucopyranosylamide (200 mg, 0.27 mmol), and 4Å molecular sieves (100 mg) in DCM (4 mL) at -78 ℃. The reaction mixture was stirred for 2 hours, after which the temperature was allowed to rise to -40 ℃, and stirring continued overnight. The temperature was increased to 20 ℃ for 2h and subsequently to RT for about 2h. The reaction mixture was quenched with water and filtered through Celite. The filtrate was extracted with chloroform (3×30 mL), the organic layer dried over anhydrous MgSO4, and the solvent was evaporated under reduced pressure. The brown oil was separated by TLC chromatography (Hx/ EtOAc/ DCM 8.5:0.5:1, Rf 0.3, 44 mg, 0.06 mmol, 30%). 1H NMR (CDCl3, 600 MHz) δ 7.76 (1H, s, OH), 7.43 – 7.05 (28H, aromatic), 7.18 (1H, d, J = 7.7 Hz, H-5ʹ), 6.86 (1H, d, J = 1.5 Hz, H-2ʹ), 6.77 (1H, dd, J = 1.5, 7.8 Hz, H-6ʹ), 5.02 – 3.86 (8H, -OCH2-), 4.44 (1H, d, J = 11.1 Hz, H-1ʹʹʹ), 3.92 (1H, t, J = 8.1 Hz, H-4ʹʹʹ), 3.85 (1H, dd, J = 1.8, 11.2 Hz, H-6ʹʹʹb), 3.75 (1H, t, J = 9.8 Hz, H-2ʹʹʹ), 3.70 (1H, dd, J = 5.0, 11.2 Hz, H-6ʹʹʹa), 3.62 (1H, m, H-5ʹʹʹ), 3.56 (1H, t, J = 10.0 Hz, H-3ʹʹʹ), 2.68 (2H, t, J = 7.7 Hz, H-1), 2.68 (2H, t, J = 7.7 Hz, H-3), 1.99 (2H, pent, J = 7.7 Hz, H-2). 13C NMR (CDCl3, 600 MHz) δ 155.5 (C-3ʹ), 144.3 (C-4ʹ), 142.2 (C-1ʹ), 138.6 – 137.3 (4 x -OCH2-C-), 127.6 – 129.1 (25C, aromatic), 127.7 (C-1ʹʹ), 128.1 (C-5ʹ), 128.0 (C-2ʹʹ/C4ʹʹ), 127.9 (C-3''/5''), 125.7 (C-5ʹ), 125.3 (C-4''), 120.1 (C-6'), 117.5 (C-2ʹ), 86.0 (C-3ʹʹʹ), 81.7 (C-1ʹʹʹ), 81.5 (C-2ʹʹʹ), 78.6 (C-5ʹʹʹ), 77.3 (C-4ʹʹʹ), 76.0 – 68.2 (4 x -OCH2-), 68.0 (C-6ʹʹʹ), 35.3 (C-3), 35.1 (C-1), 32.8 (C-2).

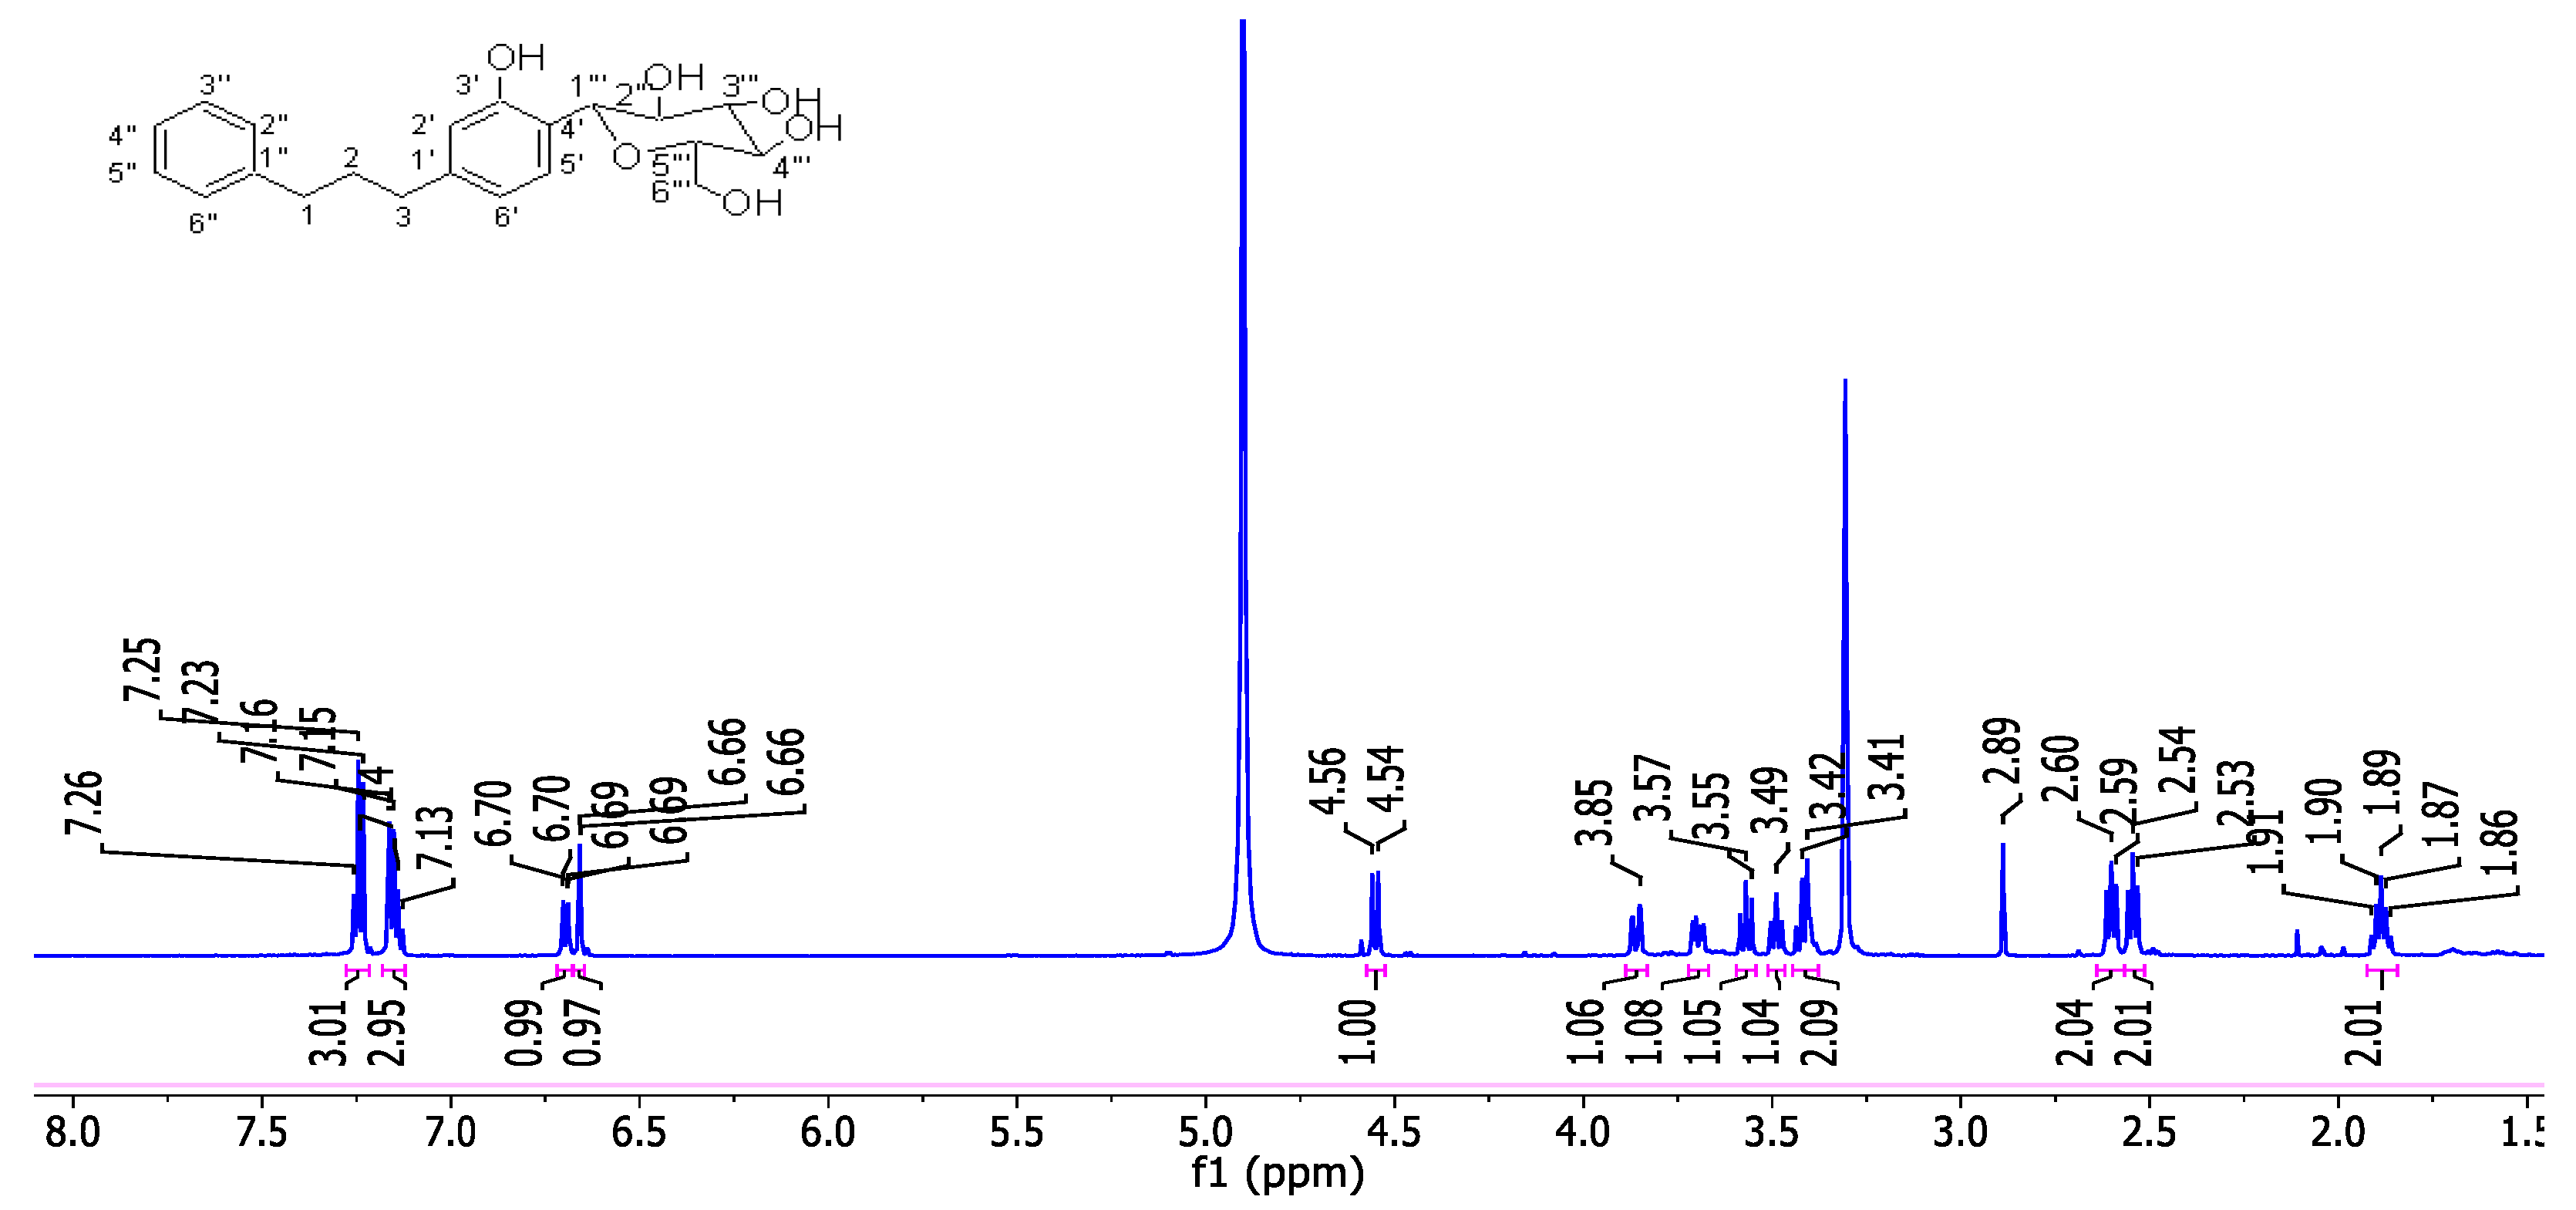
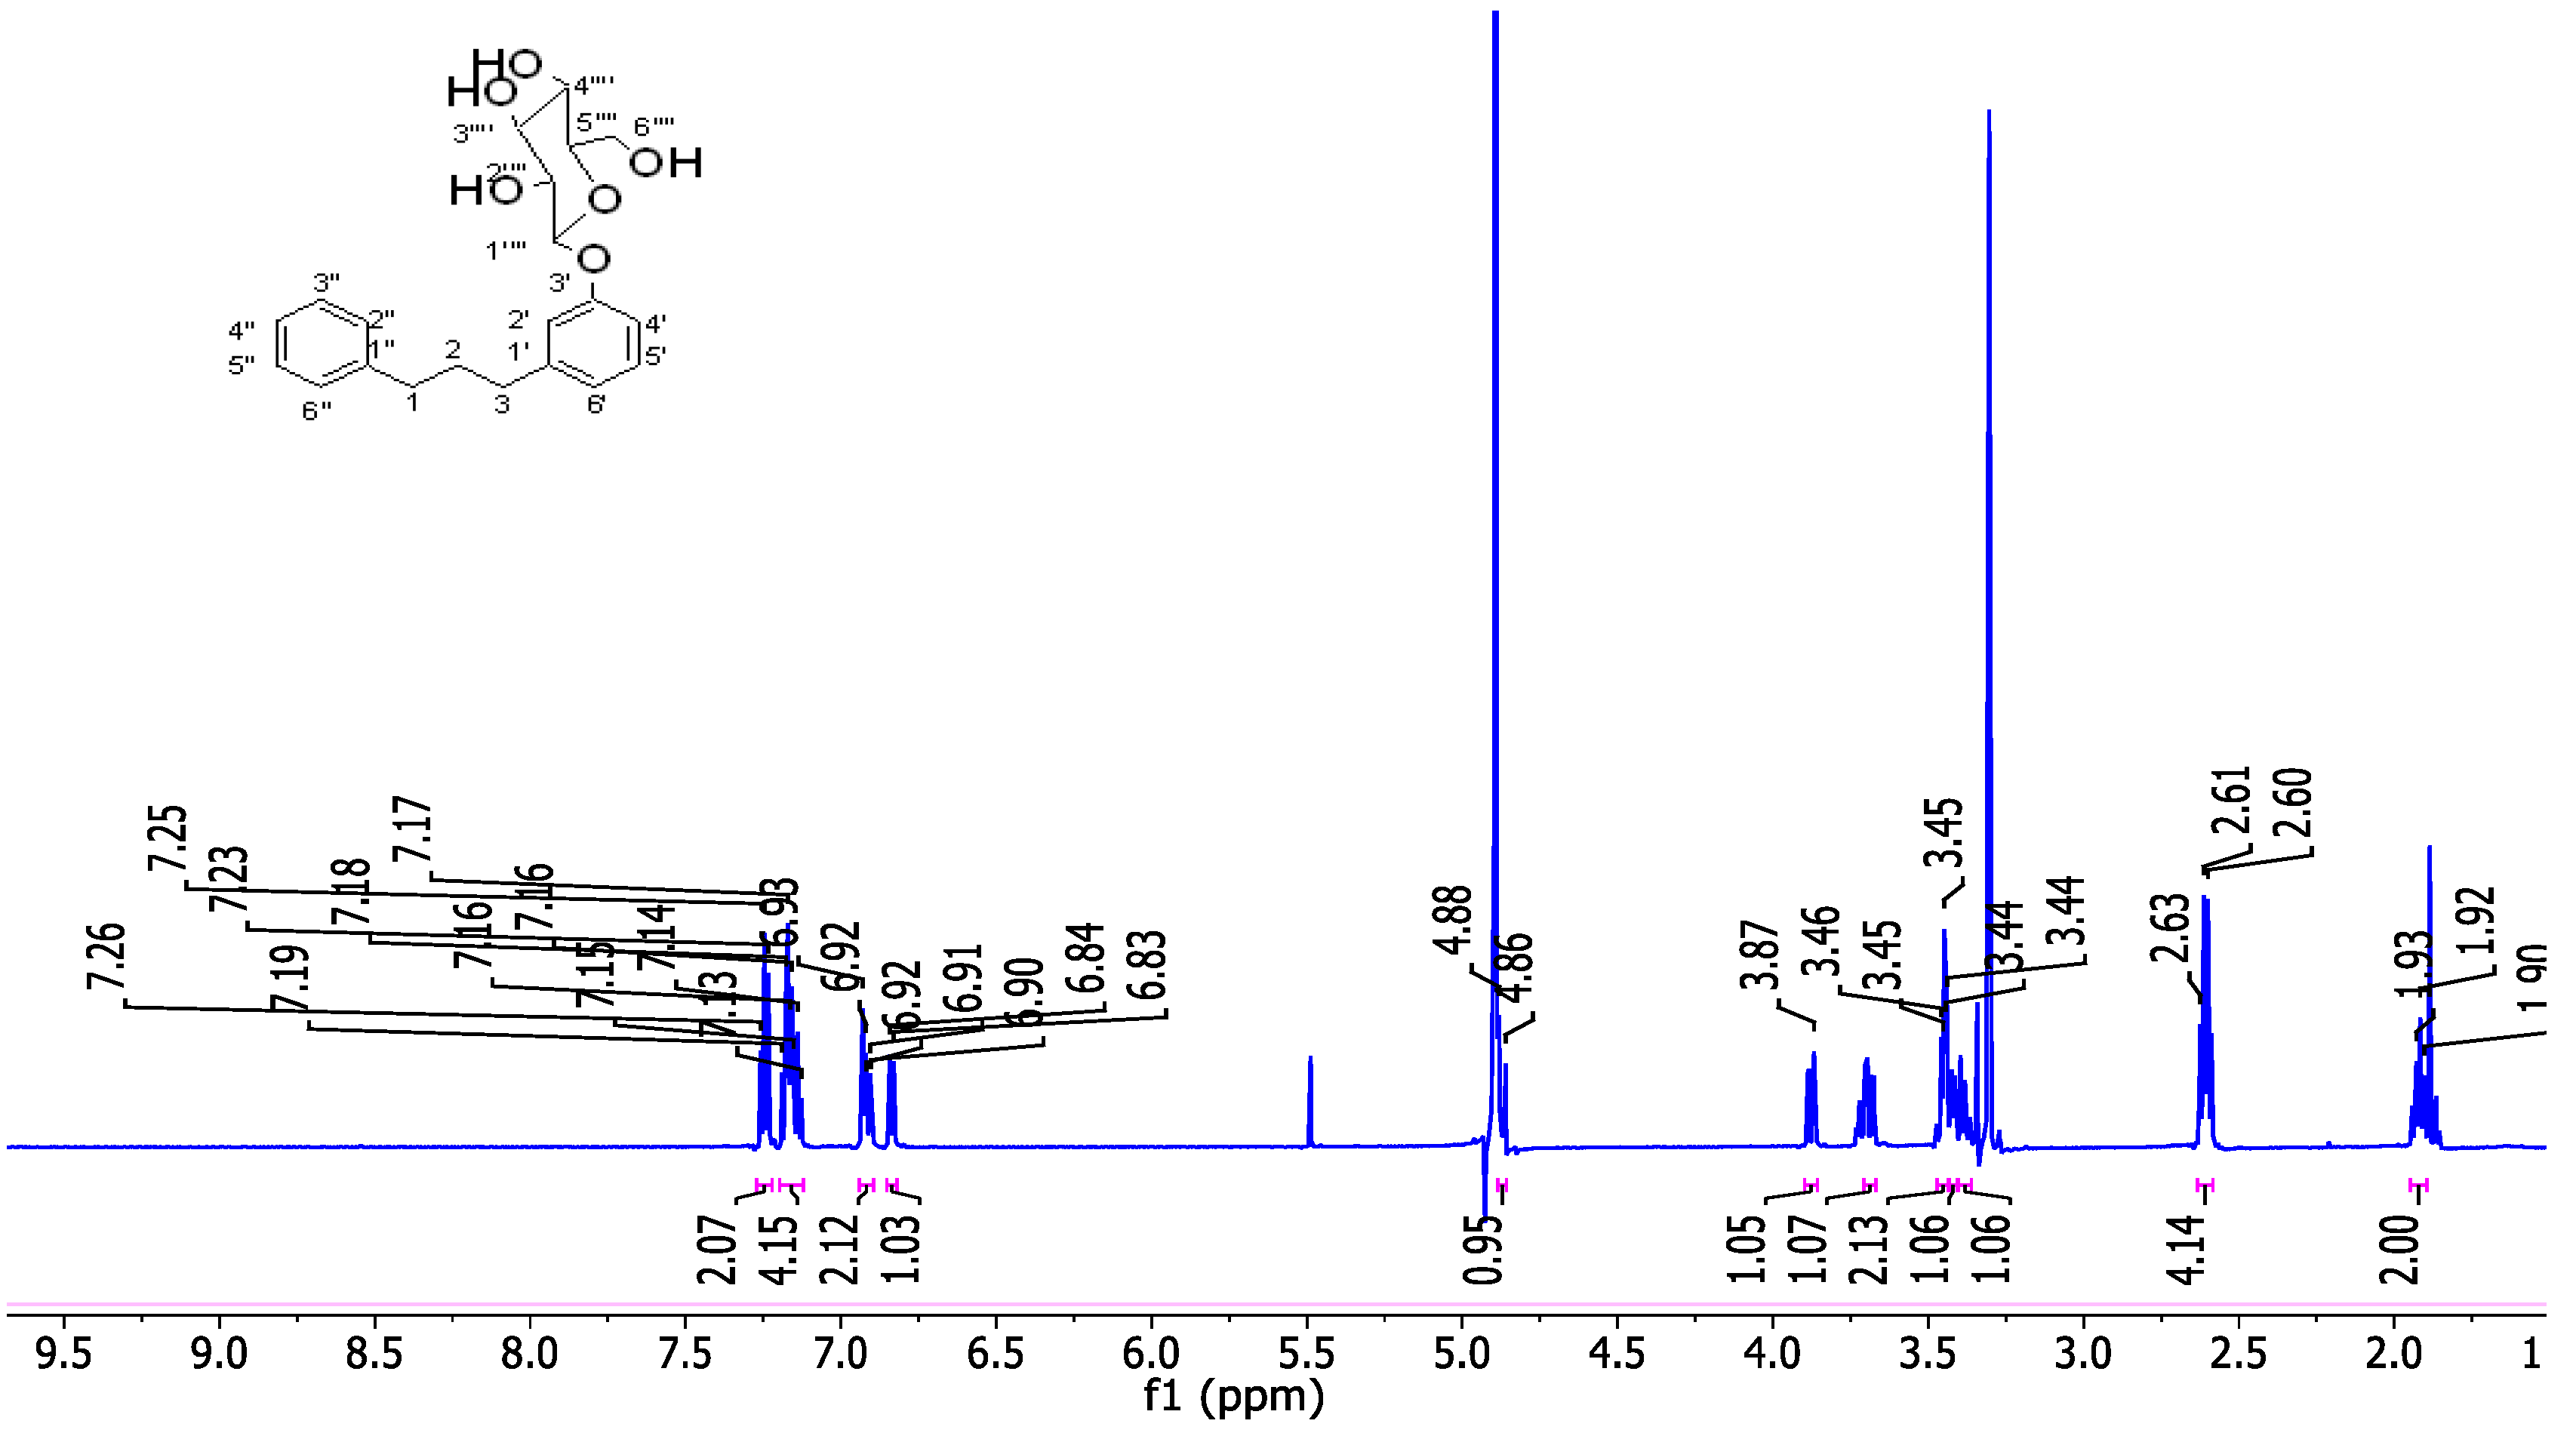
2.2.4. Synthesis of 1-phenyl-3-(4ʹ-C-β-D-2ʹʹʹ,3ʹʹʹ,4ʹʹʹ,6ʹʹʹ-tetrahydroxyglucopyranosyl-3'-hydroxyphenyl)propane (5)

To a solution of 1-phenyl-3-(4ʹ-C-β-D-2ʹʹʹ,3ʹʹʹ,4ʹʹʹ,6ʹʹʹ-tetra-O-benzylglucopyranosyl-3'-hydroxyphenyl)propane (4) (28 mg, 27.2 mmol) in EtOAc (1.5 mL) an,d H2O (4.5 mL) 20% Pd(OH)2/C (50% wet, 20 mg/g, 60 wt %) was added. Hydrogen gas was passed through the reaction mixture, and the progress was monitored by TLC. After stirring for 30 minutes at room temperature, the reaction mixture was filtered to remove the catalyst. The organic layer was evaporated under nitrogen and subsequently freeze-dried, Rf = 0.2 (hexane: THF, 4:6), (yield 80%, 18 mg). 1H NMR (CDCl3, 600 MHz) δ 7.25 (1H, d, J = 6.8 Hz, H-5′), 7.23 (2H, d, J = 7.9 Hz, H-2′′/H-6′′), 7.15 (2H, d, J = 7.9 Hz, H-3′′/H-5′′), 7.13 (1H, d, J = 7.9 Hz, H-4′′), 6.68 (1H, d, J = 6.8, 1.5 Hz, H-6′), 6.65 (1H, d, J = 1.5, H-2′), 4.55 (1H, d, J = 9.6 Hz, H-1'''), 3.85 (dd, 1H, J = 1.8, 11.2 Hz, H-6'''b), 3.70 (dd, 1H, J = 5.0, 11.2 Hz, H-6'''a), 3.56 (1H, t, J = 8.9 Hz, H-3'''), 3.48 (1H, t, J = 9.8 Hz, H-2'''), 3.42 (1H, t, J = 8.0 Hz, H-4'''), 3.40 (1H, m, H-5'''), 2.60 (2H, t, J = 7.7 Hz, H-1), 2.54 (2H, t, J = 7.5 Hz, H-3), 1.88 (2H, pent, J = 7.5 Hz, H-2). 13C NMR (CDCl3, 600 MHz) δ 155.2 (C-3′), 143.3 (C-1′), 142.1 (C-1′′), 128.1 (C-5′), 128.0 (C-2′′/C-4′′), 127.9 (C-3′′/C-5′′), 125.3 (C-4′′), 122.7 (C-4′), 119.5 (C-6′), 115.4 (C-2′), 80.8 (C-5′′′), 78.6 (C-3′′′), 76.8 (C-1′′′), 74.1 (C-2′′′), 70.4 (C-4′′′), 61.5 (C-6′′′), 34.9 (C-3), 34.6 (C-1), 32.9 (C-2).

2.2.5. Synthesis of 1-phenyl-3-(3ʹ-acetoxy-4ʹ-C-(2ʹʹʹ,3ʹʹʹ,4ʹʹʹ,6ʹʹʹ-tetra-O-acetyl-β-D-glucopyranosyl)propane (6)

A solution of 1-phenyl-3-(4ʹ-C-β-D-2ʹʹʹ,3ʹʹʹ,4ʹʹʹ,6ʹʹʹ-tetrahydroxyglucopyranosyl-3'-hydroxyphenyl)propane (5) (15 mg, 0.5 mmol) in Ac2O (0.4 mL) and pyridine (0.2 mL) was kept for 12 h at room temperature. Crushed ice was added to the mixture. The precipitate was filtered and washed with water. A white amorphous product was obtained, Rf = 0.9 (Hexane:THF, 5:5) 10 mg, 43%. 1H NMR (600 MHz, CDCl3) δ 7.27 (1H, d, J = 7.9 Hz, H-5′), 7.24 (2H, d, J = 8.2 Hz, H-2′′, H-6′′), 7.10 (1H, d, J = 8.2 Hz, H-4′′), 7.09 (2H, d, J = 8.2 Hz, H-3′′, H-5′′), 6.99 (1H, dd, J = 1.3, 7.9 Hz, H-6′), 6.80 (1H, d, J = 1.3, H-2′), 5.24 (1H, t, J = 9.8 Hz, H-2'''), 5.23 (t, 1H, J = 9.8 Hz, H-3'''), 5.13 (1H, t, J = 9.8 Hz, H-4'''), 4.52 (d, 1H, J = 9.8 Hz, H-1'''), 4.23 (1H, dd, J = 2.1, 12.4 Hz, H-6'''a), 4.01 (1H, dd, J = 1.7, 12.8 Hz, H-6'''b), 3.80 (1H, ddd, J = 2.1, 4.9, 9.8 Hz, H-5'''), 2.62 (2H, J = 7.7, Hz, H-1), 2.62 (2H, t, J = 7.5 Hz, H-3), 2.35 (3H, s, phenolic OAc), 2.08, 2.05, 1.93, 1.78 (4 x 3H, s, glucose moiety OAc), 1.93 (2H, pent, J = 7.5 Hz, H-2). 13C NMR (600 MHz, CDCl3) δ 148.6 (C-3′), 169.0 – 170.7 (5 x -O-CO-CH3), 144.5 (C-4′), 141.9 (C-1′), 125.2 (C-1′′), 128.5 (C-2′′/C-4′′), 128.4 (C-5′), 128.3 (C-3′′/C-5′′), 122.8 (C-6′), 122.8 (C-2′), 125.8 (C-4′), 62.2 (C-5′′′), 75.1 (C-1′′′), 74.4 (C-2′′′), 71.7 (C-3′′′), 68.5 (C-4′′′), 62.3 (C-6′′′), 35.3 (C-3), 34.9 (C-2), 32.4 (C-1), 21.1 – 20.4 (5 x -O-CO-CH3).

2.2.6. Synthesis of 1-phenyl-3-(3'-O-α- and b-D-2′′′,3′′′,4′′′,6′′′-tetra-O-benzylglucopyranosylphenyl)propane (7a and 7b)

BF3.OEt2 (0.2 mL, 1.55 mmol) was added dropwise to a stirred mixture of 3-(3-phenylpropyl)phenol (3) (52 mg, 0.245 mmol), 2,3,4,6-tetra-O-benzyl-D-glucopyranosylamide (213 mg, 0.3 mmol), and 4Å molecular sieves (100 mg) in dichloromethane (3 mL) at -78 ℃. The reaction mixture was stirred for 3 hours, and subsequently, the temperature was allowed to rise to -40 ℃ and stirred overnight. The reaction mixture was quenched with water and filtered through Celite. The filtrate was extracted with chloroform (3 × 20 mL), the organic layer dried over anhydrous MgSO4, and the solvent evaporated under reduced pressure. The resulting syrup was purified via silica gel thin layer chromatography (Hx: THF; 8:2) to yield a mixture of the a- and b-isomers (110 mg). The mixture was separated via thin layer chromatography (Hx: EtOAc: DCM; 8.5:0.5:1) to afford the a (34 mg) and b (40 mg) glycosylated isomers.
1-phenyl-3-(3'-O-α-D-2′′′,3′′′,4′′′,6′′′-tetra-O-benzylglucopyranosylphenyl)propane(7a)
1H NMR δ (600 MHz, CDCl3 , Me4Si) δ 7.34 – 7.04 (26H, aromatic Hs), 6.84 (1H, d, J =1.8 Hz, H-2′), 6.83 (1H, dd, J = 1.8, 7.5 Hz, H-6′), 6.77 (1H, d, J = 7.6 Hz, H-4′), 5.39 (1H, d, J =3.5, 6.1 Hz, H-1′′′), 4.97, 4.82, 4.77, 4.71, 4.59, 4.50, 4.39, 4.30 (8H, -OCH2-), 4.11 (1H, t, J = 6.3 Hz, H-3′′′), 3.70 (1H, ddd, J = 2.4, 10.0 Hz, H-5′′′), 3.71 (1H, t, J = 10.0 Hz, H-4′′′), 3.65 (1H, d, J = 4.4 Hz, H-2′′′), 3.64 (1H, dd, J = 0.7, 3.6 Hz, H-6′′′b), 3.47 (1H, dd, J = 2.0, 10.7 Hz, H-6′′′a), 2.57 (2H, t, J = 7.7 Hz, H-1), 2.53 (2H, t, J = 7.7 Hz, H-3), 1.89 (2H, pent, J = 7.7 Hz, H-2). 13C NMR (600 MHz, CDCl3) δ 156.7 (C-3′), 142.2 (C-1′), 138.8 – 137.7 (4 x -OCH2-C-), 143.9 (C-1′′), 127.5 – 125.7 (25C, aromatic), 122.4 (C-2′), 116.9 (C-6′), 113.9 (C-4′), 95.3 (C-1′′′'), 75.8 – 73.3 (4 x -OCH2-), 82.0 (C-3′′′'), 79.7 (C-2′′′), 77.4 (C-4′′′), 70.7 (C-5′′′), 68.22 (C-6′′′), 35.45 (C-3), 35.4 (C-1), 32.8 (C-2).
1-phenyl-3-(3'-O-β-D-2′′′,3′′′,4′′′,6′′′-tetra-O-benzylglucopyranosylphenyl)propane (7b)
1H NMR (600 MHz, CDCl3) δ 7.44 – 7.24 (26H, aromatic), 7.01 (1H, dd, J = 1.8, 7.5 Hz, H-6′), 6.99 (1H, d, J = 1.8 Hz, H-2′), 6.96 (1H, d, J = 7.6 Hz, H-4′), 5.09 (1H, d, J = 7.2 Hz, H-1′′′), 4.97 – 4.43 (8H, -OCH2-), 3.85 (1H, dd, J =1.5, 9.2 Hz, H-6′′′b), 384 (1H, t, J = 3.7 Hz, H-3′′′), 3.83 (1H, t, J = 8.9 Hz, H-4′′′), 3.76 (1H, dd, J = 5.2, 10.5 Hz, H-6′′′a), 3.75 (1H, t, J = 6.4 Hz, H-2′′′), 3.69 (1H, ddd, J = 1.6, 6.4 Hz, H-5′′′), 2.69 (4H, t, J = 7.6 Hz, H-1, H-3), 1.99 (2H, pent, J = 7.6 Hz, H-2). 13C NMR (600 MHz, CDCl3) δ 157.5 (C-3′), 144.1 (C-1′′), 144.1 (C-1′) 138.6 – 138.1 (4 x -OCH2-C-), 125.8 – 128.5 (25C, aromatic), 122.9 (C-4′), 114.1 (C-6′), 117.3 (C-2′), 101.8 (C-1′′′'), 84.7 (C-3′′′), 82.1 (C-2′′′), 77.8 (C-4′′′), 75.2 (C-5′′′), 75.8 – 68.9 (4 x -OCH2-), 68.91, (C-6′′′'), 35.45 (C-3), 35.4 (C-1), 32.8 (C-2).

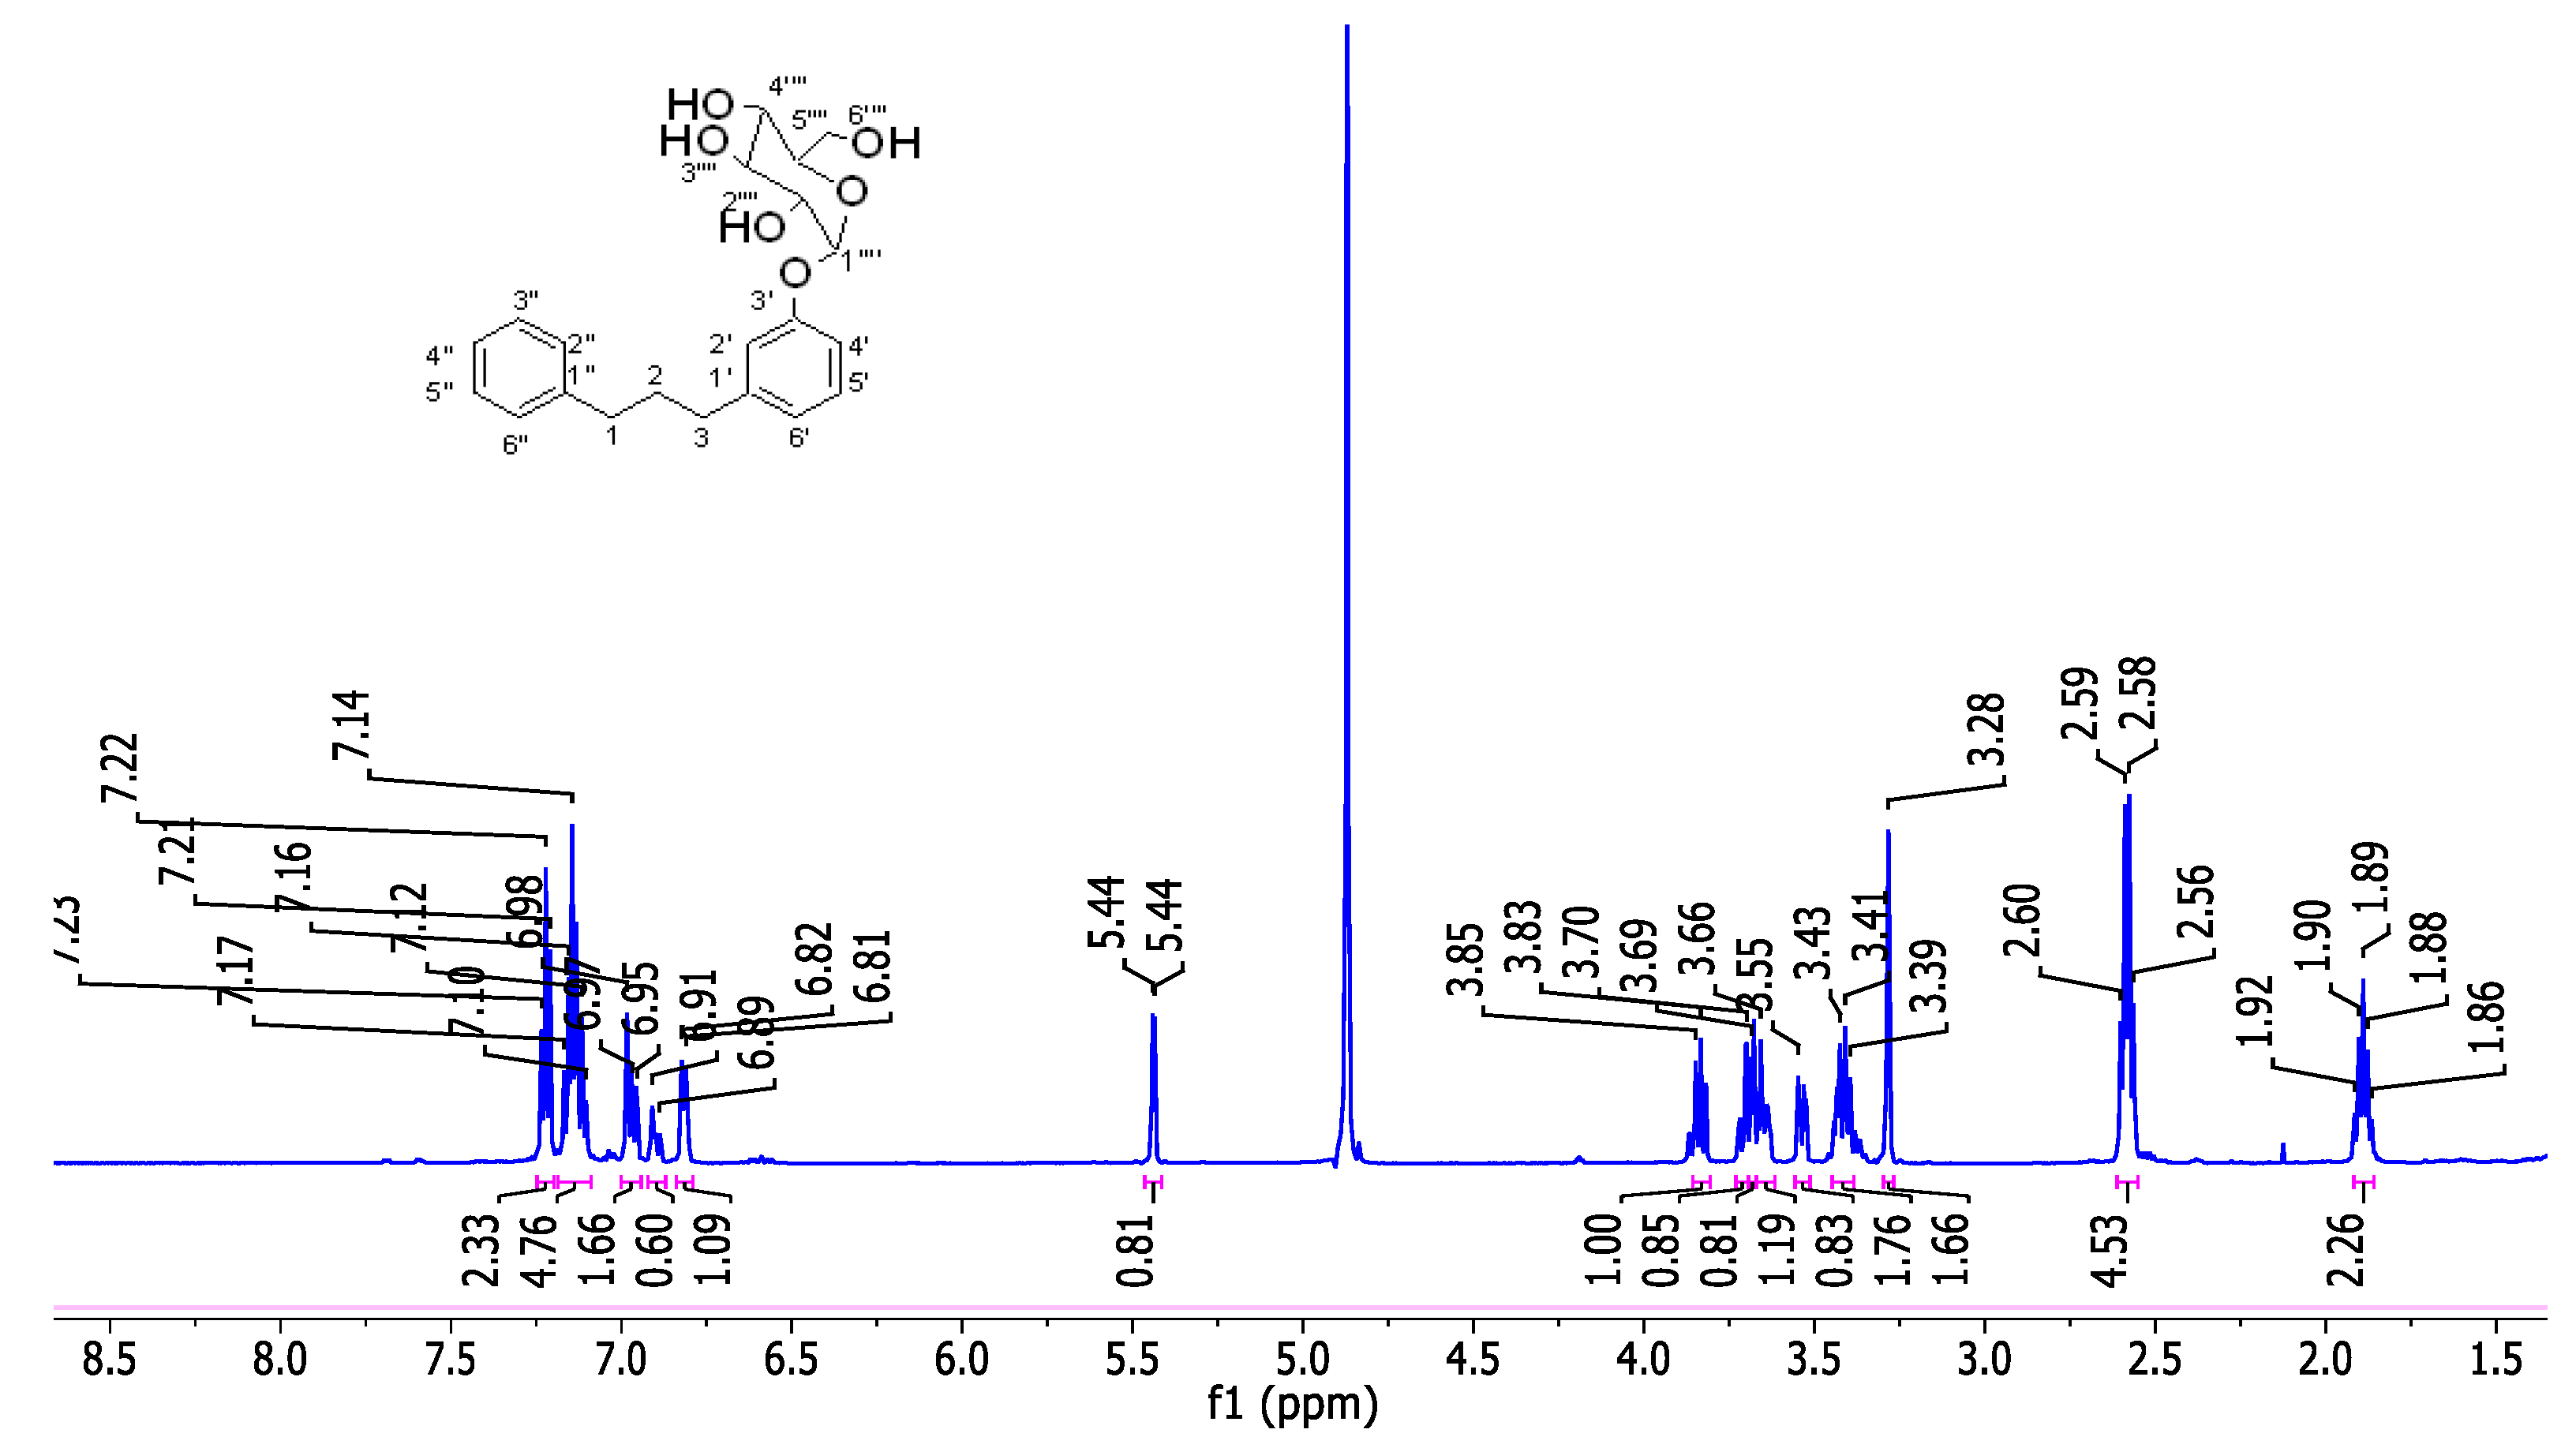
2.2.7. Synthesis of 1-phenyl-3-(3'-O-α-D-2′′′,3′′′,4′′′,6′′′-tetra-hydroxyglucopyranosylphenyl)propane (8a)

To a solution of 1-phenyl-3-(3'-O-α-D-2′′′,3′′′,4′′′,6′′′-tetra-O-benzylglucopyranosylphenyl)propane (7a) (50 mg, mol) in EtOAc (3 mL) and MeOH (1 mL) 20% Pd(OH)2/C (50% wet, 25 mg/g, 60 wt %) was added. The bottle was sealed, and hydrogen gas was passed through the reaction mixture and monitored by TLC. After stirring for 30 minutes at room temperature, the reaction mixture was filtered to remove the catalyst. The organic solvent was removed by vacuum. Rf 0.2 (hexane: etyl acetate (6:4), 20 mg. 1H NMR (600 MHz, CD3OD) δ 7.25 – 7.23 (8H, m, aromatic), 6.82 (1H, d, J = 7.5, H-4′), 5.44 (1H, d, J = 3.6 Hz, H-1'''), 3.87 (1H, t, J = 9.3 Hz, H-3'''), 3.74 (1H, dd, J = 2.2, 11.5 Hz, H-6'''b), 3.69 (1H, dd, J = 4.6, 12.1 Hz, H-6'''a), 3.67 (1H, m, H-5'''), 3.57 (1H, dd, J = 3.6 Hz, H-2'''), 3.41 (1H, t, J = 9.3 Hz, H-4'''), 2.61 (4H, q, J = 7.5 Hz, H-1, H-3), 1.91 (2H, pent, J = 7.5 Hz, H-2). 13C NMR (600 MHz, CD3OD) δ 158.7 (C-3′), 145.2 (C-4′′), 143.5 (C-1′), 130.2 (C-1′′), 129.4 (C-2′′/C-6′′), 129.3 (C-3′′/C-5′′), 126.7 (C-6′), 118.3 (C-2′), 123.5 (C-5′), 115.5 (C-4′), 99.2 (C-1′′′), 74.9 (C-3′′′), 74.2 (C-2′′′), 73.3 (C-4′′′), 71.4 (C-5′′′), 62.5 (C-6′′′), 36.3 (C-2/C-3), 34.4 (C-1).

2.2.8. Synthesis of 1-phenyl-3-(3'-O-β-D-2′′′,3′′′,4′′′,6′′′-tetra-hydroxyglucopyranosylphenyl)propane (8b)

To a solution of 1-phenyl-3-(3'-O-β-D-2′′′,3′′′,4′′′,6′′′-tetra-O-benzylglucopyranosylphenyl)propane (7b) (600 mg, 817 mmol) in ethyl acetate (1.5 mL) and water (4.5 mL), 20% Pd(OH)2/C (50% wet, 40 mg/g, 60 wt %) was added. The bottle was sealed, and hydrogen gas was passed through the reaction mixture and monitored by TLC. After stirring for 30 minutes at room temperature, the reaction mixture was filtered to remove the catalyst. The organic layer was evaporated under nitrogen, followed by freeze-drying, to yield the title compound (5 mg) (Hx: THF, 4:6, Rf 0.2). 1H NMR (600 MHz, CD3OD) δ 7.25 – 7.23 (8H, m, aromatic), 6.82 (1H, d, J = 7.5 Hz, H-4′), 4.88 (1H, d, J = 12.2 Hz, H-1'''), 3.69 (1H, dd, J = 4.4, 12.0 Hz, H-6'''a), 3.85 (1H, dd, J = 2.1, 12.0 Hz, H-6'''b), 3.48 (1H, t, J = 12.2 Hz, H-3'''), 3.44 (1H, t, J = 12.2 Hz, H-2'''), 3.41(1H, dd, J = 2.2, 5.4 Hz, H-4'''), 3.38 (1H, m, H-5'''), 2.60 (4H, t, J = 7.7 Hz, H-1, H-3), 1.91 (2H, pent, J = 7.7 Hz, H-2). 13C NMR (600 MHz, CD3OD) δ 159.2 (C-3′), 145.2 (C-4′′), 143.5 (C-1′), 130.2 (C-1′′), 129.5 (C-2′′/C-6′′), 129.3 (C-3′′/C-5′′), 126.7 (C-6′), 123.6 (C-5′), 117.9 (C-2′), 115 (C-4′), 102.3 (C-1′′′), 78.1 (C-3′′′), 78.0 (C-2′′′), 74.9 (C-4′′′), 71.4 (C-5′′′), 62.5 (C-6′′′), 36.3 (C-2, C-3), 34.4 (C-1).

2.3. In vitro Anti-Diabetic Investigation of the Compound 5

The anti-diabetic potential of the main product (5) of the glycosylation process was investigated through α-amylase and α-glucosidase inhibition. α-Amylase and α-glucosidase are key carbohydrate-digesting enzymes commonly targeted in vitro to evaluate the antidiabetic potential of natural and synthetic compounds [16]. Inhibiting either enzyme slows carbohydrate breakdown and reduces post-prandial glucose spikes, a major therapeutic goal in type 2 diabetes management. In vitro assays measuring the ability of test compounds to inhibit α-amylase and α-glucosidase activities, therefore, serve as reliable indicators of their potential to directly modulate glucose release and absorption, with α-glucosidase inhibition often showing a stronger correlation with effective glycemic control [17].

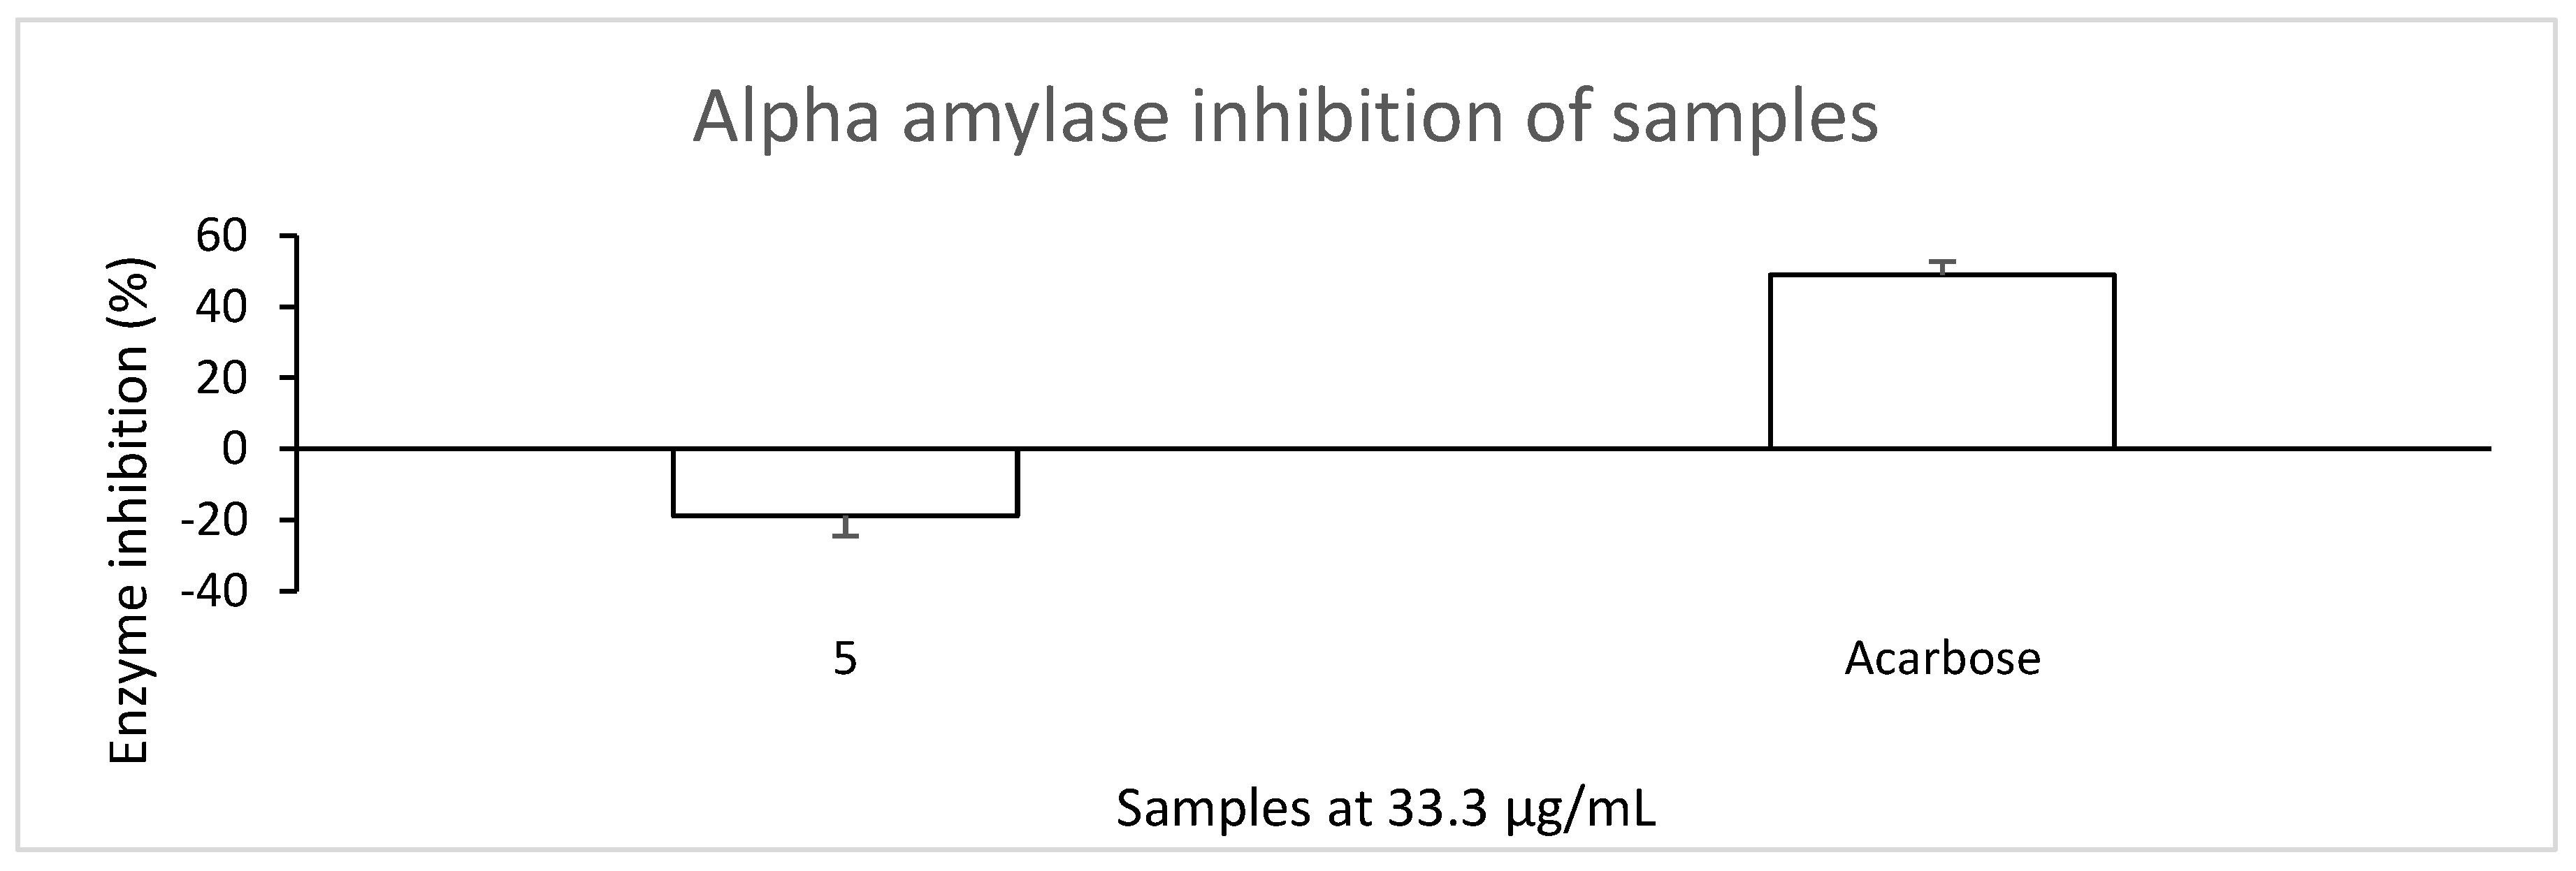
2.4. Measurement of α-Amylase Inhibition

A previous method [18] was adopted with modifications to perform the α-amylase inhibition assay. To perform the assay, 75 μL of the tested sample or acarbose (at 33.3 µg/mL in assay volume) was mixed with 75 μL of 3 U/mL porcine pancreatic amylase solution (dissolved in 100 mM phosphate buffer, pH 6.8) in a vial. An equivalent volume of distilled water was used as the control. The mixture was incubated at 37 °C for 15 minutes before the addition of an equivalent volume of 1% starch solution (dissolved in 100 mM phosphate buffer, pH 6.8). Thereafter, the mixture was incubated for another 30 min at 37 °C, and 75 μL of dinitrosalicylate color reagent was added. The mixture was put in a boiling water bath for 10 minutes. After cooling, the mixture was centrifuged (Hettich Mikro 200 microcentrifuge, Hettich Lab Technology, Tuttlingen, Germany) at 5000 x g for 5 min. An aliquot of 150 μL of the supernatant was transferred into a 96-well plate and absorbance was measured at 540 nm. The enzyme inhibition (%) was calculated as follows:
I n h i b i t i o n   % = A b s o r b a n c e   o f   c o n t r o l A b s o r b a n c e   o f   t e s t A b s o r b a n c e   o f   c o n t r o l   x   100  

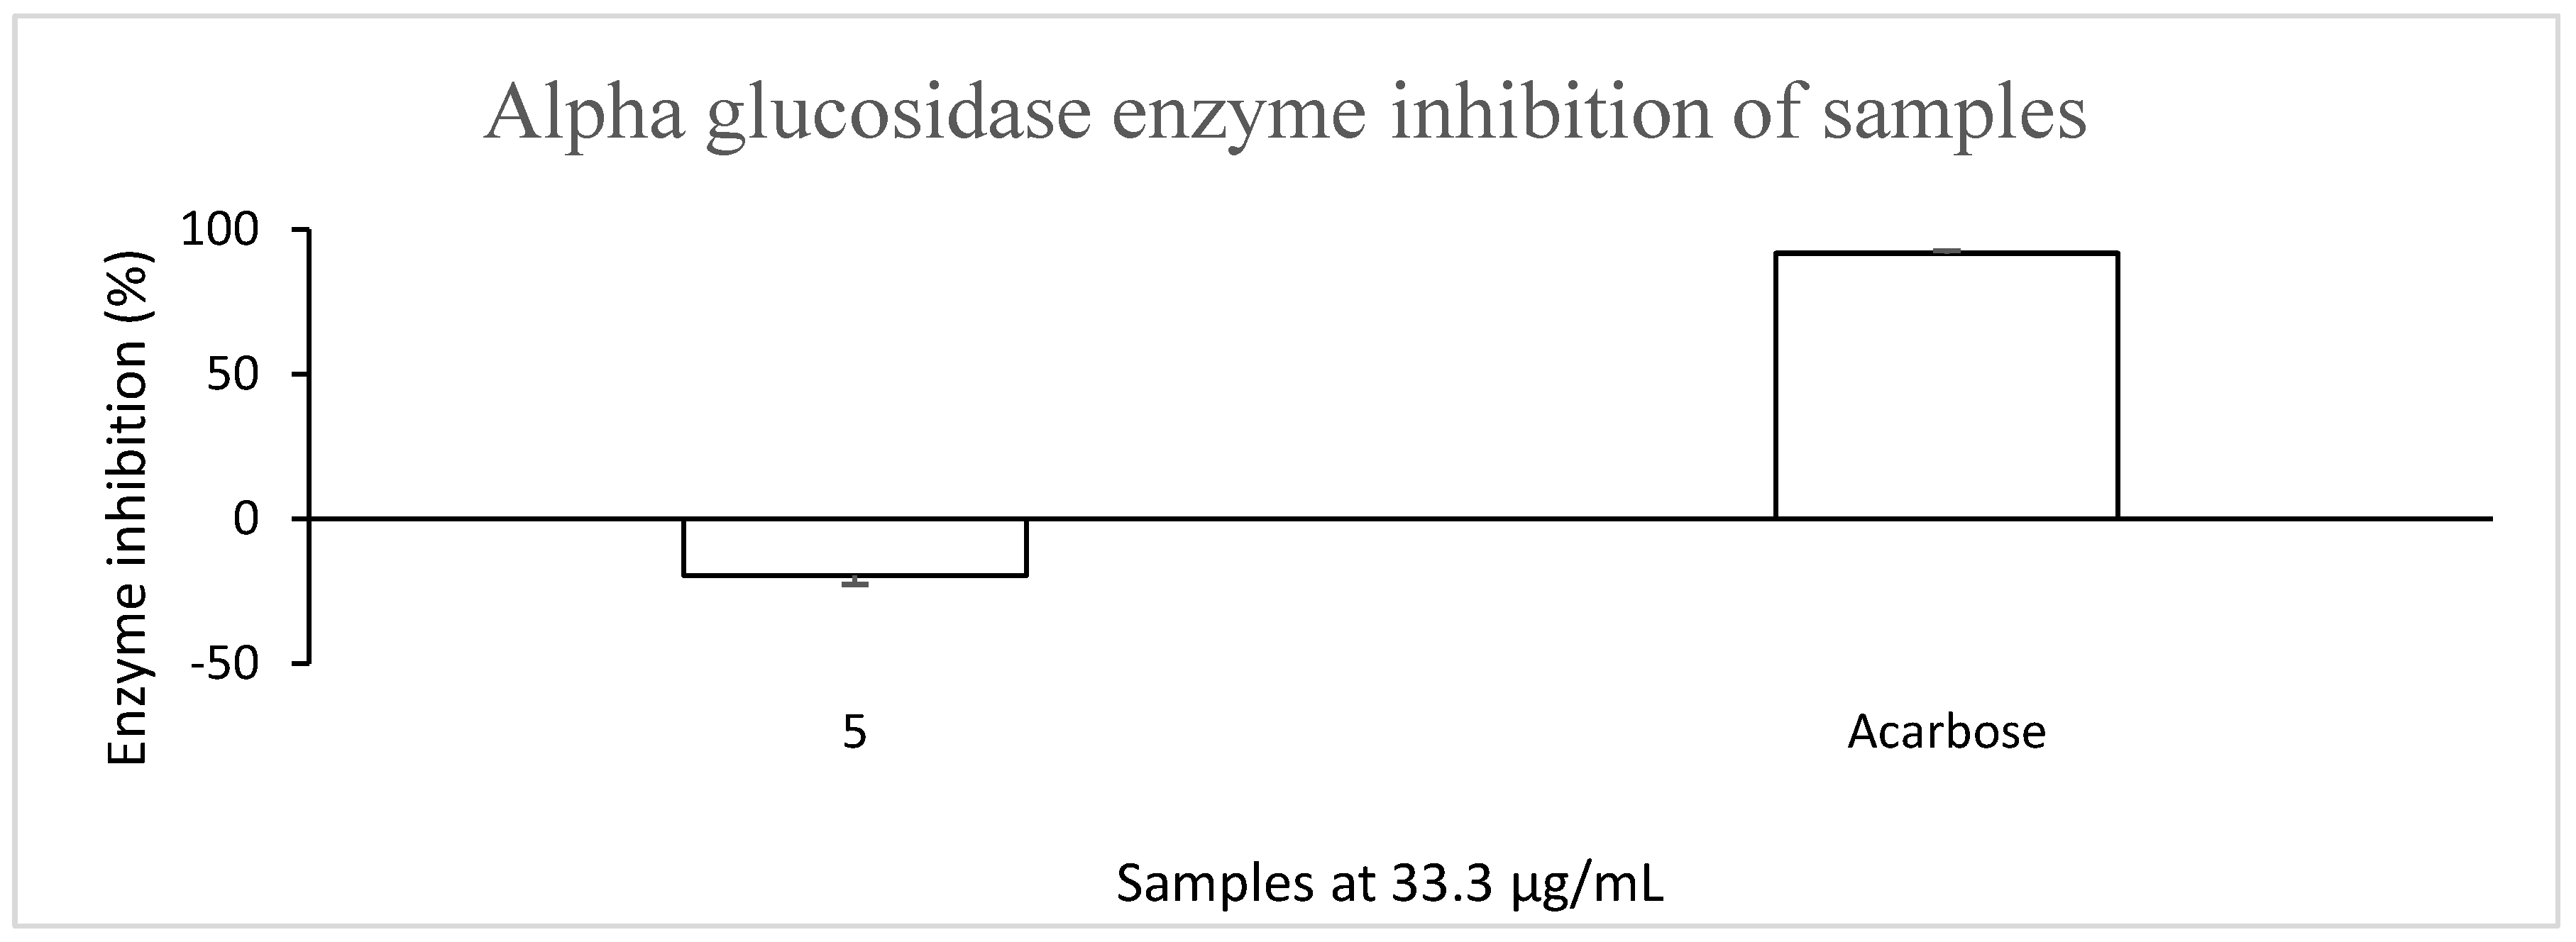
2.5. Measurement of α-Glucosidase Inhibition

A previous method [19] was adopted to perform the glucosidase inhibition assay. It was done on a 96-well transparent plate. First, 25 µL of the tested sample or acarbose (at 33.3 µg/mL in assay volume) or their solvents (control) and 25 µL of a 4 U/mL ⍺-glucosidase solution (dissolved in 100 mM phosphate buffer, pH 6.8) were incubated for 10 min at 37 °C. Next, 50 µL of 10 mM 4-nitrophenyl-β-D-glucopyranoside substrate solution (dissolved in 100 mM phosphate buffer, pH 6.8) was added, and incubation continued for an additional 20 min under the same incubation conditions. After incubation, the enzyme-substrate reaction was stopped by adding 100 µL of a 0.1 M Na2CO3 solution, and absorbance was measured at 405 nm. The absorbances were blanked using the sample and solvent blanks. The enzyme inhibition activity of the samples was computed using the formula below:
I n h i b i t i o n   % = A b s o r b a n c e   o f   c o n t r o l A b s o r b a n c e   o f   t e s t A b s o r b a n c e   o f   c o n t r o l   x   100  

2.6. In Silico Procedure

The drug potentials of the synthesised compounds were evaluated through integrated computational techniques. The compounds' physicochemical and pharmacodynamics (ADMET) properties were studied through machine learning. Density Functional Theory (DFT) and molecular dynamics simulations were further conducted to uncover the reactivity and impact on the conformational dynamics of proteins implicated in the advancement of diabetes.

2.7. Biological Activity Prediction

The antidiabetic biological activity of the compounds was evaluated using PASSonline software [20]. This platform is used to determine the physiological activity of diverse compounds based on their chemical structure by using their 2D molecular fragments, referred to as multilevel neighbors of atom descriptors. These descriptors are used to predict the biological activity of a compound as a function of its molecular structure [20]. The activity of a compound is evaluated as probable activity (Pa) and probable inactivity (Pi); thus, a compound is active if its Pa is greater than its Pi [21]. Specifically, compounds with predicted Pa values greater than 0.7 are considered bioactive with high confidence, whereas those with Pa values below 0.5 are regarded as inactive. Compounds with Pa values between 0.5 and 0.7 are considered moderately active and may require further experimental validation [22], [23].

2.8. Physicochemical and Pharmacokinetics Study

The physicochemical properties and pharmacokinetics of the compounds were determined using Swiss/ADME and ProTox-II [24,25]. These tools use machine learning and predictive models to determine the properties of potential drugs.

2.9. Density Functional Theory

Density function theory is popular in the study of the structure, electron density, and electron transfer of compounds via quantum chemical computations [26]. It has been used extensively in determining the reactivity and stability of potential drugs. The calculations involving the optimisation of the ground-state geometries were performed using the Gaussian 09 program [27]. They were optimised by employing Becke3-Yang-Parr (B3) [28,29] exchange function integrated with the LYP correlation functional with 6-311G++(2d,2p) basis set. Chemical descriptors of the compounds were calculated using the following equations:
Eg = E L U M O E H O M O
I = E H O M O
A = E L U M O
χ = I + A 2
Ƞ = I A 2
δ = 1 Ƞ
ω = ( E L U M O + E H O M O ) 4 ( E L U M O E H O M O 2
ω = ( 3 E H O M O E L U M O ) 2 16 Ƞ
ω + = E H O M O + 3 E L U M O 2 16 Ƞ
Δ ω ± = ω + + ω
where Eg = energy gap, I = ionization potential, A = electron affinity, χ = electronegativity, Ƞ = global hardness, δ = global softness, ω = electrophilicity index, ω- = electron donating power, ω+ = electron accepting power and Δω± = electrophilicity.

2.10. Targets Retrieval and Processing

Six (6) proteins reported to advance the development of diabetes were retrieved from the RSCB protein data bank. These proteins included Protein Kinase B (AKT) [30], AMP-activated kinase (AMPK) [31], Glucose Transporter type 4 (GLUT4) [32], Protein Kinase C [33], Sodium-Glucose Cotransporter 2 (SGLT2) [34], and sirtuin 6 (SIRT6) [35] with PDB IDs of 2GU8, 6BX6, 7WSM, 8UAK, 8HIN, and 6XVG respectively. The proteins were first preprocessed using the protein preparation wizard incorporated in Maestro Schrodinger [36]. Proteins with missing residues were remodeled using the Prime module. Hydrogen bonds and bond orders were allocated. Disulfide bonds were assigned, and the het states were determined using Epik at a pH of 7.4 ± 2.0 [37]. OPLS4 forcefield [38] and PROPKA were then used to optimise and minimise the structures. The co-crystallised compounds defined the binding sites of the proteins. For SIRT6, the main binding site occupied by Adenosine-5-Diphosphoribose (native ligand) and the allosteric site were both processed for docking. The receptor grids for each protein were prepared using the default settings of the receptor grid generation module. The compounds were modeled using the Maestro 2D sketcher, and their 3D structures were built using the LigPrep module [39]. This module was further used to establish the protonation states of the compounds through Epik. Tautomeric conformations of the compounds were not considered.

2.11. Molecular Docking

The standard precision (SP) and extra precision (XP) protocols of Glide [40] were used to perform the molecular docking of the compounds to receptors. Redocking was performed for the co-crystallised compounds to serve as controls.

2.12. Molecular Dynamics Simulations

After assessing the docking results, one of the receptors in complex with the compounds was selected for further analysis through molecular dynamics simulations. Desmond [41] was used to perform all simulations. The receptor-compound complexes, including an unbound receptor (Apo), were embedded separately in a predefined Transferable Intermolecular Potential with 3 Point (TIP3P) water model [42] in an orthorhombic box and buffered at distances of 10.0 Å each for the X, Y, and Z directions. The systems were then neutralised by adding Na+ and Cl- counter ions. The OPLS4 force field was used to build the systems. 200 ns of MD was then performed under normal pressure and temperature (NPT). The simulation interaction diagram module analysed the MD trajectories and coordinates generated.

3. Results and Discussion

As a model reaction, the synthesis of the O- and C-glucosylated 1,3-diarylpropane derivatives of 1-phenyl-3-(3ʹ-hydroxy)phenyl chalcone was investigated, followed by antidiabetic tests and in silico experiments. The synthesis of the (E)-1-(3-hydroxyphenyl)-3-phenylpropane C-glucoside derivative is depicted in Figure 1. Amidation of 2,3,4,5-O-tetrabenzyl-b-D-glucose afforded the glucose amidate 1. Under basic conditions, the aldol condensation of acetophenone and 3-hydroxybenzaldehyde yielded (E)-3-(3-hydroxyphenyl)-1-phenylprop-2-en-1-one 2 (chalcone). Han et al. (2014) reported that the carbonyl group of the chalcone inhibits the C-glucosylation reaction [14]. Thus, 2 was hydrogenated under high pressure to reduce the chalcone to 1,3-diarylpropane (3) (Supplementary Figure S1-S3). The 3-(3-phenylpropyl)phenol (3) was glucosylated with 2,3,4,5-tetra-O-benzyl-D-glucopyranosylamide (1) in the presence of TMSOTf or BF3.OEt2 (. During the reaction, the temperature was slowly increased from -78 ℃ to RT to yield the C-glucosylated 1,3-diarylpropane 4 as the final product (Supplementary Figure S4-S7).
Scheme 1. Synthesis of 1-phenyl-3-(4ʹ-C-β-D-2ʹʹʹ,3ʹʹʹ,4ʹʹʹ,6ʹʹʹ-tetra-O-benzylglucopyranosyl-3'-hydroxyphenyl)propane 4.
Preprints 187432 sch001
The mechanism proceeds with the formation of the α/β-O-glucosylated intermediates 7a and 7b as the temperature is raised from -78 ℃ to -40 ℃ in the presence of TMSOTf or BF3.OEt2. The O-glucosylated intermediates undergo an in situ Fries-rearrangement to the 4ʹ position as the temperature is increased to room temperature to yield the b-isomer of the target molecule 4. Work-up of the reaction mixture after raising the temperature from -78 ℃ to -40 °C afforded a mixture of the α/β-O-glucoside isomers . The isomers were separated via TLC to isolate 1-phenyl-3-(3'-O-α-D-2′′′,3′′′,4′′′,6′′′-tetra-O-benzylglucopyranosylphenyl)propane 7a and 1-phenyl-3-(3'-O-β-D-2′′′,3′′′,4′′′,6′′′-tetra-O-benzylglucopyranosylphenyl)propane 7b. Catalytic hydrogenation at atmospheric pressure of 4, 7a (Supplementary Figure S14-S17), and 7b (Supplementary Figure S18-S20) yielded the free phenolic derivatives 5, 8a, and 8b (Supplementary Figure S21-S24), respectively, and subsequent acetylation of 5 afforded derivatives 6 (Supplementary Figure S10-S13).
The 1H NMR spectrum of 2 displayed the characteristic α,b-unsaturated carbonyl functionality associated with chalcones, with H-2 resonating at dH 7.73 (d, 16 Hz) and H-3 at dH 7.81 (d, 16 Hz). The resonance at dC on the 13C NMR spectrum confirmed the presence of the carbonyl functionality. The physical data of chalcone 2 corresponds to published data [15]. Salient in the 1H NMR spectrum of compound 3 is the disappearance of the two doublet resonances of the α,b-unsaturated carbonyl functionality, which is replaced with two saturated triplets for H-1 (dH 2.65) and H-3 (dH 2.63), and a multiplet at dH 1.90, indicating a propyl moiety. The absence of the carbonyl resonance in the 13C NMR spectrum confirmed the complete reduction of 2. The physical data of 3 corresponds to published data [43]. The 1H NMR spectrum of 4 showed a pentet peak at δ 1.99 assigned for two protons of C-2. The multiplet at δ 2.68 were assigned to H-1 and H-3. The multiplet at δ 3.62 was assigned to H-5′′′, while the signal centered at δ 3.75 was assigned to H-6′′′a. The resonance at δ 3.85 was assigned to H-6′′′b, while the triplet at δ 3.56 was assigned to H-3′′′. The resonances between δ 5.02 and 3.86 are characteristic of benzylic protons. The ABX system of the aromatic ring A was observed at 6.77 as a doublet of doublets assigned to H-6′ and as a doublet at δ 6.86 assigned to H-2', while the doublet at 7.18 with J = 7.7 Hz, was assigned to H-5′. The 28 aromatic protons overlapped between δ 7.43 and 7.05.
Salient in the 1H NMR spectra of the final product 1-phenyl-3-(4ʹ-C-β-D-2ʹʹʹ,3ʹʹʹ,4ʹʹʹ,6ʹʹʹ-tetrahydroxyglucopyranosyl-3'-hydroxyphenyl)propane (5) showed the three 1,3-diaryl propane methylene moieties that resonated as a multiplet at δ 1.88 (H-2), a triplet at 2.54 (H-3), and a triplet at 2.60 (H-1) (Figure 2). The sugar moiety yielded resonances at δ 3.85, 3.70, 3.56, 3.48, 3.42 and 3.40 representing the protons at H-6'''b, H-6'''a, H-3''', H-2''', H-4''' and H-5''' respectively, while a doublet at δ 4.55 was assigned to H-1''' and correlated with the anomeric carbon at δC 76.8 (C-1′′′) in the edited HSQC spectrum. The ABX system of ring A gave three resonances, two doublets at δ 7.25 (H-5′) and 6.65 (H-2′), while the doublet of doublets centered at δ 6.68 was assigned to H-6′. The doublet at δ 7.13 was assigned to H-4′′, while the doublets at δ 7.23 and 7.15 were assigned to H-2′′/H-6′′ and H-3′′/H-5′′, respectively (Supplementary Figure S8-S9).
The α- and β-O-glucosides were prepared by monitoring the reaction mixture at -40 °C by TLC until 2,3,4,6-tetra-O-benzyl-D-glucopyranosylamide was fully consumed. Two products were isolated after work-up namely 1-phenyl-3-(3'-O-α-D-2′′′,3′′′,4′′′,6′′′-tetra-hydroxyglucopyranosylphenyl)propane (8a) (Figure 3) and 1-phenyl-3-(3'-O-β-D-2′′′,3′′′,4′′′,6′′′-tetra-hydroxyglucopyranosylphenyl)propane (8b) (Figure 4). Evidence of the α and β anomers was determined by NMR spectroscopy. An anomeric proton of α-configuration was assigned as a doublet at δ 5.44 with small coupling (J = 3.6 Hz), and an anomeric β-configuration proton was observed as a doublet at δ 4.88 with large coupling (J = 12.2 Hz). The carbons of the two anomers of α and β configuration were assigned at 99.2 and 102.3, respectively.
The HR-ESIMS in negative mode (m/z is [M-H]- ions) of β-C-glucoside 5 (C21H26O6 exact mass: 374.1729 demonstrated a peak correlating to the presence at m/z 373.1649, while β-O-glucoside 8b (C21H26O6 exact mass: 374.1729) gave a molecular ion at m/z 373.1650 (calculated exact mass 273.1651).

3.1. Compound 5 Showed No Inhibitory Activity Against α-Glucosidase and α-Amylase

The inhibitory activity of compound 5 against α-glucosidase and α-amylase, which was the main product of the glycosylation process, was evaluated. The results are presented in Figure 5 and Figure 6. The negative results obtained for compound 5 against both enzymes indicate that it has no inhibitory activity against the enzymes. The raw values are presented in Supplementary Tables S1 and S2. Though α-glucosidase and α-amylase are critical enzymes in the control of diabetes, targeting upstream enzymes and signaling pathways has also been reported as a therapeutic targeting strategy for diabetes control and monitoring [44]. Interestingly, aspalathin has been reported to influence diabetes through several proteins, including activating AMP-activated protein kinase (AMPK) to increase glucose reuptake [45], and PI3K / AKT (Insulin Signaling Pathway) to improve insulin signaling [46], [47] among others, aside from α-glucosidase and α-amylase inhibition. Therefore, the antidiabetic properties of compounds 5, 8a, and 8b were evaluated via the activation of other proteins in silico.

3.2. In Silico Analysis

3.2.1. Biological Activity of Compounds

Firstly, the synthesised compounds' antidiabetic biological activity was determined through the analysis of structure-activity relationships using PASSonline, which considered more than 250,000 biologically active substances involving leads, drugs, drug candidates, and toxic compounds. As presented in Table 1, the compounds showed Probable activity (Pa) greater than Probable inactivity (Pi) regarding antidiabetic activity. The compounds' results were compared to aspalathin, a known antidiabetic compound isolated from rooibos tea (Aspalathus linearis) from South Africa [48]. These results suggest all the synthesised compounds have antidiabetic properties since their probable activity is greater than 0.7. The average accuracy of predicted bioactivity of this technique in leave-one-out cross-validation, in which every compound is isolated from the training set and its activity determined depending on the structure-activity relationship obtained from the rest of the training set, is about 95% [49]. This platform has therefore been used by pharmacologists, medicinal chemists, and toxicologists [20], and the results have been validated by subsequent synthesis and biological testing [50,51,52]. After determining the antidiabetic potentials of the compounds, further analyses were performed to determine their drug-likeness.

3.2.2. The Synthesised Compounds Show Relatively Better Drug-Likeness Than Aspalathin

Approximately 60% of clinical trials of potential drugs have been aborted due to poor ADME and toxicity properties [53]. Comparative assessment of the synthesised compounds and aspalathin was therefore undertaken. The physicochemical properties of the compounds, which determine their pharmacokinetics, are presented in Table 2. The Lipinski rule of five was used as the cornerstone of analysis. This rule states that a compound is more likely to be an orally active drug if it has a molecular weight (MW) less than 500 Daltons, lipophilicity less than 5 (LogP), hydrogen bond donors (HBD) ≤ 5, and hydrogen bond acceptors (HBA) ≤10 [54]. As presented in Table 1, all the synthesised compounds met the Lipinski guidelines. Aspalathin, a natural compound, however, violated two rules: the number of hydrogen acceptors and donors exceeded the limits. Aside from the Lipinski rule of five, the topological polar surface area of the compounds was also determined. This descriptor is prominent in predicting the drug-likeness of a candidate relative to its ability to permeate cell membranes, which is crucial for blood-brain barrier penetration and oral bioavailability. TPSA values below 140 Å2 are generally considered to have good oral bioavailability, while those below 90 Å2 further effectively cross the lipid-rich blood-brain barrier (BBB) [55]. Thus, the lower the TPSA, the higher the bioavailability and BBB penetration, and vice versa. With this parameter, the compounds except aspalathin showed good bioavailability, though without the ability to cross the BBB. Probing further on the drug-likeness of the compounds, their partition coefficients between octanol and water (LogP) were assessed. This quantifies the compounds’ lipophilicity, which determines how they interact with biological membranes. For good membrane permeability, moderate logP values, usually between 0 and 1, are desired, while a value less than 5 is ideal for good oral bioavailability [56]. All the compounds, including aspalathin, showed logP values less than 5. While the synthesised compounds showed logP values between 0 and 1, aspalathin showed a negative value (-0.49). This variation indicates that aspalathin is relatively more hydrophilic and would be more available in the bloodstream, which could lead to its rapid excretion.
On the other hand, the synthesised compounds would tend to accumulate more in fatty tissues, decreasing their excretion rate. Additionally, the moderate logP values of the compounds will alleviate any toxicity and off-target effects that arise from high logP values. This was further supported by the logS (solubility) values, in which the synthesised compounds showed slightly lower water solubility than aspalathin. These findings collectively indicate that the synthesised compounds had improved physicochemical properties than aspalathin. The metabolism and toxicities of the compounds were further assessed to obtain further insights into their pharmacokinetics, particularly their interactions with liver enzymes.

3.2.3. The Synthesised Compounds Exhibit High GI Absorption with Good Metabolism and Low Toxicity

The distribution of the compounds vis-à-vis the blood-brain barrier (BBB) and the gastrointestinal tract (GI) was assessed. The physicochemical properties of the compounds determine these parameters. The synthesised compounds showed higher GI absorption than aspalathin. However, none of the compounds, including aspalathin, has the potential to cross the BBB. The metabolism of the compounds was analysed via their impact on the cytochrome P450 family of enzymes. These groups of enzymes are the primary metabolic enzymes and are responsible for the metabolism of many drugs [57]. Thus, assessing the impact of these enzymes on the compounds offers insights into their half-life, potential drug-drug interactions, and bioavailability. The major CYP450 enzymes comprising CYP1A2, CYP2C19, CYP2C9, CYP2D6, and CYP3A4 were considered. As presented in Table 3, the synthesised compounds inhibit only CYP 2D6. The minimal inhibition of the enzymes indicates the compounds are not likely to interfere with the metabolic activities of these enzymes and thus have limited ability to induce drug-drug interactions and toxicities. These compounds will therefore not alter the plasma concentrations of most drugs and can be used in a wide range of patients without contraindications. This is important, especially in the fight against diabetes, wherein most patients develop secondary conditions that require co-administration of medications. The singular inhibition of CYP 2D6 by the synthesised compounds could, however, indicate their limitation among a small subset of patients since this enzyme exhibits genetic polymorphism [58]. Further assessment showed that the synthesised compounds are all P-glycoprotein (P-gp) substrates, unlike aspalathin. This is a membrane-bound efflux protein that is pivotal in drug absorption, distribution, and excretion, especially in the BBB, liver, intestines, and kidneys [59]. By being substrates, these compounds can be transported out of the cells by this protein, thus reducing their effectiveness. Toxicity studies showed that the compounds were less toxic. More than 1000mg is required to kill 1 kg of cells under study, which highlights the safety of the compounds.

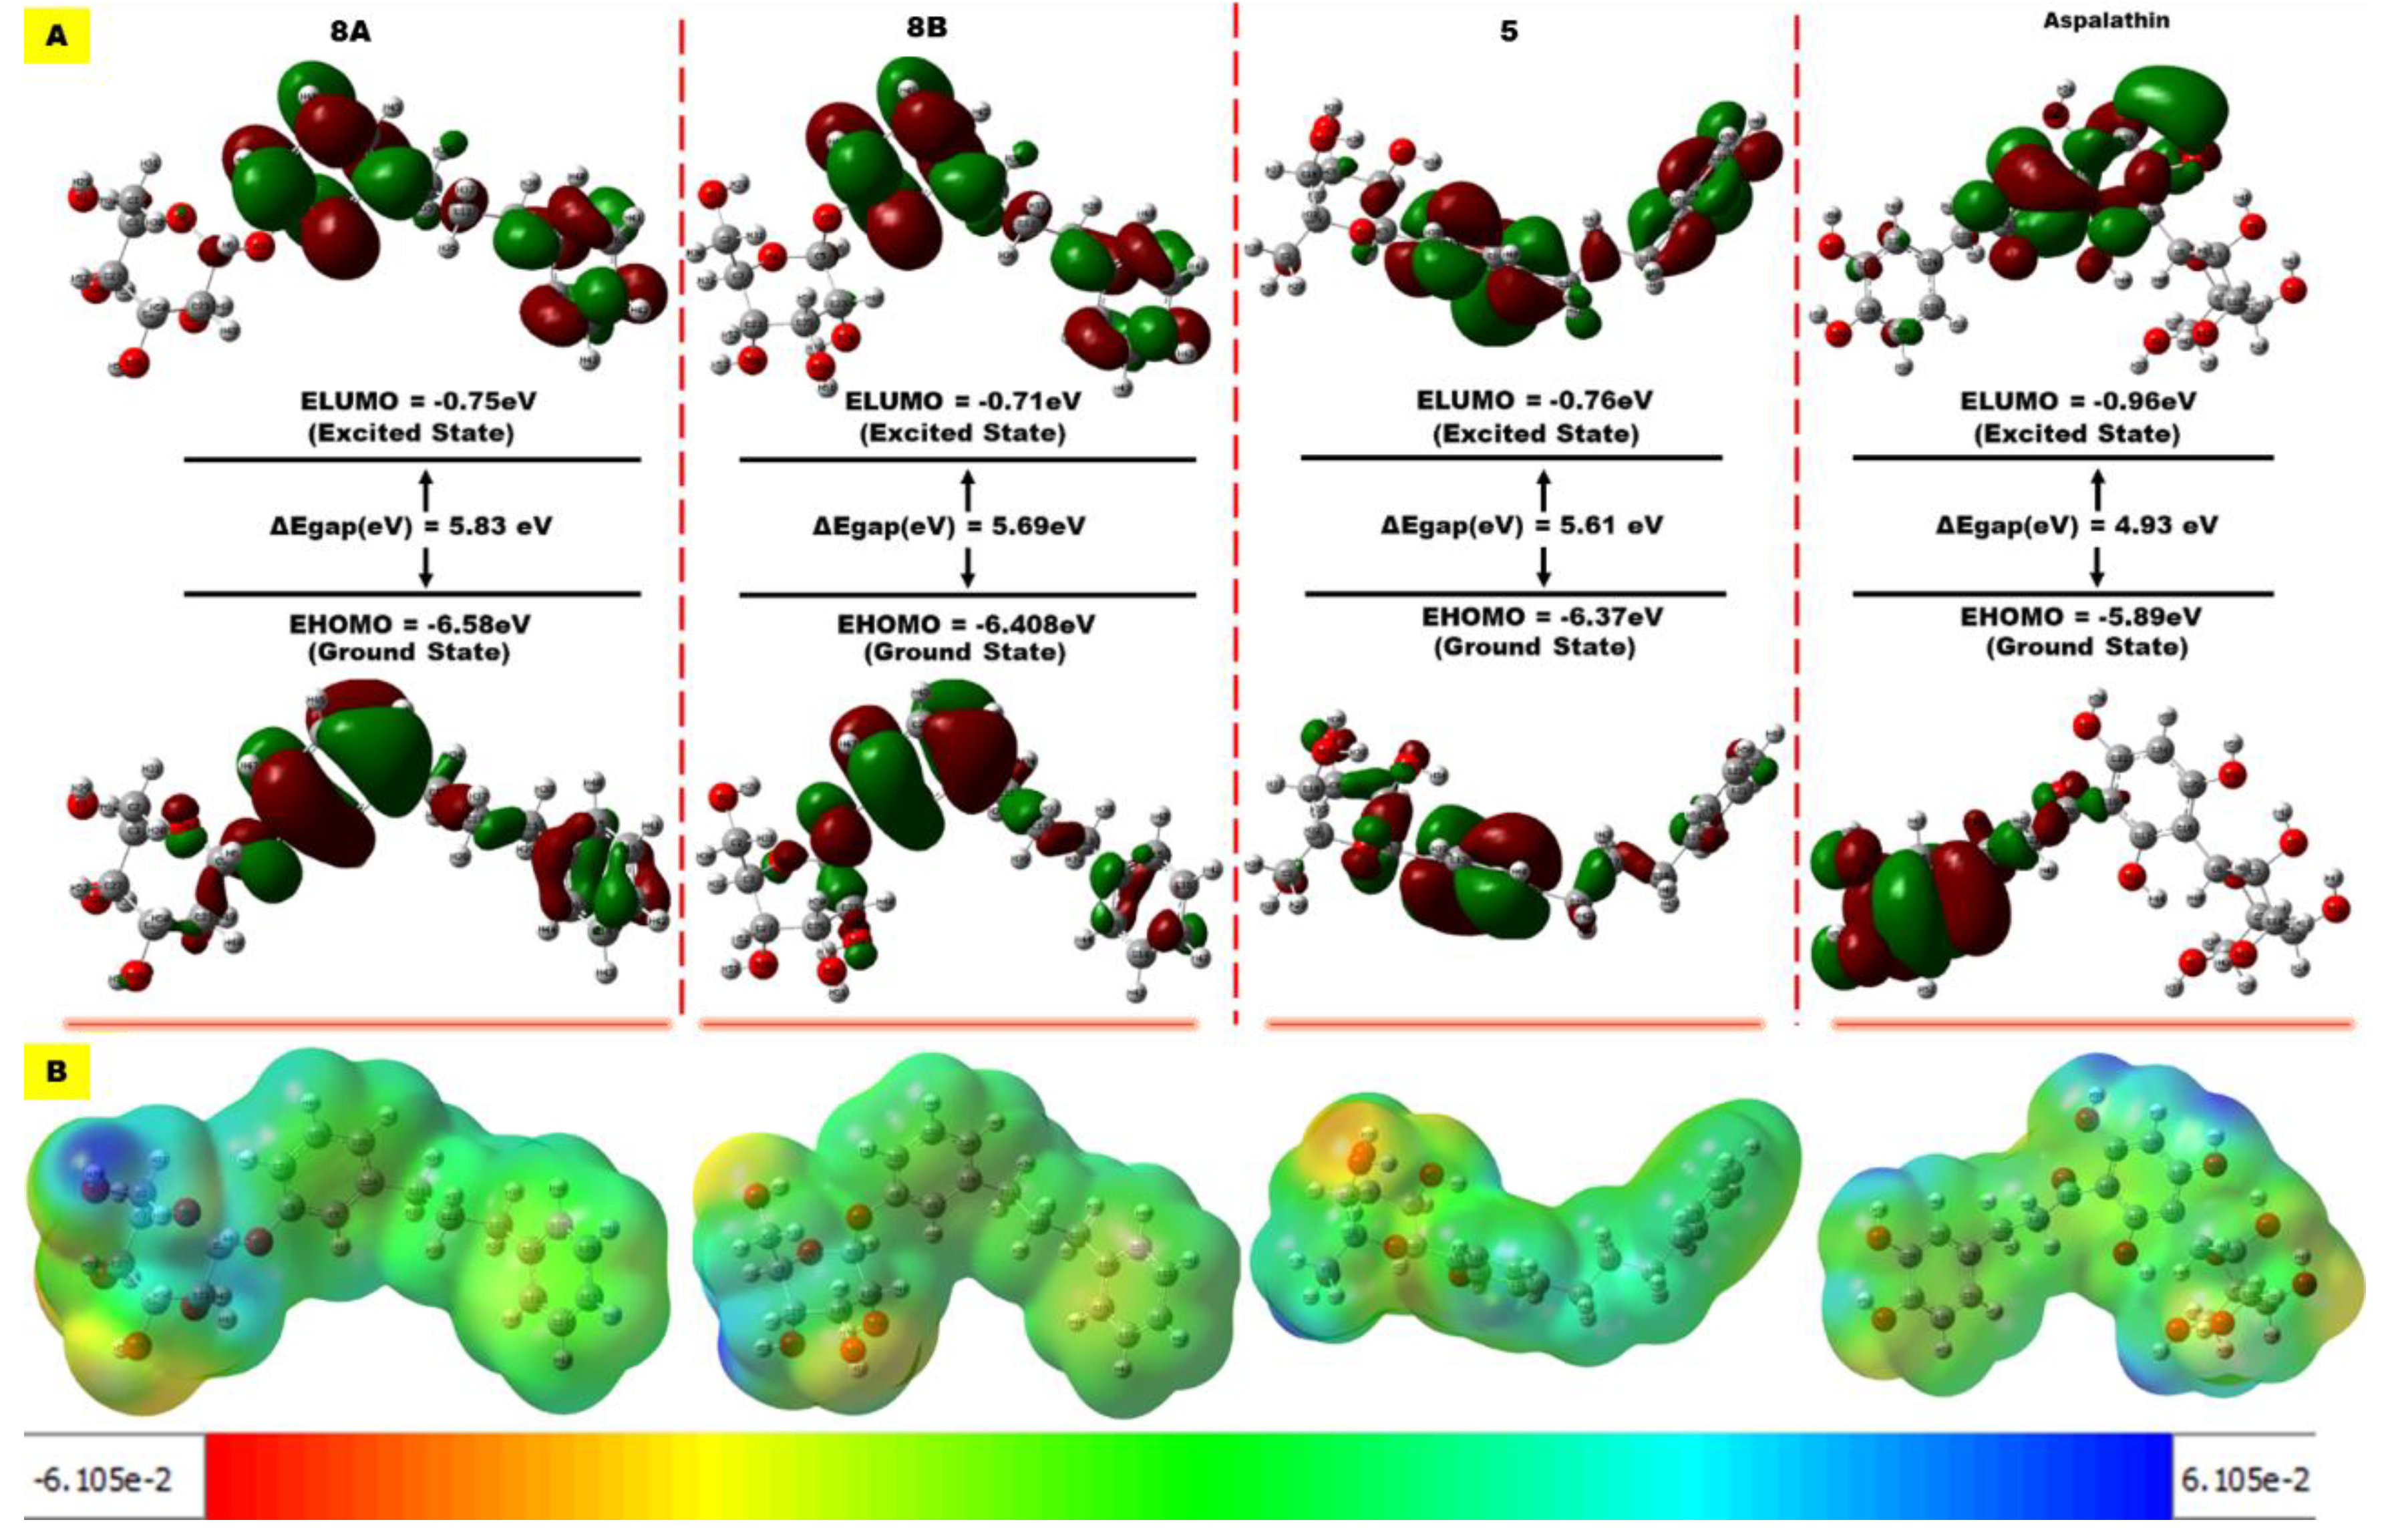
3.3. Compounds’ Reactivity

The chemical reactivity of the compounds relative to aspalathin was assessed through density functional theory. The ground state chemical structures of the compounds were optimised at the B3LYP/6-311G++(2d,2p) level of theory to shed light on the reactivity and stability of the compounds. The two prominent frontal molecular orbitals, the high-energy occupied molecular orbital (HOMO) and the low-energy unoccupied molecular orbital (LUMO), were determined and analysed. The information from these orbitals was then used to compute the local and global descriptors of the compounds and presented in Table 4. The energy gap (Eg), which depicts the energy difference between the HOMO and LUMO, is important in ascertaining the reactivity of a compound. A smaller energy gap is characterised by higher reactivity of a compound and vice versa. This parameter is crucial in determining a drug’s stability, bioactivity, and interaction with biological targets in drug discovery [60]. Since interactions between a drug and a protein involve electronic interactions, the binding affinity of a drug can be improved when its energy gap is smaller; thus, the HOMO and the LUMO of a drug and receptor, and vice versa, must align favorably to enhance stronger interaction and residence time. The HOMO and LUMO maps and Eg of the compounds are shown in Figure 7. The Eg has also been reported to influence a compound’s pharmacokinetics since a drug's susceptibility to metabolism by enzymes such as the CYP450 family of enzymes is linked to chemical reactivity, which can affect the half-life and bioavailability. As observed in Table 4, aspalathin had the smallest energy gap relative to the other compounds. This suggests aspalathin is more reactive than the compounds and could thus have higher binding affinity to target proteins as observed in other parameters such as the ionisation (I) and the affinity (A) where it showed lower ionisation and high affinity respectively. Also, its distribution could be lower. These investigations offer insights that could be exploited to optimise the compounds. The compounds’ binding affinity to the targets implicated in diabetes was then investigated.

3.4. The Synthesised Compounds as Potential Pan-Binders

The molecular docking technique has been used conventionally to identify potential inhibitors or modulators of a therapeutically relevant protein by estimating the interactions and binding strength [61]. In this study, we employed the technique to identify among proteins implicated in the advancement of diabetes, the possible binding proteins of our compounds. The docking scores of the compounds to several relevant proteins are tabulated in Table 5. The compounds generally showed docking scores ≤ -7.0 kcal/mol. This threshold has been reported to distinguish putative binders from non-binders, wherein compounds that dock to proteins with scores less than -7.0 kcal/mol are considered putative binders [62]. As such, the results of the compounds suggest they are potential pan binders to these proteins. They have the potential to bind to several targets that influence the progression of diabetes. All the compounds exhibited higher docking scores than the co-crystallised ligands (control) of GLUT4, Protein Kinase C, and SIRT6 allosteric site. Adenosine-5-Diphosphoribose (AR6) was, however, observed to exhibit higher docking scores than all the compounds. This nucleotide derivative is the native ligand of SIRT6 and a natural substrate for Poly(ADP-Ribose) Polymerases (PARPs), which is crucial for post-translational modification of proteins. The high docking score (-15.95 kcal/mol) of Adenosine-5-Diphosphoribose to the main site of SIRT6 indicates a high affinity for the pocket, which would be difficult to dislodge competitively. This could explain the need to develop allosteric binders to modulate the protein instead of competitive inhibition. Interestingly, the compounds showed higher docking scores for the allosteric site than the control compound. Due to limited computational resources, AKT in complex with the compounds was selected for further investigation through molecular dynamics simulations. This was to determine the conformational dynamics of the compounds and protein upon the compounds' binding.

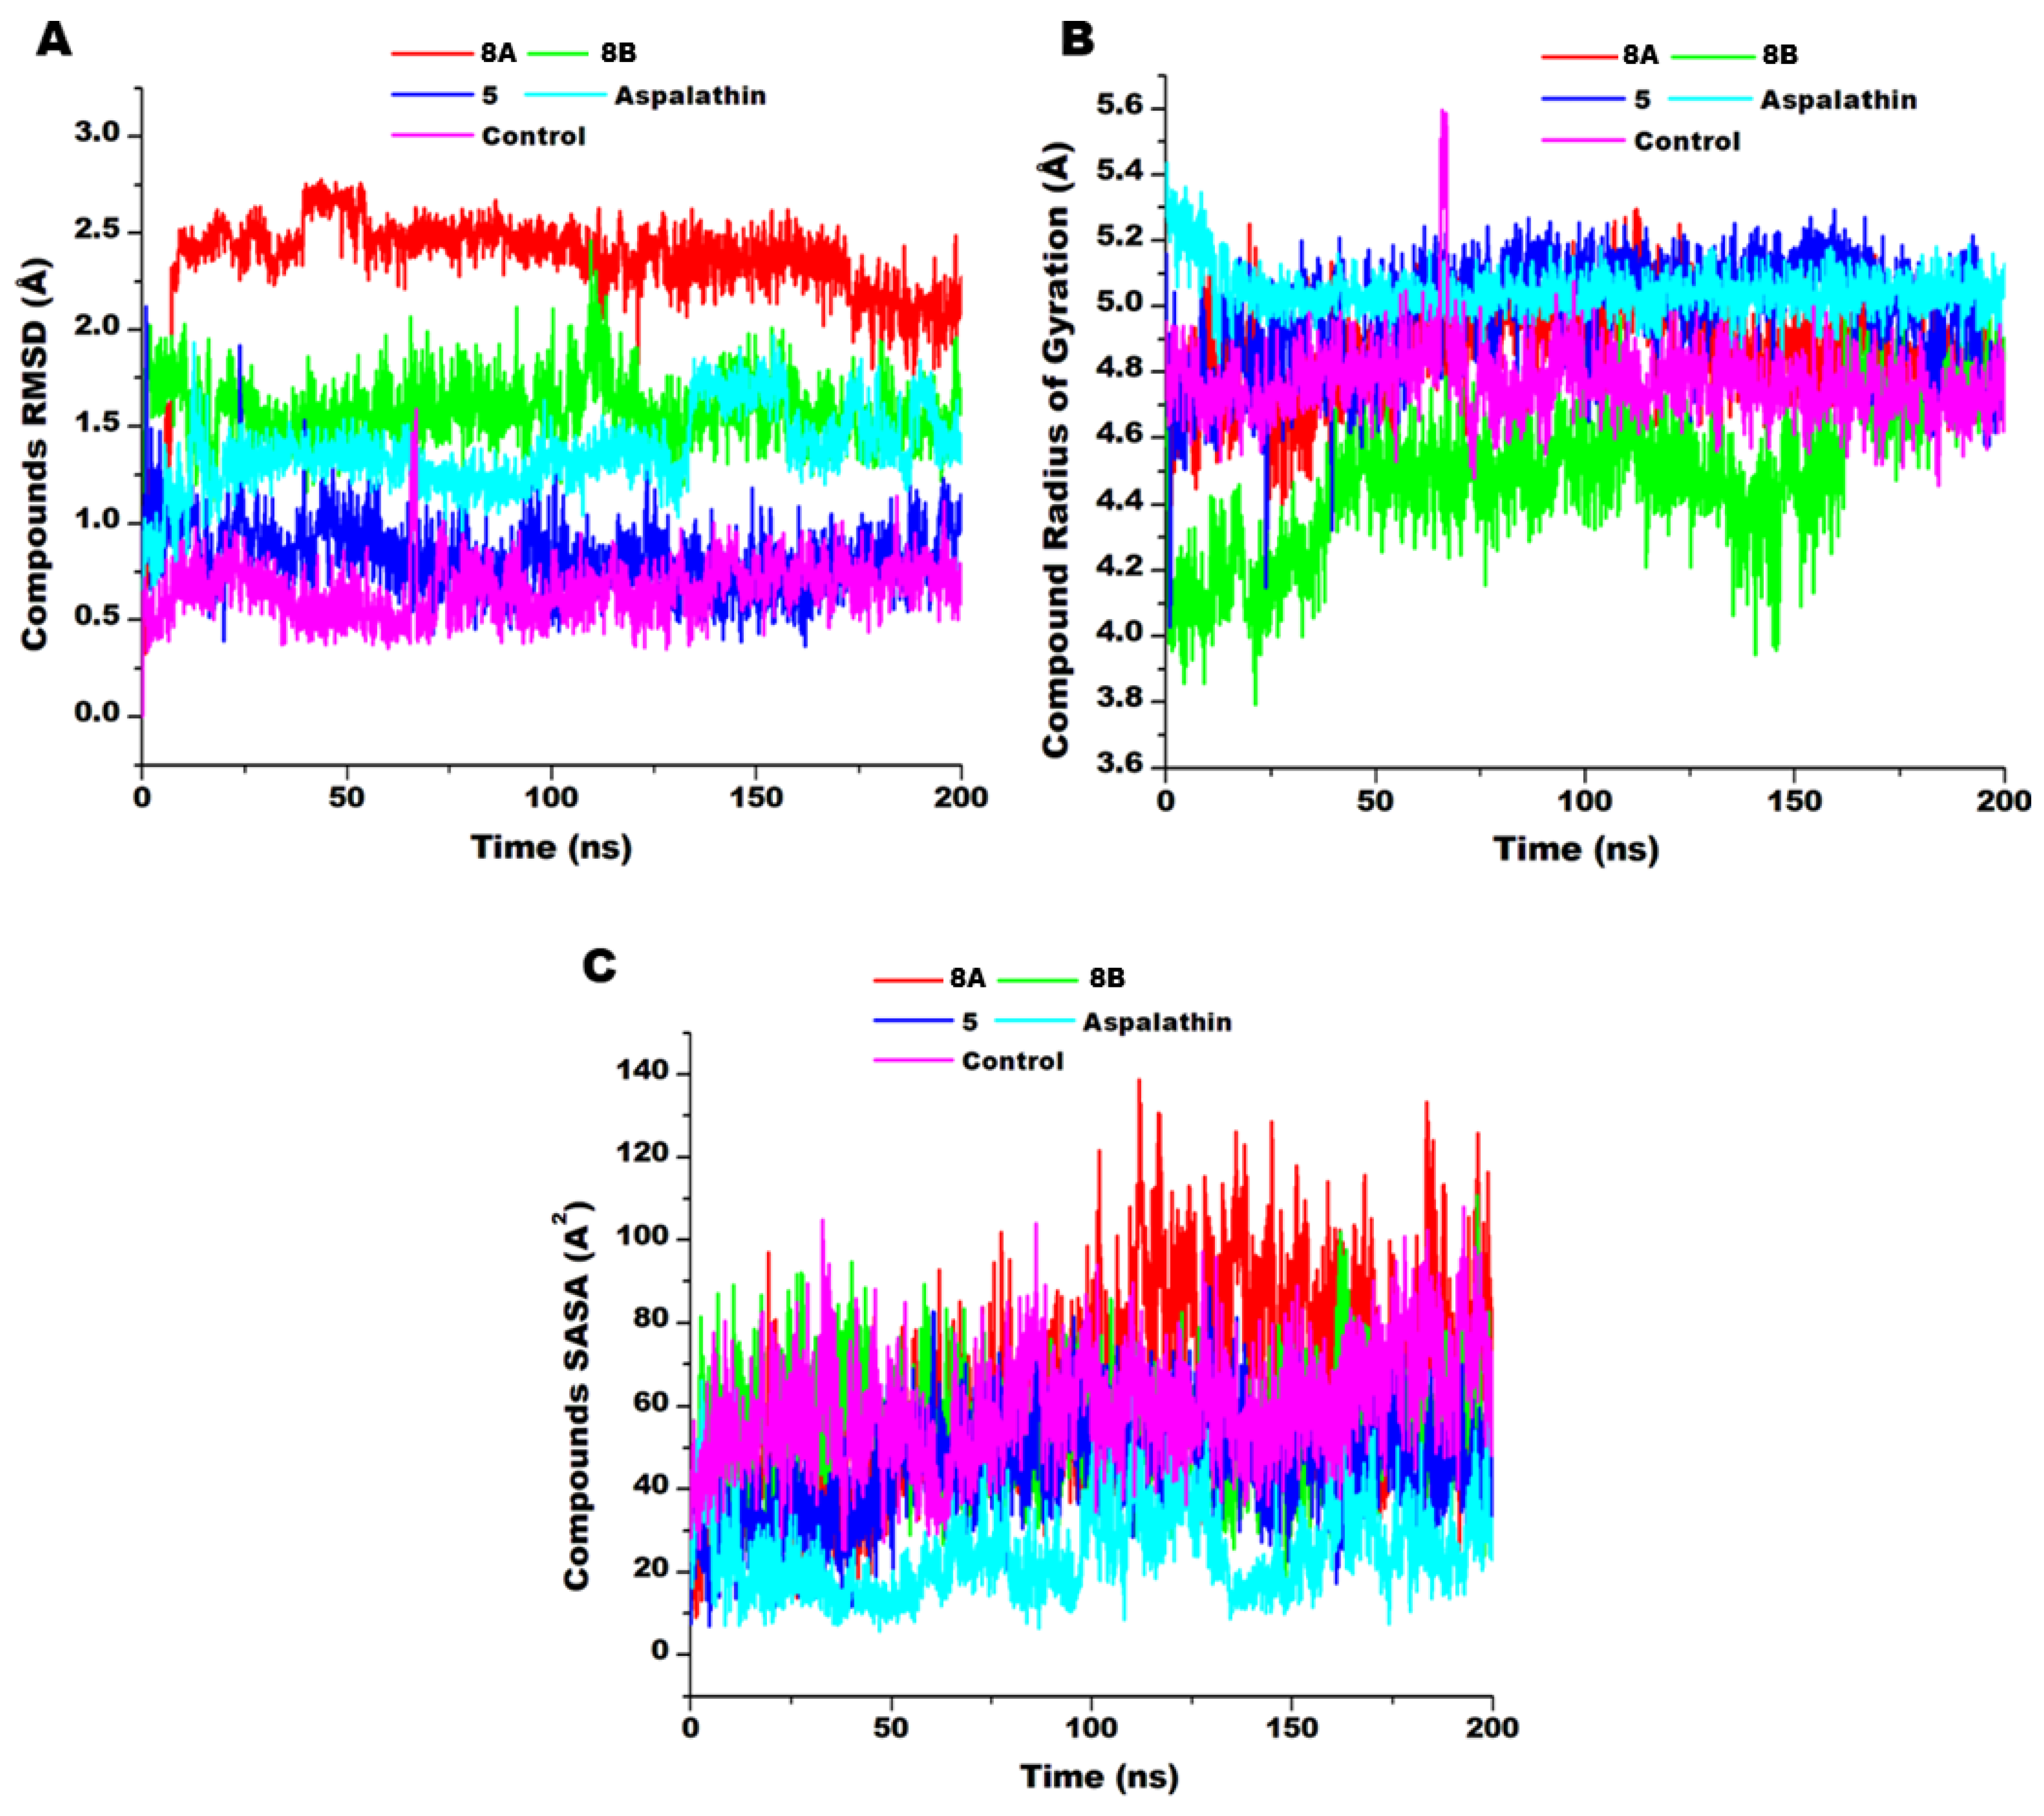
3.5. Compounds’ Dynamics

The behavior of the compounds within the binding pocket of AKT over a 200 ns simulation period was investigated through the deviations of the atoms from their starting positions (RMSD), their penetration into the hydrophobic core of the proteins (SASA), and their radius of gyration (RoG). These metrics offer insights into the compounds' behavior within the binding pockets.

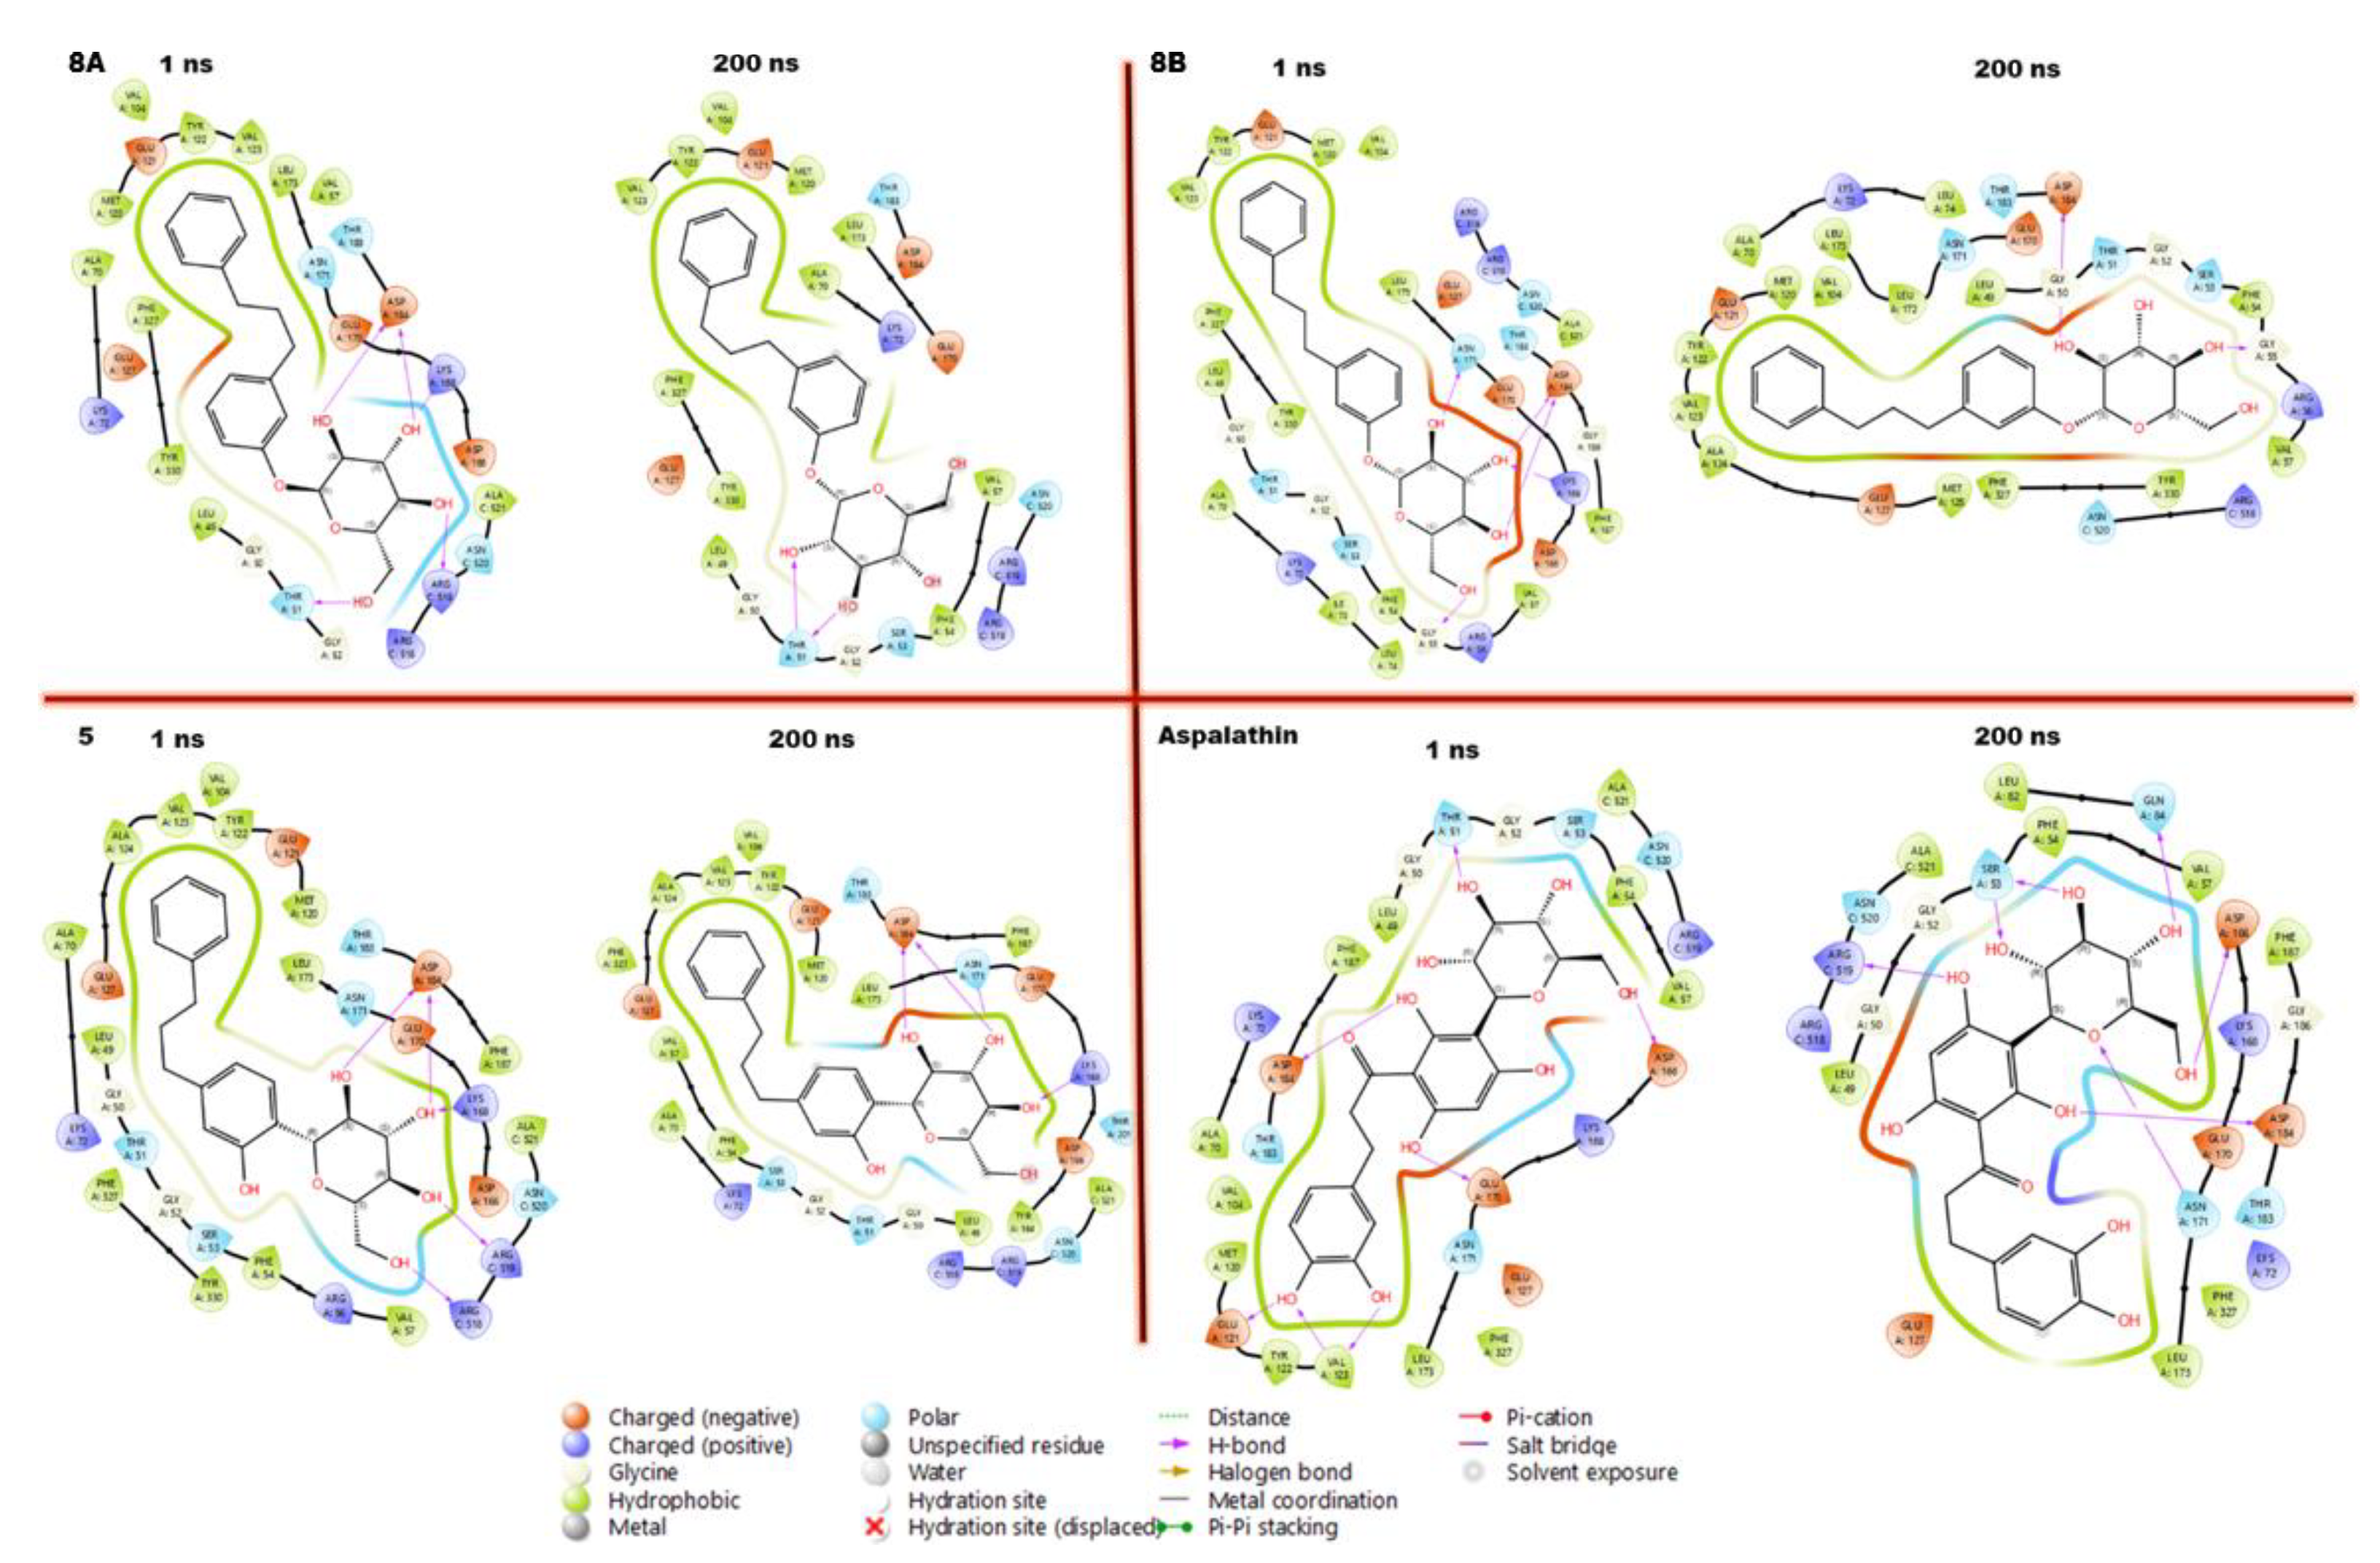
3.6. Compounds Stabilise and Penetrate Deeper into the Hydrophobic Regions of the AKT Binding Pocket

The compounds’ atoms' deviation from their starting positions before the simulation was computed. This assessment reflects the stability of the compounds within the binding pocket. The compounds exhibited average RMSD values of 2.33 Å, 1.58 Å, 0.82 Å, and 1.37 Å for compounds 8a, 8b, 5, and aspalathin, respectively. These figures suggest compound 5 showed the highest stability, while compound 8a showed the least stability. As observed in Figure 8A, compound 8a underwent a marked conformational change between 0 and 10 ns before stabilising, which explains its relatively high RMSD value. All the compounds generally stabilised within the binding pocket of AKT as observed in the figure, though aspalathin was seen to undergo instability during the last 60 ns. The solvent accessibility surface area (SASA) which was used to determine how buried they were in the hydrophobic core showed average SASA values of 63.49 Å2, 54.18 Å2, 45.78 Å2, and 24.75 Å2 for compounds 8a, 8b, 5 and aspalathin, respectively, which indicates compound 8a had the highest surface area available for solvent interaction (Figure 8C). The lower the surface area available, the deeper the penetration of the compound into the hydrophobic core of the protein and vice versa. Also, the radius of gyration (ROG), which quantifies the extendedness or compactness of the compounds and is thus reflective of their principal moment of inertia, was computed. The compounds showed average ROG values of 4.85 Å, 4.48 Å, 4.98 Å, and 5.04 Å for compound 8a, 8b, 5, and aspalathin, respectively, over the simulation time. These results suggest compound 8a has its atoms less distributed around its center of mass and is thus the most compact (Figure 8B). In contrast, aspalathin has the most widely distributed atoms around its mass (most extended/flexible). The flexibility of a ligand, its ability to rotate around single bonds, influences how extended it appears in different conformations. This may improve its propensity to occupy more space within the binding pocket, thus forming interactions with multiple residues that increase binding affinity. These observations could explain the higher binding affinity of aspalathin to the target proteins than the compounds, as shown in Table 5.

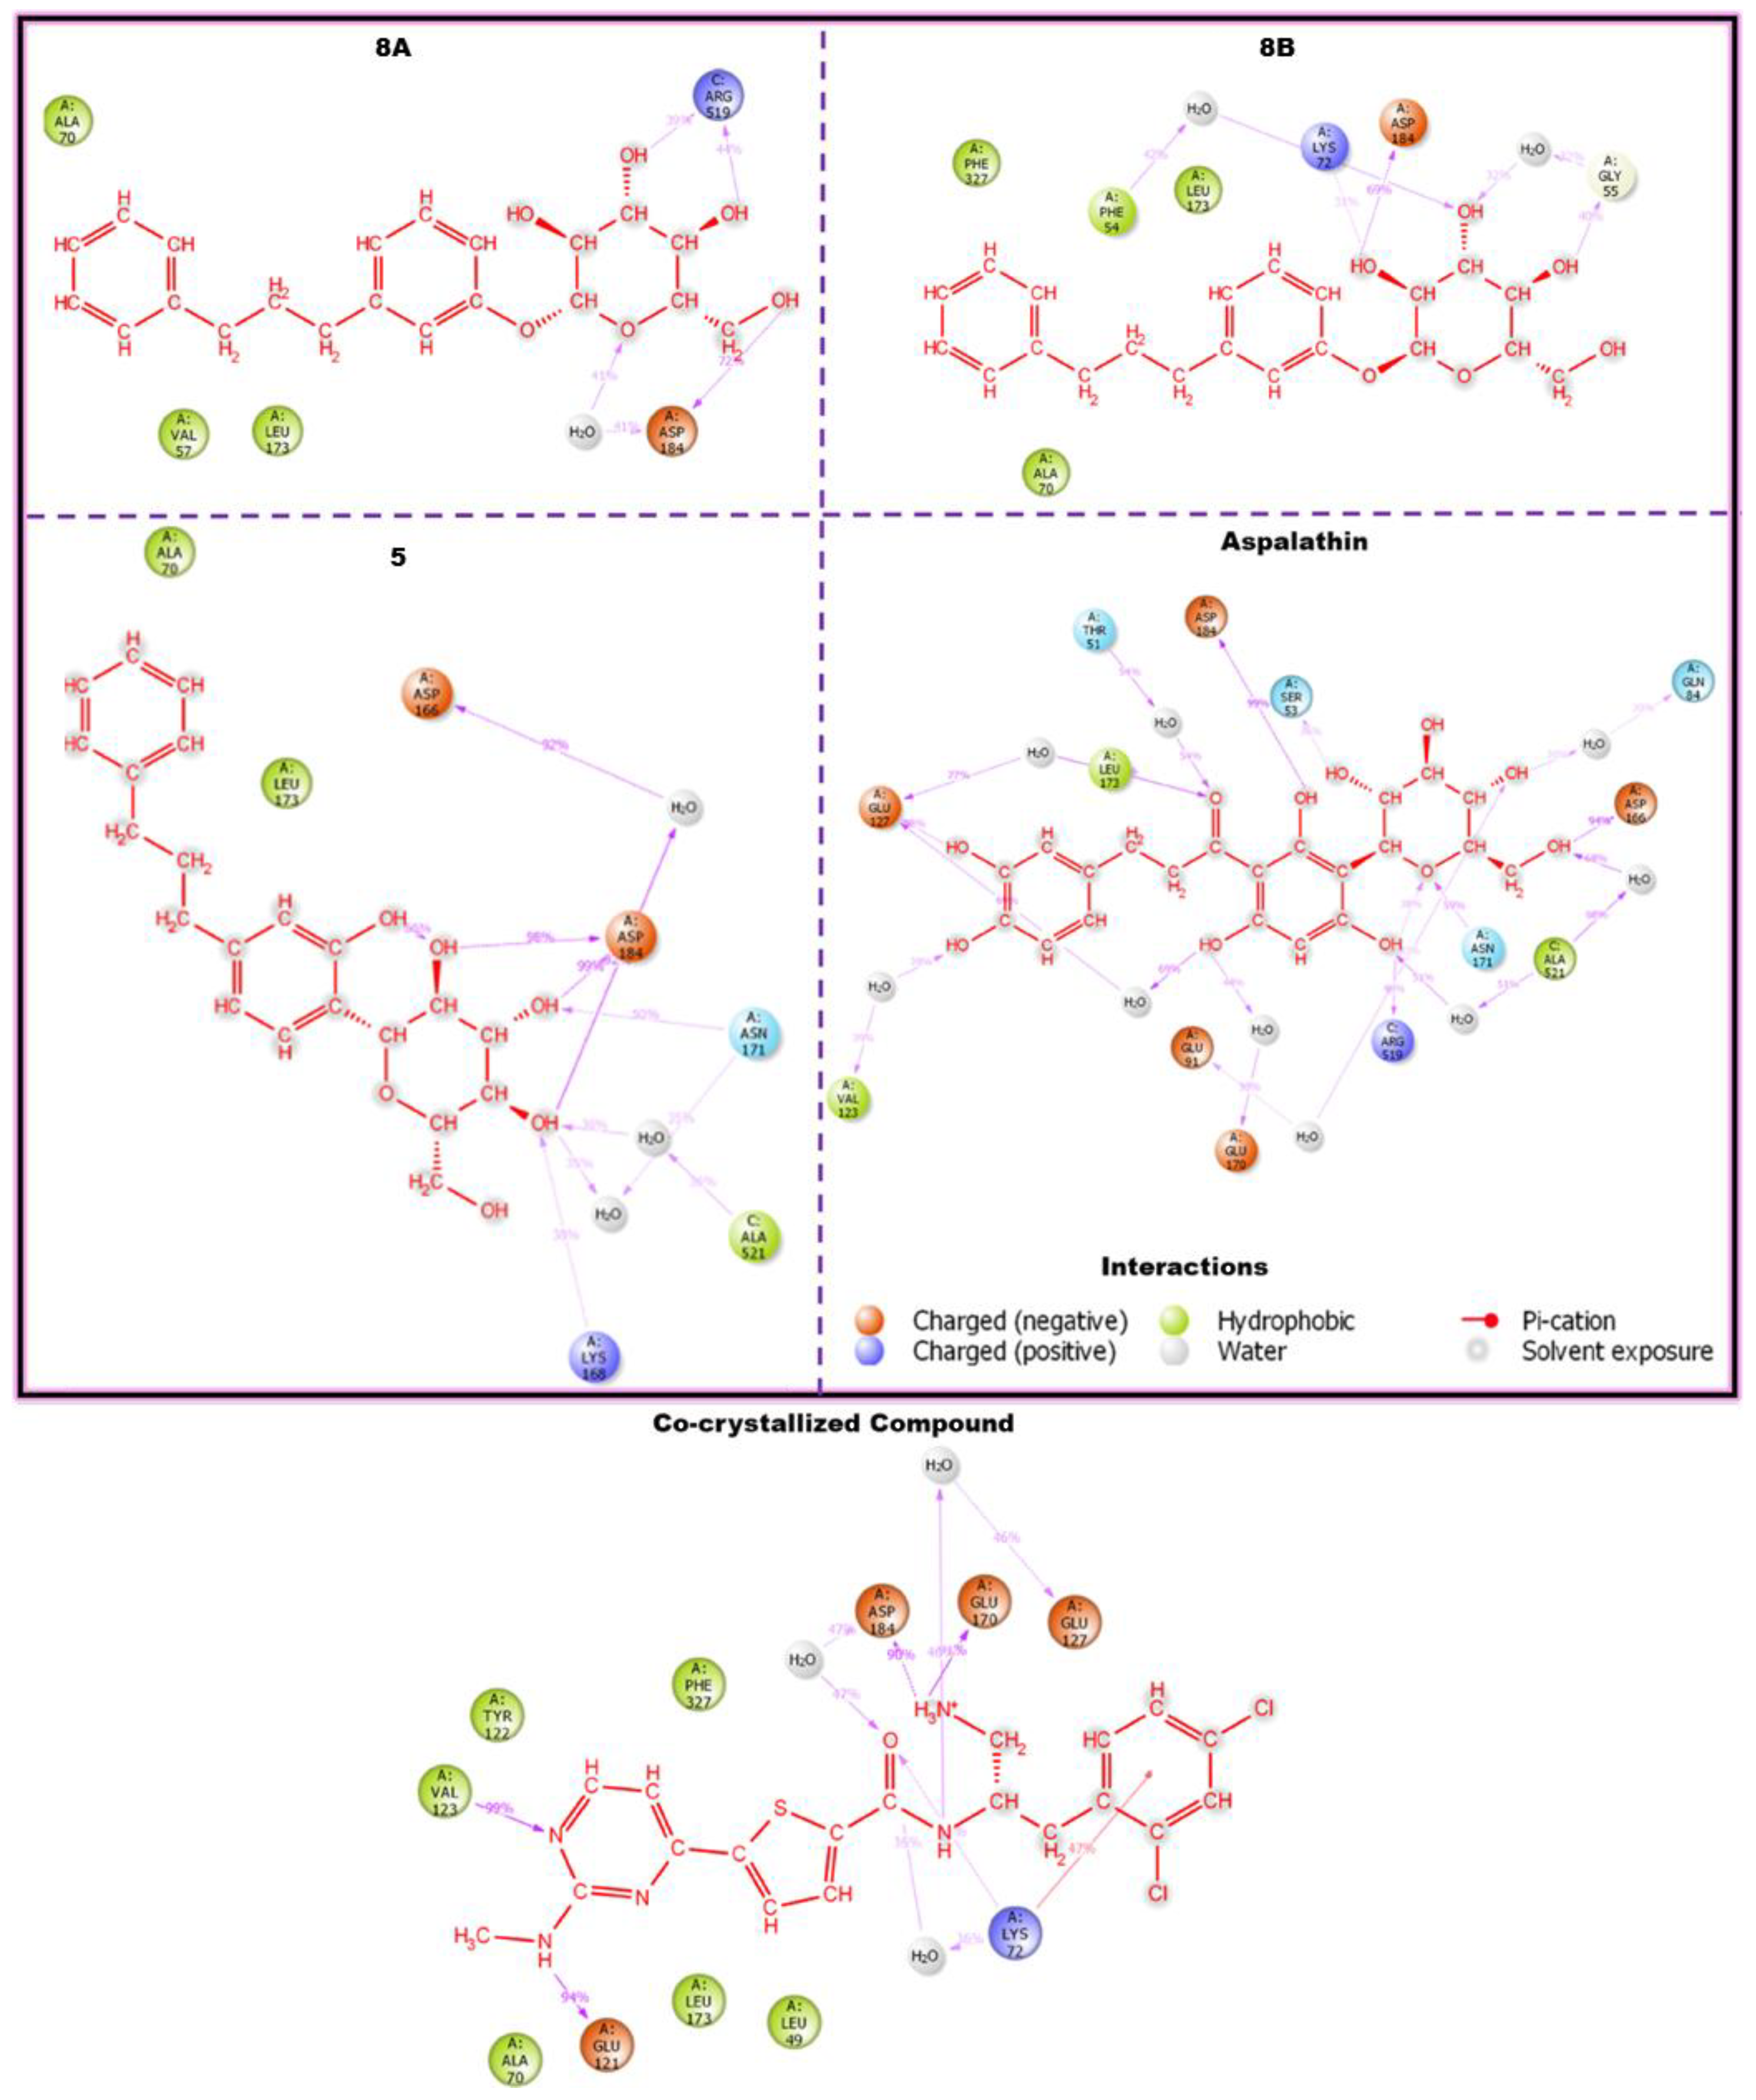
3.7. Compounds-Residues Interactions Profile

The behavior of the compounds within the binding pocket is conditioned by the interactions that occur during their residence time. The interactions between the compounds and the binding site residue were therefore analysed. Residues whose interactions endured over 30% of the simulation time were analysed and presented in Figure 9. Ala70, Leu173, and Asp184 were observed to interact with all the compounds, including aspalathin and the co-crystallised compound. While Asp184 formed strong hydrogen bonds with the compounds, Ala70 and Leu173 formed hydrophobic interactions. The endurance and consistency of these interactions with the compounds suggest their relevance in maintaining the residence time of the compound within the pocket. Other residues that formed transient contacts with the compounds are presented in Figure 10. The residence and interaction of small molecules with binding site residues often result in conformational changes in the target protein. As such, the stability and flexibility of the protein-compound complexes were analysed.

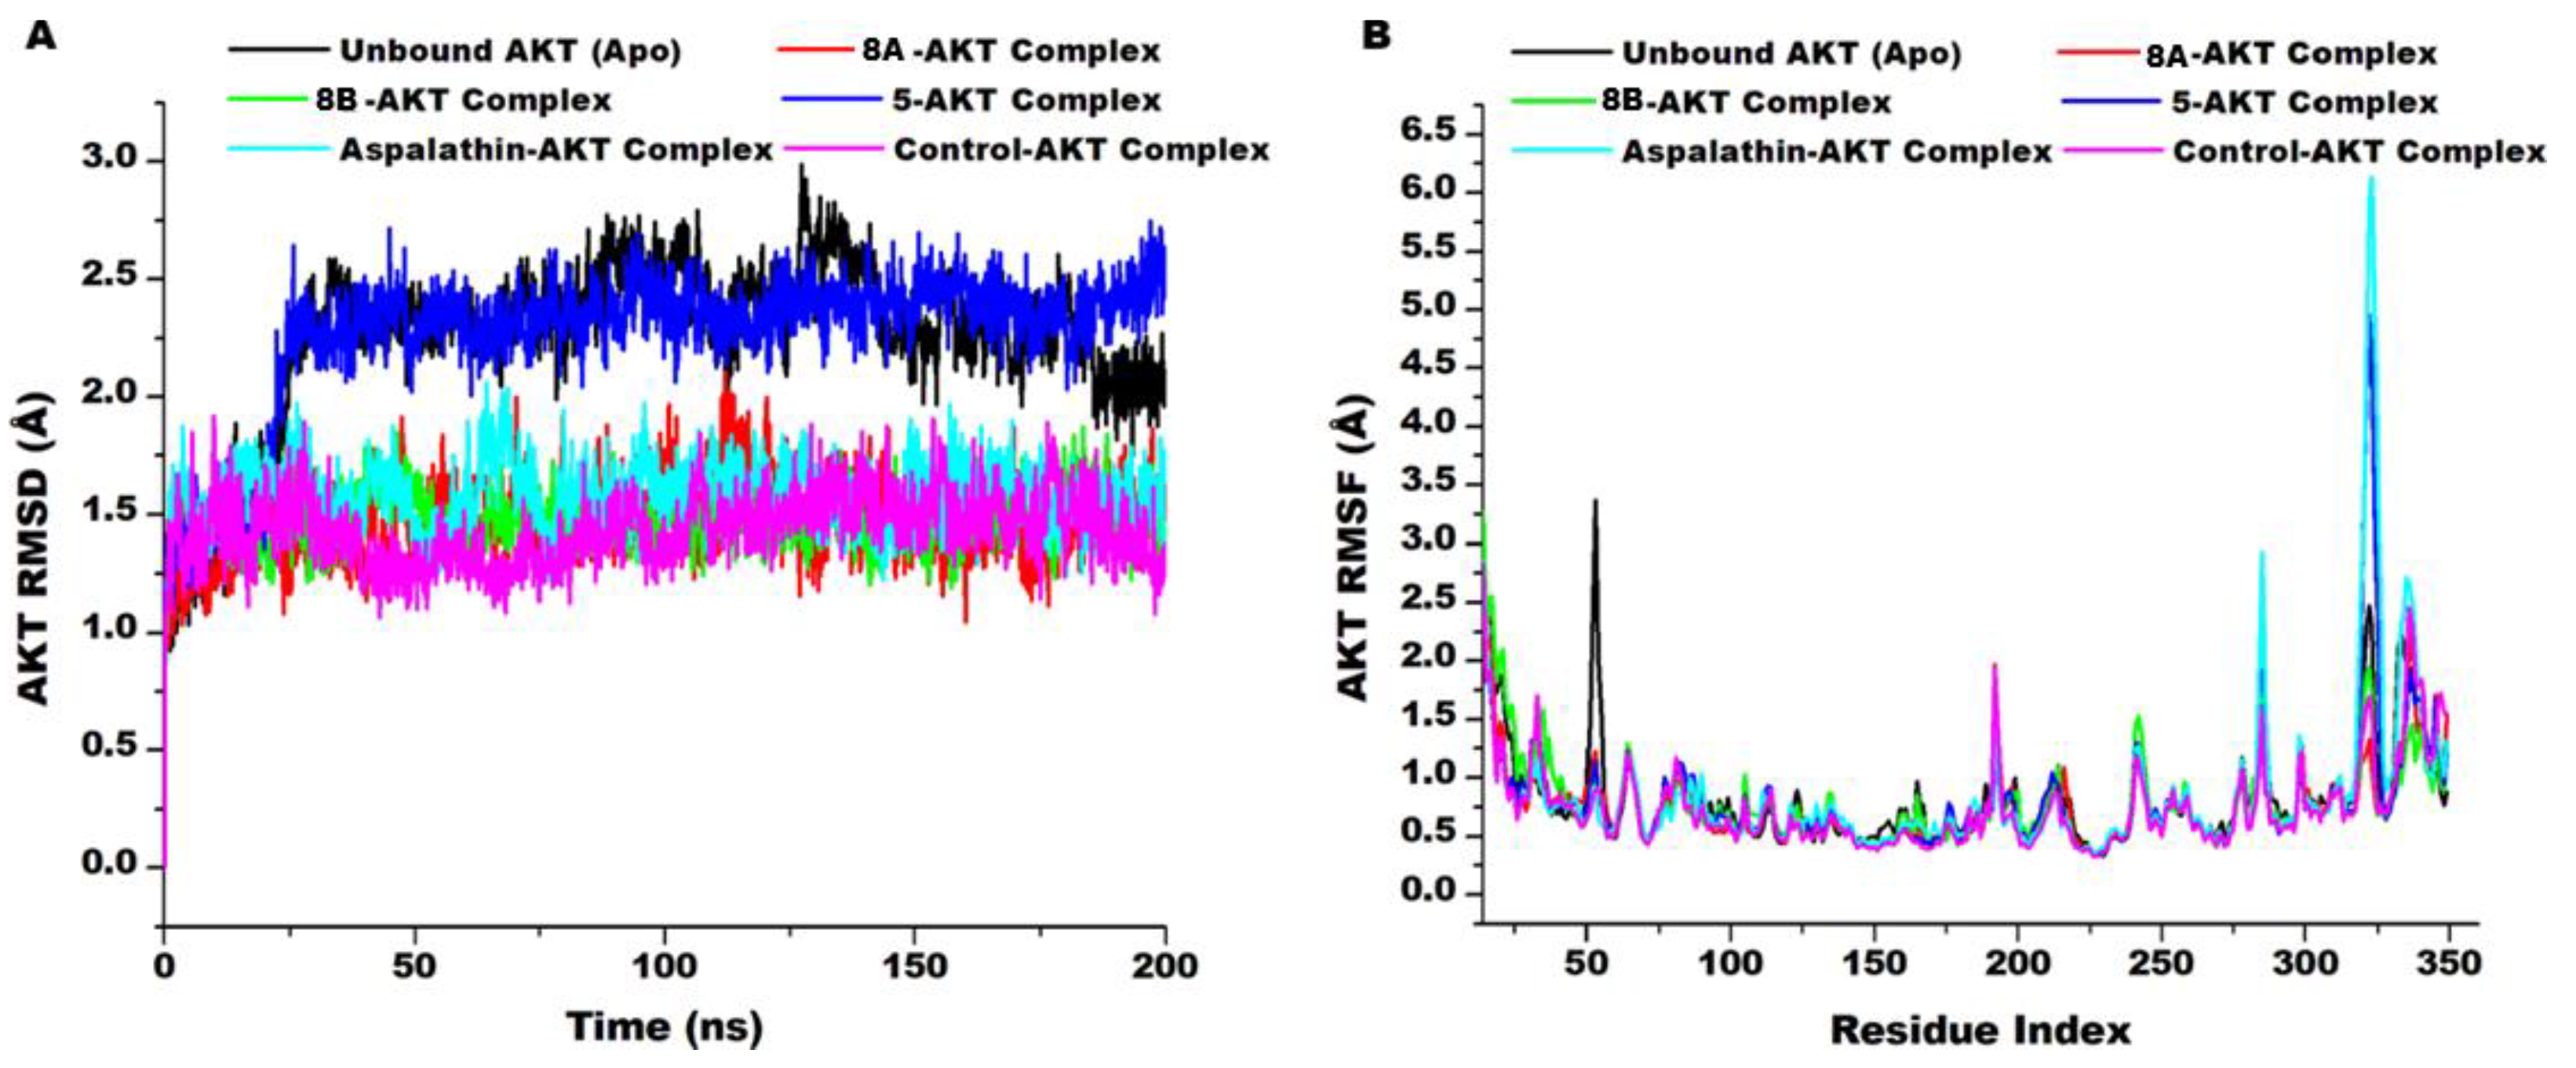
3.8. AKT Conformational Changes Upon Compounds’ Binding

The investigations were supplemented by assessing the stability and flexibility of the protein during the simulation period. The C-α atoms’ deviations of the residues from their initial positions (RMSD) and their fluctuations (RMSF) were investigated. The RMSD metric highlights the stability of the protein, while the RMSF reflects the flexibility of the protein [63]. The results are graphically presented in Figure 11. Average RMSD values of 2.26 Å, 1.45 Å, 1.47 Å, 1.58 Å, 2.24 Å, and 1.43 Å were computed for the unbound AKT (Apo), compounds 8a, 8b, 5, aspalathin, and the co-crystallised compound (control) complexes, respectively. These results suggest the unbound protein was the most unstable, while the control was the most stable. The compound-bound AKT all showed higher stability than the unbound protein. The RMSF analysis also showed average values of 0.82 Å, 0.75 Å, 0.78 Å, 0.80 Å, 0.86 Å, and 0.74 Å for the Apo, Compounds 8a, 8b, 5, aspalathin, and the control complexes, respectively, which shows that the binding of aspalathin induced the highest fluctuation of the residues, while the control induced the least flexibility. The other compounds were, however, observed to induce less flexibility than the Apo. The differentials in the stability and flexibility of the protein upon the compounds' binding could underscore their therapeutic potential.

4. Conclusions

The electron-withdrawing carbonyl group of the acetophenones reduced nucleophilicity by complexation of carbonyl oxygen with Lewis acid catalyst and inhibited the C-glycosylation in the synthesis of aspalathin and analogs. Therefore, after aldol condensation of the acetophenone and 3-hydroxybenzaldehyde, it yielded a 3-hydroxychalcone. Continuous catalytic hydrogenation under high pressure reduced the chalcone to a 1,3-diarylpropane. Coupling it with tetra-O-benzylglucoseamidate using TMSOTf or BF3.OEt2 produced the glucosylated 1,3-diarylpropane. Subsequent benzylic oxidation and deprotection via catalytic hydrogenation finally afforded the aspalthin analog, 1-phenyl-3-(4ʹ-C-β-D-2ʹʹʹ,3ʹʹʹ,4ʹʹʹ,6ʹʹʹ-tetrahydroxyglucopyranosyl-3'-hydroxyphenyl)propane (5). Under controlled temperatures, 1-phenyl-3-(3'-O-α-D-2′′′,3′′′,4′′′,6′′′-tetra-hydroxyglucopyranosylphenyl)propane (8a) and 1-phenyl-3-(3'-O-β-D-2′′′,3′′′,4′′′,6′′′-tetra-hydroxyglucopyranosylphenyl)propane (8b) were obtained. In silico assessment of these compounds has antidiabetic potential with probable activity greater than 0.70. They also possess good drug-like properties and are potential ‘pan-binders’ of several diabetes-related proteins. Their binding to AKT was characterised by strong hydrogen and hydrophobic interactions, which changed the protein's conformational dynamics. Generally, the results obtained suggest that all the compounds have antidiabetic properties and can be explored as leads for the development of antidiabetic drugs.

Supplementary Materials

The following supporting information can be downloaded at the website of this paper posted on Preprints.org.

Author Contributions

Conceptualization, A.E.M.N. and ARI: Methodology, AEMN and AW: Computational Investigation, ARI: Synthesis, AEMN and SLB: In vitro Testing, CIC: Original Draft Preparation, AEMN, ARI, CIC, and AW: Supervision, SLB.

Institutional Review Board Statement

Informed Consent Statement

Data Availability Statement

All supporting data is available in the supporting information provided.

Acknowledgments

The authors acknowledge the Centre of High-Performance Computing (CHPC, www.chpc.ac.za), Cape Town, South Africa, for making computational resources available.

Conflicts of Interest

The authors declare no financial or intellectual conflict of interest.

References

  1. Ipp, E., “Diabetic Retinopathy and Insulin Insufficiency: Beta Cell Replacement as a Strategy to Prevent Blindness,” Front. Endocrinol. (Lausanne)., vol. 12, no. November, pp. 1–7, 2021. [CrossRef]
  2. Thomas, M.C.; et al., “Diabetic kidney disease,” Nat. Rev. Dis. Prim., vol. 1, no. 1, p. 15018, 2015. [CrossRef]
  3. Leon, B.M.; Maddox, T.M., “Diabetes and cardiovascular disease: Epidemiology, biological mechanisms, treatment recommendations and future research.,” World J. Diabetes, vol. 6, no. 13, pp. 1246–1258, Oct. 2015. [CrossRef]
  4. Ristow, M., “Neurodegenetive disorders associated with diabetes mellitus,” J. Mol. Med., vol. 82, no. 8, pp. 510–529, 2004. [CrossRef]
  5. Kulshrestha, V.; Agarwal, N., “Maternal complications in pregnancy with diabetes.,” J. Pak. Med. Assoc., vol. 66, no. 9 Suppl 1, pp. S74-7, Sep. 2016.
  6. Wong, M.S.; Hawthorne, W.J.; Manolios, N., “Gene therapy in diabetes.,” Self. Nonself., vol. 1, no. 3, pp. 165–175, Jul. 2010. [CrossRef]
  7. Rahim, F.; Arjmand, B.; Shirbandi, K.; Payab, M.; Larijani, B., “Stem cell therapy for patients with diabetes: a systematic review and meta-analysis of metabolomics-based risks and benefits.,” Stem cell Investig., vol. 5, p. 40, 2018. [CrossRef]
  8. Elnaem, M.H.; Mohamed, M.H.N.; Huri, H.Z.; Azarisman, S.M.; Elkalmi, R.M., “Statin Therapy Prescribing for Patients with Type 2 Diabetes Mellitus: A Review of Current Evidence and Challenges.,” J. Pharm. Bioallied Sci., vol. 9, no. 2, pp. 80–87, 2017. [CrossRef]
  9. Perreault, L.; Skyler, J.S.; Rosenstock, J., “Novel therapies with precision mechanisms for type 2 diabetes mellitus,” Nat. Rev. Endocrinol., vol. 17, no. 6, pp. 364–377, 2021. [CrossRef]
  10. Mahapatra, D.K.; Asati, V.; Bharti, S.K., “Chalcones and their therapeutic targets for the management of diabetes: Structural and pharmacological perspectives,” Eur. J. Med. Chem., vol. 92, pp. 839–865, 2015. [CrossRef]
  11. Rocha, S.; Ribeiro, D.; Fernandes, E.; Freitas, M., “A Systematic Review on Anti-diabetic Properties of Chalcones.,” Curr. Med. Chem., vol. 27, no. 14, pp. 2257–2321, 2020. [CrossRef]
  12. Xiao, J.; Kai, G.; Yamamoto, K.; Chen, X., “Advance in dietary polyphenols as α-glucosidases inhibitors: a review on structure-activity relationship aspect.,” Crit. Rev. Food Sci. Nutr., vol. 53, no. 8, pp. 818–836, 2013. [CrossRef]
  13. Mahapatra, D.K.; Bharti, S.K.; Asati, V., “Chalcone scaffolds as anti-infective agents: structural and molecular target perspectives.,” Eur. J. Med. Chem., vol. 101, pp. 496–524, Aug. 2015. [CrossRef]
  14. Han, Z.; et al., “Concise and Scalable Synthesis of Aspalathin, a Powerful Plasma Sugar-Lowering Natural Product,” J. Nat. Prod., vol. 77, no. 3, pp. 583–588, Mar. 2014. [CrossRef]
  15. Wilhelm, A.; et al., “Syntheses and in Vitro Antiplasmodial Activity of Aminoalkylated Chalcones and Analogues,” J. Nat. Prod., vol. 78, no. 8, pp. 1848–1858, Aug. 2015. [CrossRef]
  16. de Souza, P.M.; de Sales, P.M.; Simeoni, L.A.; Silva, E.C.; Silveira, D.; de O, P., “Inhibitory activity of α-amylase and α-glucosidase by plant extracts from the Brazilian cerrado.,” Planta Med., vol. 78, no. 4, pp. 393–399, Mar. 2012. [CrossRef]
  17. Krentz, A.J.; Bailey, C.J., “Oral antidiabetic agents: current role in type 2 diabetes mellitus.,” Drugs, vol. 65, no. 3, pp. 385–411, 2005. [CrossRef]
  18. Chukwuma, C.I.; Mashele, S.S.; Akuru, E.A., “Evaluation of the in vitro ⍺-amylase inhibitory, antiglycation, and antioxidant properties of Punica granatum L. (pomegranate) fruit peel acetone extract and its effect on glucose uptake and oxidative stress in hepatocytes.,” J. Food Biochem., vol. 44, no. 5, p. e13175, May 2020. [CrossRef]
  19. Motloung, D.M.; et al., “Synthesis, characterization, antidiabetic and antioxidative evaluation of a novel Zn(II)-gallic acid complex with multi-facet activity,” J. Pharm. Pharmacol., vol. 72, no. 10, pp. 1412–1426, Oct. 2020. [CrossRef]
  20. Lagunin, A.; Stepanchikova, A.; Filimonov, D.; Poroikov, V., “PASS: Prediction of activity spectra for biologically active substances,” Bioinformatics, vol. 16, no. 8, pp. 747–748, 2000. [CrossRef]
  21. Tratrat, C., “Novel Thiazole-Based Thiazolidinones as Potent Anti-infective Agents: In silico PASS and Toxicity Prediction, Synthesis, Biological Evaluation and Molecular Modelling.,” Comb. Chem. High Throughput Screen., vol. 23, no. 2, pp. 126–140, 2020. [CrossRef]
  22. Lagunin, A.; Stepanchikova, A.; Filimonov, D.; Poroikov, V., “PASS: prediction of activity spectra for biologically active substances.,” Bioinformatics, vol. 16, no. 8, pp. 747–748, Aug. 2000. [CrossRef]
  23. Filimonov, D.A.; et al., “Prediction of the Biological Activity Spectra of Organic Compounds Using the Pass Online Web Resource,” Chem. Heterocycl. Compd., vol. 50, no. 3, pp. 444–457, 2014. [CrossRef]
  24. Banerjee, P.; Eckert, A.O.; Schrey, A.K.; Preissner, R., “ProTox-II: a webserver for the prediction of toxicity of chemicals,” Nucleic Acids Res., vol. 46, no. W1, pp. W257–W263, Jul. 2018. [CrossRef]
  25. Daina, A.; Michielin, O.; Zoete, V., “SwissADME: A free web tool to evaluate pharmacokinetics, drug-likeness and medicinal chemistry friendliness of small molecules,” Sci. Rep., vol. 7, no. October 2016, pp. 1–13, 2017. [CrossRef]
  26. Nalewajski, R.F., “Density Functional Theory BT - Perspectives in Electronic Structure Theory,” R. F. Nalewajski, Ed. Berlin, Heidelberg: Springer Berlin Heidelberg, 2012, pp. 255–368.
  27. Frisch, M.J., “gaussian09,” http//www. gaussian. com/, 2009.
  28. Lutnaes, O.B.; Ruden, T.A.; Helgaker, T., “The performance of hybrid density functional theory for the calculation of indirect nuclear spin-spin coupling constants in substituted hydrocarbons.,” Magn. Reson. Chem., vol. 42 Spec no, pp. S117-27, Oct. 2004. [CrossRef]
  29. McCullough, E.A.; Aprà, E.; Nichols, J., “Comparison of the Becke−Lee−Yang−Parr and Becke−Perdew−Wang Exchange-Correlation Functionals for Geometries of Cyclopentadienyl−Transition Metal Complexes,” J. Phys. Chem. A, vol. 101, no. 13, pp. 2502–2508, Mar. 1997. [CrossRef]
  30. Miao, R.; Fang, X.; Wei, J.; Wu, H.; Wang, X.; Tian, J., “Akt: A Potential Drug Target for Metabolic Syndrome.,” Front. Physiol., vol. 13, p. 822333, 2022. [CrossRef]
  31. Chung, M.-Y.; Choi, H.-K.; Hwang, J.-T., “AMPK Activity: A Primary Target for Diabetes Prevention with Therapeutic Phytochemicals.,” Nutrients, vol. 13, no. 11, Nov. 2021. [CrossRef]
  32. Yuan, Y.; Kong, F.; Xu, H.; Zhu, A.; Yan, N.; Yan, C., “Cryo-EM structure of human glucose transporter GLUT4,” Nat. Commun., vol. 13, no. 1, p. 2671, 2022. [CrossRef]
  33. Geraldes, P.; King, G.L., “Activation of protein kinase C isoforms and its impact on diabetic complications.,” Circ. Res., vol. 106, no. 8, pp. 1319–1331, Apr. 2010. [CrossRef]
  34. Hiraizumi, M.; et al., “Transport and inhibition mechanism of the human SGLT2–MAP17 glucose transporter,” Nat. Struct. Mol. Biol., vol. 31, no. 1, pp. 159–169, 2024. [CrossRef]
  35. Bae, E.J., “Sirtuin 6, a possible therapeutic target for type 2 diabetes.,” Arch. Pharm. Res., vol. 40, no. 12, pp. 1380–1389, Dec. 2017. [CrossRef]
  36. Suite, S. 2017-4 Protein Preparation Wizard. 2018.
  37. Shelley, J.C.; Cholleti, A.; Frye, L.L.; Greenwood, J.R.; Timlin, M.R.; Uchimaya, M., “Epik: a software program for pKaprediction and protonation state generation for drug-like molecules,” J. Comput. Aided. Mol. Des., vol. 21, no. 12, pp. 681–691, 2007. [CrossRef]
  38. Lu, C.; et al., “OPLS4: Improving Force Field Accuracy on Challenging Regimes of Chemical Space.,” J. Chem. Theory Comput., vol. 17, no. 7, pp. 4291–4300, Jul. 2021. [CrossRef]
  39. 39. “Schrödinger Release 2024-2: LigPrep, Schrödinger, LLC, New York, NY, 2024.”.
  40. Friesner, R.A.; et al., “Glide: a New Approach for Rapid, Accurate Docking and Scoring. 1. Method and Assessment of Docking Accuracy,” J. Med. Chem., vol. 47, p. 1739, 2004.
  41. Shaw, D.E., “Desmond Molecular Dynamics System.” D. E. Shaw Research, New York, NY, 2021.
  42. Harrach, M.F.; Drossel, B., “Structure and dynamics of TIP3P, TIP4P, and TIP5P water near smooth and atomistic walls of different hydroaffinity,” J. Chem. Phys., vol. 140, no. 17, p. 174501, 2014. [CrossRef]
  43. Noreljaleel, A.E.M.; Wilhelm, A.; Bonnet, S.L.; van der Westhuizen, J.H., “Synthesis and Bioactivity of Reduced Chalcones Containing Sulfonamide Side Chains,” J. Nat. Prod., vol. 81, no. 1, pp. 41–48, Jan. 2018. [CrossRef]
  44. Kakoti, B.B.; Alom, S.; Deka, K.; Halder, R.K., “AMPK pathway: an emerging target to control diabetes mellitus and its related complications.,” J. Diabetes Metab. Disord., vol. 23, no. 1, pp. 441–459, Jun. 2024. [CrossRef]
  45. Son, M.J.; Minakawa, M.; Miura, Y.; Yagasaki, K., “Aspalathin improves hyperglycemia and glucose intolerance in obese diabetic ob/ob mice.,” Eur. J. Nutr., vol. 52, no. 6, pp. 1607–1619, Sep. 2013. [CrossRef]
  46. Mazibuko-Mbeje, S.E.; et al., “Aspalathin-Enriched Green Rooibos Extract Reduces Hepatic Insulin Resistance by Modulating PI3K/AKT and AMPK Pathways.,” Int. J. Mol. Sci., vol. 20, no. 3, Feb. 2019. [CrossRef]
  47. Mazibuko-Mbeje, S.E.; et al., “Aspalathin alleviates skeletal muscle insulin resistance and mitochondrial dysfunction.,” Physiol. Res., vol. 71, no. 5, pp. 643–656, Nov. 2022. [CrossRef]
  48. Mazibuko-Mbeje, S.E.; et al., “Aspalathin, a natural product with the potential to reverse hepatic insulin resistance by improving energy metabolism and mitochondrial respiration,” PLoS One, vol. 14, no. 5, p. e0216172, May 2019, [Online]. Available: . [CrossRef]
  49. Filimonov, D.; Poroikov, V., “Chapter 6. Probabilistic Approaches in Activity Prediction,” Chemoinformatics Approaches to Virtual Screen., pp. 182–216, 2009. [CrossRef]
  50. Geronikaki, A., “Recent Trends in Enzyme Inhibition and Activation in Drug Design,” Molecules, vol. 26, no. 1. 2021. [CrossRef]
  51. Emon, N.U.; et al., “Antidepressant, anxiolytic, antipyretic, and thrombolytic profiling of methanol extract of the aerial part of Piper nigrum: In vivo, in vitro, and in silico approaches,” Food Sci. Nutr., vol. 9, no. 2, pp. 833–846, Feb. 2021. [CrossRef]
  52. Lawal, B.; et al., “Pharmacoinformatics and Preclinical Studies of NSC765690 and NSC765599, Potential STAT3/CDK2/4/6 Inhibitors with Antitumor Activities against NCI60 Human Tumor Cell Lines,” Biomedicines, vol. 9, no. 1. 2021. [CrossRef]
  53. 53. “Computational tools for ADMET.” http://crdd.osdd.net/admet.php (accessed Dec. 08, 2021).
  54. Lipinski, C.A., “Drug-like properties and the causes of poor solubility and poor permeability.,” J. Pharmacol. Toxicol. Methods, vol. 44, no. 1, pp. 235–249, 2000. [CrossRef]
  55. Shityakov, S.; Neuhaus, W.; Dandekar, T.; Forster, C., “Analysing molecular polar surface descriptors to predict blood-brain barrier permeation,” Int. J. Comput. Biol. Drug Des., vol. 6, pp. 146–156, 2013.
  56. Martin, Y.C., “How medicinal chemists learned about log P.,” J. Comput. Aided. Mol. Des., vol. 32, no. 8, pp. 809–819, Aug. 2018. [CrossRef]
  57. Zhao, M.; et al., “Cytochrome P450 Enzymes and Drug Metabolism in Humans.,” Int. J. Mol. Sci., vol. 22, no. 23, Nov. 2021. [CrossRef]
  58. Ingelman-Sundberg, M., “Genetic polymorphisms of cytochrome P450 2D6 (CYP2D6): clinical consequences, evolutionary aspects and functional diversity,” Pharmacogenomics J., vol. 5, no. 1, pp. 6–13, 2005. [CrossRef]
  59. Li, Y.; Yuan, H.; Yang, K.; Xu, W.; Tang, W.; Li, X., “The structure and functions of P-glycoprotein.,” Curr. Med. Chem., vol. 17, no. 8, pp. 786–800, 2010. [CrossRef]
  60. Mumit, M.A.; Pal, T.K.; Alam, M.A.; Islam, M.A.-A.-A.-A.; Paul, S.; Sheikh, M.C., “DFT studies on vibrational and electronic spectra, HOMO-LUMO, MEP, HOMA, NBO and molecular docking analysis of benzyl-3-N-(2,4,5-trimethoxyphenylmethylene)hydrazinecarbodithioate.,” J. Mol. Struct., vol. 1220, p. 128715, Nov. 2020. [CrossRef]
  61. Meng, X.-Y.; Zhang, H.-X.; Mezei, M.; Cui, M., “Molecular docking: a powerful approach for structure-based drug discovery.,” Curr. Comput. Aided. Drug Des., vol. 7, no. 2, pp. 146–157, Jun. 2011. [CrossRef]
  62. Chang, M.W.; Lindstrom, W.; Olson, A.J.; Belew, R.K., “Analysis of HIV wild-type and mutant structures via in silico docking against diverse ligand libraries.,” J. Chem. Inf. Model., vol. 47, no. 3, pp. 1258–1262, 2007. [CrossRef]
  63. Issahaku, A.R.; et al., “Multi-dimensional structural footprint identification for the design of potential scaffolds targeting METTL3 in cancer treatment from natural compounds.,” J. Mol. Model., vol. 29, no. 4, p. 122, Mar. 2023. [CrossRef]
Figure 1. E- and Z-isomers of a chalcone.
Preprints 187432 g001
Figure 2. 1H NMR: 1-phenyl-3-(4ʹ-C-β-D-2ʹʹʹ,3ʹʹʹ,4ʹʹʹ,6ʹʹʹ-tetrahydroxyglucopyranosyl-3'-hydroxyphenyl)propane (5).
Preprints 187432 g002
Figure 3. 1H NMR : 1-phenyl-3-(3'-O-α-D-2′′′,3′′′,4′′′,6′′′-tetra-hydroxyglucopyranosylphenyl)propane (8a).
Preprints 187432 g003
Figure 4. 1H NMR: 1-phenyl-3-(3'-O-β-D-2′′′,3′′′,4′′′,6′′′-tetra-hydroxyglucopyranosylphenyl)propane (8b).
Preprints 187432 g004
Figure 5. α-Glucosidase inhibition by compound 5 and acarbose. Compound 5 shows negative results, indicating it has no inhibitory effects on α-glucosidase.
Preprints 187432 g005
Figure 6. α-Amylase inhibition by compound 5 and acarbose. Compound 5 shows negative results, indicating it has no inhibitory effects on α-amylase.
Preprints 187432 g006
Figure 7. A) HOMO and LUMO maps of the compounds. B) Shows the MEP maps depicting areas of the compounds susceptible to nucleophilic and electrophilic attacks.
Preprints 187432 g007
Figure 8. Comparative plots of the compounds' stability and extendedness over the simulation period. A) Shows the compounds' deviations from their starting positions. B) Shows the radius of gyration of the compounds, depicting their extendedness. C) Shows the surface area of the compounds available for solvent interactions (SASA).
Preprints 187432 g008
Figure 9. A schematic of detailed compounds’ interactions with the protein residues. Interactions that occur more than 30.0% of the simulation time are shown.
Preprints 187432 g009
Figure 10. 2D interaction of the compounds and the site residues at the beginning (1 ns) and end (200 ns) of the simulation.
Preprints 187432 g010
Figure 11. Comparative plots of protein stability and residual fluctuations.
Preprints 187432 g011
Table 1. Antidiabetic biological activity prediction of the synthesised compounds.
Antidiabetic Activity
Probable Activity (Pa) Probable Inactivity (Pi)
Compound 8a 0.769 0.005
Compound 8b 0.769 0.005
Compound 5 0.854 0.004
Aspalathin 0.835 0.004
Table 2. The physicochemical properties of the compounds and Aspalathin.
Compound Formula MW (g/mol) MLogP LogS (Ali) (mol/L) TPSA (A2) Molar Refractivity HBA HBD Rotatable Bonds Lipinski Drug Likeness
8a C21H26O6 374.43 1.87 -3.99 99.38 99.65 6 4 7 Yes:0violations
8b C21H26O6 374.43 1.74 -3.99 99.38 99.65 6 4 7 Yes;0violations
5 C21H26O6 374.43 1.43 -3.80 110.38 100.15 6 5 6 Yes;0violations
Aspalathin C21H24O11 452.41 -0.49 -3.73 208.37 108.66 11 9 6 No; 2violations
Table 3. In silico pharmacokinetics prediction of the compounds and aspalathin.
Pharmacokinetics . Compounds
8a 8b 5 Aspalathin
Distribution
Blood Brain Barrier Permeability (log BB) No No No No
GI Absorption High High High Low
Metabolism
P-gp substrate Yes Yes Yes No
CYP1A2 inhibitor No No No No
CYP2C19 inhibitor No No No No
CYP 2C9 inhibitor No No No No
CYP 2D6 inhibitor Yes Yes Yes No
CYP 3A4 inhibitor No No No No
Excretion
Total Clearance (log mL/min/kg) 0.569 0.197 0.367 1.16
Renal OCT2 substrate No No No Yes
Toxicity
Oral rat acute toxicity (LD50) (mg/kg) 3000 3000 1000 2000
Toxicity Class 5 5 4 4
Table 4. Reactivity descriptors of the compounds.
Compound Parameter
EHOMO ELUMO Eg I A χ Ƞ δ ω ω− ω+ Δω ±
8a -6.58 -0.75 5.83 6.58 0.75 3.66 2.91 0.34 2.30 7.73 1.67 9.40
8b -6.40 -0.71 5.69 6.40 0.71 3.55 2.84 0.35 2.22 7.51 1.59 9.10
5 -6.37 -0.76 5.61 6.37 0.76 3.56 2.80 0.35 2.26 7.50 1.66 9.10
Aspalathin -5.89 -0.96 4.93 5.89 0.96 3.42 2.46 0.40 2.37 7.07 1.95 9.02
Table 5. Molecular Docking Profile of the compounds on diabetes-implicated proteins.
Target PDB ID Docking Scores (Kcal/mol)
8a
SP XP
8b
SP XP
5
SP XP
Aspalathin
SP XP
Control
SP XP
AKT 2GU8 -7.55 -9.95 -7.54 -8.66 -8.50 -11.45 -7.27 -14.07 -12.66 -13.55
AMPK 6BX6 -5.74 -7.08 -6.14 -7.48 -5.29 -6.64 -6.19 -7.97 -7.48 -8.93
GLUT4 7WSM -6.70 -10.69 -8.05 -9.97 -8.70 -12.89 -8.22 -13.54 -7.00 -7.87
Protein Kinase C 8UAK -6.27 -9.11 -6.00 -8.15 -7.51 -8.95 -7.08 -9.89 -5.96 -7.47
SGLT2 8HIN -5.83 -7.93 -5.22 -7.31 -5.11 -7.61 -6.79 -9.36 -7.32 -9.06
SIRT6(Main) 6XVG -5.98 -9.00 -6.07 -9.09 -5.61 -8.83 -6.59 -10.66 -8.54 -15.95
SIRT6(Alosteric) 6XVG -6.39 -10.34 -6.91 9.522 -5.61 -10.74 -6.72 -12.55 -4.95 -3.05
Disclaimer/Publisher’s Note: The statements, opinions and data contained in all publications are solely those of the individual author(s) and contributor(s) and not of MDPI and/or the editor(s). MDPI and/or the editor(s) disclaim responsibility for any injury to people or property resulting from any ideas, methods, instructions or products referred to in the content.
Copyright: This open access article is published under a Creative Commons CC BY 4.0 license, which permit the free download, distribution, and reuse, provided that the author and preprint are cited in any reuse.
Prerpints.org logo

Preprints.org is a free preprint server supported by MDPI in Basel, Switzerland.

Subscribe

Disclaimer

Terms of Use

Privacy Policy

Privacy Settings

© 2025 MDPI (Basel, Switzerland) unless otherwise stated