Submitted:
29 November 2025
Posted:
01 December 2025
You are already at the latest version
Abstract
More modern web applications are produced every year, they process more data and users, so effective memory management directly affects performance. Node.js uses the V8 JavaScript Engine, where Garbage Collection (GC) automatically re- leases unused memory. Despite the convenience, this process can cause certain delays and reduce the performance of applications under high load. The purpose of the study is to examine how different garbage collection configurations and param- eters affect the memory management performance of modern Nodes.js applications. In my research, I will analyze existing research and provide a series of load tests with different GC settings. The metrics of request response time and memory usage are compared as the number of simultaneous requests increases. The results obtained will allow us to determine the optimal approaches to configuring and profiling mem- ory in the Node.They will also provide practical recommendations to developers on how to improve the performance of their applications.
Keywords:
Node.js
; garbage collection
; V8 engine
; memory management
; application performance
1. Introduction
Modern web applications handle large amounts of user data and many concurrent requests, so good memory management is essential to keep them fast and responsive. Node.js, which runs on Google’s V8 JavaScript engine, uses an automatic garbage collector (GC) to clear memory that is no longer needed. This process simplifies development because developers don’t need to manage memory manually, but it can also cause short pauses that slow down performance, especially under heavy load.
Node.js is one of the most widely used platforms for scalable web and real-time applications. It provides non-blocking I/O and runs efficiently on a single thread, but this also means that any pause in execution-such as those caused by garbage collection-can directly affect responsiveness. Unlike short-lived scripts, Node.js servers usually run continuously, so memory usage changes dynamically as requests come and go. Although the V8 engine handles memory automatically, this process still has a cost. Every GC event temporarily pauses the application to reclaim unused memory. When these pauses become frequent or last too long, latency increases and throughput drops.
In high-traffic systems, these effects can accumulate, especially as an application grows in complexity or handles larger in-memory datasets such as caches, queues, and real-time analytics buffers. Developers often notice performance regressions only indirectly-through increased response times, unpredictable spikes in latency, or elevated CPU usage-without immediately realizing that the underlying cause is the garbage collector. Modern versions of V8 have introduced incremental, parallel, and concurrent GC strategies to reduce pause times, but the behavior of the garbage collector is still influenced by application design, memory allocation patterns, and workload characteristics.
For this reason, understanding how V8 manages memory, what triggers garbage collection, and how GC events impact performance is essential for building reliable Node.js services. Previous research has explored the internal mechanisms of the V8 GC, the trade-offs between GC modes, and the effects of heap size tuning. However, there is still a gap in practical, application-level studies that show how real workloads interact with GC in typical server environments.
The goal of this paper is to explain how garbage collection works in Node.js, review the findings of previous research, and show a small experiment that demonstrates the link between GC activity and application performance. By combining theoretical background with empirical observations, this work aims to give developers clearer insight into how memory management decisions can influence responsiveness, scalability, and overall system behavior.
2. Literature Review
2.1. Foundations of Garbage Collection
The foundational theory of garbage collection originates from lifetime-based models that identified object lifetimes as the most significant predictor of collection cost. Lieberman and Hewitt established early lifetime-based approaches to GC that influenced generational designs [1]. The dynamic storage allocation surveys synthesized the trade-offs between the copying, mark–sweep, and mark–compact strategies [2]. Comprehensive texts distilled these algorithms into practical engineering guidance for virtual machines [3,4].
2.2. Generational and Concurrent Designs
Generational collectors partition memory into young and old spaces to exploit the predominance of short-lived objects. Mostly-concurrent and incremental algorithms attempt to minimize stop-the-world pauses by performing work concurrently with application execution [5]. Pretenuring and adaptive allocation strategies reduce unnecessary promotions, lowering old-generation pressure [6].
2.3. Empirical Perspectives on GC Overhead
Empirical studies quantify GC overhead across workloads. Hertz and Berger compared GC and explicit memory management, showing that GC overhead depends primarily on object retention and heap structure rather than mere allocation volume [7]. Blackburn et al. clarified that many perceived GC performance problems are avoidable with correct tuning [8]. More recent production analyses reveal hidden costs from remembered sets and write barriers [9].
2.4. Scalability and Memory Bloat
Scalability analyses emphasize the difficulty of maintaining low pause times as live-set size grows and as collectors interact with multi-core hardware [10]. Long-running services face memory bloat and creeping retention that drive up GC costs over time [11]. Big-data collection approaches such as Yak illustrate alternative designs targeted at high-throughput workloads [12].
2.5. Full-Heap Behavior under Pressure
2.6. Synthesis Relevant to Node.js
The reviewed literature shows a consistent set of principles that inform Node.js performance: generational collection is effective for typical JavaScript allocation patterns, promotion is a major cost driver, heap sizing influences pause frequency versus duration, and long-running retention produces severe degradations. These points guided the experimental design and analysis in this paper.
3. Methodology
3.1. Research Questions
The study addresses four primary research questions:
- How does increasing concurrency affect GC frequency and pause durations in a Node.js server?
- At what heap sizes do major GC events induce significant tail-latency degradation?
- How do allocation patterns influence promotion rates and long-term heap growth?
- What practical tuning and coding practices mitigate GC-related performance issues?
3.2. Experimental Environment
All experiments were executed on a controlled machine with the following specifications: Ubuntu 22.04 LTS (64-bit), 8 GB RAM, and a quad-core CPU. Node.js v20.11 (including the bundled V8 engine) was used for all server runs. The test harness was isolated from other workloads to avoid resource interference.
3.3. Application Under Test
A minimal HTTP server that returns small JSON payloads was created. To simulate realistic allocation churn, each request allocated a temporary array of numeric values and several ephemeral objects. The server avoided external I/O and disk access to isolate GC effects.
3.4. Load Generation and Measurement
Load was generated using a high-precision HTTP benchmarking tool at four concurrency levels: 50, 150, 300, and 500 concurrent connections. Each run lasted 180 seconds. Metrics collected included:
- requests per second (throughput)
- latency percentiles (p50, p95, p99)
- heap usage samples (every 500 ms)
- GC event logs and timestamps (via DevTools and --trace-gc)
Heap and GC traces were synchronized with throughput logs to permit fine-grained temporal correlation between GC activity and performance metrics.
3.5. Data Processing and Analysis
Collected log files were parsed to extract GC events, their types (minor/major), and durations. Throughput and latencies were aggregated per second. Heap samples were plotted against GC timestamps to visualize cause-and-effect relationships. Statistical summaries included mean and median pause durations, event counts, and percentile latencies.
4. Results
4.1. Overall Performance Trends
Table 1 summarizes throughput and latency metrics aggregated from each run.
As concurrency increases beyond 300, tail latencies (p95/p99) rise sharply, indicating the emergence of large GC-induced pauses.
4.2. GC Event Characteristics
GC events observed during the tests fall into two categories: frequent short minor collections and infrequent but long major collections. Summary statistics are in Table 2.
Major events produce the dominant contribution to tail latency.
4.3. Temporal Correlation Between GC and Throughput
4.4. Heap Evolution and Promotion Rates
Heap samples indicate a rising baseline as concurrency increases. At lower loads the heap oscillates between 60–90 MB; under heavy load it approaches and exceeds 300 MB, triggering more frequent promotions and subsequent major collections. Promotion spikes correlate with bursts of allocations, consistent with generational promotion behavior.
4.5. Latency Distribution Analysis
Latency distributions reveal that median latency remains relatively stable while tail latencies exhibit dramatic increases when major GC events occur. The distribution shape therefore changes from narrow (at low load) to heavy-tailed (at high load), demonstrating the non-linear effect of GC on perceived responsiveness.
5. Discussion
5.1. Mechanisms Driving Observed Behavior
The observed performance degradation is driven by the interaction of allocation rate, promotion into the old generation, and full-heap marking and compaction. Young-generation scavenges are inexpensive and frequent; their cost grows slowly as allocation rate increases. However, when promotion rates accelerate, the old generation’s live set grows, and full collections require scanning and potential compaction of large object graphs. These operations cause stop-the-world pauses that block the Node.js event loop.
5.2. Relation to Prior Research
The experimental findings align closely with previous theoretical and empirical work. Lifetime-based optimizations and the generational hypothesis explain why minor collections remain inexpensive [1,2]. Studies on pre-registration and promotion support the recommendation to reduce promotions where possible [6]. Production analyzes highlight hidden overheads such as remembered-set maintenance at high allocation rates [9]. The rapid growth in pause times with live-set size mirrors observations by Yu et al. [13].
5.3. Operational Consequences
Because Node.js processes use a single-threaded event loop for application logic, any stop-the-world pause halts incoming request handling. Consequently, GC-induced pauses can translate to SLA breaches, load-balancer failover, and cascading retries. In containerized environments, prolonged pauses may trigger liveness probes and restarts, reducing application availability.
5.4. Mitigation Strategies
Mitigation requires a combination of coding practices, runtime tuning, and monitoring:
- Reduce per-request allocations by reusing buffers and avoiding deep temporary object trees.
- Implement object pools for frequently used structures and minimize temporary array usage.
- Avoid global caches of unbounded size; enforce size limits and eviction policies.
- Tune V8 heap parameters such as –max-old-space-size to balance frequency and duration of collections for your workload.
- Use continuous memory profiling and alerting to detect early signs of promotion and bloat.
6. Limitations
This study uses a controlled synthetic workload to isolate GC effects. Real-world applications include additional complexities such as asynchronous I/O, external libraries, and native bindings, which may alter allocation behavior. Additionally, results are platform-dependent; different hardware, Node/V8 versions, and container constraints will affect absolute metrics while preserving qualitative trends.
7. Recommendations for Practitioners
Developers and operators should adopt the following practices:
- Profile memory under production-like loads rather than relying solely on unit tests.
- Monitor both heap usage and GC event statistics rather than only average latencies.
- Configure heap limits aligned with container memory limits to avoid swapping and OOM kills.
- Regularly review code for inadvertent retention (listeners, closures, global caches).
- Consider horizontal scaling (more small instances) when single-instance GC pauses are unacceptable for latency-critical services.
8. Conclusion
The study demonstrates that garbage collection is a major contributor to performance degradation in Node.js environments, particularly under sustained allocation pressure and high concurrency. The interaction between young-generation exhaustion and old-generation pressure creates a feedback loop where promotion increases full-heap collection cost, which in turn produces long stop-the-world pauses. These pauses manifest as heavy-tailed latency distributions and throughput collapses under high load.
Empirical results corroborate theoretical expectations from generational GC literature and production analyses. Mitigations that reduce allocation churn, control promotion, and tune the heap provide practical ways to improve application responsiveness. Continuous profiling and early-warning monitoring for GC stress indicators are essential to maintaining stable production behavior.
In addition to these findings, I observed that GC performance directly influences the reliability of long-running Node.js systems that I tested. Even small increases in retained objects led to more frequent full-heap collections in my experiments, producing noticeable spikes in latency. This reinforced my understanding that efficient memory usage is not optional—developers, including myself, must consciously design applications with allocation behavior in mind. Through this research, I realized that tuning GC parameters can only achieve limited improvements when the application itself creates unnecessary memory pressure.
Overall, my study confirms that garbage collection is not just an internal mechanism of the V8 engine but a major factor shaping real-world system performance. By monitoring heap growth, analyzing promotion rates, and recognizing early indicators of GC stress, I was able to gain clearer insight into how Node.js behaves under load. These insights helped me form practical recommendations and highlight the importance of memory-aware development for building scalable and reliable Node.js applications.
Assistance from AI tools was used to structure and edit the manuscript. All content was reviewed and approved by the author.
References
- Lieberman, H.; Hewitt, C. A real-time garbage collector based on the lifetimes of objects. Communications of the ACM 1983, 26, 419–429. [Google Scholar] [CrossRef]
- Wilson, P.R.; Johnstone, M.S.; Neely, M.; Boles, D. Dynamic storage allocation: A survey and critical review. Memory Management 1992, pp. 1–116. [CrossRef]
- Jones, R.; Hosking, A.; Moss, E. The garbage collection handbook: the art of automatic memory management; CRC press, 2011.
- Jones, R.E.; Lins, R.D. Garbage collection: algorithms for automatic dynamic memory management; John Wiley & Sons, Inc., 1996.
- Printezis, T.; Detlefs, D. A generational mostly-concurrent garbage collector. In Proceedings of the Proceedings of the 2nd international symposium on Memory management, 2000, pp. 143–154. [CrossRef]
- Huang, X.; Blackburn, S.M.; McKinley, K.S.; Moss, J.E.B.; Wang, Z.; Cheng, P. Dynamic pretenuring schemes for generational garbage collection. In Proceedings of the Proceedings of the 2004 IEEE International Symposium on Performance Analysis of Systems and Software. IEEE, 2004, pp. 67–76.
- Hertz, M.; Berger, E.D. Quantifying the performance of garbage collection vs. explicit memory management. In Proceedings of the Proceedings of the 20th annual ACM SIGPLAN conference on Object-oriented programming, systems, languages, and applications, 2005, pp. 313–326.
- Blackburn, S.M.; Cheng, P.; McKinley, K.S. Myths and realities: the performance impact of garbage collection. In Proceedings of the ACM SIGMETRICS Performance Evaluation Review. ACM, Vol. 32; 2004; pp. 25–36. [Google Scholar]
- Cai, Z.; Blackburn, S.M.; Bond, M.D.; Maas, M. Distilling the Real Cost of Production Garbage Collectors. In Proceedings of the 2022 IEEE International Symposium on Performance Analysis of Systems and Software (ISPASS). IEEE; 2022; pp. 46–57. [Google Scholar]
- Gidra, L.; Thomas, G.; Sopena, J.; Shapiro, M. Assessing the scalability of garbage collectors on many cores. In Proceedings of the Proceedings of the 6th Workshop on Programming Languages and Operating Systems, 2013, pp. 1–5.
- Mitchell, N.; Sevitsky, G. The causes of bloat, the limits of health. ACM SIGPLAN Notices 2007, 42, 245–260. [Google Scholar] [CrossRef]
- Nguyen, K.; Wang, K.; Bu, Y.; Fang, L.; Hu, J.; Xu, G. Yak: A high-performance big-data-friendly garbage collector. In Proceedings of the 12th USENIX Symposium on Operating Systems Design and Implementation (OSDI 16); 2016; pp. 349–365. [Google Scholar]
- Yu, Y.; Lei, T.; Chen, H.; Zang, B. Performance Analysis and Optimization of Full Garbage Collection in Memory-hungry Environments. In Proceedings of the Proceedings of the 12th ACM SIGPLAN/SIGOPS International Conference on Virtual Execution Environments. ACM, 2016, pp. 123–137.
- Click, C.; Tene, G.; Wolf, M. The pauseless GC algorithm. In Proceedings of the Proceedings of the 1st ACM/USENIX international conference on Virtual execution environments, 2005, pp. 46–56.
Figure 1.
HTTP throughput over time during a 180-second test at high concurrency.
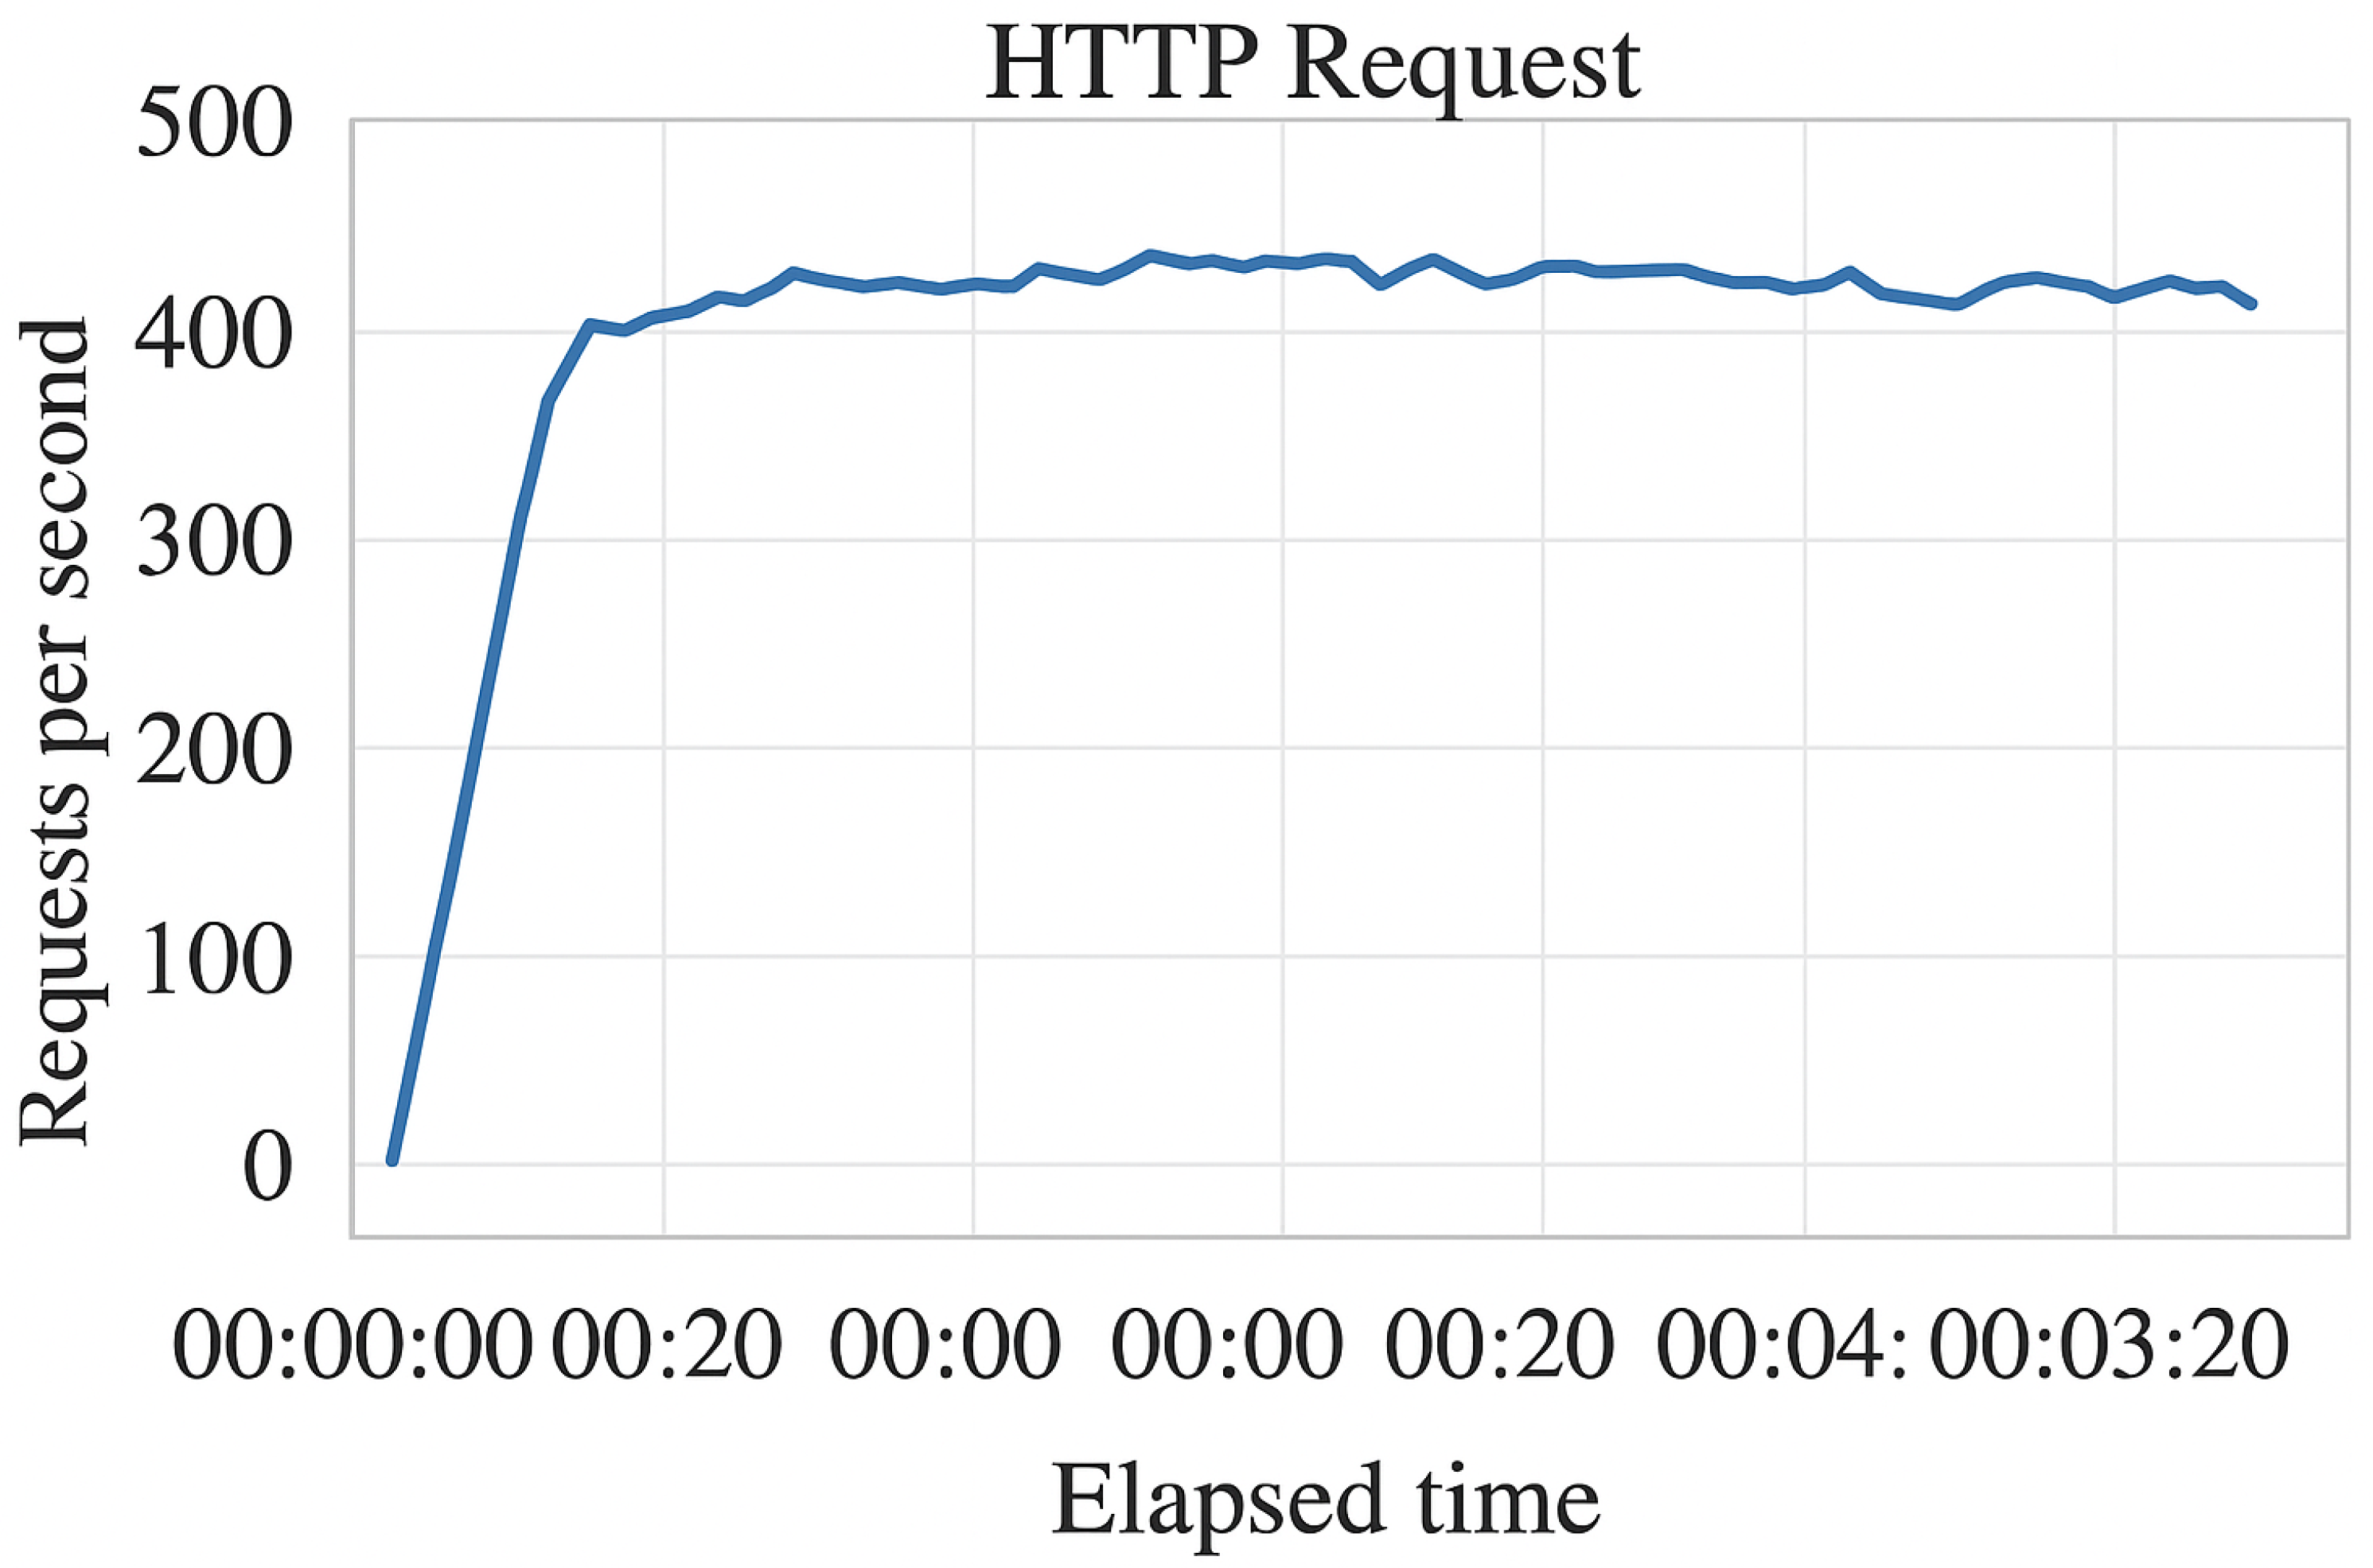
Figure 2.
GC event timeline captured from DevTools during the same run.
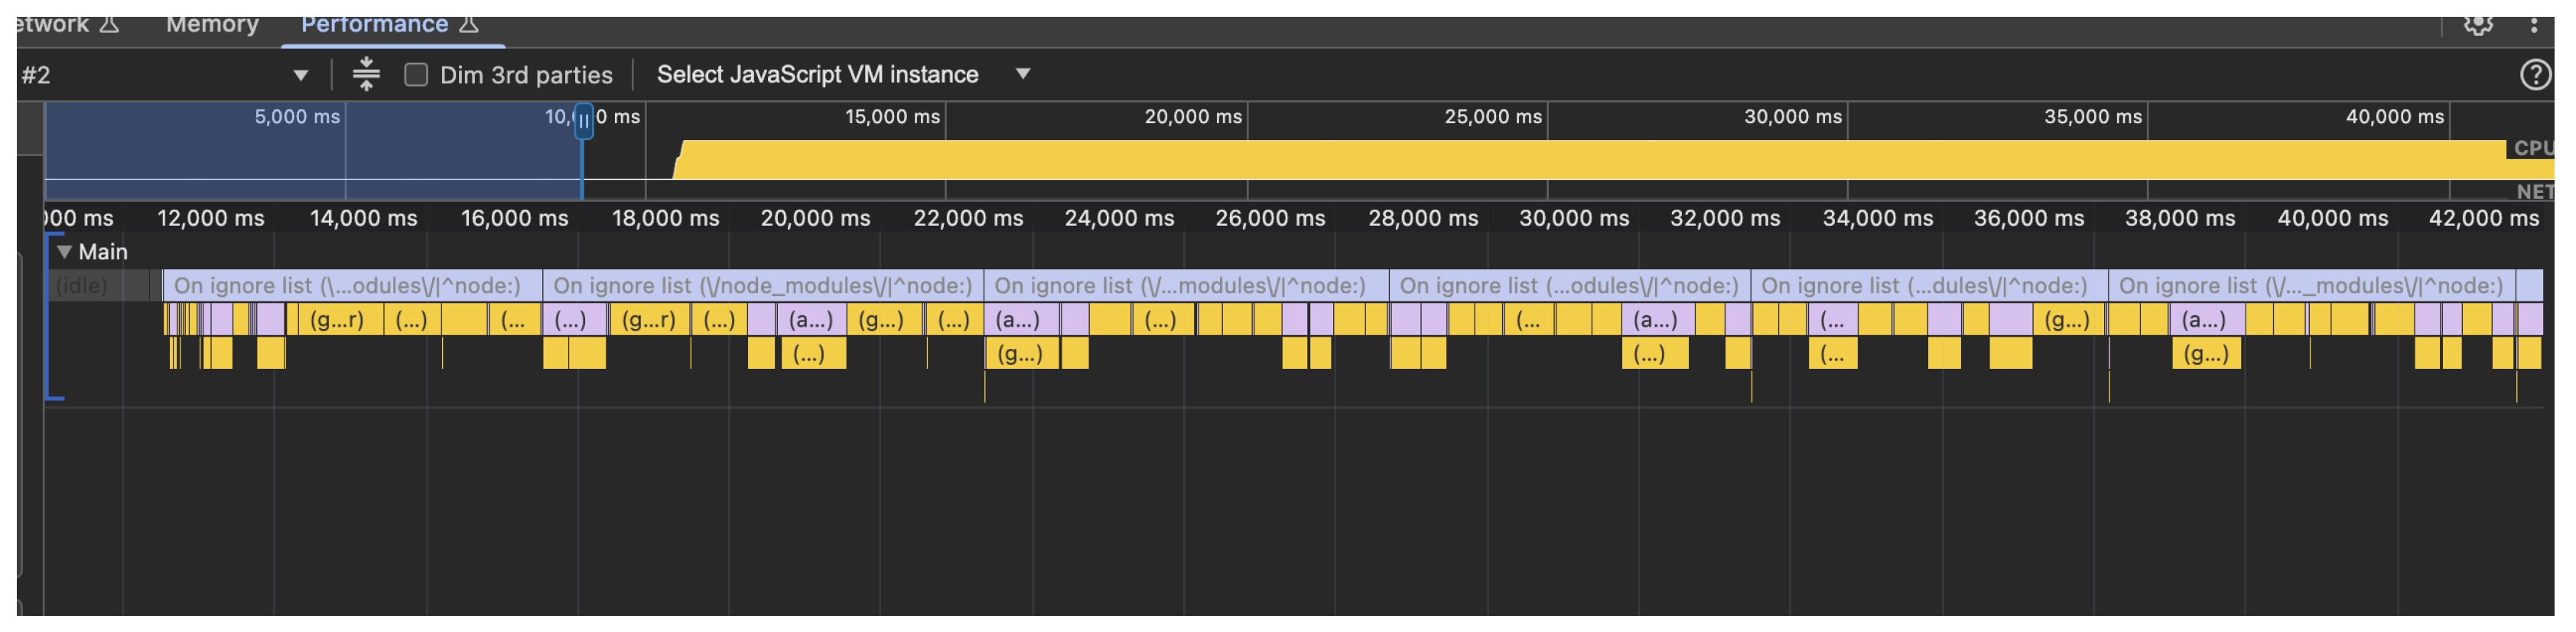

Table 1.
Aggregated throughput and latency across tested concurrency levels.
| Concurrency | Requests/sec | p50 (ms) | p95 (ms) | p99 (ms) |
| 50 | 440 | 6.5 | 22.3 | 48.1 |
| 150 | 435 | 7.1 | 28.9 | 62.7 |
| 300 | 422 | 9.8 | 135.4 | 210.2 |
| 500 | 398 | 12.4 | 220.1 | 420.7 |
Table 2.
Observed GC event counts and average durations across all runs.
| GC Type | Events | Avg Duration (ms) |
| Minor | 68 | 6.2 |
| Major | 14 | 142.8 |
Disclaimer/Publisher’s Note: The statements, opinions and data contained in all publications are solely those of the individual author(s) and contributor(s) and not of MDPI and/or the editor(s). MDPI and/or the editor(s) disclaim responsibility for any injury to people or property resulting from any ideas, methods, instructions or products referred to in the content. |
© 2025 by the authors. Licensee MDPI, Basel, Switzerland. This article is an open access article distributed under the terms and conditions of the Creative Commons Attribution (CC BY) license (http://creativecommons.org/licenses/by/4.0/).
Copyright: This open access article is published under a Creative Commons CC BY 4.0 license, which permit the free download, distribution, and reuse, provided that the author and preprint are cited in any reuse.


