
Submitted:
27 November 2025
Posted:
02 December 2025
You are already at the latest version
Abstract
Bovine Tuberculosis (bTB) remains one of the most persistent and costly livestock diseases in Ireland, threatening animal health, farm livelihoods, and national biosecurity. In 2024, 5,906 herds experienced a TB breakdown, leading to the removal of 37,964 reactor animals, with significant impacts on agricultural exports—€6.3 billion from dairy and €2.8 billion from beef. This study leverages a comprehensive national dataset spanning 2019–2023, comprising over 84 million records, including individual bTB tests, cattle movement logs, herd demographics, and herd status information. Using this dataset, we applied machine learning enhanced with graph-based network features from cattle movements to predict herd-level bTB breakdowns one year in advance. Traditional herd characteristics were combined with network metrics—including degree, PageRank, closeness, betweenness, and Louvain clustering—and evaluated under three data augmentation strategies: Random Under-Sampling (RUS), Random Over-Sampling, and Synthetic Minority Oversampling. The best-performing model (Random Forest with RUS) achieved a sensitivity of 0.83, specificity of 0.85, and ROC–AUC of 0.89. Feature importance analysis showed conventional risk factors dominated, with PageRank ranking fifth among all features. Despite a moderate precision of 0.23, these results highlight the potential of integrating network analytics with machine learning to enhance targeted bTB surveillance and control strategies.
Keywords:
graph features
; machine learning
; data augmentation
1. Introduction
Bovine tuberculosis (bTB) is a chronic infectious disease in cattle, primarily affecting the lungs and associated lymph nodes, caused by the bacterium Mycobacterium bovis [1]. Transmission occurs through multiple pathways, including inhalation of aerosolised droplets from infected animals and contact with materials contaminated by infected excreta. In aerosol form, the bacterium can survive in the air for several hours, while in environmental suspension it may persist for up to six months [2]. Reported herd-level risk factors for bTB breakdowns include a history of previous breakdowns, total farm area, cattle movement patterns, proximity to infected herds, herd size, badger presence, and others [3]. When a herd experiences a bTB breakdown, one or more cattle testing positive (reactors) are culled, and movement restrictions are imposed until the herd is confirmed bTB-free.
Testing for bTB, alongside other control measures implemented under national eradication programmes, imposes substantial economic costs worldwide. In Ireland, government expenditure on the eradication scheme reached €74.3 million in 2023, up from €57.4 million in 2022 [4]. The programme includes annual cattle testing, removal of reactors, targeted badger culling, and movement restrictions for affected herds [5]. Beyond official costs, herd owners often face additional “consequential costs” for which they receive no compensation, such as extra testing requirements, loss of sales, and increased labour demands. Furthermore, 6% of farmers have reported experiencing “psychological and emotional stress” as a result of bTB breakdowns [6].
Project Aims: By predicting herd-level bTB breakdowns, we aim to improve understanding of disease spread and its driving factors, enabling more targeted and effective containment strategies. This approach has the potential to reduce both the direct and indirect costs borne by farmers and the public sector. Notably, smaller farms are disproportionately affected, as larger operations are generally more resilient to the financial impact of bTB breakdowns. Moreover, financial losses are often delayed; for instance, replacing culled animals can require rearing cattle for more than two years before productivity is restored [7].
Key Contributions: (1) Graph-based Features: Integrated network-derived metrics (e.g., PageRank, centrality measures, and community detection) into the feature set to enhance the predictive performance of machine learning methods; (2) Class Imbalance Handling: Addressed severe class imbalance through data augmentation techniques combined with ensemble learning methods; (3) Feature Importance Analysis: Top 20 features from models shared identical top seven risk factors, with network metrics like PageRank and centrality ranked lower.
2. Related Works
Statistical Application: A 2012–2019 Irish study used spatio-temporal models and national bTB data, finding that cattle numbers, badger captures, forest cover, and farm fragmentation were significant risk factors, while badger habitat and dairy herd percentage were not. Incorporating spatial correlation improved accuracy and highlighted persistent high-risk areas [8]. In England, a dynamic Bayesian network model, informed by expert input and historical data, captured bTB’s cyclical spread and control, emphasizing factors like badger density and test accuracy for a more realistic disease progression view [9].
ML Application: A recent UK study applied machine learning (ML) to predict herd-level bTB breakdowns, aiming to improve diagnostic sensitivity. Using data from 2012–2014 with about 4,700 positive herds annually, the best model increased herd-level sensitivity from 61.3% to 67.6% and specificity from 90.5% to 92.3% on 2015 validation data, highlighting ML’s potential to enhance disease control [10]. Another study in England used classification trees and random forests to predict incidents at the 60-day retest following inconclusive SICCT results. The classification tree achieved 70% sensitivity and 93% specificity, enabling targeted testing of high-risk herds to reduce disease spread [11]. A recent hybrid approach combined a Convolutional Neural Network and a Support Vector Machine to classify five major cattle diseases, including bTB, achieving an overall recall of 95.61%, with high accuracy and precision across categories [12].
Network-Based Analysis of bTB Spread: A study in northwestern Minnesota, USA, analyzed 57,460 cattle movements over three years across 682 premises. Although sale yards comprised less than 2% of premises, they accounted for 60% of movements. The network had low density (0.4%) and clustering (14.6%), with 20% of nodes responsible for 90% of movements, highlighting potential targets for surveillance. Notably, 80% of bTB risk was concentrated in just 14% of premises [13]. In France, network analysis of cattle movements from 2005 to 2014 linked high in-degree centrality and longer contact chains with increased bTB infection risk. While spatial proximity to infected herds accounted for 73% of transmission risk, cattle movements facilitated spread between distant areas, indicating movement as a key transmission pathway alongside local spread [14]. In Uruguay, where bTB prevalence has declined due to strict control, evaluating ten surveillance strategies showed that excluding low-risk farms from testing could cut sampling by 40% without raising disease incidence. This supports risk-based surveillance as a cost-effective approach, especially in low-prevalence, resource-limited settings [15].
Comparison: Existing statistical models for bTB prediction often rely on spatio-temporal correlations and aggregated risk factors. While these approaches are useful, they may not fully capture the dynamic nature of disease spread driven by animal movements. Network-based studies have emphasized the role of cattle trade in transmission but generally focus on descriptive analyses rather than directly integrating network features into predictive models. Moreover, many prior ML approaches overlook the challenge of class imbalance in bTB data, which limits their practical effectiveness in surveillance. In contrast, our study combines ML with graph-derived features extracted from animal movement networks, providing a richer representation of inter-herd connectivity. We also systematically address class imbalance using resampling techniques such as Random Under-Sampling, Random Over-Sampling, and Synthetic Minority Oversampling Technique, enhancing model performance in this low-prevalence context.
3. Dataset and Methodology
3.1. Dataset
The dataset utilized in this study spans a five-year period, from 2019 to 2023, and was provided by the Department of Agriculture, Food, and the Marine (DAFM)1. This comprehensive dataset includes detailed information on cattle movements between herds, the history of bTB breakdowns, and various herd-specific characteristics relevant to bTB epidemiology.
In total, the dataset comprises 84,866,921 records, reflecting the scale and complexity of the national cattle surveillance and movement systems. The main components of the dataset are as follows:
- Animal Test Records: This subset contains 47,041,927 entries, each documenting individual bTB tests. These records include information on the herd where the test was conducted, the identity of the animal tested, and the corresponding test results.
- Animal Movement Records: With 33,355,210 entries, this portion of the data captures detailed logs of animal transfers, including the date of movement, origin, and destination herds.
- Herd Demographics and Characteristics: A total of 2,161,924 quarterly records describe herd-level attributes. These include the age distribution of cattle, herd type (e.g., beef or dairy), and the reported presence of wildlife such as deer or badgers, which are known vectors for bTB transmission.
- Herd Status Records: Comprising 2,307,860 entries, this dataset indicates the status of herds, specifically whether they experienced a breakdown and their assigned bTB risk classification—high, normal, or low. It also denotes whether the herd was active during the recorded period.
The predictive modeling in this study focused on a binary target variable named tb_breakdown_next_year. A value of 1 indicates that the herd experienced a bTB breakdown in the following year, while a value of 0 signifies that the herd remained free from breakdown. This formulation allowed for the application of supervised ML techniques to forecast bTB risk at the herd level, thereby supporting targeted interventions and enhanced disease surveillance strategies.
3.2. Methodology
To collaborate effectively on this project, we adopted a three-pronged strategy focusing on reproducibility, efficiency, and flexibility across each team member’s data workflows. Given the data’s size and the range of operations required for extraction and cleaning, we chose MySQL and Neo4j as our databases. To ensure reproducibility, we used environment variables and the Python drivers for both databases in our scripts. All database operations were implemented as repeatable scripts, and indexes were created to optimize performance.
Figure 1 outlines the data pipeline from the original source to the results generated by the ML models. Data from the provided TSV files was first ingested into MySQL tables. Relevant nodes were then created by querying the MySQL tables and subsequently imported into Neo4j.
We executed multiple queries to run the required graph algorithms, and the outputs were consolidated into a new graph-features file. In parallel, tabular features were extracted and enhanced using aggregation functions. To address inconsistencies between tables in the original dataset, we employed a business ID mapping script, enabling us to align all rows between the graph and tabular features.
This process yielded the final ML dataset, on which we performed Variance Inflation Factor (VIF) analysis to reduce multicollinearity. The resulting CSV file served as the input for training and evaluating our models.
4. Data Engineering Based on Graph
4.1. Graph Modelling
As part of our analysis on the impact of animal movement on the spread of bTB, we modelled the movement data between herd keepers and marts in Neo4j, using the Python driver to interface with the database. The database consisted of three node types (herd_keeper, herd_breakdown_status, and mart) and two relationship types (transfer_to and active_status).
A transferred_to edge represents a single movement of an animal from one node to another, with attributes such as year and movement_order. The active_status relationship indicates that a herd experienced a breakdown in a given year. This allowed us to quantify animal transfers originating from herds that broke down with bTB and could potentially spread the disease within the same year.
Across all five years of data (2019–2023), the graph contained a total of 549,981 nodes (526,327 herd_keeper, 23,238 herd_breakdown_status, and 416 mart nodes) and 20,833,668 edges (12,710,897 transfer to herd_keepers, 8,099,533 transfer to mart, and 23,238 active_status relationships). An overview of the graph database and the herd movement network is shown in Figure 2, which illustrates the graph database schema, and in Figure 3, which presents a subset of the network highlighting the relationships between herd keepers (green) and marts (pink) in 2022.
4.2. Graph Features
To assess the role of different nodes in the animal movement network, we applied several graph algorithms to capture their significance and influence [16]. The resulting metrics were extracted and used as features in our supervised learning models.
- Degree: The total number of edges entering and leaving a node, separated into in-links and out-links [17]. In our context, this represents the number of incoming and outgoing animal transfers for a herd or mart. We also identified transfers originating from herds that experienced a breakdown within the year.
- Betweenness: A measure of how influential a node is in connecting other nodes. The algorithm calculates shortest paths between all pairs of nodes, and nodes that appear most frequently on these paths receive the highest scores [18]. In our data, this highlights herds and marts that act as key bridges for potential disease transmission across the network.
- Closeness: Assigns higher scores to nodes that, on average, have the shortest distances to all other nodes [19]. In our dataset, these correspond to central nodes that could act as “super-spreaders” due to their proximity to others within the network.
- PageRank: Scores nodes based on the number and quality of incoming links, giving higher weight to links from more important nodes [20]. In our context, this measures a node’s overall importance and its potential influence on disease spread across the network.
- Louvain Clustering: A hierarchical community detection algorithm that groups nodes into clusters based on connection density [21]. In our data, herds and marts that frequently trade with one another form the same cluster, effectively partitioning the network into communities.
Due to the volume of animal transfers, we opted to create aggregated counts of transfers between each herd and mart on a yearly basis. We created projections for each year upon which the graph algorithms listed above were run, leading to our results.
5. Supervised Learning Models
5.1. ML Dataset Creation
We constructed the ML dataset by merging enriched tabular data from the MySQL database with graph-based features from the Neo4j database [22] into a single CSV file. Graph features (Section 4.2) were combined with additional tabular features, including import/export cattle ratios, counts of bTB risk status changes (default, lower risk, high risk), and cattle-type counts (dairy, beef). Records were joined on herd reference IDs, producing yearly snapshots that captured both network metrics and herd-level characteristics.
Feature Reduction: To improve model efficiency and mitigate multicollinearity, we applied Variance Inflation Factor (VIF) analysis. VIF measures how much the variance of a regression coefficient is inflated due to correlations among input features [23]. We computed VIF scores for all features and removed those with values substantially exceeding the threshold of 5, based on two main criteria. First, columns representing the ages of dairy cows (0–18 months) were excluded due to sparsity, as they contained predominantly zero values. Second, aggregate counts derived from more granular features already present in the dataset were removed, as they introduced high multicollinearity without adding predictive value. Finally, after removing 12 features from the original set, 80 features remained.
5.2. Evaluation Metrics and Experimental Setup
Given the significant class imbalance in our dataset, we adopted a comprehensive evaluation strategy to ensure reliable assessment of model performance. We employed the following metrics:
- Sensitivity (Se) – the true positive rate, measuring the proportion of actual positive cases correctly identified by the model;
- Specificity (Sp) – the true negative rate, reflecting the proportion of actual negative cases correctly classified;
- Positive Predictive Value (PPV) – precision for the positive class, indicating the proportion of predicted positive cases that are truly positive;
- Receiver Operating Characteristic Area Under the Curve (ROC-AUC, R-A) – a threshold-independent metric summarizing the trade-off between sensitivity and specificity across all possible decision thresholds [24].
To ensure robust performance estimation, the dataset was split 80:20 into training and testing sets. The training set underwent 5-fold cross-validation, where each of five subsets served once as validation data [25]. This approach reduces variance in performance estimates and mitigates overfitting, especially for imbalanced datasets.
5.3. ML Methods and Data Augmentation
We conducted experiments using four supervised ML methods: Logistic Regression (LR), Random Forest (RF) [26], XGBoost, and LightGBM. Our initial baseline used default hyperparameters without any form of data augmentation. Subsequently, a Soft Voting Ensemble classifier was constructed to combine the predictions of all four methods [24]. Finally, we applied a stratified random search cross-validation procedure to optimize model hyperparameters based on the ROC-AUC metric, aiming to balance sensitivity and specificity.
Given the high class imbalance in our dataset (approximately 5% positive cases), we evaluated three data augmentation strategies: Random Over-Sampling (ROS), Random Under-Sampling (RUS), and the Synthetic Minority Oversampling Technique (SMOTE). In the original training split, the dataset contained 418,775 rows; after augmentation, the size varied from 30,506 rows with RUS to 639,534 rows with ROS or SMOTE.
5.4. Results
As shown in Table 1, most models achieved a similar R-A score of approximately 0.88. The highest R-A score of 0.89 was obtained by multiple model–augmentation combinations, including Random Forest with RUS (RF–RUS), which produced Se = 0.83, Sp = 0.85, and PPV = 0.23. While higher individual metrics were reached in other experiments—such as Sp = 1.00 and PPV = 0.47 with Random Forest on the unaugmented dataset—these came at the cost of extremely low sensitivity (Se = 0.02), meaning that very few herds experiencing breakdowns were correctly identified.
In contrast, the RF–RUS configuration offers a more balanced trade-off between Se and Sp, ensuring that most herds likely to experience a breakdown are correctly flagged (high Se) while also maintaining a low false-positive rate (high Sp). This balance is crucial for practical disease monitoring, where high sensitivity supports early intervention and high specificity helps avoid unnecessary control measures. However, the consistently low PPV across all configurations remains a limitation, largely driven by the strong class imbalance in the dataset—an effect not fully captured by specificity alone.
The R-A curves for the best-performing configuration, Random Forest with Random Under-Sampling (RF–RUS), are presented in Figure 4, illustrating its performance on both cross-validation and independent test sets. The RF–RUS model achieved a robust R-A score of 0.887 on the test set, closely matching its cross-validation performance of 0.886 observed during training. This consistency indicates strong model generalisation and suggests that the RF–RUS configuration effectively balances sensitivity and specificity even on unseen data. The figure highlights the stability and reliability of the model’s predictive capability across different evaluation stages.
The most influential features were extracted from the best-performing model by calculating the decrease in impurity after each split. As shown in Figure 5, these top features predominantly correspond to risk factors. Specifically, they represent the herd’s risk status based on the severity and history of previous breakdowns, the number of at-risk animals, and the purchase history of the herd keeper. Among age-related features, the count of dairy cattle older than 36 months was the most important. Following these, several network features emerged, including PageRank, inlinks from marts, outlinks, closeness centrality, and betweenness centrality.
We also analysed feature importance for the LightGBM model trained with RUS, which performed similarly. Notably, the top seven features in LightGBM matched exactly in identity and rank with those from the Random Forest model. However, the remaining thirteen features differed considerably; for instance, the LightGBM model identified a community feature not present in the Random Forest model, along with different age range variables.
These results indicate that both models learned very similar underlying patterns, heavily relying on the risk factor scores. Unfortunately, the graph-based network features, while present, were generally deemed less important in the decision-making process of the models.
6. Conclusion and Future Work
Our experiments demonstrate the potential of combining ML with network-based features to predict herd-level bTB breakdowns across Ireland. The best-performing configuration, RF–RUS, achieved strong sensitivity and specificity. Network-derived metrics such as PageRank, betweenness centrality, and closeness centrality ranked among the top 20 predictors; however, traditional risk factors remained the most influential.
Despite this promising performance, the model’s PPV remained low, reflecting a high false-positive rate. The lack of location-specific data may also have constrained predictive accuracy. Nevertheless, the modelling framework developed here has the potential to make a meaningful contribution to Ireland’s bTB Eradication Programme. Importantly, the prediction windows can be adjusted to align with epidemiological requirements, making the approach adaptable to different operational contexts. This flexibility enhances its utility as a decision-support tool for veterinarians, enabling the identification of high-risk cattle for targeted interventions such as risk-based testing.
Future work will refine the prediction window and integrate additional data sources. Shorter forecasting horizons (60–90 days) may better identify herds needing immediate testing and enable faster interventions. Incorporating geographic data could also enhance predictive accuracy by capturing proximity-based cattle interactions not reflected in recorded transfers. Finally, we will explore the use of Enhancing Bagging Ensemble Regression [27], knowledge graphs [28,29], and data warehouse frameworks [30,31] to improve both classification performance and computational efficiency.
Acknowledgments
This study has emanated from research conducted with the financial support of Taighde Éireann – Research Ireland under Grant number 12/RC/2289_P2, and the Department of Agriculture, Food and the Marine (DAFM), Ireland under Grant number 03294001D.AGR.
References
- Domingo, M.; Vidal, E.; Marco, A. Pathology of bovine tuberculosis. Research in Veterinary Science 2014, 97, S20–S29. [Google Scholar] [CrossRef] [PubMed]
- TB Hub. TB in the Environment – Bovine TB. https://tbhub.co.uk/preventing-tb-breakdowns/biosecurity/tb-in-the-environment/. Accessed June 2025.
- Skuce, R.A.; Allen, A.R.; McDowell, S.W.J. Herd-Level Risk Factors for Bovine Tuberculosis: A Literature Review. Veterinary Medicine International 2012, 2012, 621210. [Google Scholar] [CrossRef] [PubMed]
- O Donnell, C. TB programme: Reactors, restrictions and costs all rise in 2023. https://www.agriland.ie/farming-news/tb-programme-reactors-estrictions-and-costs-all-rise-in-2023, 2024.
- Department of Agriculture, Food and the Marine. TB Eradication Scheme. https://www.gov.ie/en/service/05f79-tb-eradication-scheme.
- Barnes, A.P.; et al. The consequential costs of bovine tuberculosis (bTB) breakdowns in England and Wales. Preventive Veterinary Medicine 2023, 211, 105808. [Google Scholar] [CrossRef] [PubMed]
- Perez-Morote, R.; et al. Quantifying the Economic Impact of Bovine Tuberculosis on Livestock Farms in South-Western Spain. Animals 2020, 10. [Google Scholar] [CrossRef] [PubMed]
- Madden, J.M.; et al. Spatio-temporal models of bovine tuberculosis in the Irish cattle population, 2012-2019. Spatial and Spatio-temporal Epidemiology 2021, 39, 100441. [Google Scholar] [CrossRef] [PubMed]
- Sedighi, T.; Varga, L. Evaluating the Bovine Tuberculosis Eradication Mechanism and Its Risk Factors in England’s Cattle Farms. International Journal of Environmental Research and Public Health 2021, 18, 3451. [Google Scholar] [CrossRef] [PubMed]
- Stański, K.; Lycett, S.; Porphyre, T.; de, C. Bronsvoort, B.M. Using machine learning improves predictions of herd-level bovine tuberculosis breakdowns in Great Britain. Scientific Reports 2021, 11. [Google Scholar] [CrossRef] [PubMed]
- Romero, M.P.; et al. Machine learning classification methods informing the management of inconclusive reactors at bovine tuberculosis surveillance tests in England. Preventive Veterinary Medicine 2022, 199, 105565. [Google Scholar] [CrossRef] [PubMed]
- Mehta, S.; Bhalla, A. Harnessing the Power of CNN and SVM for Robust Cattle Disease Classification. In Proceedings of the 2024 15th International Conference on Computing Communication and Networking Technologies (ICCCNT), Kamand, India; 2024; pp. 1–6. [Google Scholar] [CrossRef]
- Ribeiro-Lima, J.; Enns, E.A.; Thompson, B.; Craft, M.E.; Wells, S.J. From network analysis to risk analysis—An approach to risk-based surveillance for bovine tuberculosis in Minnesota, US. Preventive Veterinary Medicine 2015, 118, 328–340. [Google Scholar] [CrossRef] [PubMed]
- Palisson, A.; Courcoul, A.; Durand, B. Role of Cattle Movements in Bovine Tuberculosis Spread in France between 2005 and 2014. PLOS ONE 2016, 11, e0152578. [Google Scholar] [CrossRef] [PubMed]
- VanderWaal, K.; et al. Optimal surveillance strategies for bovine tuberculosis in a low-prevalence country. Scientific Reports 2017, 7. [Google Scholar] [CrossRef] [PubMed]
- Roantree, M.; Murphy, N.; Cuong, D.V.; Ngo, V.M. Graph-Based Optimisation of Network Expansion in a Dockless Bike Sharing System. In Proceedings of the IEEE 40th International Conference on Data Engineering Workshops (ICDEW); 2024; pp. 48–55. [Google Scholar]
- Brandes, U. A faster algorithm for betweenness centrality. The Journal of Mathematical Sociology 2001, 25, 163–177. [Google Scholar] [CrossRef]
- Cuong, D.V.; Ngo, V.M.; Cappellari, P.; Roantree, M. Analyzing Shared Bike Usage Through Graph-Based Spatio-Temporal Modeling. IEEE Open Journal of Intelligent Transportation Systems 2024, 5, 115–131. [Google Scholar] [CrossRef]
- Okamoto, K.; Chen, W.; Li, X.Y. Ranking of Closeness Centrality for Large-Scale Social Networks. In Proceedings of the Frontiers in Algorithmics; Preparata, F.P.; Wu, X.; Yin, J., Eds., Berlin, Heidelberg; 2008; pp. 186–195. [Google Scholar] [CrossRef]
- Brin, S.; Page, L. The anatomy of a large-scale hypertextual Web search engine. Computer Networks and ISDN Systems 1998, 30, 107–117. [Google Scholar] [CrossRef]
- Lu, H.; Halappanavar, M.; Kalyanaraman, A. Parallel Heuristics for Scalable Community Detection, 2014. [CrossRef]
- Ngo, V.M.; Bolger, E.; Goodwin, S.; O’Sullivan, J.; Cuong, D.V.; Roantree, M. A Graph Based Raman Spectral Processing Technique for Exosome Classification. In Proceedings of the Artificial Intelligence in Medicine; Bellazzi, R.; et al., Eds. Springer, 2025, pp. 344–354. [CrossRef]
- Kim, J.H. Multicollinearity and misleading statistical results. Korean Journal of Anesthesiology 2019, 72, 558–569. [Google Scholar] [CrossRef] [PubMed]
- Kaur, H.; Pannu, H.S.; Malhi, A.K. A Systematic Review on Imbalanced Data Challenges in Machine Learning. ACM Computing Surveys 2019, 52, 1–36. [Google Scholar] [CrossRef]
- Ngo, V.M.; Gajula, R.; Thorpe, C.; Mckeever, S. Discovering child sexual abuse material creators’ behaviors and preferences on the dark web. Child Abuse & Neglect 2024, 147, 106558. [Google Scholar] [CrossRef]
- Cogan, K.; Ngo, V.M.; Roantree, M. Developing a Dyslexia Indicator Using Eye Tracking. In Proceedings of the Artificial Intelligence in Medicine; Bellazzi, R.; et al., Eds. Springer; 2025; pp. 105–109. [Google Scholar] [CrossRef]
- Ngo, V.M.; Tran, V.Q.; Kearney, P.; Roantree, M. Enhancing Bagging Ensemble Regression with Data Integration for Time Series-Based Diabetes Prediction. In Proceedings of the Proceedings of the 17th International Conference on Computational Collective Intelligence (ICCCI’25). Springer, 2025, LNAI, pp. 1–15.
- Cao, T.H.; Ngo, V.M. Semantic search by latent ontological features. New Generation Computing 2012, 30, 53–71. [Google Scholar] [CrossRef]
- Ngol, V.M.; Munnelly1, G.; Orlandi1, F.; Crooks, P. A Semantic Search Engine for Historical Handwritten Document Images. In Proceedings of the 25th International Conference on Theory and Practice of Digital Libraries, TPDL 2021 Proceedings. Springer, 2021, Vol. 12866, p. 60. 60. [CrossRef]
- Ngo, V.M.; Le-Khac, N.A.; Kechadi, M.T. Designing and implementing data warehouse for agricultural big data. In Proceedings of the International Conference on Big Data. Springer; 2019; pp. 1–17. [Google Scholar] [CrossRef]
- Ngo, V.M.; Le-Khac, N.A.; Kechadi, M.T. Data warehouse and decision support on integrated crop big data. International Journal of Business Process Integration and Management 2020, 10, 17–28. [Google Scholar] [CrossRef]
| 1 |
Figure 1.
Data Flow Methodology
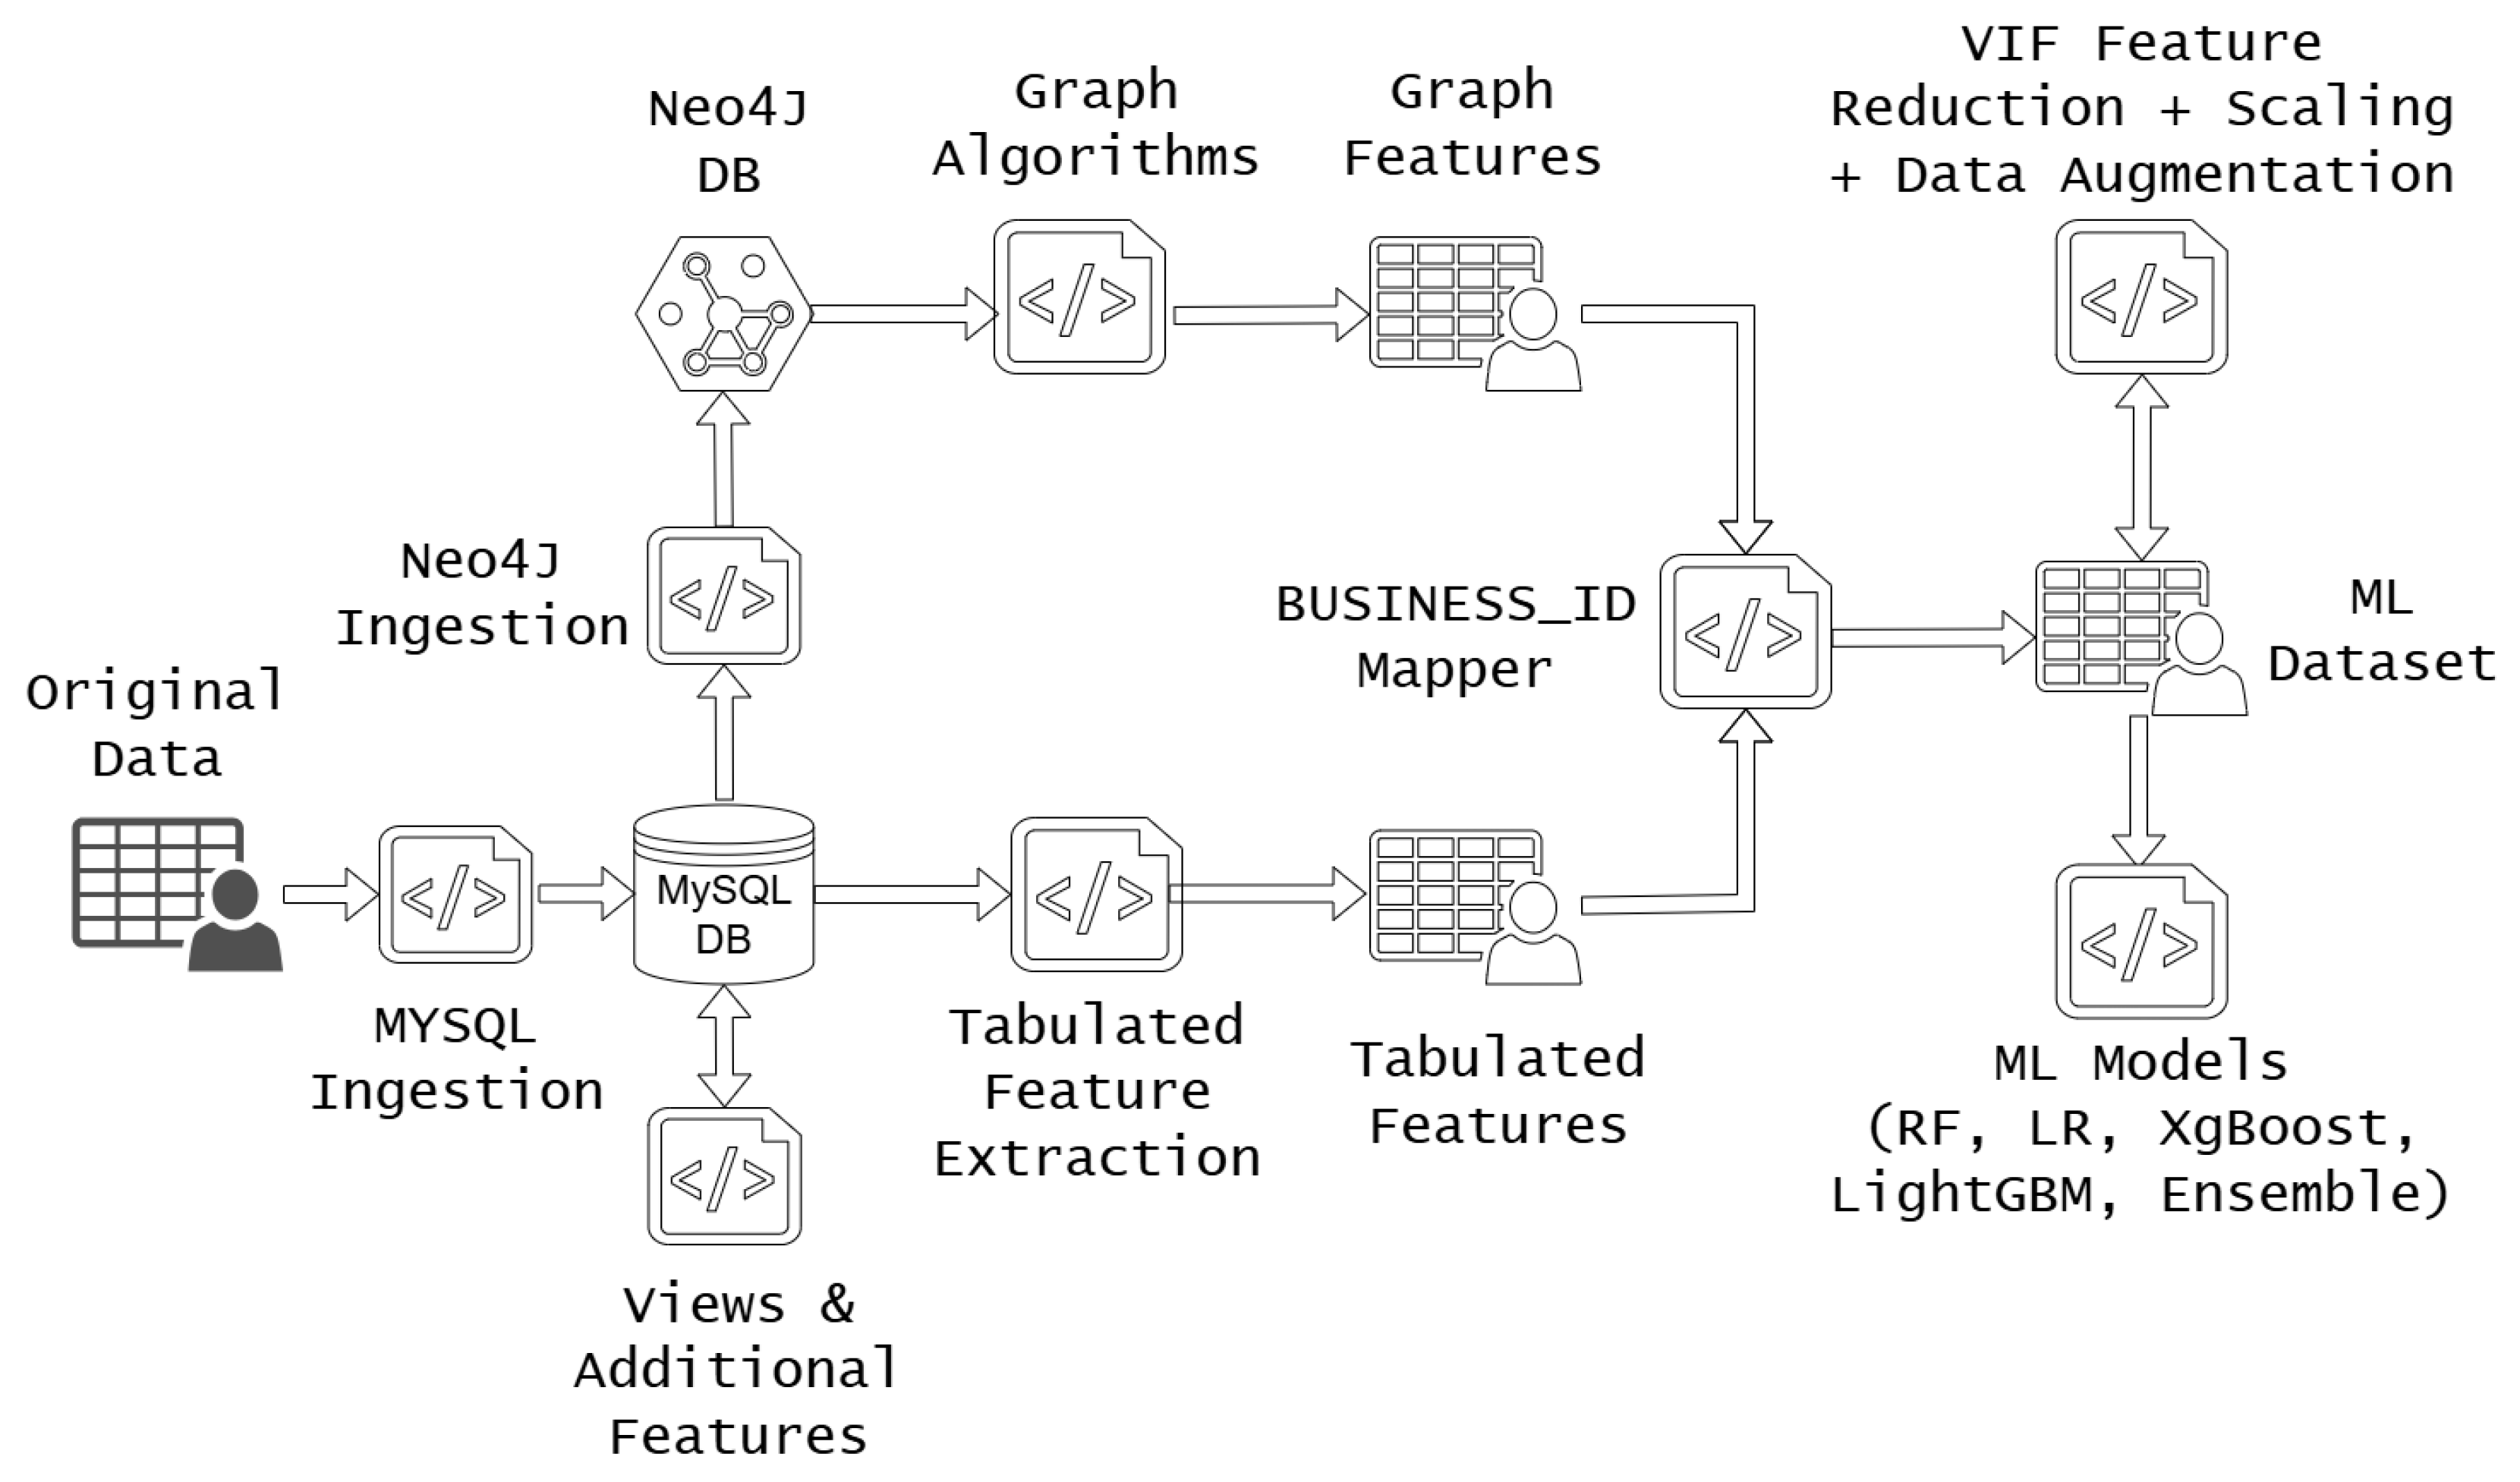
Figure 2.
Schema of Graph Database
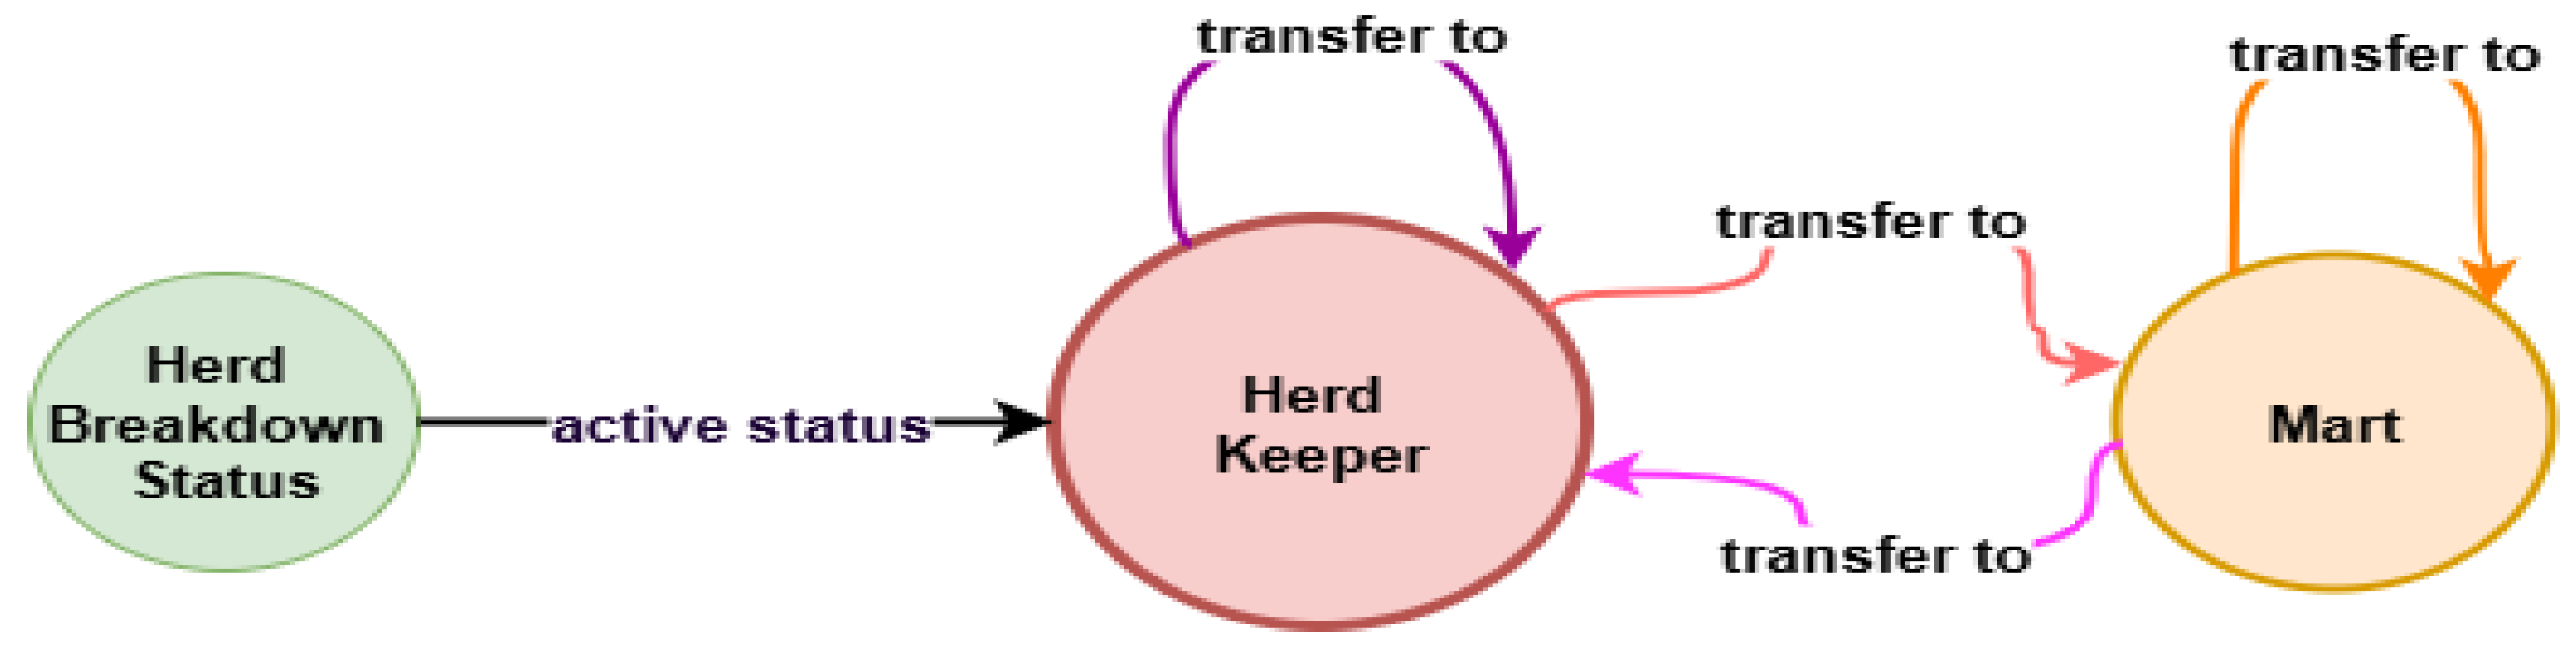
Figure 3.
Part of the Network in 2022
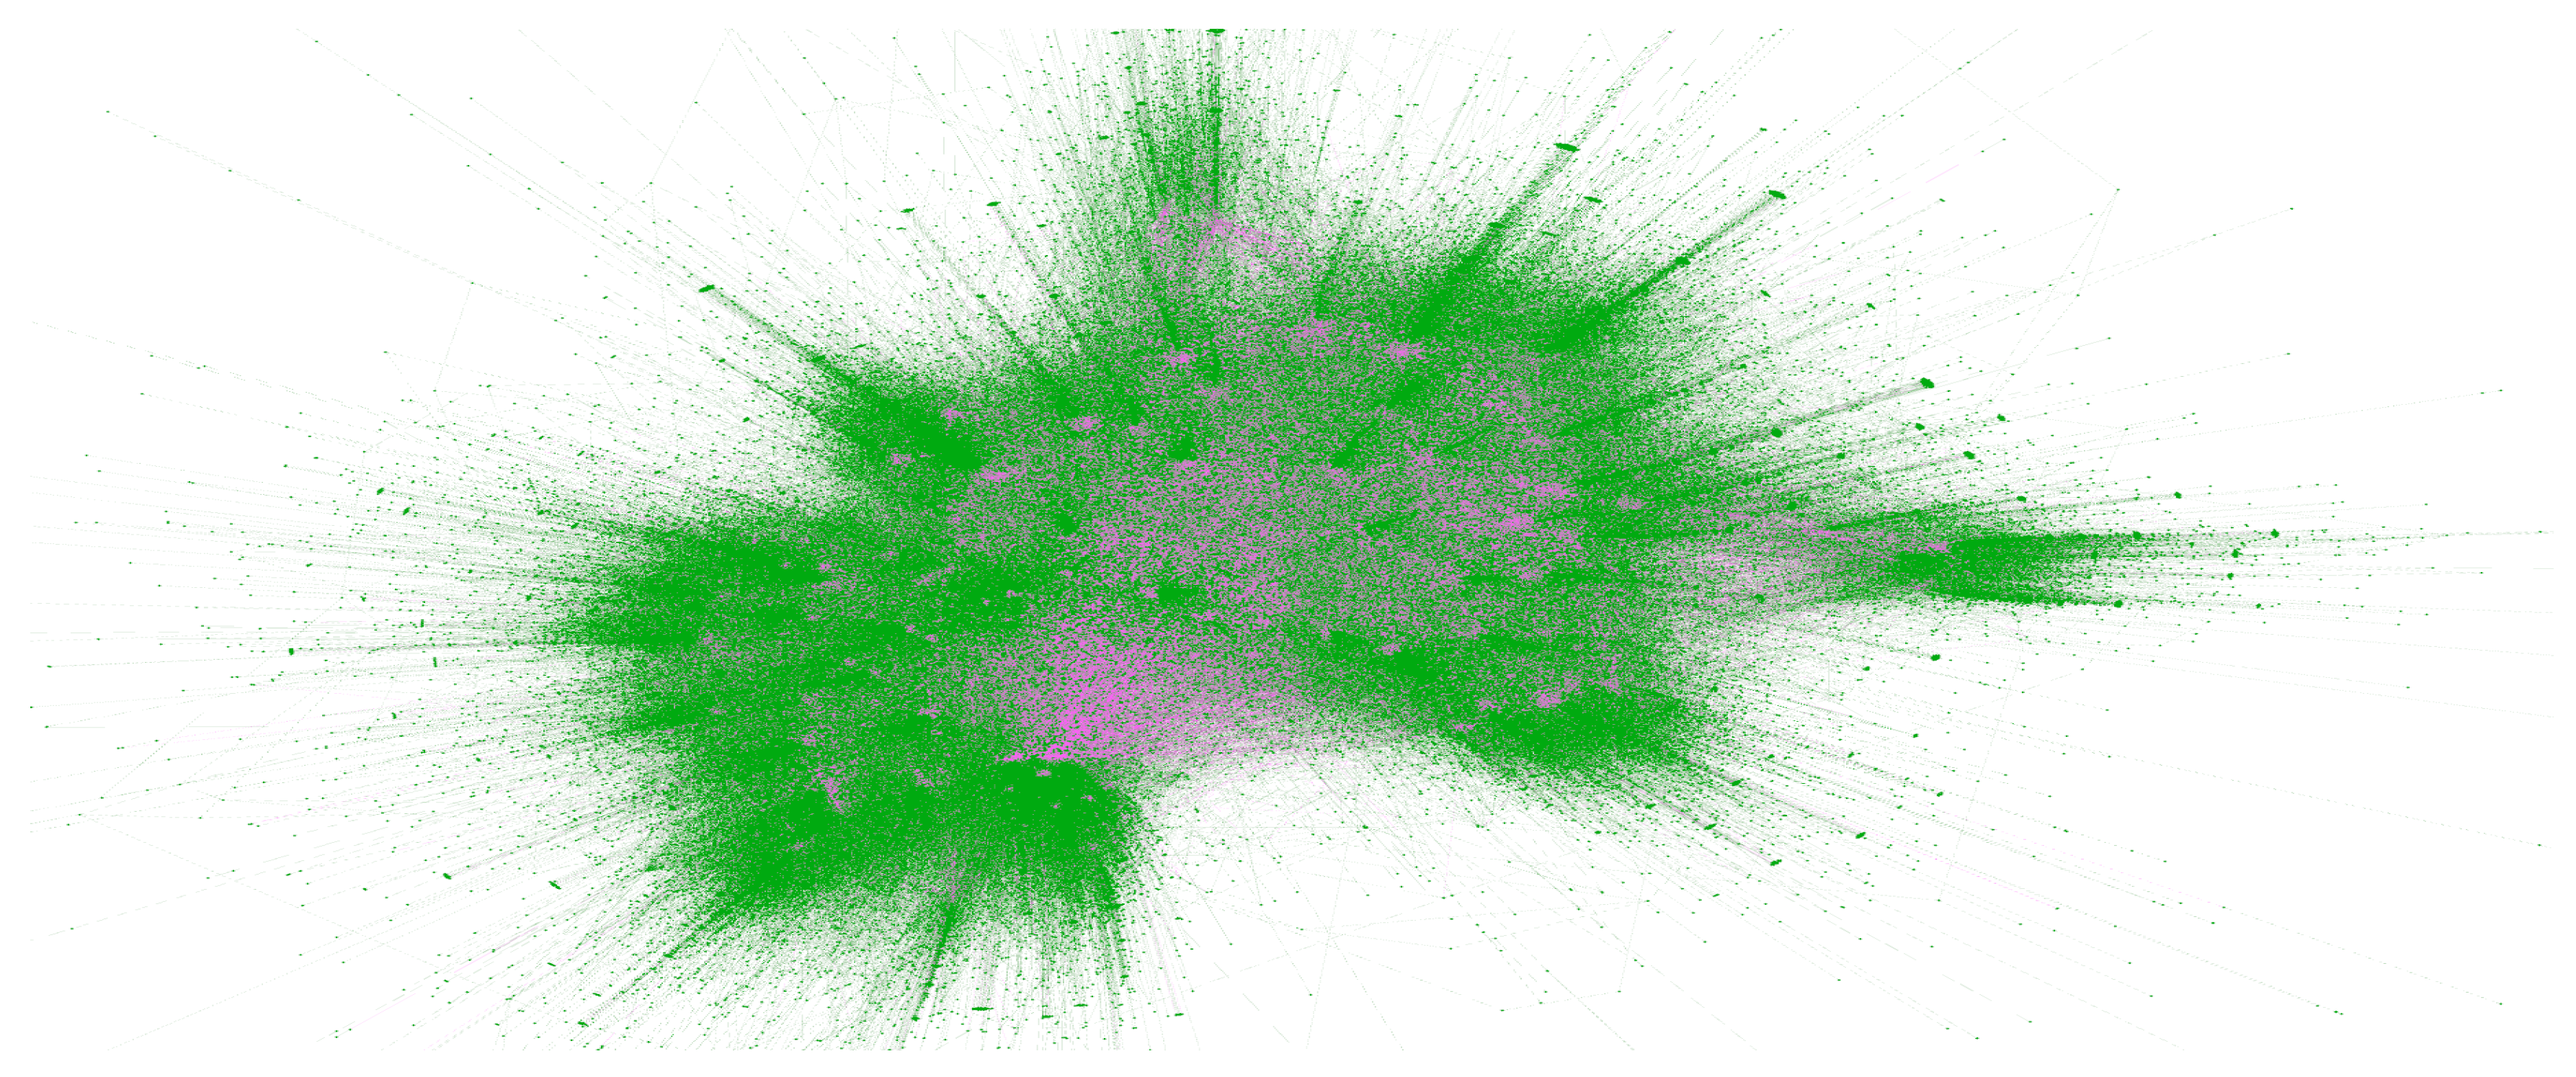
Figure 4.
Cross-Validation and Test Set ROC-AUC Curves for the RF–RUS model
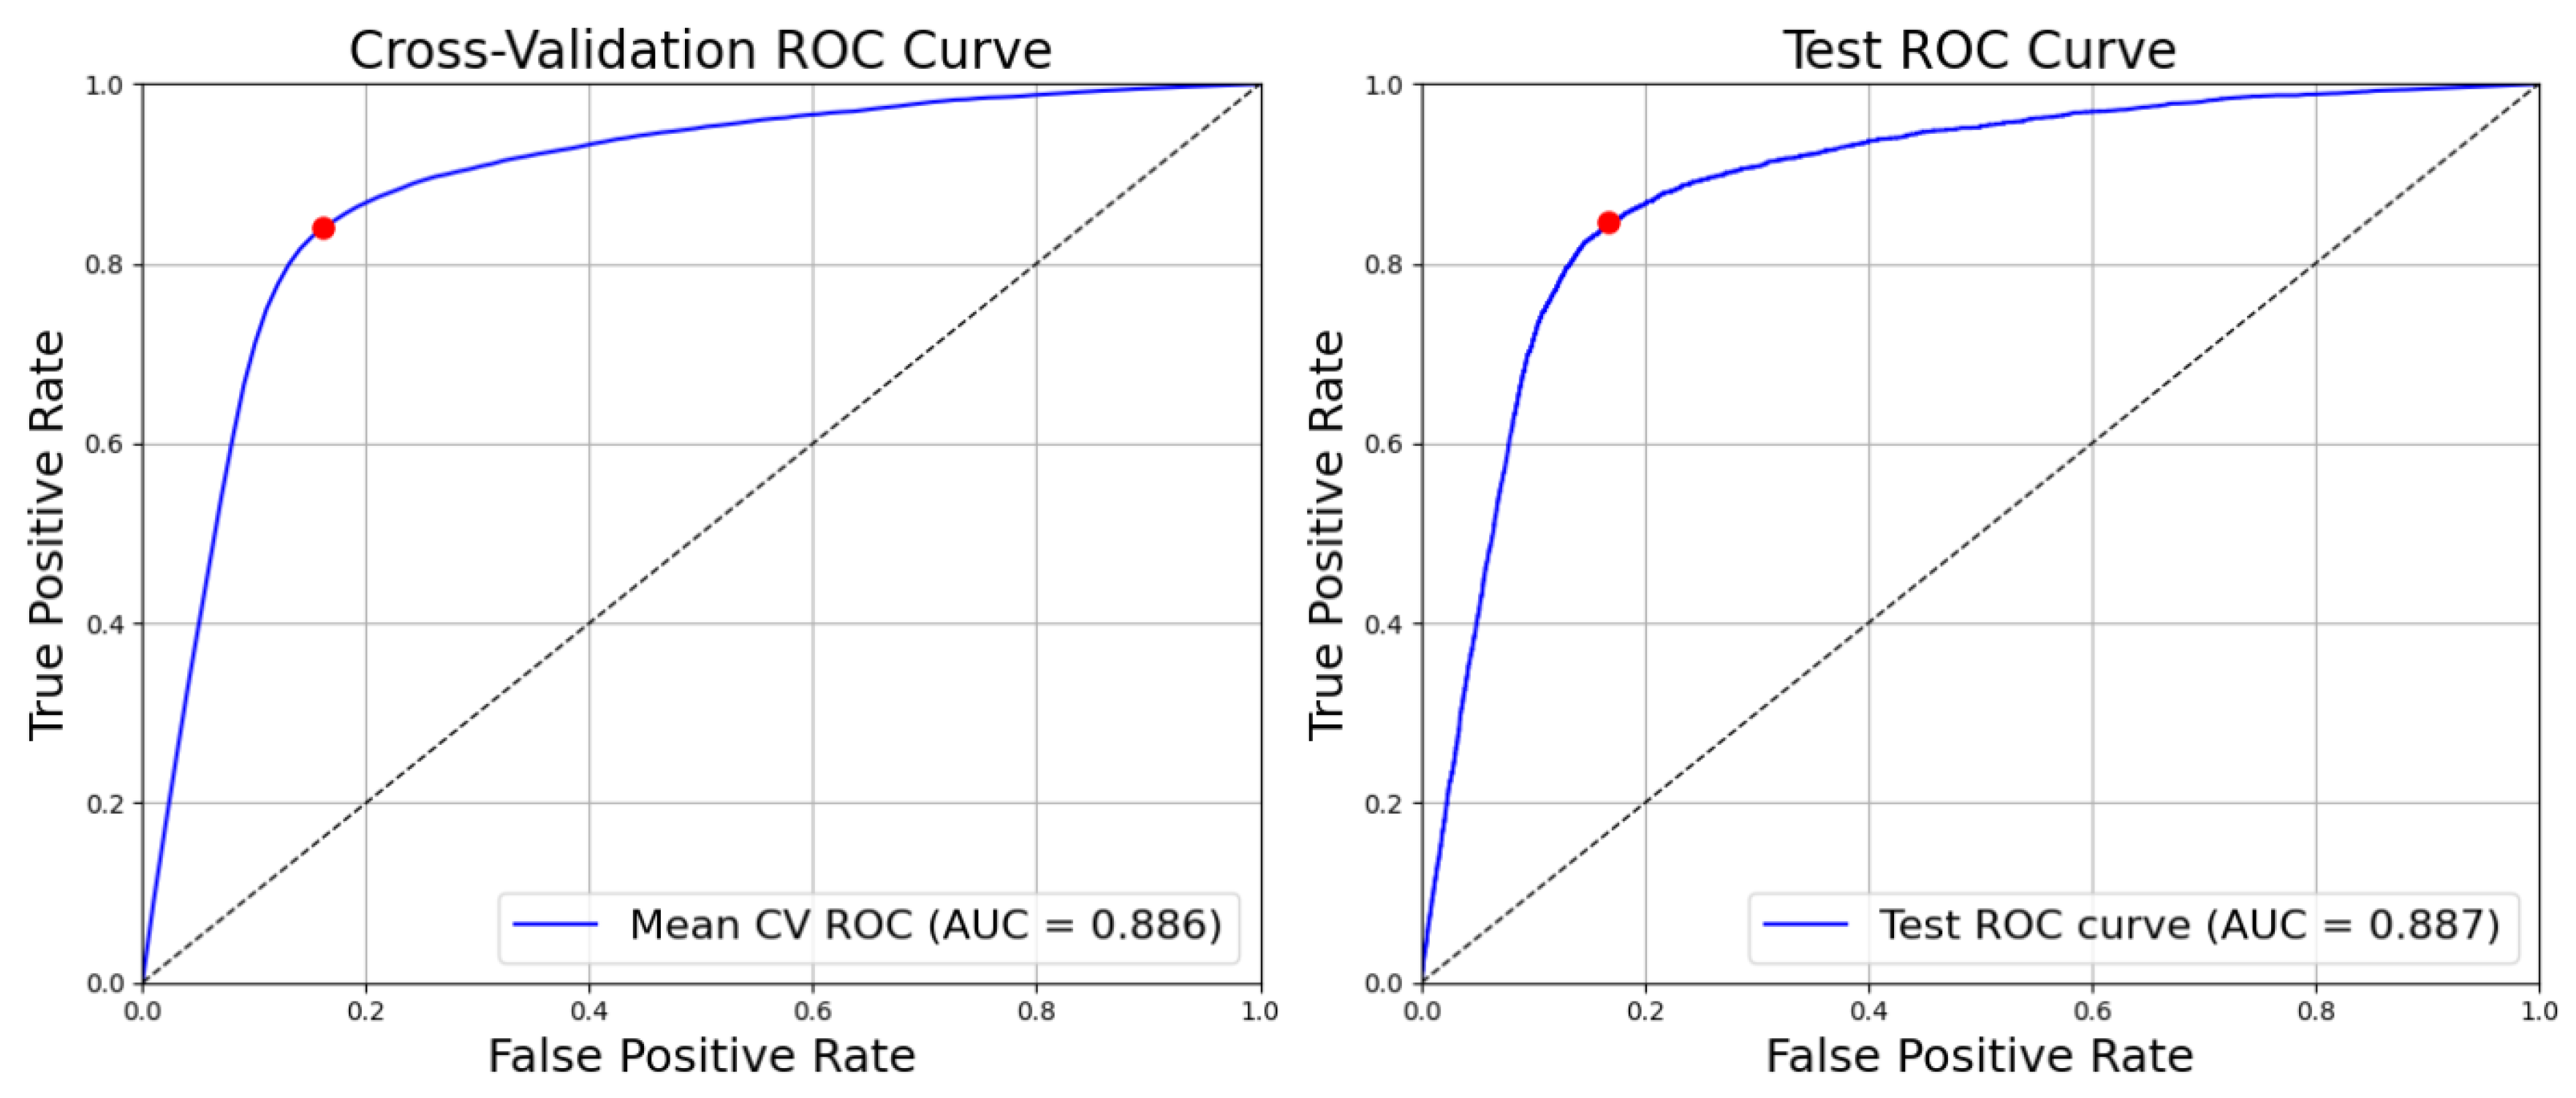
Figure 5.
Top 20 Most Important Features of the RF–RUS Model
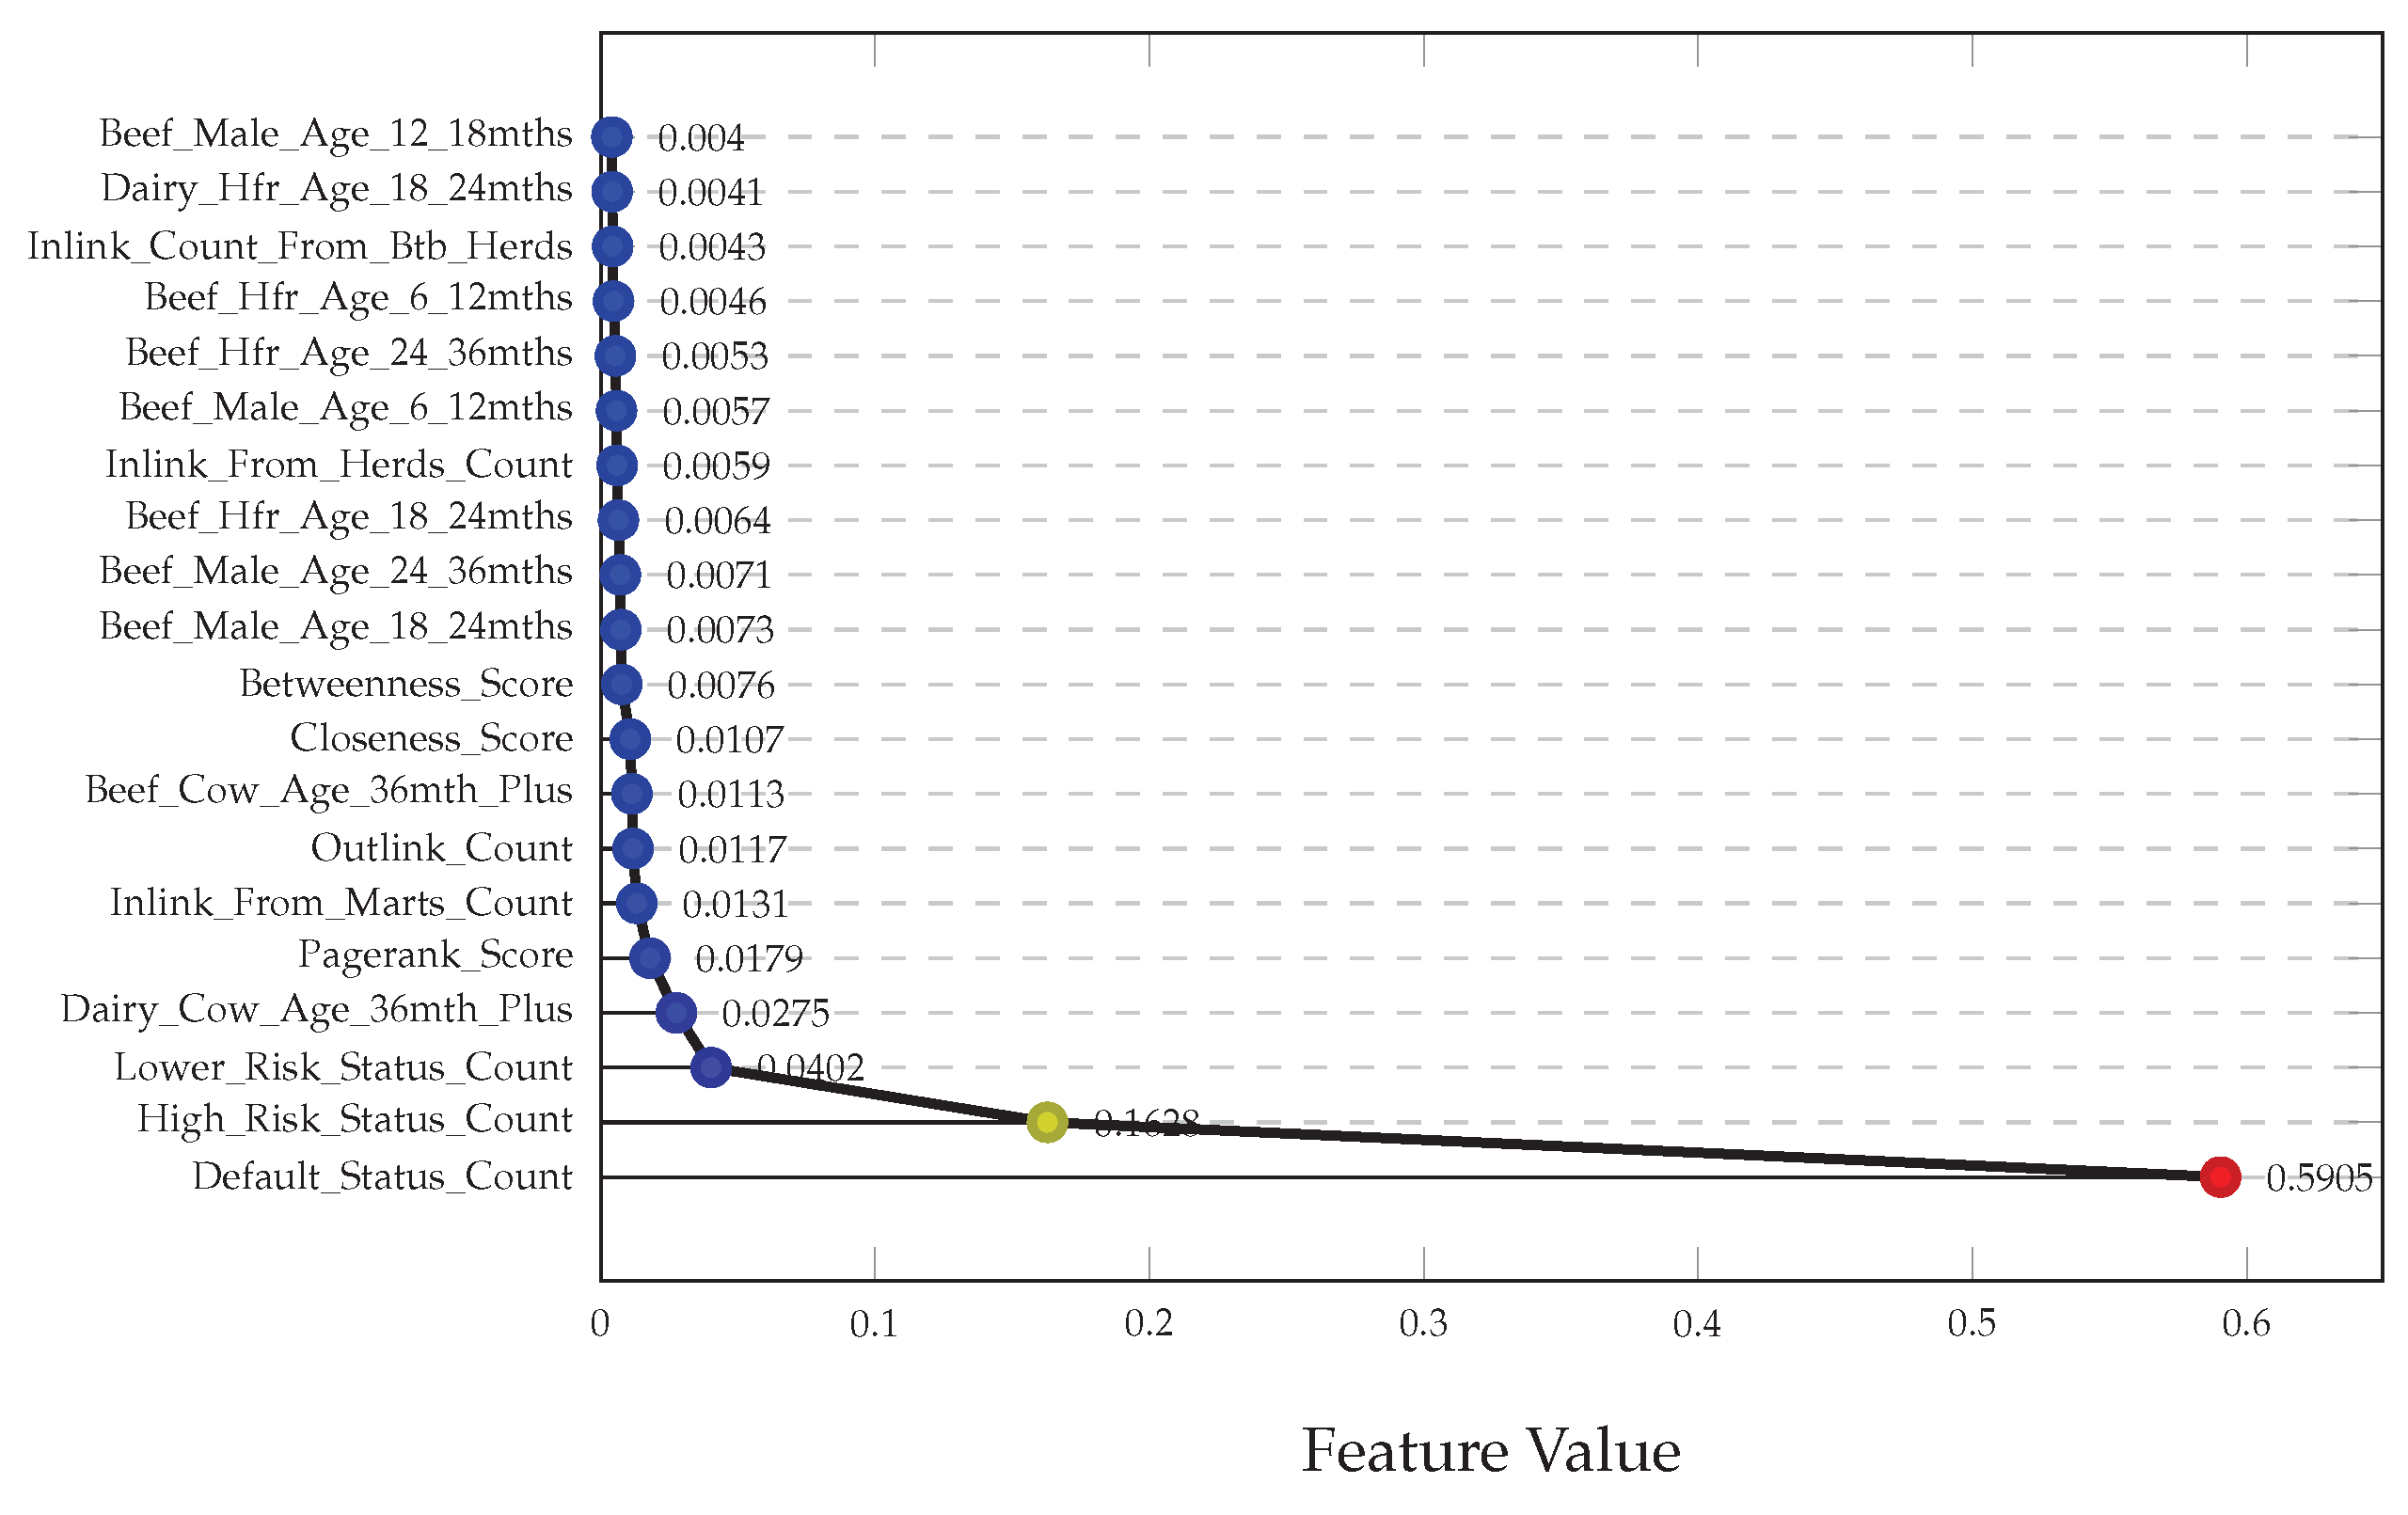

Table 1.
Model and Data Augmentation Technique Results (Best Se, Sp, and R-A per augmentation are bolded)
Table 1.
Model and Data Augmentation Technique Results (Best Se, Sp, and R-A per augmentation are bolded)
| Data Augmentation | Original | ROS | RUS | SMOTE | ||||||||
| ML Method | Se | Sp | R-A | Se | Sp | R-A | Se | Sp | R-A | Se | Sp | R-A |
| Logistic Regression | 0.78 | 0.85 | 0.85 | 0.78 | 0.85 | 0.85 | 0.85 | 0.78 | 0.85 | 0.74 | 0.87 | 0.84 |
| Random Forest | 0.02 | 1.00 | 0.88 | 0.82 | 0.85 | 0.88 | 0.83 | 0.85 | 0.89 | 0.72 | 0.89 | 0.87 |
| XGBoost | 0.02 | 1.00 | 0.89 | 0.22 | 0.97 | 0.84 | 0.83 | 0.85 | 0.88 | 0.78 | 0.87 | 0.88 |
| LightGBM | 0.75 | 0.89 | 0.89 | 0.20 | 0.83 | 0.89 | 0.84 | 0.84 | 0.89 | 0.83 | 0.83 | 0.88 |
| Soft Voting Ensemble | 0.34 | 0.96 | 0.89 | 0.87 | 0.79 | 0.89 | 0.84 | 0.84 | 0.89 | 0.79 | 0.87 | 0.89 |
Disclaimer/Publisher’s Note: The statements, opinions and data contained in all publications are solely those of the individual author(s) and contributor(s) and not of MDPI and/or the editor(s). MDPI and/or the editor(s) disclaim responsibility for any injury to people or property resulting from any ideas, methods, instructions or products referred to in the content. |
© 2025 by the authors. Licensee MDPI, Basel, Switzerland. This article is an open access article distributed under the terms and conditions of the Creative Commons Attribution (CC BY) license (http://creativecommons.org/licenses/by/4.0/).
Copyright: This open access article is published under a Creative Commons CC BY 4.0 license, which permit the free download, distribution, and reuse, provided that the author and preprint are cited in any reuse.


