
Submitted:
28 November 2025
Posted:
01 December 2025
You are already at the latest version
Abstract
Objectives: Respiratory Syncytial Virus (RSV) is a leading cause of hospitalization for acute lower respiratory tract infections (ALRIs) in children, with bacterial coinfection complicating diagnosis and often driving antibiotic overuse. This study aimed to develop and validate a clinical prediction model using common laboratory biomarkers to enable early, accurate identification of clinically significant bacterial coinfection in children with RSV infection. Methods: A single-center, retrospective cohort study was conducted at Fujian Children’s Hospital, enrolling 518 hospitalized children with tNGS-confirmed RSV infection. Patients were randomly divided into a training set (n=363) and a test set (n=155) at a 7:3 ratio. The primary outcome, bacterial coinfection, was defined by a composite reference standard integrating etiological evidence from tNGS with clinical, inflammatory, and imaging data, and adjudicated by a blinded expert panel. LASSO regression identified independent predictors, followed by multivariable logistic regression modeling. Model performance was assessed via discrimination (AUC), calibration (Hosmer-Lemeshow test), and clinical utility (Decision Curve Analysis) in both sets. Results: Neutrophil-to-Lymphocyte Ratio (NLR), C-Reactive Protein (CRP), and Serum Amyloid A (SAA) were selected as predictors. The model achieved an AUC of 0.832 (95% CI: 0.788–0.875) in the training set and 0.811 (95% CI: 0.737–0.885) in the test set, with well-calibrated predictions (P > 0.05). Decision Curve Analysis demonstrated net clinical benefit across 10%–80% threshold probabilities. A nomogram was developed for practical application. Conclusions: This study established a model integrating NLR, CRP, and SAA. It offers a reliable tool for the early detection of bacterial coinfection in RSV-infected children, enabling targeted antibiotic stewardship and improving clinical outcomes.
Keywords:
respiratory syncytial virus
; bacterial coinfection
; prediction model
; neutrophil-to-lymphocyte ratio
; C-reactive protein
; serum amyloid A
; nomogram
1. Introduction
Respiratory Syncytial Virus (RSV) remains a leading cause of acute lower respiratory tract infections (ALRIs) in infants and young children, imposing a substantial global health burden [1]. A key challenge in managing RSV infections is the early detection of bacterial coinfection, which exacerbates disease severity and drives antibiotic overuse, particularly when clinical presentations overlap with viral pathology [2,3]. The advent of genetic testing, such as targeted next-generation sequencing (tNGS), has revolutionized etiological diagnosis by identifying pathogens with high sensitivity, yet distinguishing clinically significant bacterial coinfection from colonization remains a complex task requiring integrated laboratory approaches [4].
Traditional laboratory markers, including C-reactive protein (CRP) and white blood cell count (WBC), offer limited diagnostic precision for bacterial coinfection in RSV cases [5]. Emerging evidence suggests that novel inflammatory biomarkers, such as the neutrophil-to-lymphocyte ratio (NLR) and serum amyloid A (SAA), captured through routine laboratory testing, may enhance diagnostic accuracy by reflecting distinct immune responses [6]. However, the diagnostic potential of individual markers is constrained, highlighting the need for multivariable models that leverage laboratory data [7]. The integration of tNGS with conventional biomarkers presents a unique opportunity in laboratory medicine to develop precise diagnostic tools.
This study aimed to develop and internally validate a clinical prediction model combining NLR, CRP, and SAA, utilizing tNGS-confirmed RSV cases, to identify bacterial coinfection. We further created a nomogram to translate this model into a practical, laboratory-supported decision tool, aligning with the era of genetic testing by transforming complex laboratory data into an actionable clinical strategy to optimize antibiotic stewardship and advance pediatric precision medicine.
2. Materials and Methods
2.1. Study Design and Ethical Statement
This single-center, retrospective cohort study was conducted at Fujian Children’s Hospital. The study protocol was approved by the Ethics Committee of Fujian Children’s Hospital (Approval No.: 2025ETKLRK10017) and adhered to the Declaration of Helsinki. Individual informed consent was waived due to the retrospective nature and use of anonymized data.
2.2. Study Population
We planned to screen all children aged 28 days to 14 years who were hospitalized with a primary diagnosis of RSV infection between January 2022 and August 2025. The diagnosis of RSV infection was to be confirmed via tNGS of respiratory specimens. Exclusion criteria were predefined as: (1) the presence of severe underlying conditions that could confound the assessment of infection (e.g., congenital heart disease, severe immunodeficiency); (2) receipt of systemic antibiotic therapy for more than 48 hours prior to admission; and (3) records with incomplete data for key variables required for model development. Following the screening and selection process, all eligible patients were to be randomly allocated into a training set and a test set at a 7:3 ratio for the purpose of model development and internal validation.
2.3. Data Collection and Definitions
Data were extracted from the hospital’s electronic medical record (EMR) system by two independent researchers using a standardized form, with discrepancies resolved by consensus. Collected variables included: demographic data (age, sex, weight), clinical outcomes (hospital stay length, severity, ICU admission, mechanical ventilation), imaging findings (chest X-ray/CT: increased markings, consolidation, infiltrates, pleural effusion), and laboratory parameters (first 24-hour results: WBC, platelet count, neutrophil/lymphocyte counts, CRP, procalcitonin, SAA, ferritin, LDH, albumin, ALT, AST, D-dimer). Derived indices included NLR (neutrophil/lymphocyte ratio) and PLR (platelet/lymphocyte ratio). RSV subtyping (A/B) was determined via tNGS.
2.4. Targeted Next-Generation Sequencing (tNGS) and Pathogen Identification
Nasopharyngeal swab or bronchoalveolar lavage fluid specimens were collected from patients, typically within 24 hours of admission, and transported to certified third-party clinical laboratories for analysis. Pathogen identification was performed using commercial multiplex PCR-based tNGS assays from either Dian Diagnostics (Hangzhou, China) or KingMed Diagnostics (Fuzhou/Hangzhou, China). Although the specific panels and proprietary bioinformatics pipelines differ slightly between the two providers, both assays are designed for the comprehensive targeted detection of over 200 respiratory pathogens (including viruses, bacteria, fungi, and mycobacteria) using high-throughput sequencing platforms. Both assays incorporate internal standards to allow for semi-quantitative estimation of pathogen load (reported as copies/mL), with a lower limit of detection of approximately 100–500 copies/mL. The bioinformatic workflow for both services included quality control, removal of human host sequences, and alignment of high-quality reads to a curated microbial reference database to identify pathogens based on validated criteria.
2.5. Outcome Definition and Adjudication
The primary outcome, clinically significant bacterial coinfection, was defined using a composite reference standard [8]. A case was classified as coinfection if targeted next-generation sequencing (tNGS) detected bacterial pathogens in respiratory specimens with a sequence read count >10,000 or an estimated concentration >10³ copies/ml, with colonization excluded based on clinical context, AND at least two of the following criteria were met: (1) clinical signs (e.g., persistent fever, worsening respiratory distress); (2) elevated inflammatory markers (e.g., procalcitonin >0.5 µg/L, CRP >20 mg/L); (3) imaging evidence (e.g., new consolidation); (4) response to targeted antibiotics. These tNGS thresholds were determined through local validation to distinguish pathogenic bacteria from colonizing flora, enhancing the precision of genetic testing in laboratory diagnostics [9]. Case adjudication was performed by two independent attending pediatricians in a blinded manner; discrepancies were resolved by a senior consultant with advanced expertise.
2.6. Statistical Analysis
The hospital dataset was randomly split into a training set (n=363) and a test set (n=155) at a 7:3 ratio using stratified sampling. Data distribution was assessed with the Shapiro-Wilk test, with normally distributed variables summarized as mean ± standard deviation and non-normally distributed variables as median (interquartile range); baseline comparisons employed Pearson’s chi-squared or Fisher’s exact tests for categorical variables, and Student’s t-test or Mann-Whitney U test for continuous variables (P<0.05), with missing data (5.2%) excluded. In the training set, Least Absolute Shrinkage and Selection Operator (LASSO) regression with 10-fold cross-validation (glmnet package in R) identified predictors of bacterial coinfection, followed by multivariable logistic regression modeling. Model performance was evaluated using the area under the receiver operating characteristic curve (AUC, 0.5-1.0), Hosmer-Lemeshow calibration test, and Decision Curve Analysis (DCA) for net benefit estimation [10,11]. All analyses were conducted with R software (version 4.2.2) and MSTATA (www.mstata.com), with a two-sided P-value <0.05 considered significant.
3. Results
3.1. Patient Enrollment and Baseline Characteristics
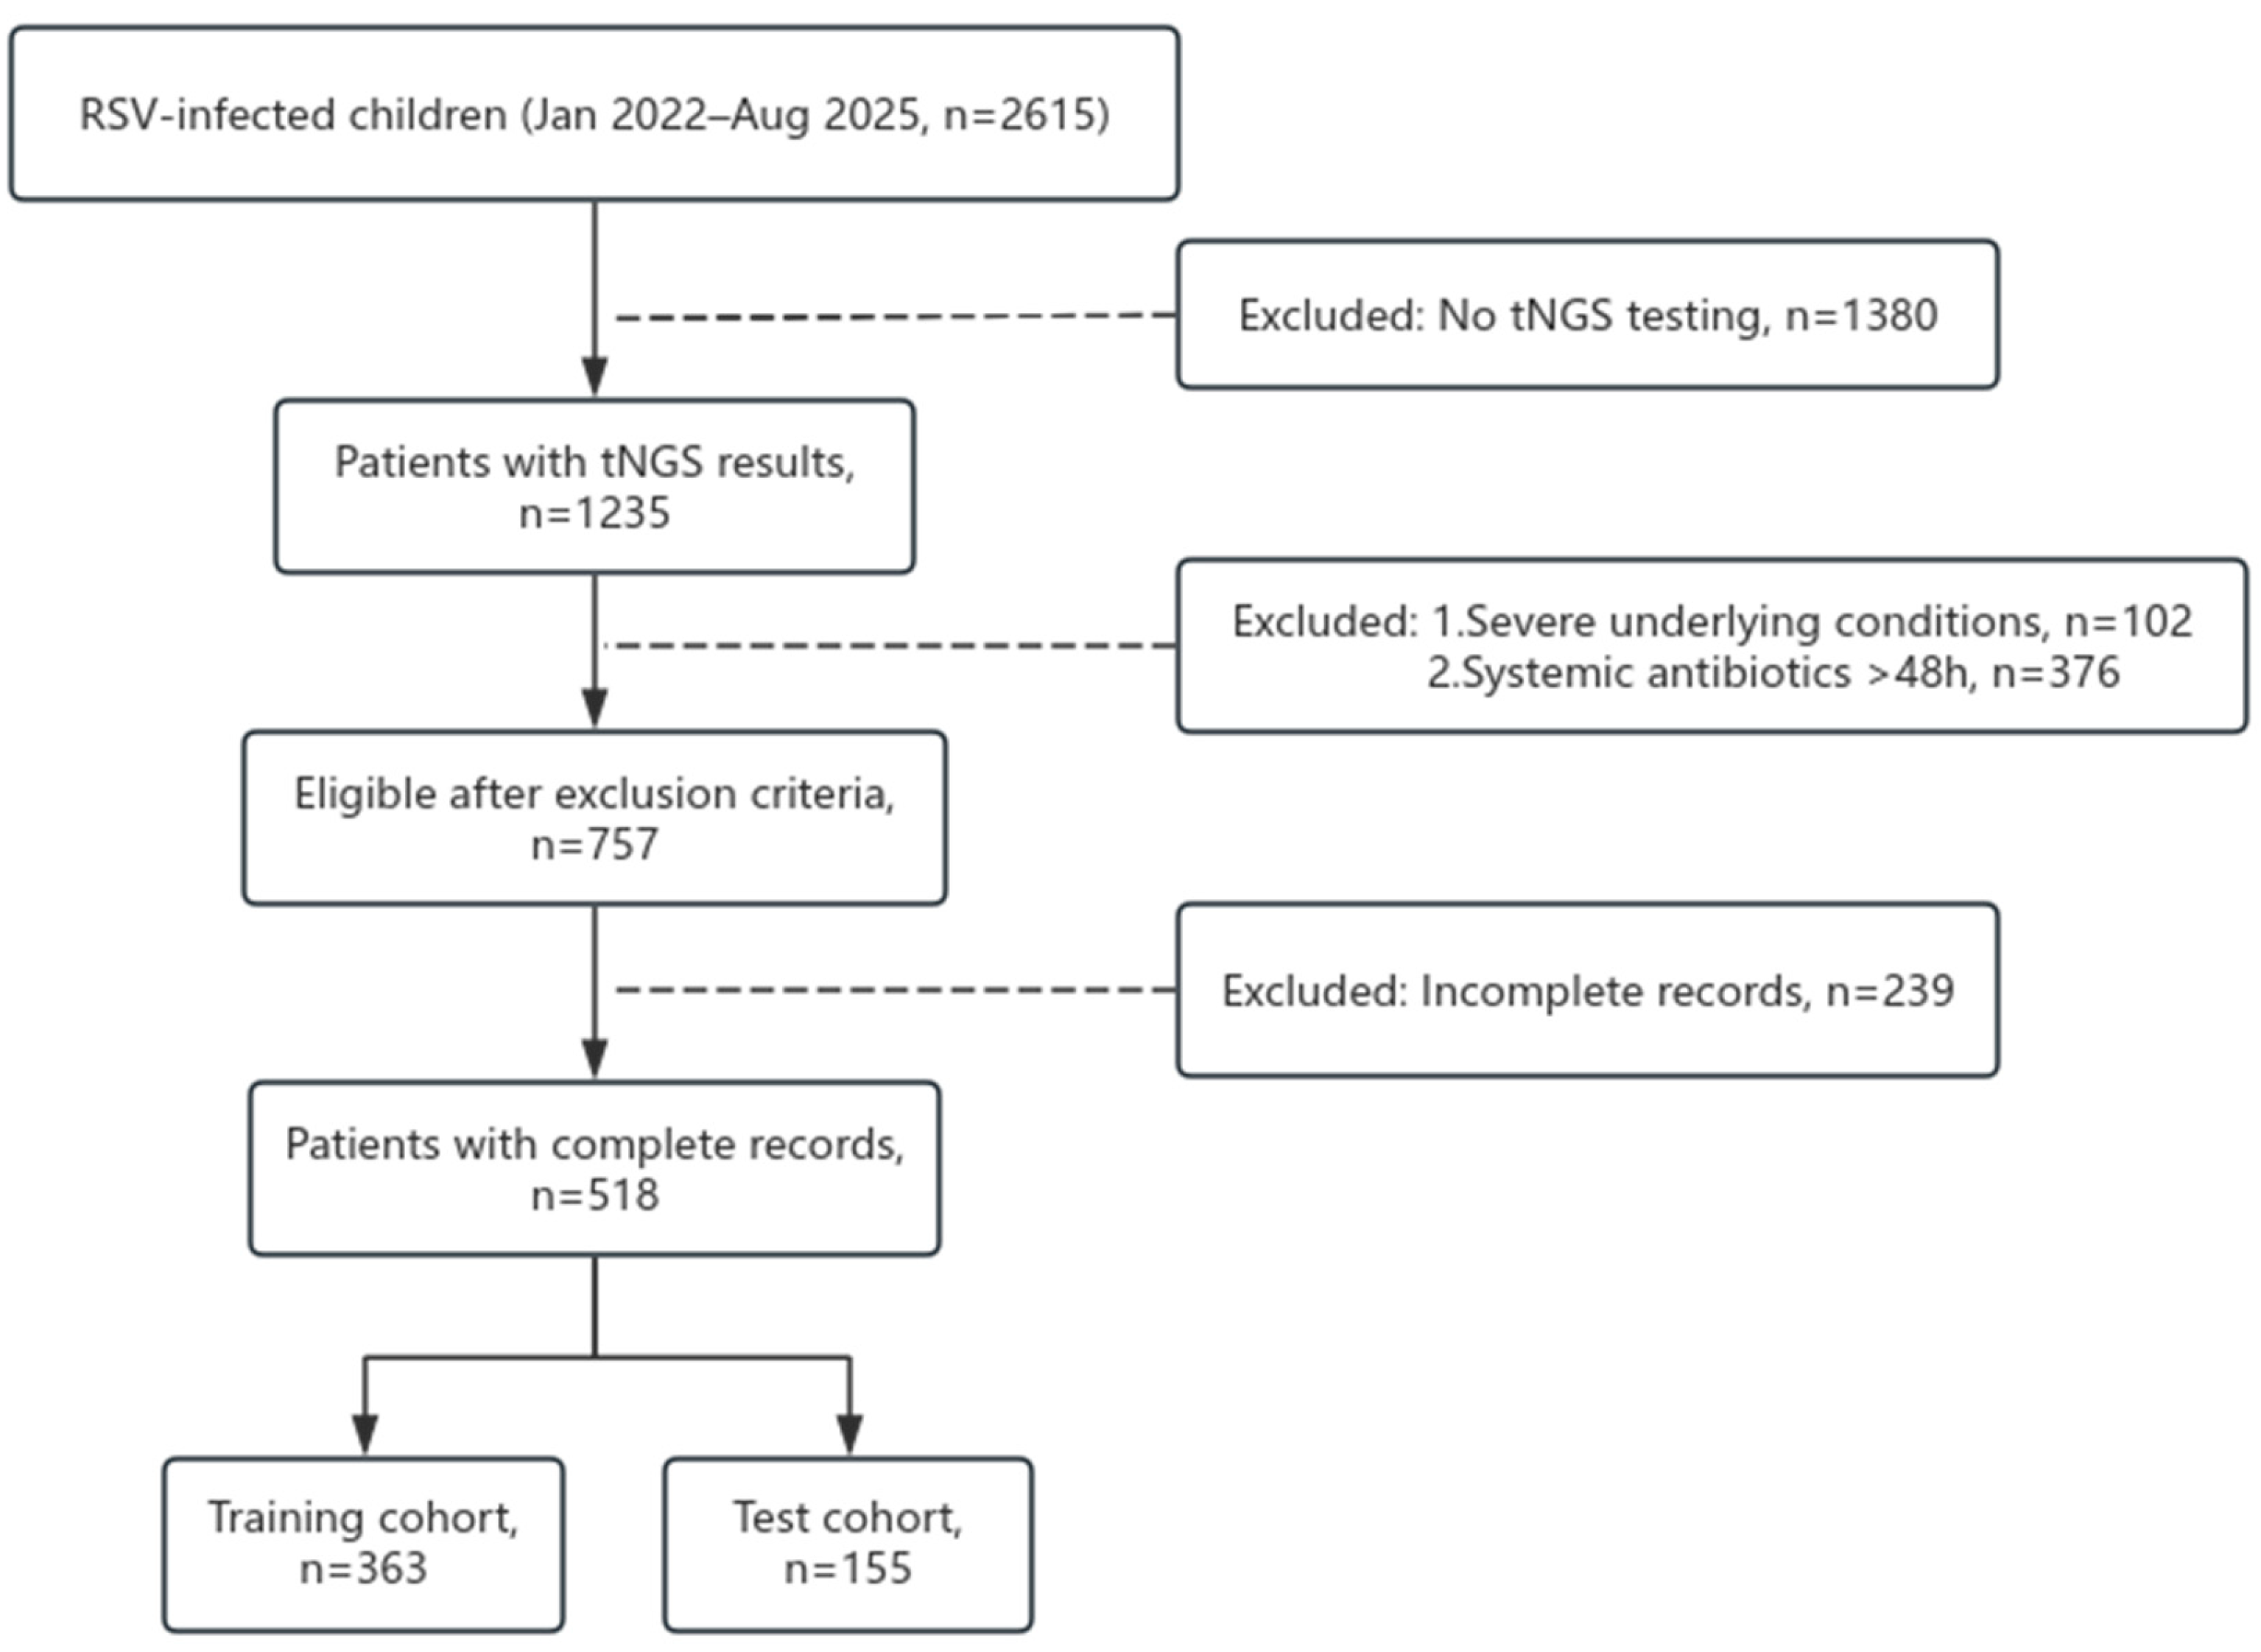
Between January 2022 and August 2025, 2615 children hospitalized with RSV infection were screened at Fujian Children’s Hospital. Of these, 1235 underwent targeted next-generation sequencing (tNGS), with 102 excluded due to severe underlying conditions (e.g., congenital heart disease), 376 due to systemic antibiotic use >48 hours pre-admission, and 239 due to incomplete records, yielding 518 eligible patients. These were randomly allocated to a training set (n=363) and a test set (n=155) at a 7:3 ratio (Figure 1). Baseline characteristics showed no significant differences between cohorts in sex (male: 57.9% vs. 60.6%, P=0.554), median age (12 vs. 12 months, P=0.271), or weight (10.7 vs. 9.9 kg, P=0.325), with laboratory and clinical features also balanced (all P>0.05, Table 1), confirming successful randomization.
Figure 1.
Flow diagram of patients enrollment for the study.
3.2. Univariate Analysis of Risk Factors for Bacterial Coinfection
In the training set (n=363), 129 patients (35.5%) were adjudicated with bacterial coinfection. Univariate analysis revealed significant differences: median age (24 vs. 12 months, P<0.001), white blood cell count (10.2 vs. 8.2×10⁹/L, P<0.001), NLR (1.64 vs. 0.54, P<0.001), PLR (103 vs. 74, P<0.001), CRP (11 vs. 3 mg/L, P<0.001), procalcitonin (0.12 vs. 0.09 µg/L, P<0.001), and SAA (52 vs. 20 mg/L, P<0.001) were higher in the coinfection group (Table 2), suggesting these markers’ potential in distinguishing infection states.
3.3. Development of the Predictive Model via LASSO Regression
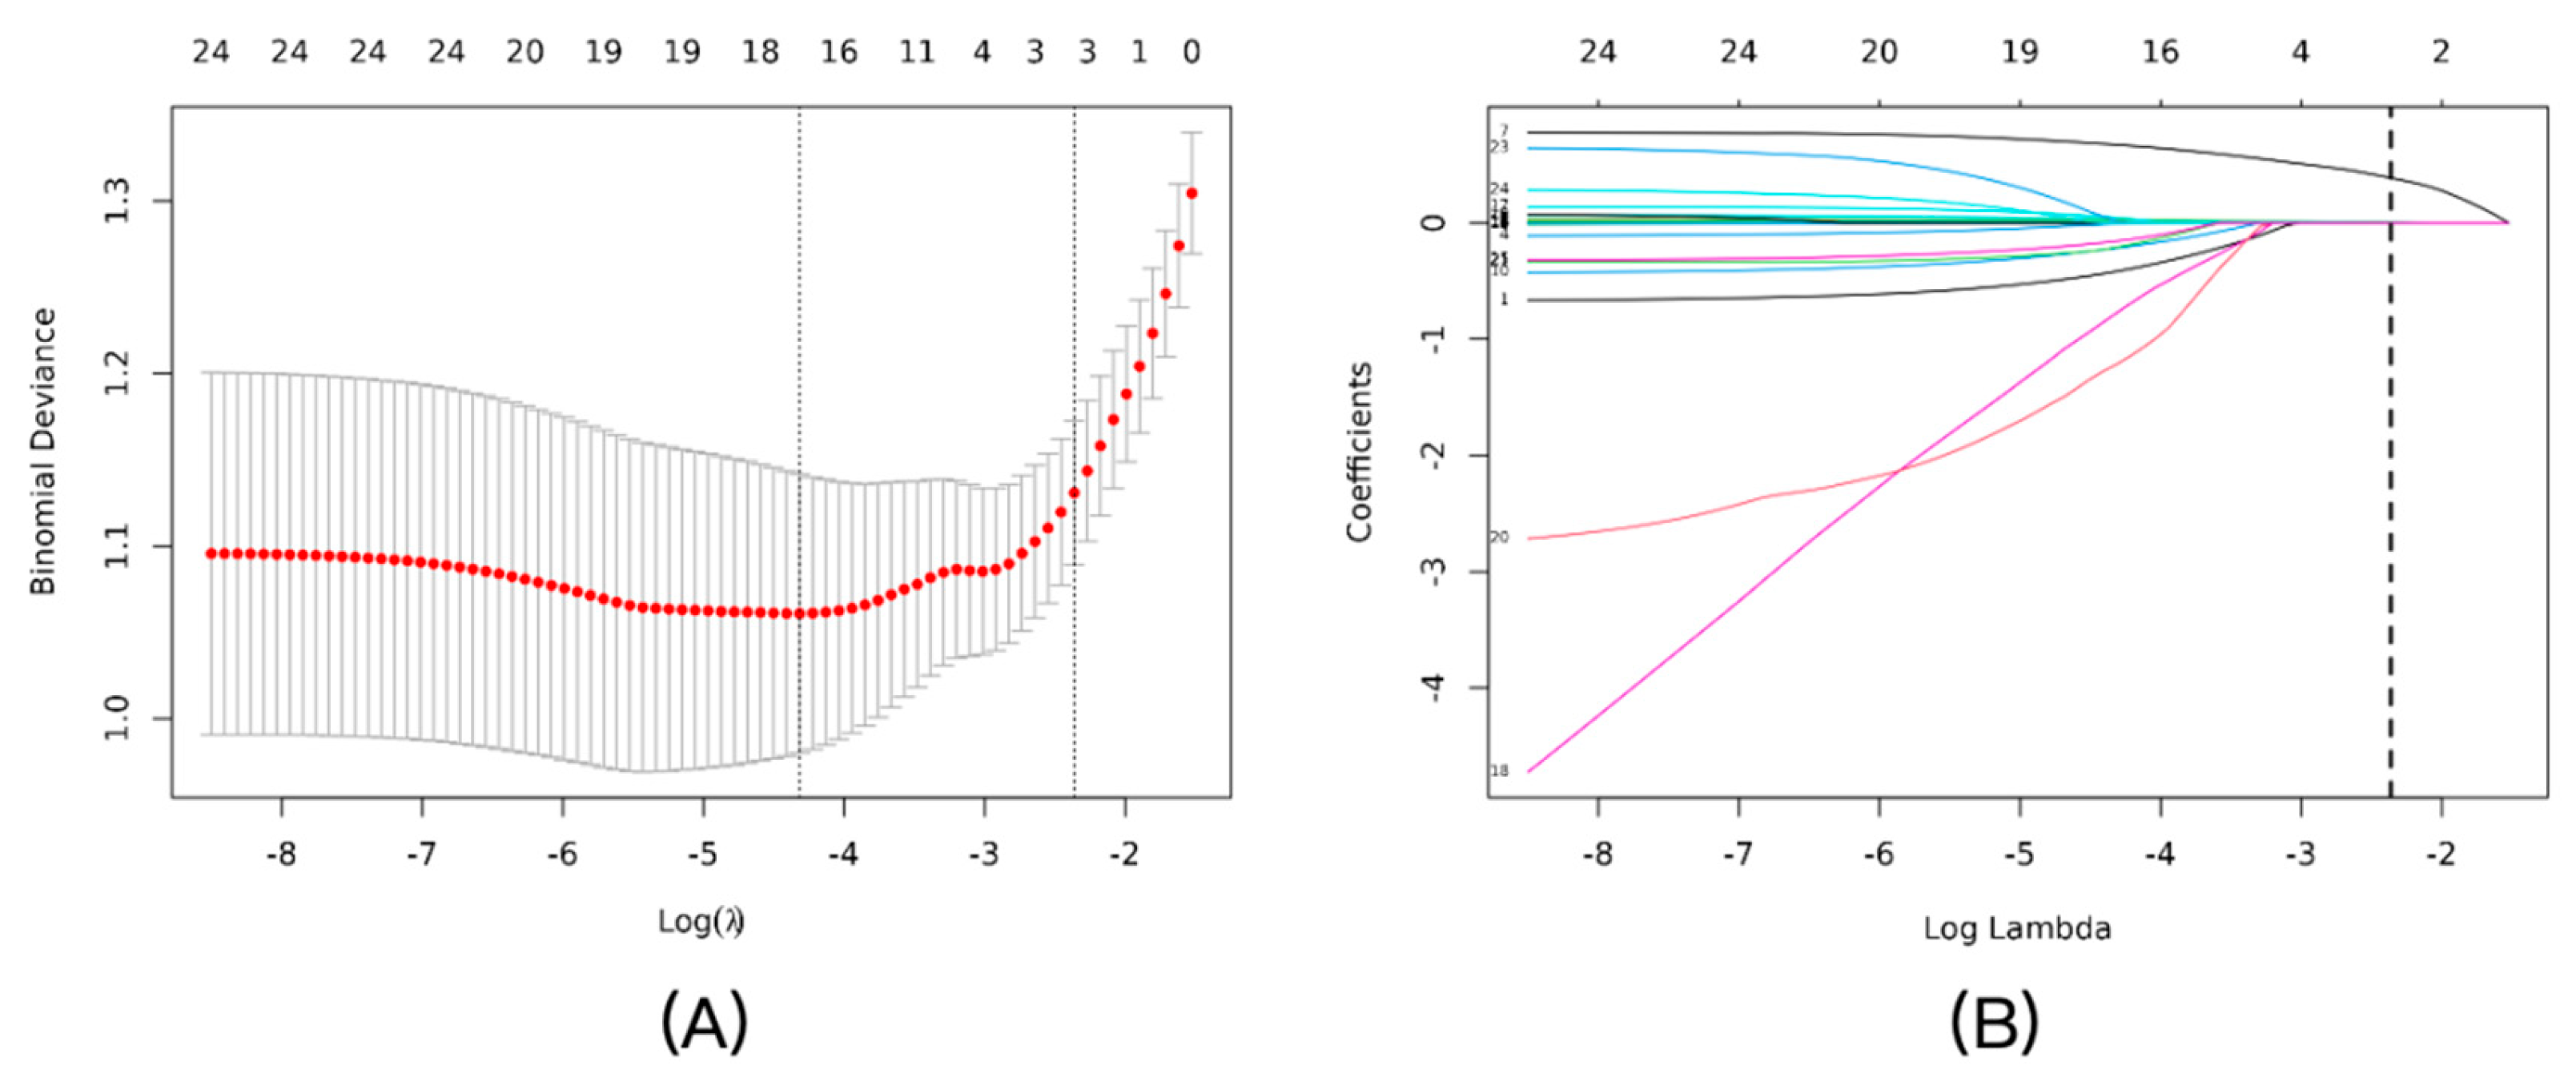
LASSO regression with 10-fold cross-validation in the training set identified NLR, CRP, and SAA as key predictors, with an optimal penalty coefficient λ=0.0943 (Figure 2A). The coefficient profile plot showed variable shrinkage, retaining these three markers (Figure 2B). Multivariable logistic regression confirmed their independence: NLR (OR=2.13, 95% CI: 1.64–2.79, P<0.001), CRP (OR=1.03, 95% CI: 1.01–1.06, P=0.017), and SAA (OR=1.01, 95% CI: 1.00–1.01, P=0.007) (Table 3).
Figure 2.
Feature selection using the LASSO logistic regression model. (A) Tuning parameter (λ) selection in the LASSO model using 10-fold cross-validation. The binomial deviance was plotted versus log(λ). The vertical dotted lines indicate the optimal λ value (λ_min, left line) that results in the minimum mean cross-validated error, and the λ_1se value (right line) that corresponds to the most regularized model within one standard error of the minimum. We chose λ_1se to build the most parsimonious model. (B) LASSO coefficient profiles of the candidate predictors. A vertical line is drawn at the optimal λ value selected by the cross-validation process, where three features remained with non-zero coefficients.
3.4. Nomogram for Clinical Application
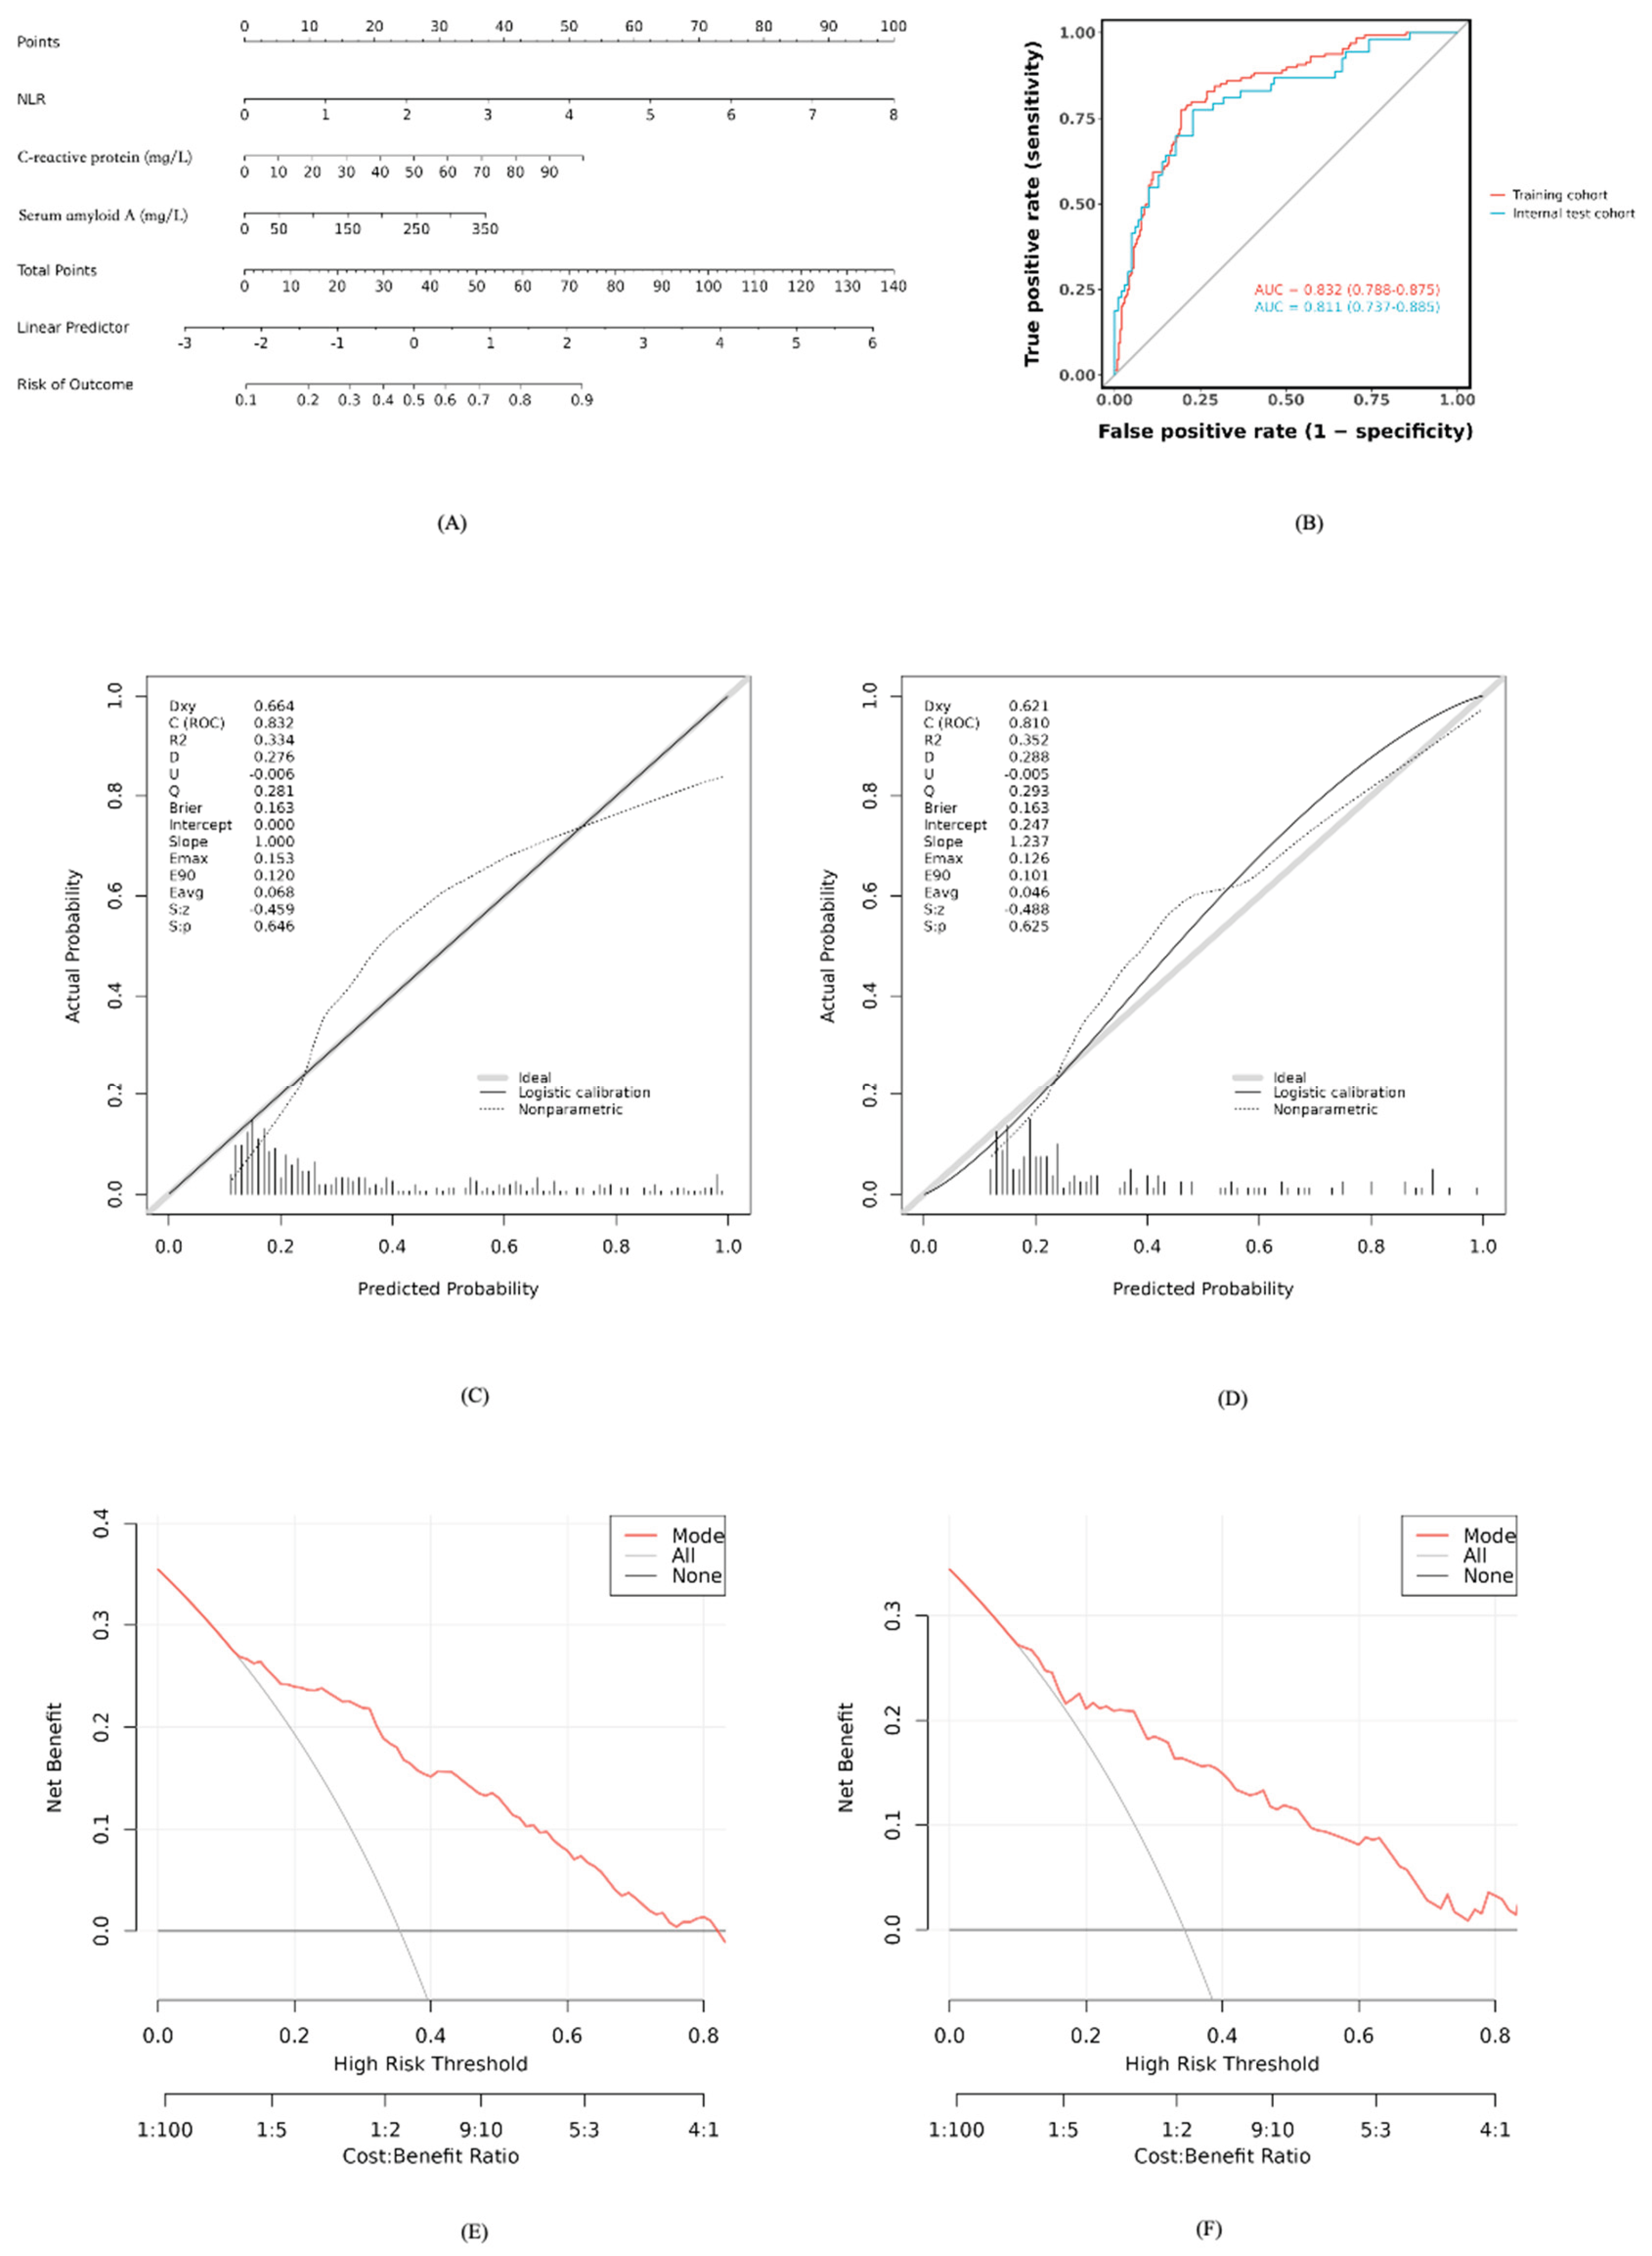
Based on the developed model, a nomogram was constructed to estimate bacterial coinfection probability, integrating NLR, CRP, and SAA values. Clinicians can sum points from each variable’s axis and project the total onto a risk scale for rapid assessment (Figure 3A).
3.5. Performance and Validation of the Predictive Model
The model’s discriminative ability was strong, with an AUC of 0.832 (95% CI: 0.788–0.875) in the training set and 0.811 (95% CI: 0.737–0.885) in the test set (Figure 3B). Calibration curves showed good agreement between predicted and observed probabilities (Hosmer-Lemeshow P>0.05, Figure 3C-D). Decision Curve Analysis indicated net clinical benefit across 10%–80% threshold probabilities (Figure 3E-F), supporting practical utility.
Figure 3.
Development and performance of the nomogram for predicting bacterial coinfection. (A) The nomogram developed based on the three independent predictors (NLR, CRP, and SAA) in the training cohort. (B) Receiver operating characteristic (ROC) curves of the nomogram in the training and test cohorts. (C) Calibration curve of the nomogram in the training cohort. The y-axis represents the actual observed probability, and the x-axis represents the predicted probability. The diagonal dotted line represents a perfect prediction. (D) Calibration curve of the nomogram in the test cohort. (E) Decision curve analysis (DCA) for the nomogram in the training cohort. The y-axis measures the net benefit. The red solid line represents the nomogram. The thin gray line represents the “treat-all” strategy, and the black horizontal line represents the “treat-none” strategy. (F) Decision curve analysis (DCA) for the nomogram in the test cohort.
3.6. Pathogen Distribution of Bacterial Coinfections
Among 129 patients with bacterial coinfection, tNGS identified Haemophilus influenzae (98 cases, 18.92%), Streptococcus pneumoniae (65 cases, 12.55%), Moraxella catarrhalis (28 cases, 5.41%), Bordetella pertussis (12 cases, 2.32%), Staphylococcus aureus (10 cases, 1.93%), and Klebsiella pneumoniae (9 cases, 1.74%) as predominant pathogens (Table 4).
4. Discussion
In this study, we successfully developed and validated a clinical prediction model that integrates the neutrophil-to-lymphocyte ratio (NLR), C-reactive protein (CRP), and serum amyloid A (SAA) for the early identification of clinically significant bacterial coinfection in children hospitalized with RSV infection. The model demonstrated not only excellent discrimination (AUC > 0.8) and good calibration in internal validation but, more importantly, its practical utility was confirmed by decision curve analysis across a wide range of clinical thresholds. To our knowledge, this is one of the first studies to integrate these three common inflammatory markers for this specific clinical scenario, providing a novel, evidence-based tool to address a persistent diagnostic challenge and promote precision antibiotic stewardship in pediatrics.
Our multivariable analysis revealed that NLR, CRP, and SAA were all independent predictors of bacterial coinfection in children with RSV-ALRI. As a marker of systemic inflammation, an elevated NLR reflects an immune status characterized by neutrophil activation and lymphocyte suppression, which is closely associated with the host’s stress response during bacterial infection [12,13]. The odds ratio for NLR in our study was 2.13 (95% CI: 1.64–2.79), indicating that for each unit increase in NLR, the risk of bacterial coinfection approximately doubles. This finding is consistent with numerous studies in sepsis and intra-abdominal infections, where NLR has been proven to be a crucial indicator for predicting infection severity and prognosis [14]. As an acute-phase protein, CRP levels rise significantly during bacterial infections; although the OR in our study was modest at 1.03 (95% CI: 1.01–1.06), its dynamic changes should not be overlooked as an indicator of bacterial infection [15]. SAA, another sensitive inflammatory marker, had an OR of 1.01 (95% CI: 1.00–1.01), further supporting its value in differentiating viral from bacterial infections. The combined application of these inflammatory markers, integrated through a multivariable model, significantly improves the predictive accuracy for bacterial coinfection, overcoming the limitations of any single marker.
Compared to existing literature, the significant innovation of our study lies in its methodological rigor and specific clinical focus. First, regarding outcome definition, we directly confronted the core challenge of the tNGS era: how to distinguish “pathogen” from “colonizer.” We did not simplistically use a positive tNGS result as the gold standard. Instead, we pioneered a composite reference standard encompassing etiological, clinical, inflammatory, and imaging evidence, adjudicated through a blinded expert panel process [16]. This approach minimizes misclassification bias of the outcome event, ensuring that our model predicts a “clinically significant” infection that truly warrants intervention, rather than asymptomatic carriage. This greatly enhances the clinical relevance of our findings. Second, in terms of statistical strategy, the application of LASSO regression not only resolved the issues of subjectivity and collinearity in traditional multivariable analysis but also constructed a data-driven, parsimonious model with only three core predictors [17]. This simplicity is key to the model’s potential for clinical translation, as it is easy to remember, calculate, and implement.
This study also provides important local microbiological evidence for clinical practice. We found that Haemophilus influenzae and Streptococcus pneumoniae are the predominant pathogens in children with RSV and bacterial coinfection. This finding is consistent with the pathogen spectrum of community-acquired pneumonia in children in many regions, but clarifying their leading role in the context of RSV infection provides more precise guidance for empirical antibiotic selection [18,19]. For example, while awaiting etiological results, choosing an antibiotic that effectively covers these two pathogens (e.g., amoxicillin-clavulanate or a second/third-generation cephalosporin) would be a more evidence-based decision for RSV-infected children with a high suspicion of bacterial coinfection [20,21].
Despite its strengths, our study has limitations. As a single-center, retrospective analysis, our findings need to be interpreted with caution, as patient demographics and local practice patterns may have influenced the results. The model’s generalizability, therefore, remains to be established. While our sample size was sufficient for the primary analysis, it may not have been large enough for detailed subgroup evaluations, such as in different age brackets. Furthermore, our model was intentionally parsimonious, relying on three common inflammatory markers; future iterations could potentially be enhanced by incorporating other variables, like viral load or additional cytokines.
These limitations naturally guide our future work. An external, multicenter prospective validation is the immediate and essential next step to confirm the model’s robustness across diverse populations. Looking further ahead, a dynamic model that tracks the trajectory of these biomarkers over the first 48 hours could offer more nuanced predictions. Ultimately, the true clinical value of this tool can only be confirmed through a randomized controlled trial (RCT), designed to test whether a model-guided antibiotic strategy improves patient outcomes, such as reducing antibiotic usage and hospital stay.
5. Conclusions
In conclusion, this study successfully developed and validated a clinical prediction model integrating NLR, CRP, and SAA. This model serves as a simple, objective, and effective tool to help clinicians in the early and accurate identification of high-risk patients with clinically significant bacterial coinfection in the complex clinical scenario of RSV infection. It thereby provides strong evidence-based support for achieving precision antibiotic therapy and enhancing antimicrobial stewardship (AMS).
Author Contributions
Conceptualization, D.L. and Q.T.; methodology, D.L. and J.W.; software, C.L.; validation, D.L., M.X. and J.W.; formal analysis, M.X.; investigation, D.L. and C.L.; resources, Q.T.; data curation, J.W. and M.X.; writing—original draft preparation, D.L.; writing—review and editing, Q.T. and C.L.; visualization, D.W.; supervision, Q.T.; project administration, Q.T.; funding acquisition, Q.T. All authors have read and agreed to the published version of the manuscript.
Funding
This research was funded by the Natural Science Foundation of Fujian Province, grant number 2023J01121653.
Institutional Review Board Statement
The study was conducted in accordance with the Declaration of Helsinki, and approved by the Institutional Review Board of Fujian Children’s Hospital (protocol code: 2025ETKLRK10017; date of approval: 21 October 2025).
Informed Consent Statement
Patient consent was waived due to the retrospective nature of the study and the use of anonymized data.
Data Availability Statement
The data presented in this study are available on request from the corresponding author. The data are not publicly available due to privacy and ethical restrictions.
Conflicts of Interest
The authors declare no conflicts of interest.
References
- Li, Y.; Wang, X.; Blau, D.M.; Caballero, M.T.; Feikin, D.R.; Gill, C.J.; Madhi, S.A.; Omer, S.B.; Simões, E.A.F.; Campbell, H.; et al. Global, Regional, and National Disease Burden Estimates of Acute Lower Respiratory Infections Due to Respiratory Syncytial Virus in Children Younger than 5 Years in 2019: A Systematic Analysis. Lancet 2022, 399, 2047–2064. [Google Scholar] [CrossRef]
- Shi, T.; McAllister, D.A.; O’Brien, K.L.; Simoes, E.A.F.; Madhi, S.A.; Gessner, B.D.; Polack, F.P.; Balsells, E.; Acacio, S.; Aguayo, C.; et al. Global, Regional, and National Disease Burden Estimates of Acute Lower Respiratory Infections Due to Respiratory Syncytial Virus in Young Children in 2015: A Systematic Review and Modelling Study. Lancet 2017, 390, 946–958. [Google Scholar] [CrossRef]
- Fleming-Dutra, K.E.; Hersh, A.L.; Shapiro, D.J.; Bartoces, M.; Enns, E.A.; File, T.M.; Finkelstein, J.A.; Gerber, J.S.; Hyun, D.Y.; Linder, J.A.; et al. Prevalence of Inappropriate Antibiotic Prescriptions Among US Ambulatory Care Visits, 2010-2011. JAMA 2016, 315, 1864–1873. [Google Scholar] [CrossRef] [PubMed]
- Liang, A.; Wu, X.; Zhu, Y.; Pan, L.; Wang, A.; Wu, C.; Xia, J. Targeted Next-Generation Sequencing (tNGS): An Upcoming Application for Pathogen Identification in Clinical Diagnosis. J Infect Public Health 2025, 18, 102936. [Google Scholar] [CrossRef]
- Qu, X.; Ye, X.; Yu, J.; Zheng, F.; Tang, Y.; Yuan, F.; Xie, Q. Epidemiological and Clinical Characteristics of Bacterial Co-Detection in Respiratory Syncytial Virus-Positive Children in Wenzhou, China, 2021 to 2023. BMC Infect Dis 2025, 25, 697. [Google Scholar] [CrossRef]
- Fu, S.; Zhang, M.-M.; Zhang, L.; Wu, L.-F.; Hu, Q.-L. The Value of Combined Serum Amyloid A Protein and Neutrophil-to-Lymphocyte Ratio Testing in the Diagnosis and Treatment of Influenza A in Children. Int J Gen Med 2021, 14, 3729–3735. [Google Scholar] [CrossRef] [PubMed]
- Wang, Y.; Wang, T.; Wen, X.; Feng, C. Establishing a Predictive Model for Liver Fluke Infection on the Basis of Early Changes in Laboratory Indicators: A Retrospective Study. Parasit Vectors 2025, 18, 186. [Google Scholar] [CrossRef]
- Xie, X.; Wang, W.; Liu, Z.; Sun, T.; Song, Y.; Wang, N.; Wang, Z.; Wang, Y. Clinical Characteristics Analysis and Prediction Model Construction for Pediatric Influenza Virus Pneumonia Complicated by Bacterial Infection. Transl Pediatr 2025, 14, 2078–2091. [Google Scholar] [CrossRef] [PubMed]
- Lian, D.; Lin, C.; Zhang, Z.; Wei, J.; Wang, D.; Tang, Q. Clinical Diagnostic Value of Throat Swabs in Pediatric Acute Lower Respiratory Tract Infections Using Targeted Next-Generation Sequencing. BMC Pediatr 2025, 25, 224. [Google Scholar] [CrossRef]
- Gao, S.; Zhang, H. Development and Validation of a Depression Risk Prediction Model for Rural Elderly Living Alone. BMC Psychiatry 2025, 25, 357. [Google Scholar] [CrossRef]
- Sun, D.; Huang, T.; Li, J.; Liu, M.; Zhang, X.; Cui, M. Development and Validation of a Predictive Model for Anticipatory Grief in Family Caregivers of Cancer Patients: Based on LASSO-Logistic Regression Model. Psychooncology 2025, 34, e70236. [Google Scholar] [CrossRef]
- Liu, D.; Liu, H.; Yao, J.; Chen, G.; Wang, W.; Cao, B.; Hu, J.; Wu, W. Development and Validation of a Nomogram Model for Assessing the Severity of Acute Pancreatitis from the Perspective of PICS. Front Nutr 2025, 12, 1611501. [Google Scholar] [CrossRef]
- Shen, C.; Liu, M.; Cai, Z.; Wang, M.; Tian, L.; Tang, L.; Cui, F.; Zhao, W. Association between Neutrophil-to-Lymphocyte Ratio and Early Renal Function Decline in Patients with Immunoglobulin a Nephropathy. Ann Med 2025, 57, 2559133. [Google Scholar] [CrossRef] [PubMed]
- Liu, S.; Li, Y.; She, F.; Zhao, X.; Yao, Y. Predictive Value of Immune Cell Counts and Neutrophil-to-Lymphocyte Ratio for 28-Day Mortality in Patients with Sepsis Caused by Intra-Abdominal Infection. Burns Trauma 2021, 9, tkaa040. [Google Scholar] [CrossRef]
- Zhou, X.; Fu, S.; Wu, Y.; Guo, Z.; Dian, W.; Sun, H.; Liao, Y. C-Reactive Protein-to-Albumin Ratio as a Biomarker in Patients with Sepsis: A Novel LASSO-COX Based Prognostic Nomogram. Sci Rep 2023, 13, 15309. [Google Scholar] [CrossRef]
- Society of Clinical Microbiology of China International Exchange and Promotion Association for Medical and Healthcare [Expert consensus on the application and practice of targeted next-generation sequencing in infectious diseases]. Zhonghua Yi Xue Za Zhi 2024, 104, 4375–4383. [CrossRef]
- Zhou, L.; Wu, Y.; Wang, J.; Wu, H.; Tan, Y.; Chen, X.; Song, X.; Ren, Y.; Yang, Q. Development of a Predictive Nomogram for Intra-Hospital Mortality in Acute Ischemic Stroke Patients Using LASSO Regression. Clin Interv Aging 2024, 19, 1423–1436. [Google Scholar] [CrossRef]
- Mahtab, S.; Blau, D.M.; Madewell, Z.J.; Ogbuanu, I.; Ojulong, J.; Lako, S.; Legesse, H.; Bangura, J.S.; Bassat, Q.; Mandomando, I.; et al. Post-Mortem Investigation of Deaths Due to Pneumonia in Children Aged 1-59 Months in Sub-Saharan Africa and South Asia from 2016 to 2022: An Observational Study. Lancet Child Adolesc Health 2024, 8, 201–213. [Google Scholar] [CrossRef] [PubMed]
- Gan, Y.; Hu, Y.; Dong, H.; Wu, L.; Niu, Y. Causes of Lower Respiratory Tract Infections and the Use of Diagnostic Biomarkers in Blood Samples from Children in Hohhot, Inner Mongolia, China, Between July 2019 and June 2020. Med Sci Monit 2022, 28, e934889. [Google Scholar] [CrossRef] [PubMed]
- Haeberer, M.; Mengel, M.; Fan, R.; Toquero-Asensio, M.; Martin-Toribio, A.; Liu, Q.; He, Y.; Uppal, S.; Rojo-Rello, S.; Domínguez-Gil, M.; et al. Respiratory Syncytial Virus Risk Profile in Hospitalized Infants and Comparison with Influenza and COVID-19 Controls in Valladolid, Spain, 2010-2022. Infect Dis Ther 2024, 13, 2395–2413. [Google Scholar] [CrossRef]
- Asmare, Z.; Awoke, T.; Genet, C.; Admas, A.; Melese, A.; Mulu, W. Incidence of Catheter-Associated Urinary Tract Infections by Gram-Negative Bacilli and Their ESBL and Carbapenemase Production in Specialized Hospitals of Bahir Dar, Northwest Ethiopia. Antimicrob Resist Infect Control 2024, 13, 10. [Google Scholar] [CrossRef] [PubMed]

Table 1.
Baseline characteristics of patients in the training and test cohorts.
| Characteristic | Training Cohort (n=363) | Test Cohort (n=155) | p-Value |
|---|---|---|---|
| Demographics | |||
| Sex, n (%) | 0.554¹ | ||
| Female | 153 (42.1) | 61 (39.4) | |
| Male | 210 (57.9) | 94 (60.6) | |
| Age, months, median (IQR) | 12 (7, 24) | 12 (6, 24) | 0.271² |
| Weight, kg, median (IQR) | 10.7 (8.0, 13.8) | 9.9 (7.8, 13.3) | 0.325² |
| Clinical Outcomes | |||
| Length of stay, days, median (IQR) | 6.0 (5.0, 7.0) | 5.0 (5.0, 7.0) | 0.579² |
| Severe disease, n (%) | 54 (14.9) | 23 (14.8) | 0.991¹ |
| ICU admission, n (%) | 5 (1.4) | 6 (3.9) | 0.094³ |
| Mechanical ventilation, n (%) | 4 (1.1) | 3 (1.9) | 0.432³ |
| Laboratory Parameters, median (IQR) | |||
| WBC (×10⁹/L) | 8.8 (6.6, 12.3) | 9.1 (6.9, 11.6) | 0.517² |
| Platelet count (×10⁹/L) | 332 (260, 425) | 334 (271, 424) | 0.584² |
| NLR | 0.79 (0.42, 1.59) | 0.77 (0.48, 1.29) | 0.557² |
| PLR | 81 (58, 116) | 77 (56, 113) | 0.373² |
| CRP (mg/L) | 4 (2, 12) | 5 (2, 14) | 0.552² |
| Procalcitonin (μg/L) | 0.09 (0.06, 0.18) | 0.09 (0.06, 0.17) | 0.477² |
| SAA (mg/L) | 28 (17, 63) | 32 (18, 65) | 0.652² |
| Ferritin (μg/L) | 148 (99, 246) | 145 (94, 248) | 0.857² |
| Lactate dehydrogenase (U/L) | 323 (283, 373) | 324 (276, 383) | 0.917² |
| Albumin (g/L) | 44.9 (42.7, 46.4) | 45.2 (42.8, 47.0) | 0.228² |
| ALT (U/L) | 19 (15, 28) | 20 (16, 27) | 0.568² |
| AST (U/L) | 42 (35, 50) | 42 (35, 50) | 0.713² |
| D-dimer (mg/L) | 0.39 (0.28, 0.52) | 0.36 (0.26, 0.48) | 0.330² |
| Imaging Findings, n (%) | |||
| Increased lung markings | 112 (30.9) | 51 (32.9) | 0.646¹ |
| Consolidation | 19 (5.2) | 10 (6.5) | 0.581¹ |
| Patchy infiltrates | 77 (21.2) | 29 (18.7) | 0.518¹ |
| Pleural effusion | 0 (0.0) | 1 (0.6) | 0.299³ |
| RSV Subtype, n (%) | |||
| RSV-A | 106 (29.2) | 44 (28.4) | 0.852¹ |
| RSV-B | 256 (70.5) | 111 (71.6) | 0.803¹ |
Data are presented as n (%) for categorical variables and median (interquartile range, IQR) for continuous variables. Abbreviations: WBC, white blood cell count; CRP, C-reactive protein; SAA, Serum amyloid A; ALT, alanine aminotransferase; AST, aspartate aminotransferase; ICU, intensive care unit; IQR, interquartile range; NLR, neutrophil-to-lymphocyte ratio; PLR, platelet-to-lymphocyte ratio; RSV, respiratory syncytial virus. 1 Pearson’s Chi-squared test. 2 Wilcoxon rank sum test. 3 Fisher’s exact test.
Table 2.
Univariate analysis of risk factors for bacterial coinfection in the training cohort (N=363).
Table 2.
Univariate analysis of risk factors for bacterial coinfection in the training cohort (N=363).
| Characteristic | No Bacterial Coinfection (n=234) | Bacterial Coinfection (n=129) | p-value |
|---|---|---|---|
| Demographics | |||
| Sex, n (%) | 0.055¹ | ||
| Female | 90 (38.5) | 63 (48.8) | |
| Male | 144 (61.5) | 66 (51.2) | |
| Age, months, median (IQR) | 12 (5, 24) | 24 (11, 36) | <0.001² |
| Weight, kg, median (IQR) | 10.0 (7.6, 13.0) | 12.0 (9.0, 15.5) | <0.001² |
| Clinical Outcomes | |||
| Length of stay, days, median (IQR) | 6.0 (5.0, 7.0) | 6.0 (5.0, 7.0) | 0.974² |
| Severe disease, n (%) | 35 (15.0) | 19 (14.7) | 0.953¹ |
| ICU admission, n (%) | 5 (2.1) | 0 (0.0) | 0.165³ |
| Mechanical ventilation, n (%) | 4 (1.7) | 0 (0.0) | 0.302³ |
| Laboratory Parameters, median (IQR) | |||
| WBC (×10⁹/L) | 8.2 (6.3, 11.2) | 10.2 (7.6, 13.4) | <0.001² |
| Platelet count (×10⁹/L) | 333 (263, 413) | 324 (258, 436) | 0.455² |
| NLR | 0.54 (0.33, 1.00) | 1.64 (0.95, 2.85) | <0.001² |
| PLR | 74 (53, 100) | 103 (74, 151) | <0.001² |
| CRP (mg/L) | 3 (2, 7) | 11 (4, 22) | <0.001² |
| Procalcitonin (μg/L) | 0.09 (0.06, 0.14) | 0.12 (0.07, 0.27) | <0.001² |
| SAA (mg/L) | 20 (15, 42) | 52 (22, 119) | <0.001² |
| Ferritin (μg/L) | 144 (95, 246) | 150 (112, 220) | 0.537² |
| Lactate dehydrogenase (U/L) | 325 (290, 390) | 307 (272, 350) | 0.002² |
| Albumin (g/L) | 45.0 (43.0, 46.8) | 44.2 (42.3, 46.0) | 0.133² |
| ALT (U/L) | 20 (16, 30) | 18 (15, 24) | 0.013² |
| AST (U/L) | 43 (36, 52) | 39 (31, 46) | <0.001² |
| D-dimer (mg/L) | 0.39 (0.27, 0.50) | 0.40 (0.29, 0.54) | 0.234² |
| Imaging Findings, n (%) | |||
| Increased lung markings | 78 (33.3) | 34 (26.4) | 0.168¹ |
| Consolidation | 11 (4.7) | 8 (6.2) | 0.539¹ |
| Patchy infiltrates | 48 (20.5) | 29 (22.5) | 0.661¹ |
| Pleural effusion | 0 (0.0) | 0 (0.0) | >0.999³ |
| RSV Subtype, n (%) | |||
| RSV-A | 75 (32.1) | 31 (24.0) | 0.108¹ |
| RSV-B | 159 (67.9) | 97 (75.2) | 0.147¹ |
Data are presented as n (%) for categorical variables and median (interquartile range, IQR) for continuous variables. Variables with statistically significant differences (P < 0.05) are highlighted in bold. Abbreviations: WBC, white blood cell count; CRP, C-reactive protein; SAA, Serum amyloid A; ALT, alanine aminotransferase; AST, aspartate aminotransferase; ICU, intensive care unit; IQR, interquartile range; NLR, neutrophil-to-lymphocyte ratio; PLR, platelet-to-lymphocyte ratio; RSV, respiratory syncytial virus. ¹ Pearson’s Chi-squared test. ² Wilcoxon rank sum test. ³ Fisher’s exact test.
Table 3.
Multivariable logistic regression analysis of independent predictors for bacterial coinfection in the training cohort.
Table 3.
Multivariable logistic regression analysis of independent predictors for bacterial coinfection in the training cohort.
| Characteristic | β (Beta) | SE | OR (95% CI) | p-value |
|---|---|---|---|---|
| NLR | 0.758 | 0.136 | 2.13 (1.64–2.79) | <0.001 |
| C-reactive protein (mg/L) | 0.032 | 0.013 | 1.03 (1.01–1.06) | 0.017 |
| Serum amyloid A (mg/L) | 0.006 | 0.002 | 1.01 (1.00–1.01) | 0.007 |
Abbreviations: β, beta coefficient; SE, standard error; OR, odds ratio; CI, confidence interval; NLR, neutrophil-to-lymphocyte ratio.
Table 4.
Distribution and classification of bacterial pathogens identified in children with RSV coinfection.
Table 4.
Distribution and classification of bacterial pathogens identified in children with RSV coinfection.
| Pathogen | Type | Number of Detections (n) | Detection Rate (%)¹ |
|---|---|---|---|
| Haemophilus influenzae | G- | 98 | 18.92 |
| Streptococcus pneumoniae | G+ | 65 | 12.55 |
| Moraxella catarrhalis | G- | 28 | 5.41 |
| Bordetella pertussis | G- | 12 | 2.32 |
| Staphylococcus aureus | G+ | 10 | 1.93 |
| Klebsiella pneumoniae | G- | 9 | 1.74 |
| Pseudomonas aeruginosa | G- | 2 | 0.39 |
| Streptococcus intermedius | G+ | 2 | 0.39 |
| Streptococcus pyogenes | G+ | 1 | 0.19 |
Abbreviations: G-, Gram-negative; G+, Gram-positive. 1 The detection rate was calculated based on the total study population (N=518).
Disclaimer/Publisher’s Note: The statements, opinions and data contained in all publications are solely those of the individual author(s) and contributor(s) and not of MDPI and/or the editor(s). MDPI and/or the editor(s) disclaim responsibility for any injury to people or property resulting from any ideas, methods, instructions or products referred to in the content. |
© 2025 by the authors. Licensee MDPI, Basel, Switzerland. This article is an open access article distributed under the terms and conditions of the Creative Commons Attribution (CC BY) license (https://creativecommons.org/licenses/by/4.0/).
Copyright: This open access article is published under a Creative Commons CC BY 4.0 license, which permit the free download, distribution, and reuse, provided that the author and preprint are cited in any reuse.


