Submitted:
28 November 2025
Posted:
02 December 2025
You are already at the latest version
Abstract
Traumatic brain injury (TBI) often leads to long-lasting motor deficits, yet the cellular mechanisms underlying these impairments remain incompletely understood. Here we examined glial and neuronal responses following focal ablation injury of the hindlimb sensorimotor cortex in adult male rats, a model previously shown to induce persistent gait asymmetry and postural deficits. Immunohistochemical analysis of resting and activated microglia, astrocytes, and neurons was performed bilaterally in peri-lesional cortex at 3, 7, 14, 21, and 28 days post-injury. The injury produced an early, sharply lo-calized increase in activated microglia and macrophages in the injured hemisphere, followed by sustained microglial activation that gradually extended contralaterally. Astrocytic activation displayed a delayed but more prolonged profile, rising ipsilater-ally within the first week, peaking around two weeks, and becoming bilaterally ele-vated by four weeks. Neuronal density and morphology were preserved throughout, indicating that motor impairments arose without secondary neuronal loss. These find-ings demonstrate a structured and temporally distinct cascade of glial responses mir-roring the evolution of motor deficits. The results suggest that focal cortical injury ini-tiates sequential inflammatory and astrocytic processes without secondary neuronal loss, highlighting glial–neuronal interactions as key targets for improving motor re-covery after TBI.
Keywords:
traumatic brain injury
; neuroinflammation
; microglia activation
; astrocytic gliosis
; motor deficits
; focal cortical injury
; glia-neuronal interactions
; rat mod
1. Introduction
Traumatic brain injury (TBI) is caused by external mechanical forces and can lead to temporary or permanent impairments in physical, cognitive, and psychosocial functions [1]. It represents a major global health problem, with millions living with long-term disabilities. Globally, an estimated 64–74 million people sustain a TBI each year, most commonly due to road traffic injuries and falls, with particularly high incidence in adolescents, young adults and in older adults [2].
TBI pathology is commonly divided into two phases. The primary injury reflects the immediate mechanical disruption of brain tissue whereas, the secondary injury develops over hours to weeks and involves neuroinflammation, blood–brain barrier (BBB) disruption, edema, and excitotoxicity [3]. These processes expand the lesion and worsen neuronal dysfunction. Excessive or unresolved inflammation has been linked to progressive neuronal loss and persistent functional decline [4]. Anatomical localization further affects the outcome. Focal cortical injuries are often associated with long-lasting contralateral motor impairments such as spastic paresis, gait disturbances, and deficits in fine motor control [5].
In a recent study, we showed that a unilateral lesion of the hindlimb sensorimotor cortex in rats induces robust and persistent motor deficits, including contralateral hindlimb postural asymmetry (HL-PA) and gait alterations [6]. These findings provide a functional basis for investigating whether distinct and lateralized neuroinflammatory responses develop in parallel with motor asymmetries.
The immune response to TBI begins when damage-associated molecular patterns (DAMPs) activate pattern recognition receptors on glial cells, initiating inflammatory cascades involving nuclear factor kappa-light-chain-enhancer of activated B cells (NF-κβ) signaling and cytokine release [3,4]. Microglia are the earliest responders and can adopt pro- or anti-inflammatory phenotypes. In their pro-inflammatory state, they release interleukins such as IL-6 and IL-1β, tumor necrosis factor alpha (TNF-α), glutamate, and reactive oxygen species, thereby aggravating neuronal stress. In their anti-inflammatory state, they contribute to repair through phagocytosis and the release of IL-4 and IL-10. Infiltrating macrophages can also influence these processes, although their role in focal cortical injury remains poorly understood [3,4,7]. Astrocytes are activated early as well and may assume neurotoxic or neuroprotective functions. They support BBB integrity, release trophic factors, and stabilize the extracellular environment, but persistent activation can prolong inflammation and restrict recovery through scar formation [3,4,7].
Rodent models of TBI differ markedly in the distribution of injury and in their inflammatory and motor outcomes. Weight-drop and fluid percussion injury (FPI) models generally produce diffuse pathology, often affecting both cortical and subcortical regions as well as white matter tracts. These injuries are accompanied by widespread gliosis with time- and region-dependent variations in microglial and astrocytic reponse. For example, the degree of glial fibrillary acidic protein (GFAP) reactivity after FPI depends strongly on the location of the craniotomy [7,8]. Because injury and gliosis are not tightly localized, the inflammatory response is often bilateral or global, and the associated motor impairments are less consistently lateralized.
In contrast, controlled cortical impact (CCI) and aspiration/ablation models induce focal cortical lesions with reproducible tissue responses concentrated in peri-lesional regions [7,8]. These focal injuries are typically associated with predictable contralateral motor impairments, including hemiparesis, gait asymmetry, and HL-PA, reflecting the decussation of corticospinal pathways. This allows direct links to be made between local neuroinflammatory responses and lateralized motor outcomes. In our aspiration model targeting the hindlimb sensorimotor cortex, we previously observed persistent contralateral HL-PA and altered gait, along with evidence that these asymmetries are encoded at the spinal level [9]. These findings highlight the value of focal TBI models for investigating how cortical injury drives neuroinflammation and asymmetric motor deficits.
In this study, we examined glial and neuronal responses to focal TBI in the rat hindlimb sensorimotor cortex. Our aim was to determine whether inflammatory and cellular changes differ between the ipsilateral and contralateral hemispheres, and how these patterns relate to the motor outcomes we previously reported in the same rats [6]. While unilateral cortical injury is generally expected to produce contralateral motor impairments due to corticospinal decussation, our earlier work showed that aspiration of the hindlimb sensorimotor cortex induces persistent postural asymmetry and gait alterations that cannot be fully explained by a simple ipsi–contra distinction. This raises the question of whether glial activation likewise extends beyond the lesioned hemisphere. We therefore hypothesized that focal TBI would elicit a sequential neuroinflammatory response, beginning with an acute ipsilateral cluster of differentiation 11b (CD11b) microglial/macrophage component, followed by more sustained ionized calcium-binding adapter molecule 1 (IBA-1) microglial activation and delayed astrocytic GFAP upregulation, and that these glial changes could extend contralaterally in parallel with the evolution of motor deficits.2.
2. Materials and Methods
2.1. Animals
Adult male Sprague-Dawley rats, (Janvier Labs, weight 250-600 g, 3-4 months), were housed under standard laboratory conditions (12-hour light/dark cycle, 21 °C, 65% humidity) with ad libitum access to food and water. Animals were randomly assigned either the TBI group or a SHAM-operated control group. All experimental procedures were conducted in accordance with institutional and national ethical guidelines (Permit # 2019-15-0201-0015).
2.2. Focal Cortical Aspiration Model
Focal TBI was induced in the right hindlimb sensorimotor cortex using a focal cortical aspiration model, as previously described [6]. The rats were given oral buprenorphine (Temgesic® 485473, Indivior Europe, VA, USA) 0.4 mg/kg 1 hour pre-operatively mixing the drug with peanut butter; the drug acts over 24 h and was used for postoperative pain relief.
The rats were anesthetized intraperitoneally (i.p.) with a mixture of ketamine 100 mg/kg (Ketaminol Vet 20 mg/mL, CAS: 6740-88-1, MSD Animal Health, Stockholm, Sweden) and xylazine 10 mg/kg (Rompun Vet 50 mg/mL, CAS: 7361-61-7, Elanco Denmark, Ballerup, Denmark) with a dose of 0.25 mL/kg body weight. To avoid eye irritation during surgery, 2 mg/g carbomer gel (ViscoTears, CAS: 9007-20-9, Bausch & Lomb Nordic AB, Stockholm, Sweden) was applied to the eyes.
Local anesthesia of 20 mg/mL lidocaine (Xylocain, CAS: 137-58-6, Aspen Nordic, Aspen, CO, USA) was given in the ears and subcutaneously on the surgical area. The rats’ heads were fixed on a stereotaxic head holder to ensure proper alignment of bregma and lambda landmarks. Under local anesthesia with lidocaine, the scalps were incised along the midline, opened, and stretched to expose the right side of the cranium.
A section of the cranium was marked with the coordinates 0.5–4.0 mm posterior to bregma and 1.8–3.8 mm lateral to the midline. The marked cranial area was opened by drilling. The part of the cerebral cortex located below this window includes the hindlimb representation area of the sensorimotor cortex, which was aspirated with a glass pipette (tip diameter ~0.5 mm) connected to an electrical suction machine (Craft Duo-Vec Suction unit, Rocket Medical Plc, Watford, UK). Care was taken not to aspirate the white matter below the cortex. After suction was complete, bleeding was stopped using Spongostone (Lagaay Medical, Rotterdam, The Netherlands). The wound was closed using 3-0 vicryl suture (Ethicon, Raritan, NJ, USA), and lidocaine was reapplied on the operation area.
After the operation, the rats were placed in a recovery cage for 24 hours and then returned to their home cage.
For the SHAM operation, the same anesthetic and operative procedure was used, but the dura was kept intact, and no cortical tissue was aspirated. After haemostasis, the wound was closed in the same manner as in the TBI group.
This aspiration model produces focal cortical lesions that consistently result in contralateral motor deficits, including HL-PA and flexion, thereby providing a reproducible phenotype for linking motor impairments with tissue responses [9].
2.3. Perfusion and Tissue Preparation
Animals were euthanized at days 3, 7, 14, 21, and 28 post-injury. Following the completion of HL-PA and gait pattern assessments [6], the rats were administered a lethal dose of sodium pentobarbital (60 mg/100 g body weight, Exagon Vet., Salfarm, CAS: 76-74-4) via i.p. injection. Subsequently, intracardiac perfusion fixation was performed. The perfusion procedure began with 0.1 M phosphate-buffered saline (PBS) followed by a fixative solution containing 4% paraformaldehyde (Sigma-Aldrich, CAS: 30525-89-4) in 0.1 M PBS at a volume of 100 mL/100 g body weight. After perfusion, the brain was carefully dissected and post-fixed in 4% paraformaldehyde at 4 °C for 24 hours and cryoprotected in 30% sucrose with 0.1% sodium azide (NaN3). Tissue was stored at -80 °C until sectioned coronally at 40 µm using a freezing microtome (Microm 34, Thermo Fisher Scientific, Roskilde, Denmark). The sections were distributed into ten separate Eppendorf tubes, with every 10th section placed in the same tube to ensure uniform sampling. The storage solution in each tube contained 30% sucrose and 0.1% NaN3, which prevented crystal formation in the tissue during storage.
2.4. Immunohistochemistry (IHC) Protocol
Coronal brain sections from each animal were stained for one of four cellular markers: CD11b identifying microglia and infiltrating monocytes/macrophages [10], IBA-1 labeling the total microglia/macrophage population [11,12], GFAP detecting astrocytes [13,14], and neuronal nuclei (NeuN) identifying mature neurons [15]. CD11b is a membrane integrin associated with adhesion, phagocytosis, and cytokine release [10]. IBA-1 is a cytoplasmic calcium-binding protein linked to actin remodeling and migration, and its expression increases with microglial activation [11,12]. GFAP labels intermediate filaments in astrocytes, which respond to injury through processes including BBB repair, neurotrophic support, and glial-scar formation [13,14]. NeuN serves as a neuronal reference marker, allowing evaluation of glial changes relative to neuronal density [15].
Endogenous peroxidase activity was quenched for 30 minutes (0.3% H2O2 in PBS), and non-specific binding were blocked in 2% bovine serum albumin (BSA) and 5% normal goat serum (NGS) for 1 hour. Primary antibodies (diluted in 5% goat serum, 2% BSA and PBS with 0.1% triton X-100 (PBS-T) were applied for 20 minutes at room temperature (RT) followed by approx. 48 hours at 4 °C (for further information on the antibodies and their concentrations see Supplementary Table 1).
After primary antibody incubation, sections were brought to RT for 30 minutes and washed in PBS-T three times for 15 minutes. The sections were incubated with biotinylated secondary antibodies in PBS-T containing 1% BSA and 2% NGS for 2 hours at room temperature followed by incubation in an avidin-biotin complex (ABC) solution (1:100; Vectastain Elite ABC kit, peroxidase standard (Vector Laboratories, Burlingame, USA) in PBS-T) for 1 hour at RT (for further information on the antibodies and their concentrations see Supplementary Table 1). After incubation, sections were washed in PBS for two 10-minute washes, followed by two 10-minute washes in tris-buffered saline (TBS) to remove any excess avidin. The chromogenic development was carried out by incubating sections in TBS (pH 7.2) containing 0.05% 3,3’-diaminobenzidine (DAB) (Merck, D5637, Hessen, Germany) and 0.01% H₂O₂ until the desired brown coloration developed, which typically took 1-15 minutes depending on the primary antibody used. Sections were then washed in TBS five times for 5 minutes each. The sections were then washed in tris buffer and mounted onto glass slides using a 0.5% gelatine solution.
Once dry, the sections were dehydrated in graded alcohol (70%, 96%, and 99.9%) followed by xylene and mounted with DPX mounting medium (Merck, HX60964379, Burlington, USA).
2.5. Data Acquisition and Analysis
The brain sections were imaged using a LEICA DM6000 B light microscope (Leica Microsystems, Wetzlar, Germany) at 20× magnification in 8-bit grayscale mode. A total of 40 rat brains were analyzed, comprising 22 with TBI and 18 SHAM-operated controls (see Supplementary Table 3). For each brain, four coronal sections were imaged (with a Leica DFC420 digital microscope camera, Digital Camera System, Wetzlar, Germany) per marker (CD11b, IBA-1, GFAP, or NeuN), and eight images were captured per section - two each from regions located 0–500 µm and 500–1000 µm lateral to the lesion site in both hemispheres (see Figure 1). In SHAM animals, comparable midline-symmetric regions were imaged, so identical sampling zones were used across hemispheres and timepoints to assess spatial and lateralized glial reactivity. Exposure and acquisition settings were kept identical across all samples for a given marker to allow valid comparison.
Quantification of immunoreactivity was performed using Fiji (ImageJ 1.54g, Java 1.8.0_364 (64.bit)). A custom batch-processing macro was applied for most datasets. This pipeline included background subtraction (rolling ball radius), application of a fixed grayscale threshold, and measurement of the percent area of positive staining (see Figure 2 and Supplementary Table 2). For each marker and timepoint, threshold values were held constant to ensure comparability.
For CD11b, all timepoints were quantified using the macro. For IBA-1, GFAP, and NeuN, all timepoints except day 28 were analyzed using the macro; day 28 images were manually quantified by a different researcher. Additionally, while day 3 and day 14 images for IBA-1, GFAP, and NeuN were immunostained by different researchers, their quantification was performed using the macro pipeline.
Importantly, all manually quantified datasets were included without further calibration, which introduced potential variability in staining intensity and image quality. Therefore, normalized values were later applied in the statistical analysis to account for these differences and ensure data comparability across conditions.
For each brain, data from 3 sections per hemisphere were averaged to produce one representative value per region and marker. All stained brain sections that were imaged were included in the analysis; although the number of animals analyzed differed between markers, no imaged sections or images were excluded.
2.6. Statistical Analyses
All statistical analyses were performed using GraphPad Prism (version 9.5.1, GraphPad Software, LLC, Boston, USA). Data were assessed for normality using Shapiro-Wilk test. Due to batch variability between staining sessions, all expression values were normalized to the average of SHAM left + SHAM right values at the corresponding timepoint and distance.
At first, TBI vs. SHAM group was compared. Here, for each marker and timepoint, a two-way repeated-measures ANOVA was conducted (Group (SHAM/TBI) x Hemisphere (Right/Left)), followed by Sidak-Holm’s correction for hemisphere-specific post hoc comparisons (SHAM left vs. TBI left and SHAM right vs. TBI right). Significant threshold was set at p<0.05. Next, we investigated lesion lateralization by comparing right vs. left hemisphere values in TBI animals using paired t-tests. Sidak-Holm correction was manually applied across timepoints and distances. Hence adjusted significance threshold was: p<0.0253. All data are reported as mean ± SD.
3. Results
To investigate the cellular responses to focal cortical injury, we quantified immunoreactivity for markers of microglia/macrophages, astrocytes, and neurons across time and space (the animal numbers in each group used for the analyses were stated in Supplementary Table 3). Below, we report on the temporal dynamics and hemispheric distribution of these markers.
3.1. CD11b Expression Reveals Early, Sharply Lateralized Microglial/Macrophage Activation That Resolves by Day 21
We first examined CD11b expression to assess early microglial/macrophage response following TBI. This marker is known to highlight reactive microglia and infiltrating macrophages [10]. CD11b revealed a rapid, sharply lateralized response that resolved within three weeks.
At day 3, strong and dense CD11b labeling was observed in the TBI right peri-lesional cortex (0–500 µm), with minimal staining in both SHAM right and TBI left hemispheres (Figure 3A-C). This marked asymmetry visually supports the presence of early, sharply localized microglial/macrophage activation. Two-way ANOVA confirmed significant main effects of group (p = 0.0023), hemisphere (p < 0.0001), and a group × hemisphere interaction (p < 0.0001) at 0-500 µm peri-lesional. Post hoc comparisons confirmed significantly elevated CD11b in TBI right compared to SHAM right (p < 0.0001), and a paired t-test confirmed lateralization within TBI animals (TBI right > TBI left: p = 0.0002) (Figure 3D). At 500-1000 µm, staining density was moderately increased in TBI right compared to the other groups (Figure 4A-C). Quantitatively, group (p = 0.0214), hemisphere (p = 0.0368), and interaction (p = 0.0347) effects were all significant, and TBI right remained elevated compared to SHAM right (p = 0.0027), indicating that lateralized activation extended beyond the lesion core, though to a much lesser degree (Figure 4D).
At day 7, CD11b labeling in TBI right remained evident but less intense compared to day 3 (Figure 3E), while TBI left and SHAM hemispheres showed minimal staining (Figure 3F and G). Morphologically, CD11b+ cells in TBI right displayed irregular, partly stellate shapes and some with strong perinuclear labeling and less distinct process staining, consistent with a subacute activated phenotype (Supplementary Figure 1A (thick arrows)). Significant effects persisted at 0–500 µm pericontusional (group (p = 0.004), hemisphere (p = 0.001), and interaction (p = 0.001)). Post hoc tests confirmed that TBI right was elevated relative to SHAM right (p < 0.0001), and a paired t-test showed significant lateralization (TBI right > TBI left: p = 0.015) (Figure 3H). At 500-1000 µm, CD11b expression in TBI right also exceeded SHAM right (p = 0.0002), though the lateralization effect was weaker (Figure 4E-H).
At day 14, CD11b staining in TBI right appeared more diffuse and less intense (Figure 3I), consistent with a resolving immune response. Quantification still showed significant effects at 0-500 µm peri-lesional (group (p = 0.034), hemisphere (p = 0.007), and interaction (p = 0.014)), with TBI right > SHAM right (p = 0.002), and persistent lateralization (p = 0.008) (Figure 3L). At 500-1000 µm peri-lesional, staining intensity appeared almost normalized across hemispheres, which matched the lack of statistical significance in the ANOVA and t-test (Figure 4I-L).
3.2. IBA-1 Reveals Delayed Lateralization and Sustained Microglial Activation Through Day 21
To assess microglial dynamics, IBA-1 expression was quantified at 0-500 µm and 500-1000 µm from the lesion across the same five timepoints. Compared to CD11b, IBA-1 showed broader early response and delayed lateralization.
At day 3, IBA-1 labeling appeared bilaterally elevated in TBI animals, including pericontusional cortex in both TBI right and TBI left, while SHAM hemispheres showed less IBA-1 microglial staining (Figure 5A-C). This bihemispheric pattern was consistent with a generalized microglial response immediately after injury. Quantification at 0–500 µm confirmed a significant group effect (p = 0.004), but no hemisphere or interaction effect, with both TBI hemispheres elevated over SHAM (p = 0.002 and p = 0.0008) (Figure 5D). At 500-1000 µm peri-lesional, IBA-1 labeling remained elevated in both TBI hemispheres, but to a lesser degree (Figure 6A-C). ANOVA showed a weaker group effect (p = 0.030), with no significant hemisphere or interaction effects, and no lateralization (Figure 6D).
At day 7, IBA-1 expression became more focused and intense in TBI right, , while staining in TBI left and SHAM remained modest (Figure 5E-G). Morphologically, IBA-1⁺ microglia in TBI right displayed thicker and more prominent processes (Supplementary Figure 1D (thin arrows)) compared to SHAM, consistent with a subacute activated state. In TBI left, some microglia also showed more visible and elongated processes relative to SHAM, though this effect was less pronounced than ipsilaterally (Supplementary Figure 1E (thin arrows)). This visual shift suggests emerging lesion-side dominance. ANOVA at 0–500 µm revealed significant effects of group (p = 0.027), hemisphere (p = 0.0009), and group × hemisphere interaction (p = 0.001). Post hoc comparisons showed significantly elevated IBA-1 in TBI right vs. SHAM right (p = 0.0008), and a significant paired difference between TBI right and left (p = 0.008), confirming lateralization (Figure 5H). At 500-1000 µm peri-lesional, IBA-1 expression remained more diffuse with a slight elevated expression in the TBI brain (Figure 6E-G). Two-way ANOVA showed a significant interaction (p = 0.0007), and TBI right elevated over SHAM right (p = 0.008) meaning that lateralization remained statistically significant at 500-1000 µm peri-lesional, though weaker (p = 0.007) (Figure 6H).
At day 14, IBA-1 labeling remained strong but more diffuse than day 7 in the TBI right hemisphere (Figure 5I), consistent with a resolving yet persistent microglial response. At 0–500 µm, ANOVA showed significant hemisphere (p = 0.007) and interaction (p = 0.014) effects. TBI right was still significantly higher than SHAM right (p = 0.012) and TBI left (p = 0.004), confirming ongoing lateralized activation (Figure 5L). At 500-1000 µm pericontusional, IBA-1 staining appeared normalized across hemispheres (Figure 6I-K), with no significant ANOVA or paired effects (Figure 6L).
At day 21, IBA-1 labeling in TBI right (0–500 µm) remained detectably elevated (Figure 5M-O), with significant hemisphere (p = 0.001) and interaction (p = 0.0006) effects; TBI right exceeded SHAM right (p = 0.0004) and TBI left (p = 0.002) (Figure 5P). At 500–1000 µm, no clear differences were observed (Figure 6M-P).
3.3. GFAP Expression Indicates Gradual, Sustained Astrocyte Reactivity That Extends Beyond Microglial Resolution
Astrocyte response was assessed via GFAP immunoreactivity. In contrast to the rapid, resolving profile of CD11b and IBA-1, GFAP showed a delayed onset and prolonged activation.
At day 3, weak GFAP staining was visible in the peri-lesional cortex of the TBI right hemisphere, while SHAM and TBI left hemispheres showed little or no labeling (Figure 7A-C). This indicates early, localized astrocytic activation. Quantification at 0–500 µm confirmed a hemisphere (p = 0.011) and interaction (p = 0.017) effect, with higher GFAP in TBI right vs. TBI left (p = 0.007) (Figure 7D). No visual or statistical differences was observed 500-1000 µm from the lesion site (Figure 8A-D), indicating that GFAP reactivity was restricted to the near lesion area at day 3 post-injury.
At day 7, GFAP staining intensified markedly in TBI right (Figure 7E) at 0-500 µm peri-lesion, with dense labeling not observed in other groups (Figure 7F and G). Morphologically, GFAP⁺ astrocytes in TBI right exhibited hypertrophic somata (Supplementary Figure 1G (thick arrows)) and thick, elongated processes with strong GFAP signal (Supplementary Figure 1G, (thin arrows)), consistent with a reactive phenotype, whereas astrocytes in TBI left and SHAM remained slender with sparse labeling (Supplementary Figure 1H and I). This reflects emerging lesion-side astrocyte reactivity. ANOVA at 0–500 µm showed significant effects of group (p = 0.001), hemisphere (p = 0.001), and interaction (p = 0.001), with TBI right > SHAM right (p < 0.0001) and TBI right > TBI left (p = 0.014) (Figure 7H). At 500-1000 µm, effects were weaker (hemisphere: p = 0.044; interaction: p = 0.048), but lateralization persisted (p = 0.10) (Figure 8E-H).
At day 14, GFAP expression was dense and widespread in TBI right pericontusional cortex at 0–500 µm, with astrocyte processes forming intense, interconnected networks (Figure 7I). In contrast, both TBI left, and SHAM showed sparse GFAP expression (Figure 7HJ, K). This pattern indicates robust astrocytic recruitment in the injured hemisphere, which was supported by the ANOVA that revealed significant effects of group (p = 0.003), hemisphere (p < 0.0001), and interaction (p < 0.0001). Post hoc tests confirmed TBI right > SHAM right (p < 0.0001) and TBI right > TBI left (p < 0.0001) (Figure 7L). At 500–1000 µm, visual inspection still revealed slightly more GFAP staining in TBI right, though less dense than closer to the lesion (Figure 8I). Although two-way ANOVA effects were not significant at this distance, the paired t-test showed significantly higher GFAP in TBI right vs. TBI left (p = 0.01), suggesting a lesion-biased but less spatially extensive astrocytic response at this stage (Figure 8L).
By day 21, GFAP remained elevated in TBI right, though staining appeared more diffuse compared to day 14 (Figure 7M). Interestingly, TBI left also exhibited visibly increased GFAP labeling, with scattered astrocytes showing hypertrophic morphology, supporting a bilateral, though still asymmetric, response (Figure 7N, O). At 0–500 µm, ANOVA showed significant group (p = 0.0003), hemisphere (p = 0.0009), and interaction (p = 0.0009) effects, with TBI right > SHAM right (p < 0.0001) and TBI right > TBI left (p = 0.012) (Figure 7P). At 500–1000 µm, GFAP staining in TBI right was visibly increased compared to all other groups (Figure 8M). TBI left also appeared slightly more reactive than SHAM, but with less intensity. ANOVA revealed significant effects of group (p = 0.0214), hemisphere (p = 0.0368), and interaction (p = 0.0347), and post hoc tests showed TBI right > SHAM right (p = 0.0027) (Figure 8P). These results support a delayed expansion of astrocytic reactivity, potentially indicating secondary spread of inflammation beyond the lesion core.
At day 28, GFAP labeling was visibly bilateral and more diffuse across both TBI hemispheres (Figure 7Q-S). Staining in TBI right remained higher than SHAM, but TBI left now showed almost comparable labeling, particularly at 0–500 µm. This pattern suggests a shift toward chronic, global astrocyte activation. Statistically, only the group effect remained significant (p = 0.024), with no hemisphere or interaction effects, and the paired t-test between TBI right and left was non-significant (Figure 7T). At 500–1000 µm, GFAP signal was low and evenly distributed across groups, and all effects were non-significant (Figure 8Q-T).
3.4. NeuN Staining Reveals Preserved Neuronal Counts
NeuN immunostaining was used to assess neuronal integrity in peri-lesional cortex at 0-500 µm and 500-1000 µm from the injury site across all post-injury timepoints.
Quantitative analysis revealed no significant effects of group, hemisphere, or their interaction at any timepoint (two-way ANOVA, all p > 0.05), indicating that the number of NeuN+ neurons remained stable following TBI (Figure 9 and Figure 10). Visual inspection of NeuN-stained sections supported these findings, with no overt signs of neuronal loss in peri-lesional cortex at any timepoint (Figure 9 and 10). Morphologically, NeuN⁺ neurons displayed preserved somata and dendritic outlines across all groups, with no detectable shrinkage or disorganization compared to SHAM (Supplementary Figure 1J-L). These observations suggest that our focal TBI model did not result in measurable neuronal loss within the sampled regions, despite the presence of sustained gliosis.
4. Discussion
The present study aimed to characterize the spatiotemporal dynamics of gliosis and neuronal preservation following focal TBI in the rat hindlimb sensorimotor cortex. As expected from the aspiration model, neuronal loss was confined to the lesion core, but NeuN labeling also revealed no additional neuronal depletion in the surrounding peri-lesional cortex across all timepoints. In contrast, pronounced and dynamic changes occurred in the astrocytes, microglia and macrophages. Most strikingly, we observed an early contralateral IBA-1⁺ microglial response at day 3, despite the unilateral lesion. This represents a previously unreported systemic microglial response to focal TBI. This was followed by sustained ipsilateral microglial activity and a delayed astrocytic GFAP upregulation that became bihemipsheric by day 28. This pattern indicates a secondary, widespread phase of astrocytic reactivity. Together, these findings demonstrate that focal cortical injury induces temporally distinct but progressively bilateral glial responses without secondary neuronal loss, highlighting glial network plasticity as a key driver of post-traumatic pathology. Interestingly, the early resolution of CD11b despite persistent IBA-1 and GFAP activation strengthens the interpretation that infiltrating macrophages contribute primarily to the acute phase, while resident glia sustain later inflammatory activity.
4.1. Sequential Glial Responses in Focal Cortical Injury
4.1.1. Early Ipsilateral CD11b⁺ Microglia/Macrophage Activation Reflects an Acute, Transient Inflammatory Phase
The early peak in CD11b expression at day 3 after injury most likely reflects an acute inflammatory response involving both resident microglia and infiltrating monocytes/macrophages. CD11b⁺ cells are rapidly recruited to the lesion, where they clear debris and release pro-inflammatory mediators such as IL-1β, TNF-α, and IL-6 [16,17,18]. Similar early CD11b increases have been reported across rodent TBI models: in focal CCI, CD11b⁺ responses accumulate ipsilaterally in peri-lesional regions within the first days [16,19,20], while in LFPI models inflammatory cells are likewise concentrated near the injury site [21]. In our focal aspiration model, we observed a robust ipsilateral increase in CD11b expression at day 3, confined to peri-lesional cortex, with minimal signal, contralaterally or to SHAM. This pattern persisted through days 7-14 but declined and became non-significant by day 21.
Morphologically, CD11b⁺ cells at day 7 displayed irregular, partly stellate shapes with strong perinuclear labeling and less distinct processes - typical features of sub-acutely reactive microglia/macrophages. Comparable transitions from ramified to amoeboid forms have been described in other rodent TBI models [14,19].
Our study did not differentiate between pro- and anti-inflammatory subsets and results reflect total CD11b expression. Prior work shows phenotypic heterogeneity, with pro-inflammatory (CD11b⁺CD86⁺) cells dominating acutely and anti-inflammatory (CD11b⁺CD206⁺) cells emerging around day 7 [16,17,18,19]. Thus, the CD11b peak likely represents a continuum of functional states rather than a uniform population.
Injury severity and sex influence the extent of CD11b elevation. In female rats exposed to severe CCI, macrophage/microglial responses peak at 5–7 days, with anti-inflammatory markers rising around day 5 [18]. In contrast, our male rats showed an earlier, more restricted ipsilateral response resolving within four weeks, consistent with a moderate focal injury and progressive recovery.
Although transient, C-C chemokine receptor type 2+ (CCR2⁺) CD11b⁺ monocytes have been linked to persistent neuroinflammation and worse outcomes, in aged animals [17,22]. In our young adult males, we found no evidence of prolonged infiltration or sustained CD11b expression, which may explain the full resolution.
Taken together, the early CD11b peak most likely reflects the recruitment of CCR2⁺ macrophages together with activated microglia.
4.1.2. Early Bilateral and Sustained IBA-1⁺ Microglial Activation May Reveal Interhemispheric Signaling After Focal TBI
IBA-1 showed a prolonged increase up to day 21, indicating sustained microglial reactivity and gradual changes in functional phenotype. Previous findings from focal models supports this timeline. In CCI models, IBA-1⁺ microglia increase up to day 7 and then decline, although some studies report persistent elevation at day 28 [23,24]. Severe CCI elicits robust IBA-1 expression peaks around one week post-injury [18], and regional differences further influence the duration of microglial responses [25,26]. Our results align with this pattern - IBA-1 was significantly upregulated ipsilaterally at days 7–21 and decreased toward a baseline by day 28, consistent with the subacute profile described in other focal models.
Morphologically, IBA-1⁺ microglia in the ipsilateral cortex, displayed thicker and more prominent processes at day 7, compared to SHAM, consistent with a subacute activated phenotype. Contralaterally, some cells also showed elongated though less pronounced processes. This is in accord with the reported heterogeneity around one-week post-injury, where microglia range from de-ramified “bushy” to amoeboid or rod-like forms depending on region and injury severity [25,27,28]. Our ipsilateral “bushy” morphology and contralateral subtler phenotype fit withing this mixed spectrum of microglial states.
A particularly interesting finding was the early increase of IBA-1 expression at day 3. While occasionally reported in focal CCI models [25,29], such early contralateral involvement is uncommon. The presence of early contralateral response in our model likely reflects both anatomical and methodological factors. The hindlimb sensorimotor cortex, targeted in our aspiration paradigm, is densely interconnected through corticospinal and transcallosal pathways. Such interhemispheric connectivity may facilitate the spread of inflammatory signaling to the contralateral hemisphere, even after a strictly unilateral insult. More severe CCI models may mask these subtler effects, whereas our systematic bilateral quantification increase sensitivity to detecting them. Moreover, recent findings suggests that unilateral cortical injury can trigger widespread neuroimmune responses through interhemispheric and systemic pathways [30], reinforcing the view that focal lesions can exert bilateral consequences.
Importantly, while IBA-1 changes became bihemispheric, CD11b did not, supporting the interpretation that infiltrating macrophages remain confined to areas of BBB disruption, whereas resident microglia respond through interhemispheric or systemic signaling mechanisms.
The bilateral IBA-1 response observed here also aligns with the broader concept of glial network communication, in which microglia and astrocytes engage in reciprocal signaling that shapes both local and distant inflammatory states. Microglia release cytokines such as IL-1α, TNF-α, and C1q, which induce so-called “A1” astrocytes – a neurotoxic, pro-inflammatory phenotype that can impair synapses as well as neuronal survival [31]. In contrast, “A2” astrocytes represent a neuroprotective reparative phenotype, typically promoted by anti-inflammatory mediators such as transforming growth factor beta (TGF-β) and IL-10 released from microglia. Astrocyte-derived ATP, glutamate, IL-6, and S100β can further amplify microglial activation [7]. Thus, within this framework, our early bilateral IBA-1 response, followed by delayed bilateral GFAP upregulation, is consistent with a glia–glia signaling cascade that gradually extends beyond the lesioned hemisphere.
4.1.3. Delayed and Bilateral Astrocytic GFAP Upregulation Marks the Subacute–Chronic Transition After TBI
The GFAP response followed an early-subacute and prolonged course. In focal CCI models, GFAP increases modestly within the first 1–3 days but typically peaks after 4–7 days, reflecting astrocytic activation driven by direct injury signals and sustained microglial reactivity [14,31]. Pericontusional astrocytosis are known to peak within the first week and gradually return toward baseline by day 28, although thalamic reactivity may persist [14]. In diffuse FPI, GFAP upregulation appears earlier and more widespread, often persisting for weeks [32]. Other focal paradigms, including modified or severe CCI, also describe extended astrocytosis into subacute and chronic phases [23,24].
In our focal aspiration model, GFAP expression was minimal at day 3, but increased sharply ipsilaterally by day 7, peaked at day 14, and showed delayed contralateral involvement at day 28. The lack of an early and widespread expression contrasts with diffuse FPI, where GFAP is prominent by 1–3 days and more extensive in distribution [32]. The shift from a lateralized to bilateral pattern— contralateral signal at days 7–14 followed by clear bihemipsheric labeling by day 28 — fits with previous reports that astrocytic activation can spread beyond the lesion core. Morphologically, GFAP⁺ astrocytes in the ipsilateral cortex at day 7 exhibited hypertrophic somata and thickened, elongated processes compared to SHAM, consistent with a reactive phenotype. This is in line with reports from focal CCI models, where peri-lesional astrocytes become hypertrophic and extend thick palisading processes towards the lesion already by 3–7 days post-injury [28,33].
Remote astrocytosis has also been described in interconnected regions such as thalamus weeks after injury [14], and human post-mortem data show a survival-time–dependent increase in GFAP expression [34]. Clinical imaging supports long-lasting widespread glial activation in patients [35]. Recent work implicates Janus kinase/signal transducer and activator of transcription (JAK/STAT) - particularly STAT3 - signaling in astrocytic plasticity and glial-scar formation after CNS injury [30].
Variability between studies likely reflects differences in injury model, severity, and analysis. Moderate aspiration produces less edema and scarring than severe CCI, producing a milder GFAP response [18,23,24]. The hindlimb motor cortex’s strong interhemispheric connectivity may facilitate contralateral activation, and bilateral quantification enhances detection of subtle effects. Biological factors such as strain, age, and baseline inflammation further modulate glial dynamics.
Functionally, the trajectory we observed – initial ipsilateral rise followed by delayed bilateral involvement - suggests a dual role. Early astrocytosis near the lesion likely supports stabilization, metabolic support and scar formation, whereas persistence into later subacute and chronic phases may promote maladaptive remodeling and gliosis [36,37,38]. These dynamics parallel the progression from primary to secondary injury: initial mechanical damage followed by oxidative stress, BBB disruption, and sterile inflammation [36]. CD11b⁺ macrophages infiltrate the cortex within 24 hours [19], while astrocytic GFAP upregulation emerges later in the subacute phases [14,39]. Sterile inflammation is initiated by DAMPs such as high mobility group box 1 (HMGB1), ATP, and extracellular DNA, which activate pattern recognition receptors including toll-like receptors and NOD-, LRR- and pyrin domain-containing protein 3 (NLRP3) inflammasomes in glia cells. This leads to NF-κβ- and JAK/STAT-dependent signaling that amplifies cytokine release and sustain glial reactivity [7,36,40]. Consistent with this, microglia can maintain inflammatory signatures into the chronic phase [29].
Our timeline - early CD11b recruitment, sustained IBA-1 elevation, and delayed GFAP upregulation - reflects the sequential progression of secondary injury cascades. Importantly, the late bilateral GFAP response indicates that astrocytes contribute to the later and more widespread inflammatory milieu, after microglial responses begin to subside.
4.1.4. Stable NeuN Expression Indicates Preserved Peri-Lesional Neurons Despite Glial Activation
NeuN expression remained stable across all timepoints, indicating preserved neuronal density in the pericontusional cortex. Morphologically, NeuN⁺ neurons appeared intact, with well-preserved somata and dendritic outlines across groups, and no overt shrinkage or disorganization compared to SHAM. This agrees with previous findings that moderate focal injury can maintain cortical NeuN⁺ cell numbers despite reactive glial cells and that reduced NeuN immunoreactivity does not necessarily indicate neuronal death but may reflect reversible protein modulation [41,42].
Similar results have been reported in models where cortical NeuN⁺ populations remained intact while hippocampal neurons - particularly newborn dentate granule cells - were more vulnerable following CCI [43,44]. In contrast, severe CCI causes significant NeuN loss in hippocampus and cortex [45,46], and lesions of sensory or visual cortex also produce local neuronal loss [26,47]. Diffuse injuries show even broader NeuN vulnerability, with reduced staining across cortical and hippocampal regions [46,48]. These differences likely reflect injury severity and anatomical location, which may explain the absence of neuronal degeneration in our peri-motor cortex model.
It is important to note that NeuN does not capture all aspects of neuronal integrity. Axonal injury can occur independently of NeuN loss, and in some models axonal disconnection is even more extensive than neuronal soma degeneration [41,46]. Thus, preserved NeuN staining does not preclude functional impairment.
Overall, our results align with other moderate severity focal models that show stable peri-lesional neuronal counts. At the same time, differences compared to severe focal or diffuse injury paradigms highlight the importance of injury type, severity, and anatomical location in determining neuronal outcomes.
4.2. Neuroinflammation, Neuroendocrine Modulation, and Motor Deficits After TBI
Although the primary motor impairments following TBI result from disruption of the corticospinal projections between the motor cortex and spinal cord, accumulating evidence indicates that neuroinflammation serves as a critical secondary driver of functional deficits. Rodent studies show a causal link, as pharmacological or genetic suppression of inflammatory pathways improves recovery. In CCI models, inhibition of microglia with minocycline improves functional outcome, and blockade of the NLRP3 inflammasome enhances recovery [40,49]. In addition, neutralization of TNF-α or IL-1 after FPI reduces neurological deficits and tissue damage [50,51]. NLRP3 inhibition has also been linked to improved cognitive and motor recovery in other TBI paradigms [40]. Review data further emphasizes the contribution of microglia and cytokine signaling to secondary damage after TBI [52,53]. Similar effects are reported in closed-head injury, where IL-6 antibody treatment abolishes rotarod deficits and IL-1R1 knockout confers long-term behavioral protection [51,54]. Even cortical aspiration lesions, although less studied, produce robust glial responses that parallels forelimb impairments [55].
Within this context, our results show a temporally and spatially distinct sequence of glial changes that match the motor deficits described in the same animals [6]. The sharply lateralized CD11b response at day 3 coincided with early contralateral hindlimb asymmetry, consistent with hemisphere-specific macrophage infiltration and acute inflammation. Sustained ipsilateral IBA-1 activation through day 21 reflected prolonged microglial reactivity, which may contribute to maladaptive circuit stabilization. By day 28, bilateral GFAP upregulation paralleled the spread of motor deficits beyond simple asymmetry, indicating that astrocytic responses contribute to later and more global dysfunction. NeuN counts remained stable across all timepoints, supporting the view that motor impairments arise from glial-mediated network changes rather than neuronal loss.
An important observation is that only IBA-1 and GFAP extended bilaterally, while CD11b remained unilateral. This suggests that infiltrating macrophages are spatially restricted, whereas microglia and astrocytes can engage in across-hemispheric, or systemic signaling. Consistent with this interpretation, our group has previously demonstrated that focal TBI induces bilateral remodeling of the hindlimb muscle extracellular matrix, with disruption of basement-membrane organization and increased deposition of laminin and collagen IV in both limbs, despite the unilateral cortical insult [56]. These findings further support the idea that unilateral brain injury can evoke body-wide changes encompassing both central and peripheral tissues.
Neuroendocrine modulation may offer an additional explanation. Cortical injury alters hypothalamic–pituitary output, and hormones such as vasopressin (AVP), oxytocin (OXT), β-endorphin, and glucocorticoids regulate both inflammatory cascades and behavioal outcome [57,58,59,60,61]. AVP contributes to post-traumatic edema and BBB dysfunction, and deficiency of AVP receptors reduces secondary injury [57,58,62]. In contrast, OXT dampens pyroptosis and acute neuroinflammation [63,64]. Rodent TBI studies directly connect these hormonal changes to motor function. In line with previous work from our group and collaborators, unilateral motor cortex ablation was shown to impair contralateral posture and locomotion via pituitary-dependent signaling and asymmetric glial responsiveness [59,65,66]. CCI-induced hypothalamic activation has been shown to sustain long-term motor deficits through endocrine-driven neuroimmune reorganization [60,61]. Chronic corticosterone exposure further worsens behavioral impairments, emphasizing the role of hypothalamic–pituitary–adrenal axis dysfunction [60,61].
The systemic influence of neurohormones provides a plausible explanation for why bilateral glial changes was observed only for IBA-1 and GFAP in our study. Pituitary-derived signals can modulate both microglia and astrocytes [65,67], linking focal cortical damage to widespread glial reactions. This framework suggests that the motor deficits in our rats reflect not only local cortical injury but also hormone-driven modulation of glial cascades. Neuroendocrine–immune crosstalk may therefore be a key factor in the persistence and bilateralization of motor asymmetries after TBI.
Finally, the early bilateral IBA-1 increase may help explain previously observed early contralateral motor asymmetry in the same animals, indicating that microglial engagement could precede and contribute to functional impairment even before astrocytic activation becomes bihemispheric.
4.3. Limitations
This study has some limitations, including relatively small group sizes for several markers and methodological variability due to different operators performing labeling and imaging. Quantification was restricted to peri-lesional cortex and based on percentage area of DAB signal, which limits resolution of glial subtypes and does not capture pathological changes of axons or synapses in the target areas.
5. Conclusions
In this study, we demonstrate that a highly focal aspiration injury triggers a coordinated but distinctly timed glial response in the rat hindlimb sensorimotor cortex. The early reaction was dominated by an ipsilateral CD11b⁺ microglia/macrophage response, followed by a sustained IBA-1⁺ microglial activation that expanded bilaterally from day 3. Astrocytic GFAP upregulation emerged later and also became bilateral by day 28. Importantly, these pronounced glial changes occurred without evidence of secondary neuronal loss.
A key finding is that only resident glial markers (IBA-1 and GFAP), but not the macrophage-associated marker CD11b, extended to the contralateral hemisphere. This, in turn, indicate that microglia and astrocytes—rather than infiltrating macrophages—drive the broader, network-level consequences of focal cortical injury.
The temporal progression from acute CD11b elevation to later glial activation mirrored the motor deficits observed in the same animals, supporting a link between glial dynamics and functional impairment. Systemic components such as hypothalamic–pituitary signaling may further contribute to the bilateral nature of this response.
Overall, our results show that even highly localized cortical damage can induce widespread, stage-dependent glial activation with functional consequences, underscoring neuroinflammation as a central determinant of motor outcome after TBI.
Supplementary Materials
The following supporting information can be downloaded at the website of this paper posted on Preprints.org, Figure S1: Glial and neuronal morphology at 0–500 µm reveals reactive phenotypes in peri-lesional cortex; Table S1: Primary and secondary antibodies used for IHC; Table S2: Analysis parameters for quantification in ImageJ; Table S3: Overview of experimental groups and animal numbers at each timepoint.
Author Contributions
Conceptualization, M.Z.; methodology, K.K.R. and M.Z.; software, S.H. and K.K.R.; validation, K.K.R., S.H. and M.Z.; formal analysis, K.K.R. and S.H.; investigation, M.S.A., K.K.R, L.B.H., A.S.M., N.G., T.C.M. and S.H.; data curation, K.K.R and S.H.; writing—original draft preparation, K.K.R and S.H.; writing—review and editing, S.H., K.K.R., M.Z. and Å.F.S.; visualization, K.K.R and S.H; resources, supervision, project administration, and funding acquisition, M.Z. All authors have read and agreed to the published version of the manuscript.
Funding
This research was funded by the Novo Nordisk Foundation, grant number NNF20OC0065099 and the Elssa Foundation, grant number 24-B01-0592.
Institutional Review Board Statement
The study was approved by the Animal Experiments Inspectorate, Denmark (70-15-0201-0015, approved on 8 July 2019).
Informed Consent Statement
Not applicable.
Data Availability Statement
The data presented in this study are available on request from the corresponding author.
Acknowledgments
We are grateful to Anne-Mette Florence Durand, Charlotte Laurfelt Munch Rasmussen, and Stefanie Hansborg Kolstrup from the biomedical laboratory at the University of Southern Denmark for their support and advice for the animal experiments. During the preparation of this manuscript, the authors used BioRender Premium for the purposes of generating illustrations. The authors have reviewed and edited the output and take full responsibility for the content of this publication. Graphical abstract: Created in BioRender. Hjæresen, S. (2025) (https://BioRender.com/awdiys6).
Conflicts of Interest
The authors declare no conflict of interest. The funders had no role in the design of the study; in the collection, analyses, or interpretation of data; in the writing of the manuscript, or in the decision to publish the results.
Abbreviations
The following abbreviations are used in this manuscript:
| TBI | Traumatic brain injury |
| BBB | Blood-brain barrier |
| HL-PA | Hindlimb postural asymmetry |
| DAMP | Damage-associated molecular pattern |
| NF-кβ | Nuclear factor kappa-light-chain-enhancer of activated B cells |
| IL | Interleukins |
| TNF-α | Tumor necrosis factor alpha |
| FPI | Fluid percussion injury |
| GFAP | Glial fibrillary acidic protein |
| CCI | Controlled cortical impact |
| CD11b | Cluster of differentiation 11b |
| IBA-1 | Ionized calcium-binding adapter molecule 1 |
| i.p. | Intraperitoneally |
| PBS | Phosphate-buffered saline |
| NeuN | Nonal nuclei |
| BSA | Bovine serum albumin |
| NGS | Normal goat serum |
| RT | Room temperature |
| DAB | 3,3’-diaminobenzidine |
| LFPI | Lateral fluid percussion injury |
| CCR2 | C-C chemokine receptor type 2 |
| TGF-β | Transforming growth factor beta |
| JAK | Janus kinase |
| STAT | Signal transducer and activator of transcription |
| HMGB1 | High mobility group box 1 |
| NLRP3 | NOD-, LRR- and pyrin domain-containing protein 3 |
| AVP | Vasopressin |
| OXT | Oxytocin |
References
- Obasa, A.A.; Olopade, F.E.; Juliano, S.L.; Olopade, J.O. Traumatic brain injury or traumatic brain disease: A scientific commentary. Brain Multiphysics 2024, 6, 100092. [Google Scholar] [CrossRef]
- Dewan, M.C.; Rattani, A.; Gupta, S.; Baticulon, R.E.; Hung, Y.C.; Punchak, M.; Agrawal, A.; Adeleye, A.O.; Shrime, M.G.; Rubiano, A.M.; et al. Estimating the global incidence of traumatic brain injury. J Neurosurg 2019, 130, 1080–1097. [Google Scholar] [CrossRef] [PubMed]
- Wu, J.; Ren, R.; Chen, T.; Su, L.D.; Tang, T. Neuroimmune and neuroinflammation response for traumatic brain injury. Brain Research Bulletin 2024, 217. [Google Scholar] [CrossRef]
- Michinaga, S.; Koyama, Y. Pathophysiological responses and roles of astrocytes in traumatic brain injury. International Journal of Molecular Sciences 2021, 22. [Google Scholar] [CrossRef]
- Corrigan, F.; Wee, I.C.; Collins-Praino, L.E. Chronic motor performance following different traumatic brain injury severity-A systematic review.
- Andersen, M.S.; Güler, D.B.; Larsen, J.; Rich, K.K.; Svenningsen Å, F.; Zhang, M. The Development of Hindlimb Postural Asymmetry Induced by Focal Traumatic Brain Injury Is Not Related to Serotonin 2A/C Receptor Expression in the Spinal Cord. Int J Mol Sci 2022, 23. [Google Scholar] [CrossRef]
- Amlerova, Z.; Chmelova, M.; Anderova, M.; Vargova, L. Reactive gliosis in traumatic brain injury: a comprehensive review. Frontiers in Cellular Neuroscience 2024, 18. [Google Scholar] [CrossRef]
- Fesharaki-Zadeh, A.; Datta, D. An overview of preclinical models of traumatic brain injury (TBI): relevance to pathophysiological mechanisms. Frontiers in Cellular Neuroscience 2024, 18. [Google Scholar] [CrossRef]
- Zhang, M.; Watanabe, H.; Sarkisyan, D.; Andersen, M.S.; Nosova, O.; Galatenko, V.; Carvalho, L.; Lukoyanov, N.; Thelin, J.; Schouenborg, J.; et al. Hindlimb motor responses to unilateral brain injury: spinal cord encoding and left-right asymmetry. Brain Commun 2020, 2, fcaa055. [Google Scholar] [CrossRef]
- Lee, Y.B.; Nagai, A.; Kim, S.U. Cytokines, chemokines, and cytokine receptors in human microglia. Journal of Neuroscience Research 2002, 69, 94–103. [Google Scholar] [CrossRef]
- Imai, Y.; Ibata, I.; Ito, D.; Ohsawa, K.; Kohsaka, S. A Novel Gene iba1 in the Major Histocompatibility Complex Class III Region Encoding an EF Hand Protein Expressed in a Monocytic Lineage 1; 1996; pp. 855–862.
- Ito, D.; Imai, Y.; Ohsawa, K.; Nakajima, K.; Fukuuchi, Y.; Kohsaka, S. Microglia-specific localisation of a novel calcium binding protein, Iba1; pp. 1998–1999.
- Zhao, J.Y.; Zhou, Y.; Zhou, C.W.; Zhan, K.B.; Yang, M.; Wen, M.; Zhu, L.Q. Revisiting the critical roles of reactive microglia in traumatic brain injury. International Journal of Surgery 2025, 111, 3942–3978. [Google Scholar] [CrossRef]
- Chen, S.; Pickard, J.D.; Harris, N.G. Time course of cellular pathology after controlled cortical impact injury. Experimental Neurology 2003, 182, 87–102. [Google Scholar] [CrossRef]
- Mullen, R.J.; Buck, C.R.; Smith, A.M. NeuN, a neuronal specific nuclear protein in vertebrates. Development 1992, 116, 201–211. [Google Scholar] [CrossRef]
- Hsieh, C.L.; Kim, C.C.; Ryba, B.E.; Niemi, E.C.; Bando, J.K.; Locksley, R.M.; Liu, J.; Nakamura, M.C.; Seaman, W.E. Traumatic brain injury induces macrophage subsets in the brain. European Journal of Immunology 2013, 43, 2010–2022. [Google Scholar] [CrossRef]
- Morganti, J.M.; Jopson, T.D.; Liu, S.; Riparip, L.K.; Guandique, C.K.; Gupta, N.; Ferguson, A.R.; Rosi, S. CCR2 antagonism alters brain macrophage polarization and ameliorates cognitive dysfunction induced by traumatic brain injury. Journal of Neuroscience 2015, 35, 748–760. [Google Scholar] [CrossRef]
- Turtzo, L.C.; Lescher, J.; Janes, L.; Dean, D.D.; Budde, M.D.; Frank, J.A. Macrophagic and microglial responses after focal traumatic brain injury in the female rat. Journal of Neuroinflammation 2014, 11. [Google Scholar] [CrossRef]
- Jin, X.; Ishii, H.; Bai, Z.; Itokazu, T.; Yamashita, T. Temporal changes in cell marker expression and cellular infiltration in a controlled cortical impact model in adult male C57BL/6 mice. PLoS ONE 2012, 7. [Google Scholar] [CrossRef]
- Hsieh, C.L.; Niemi, E.C.; Wang, S.H.; Lee, C.C.; Bingham, D.; Zhang, J.; Cozen, M.L.; Charo, I.; Huang, E.J.; Liu, J.; et al. CCR2 deficiency impairs macrophage infiltration and improves cognitive function after traumatic brain injury. Journal of Neurotrauma 2014, 31, 1677–1688. [Google Scholar] [CrossRef]
- Gyoneva, S.; Kim, D.; Katsumoto, A.; Kokiko-Cochran, O.N.; Lamb, B.T.; Ransohoff, R.M. Ccr2 deletion dissociates cavity size and tau pathology after mild traumatic brain injury. Journal of Neuroinflammation 2015, 12. [Google Scholar] [CrossRef]
- Chou, A.; Krukowski, K.; Morganti, J.M.; Riparip, L.K.; Rosi, S. Persistent infiltration and impaired response of peripherally-derived monocytes after traumatic brain injury in the aged brain. International Journal of Molecular Sciences 2018, 19. [Google Scholar] [CrossRef]
- Elliott, M.B.; Oshinsky, M.L.; Amenta, P.S.; Awe, O.O.; Jallo, J.I. Nociceptive neuropeptide increases and periorbital allodynia in a model of traumatic brain injury. Headache 2012, 52, 966–984. [Google Scholar] [CrossRef]
- Kim, D.; Hwang, J.; Yoo, J.; Choi, J.; Ramalingam, M.; Kim, S.; Cho, H.H.; Kim, B.C.; Jeong, H.S.; Jang, S. The time-dependent changes in a mouse model of traumatic brain injury with motor dysfunction. PLoS ONE 2024, 19. [Google Scholar] [CrossRef]
- Caplan, H.W.; Cardenas, F.; Gudenkauf, F.; Zelnick, P.; Xue, H.; Cox, C.S.; Bedi, S.S. Spatiotemporal Distribution of Microglia After Traumatic Brain Injury in Male Mice. ASN Neuro 2020, 12, 1759091420911770. [Google Scholar] [CrossRef]
- Frankowski, J.C.; Foik, A.T.; Tierno, A.; Machhor, J.R.; Lyon, D.C.; Hunt, R.F. Traumatic brain injury to primary visual cortex produces long-lasting circuit dysfunction. Communications Biology 2021, 4. [Google Scholar] [CrossRef]
- Morrison, H.; Young, K.; Qureshi, M.; Rowe, R.K.; Lifshitz, J. Quantitative microglia analyses reveal diverse morphologic responses in the rat cortex after diffuse brain injury. Sci Rep 2017, 7, 13211. [Google Scholar] [CrossRef] [PubMed]
- Villapol, S.; Byrnes, K.R.; Symes, A.J. Temporal dynamics of cerebral blood flow, cortical damage, apoptosis, astrocyte-vasculature interaction and astrogliosis in the pericontusional region after traumatic brain injury. Front Neurol 2014, 5, 82. [Google Scholar] [CrossRef]
- Izzy, S.; Liu, Q.; Fang, Z.; Lule, S.; Wu, L.; Chung, J.Y.; Sarro-Schwartz, A.; Brown-Whalen, A.; Perner, C.; Hickman, S.E.; et al. Time-Dependent Changes in Microglia Transcriptional Networks Following Traumatic Brain Injury. Frontiers in Cellular Neuroscience 2019, 13. [Google Scholar] [CrossRef]
- Liao, X.; Xu, X.; Li, M.; Tian, R.; Zhuang, Y.; Gao, G. Contralateral Structure and Molecular Response to Severe Unilateral Brain Injury. Brain Sci 2025, 15. [Google Scholar] [CrossRef]
- Liddelow, S.A.; Guttenplan, K.A.; Clarke, L.E.; Bennett, F.C.; Bohlen, C.J.; Schirmer, L.; Bennett, M.L.; Münch, A.E.; Chung, W.S.; Peterson, T.C.; et al. Neurotoxic reactive astrocytes are induced by activated microglia. Nature 2017, 541, 481–487. [Google Scholar] [CrossRef]
- Dietrich, W.D.; Truettner, J.; Zhao, W.; Alonso, O.F.; Busto, R.; Ginsberg, M.D. Sequential changes in glial fibrillary acidic protein and gene expression following parasagittal fluid-percussion brain injury in rats. J Neurotrauma 1999, 16, 567–581. [Google Scholar] [CrossRef]
- Cheng, X.; Wang, J.; Sun, X.; Shao, L.; Guo, Z.; Li, Y. Morphological and functional alterations of astrocytes responding to traumatic brain injury. J Integr Neurosci 2019, 18, 203–215. [Google Scholar] [CrossRef]
- Trautz, F.; Franke, H.; Bohnert, S.; Hammer, N.; Müller, W.; Stassart, R.; Tse, R.; Zwirner, J.; Dreßler, J.; Ondruschka, B. Survival-time dependent increase in neuronal IL-6 and astroglial GFAP expression in fatally injured human brain tissue. Scientific Reports 2019, 9. [Google Scholar] [CrossRef] [PubMed]
- Ramlackhansingh, A.F.; Brooks, D.J.; Greenwood, R.J.; Bose, S.K.; Turkheimer, F.E.; Kinnunen, K.M.; Gentleman, S.; Heckemann, R.A.; Gunanayagam, K.; Gelosa, G.; et al. Inflammation after trauma: microglial activation and traumatic brain injury. Ann Neurol 2011, 70, 374–383. [Google Scholar] [CrossRef] [PubMed]
- Burda, J.E.; Bernstein, A.M.; Sofroniew, M.V. Astrocyte roles in traumatic brain injury. Exp Neurol 2016, 275 Pt 3, 305–315. [Google Scholar] [CrossRef]
- Jayakumar, A.R.; Tong, X.Y.; Ruiz-Cordero, R.; Bregy, A.; Bethea, J.R.; Bramlett, H.M.; Norenberg, M.D. Activation of NF-κB mediates astrocyte swelling and brain edema in traumatic brain injury. Journal of Neurotrauma 2014, 31, 1249–1257. [Google Scholar] [CrossRef]
- Zhang, Y.; Wu, F.; Iqbal, K.; Gong, C.X.; Hu, W.; Liu, F. Subacute to chronic Alzheimer-like alterations after controlled cortical impact in human tau transgenic mice. Scientific Reports 2019, 9. [Google Scholar] [CrossRef]
- Mukherjee, S.; Zeitouni, S.; Cavarsan, C.F.; Shapiro, L.A. Increased seizure susceptibility in mice 30 days after fluid percussion injury. Frontiers in Neurology 2013, 4 MAR. [Google Scholar] [CrossRef]
- Xu, X.; Yin, D.; Ren, H.; Gao, W.; Li, F.; Sun, D.; Wu, Y.; Zhou, S.; Lyu, L.; Yang, M.; et al. Selective NLRP3 inflammasome inhibitor reduces neuroinflammation and improves long-term neurological outcomes in a murine model of traumatic brain injury. Neurobiol Dis 2018, 117, 15–27. [Google Scholar] [CrossRef]
- Hernandez, M.L.; Chatlos, T.; Gorse, K.M.; Lafrenaye, A.D. Neuronal Membrane Disruption Occurs Late Following Diffuse Brain Trauma in Rats and Involves a Subpopulation of NeuN Negative Cortical Neurons. Frontiers in Neurology 2019, 10. [Google Scholar] [CrossRef]
- Munoz-Ballester, C.; Mahmutovic, D.; Rafiqzad, Y.; Korot, A.; Robel, S. Mild Traumatic Brain Injury-Induced Disruption of the Blood-Brain Barrier Triggers an Atypical Neuronal Response. Frontiers in Cellular Neuroscience 2022, 16. [Google Scholar] [CrossRef] [PubMed]
- Gao, X.; Deng-Bryant, Y.; Cho, W.; Carrico, K.M.; Hall, E.D.; Chen, J. Selective death of newborn neurons in hippocampal dentate gyrus following moderate experimental traumatic brain injury. Journal of Neuroscience Research 2008, 86, 2258–2270. [Google Scholar] [CrossRef]
- Madathil, S.K.; Carlson, S.W.; Brelsfoard, J.M.; Ye, P.; D’Ercole, A.J.; Saatman, K.E. Astrocyte-Specific Overexpression of Insulin-Like Growth Factor-1 Protects Hippocampal Neurons and Reduces Behavioral Deficits following Traumatic Brain Injury in Mice. PLoS ONE 2013, 8. [Google Scholar] [CrossRef]
- Liu, S.; Jin, R.; Xiao, A.Y.; Chen, R.; Li, J.; Zhong, W.; Feng, X.; Li, G. Induction of Neuronal PI3Kγ Contributes to Endoplasmic Reticulum Stress and Long-Term Functional Impairment in a Murine Model of Traumatic Brain Injury. Neurotherapeutics 2019, 16, 1320–1334. [Google Scholar] [CrossRef]
- Hall, E.D.; Bryant, Y.D.; Cho, W.; Sullivan, P.G. Evolution of post-traumatic neurodegeneration after controlled cortical impact traumatic brain injury in mice and rats as assessed by the de Olmos silver and fluorojade staining methods. J Neurotrauma 2008, 25, 235–247. [Google Scholar] [CrossRef]
- Fox, G.B.; Fan, L.; Levasseur, R.A.; Faden, A.I. Sustained sensory/motor and cognitive deficits with neuronal apoptosis following controlled cortical impact brain injury in the mouse. J Neurotrauma 1998, 15, 599–614. [Google Scholar] [CrossRef]
- Hall, E.D.; Sullivan, P.G.; Gibson, T.R.; Pavel, K.M.; Thompson, B.M.; Scheff, S.W. Spatial and temporal characteristics of neurodegeneration after controlled cortical impact in mice: more than a focal brain injury. J Neurotrauma 2005, 22, 252–265. [Google Scholar] [CrossRef] [PubMed]
- He, J.; Mao, J.; Hou, L.; Jin, S.; Wang, X.; Ding, Z.; Jin, Z.; Guo, H.; Dai, R. Minocycline attenuates neuronal apoptosis and improves motor function after traumatic brain injury in rats. Exp Anim 2021, 70, 563–569. [Google Scholar] [CrossRef] [PubMed]
- Rowe, R.K.; Harrison, J.L.; Zhang, H.; Bachstetter, A.D.; Hesson, D.P.; O’Hara, B.F.; Greene, M.I.; Lifshitz, J. Novel TNF receptor-1 inhibitors identified as potential therapeutic candidates for traumatic brain injury. J Neuroinflammation 2018, 15, 154. [Google Scholar] [CrossRef] [PubMed]
- Vincent, J.C.; Garnett, C.N.; Watson, J.B.; Higgins, E.K.; Macheda, T.; Sanders, L.; Roberts, K.N.; Shahidehpour, R.K.; Blalock, E.M.; Quan, N.; et al. IL-1R1 signaling in TBI: assessing chronic impacts and neuroinflammatory dynamics in a mouse model of mild closed-head injury. J Neuroinflammation 2023, 20, 248. [Google Scholar] [CrossRef]
- Parker, K.N.; Donovan, M.H.; Smith, K.; Noble-Haeusslein, L.J. Traumatic Injury to the Developing Brain: Emerging Relationship to Early Life Stress. Front Neurol 2021, 12, 708800. [Google Scholar] [CrossRef]
- He, K.L.; Yu, X.; Xia, L.; Xie, Y.D.; Qi, E.B.; Wan, L.; Hua, X.M.; Jing, C.H. A new perspective on the regulation of neuroinflammation in intracerebral hemorrhage: mechanisms of NLRP3 inflammasome activation and therapeutic strategies. Front Immunol 2025, 16, 1526786. [Google Scholar] [CrossRef]
- Yang, S.H.; Gangidine, M.; Pritts, T.A.; Goodman, M.D.; Lentsch, A.B. Interleukin 6 mediates neuroinflammation and motor coordination deficits after mild traumatic brain injury and brief hypoxia in mice. Shock 2013, 40, 471–475. [Google Scholar] [CrossRef] [PubMed]
- Napieralski, J.A.; Banks, R.J.; Chesselet, M.F. Motor and somatosensory deficits following uni- and bilateral lesions of the cortex induced by aspiration or thermocoagulation in the adult rat. Exp Neurol 1998, 154, 80–88. [Google Scholar] [CrossRef] [PubMed]
- Kristensen, M.A.; Rich, K.K.; Mogensen, T.C.; Damsgaard Jensen, A.M.; Fex Svenningsen, Å.; Zhang, M. Focal Traumatic Brain Injury Impairs the Integrity of the Basement Membrane of Hindlimb Muscle Fibers Revealed by Extracellular Matrix Immunoreactivity. Life (Basel) 2024, 14. [Google Scholar] [CrossRef]
- Szmydynger-Chodobska, J.; Chung, I.; Koźniewska, E.; Tran, B.; Harrington, F.J.; Duncan, J.A.; Chodobski, A. Increased expression of vasopressin v1a receptors after traumatic brain injury. J Neurotrauma 2004, 21, 1090–1102. [Google Scholar] [CrossRef]
- Szmydynger-Chodobska, J.; Fox, L.M.; Lynch, K.M.; Zink, B.J.; Chodobski, A. Vasopressin amplifies the production of proinflammatory mediators in traumatic brain injury. J Neurotrauma 2010, 27, 1449–1461. [Google Scholar] [CrossRef]
- Lukoyanov, N.; Watanabe, H.; Carvalho, L.S.; Kononenko, O.; Sarkisyan, D.; Zhang, M.; Andersen, M.S.; Lukoyanova, E.A.; Galatenko, V.; Tonevitsky, A.; et al. Left-right side-specific endocrine signaling complements neural pathways to mediate acute asymmetric effects of brain injury. Elife 2021, 10. [Google Scholar] [CrossRef]
- Taylor, A.N.; Rahman, S.U.; Tio, D.L.; Sanders, M.J.; Bando, J.K.; Truong, A.H.; Prolo, P. Lasting neuroendocrine-immune effects of traumatic brain injury in rats. J Neurotrauma 2006, 23, 1802–1813. [Google Scholar] [CrossRef]
- Taylor, A.N.; Rahman, S.U.; Sanders, N.C.; Tio, D.L.; Prolo, P.; Sutton, R.L. Injury severity differentially affects short- and long-term neuroendocrine outcomes of traumatic brain injury. J Neurotrauma 2008, 25, 311–323. [Google Scholar] [CrossRef]
- Viñuela-Berni, V.; Gómez-González, B.; Quintanar-Stephano, A. Blockade of Arginine Vasopressin receptors prevents blood-brain barrier breakdown in Experimental Autoimmune Encephalomyelitis. Sci Rep 2020, 10, 467. [Google Scholar] [CrossRef] [PubMed]
- Yang, M.; Deng, S.; Jiang, J.; Tian, M.; Xiao, L.; Gong, Y. Oxytocin Improves Intracerebral Hemorrhage Outcomes by Suppressing Neuronal Pyroptosis and Mitochondrial Fission. Stroke 2023, 54, 1888–1900. [Google Scholar] [CrossRef]
- Yuan, L.; Liu, S.; Bai, X.; Gao, Y.; Liu, G.; Wang, X.; Liu, D.; Li, T.; Hao, A.; Wang, Z. Oxytocin inhibits lipopolysaccharide-induced inflammation in microglial cells and attenuates microglial activation in lipopolysaccharide-treated mice. J Neuroinflammation 2016, 13, 77. [Google Scholar] [CrossRef] [PubMed]
- Watanabe, H.; Kobikov, Y.; Nosova, O.; Sarkisyan, D.; Galatenko, V.; Carvalho, L.; Maia, G.H.; Lukoyanov, N.; Lavrov, I.; Ossipov, M.H.; et al. The Left-Right Side-Specific Neuroendocrine Signaling from Injured Brain: An Organizational Principle. Function (Oxf) 2024, 5. [Google Scholar] [CrossRef]
- Watanabe, H.; Nosova, O.; Sarkisyan, D.; Storm Andersen, M.; Carvalho, L.; Galatenko, V.; Bazov, I.; Lukoyanov, N.; Maia, G.H.; Hallberg, M.; et al. Left-Right Side-Specific Neuropeptide Mechanism Mediates Contralateral Responses to a Unilateral Brain Injury. eNeuro 2021, 8. [Google Scholar] [CrossRef] [PubMed]
- Brown, C.H. Magnocellular Neurons and Posterior Pituitary Function. Compr Physiol 2016, 6, 1701–1741. [Google Scholar] [CrossRef] [PubMed]
Figure 1.
Standardized regions of interest. Representative NeuN-stained section from a TBI rat at day 7 post-injury illustrating the standardized regions of interest for quantification in the TBI-affected (right) and contralateral (left) sensorimotor cortex. Red boxes indicate sampling sites in the lesioned hemisphere (0–500 µm from the lesion edge: dark red; 500–1000 µm: light red), while green boxes indicate contralateral sites (0–500 µm: dark green; 500–1000 µm: light green). Scale bars: 500 µm (overview) and 50 µm (insets).
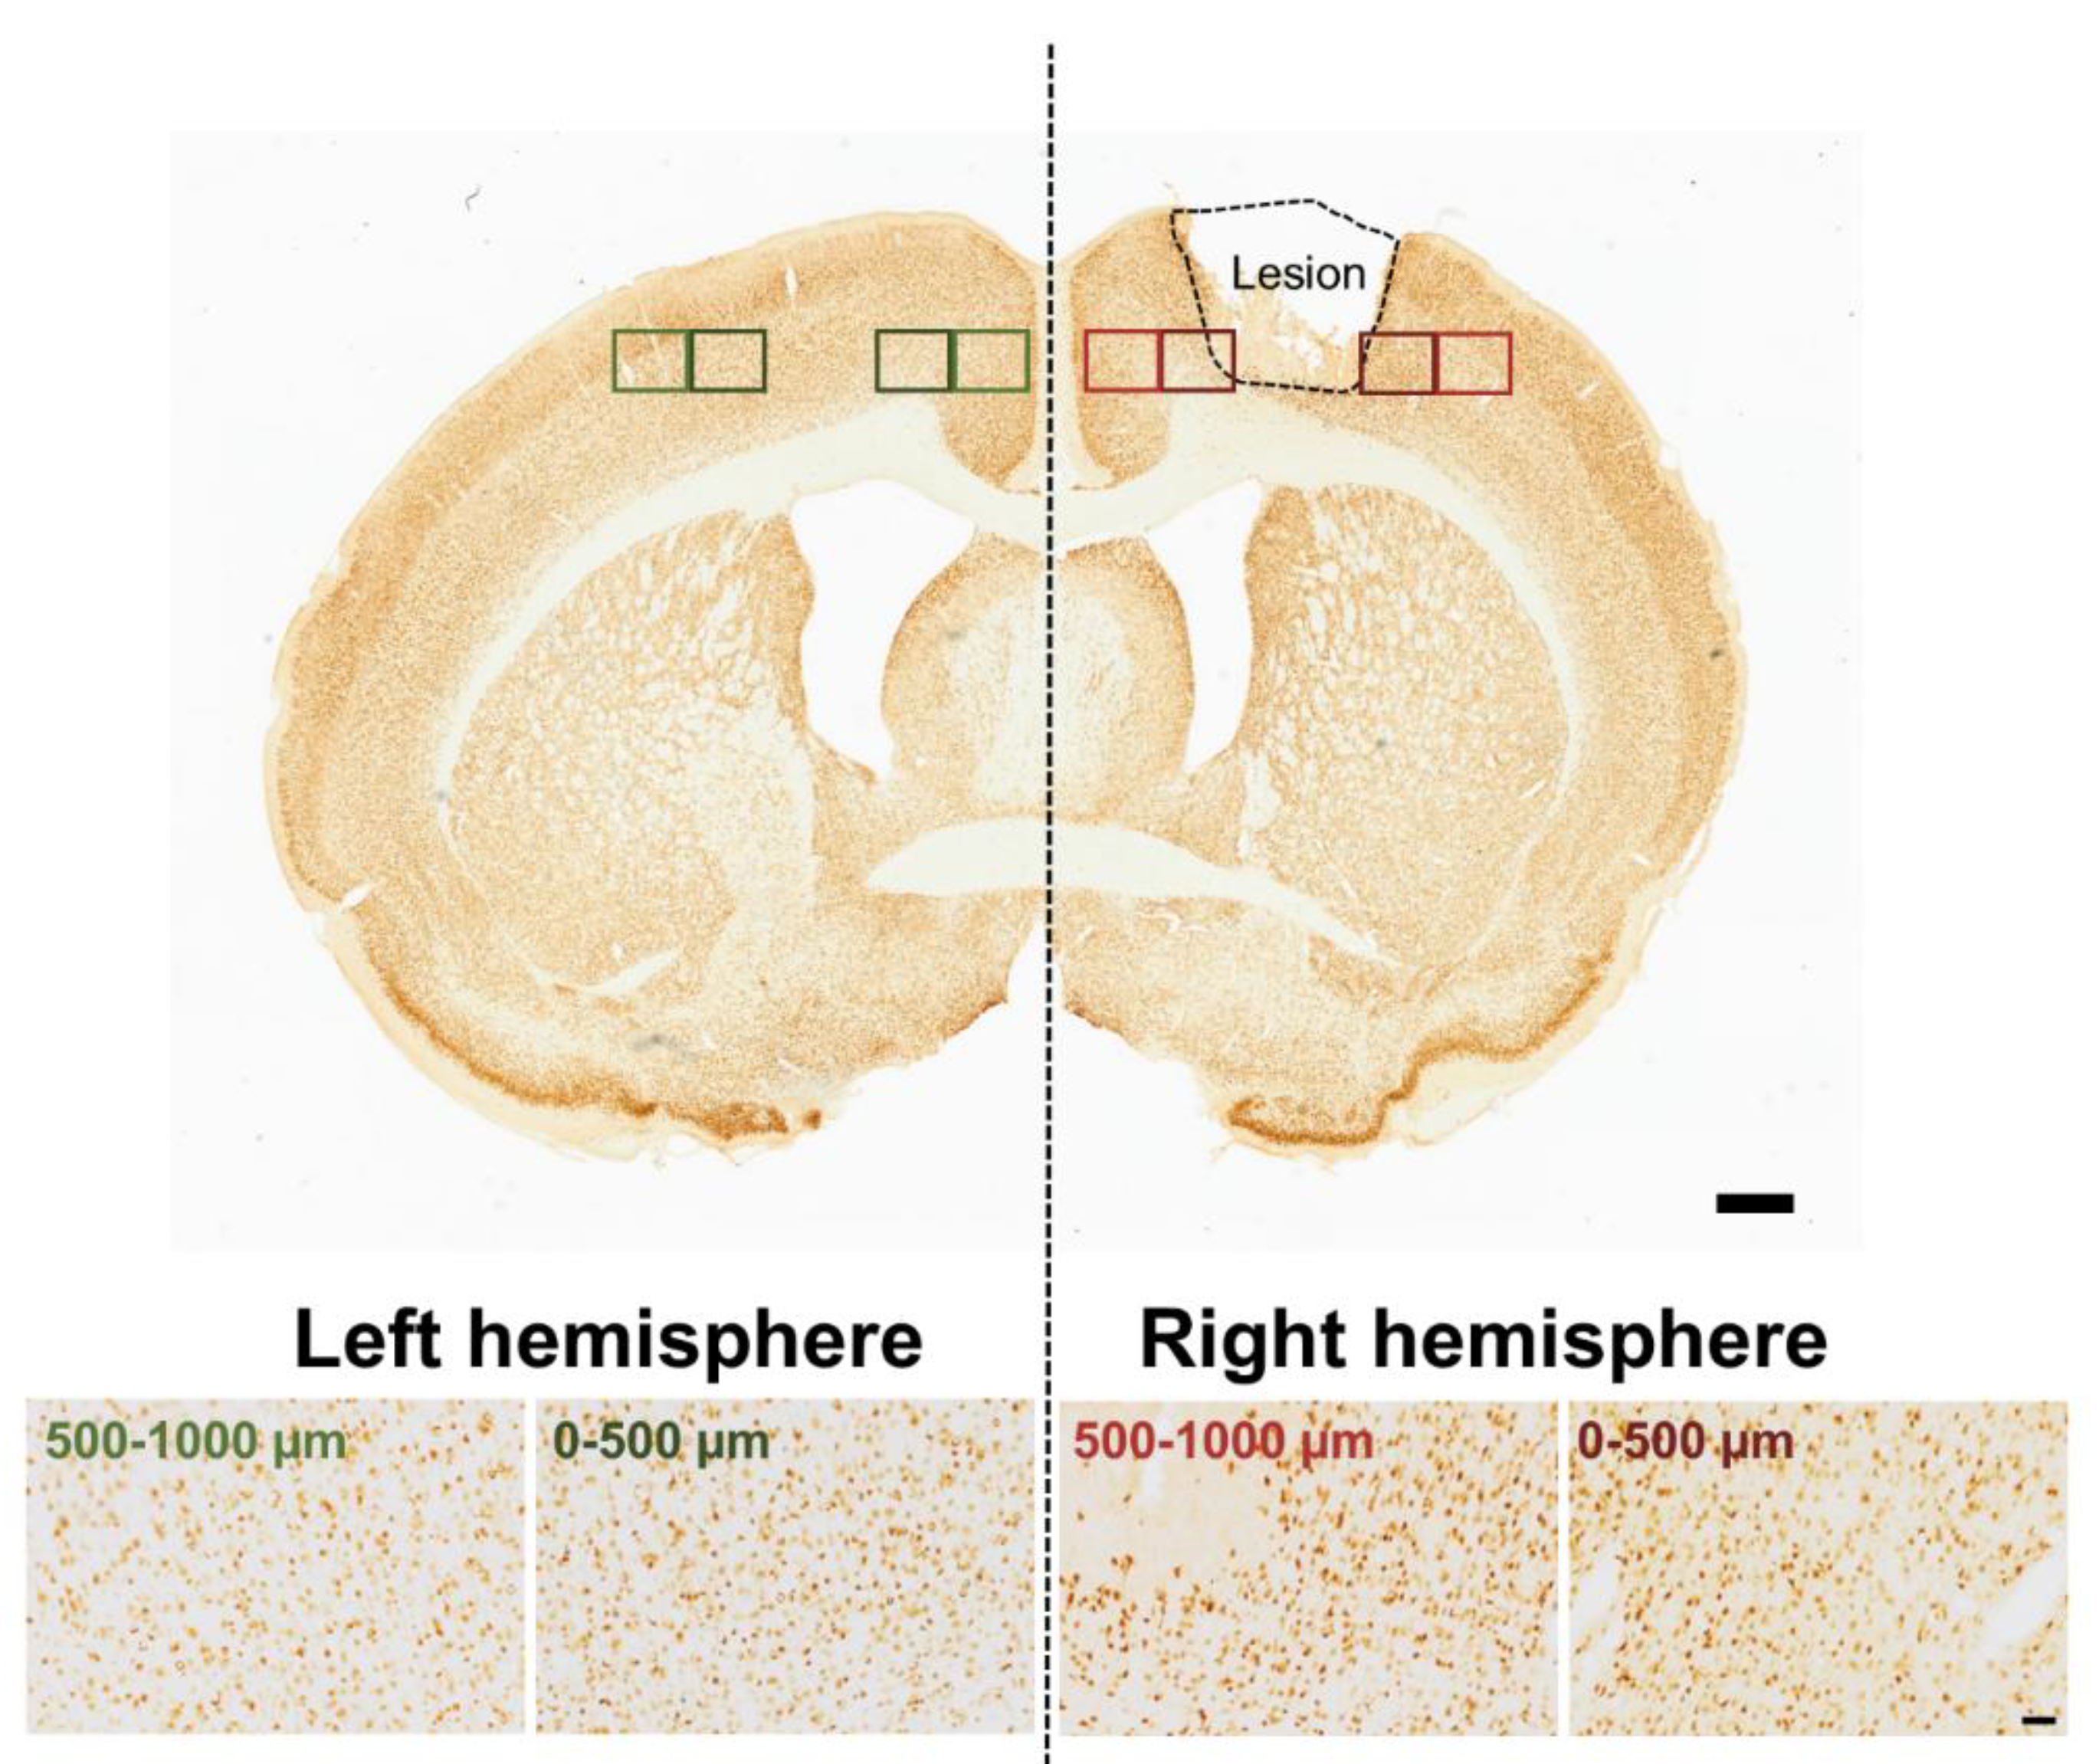
Figure 2.
Image processing workflow used for quantification of immunohistochemical staining. Representative images from TBI rats at day 7 post-injury are shown for each marker (NeuN, IBA-1, CD11b, GFAP) to illustrate the analysis pipeline. The first column shows the original DAB-stained image, the second column the grayscale-converted version used for thresholding, the third column the thresholded binary image used for quantification (with a fixed threshold per marker), and the fourth column the calculated percent area of positive staining within the region of interest (average), as extracted using ImageJ (Fiji). Scale bar, valid for all panels, 50 µm.
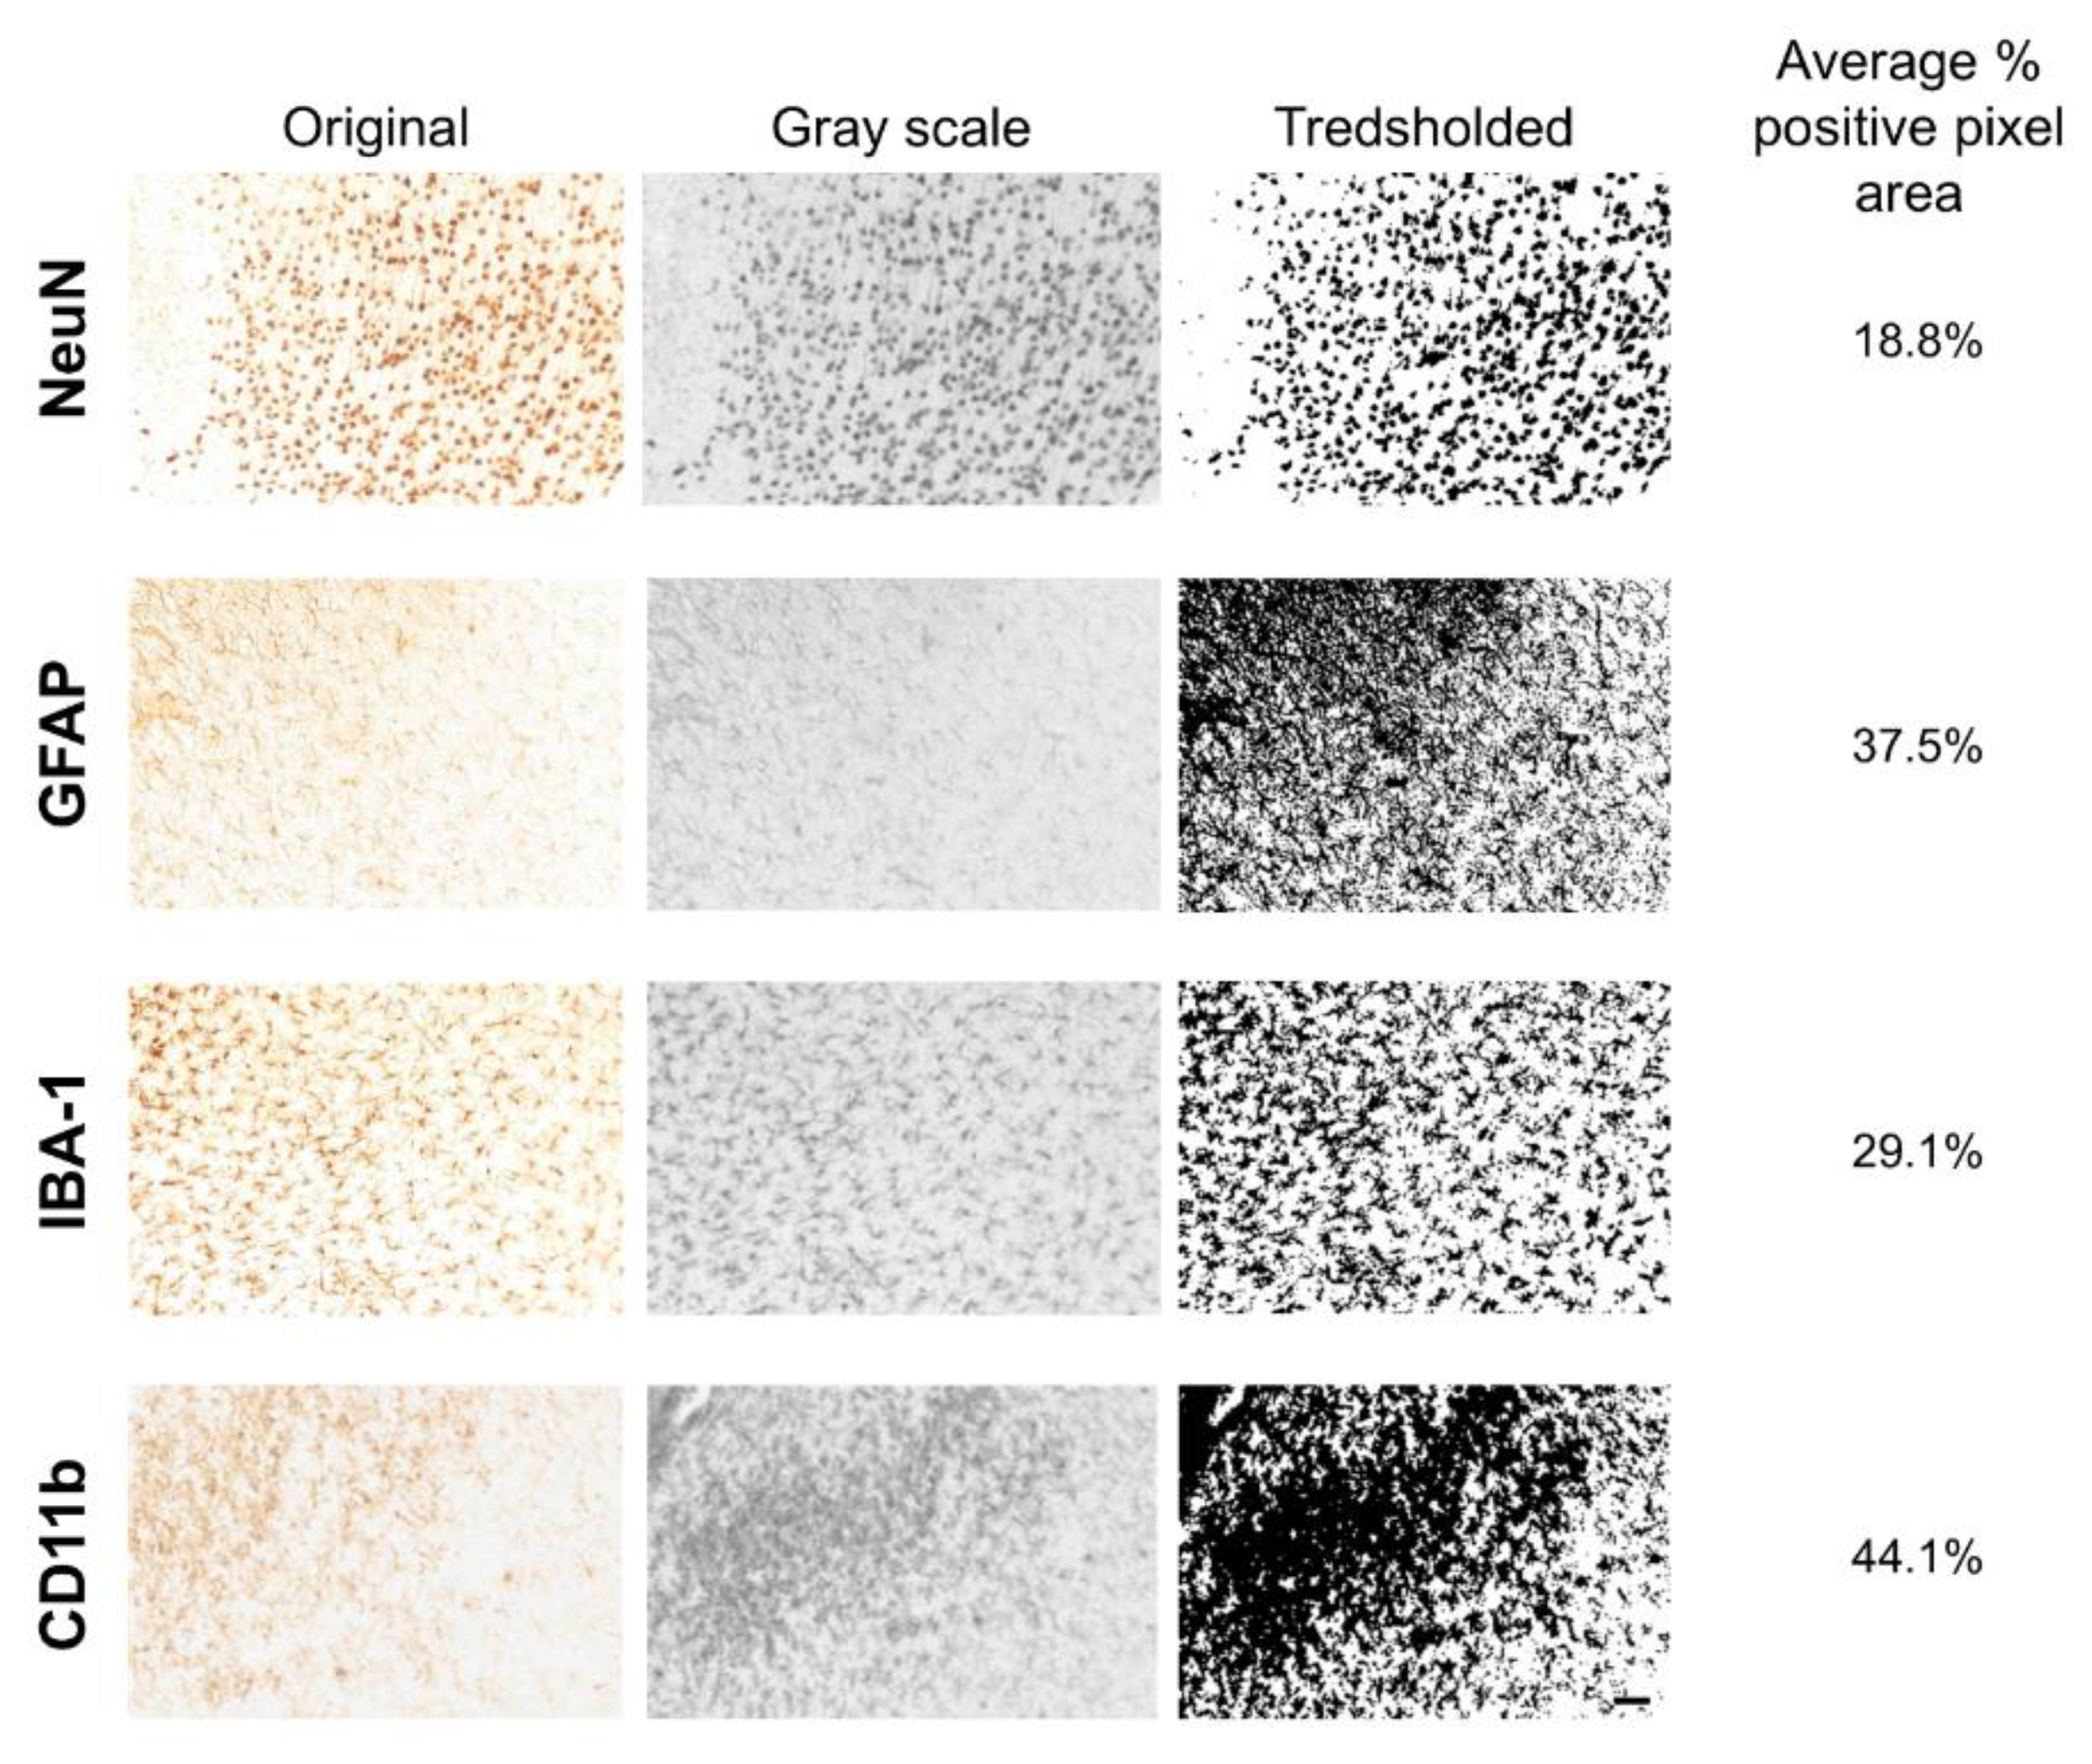
Figure 3.
CD11b expression at 0–500 µm reveals early and sharply lateralized activation. Representative images and quantification of CD11b immunoreactivity in peri-lesional cortex 0–500 µm from the lesion site across post-injury days 3 (A-D), 7 (E-H), 14 (I-L), 21 (M-P), and 28 (Q-T). CD11b staining is strongly elevated in TBI right at early timepoints, with minimal expression in SHAM and TBI left hemispheres. Quantification confirms significant group, hemisphere, and interaction effects from day 3 to day 14, indicating sharply lateralized microglial/macrophage activation. Two-way repeated ANOVA with post hoc comparisons and paired t-test. Day 3, 7, 21 and 28: n =3 (SHAM and TBI), day 14: n = 3 (SHAM) and 5 (TBI). Bars represent mean normalized values ± SD. **p < 0.01, ***p < 0.001, ****p < 0.0001. Scale bar = 50 µm, valid for all microphotographs. Brain illustrations created in BioRender. Hjæresen, S. (2025) (https://BioRender.com/dkneo0y).
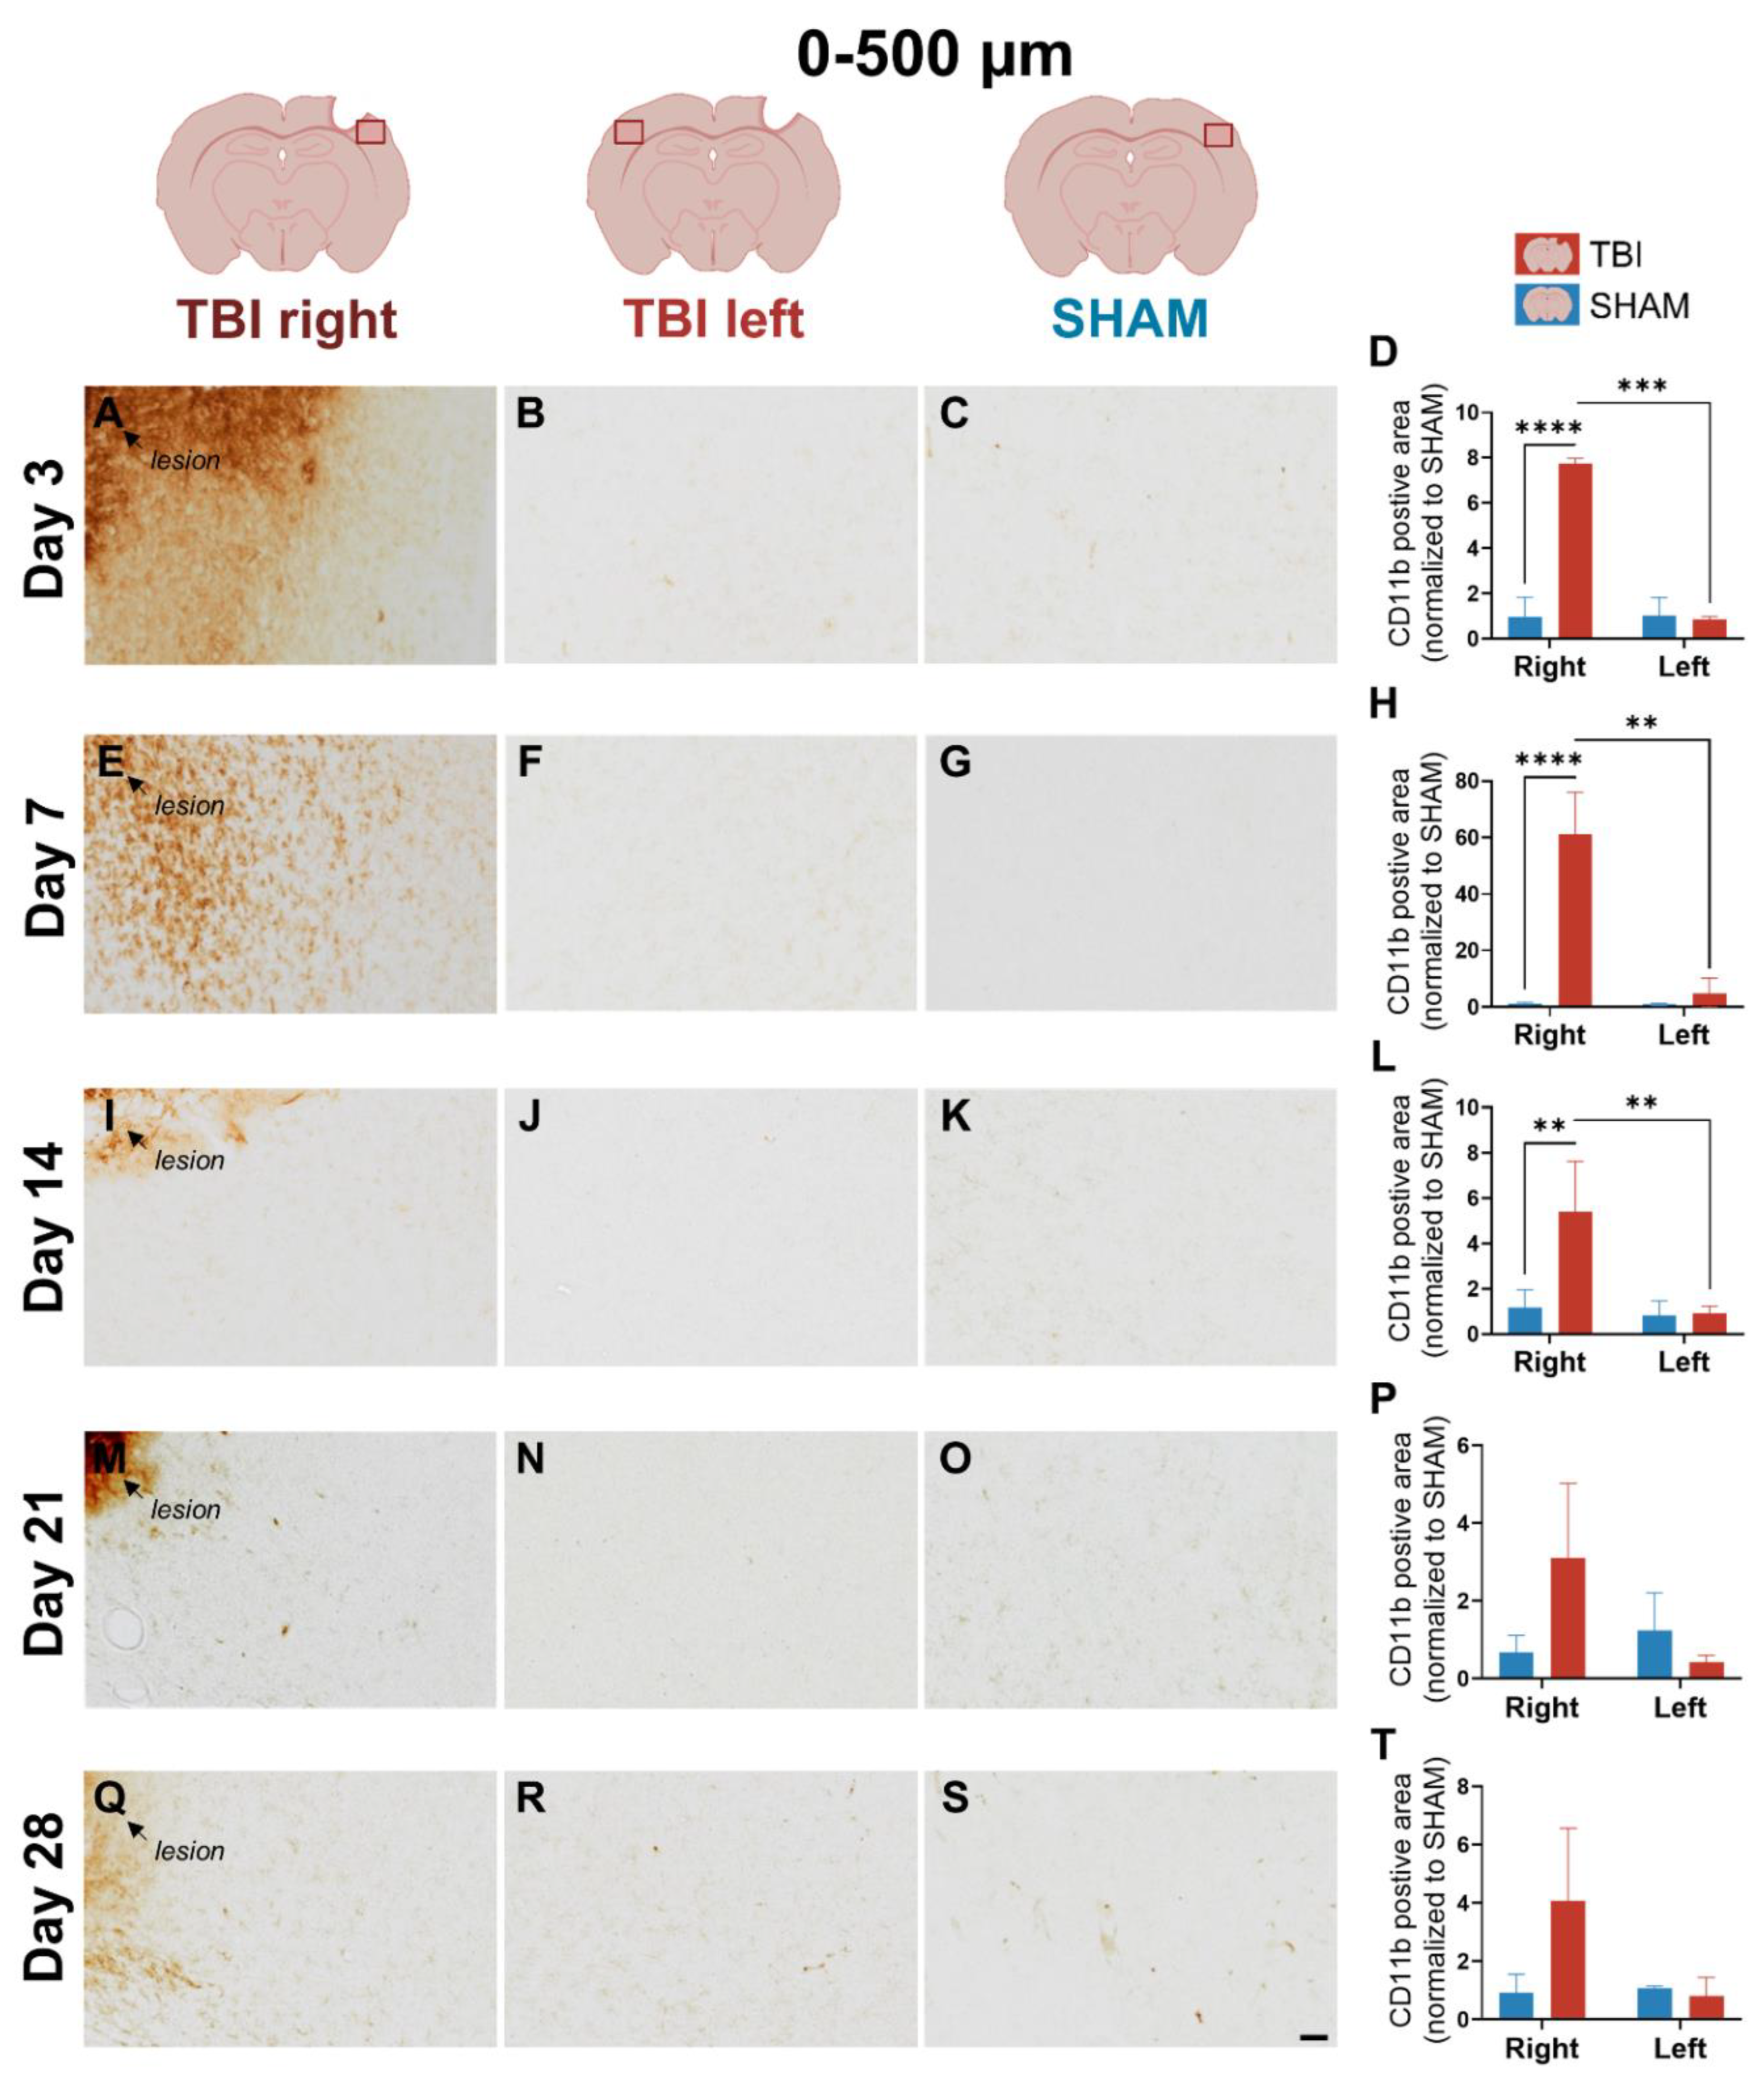
Figure 4.
CD11b expression at 500–1000 µm shows attenuated and spatially constrained activation. Representative images and quantification of CD11b staining in cortex 500–1000 µm from the lesion site across post-injury days 3 (A-D), 7 (E-H), 14 (I-L), 21 (M-P), and 28 (Q-T). At day 3, TBI right still shows elevated CD11b, though the intensity is lower and lateralization less pronounced than at 0–500 µm. Quantification reveals significant group, hemisphere, and interaction effects at early timepoints, but these resolve by day 14. Two-way repeated ANOVA with post hoc comparisons and paired t-test. Day 3, 7, 21 and 28: n =3 (SHAM and TBI), day 14: n = 3 (SHAM) and 5 (TBI). Bars show mean ± SD for each group and hemisphere. *p < 0.025, ***p < 0.001. Scale bar = 50 µm, valid for all microphotographs. Brain illustrations created in BioRender. Hjæresen, S. (2025) (https://BioRender.com/dkneo0y).
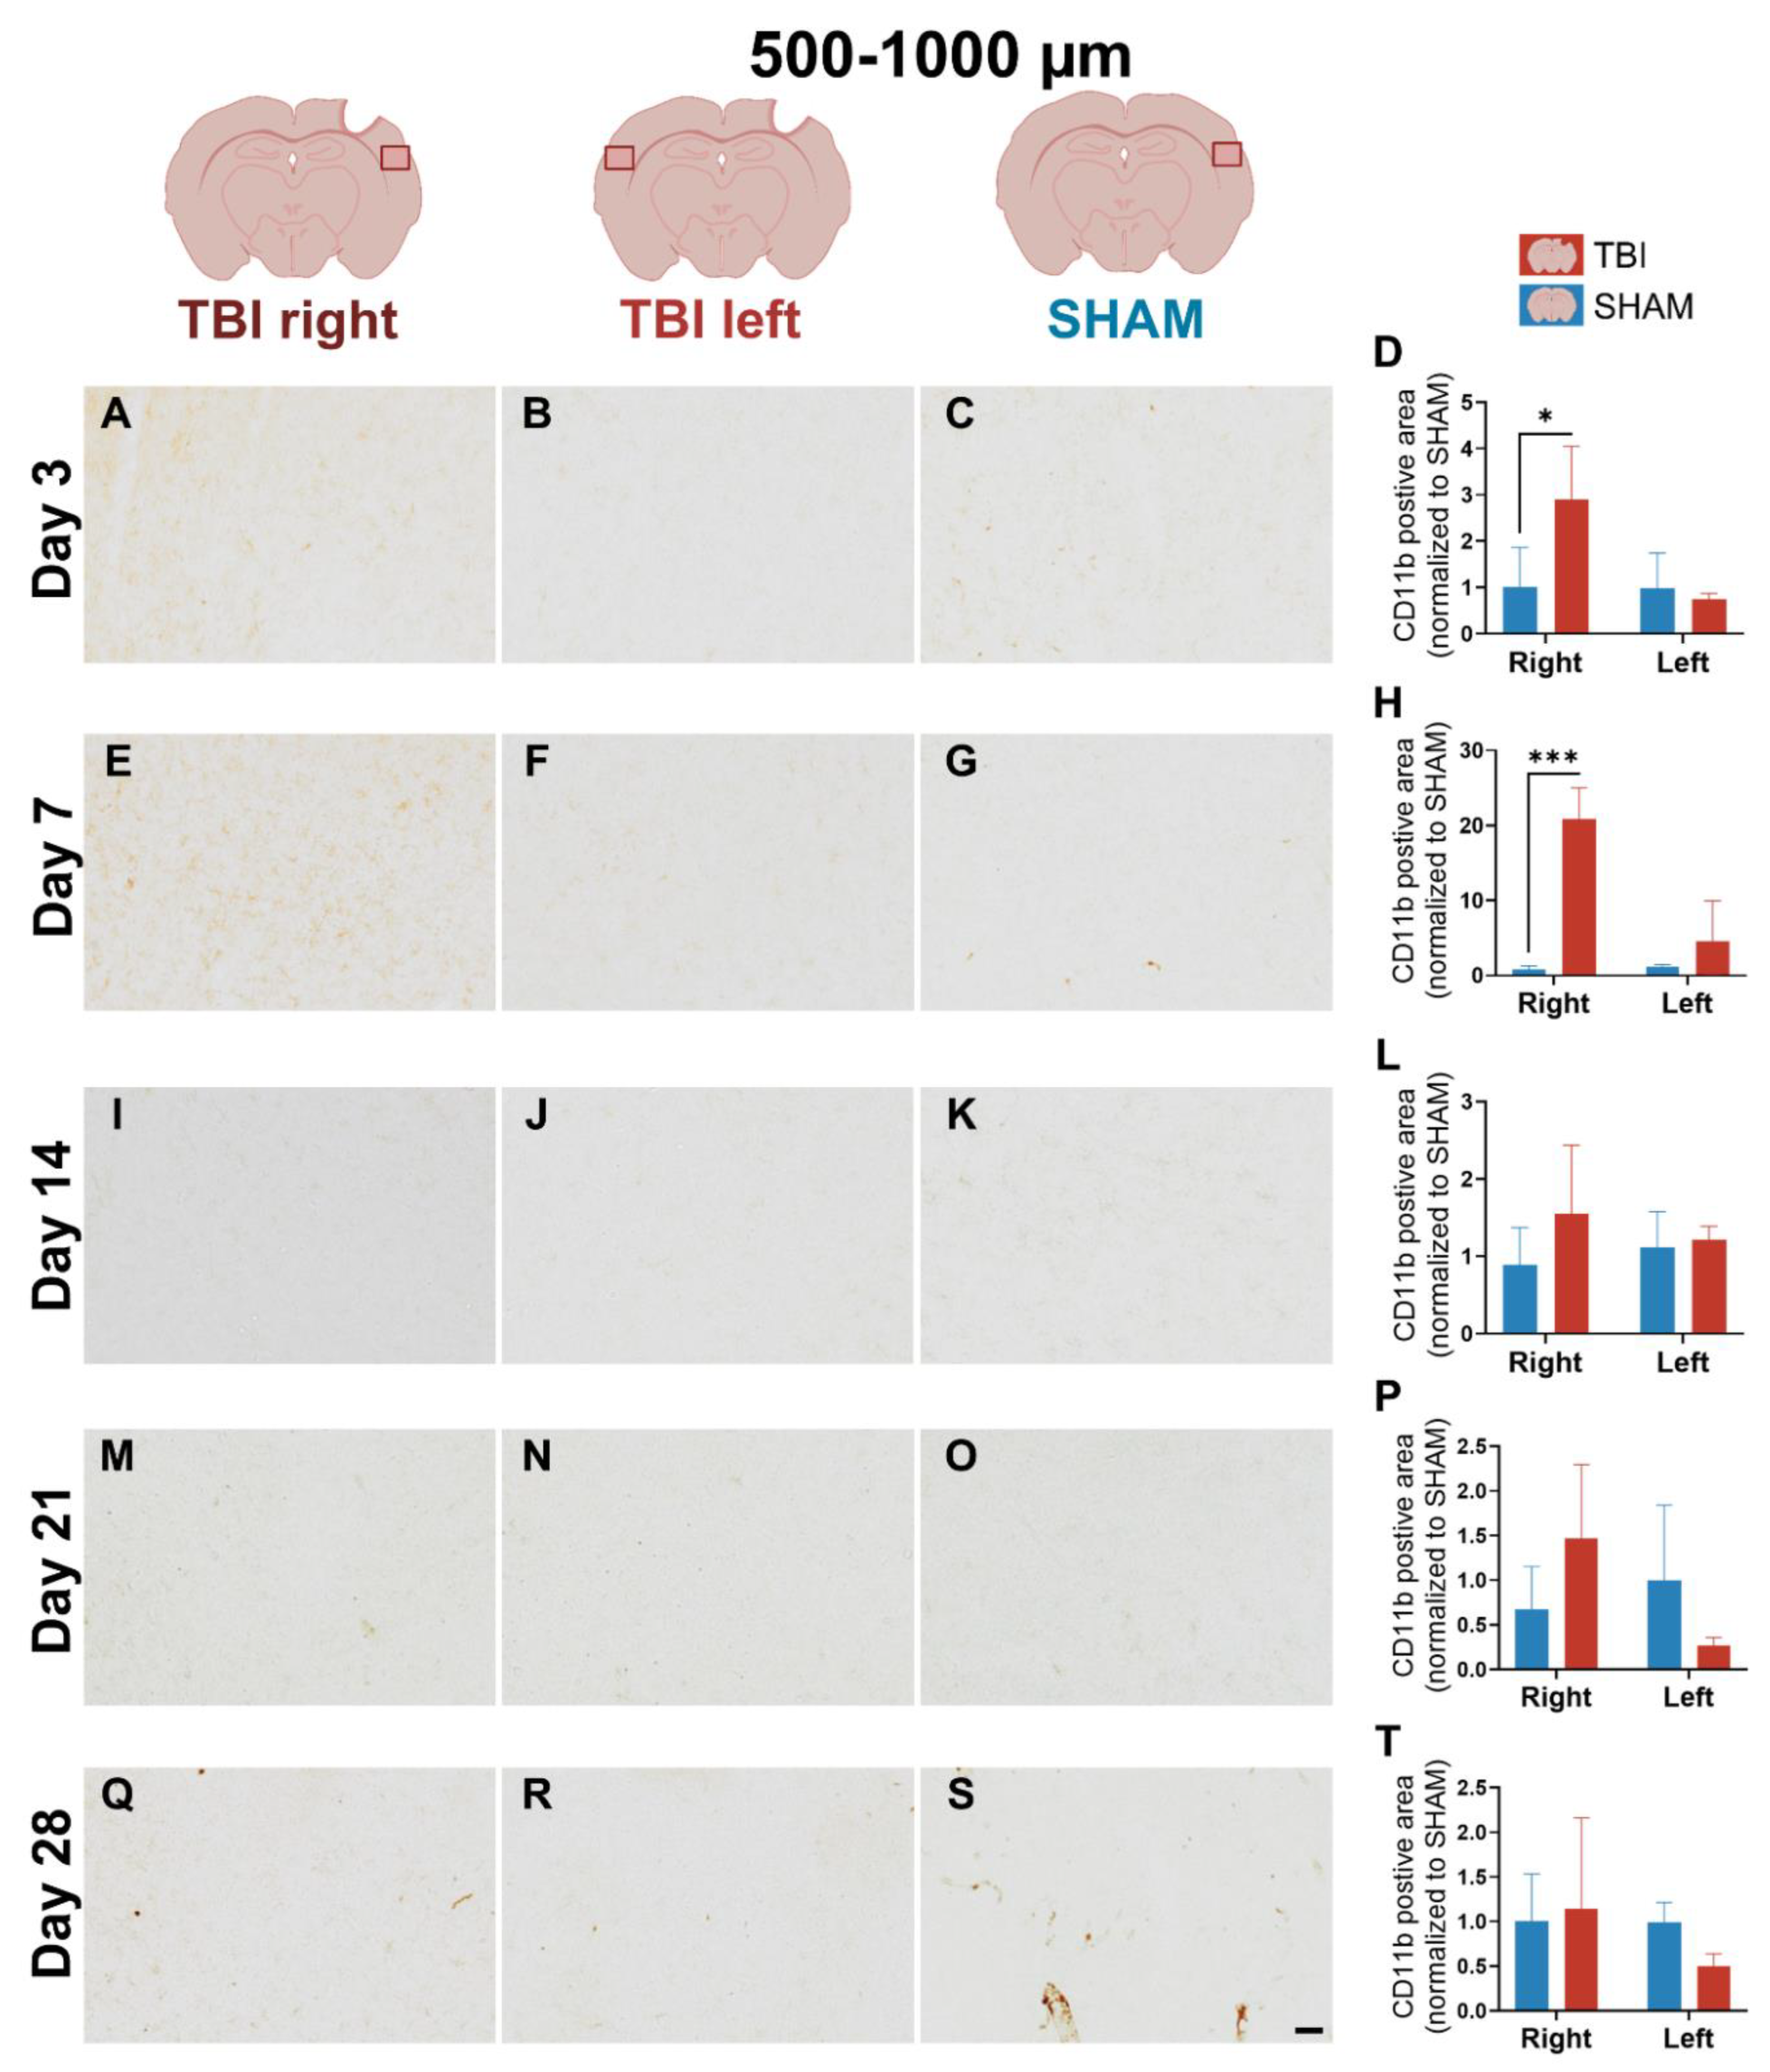
Figure 5.
IBA-1 expression at 0–500 µm reveals delayed lateralization and sustained activation. Representative images and quantification of IBA-1 staining in cortex 0–500 µm from the lesion across post-injury days 3 (A-D), 7 (E-H), 14 (I-L), 21 (M-P), and 28 (Q-T). At day 3, bilateral microglial activation is evident. From day 7 onward, labeling becomes lateralized to TBI right, persisting through day 21 and resolving by day 28. Two-way repeated ANOVA with post hoc comparisons and paired t-test. Day 3: n= 3 (SHAM) and 4 (TBI), day 7: n= 3 (SHAM and TBI), day 14: n= 3 (SHAM) and 6 (TBI), day 21: n= 4 (SHAM) and 3 (TBI), day 28: n= 4 (SHAM and TBI). Bars = mean ± SD. *p < 0.025, **p < 0.01, ***p < 0.001. Scale bar = 50 µm, valid for all microphotographs. Brain illustrations created in BioRender. Hjæresen, S. (2025) (https://BioRender.com/dkneo0y).
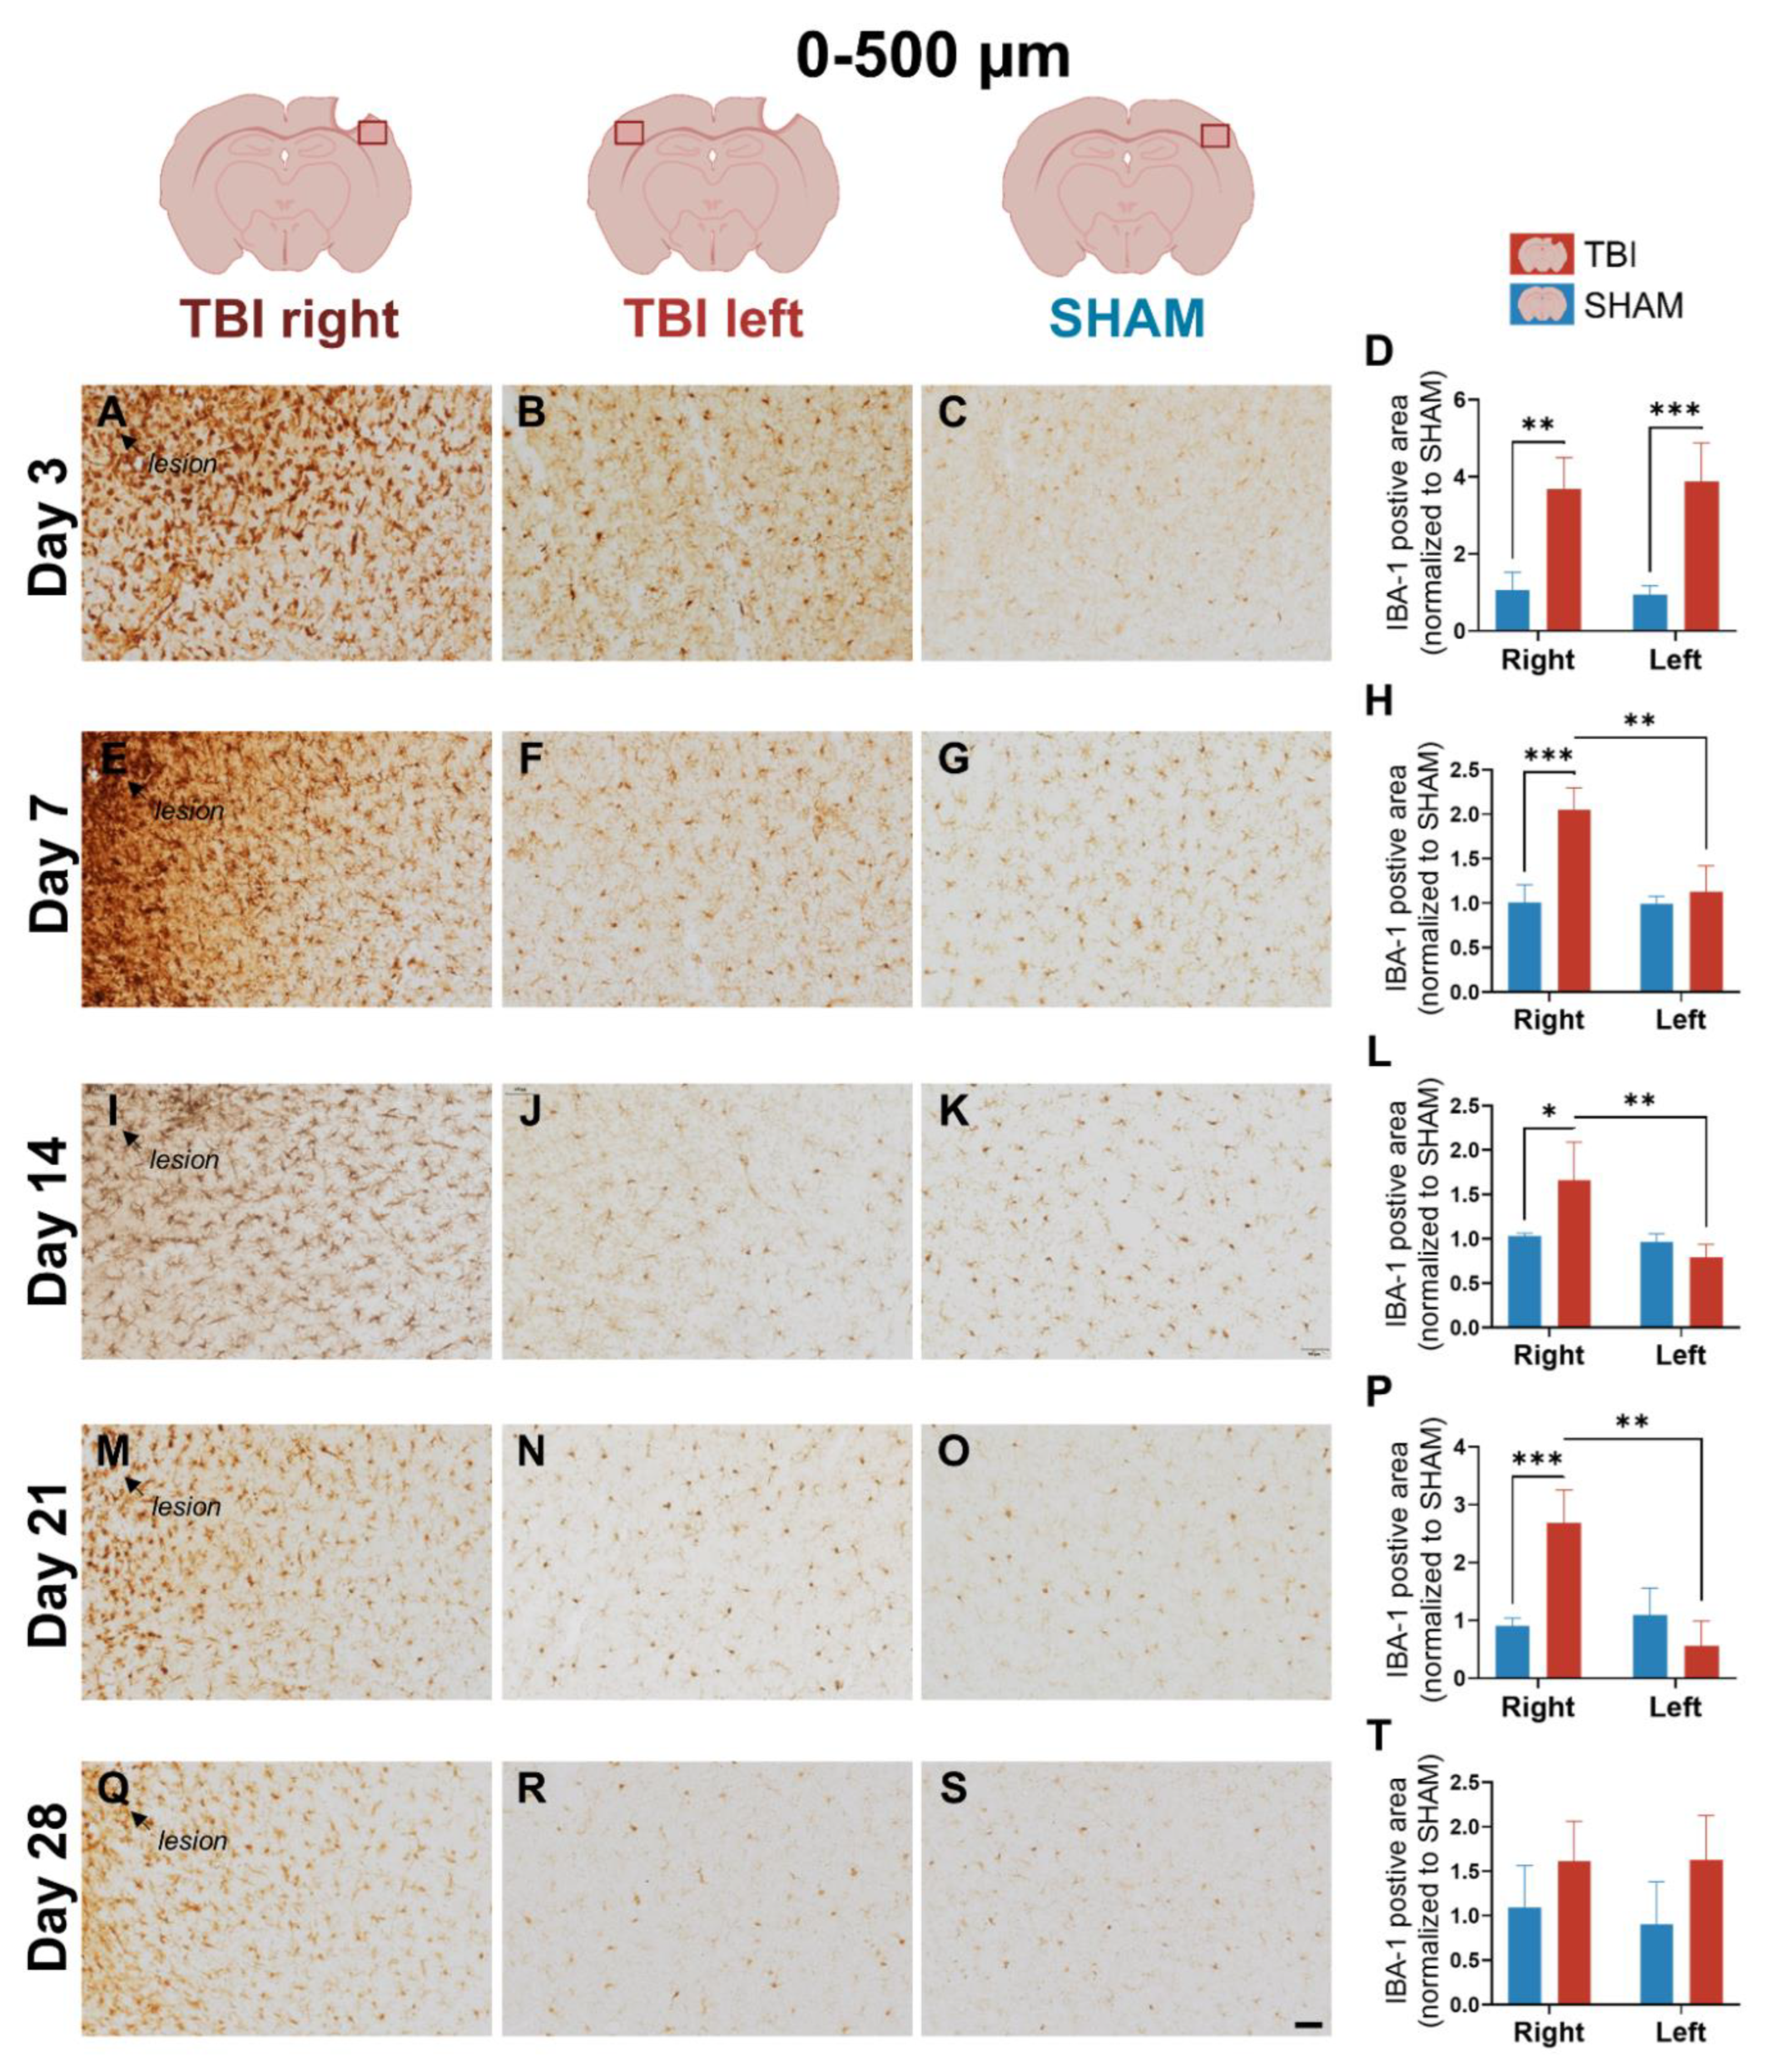
Figure 6.
IBA-1 expression at 500–1000 µm demonstrates weaker, distal microglial reactivity. Images and quantification of IBA-1 staining at 500–1000 µm from the lesion site across post-injury days 3 (A-D), 7 (E-H), 14 (I-L), 21 (M-P), and 28 (Q-T). Early activation (day 3) is moderate and bilateral, with delayed lateralization appearing from day 7. Activation in TBI right persists through day 21 but is less pronounced than in the proximal region. Quantitative analysis shows transient group and interaction effects, which were resolved by day 28. Two-way repeated ANOVA with post hoc comparisons and paired t-test. Day 3: n= 3 (SHAM) and 4 (TBI), day 7: n= 3 (SHAM and TBI), day 14: n= 3 (SHAM) and 6 (TBI), day 21: n= 4 (SHAM) and 3 (TBI), day 28: n= 4 (SHAM and TBI). Bars represent mean ± SD. *p < 0.025, **p < 0.01. Scale bar = 50 µm, valid for all microphotographs. Brain illustrations created in BioRender. Hjæresen, S. (2025) (https://BioRender.com/dkneo0y).
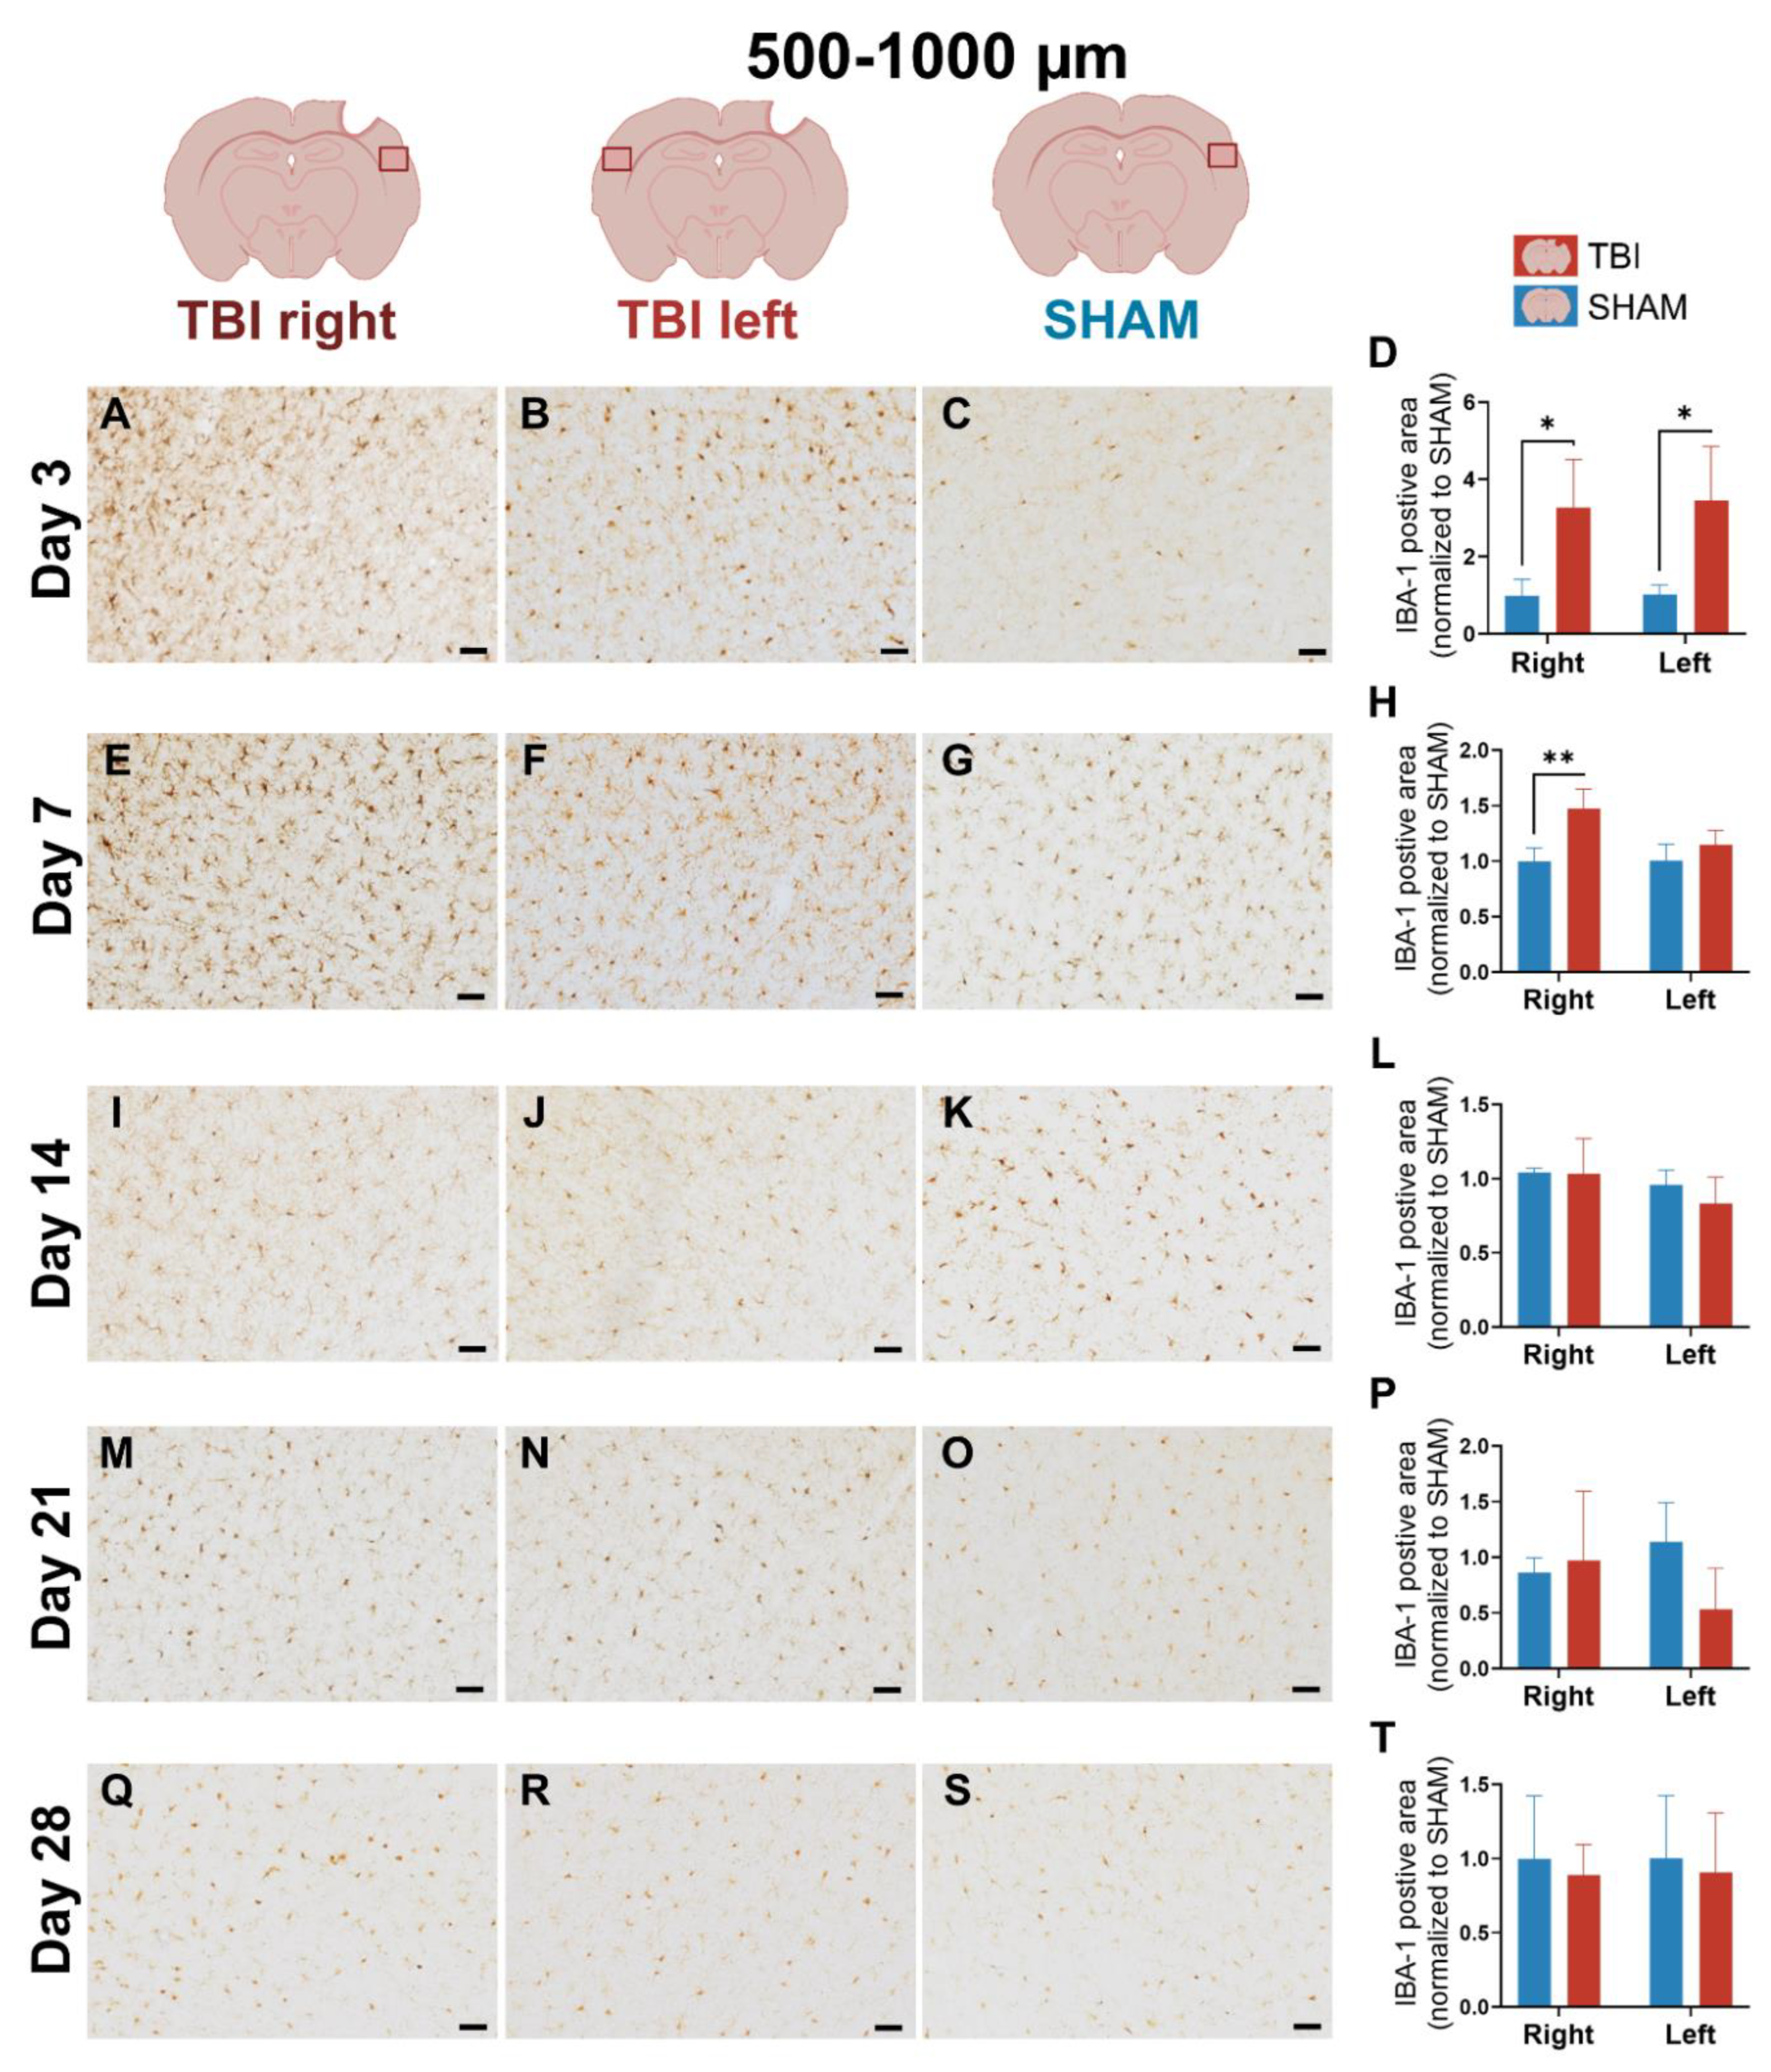
Figure 7.
GFAP expression at 0–500 µm shows progressive and lateralized astrocytic activation. Representative GFAP staining and quantification in peri-lesional cortex at 0–500 µm at post-injury days 3 (A-D), 7 (E-H), 14 (I-L), 21 (M-P), and 28 (Q-T). At day 3, TBI right shows mild astrocytic activation, increasing in intensity and spread by day 7. At day 21, activation persists, and by day 28, expression becomes bilaterally elevated. Two-way repeated ANOVA with post hoc comparisons and paired t-test. Day 3: n = 4 (SHAM and TBI), Day 7 and 21: n = 3 (SHAM and TBI), Day 14: n = 3 (SHAM) and 6 (TBI), day 28: n = 4 (SHAM and TBI). Bars represent mean ± SD. *p < 0.025, **p < 0.01, ****p < 0.0001. Scale bar = 50 µm, valid for all microphotographs. Brain illustrations created in BioRender. Hjæresen, S. (2025) (https://BioRender.com/dkneo0y).
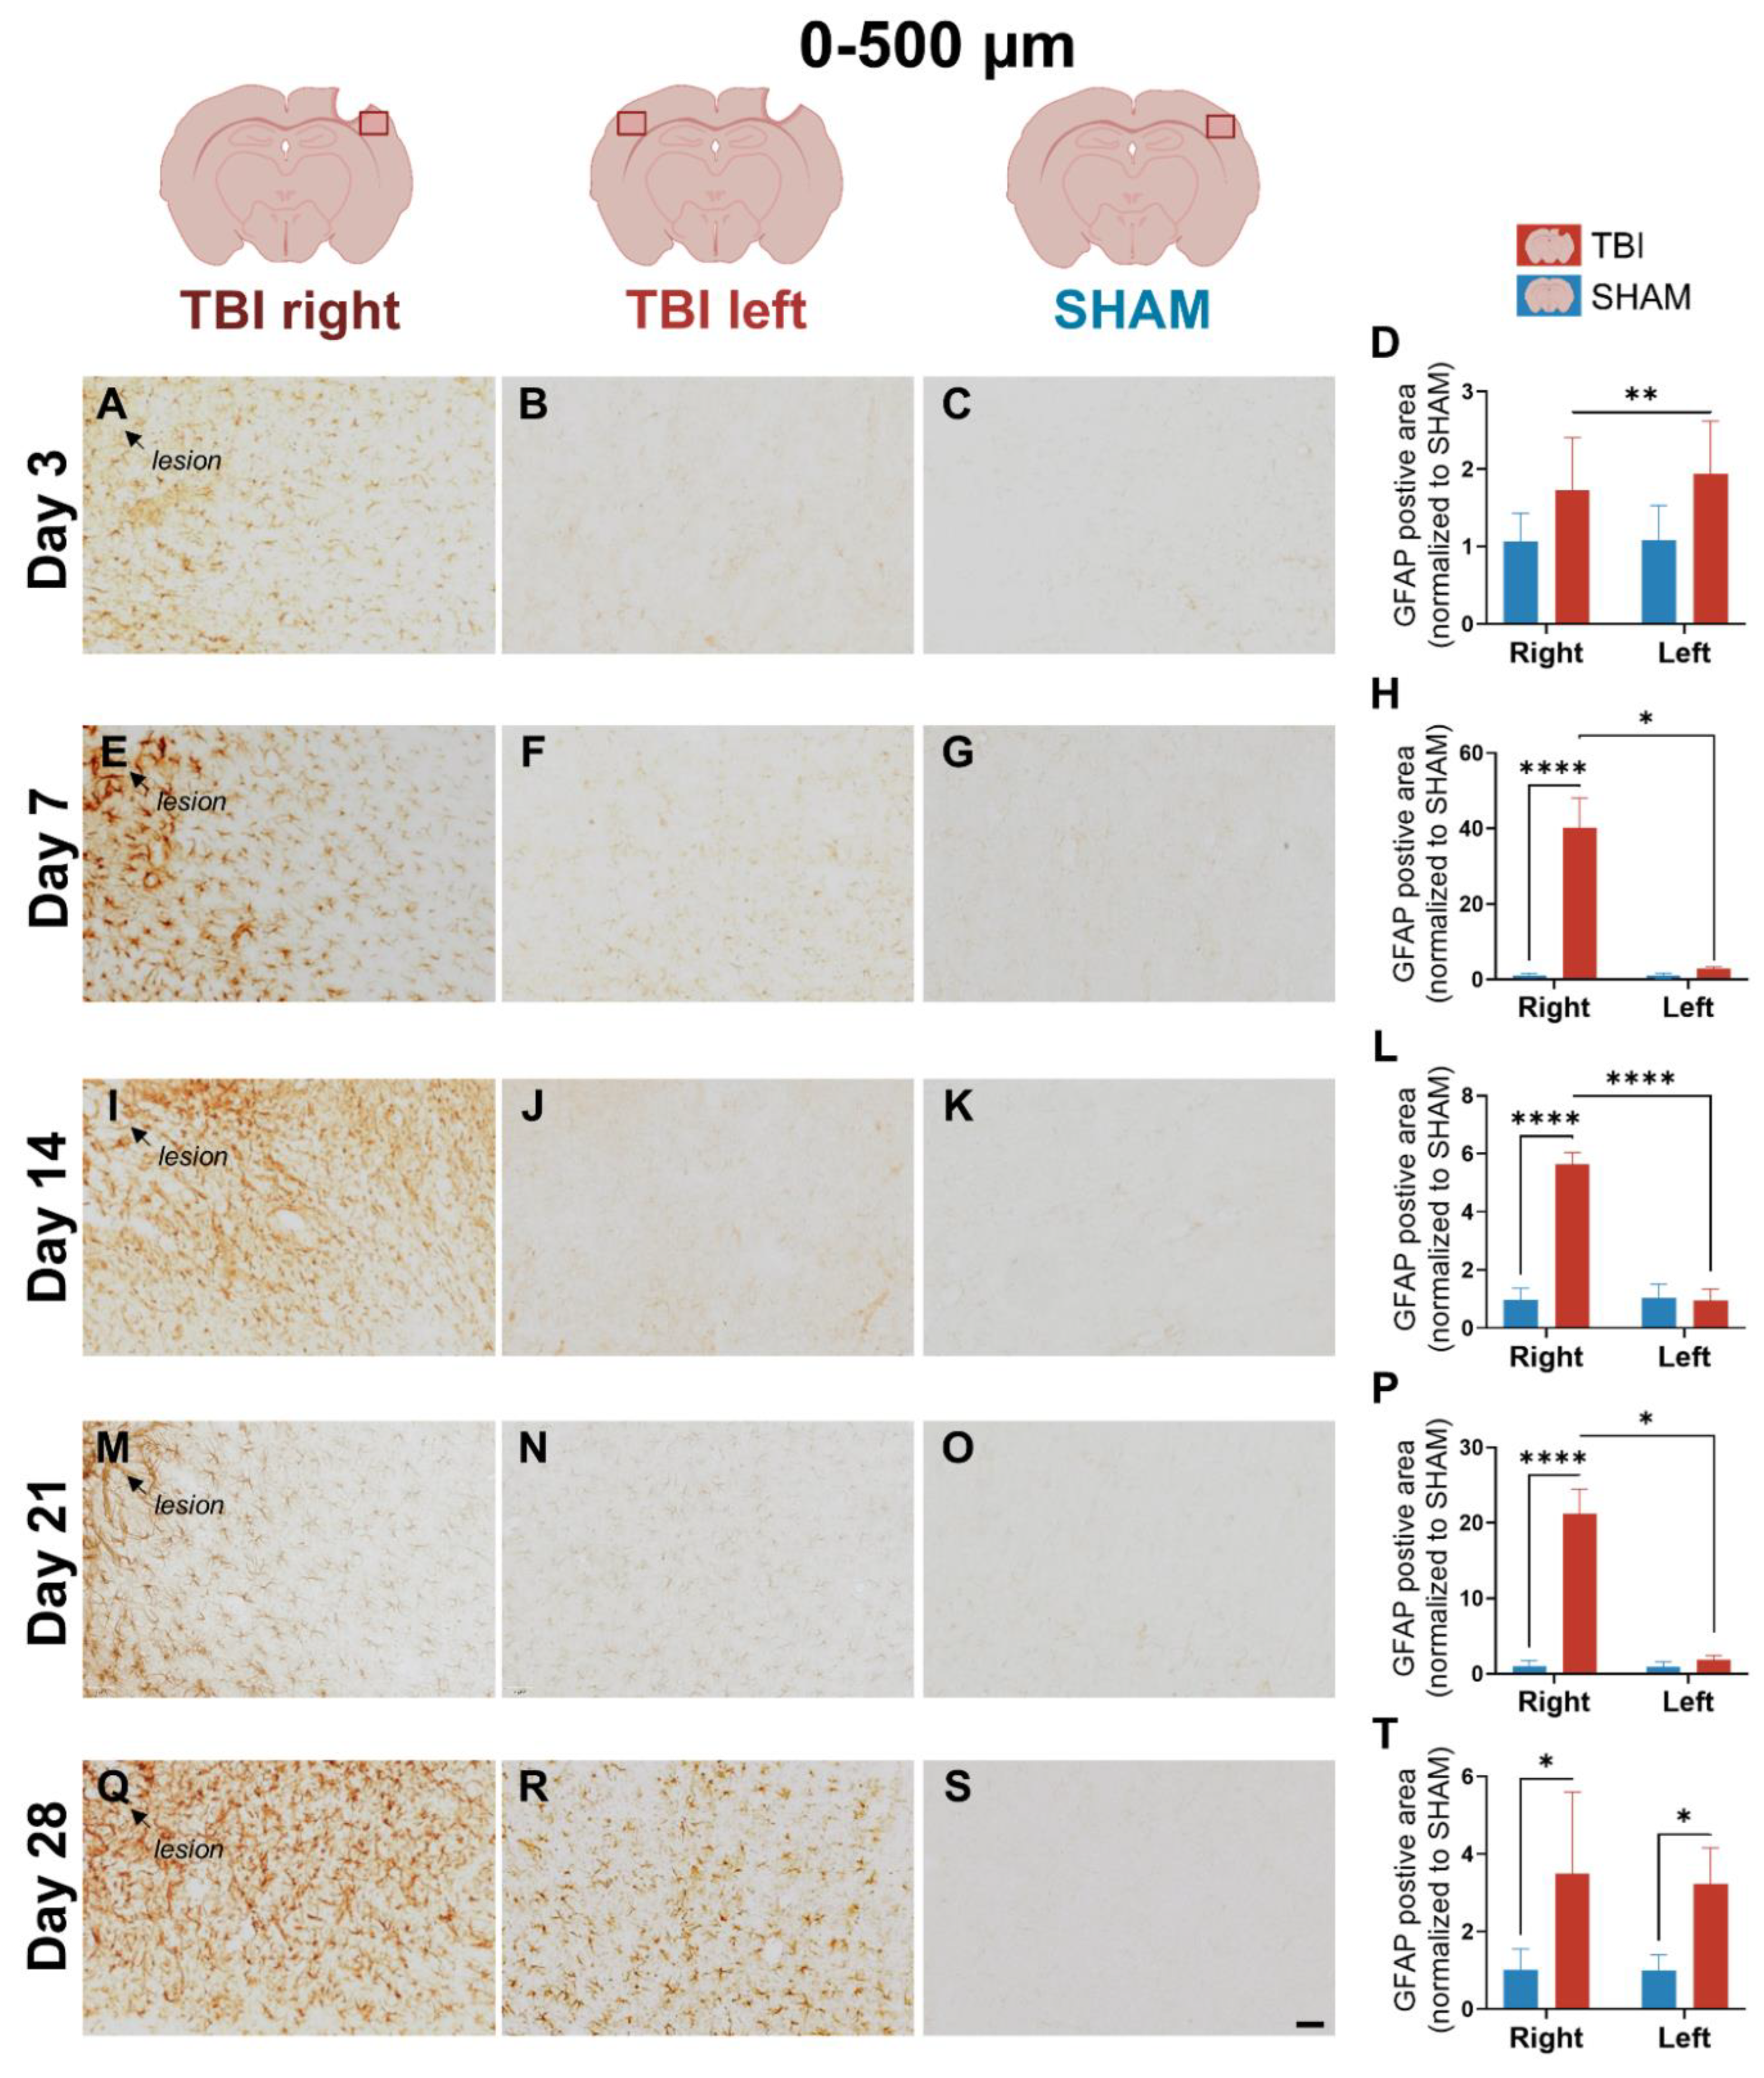
Figure 8.
GFAP expression at 500–1000 µm indicates delayed and spatially variable astrocyte activation. Images and quantification of GFAP immunoreactivity at 500–1000 µm from the lesion site across post-injury days 3 (A-D), 7 (E-H), 14 (I-L), 21 (M-P), and 28 (Q-T). Astrocytic activation is minimal at day 3, but modest increases are seen in TBI right by day 7 and persisting until day 21. Quantitative data confirms time-dependent changes. Two-way repeated ANOVA with post hoc comparisons and paired t-test. Day 3: n = 4 (SHAM and TBI), Day 7 and 21: n = 3 (SHAM and TBI), Day 14: n = 3 (SHAM) and 6 (TBI), day 28: n = 4 (SHAM and TBI). Bars = mean ± SD. *p < 0.025, **p < 0.01. Scale bar = 50 µm, valid for all microphotographs. Brain illustrations created in BioRender. Hjæresen, S. (2025) (https://BioRender.com/dkneo0y).
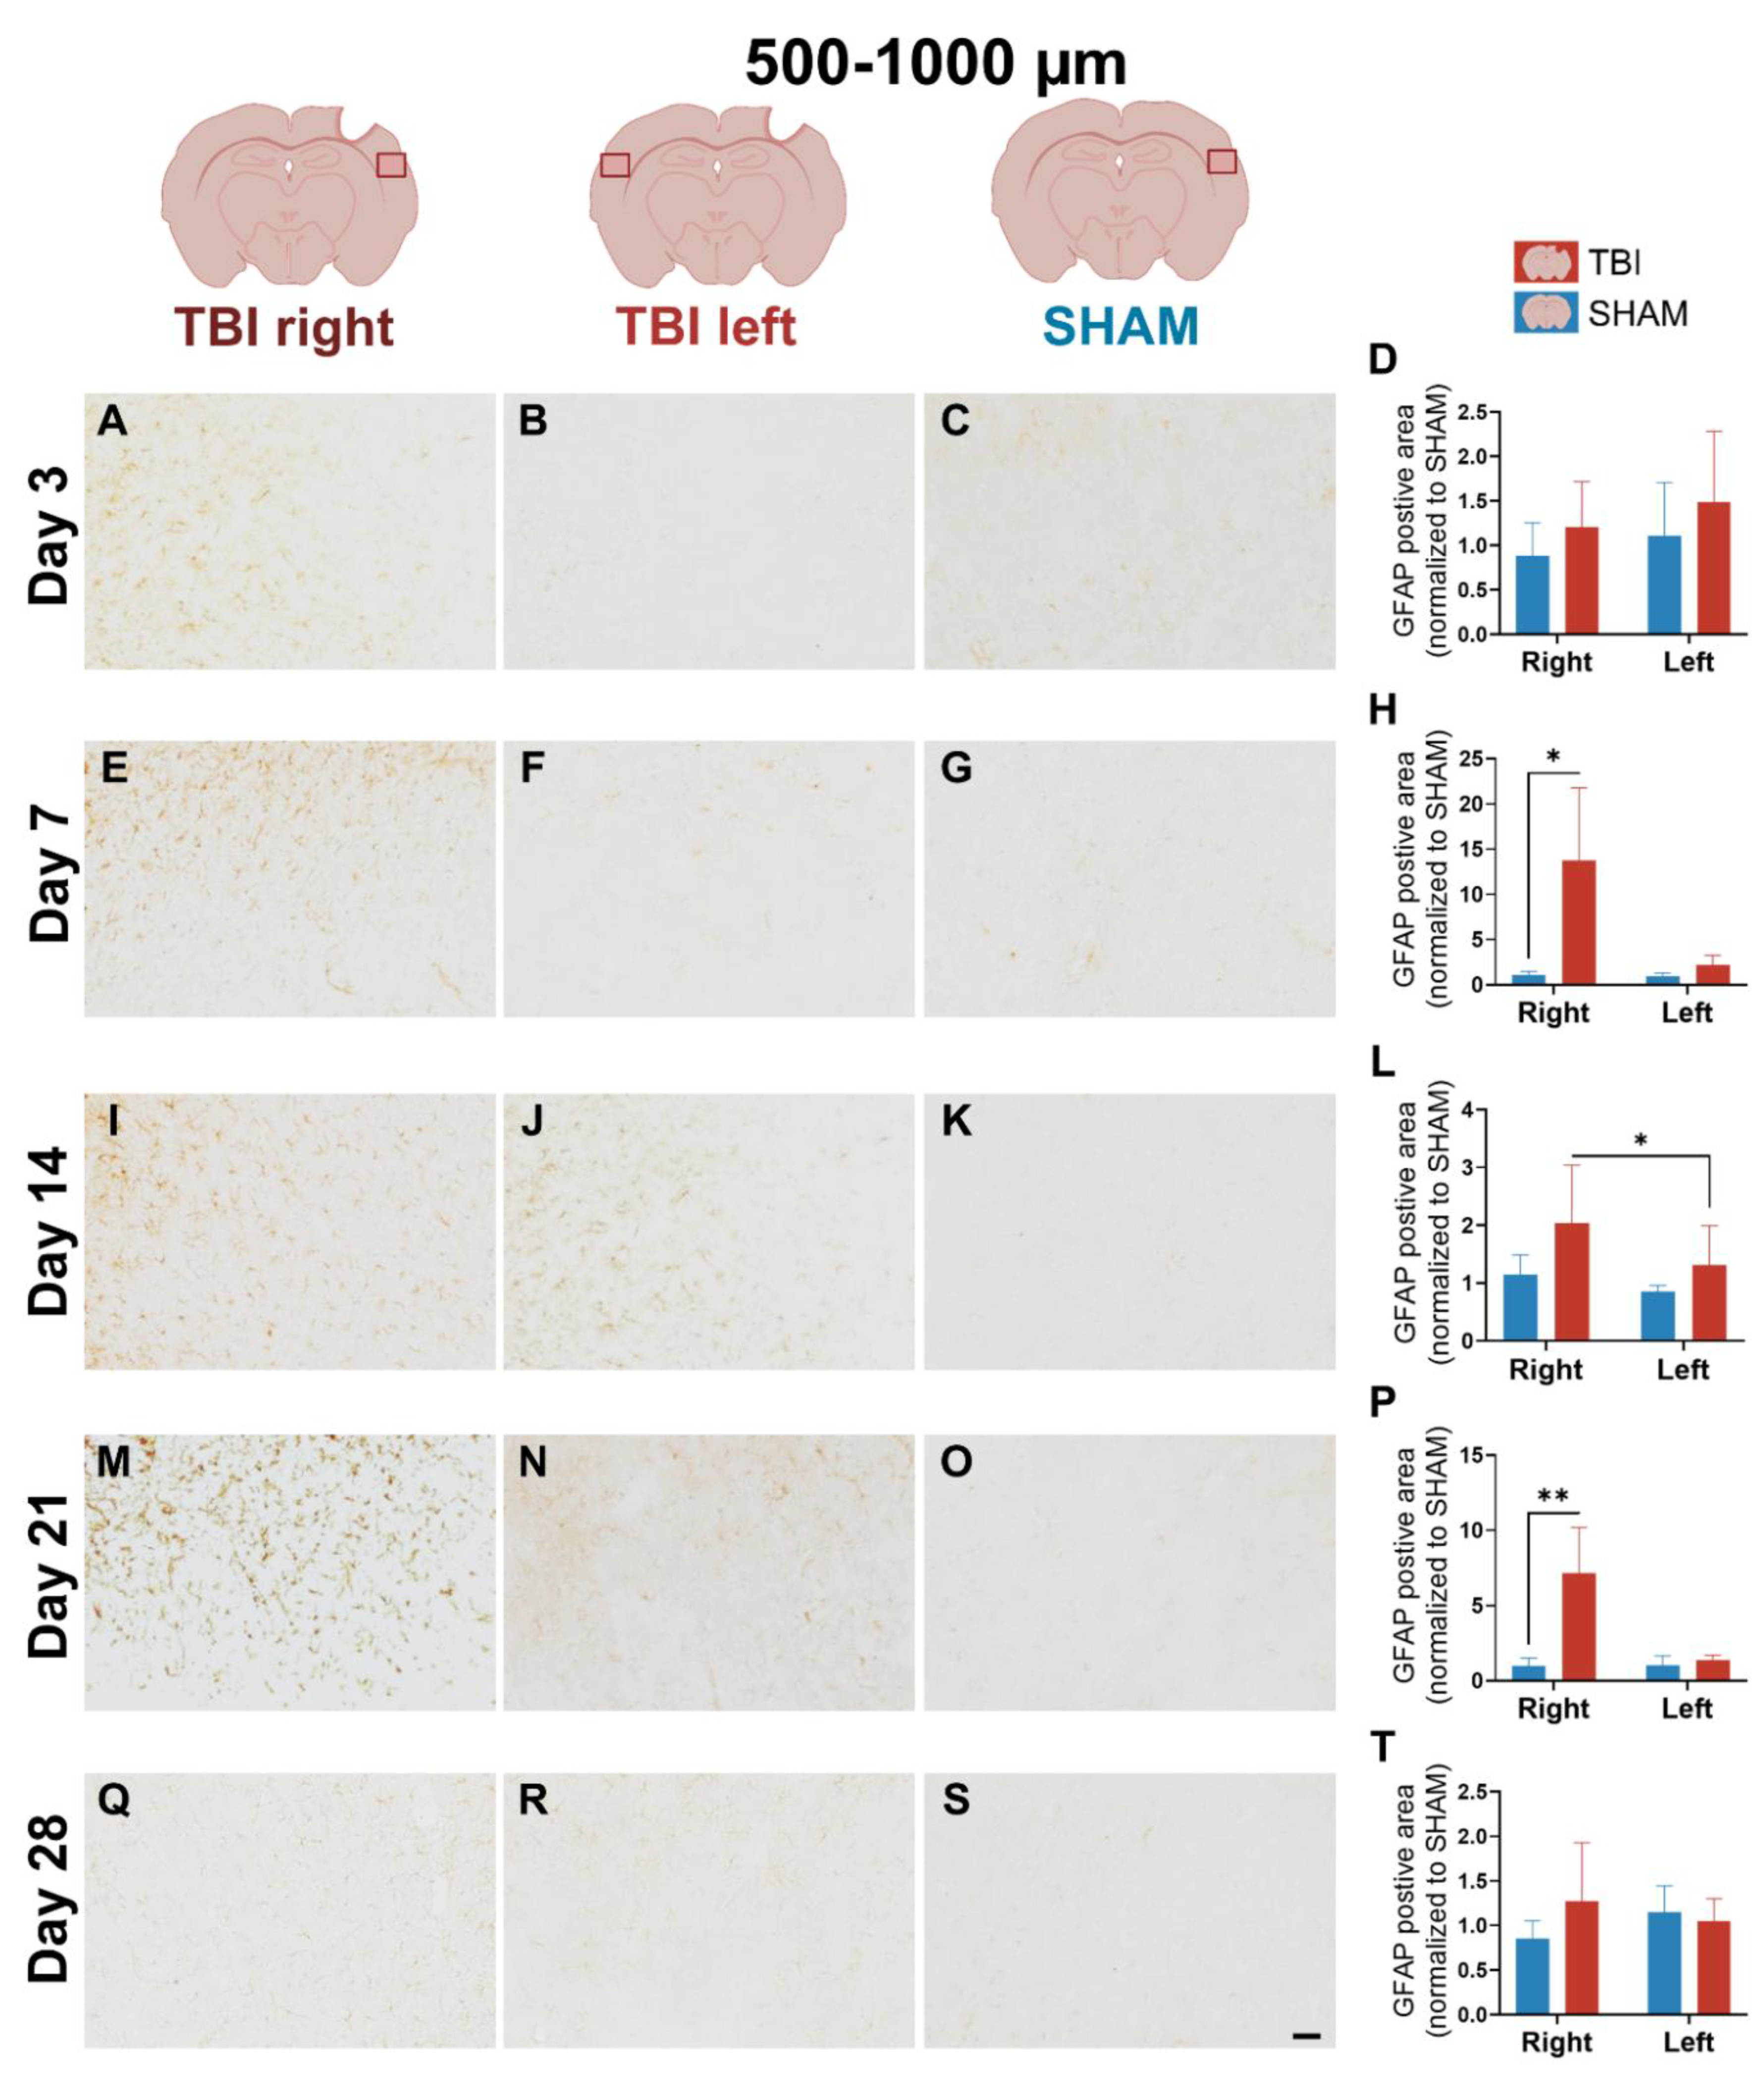
Figure 9.
NeuN expression at 0–500 µm remains stable across timepoints, indicating preserved neuronal integrity. NeuN immunostaining and quantification in the peri-lesional region (0–500 µm) at post-injury days 3 (A-D), 7 (E-H), 14 (I-L), 21 (M-P), and 28 (Q-T). Visual inspection reveals consistent neuronal density and morphology across groups and timepoints. Quantitative analysis shows no significant group, hemisphere, or interaction effects, suggesting no overt neuronal loss. Two-way repeated ANOVA with post hoc comparisons. Day 3 and 21: n = 4 (SHAM and TBI), day 7: n = 3 (SHAM and TBI), day 14: n= 3 (SHAM) and 6 (TBI), day 28: n = 4 (SHAM) and 5 (TBI). Bars = mean ± SD. Scale bar = 50 µm, valid for all microphotographs. Brain illustrations created in BioRender. Hjæresen, S. (2025) (https://BioRender.com/dkneo0y).
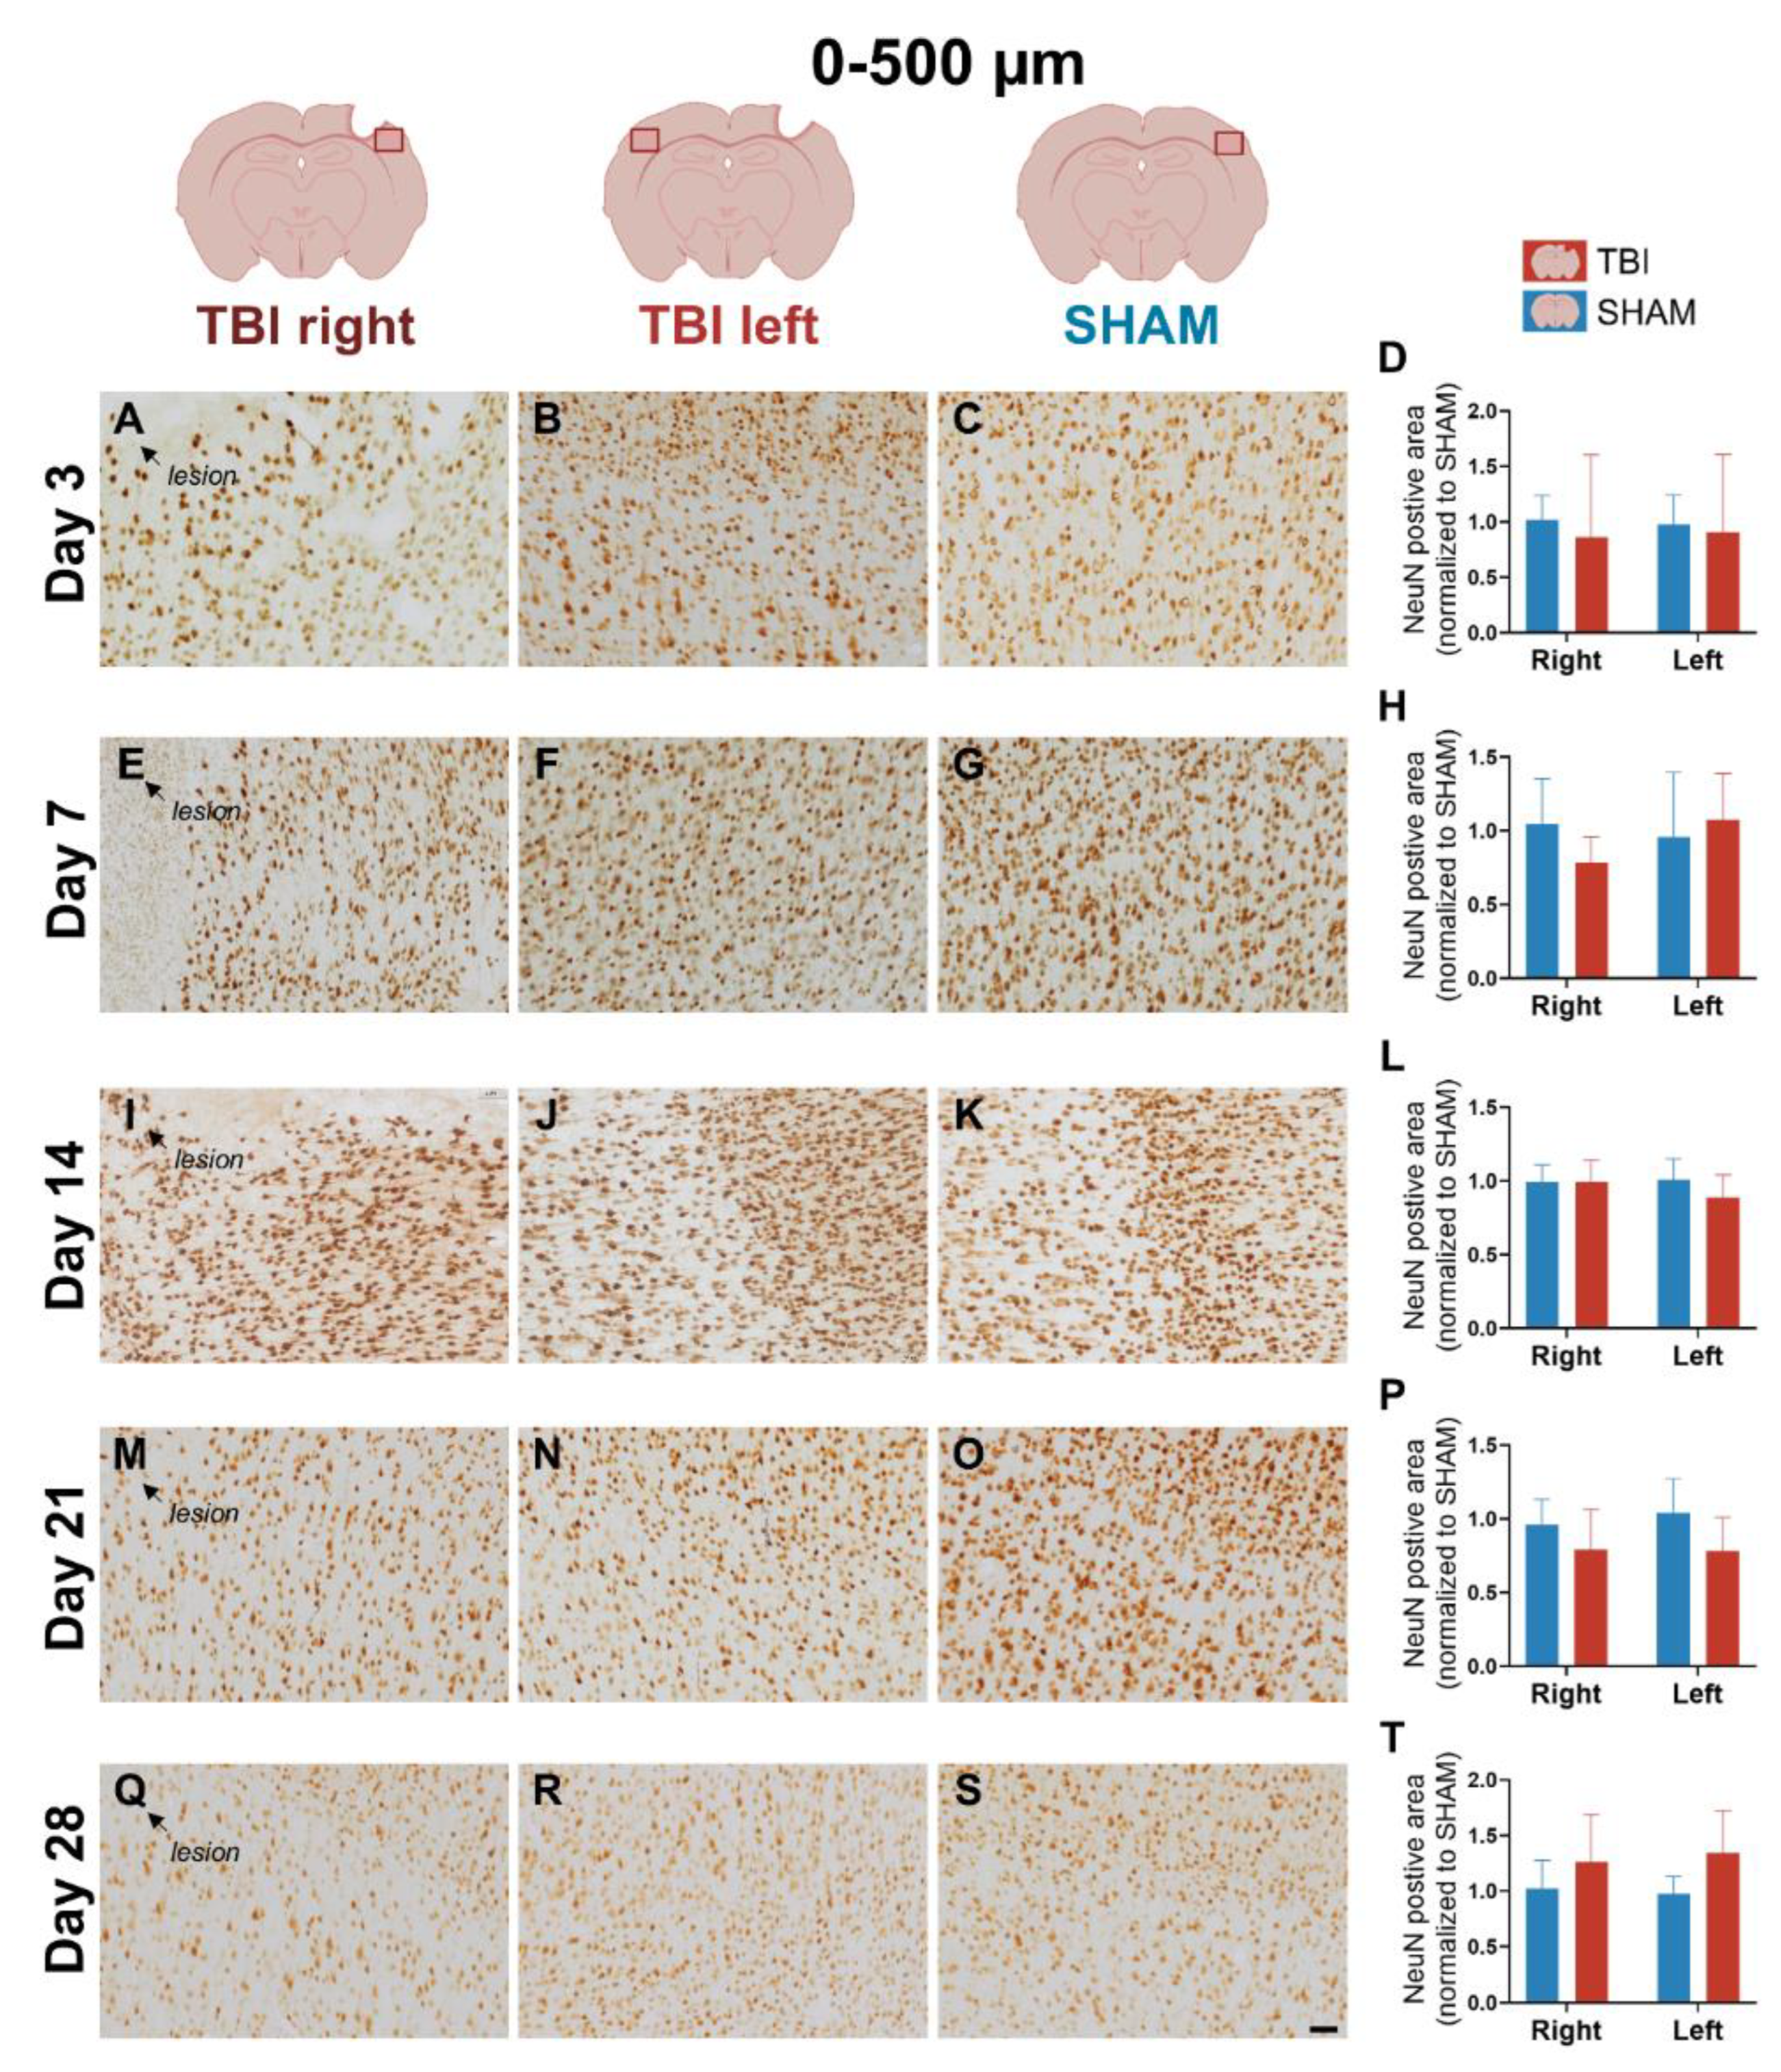
Figure 10.
NeuN expression at 500–1000 µm confirms lack of neuronal loss in distal cortex. NeuN immunostaining and quantification in the peri-lesional region at post-injury days 3 (A-D), 7 (E-H), 14 (I-L), 21 (M-P), and 28 (Q-T). NeuN expression appears uniform across groups and timepoints. Quantification reveals no significant differences in group, hemisphere, or interaction effects. These results support the conclusion that glial activation occurred without measurable neuronal loss in peri-lesional or distal cortical areas. Two-way repeated ANOVA with post hoc comparisons. Day 3 and 21: n = 4 (SHAM and TBI), day 7: n = 3 (SHAM and TBI), day 14: n= 3 (SHAM) and 6 (TBI), day 18: n = 4 (SHAM) and 5 (TBI). Bars = mean ± SD. Scale bar = 50 µm, valid for all microphotographs. Brain illustrations created in BioRender. Hjæresen, S. (2025) (https://BioRender.com/dkneo0y).
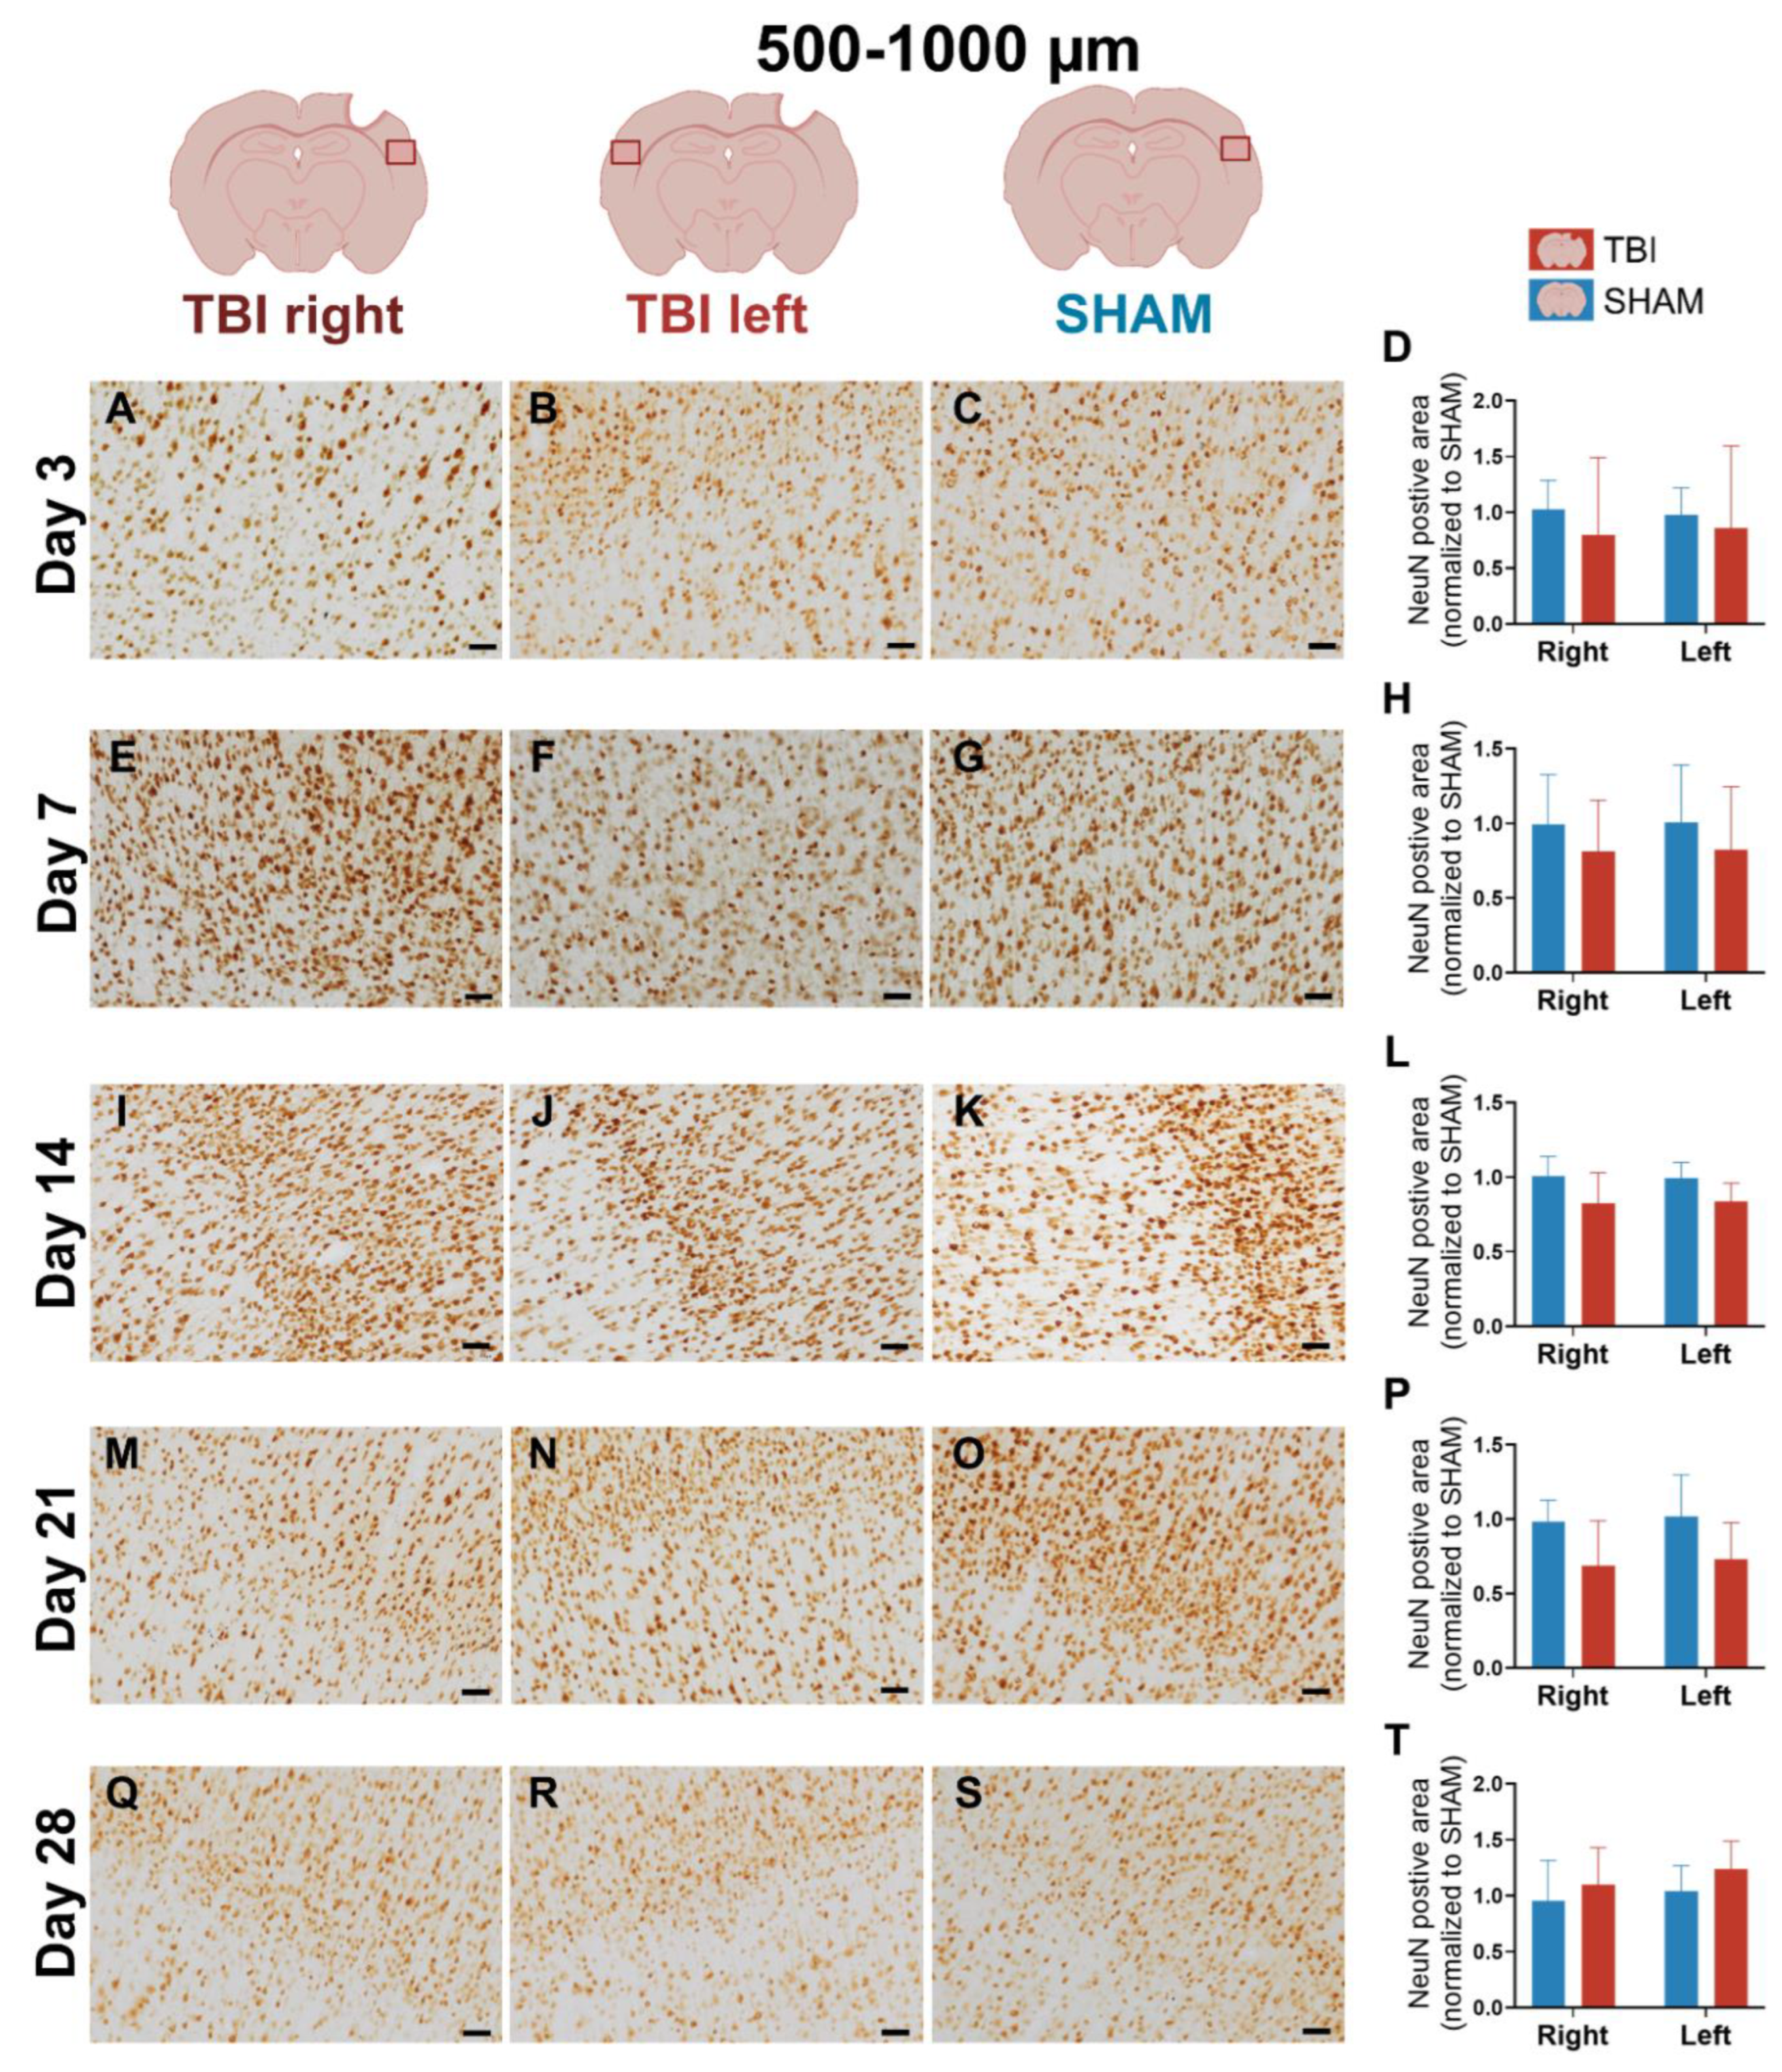
Disclaimer/Publisher’s Note: The statements, opinions and data contained in all publications are solely those of the individual author(s) and contributor(s) and not of MDPI and/or the editor(s). MDPI and/or the editor(s) disclaim responsibility for any injury to people or property resulting from any ideas, methods, instructions or products referred to in the content. |
© 2025 by the authors. Licensee MDPI, Basel, Switzerland. This article is an open access article distributed under the terms and conditions of the Creative Commons Attribution (CC BY) license (http://creativecommons.org/licenses/by/4.0/).
Copyright: This open access article is published under a Creative Commons CC BY 4.0 license, which permit the free download, distribution, and reuse, provided that the author and preprint are cited in any reuse.


