
Submitted:
27 November 2025
Posted:
28 November 2025
You are already at the latest version
Abstract
This article presents a decision support system developed as part of a Research and Development project undertaken by La Logistica srl, a third-party logistics company specializing in the storage and distribution of hydro-sanitary products. The approach is methodological and focuses on the comprehensive analysis of a case study related to freight exit processes with the aim of defining and implementing a software application to support the short-term management of picking and loading operations for product delivery. The developed decision support system integrates past data series analysis and projections, time series simulations, What-If analysis capabilities, and real-time monitoring within a single computational paradigm to anticipate peak points in the freight exit process. The developed decision support system is designed to accumulate and structure operational data from the warehouse management system software, to analyse the periodic rhythms of orders received to generate graphical projections of expected peak points and working hours based on the analysis of past data series and is able to dynamically review projections via real-time monitoring capabilities to adapt projections to actual progress made at any given time. Additionally, What-If analytics capabilities facilitate management's use of various workforce combinations to determine the feasibility of the process at any time, while identifying potential bottlenecks before they occur. Test results conducted with the corporate team indicate improvements in workload visibility and readiness for associated short-term programming strategies, while preventing operational disruptions through advance alerts on operational overload points.
Keywords:
outbound logistics
; decision support system
; What-If simulation
; predictive forecasting
; case study
1. Introduction
The outbound logistics portion of third-party logistics (3PL) is one of the most dynamic and complex environments in the supply chain. It is also characterized by customer demand uncertainty, huge product variety, strict delivery schedules, and the synchronization of multiple dependent processes across multiple warehouses (Watanabe et al., 2023). Such difficulties are further amplified in specific industries, such as hydrothermal-sanitary products, as products differ greatly in volume, fragility, processing requirements, and storage requirements (Baglio et al., 2022). This paper specifically addresses this industry, offering an effective and dynamic support system developed within the actual operational framework of La Logistica s.r.l., a company established in Monopoli, Italy, expert in the warehousing, preparation, and distribution of hydrothermal-sanitary products for wide and specific customer segments. The actual warehousing environment analyzed involves a wide range product categories, such as pipes, supports, boilers, heating elements, water plants, and various thermo-hydraulic items, for which particular picking strategies, security requirements, and packaging processes are required (Minashkina & Happonen, 2023; Alnahhal et al., 2021). The overall conceptual question being explored is:
How may advanced software tools be developed and implemented within the operational processes of the specialized 3PL warehouse to facilitate analysis and improve decision-making, transforming the management of outbound logistics for this sector from a reactive to a proactive approach? This conceptual-question served as the driving motivation behind the development of an innovative approach to decision-making for analysis and improvement of such processes by leveraging historical analysis of data series, forecasting techniques, dynamic adjustment of strategies for real-time response to operational demands, and modeling and monitoring capabilities for efficient management of outbound logistics according to an integrated managerial approach (Tamás, 2025; Kmiecik, 2022). The developed approach derives from and is developed within the framework of a research and development project, funded by the Puglia Region. All operational data entered into our decision support model were analyzed and validated by La Logistica srl operations staff to ensure alignment between reality and process entity representations. The specificity of La Logistica srl is a further source of further innovation for our scientific exploration. Hydrothermal-sanitary products have very specific logistical characteristics: many commercial categories include products with large dimensions, heavy weight, and irregular shapes that require special care for handling/transportation; other categories, on the other hand, include products made of very simple components such as small metal or plastic kitchen utensils, sanitary ware for domestic or industrial use. Historical data on actual orders are analyzed to produce high-resolution time-series data capable of resolving weekly rhythms, intra-daily cycles, and item-specific behavior. This data is input to a forecasting module, which produces projections of outbound workloads for each day of the week and corresponding peak hours for actual operational activities. The module includes real-time adjustment features for intra-daily deviations observed during operational activities to improve projections in settings where actual orders can fluctuate due to urgent customer requests or last-minute changes to item composition (Kmiecik, 2022; Giuffrida et al., 2021). This prognostic module goes beyond basic predictive analytics to include what-if analysis to assess and predict outcomes for team configuration scenarios or different staffing methodologies, and to determine actual bottlenecks in picking or packing units. This is very significant for hydro-thermal-sanitary logistics chains because of unforeseen high-volume trends driven by products that are heavy, bulky, or highly breakable (Steinbacher et al., 2024; Watanabe et al., 2023). The real-time monitoring module is also significant for completing this toolkit because it provides diligence flags for actual progress against projections, enabling timely action for improvement (Tufano et al., 2022; Giuffrida et al., 2021). One of the major additions of this study is to demonstrate how web-based tools designed on factual information and developed with features specific to their respective industries can immensely improve process transparency and analytics for effective decision-making. The case study of La Logistica s.r.l. illustrates how adopting an overall decision-making approach will change operation management for hydrothermal sanitary products' warehouses by providing managers with effective analytical support to forecast peak periods and maintain service level agreements (Tamás, 2025; Steinbacher et al., 2024; Minashkina & Happonen, 2023).
2. System Architecture and Data Flow for Outbound Decision Support
The diagram offers a clear and structured representation of the functional architecture underlying the Decision Support System developed for outbound goods management (Figure 1).
The above logic diagram embodies the integrated logic of the decision support system architecture used in the outbound logistics of the case company. The diagram illustrates the interactions among different information sources and the decision support system's management functionality, providing insights into the company's operational realities in the context of forecasting and What-If scenario analysis. The left side of the diagram illustrates the interaction of the decision support system architecture with the existing information infrastructure of the company’s legacy information systems of the warehouse management system and the archived information at the company level to ensure the continuous flow of information from the operational level of the company to the central repository of the decision support system architecture of the company at all times (Tikwayo & Mathaba, 2023; Sodiya et al., 2024). The information flows from the company’s information sources to support the two main management modules of the company's decision support system architecture. These management modules include the production of reports from the structured list of company supplies and the What-If Engine of the company’s decision support system architecture. The two management modules provide management with insights into the realities of the company’s outbound logistics at the operational level (Tang et al., 2022). The decision support system architecture of the company has been logically applied at the level of processing information of the company’s previous orders and used them as decision support information at the decision support system architecture of the company in order to allow the company’s management to anticipate the company’s needs when there are differences in the company’s requirements at the operational level of the company (Aloini et al., 2025). The right side of the company's decision support system architecture illustrates the information flow from the decision support system architecture of the company, from the needs and feasibility of the decision support system architecture of the company, to the management functionality of the decision support system architecture of the company.
3. Evaluation of the Techno-Managerial Decision-Support Model in the La Logistica Case Study
The assessment of the techno-managerial decision-support model is largely dependent on its effectiveness in addressing the operational complexities arising from the detailed mapping of outgoing processes at La Logistica s.r.l., a real company operating in Monopoli and involved in the logistical management of hydrothermal-sanitary products. It should be noted that this mapping activity allowed several key points to emerge regarding workforce variability, difficulties in predicting peak orders, and workforce efficiency optimization for picking, packing, and loading processes (Kmiecik, 2022; Boonma, 2025). This implies that, rather than being developed for use as just another mathematical computation program, it is effectively a techno-informative managerial system designed to help the company monitor and interpret outgoing processes, especially on a short-term basis when operational risks have been most significant (Wolny & Kmiecik, 2025). It is intended to provide the company's key stakeholders with analytical insights to prevent complications that could endanger its productive structure, optimization, and workforce alignment, enabling on-time order fulfillment. The system's performance largely depends on its predictive power for actual outcomes, as it serves as the basis for planning and operational decisions. Comparing it to actual performance levels measured against its validated data and historical trends indicates its ability to match weekly and daily changes to acceptable levels, provided its historical foundation is representative and adjusted correctly (Kmiecik, 2022). There may still be deviations due to unforeseen events or drastic changes in the actual composition levels of orders being prepared for dispatch, but overall, compatibility relies on curves for temporal analysis and operational attributes to produce authentic predictive results (Wolny & Kmiecik, 2025). It is not just vital for the predictive preprocessing to have acceptable actual performance levels but also to maintain stability while adjusting to actual real-time deviations for continuous adaptive adjustment to actual progress differences between expected actual performance levels and actual progress for managers to have a clarified overall sense of actual progress at all stages of its actual work performance during its performance timeline (Boonma, 2025). Simulation capabilities are another crucial aspect of this model, helping assess the impact of staffing scenarios or productivity levels on the organization's ability to absorb expected workloads. Simulation is also dependent on operational saturation points and helps identify bottlenecks in these processes, providing an analytical perspective on problems that tend to go unnoticed until operational disruptions occur (Ganbold et al., 2020). The effectiveness of these simulations becomes apparent when their outputs closely resemble actual operational activities, reinforcing their use for tactical and strategic analysis. This particular aspect is crucial for La Logistica s.r.l., whose products have hydrothermal-sanitary features, causing uneven handling times that are impossible to predict other than through analysis scenarios (Santos et al., 2020). The goodness of fit or effective use of the model leads to efficient workload balancing, avoidance of overloads and downtime, and increased productivity. Managers can avoid overload by adjusting teams before it occurs and reducing inefficient use of labor resources to minimize operational expenses (Ganbold et al., 2020). It is effective to leverage planning for both daily and weekly time cycles by using projections and dynamic information to accurately adjust workloads and execution orders (Kmiecik, 2022). It also helps to align workloads with capabilities, improving service levels without causing delays. Justification of the model may result from analyzing projected and actual activities, considering the similarity between simulations, and specifying limitations (Wolny & Kmiecik, 2025). It is important to recognize limitations between exogenous disturbances to improve refinement (Santos et al., 2020). In conclusion, the proposed model is very effective and efficient from a techno-managerial point of view, as it improves decision-making and enhances the stability and overall optimization of goods shipping at La Logistica s.r.l. (Kmiecik, 2022; Ganbold et al., 2020). See Figure 2.
4. Interpretation and Functional Role of the Historical Data Dashboard in the DSS
This dashboard provides a highly effective, organized view of the historical information available in the Decision Support System for outbound logistics activities. The primary purpose of this dashboard is to provide the user with overall information about the dataset used for forecasting, simulation, or analysis and monitoring tasks (Mirbagheri, 2023). At the top of this dashboard page, overall information for the entire dataset is provided, including total orders, total order lines, and time range details. This provides the user with information on the overall intensity of the information provided for analysis and should provide insights to create credible analysis and prediction work for logistical activities within particular operational ranges (Osho et al., 2020). The key feature of the dashboard is the table that allows you to analyze actual order line data interactively. Each row is associated with a particular order, with detailed timestamps and attributes such as Day of Week, Number of Lines, Warehouse Area, Type of Product, Geographical Delivery Areas, Priority Levels, and Order ID. This detail is sufficient for diagnostic analysis to occur instantly and recognize specific patterns or glitches directly from the operational dataset (Anggraeni & Amarilies, 2022). It also addresses attributes such as Warehouse Areas and Product Type categories to enable efficient segmentation, making this system flexible for any operational setting with diverse product families and storage areas (Mirbagheri, 2023). The row display slider is very helpful for usability, especially with large datasets. This allows zooming into specific subsets or quick looks at larger parts of the dataset, too. This is especially helpful during data validation or exploratory analysis stages, when analysts may need to inspect specific entries in detail (Osho et al., 2020). Nevertheless, this dashboard provides the basic groundwork for the entire Decision Support System, as it ensures fairness and accessibility to all data and serves as a systematic approach to enter into more detailed analysis (Anggraeni & Amarilies, 2022). This is because raw data is presented in an interpretable manner to facilitate informed decision-making while ensuring that all procedural activities for future forecasts and simulations are based on reliable, trackable past data (Mirbagheri, 2023; Osho et al., 2020). See Figure 3.
This dashboard provides a detailed analysis of past distributions of outgoing order lines for any selected weekday and is one of the most significant platforms for gaining insights into operational trends across the entire logistics setting (Zhai, 2024). This particular dashboard also contains interactive filters to allow for the selection of any particular weekday and also to select past weeks for analysis and further limits them to warehouse areas and product types (Anggraeni & Amarilies, 2022). This particular dashboard is also highly flexible, as managers can generate insights for any operational setting and past performance (González-Vidal et al., 2021). The key performance indicators at the top of the page highlight key features of the selected day: average order lines, peak hour, and peak lines, enabling managers to gain immediate insights into expected levels of operational activity (Zhai, 2024). These measurements provide managers with key insights into expected levels of operational activity on any given day, such as Monday (Anggraeni and Amarilies, 2022). The histogram of average operational load per hour helps convey the average operational load of the entire business for each hour of the day through graphical illustrations (González-Vidal et al., 2021). Peaks and troughs are clearly depicted, allowing easy visualization of high concentrations of outbound activities (Zhai, 2024). This is vital for identifying peak periods and planning staffing based on expected pressure from picking or packing activities. The cumulative curve below complements the histogram by enabling managers to assess whether workers' load is gradually increasing or accumulating at specific points in time (Anggraeni & Amarilies, 2022). This cumulative curve also facilitates comparison between past cumulative performance and actual performance during operations (González-Vidal et al., 2021). In conclusion, the dashboard is very helpful for visualizing trends in outbound logistics activities over time and provides managers with sufficient information to develop projections or scenarios within the overall decision-support framework (Zhai, 2024; Anggraeni & Amarilies, 2022; González-Vidal et al., 2021). See Figure 4.
This dashboard also offers basic prediction capabilities from the Decision Support System and features an easy-to-understand layout and workflow for projecting outgoing workloads (Klumpp, 2018). The user can select which weekday and prediction method to use for projecting outgoing workloads for analysis (Swari et al., 2021). The system employs a six-period moving average to smooth out variations and indicate the basic need for demand (Hamidy & Yasin, 2023). A real-time simulation option is also provided to adjust deviations during intra-day variations when actual performance does not match expected values (Klumpp, 2018). On the right side of the page, the dashboard shows the result of these forecasts in a concise manner. Based on the total number of predicted order lines, the expected peak hours, and the associated peak volume for each selected day, operational intensity can be readily evaluated (Hamidy & Yasin, 2023). Initially, managers can determine whether these anticipated workloads align with past trends or indicate peak or off-peak days based on actual operational requirements (Swari et al., 2021). The bar chart provides managers with an hourly visualization of predicted order lines, indicating how workforce activities should run on each day (Klumpp, 2018). Peak and off-peak analysis is combined to provide a single-glance view and identify areas requiring additional workforce input for specific functions, such as picking or packing (Hamidy & Yasin, 2023). At the bottom of this page, cumulative graphs show how predicted workloads accumulate at specific points as operational hours progress, enabling informed planning for intervention when actual operational intensity exceeds key thresholds (Hamidy & Yasin, 2023). On the whole, the dashboard marries simplicity and analytical intensity by translating historical behavior and forecasting models into insights for proactive planning (Swari et al., 2021; Klumpp, 2018). See Figure 5.
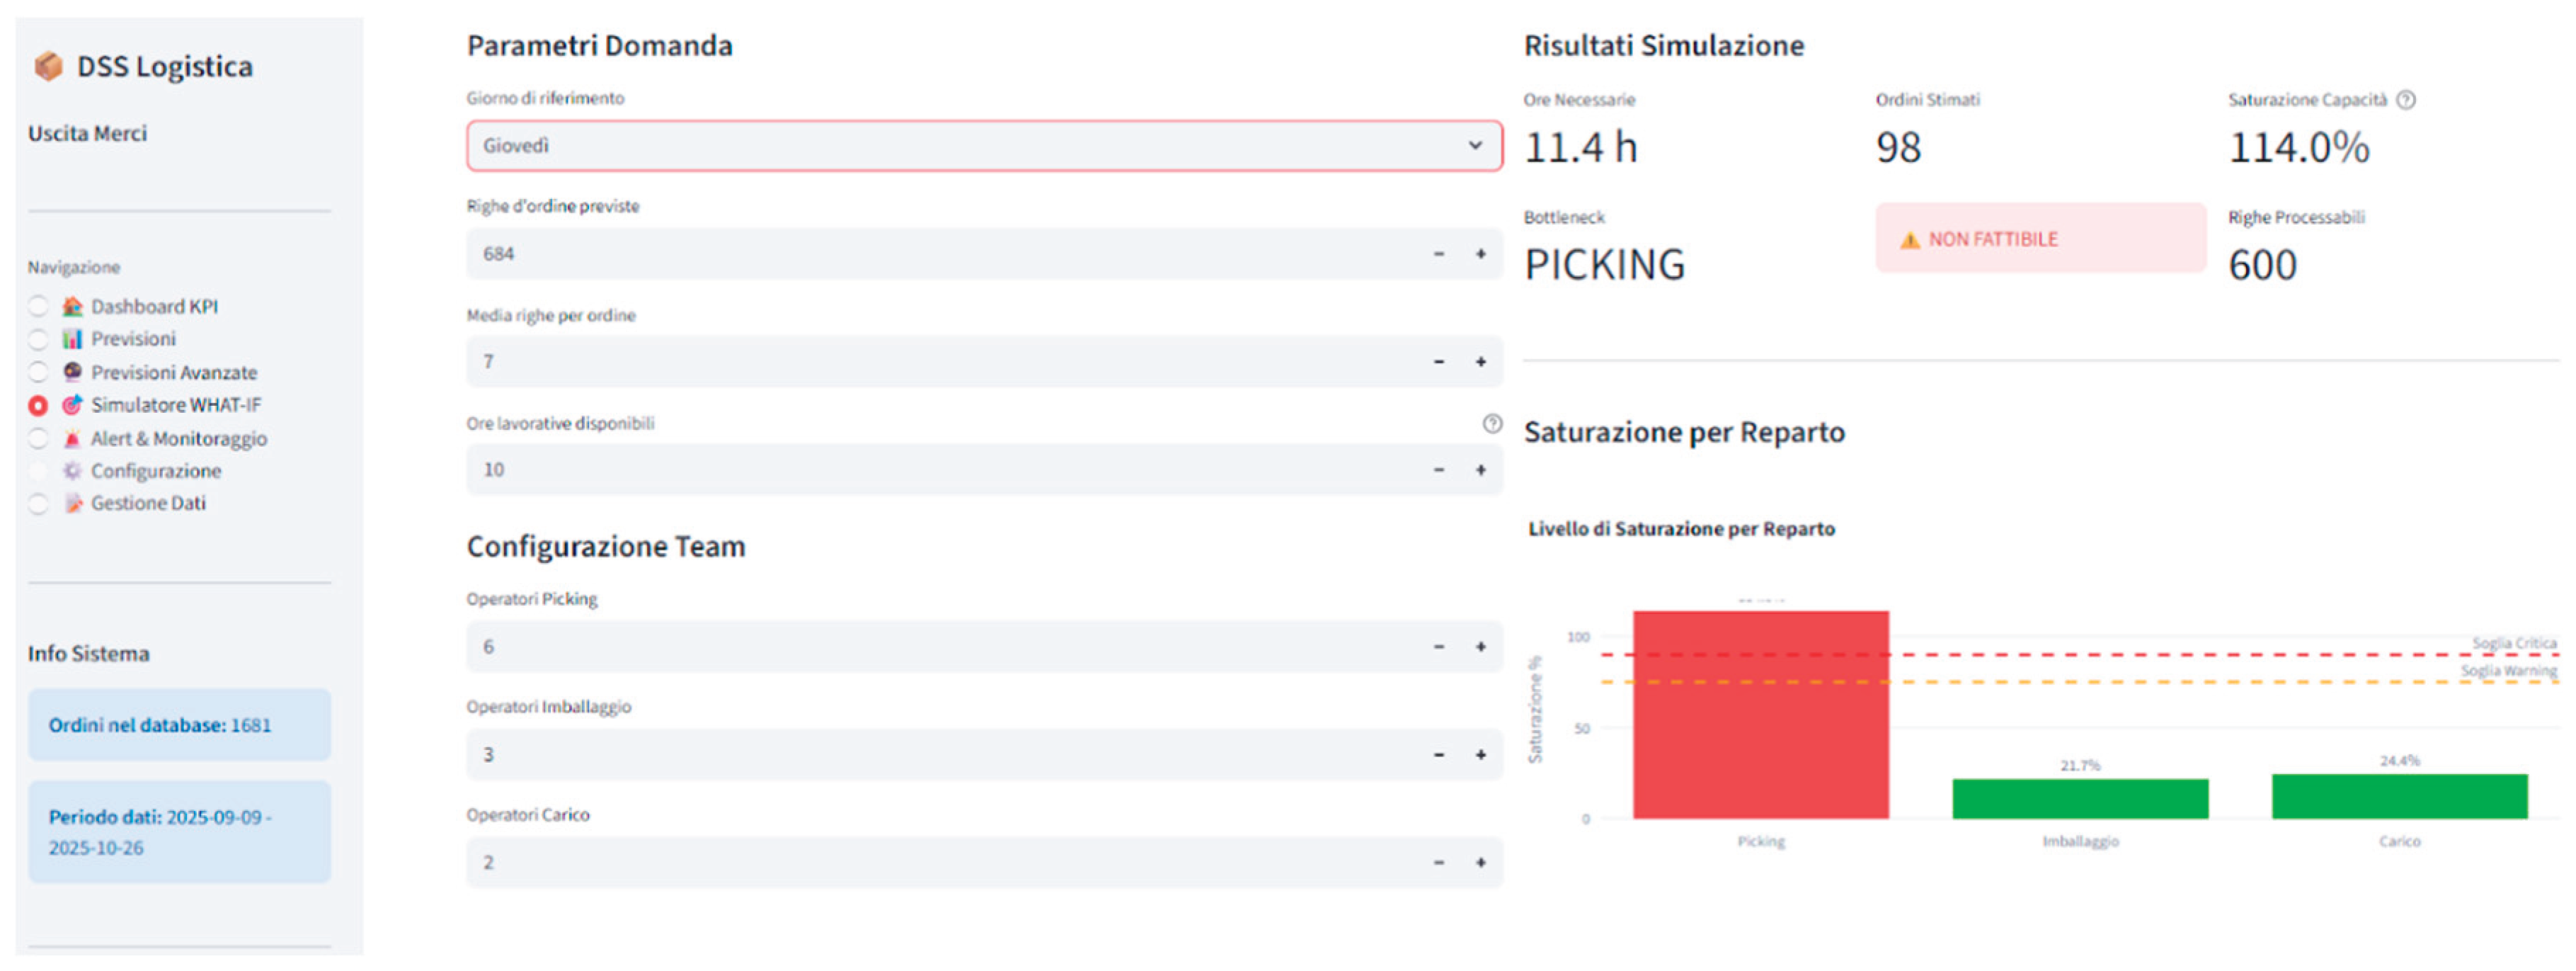
This dashboard is central to the system's What-If Simulation Model because it enables managers to examine and analyze different operational scenarios and their impacts on the viability of operational workloads for processing. As discussed in logistics studies on simulations for operational decision-making (Daroń, 2022), simulations have become highly useful for operational planning, especially in high-variability scenarios. This dashboard is not only helpful for displaying current information but also provides managers with opportunities to adjust key parameters and have direct impacts of these adjusted choices presented simultaneously because high variability associated with operational workloads is one of the concerns raised by analysis associated with bottlenecks of warehouses' resources (Fabianova et al., 2021). The top-left corner shows the parameters for the day considered, such as the expected number of order lines, average lines per order, and available working hours. These form the setting for What-If analysis, against which specific workforce scenarios are tested. Below this, the user selects the number of operators to allocate to the picking, packing, and loading processes. This helps managers analyze different workforce allocation scenarios by altering personnel distribution factors, aligning with established scientific studies emphasizing the applicability of simulation to shift planning and staffing activities (Kirchhoff et al., 2023). On the right side, it shows the What-If simulation results on the dashboard for right analysis. It also calculates how many hours it will take to cover the entire expected workload to determine whether it is possible directly. Notably, in this case analysis, it shows that the system lacks sufficient capacity for a non-feasible configuration because it interprets picking as a significant bottleneck, leading to delays in initial preparation processes for outbound activities. This is very helpful because What-If analysis enables managers to act on probable bottlenecks before they cause difficulties during actual operational processes, aligning with conclusions from analysis and identifying warehouse throughput optimization to improve performance (Fabianova et al., 2021). It is also shown in the saturation use diagram, which indicates picking beyond its critical high use but below its actual use for packing and loading activities. On the whole, the dashboard empowers managers to predict future situations, analyze what-if scenarios, and make informed decisions to stabilize and optimize outgoing processes, thereby validating the notion that simulation is trustworthy for informed logistical decision-making (Daroń, 2022; Kirchhoff et al., 2023). See Figure 6.
5. Conclusion
The new approach proposed in this article is highly significant for the effective management of outbound logistics processes because it brings together all concepts associated with forecasting, as well as those associated with simulation and analytics, for use within a single management system grounded in tangible reality. This particular approach was developed for use within the context of its actual case study at La Logistica s.r.l., located at Monopoli, and deals primarily with hydrothermal-sanitary products for specialization within its logistics business because it was developed to draw direct insights from actual processes within its company's outbound logistics by detailed analysis of all processes of the company's actual warehouse processes. One of the most significant features of this model is its ability to convert raw operational information into predictive knowledge for making very short-term decisions. It considers key temporal patterns associated with past orders and transmits them as detailed forecasts to managers to prepare them for significant situations, such as peak workloads and overload points, before they have any direct effect on efficiency or performance. The dynamic tuning techniques further enhance this predictive feature by adjusting expectations at the first sign of deviations between actual and forecast progress. Another significant addition to this system is its ability to facilitate informed, proactive decisions through its What-If Simulation Engine. Based on actual operational values extracted from the case study analysis, this system will allow managers to analyse various workforce structures, productivity values, and work-hour arrangements before their execution. This enhances the company's ability to redesign its structure, adjust its human resources, and thereby modify its team composition to match the anticipated workforce. This system is not just for analysis; it also serves as a work companion for managers to make informed decisions as situations unfold during business hours. On the one hand, the benefits range from operational effectiveness to labour management and service reliability for clients. The approach of integrating past experience into its predictive architecture helps improve the company's adaptability to various sources of uncertainty, such as seasonality, weekly cycles, and customer-specific events. Consequently, offloading and downtime directly enhance the company's cost effectiveness, while improved forecast accuracy helps mitigate fluctuations associated with shift management and labour scheduling. Strategically focusing on accumulating historical data on both forecasts and performance helps improve operational effectiveness and support continuous improvement of planning strategies and productivity indicators. Looking ahead, this approach also lends itself to many enhancements, such as applying artificial intelligence to represent non-linear relationships and even automating decision orchestration. This is also expected to make La Logistica s.r.l., as well as any warehouses that implement it, remain resilient to dynamic changes in the logistics landscape.
Future research. The industrialization project of this application will be able to further develop through the use of advanced analysis techniques, including artificial intelligence tools and machine learning algorithms, in multiple process areas, while prioritizing, with specific reference to the use case presented here, ML algorithms for short-term forecasting which also includes hyper-parameter optimization capabilities.
Acknowledgment
The proposed work has been developed within the framework of the project “Logistics 4.0” (Regional call of Apulia for aid under exemption No. 17 of 30/09/2014 – BURP No. 139 supplement of 06/10/2014 and subsequent amendments – TITLE II, CHAPTER 2 OF THE GENERAL REGULATION, “Notice for the submission of projects promoted by Large Enterprises pursuant to Article 17 of the Regulation”).
Data Availability Statement
The data used and the processes analysed in the proposed simulation have been validated by the company "La Logistica s.r.l".
References
- Alnahhal, M., Tabash, M. I., & Ahrens, D. (2021). Optimal selection of third-party logistics providers using integer programming: A case study of a furniture company storage and distribution. Annals of Operations Research, 302(1), 1-22. [CrossRef]
- Aloini, D., Benevento, E., Dulmin, R., Guerrazzi, E., & Mininno, V. (2025). Unlocking Real-Time Decision-Making in Warehouses: A machine learning-based forecasting and alerting system for cycle time prediction. Transportation Research Part E: Logistics and Transportation Review, 194, 103933.
- Anggraeni, M. S., & Amarilies, H. S. (2022). Pureshare Method in Dashboard Development to Monitor Warehouse Performance at PT XYZ Using the Cost Per Case (Cpc) Perspective. Journal of Emerging Supply Chain, Clean Energy, and Process Engineering, 1(1), 19-34. [CrossRef]
- Baglio, M., Perotti, S., Dallari, F., & Creazza, A. (2022). How can logistics real estate support third-party logistics providers?. International journal of logistics research and applications, 25(10), 1334-1358.
- Boonma, C. (2025, May). Logistics Data Analytics and Delay Prediction. In The 15th Benjamit National and International Conference (pp. 72-78).
- Daroń, M. (2022). Simulations in planning logistics processes as a tool of decision-making in manufacturing companies. Production Engineering Archives, 28.
- Fabianova, J., Janekova, J., & Horbulak, J. (2021). Solving the bottleneck problem in a warehouse using simulations. Acta logistica, 8(2), 107-116. [CrossRef]
- Ganbold, O., Kundu, K., Li, H., & Zhang, W. (2020). A simulation-based optimization method for warehouse worker assignment. Algorithms, 13(12), 326.
- Giuffrida, M., Mangiaracina, R., & Burki, U. (2021). Cloud-based booking platforms in warehouse operations. Sustainability, 13(20), 11547. [CrossRef]
- Gkanatsas, E., & Krikke, H. (2020). Towards a pro-silience framework: a literature review on quantitative modelling of resilient 3PL supply chain network designs. Sustainability, 12(10), 4323.
- González-Vidal, A., Gómez-Bernal, P., Mendoza-Bernal, J., & Skarmeta, A. F. (2021, December). BIGcoldTRUCKS: a BIG data dashboard for the management of COLD chain logistics in refrigerated TRUCKS. In 2021 IEEE International Conference on Big Data (Big Data) (pp. 2894-2900). IEEE.
- Hamidy, F., & Yasin, I. (2023). Implementation of Moving Average for Forecasting Inventory Data Using CodeIgniter. Journal of Data Science and Information Systems, 1(1), 17-23. [CrossRef]
- Kirchhoff, D., Kirberg, M., Kuhnt, S., & Clausen, U. (2023). Metamodel-based optimization of shift planning in high-bay warehouse operations. Quality and Reliability Engineering International, 39(2), 590-608.
- Klumpp, M. (2018). Automation and artificial intelligence in business logistics systems: human reactions and collaboration requirements. International Journal of Logistics Research and Applications, 21(3), 224-242. [CrossRef]
- Kmiecik, M. (2022). Automation of warehouse resource planning process by using a cloud demand forecasting tool. Scientific Papers of Silesian University of Technology.
- Kmiecik, M. (2022). Logistics coordination based on inventory management and transportation planning by third-party logistics (3PL). Sustainability, 14(13), 8134. [CrossRef]
- Minashkina, D., & Happonen, A. (2023). A systematic literature mapping of current academic research linking warehouse management systems to the third-party logistics context. Acta Logistica (AL), 10(2).
- Mirbagheri, S. (2023, September). Leveraging data warehousing and decision support systems for effective supply chain management. In 2023 IEEE 8th international conference on smart cloud (SmartCloud) (pp. 111-115). IEEE.
- Osho, G. O., Omisola, J. O., & Shiyanbola, J. O. (2020). An Integrated AI-Power BI Model for Real-Time Supply Chain Visibility and Forecasting: A Data-Intelligence Approach to Operational Excellence. Unknown Journal. [CrossRef]
- Santos, C. H. D., Lima, R. D. C., Leal, F., de Queiroz, J. A., Balestrassi, P. P., & Montevechi, J. A. B. (2020). A decision support tool for operational planning: a Digital Twin using simulation and forecasting methods. Production, 30, e20200018.
- Sodiya, E. O., Umoga, U. J., Amoo, O. O., & Atadoga, A. (2024). AI-driven warehouse automation: A comprehensive review of systems. GSC Advanced Research and Reviews, 18(2), 272-282.
- Steinbacher, L. M., Düe, T., Veigt, M., & Freitag, M. (2024). Automatic model generation for material flow simulations of Third-Party Logistics. Journal of Intelligent Manufacturing, 35(8), 3857-3874. [CrossRef]
- Swari, M. H. P., Qusyairi, M., Mandyartha, E. P., & Wahanani, H. E. (2021, May). Business Intelligence System using Simple Moving Average Method (Case Study: Sales Medical Equipment at PT. Semangat Sejahtera Bersama). In Journal of Physics: Conference Series (Vol. 1899, No. 1, p. 012121). IOP Publishing.
- Tamás, P. (2025). New Dimensions in the Study of Outsourcing Logistics Services: The Role of Digitalization in Enhancing Efficiency. Logistics, 9(2), 44.
- Tang, Y. M., Ho, G. T. S., Lau, Y. Y., & Tsui, S. Y. (2022). Integrated smart warehouse and manufacturing management with demand forecasting in small-scale cyclical industries. Machines, 10(6), 472.
- Tikwayo, L. N., & Mathaba, T. N. (2023). Applications of industry 4.0 technologies in warehouse management: A systematic literature review. Logistics, 7(2), 24. [CrossRef]
- Tufano, A., Accorsi, R., & Manzini, R. (2022). A machine learning approach for predictive warehouse design. The International Journal of Advanced Manufacturing Technology, 119(3), 2369-2392. [CrossRef]
- Watanabe, W. C., Wichaisri, S., & Patitad, P. (2023). Outbound logistics resilience considering customer participation level: A case study of Thailand’s sugar factory. Engineering and Applied Science Research, 50(4), 382-390.
- Wolny, M., & Kmiecik, M. (2025). Unveiling Patterns in Forecasting Errors: A Case Study of 3PL Logistics in Pharmaceutical and Appliance Sectors. Sustainability, 17(1), 214. [CrossRef]
- Zhai, X. (2024). Visualizing Walmart’s supply chain management: A case study on detailed warehouse management practices. Transactions on Economics, Business and Management Research, 10, 37-41.
Figure 1.
Functional Architecture of the Outbound Decision Support System.
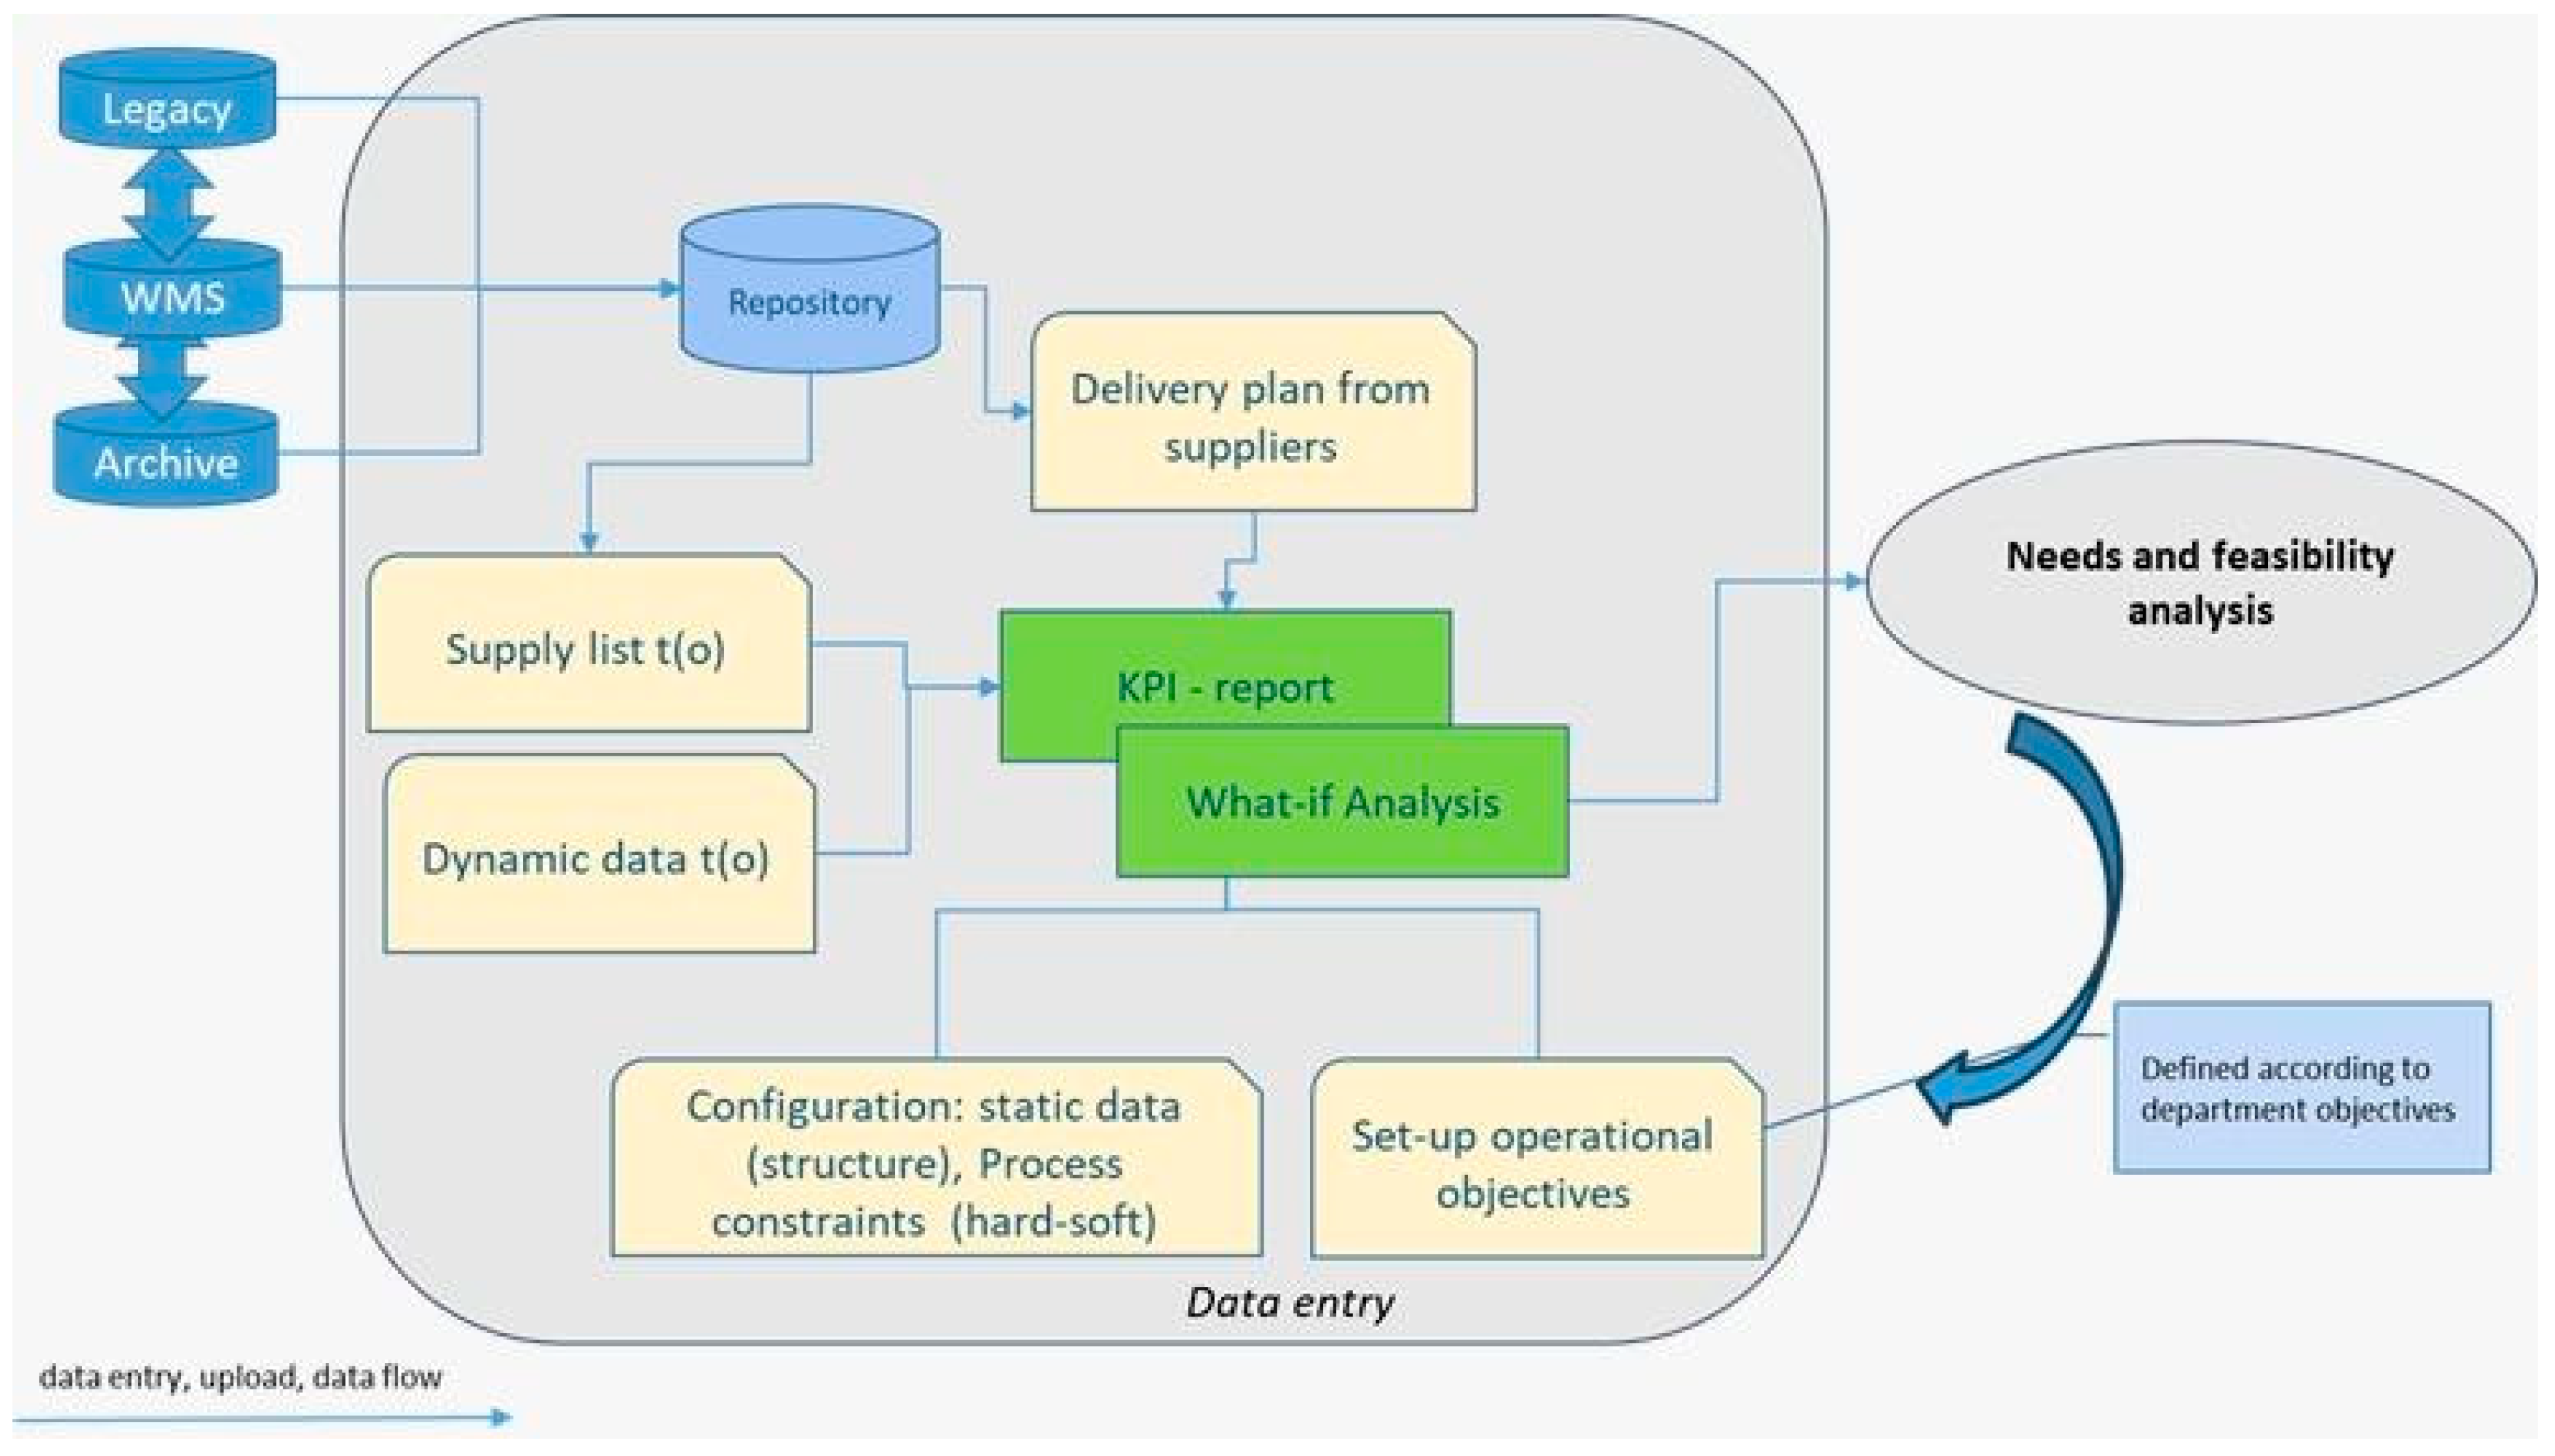
Figure 2.
Techno-Managerial Decision-Support Model: Structure, Components, and Operational Impacts.
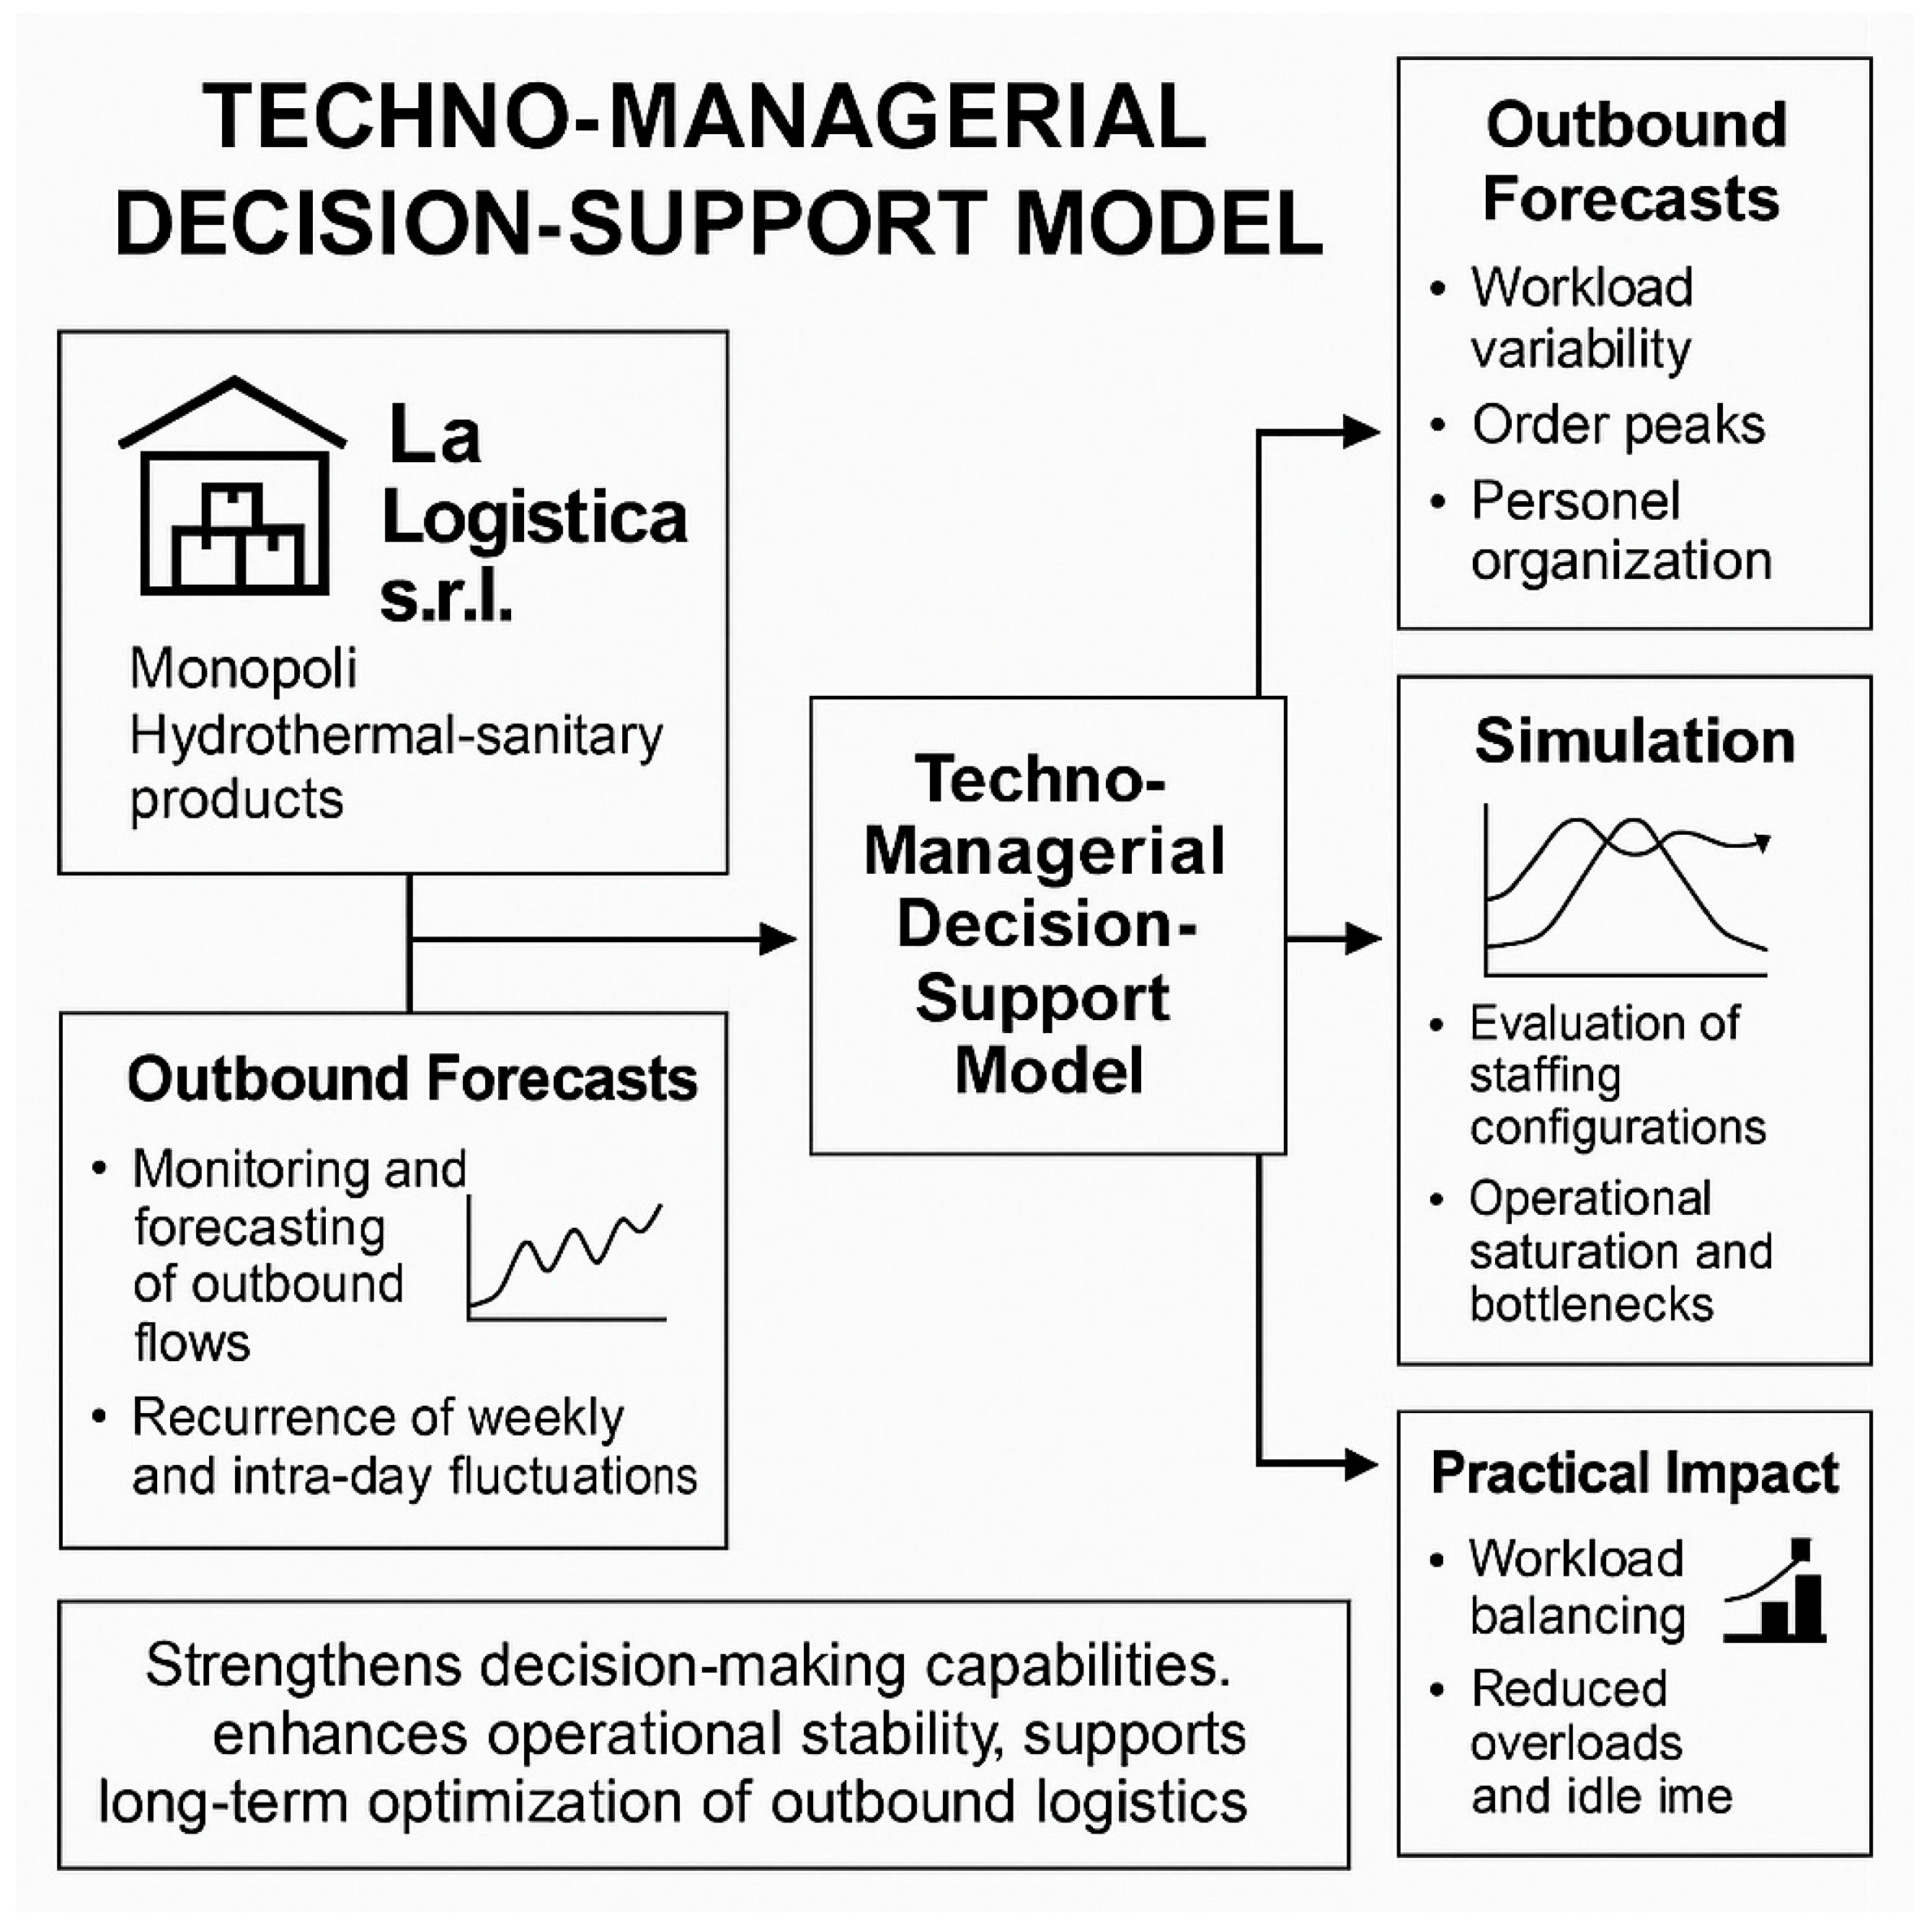
Figure 3.
Data Management and Historical Dataset Visualization Dashboard.
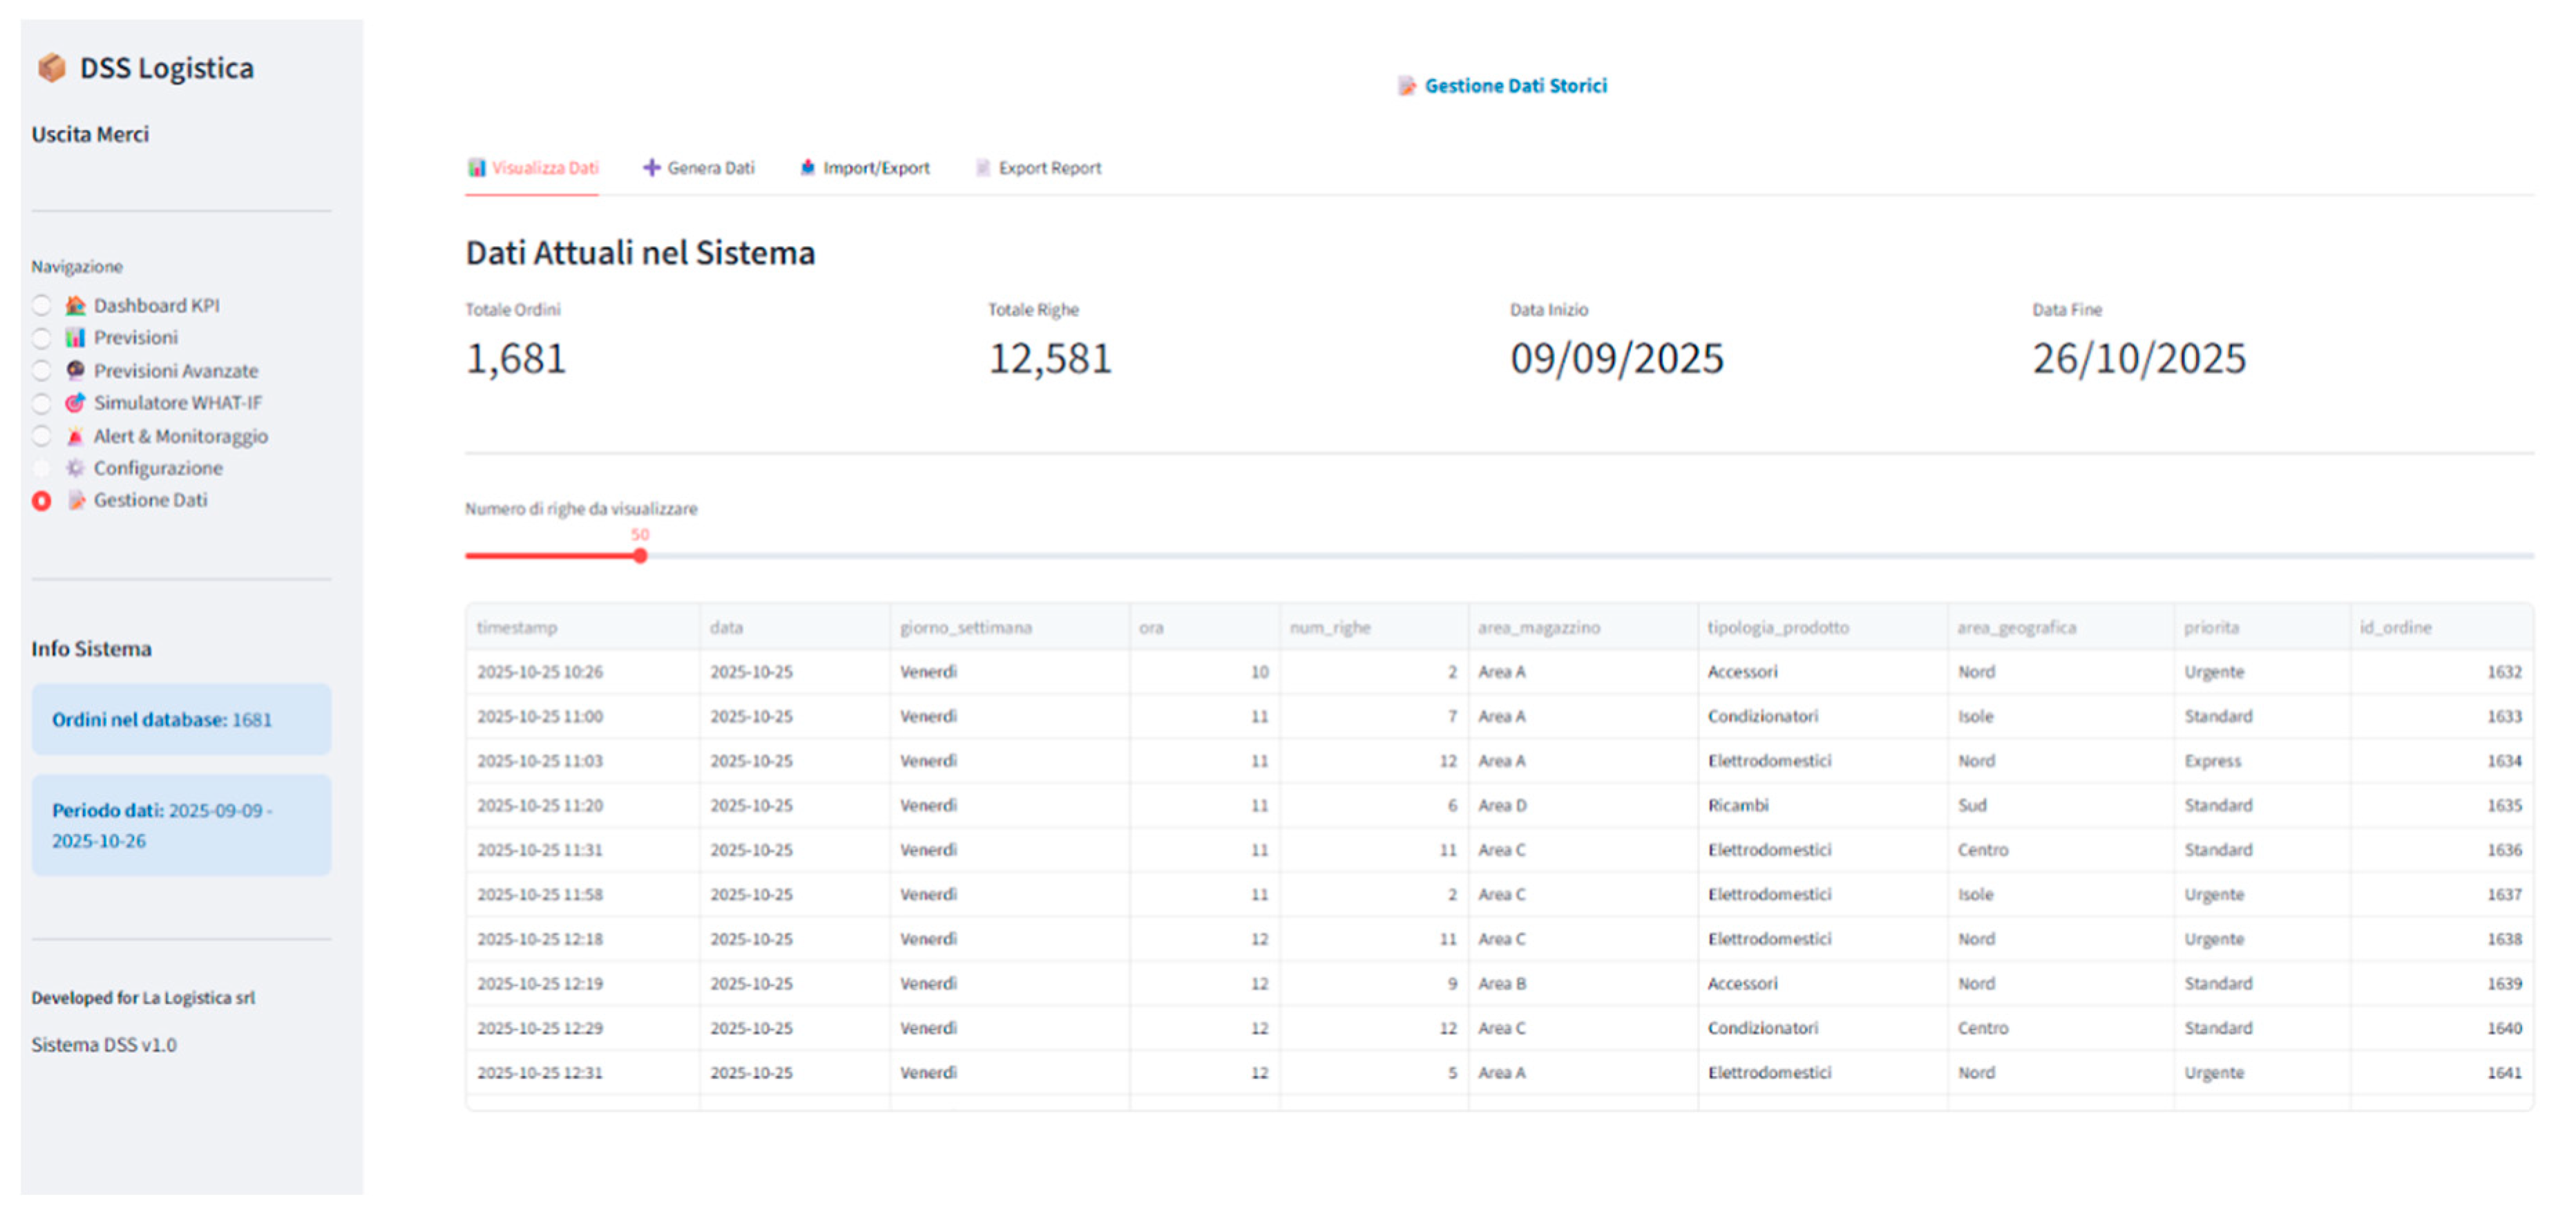
Figure 4.
What-if Analysis Dashboard for Outbound Logistics within the DSS.
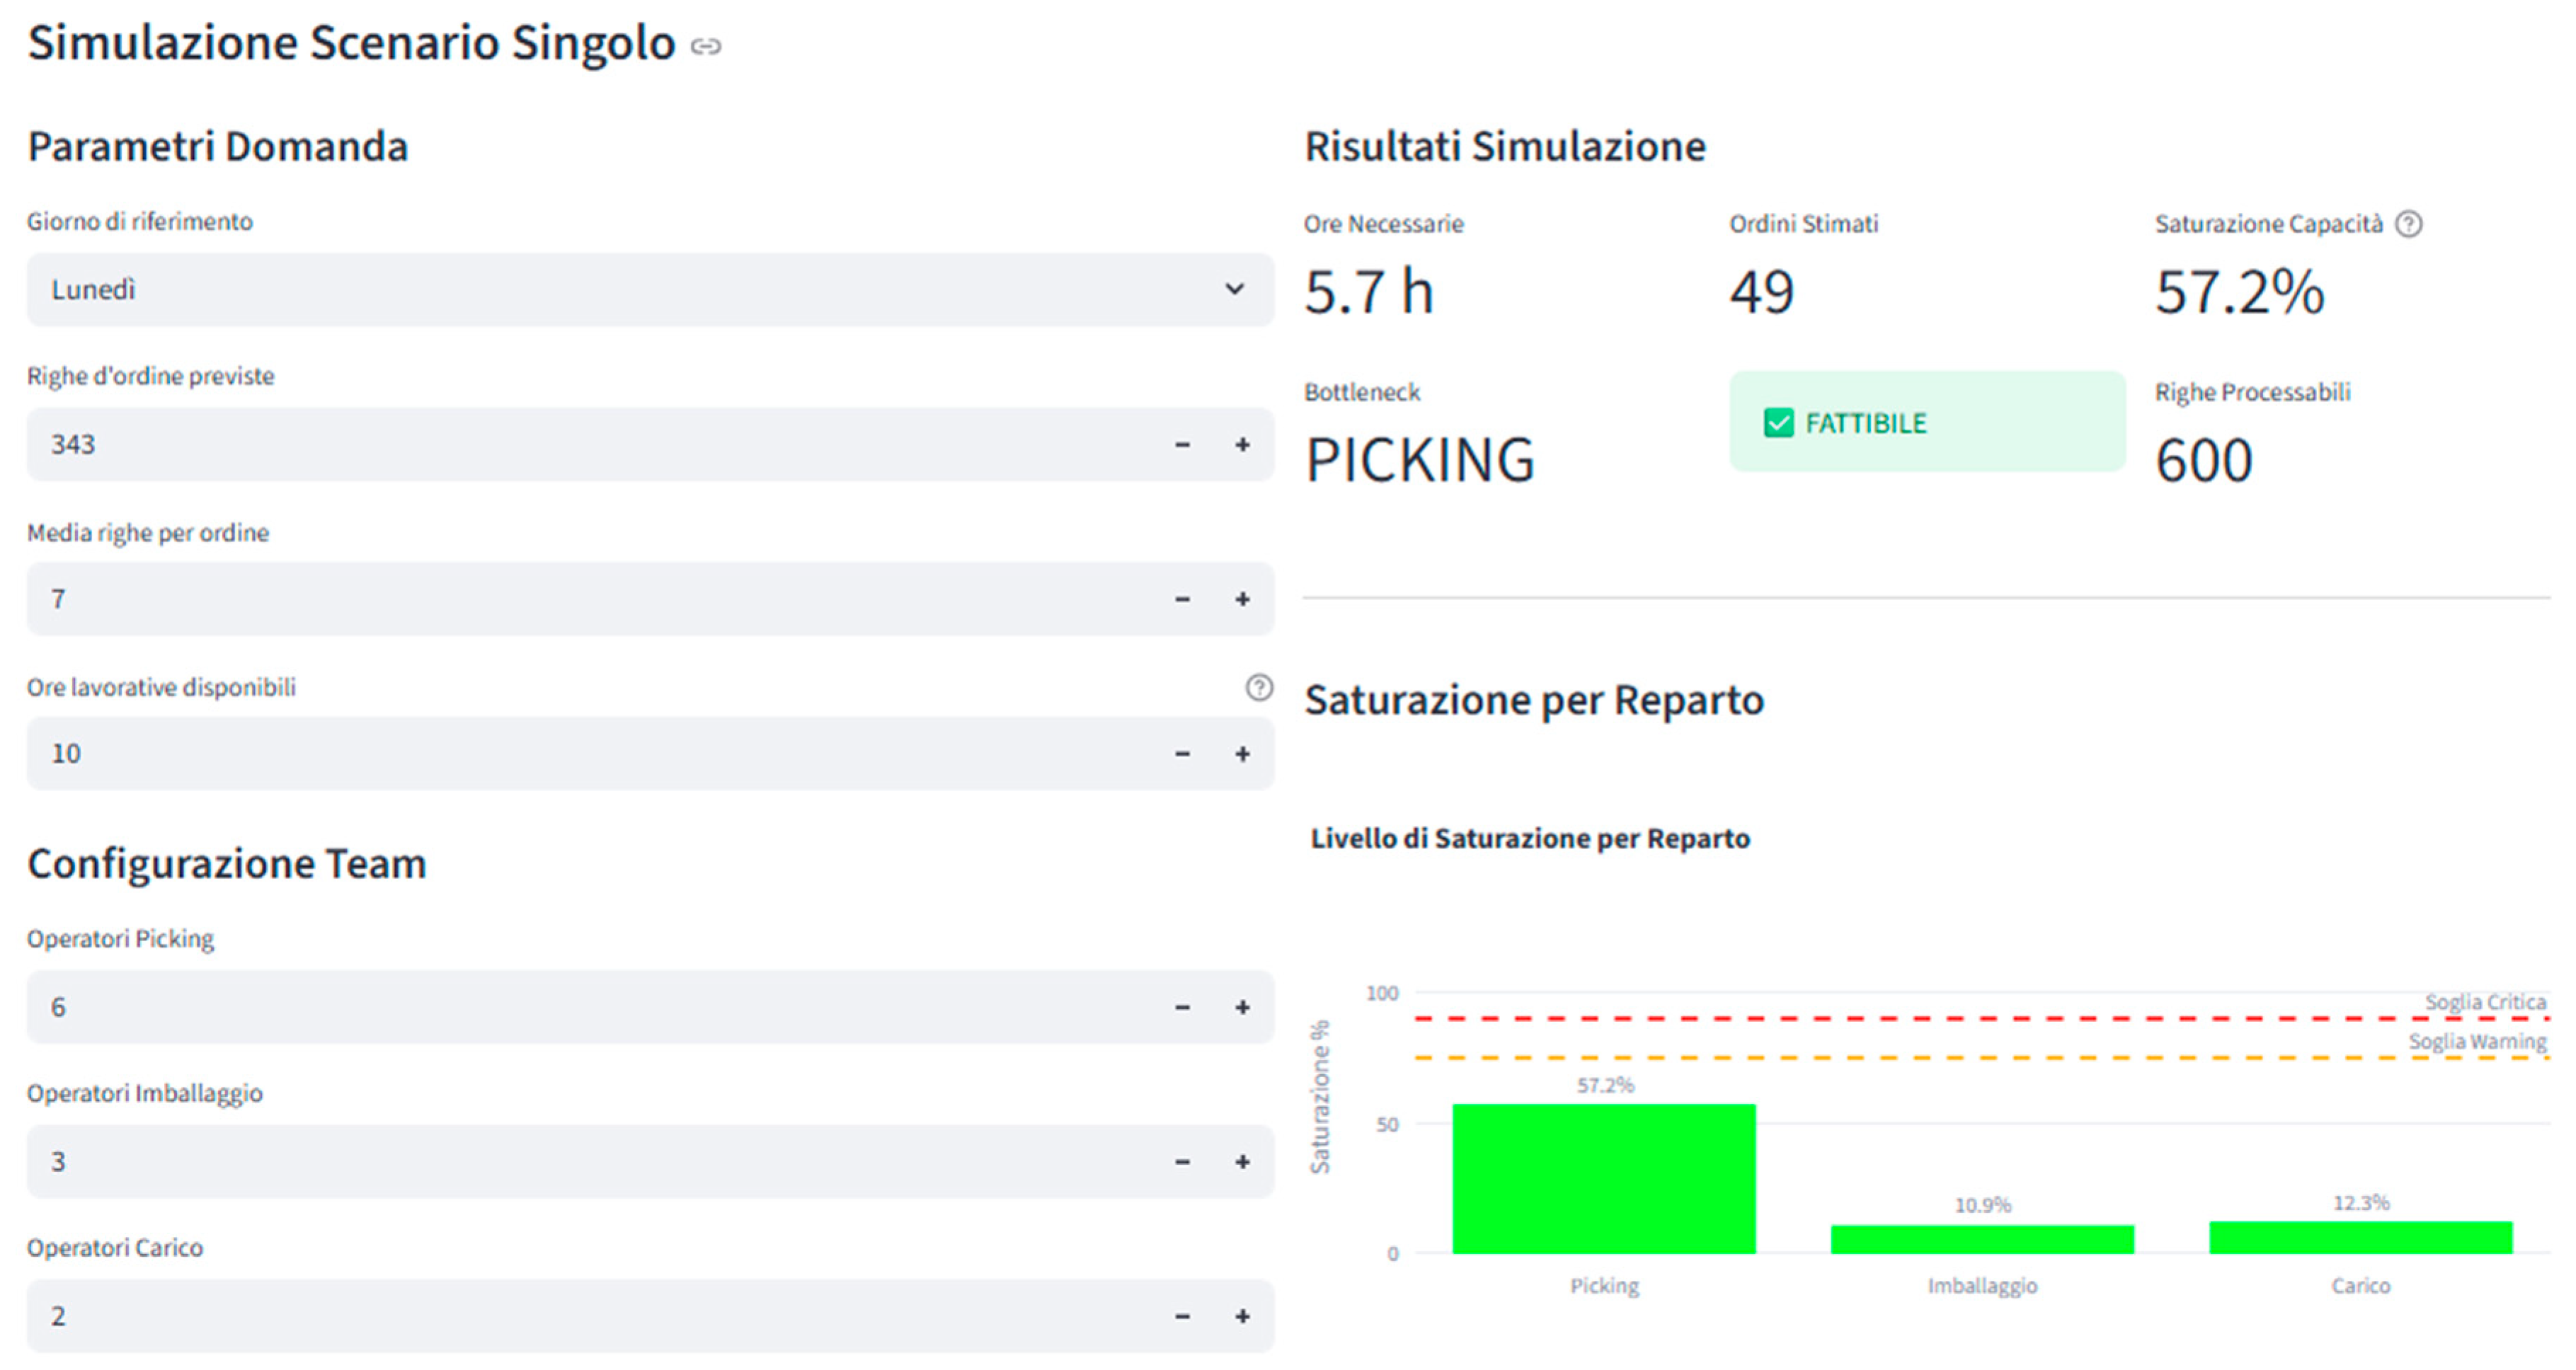
Figure 5.
Forecasting Dashboard for Outbound Workload Prediction within the DSS.
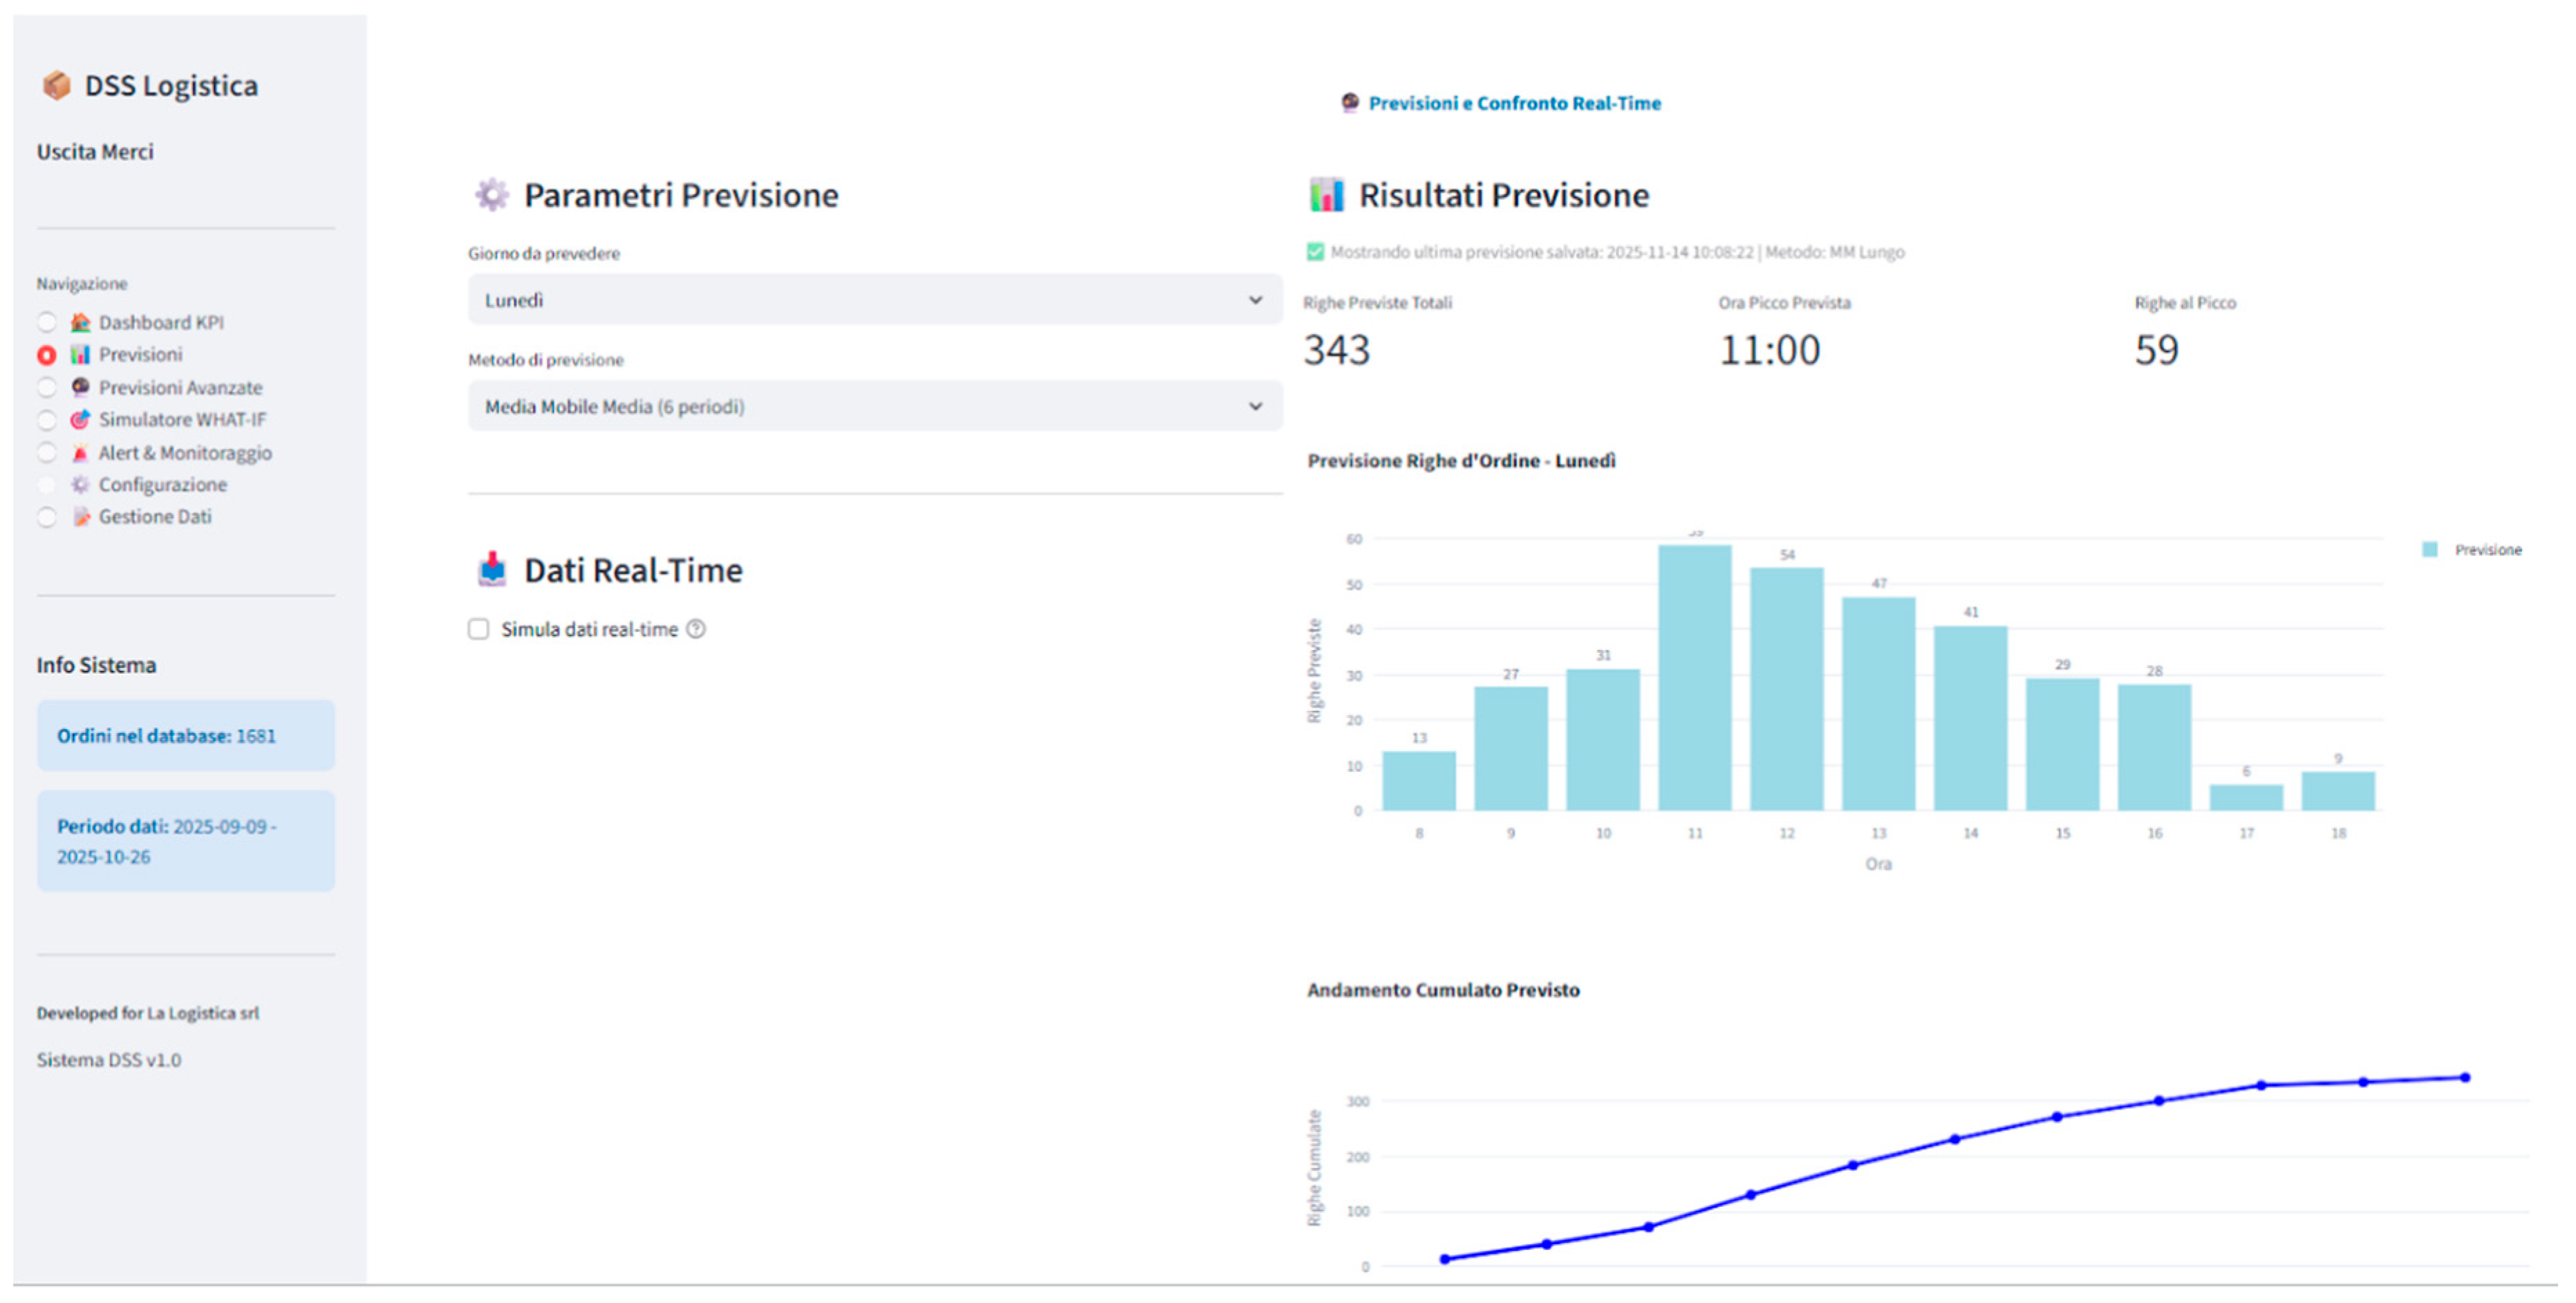
Figure 6.
System Data Visualization Interface for Outbound Logistics.
Disclaimer/Publisher’s Note: The statements, opinions and data contained in all publications are solely those of the individual author(s) and contributor(s) and not of MDPI and/or the editor(s). MDPI and/or the editor(s) disclaim responsibility for any injury to people or property resulting from any ideas, methods, instructions or products referred to in the content. |
© 2025 by the authors. Licensee MDPI, Basel, Switzerland. This article is an open access article distributed under the terms and conditions of the Creative Commons Attribution (CC BY) license (http://creativecommons.org/licenses/by/4.0/).
Copyright: This open access article is published under a Creative Commons CC BY 4.0 license, which permit the free download, distribution, and reuse, provided that the author and preprint are cited in any reuse.


